Westport, CT Map & Demographics
Westport Overview
$127,477
PER CAPITA INCOME
$250,001
AVG FAMILY INCOME
$215,526
AVG HOUSEHOLD INCOME
56.0%
WAGE / INCOME GAP [ % ]
44.0¢/ $1
WAGE / INCOME GAP [ $ ]
0.48
INEQUALITY / GINI INDEX
2,668
TOTAL POPULATION
1,405
MALE POPULATION
1,263
FEMALE POPULATION
111.24
MALES / 100 FEMALES
89.89
FEMALES / 100 MALES
44.0
MEDIAN AGE
3.3
AVG FAMILY SIZE
2.7
AVG HOUSEHOLD SIZE
1,351
LABOR FORCE [ PEOPLE ]
67.6%
PERCENT IN LABOR FORCE
6.9%
UNEMPLOYMENT RATE
Westport Zip Codes
Westport Area Codes
Income in Westport
Income Overview in Westport
Per Capita Income in Westport is $127,477, while median incomes of families and households are $250,001 and $215,526 respectively.
| Characteristic | Number | Measure |
| Per Capita Income | 2,668 | $127,477 |
| Median Family Income | 731 | $250,001 |
| Mean Family Income | 731 | $370,854 |
| Median Household Income | 976 | $215,526 |
| Mean Household Income | 976 | $338,274 |
| Income Deficit | 731 | $0 |
| Wage / Income Gap (%) | 2,668 | 55.98% |
| Wage / Income Gap ($) | 2,668 | 44.02¢ per $1 |
| Gini / Inequality Index | 2,668 | 0.48 |
Earnings by Sex in Westport
Average Earnings in Westport are $93,309, $130,278 for men and $57,349 for women, a difference of 56.0%.
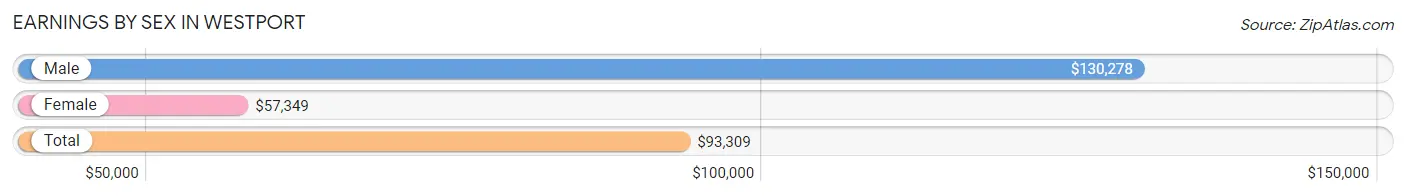
| Sex | Number | Average Earnings |
| Male | 894 (64.0%) | $130,278 |
| Female | 503 (36.0%) | $57,349 |
| Total | 1,397 (100.0%) | $93,309 |
Earnings by Sex by Income Bracket in Westport
The most common earnings brackets in Westport are $100,000+ for men (499 | 55.8%) and $100,000+ for women (160 | 31.8%).
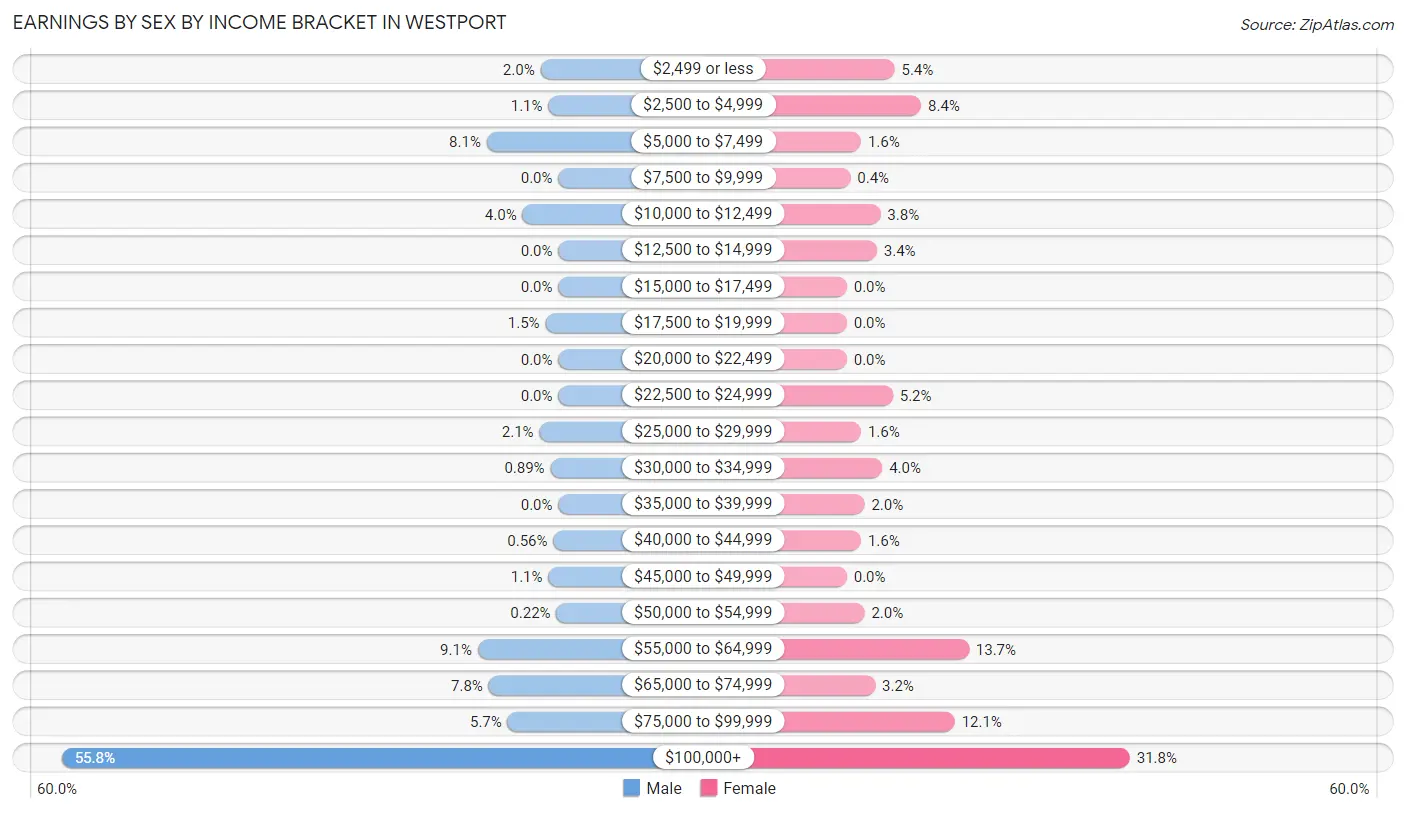
| Income | Male | Female |
| $2,499 or less | 18 (2.0%) | 27 (5.4%) |
| $2,500 to $4,999 | 10 (1.1%) | 42 (8.4%) |
| $5,000 to $7,499 | 72 (8.1%) | 8 (1.6%) |
| $7,500 to $9,999 | 0 (0.0%) | 2 (0.4%) |
| $10,000 to $12,499 | 36 (4.0%) | 19 (3.8%) |
| $12,500 to $14,999 | 0 (0.0%) | 17 (3.4%) |
| $15,000 to $17,499 | 0 (0.0%) | 0 (0.0%) |
| $17,500 to $19,999 | 13 (1.5%) | 0 (0.0%) |
| $20,000 to $22,499 | 0 (0.0%) | 0 (0.0%) |
| $22,500 to $24,999 | 0 (0.0%) | 26 (5.2%) |
| $25,000 to $29,999 | 19 (2.1%) | 8 (1.6%) |
| $30,000 to $34,999 | 8 (0.9%) | 20 (4.0%) |
| $35,000 to $39,999 | 0 (0.0%) | 10 (2.0%) |
| $40,000 to $44,999 | 5 (0.6%) | 8 (1.6%) |
| $45,000 to $49,999 | 10 (1.1%) | 0 (0.0%) |
| $50,000 to $54,999 | 2 (0.2%) | 10 (2.0%) |
| $55,000 to $64,999 | 81 (9.1%) | 69 (13.7%) |
| $65,000 to $74,999 | 70 (7.8%) | 16 (3.2%) |
| $75,000 to $99,999 | 51 (5.7%) | 61 (12.1%) |
| $100,000+ | 499 (55.8%) | 160 (31.8%) |
| Total | 894 (100.0%) | 503 (100.0%) |
Earnings by Sex by Educational Attainment in Westport
Average earnings in Westport are $172,438 for men and $72,031 for women, a difference of 58.2%. Men with an educational attainment of graduate degree enjoy the highest average annual earnings of $250,001, while those with bachelor's degree education earn the least with $121,513. Women with an educational attainment of bachelor's degree earn the most with the average annual earnings of $93,529, while those with bachelor's degree education have the smallest earnings of $93,529.
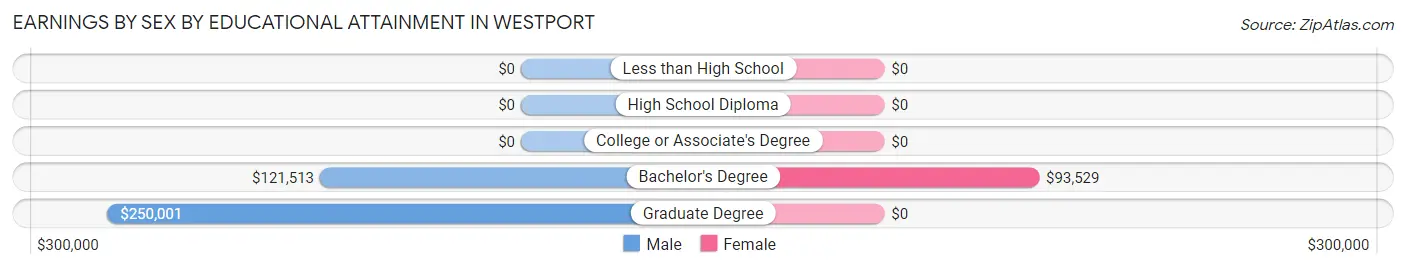
| Educational Attainment | Male Income | Female Income |
| Less than High School | - | - |
| High School Diploma | - | - |
| College or Associate's Degree | - | - |
| Bachelor's Degree | $121,513 | $93,529 |
| Graduate Degree | $250,001 | $0 |
| Total | $172,438 | $72,031 |
Family Income in Westport
Family Income Brackets in Westport
According to the Westport family income data, there are 474 families falling into the $200,000+ income range, which is the most common income bracket and makes up 64.8% of all families.
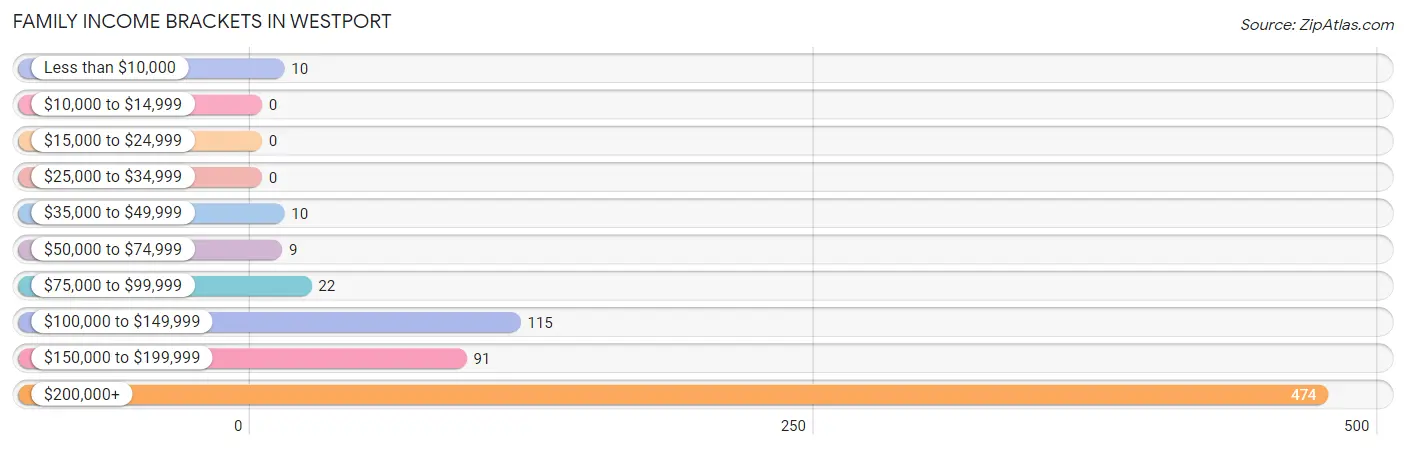
| Income Bracket | # Families | % Families |
| Less than $10,000 | 10 | 1.4% |
| $10,000 to $14,999 | 0 | 0.0% |
| $15,000 to $24,999 | 0 | 0.0% |
| $25,000 to $34,999 | 0 | 0.0% |
| $35,000 to $49,999 | 10 | 1.4% |
| $50,000 to $74,999 | 9 | 1.2% |
| $75,000 to $99,999 | 22 | 3.0% |
| $100,000 to $149,999 | 115 | 15.7% |
| $150,000 to $199,999 | 91 | 12.4% |
| $200,000+ | 474 | 64.8% |
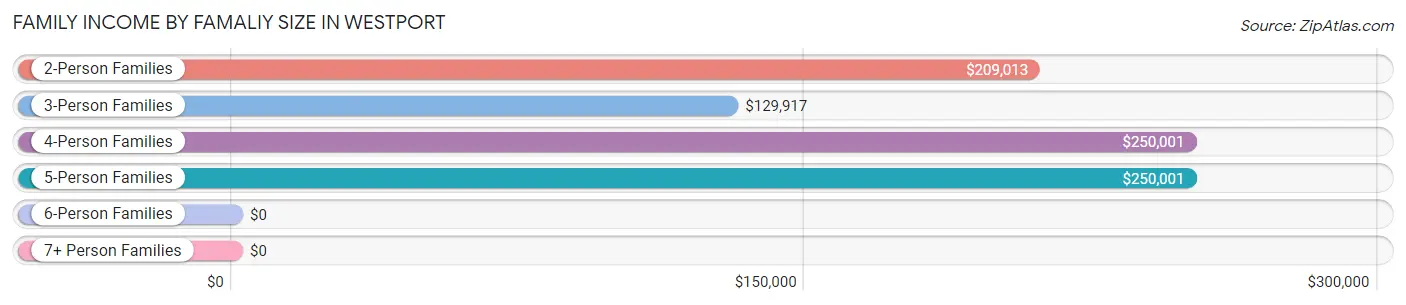
Family Income by Famaliy Size in Westport
4-person families (224 | 30.6%) account for the highest median family income in Westport with $250,001 per family, while 2-person families (269 | 36.8%) have the highest median income of $104,506 per family member.
| Income Bracket | # Families | Median Income |
| 2-Person Families | 269 (36.8%) | $209,013 |
| 3-Person Families | 145 (19.8%) | $129,917 |
| 4-Person Families | 224 (30.6%) | $250,001 |
| 5-Person Families | 93 (12.7%) | $250,001 |
| 6-Person Families | 0 (0.0%) | $0 |
| 7+ Person Families | 0 (0.0%) | $0 |
| Total | 731 (100.0%) | $250,001 |
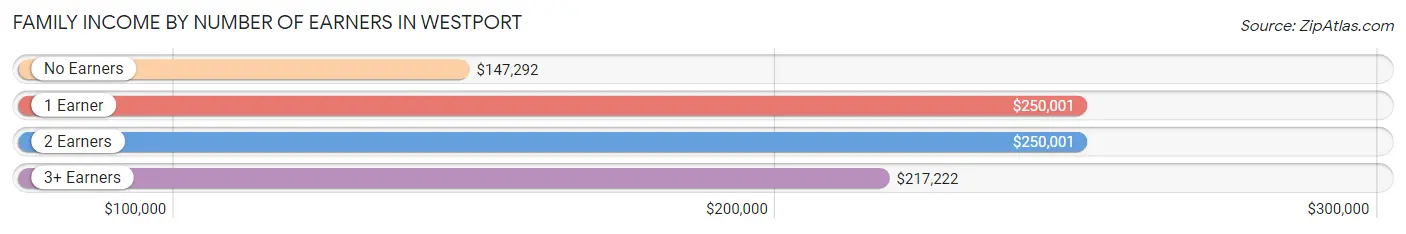
Family Income by Number of Earners in Westport
The median family income in Westport is $250,001, with families comprising 1 earner (227) having the highest median family income of $250,001, while families with no earners (60) have the lowest median family income of $147,292, accounting for 31.0% and 8.2% of families, respectively.
| Number of Earners | # Families | Median Income |
| No Earners | 60 (8.2%) | $147,292 |
| 1 Earner | 227 (31.0%) | $250,001 |
| 2 Earners | 398 (54.4%) | $250,001 |
| 3+ Earners | 46 (6.3%) | $217,222 |
| Total | 731 (100.0%) | $250,001 |
Household Income in Westport
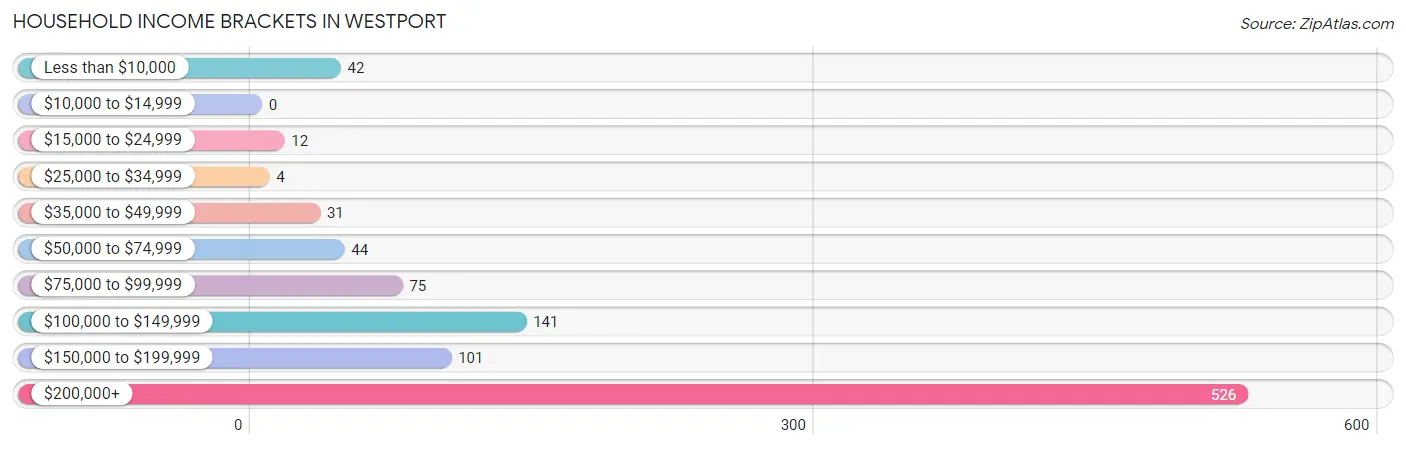
Household Income Brackets in Westport
With 526 households falling in the category, the $200,000+ income range is the most frequent in Westport, accounting for 53.9% of all households.
| Income Bracket | # Households | % Households |
| Less than $10,000 | 42 | 4.3% |
| $10,000 to $14,999 | 0 | 0.0% |
| $15,000 to $24,999 | 12 | 1.2% |
| $25,000 to $34,999 | 4 | 0.4% |
| $35,000 to $49,999 | 31 | 3.2% |
| $50,000 to $74,999 | 44 | 4.5% |
| $75,000 to $99,999 | 75 | 7.7% |
| $100,000 to $149,999 | 141 | 14.4% |
| $150,000 to $199,999 | 101 | 10.3% |
| $200,000+ | 526 | 53.9% |
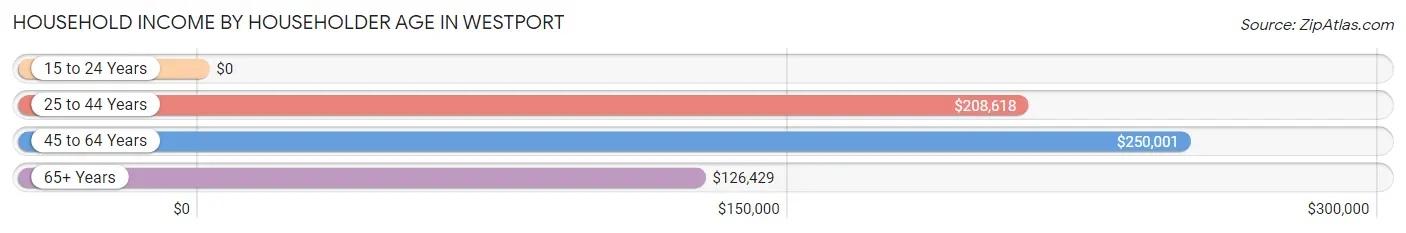
Household Income by Householder Age in Westport
The median household income in Westport is $215,526, with the highest median household income of $250,001 found in the 45 to 64 years age bracket for the primary householder. A total of 489 households (50.1%) fall into this category.
| Income Bracket | # Households | Median Income |
| 15 to 24 Years | 0 (0.0%) | $0 |
| 25 to 44 Years | 211 (21.6%) | $208,618 |
| 45 to 64 Years | 489 (50.1%) | $250,001 |
| 65+ Years | 276 (28.3%) | $126,429 |
| Total | 976 (100.0%) | $215,526 |
Poverty in Westport
Income Below Poverty by Sex and Age in Westport
With 1.1% poverty level for males and 3.3% for females among the residents of Westport, 55 to 64 year old males and 65 to 74 year old females are the most vulnerable to poverty, with 10 males (5.1%) and 13 females (17.8%) in their respective age groups living below the poverty level.
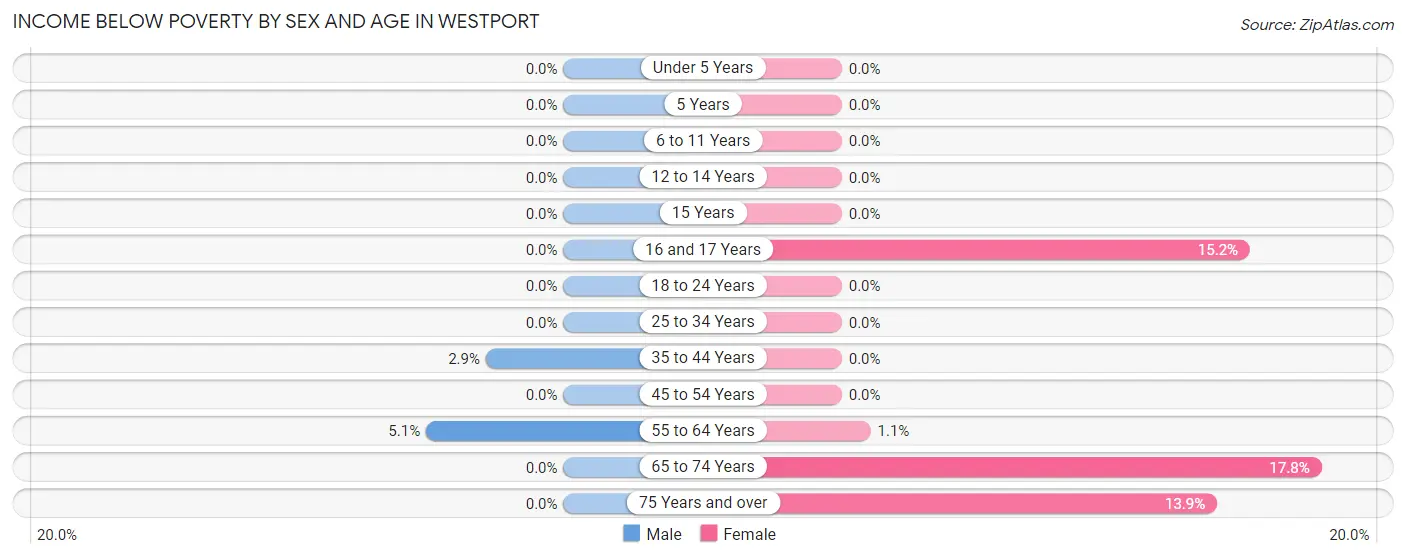
| Age Bracket | Male | Female |
| Under 5 Years | 0 (0.0%) | 0 (0.0%) |
| 5 Years | 0 (0.0%) | 0 (0.0%) |
| 6 to 11 Years | 0 (0.0%) | 0 (0.0%) |
| 12 to 14 Years | 0 (0.0%) | 0 (0.0%) |
| 15 Years | 0 (0.0%) | 0 (0.0%) |
| 16 and 17 Years | 0 (0.0%) | 10 (15.1%) |
| 18 to 24 Years | 0 (0.0%) | 0 (0.0%) |
| 25 to 34 Years | 0 (0.0%) | 0 (0.0%) |
| 35 to 44 Years | 6 (2.9%) | 0 (0.0%) |
| 45 to 54 Years | 0 (0.0%) | 0 (0.0%) |
| 55 to 64 Years | 10 (5.1%) | 2 (1.1%) |
| 65 to 74 Years | 0 (0.0%) | 13 (17.8%) |
| 75 Years and over | 0 (0.0%) | 17 (13.9%) |
| Total | 16 (1.1%) | 42 (3.3%) |
Income Above Poverty by Sex and Age in Westport
According to the poverty statistics in Westport, males aged under 5 years and females aged under 5 years are the age groups that are most secure financially, with 100.0% of males and 100.0% of females in these age groups living above the poverty line.
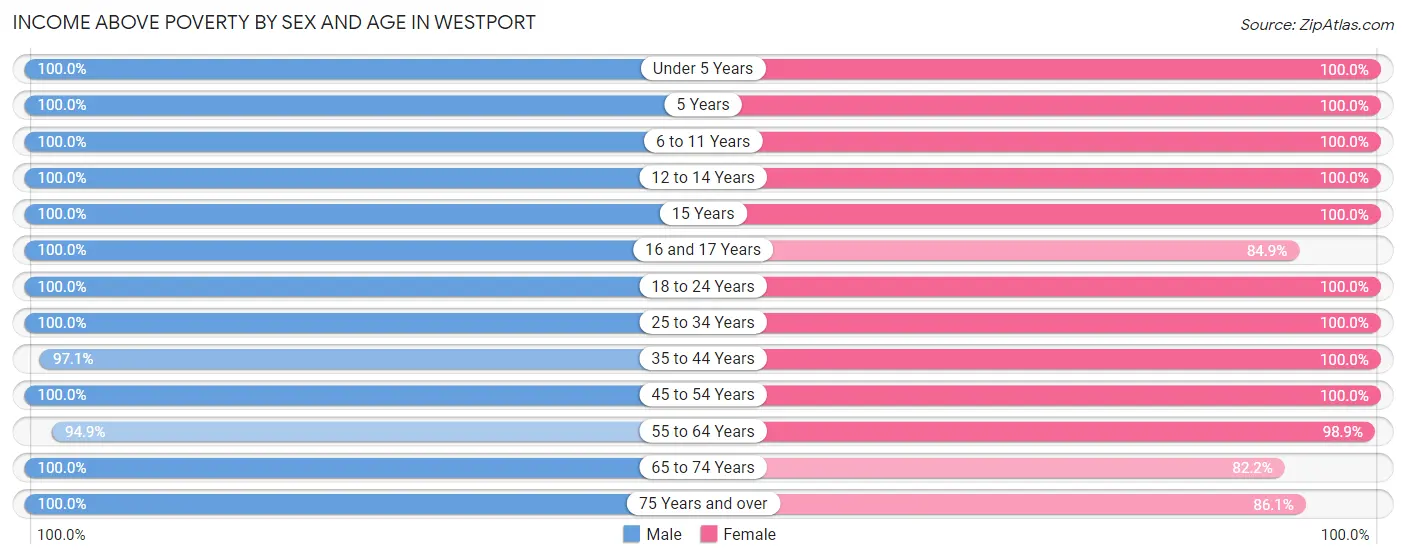
| Age Bracket | Male | Female |
| Under 5 Years | 37 (100.0%) | 51 (100.0%) |
| 5 Years | 14 (100.0%) | 64 (100.0%) |
| 6 to 11 Years | 172 (100.0%) | 127 (100.0%) |
| 12 to 14 Years | 105 (100.0%) | 43 (100.0%) |
| 15 Years | 22 (100.0%) | 35 (100.0%) |
| 16 and 17 Years | 61 (100.0%) | 56 (84.9%) |
| 18 to 24 Years | 73 (100.0%) | 55 (100.0%) |
| 25 to 34 Years | 64 (100.0%) | 66 (100.0%) |
| 35 to 44 Years | 202 (97.1%) | 122 (100.0%) |
| 45 to 54 Years | 275 (100.0%) | 252 (100.0%) |
| 55 to 64 Years | 186 (94.9%) | 185 (98.9%) |
| 65 to 74 Years | 113 (100.0%) | 60 (82.2%) |
| 75 Years and over | 65 (100.0%) | 105 (86.1%) |
| Total | 1,389 (98.9%) | 1,221 (96.7%) |
Income Below Poverty Among Married-Couple Families in Westport
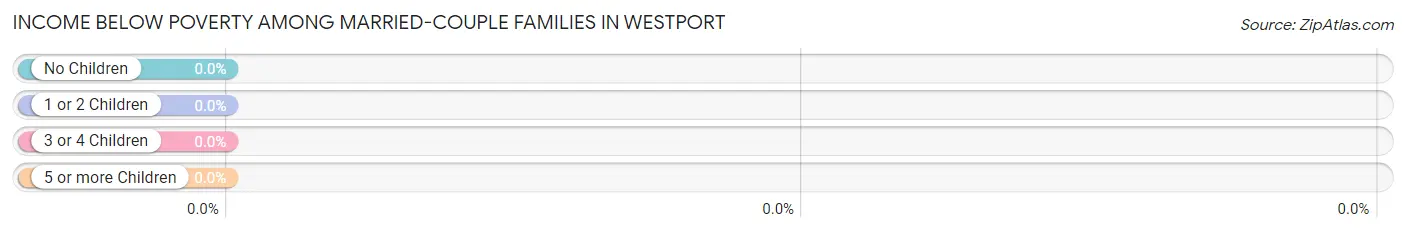
| Children | Above Poverty | Below Poverty |
| No Children | 293 (100.0%) | 0 (0.0%) |
| 1 or 2 Children | 273 (100.0%) | 0 (0.0%) |
| 3 or 4 Children | 90 (100.0%) | 0 (0.0%) |
| 5 or more Children | 0 (0.0%) | 0 (0.0%) |
| Total | 656 (100.0%) | 0 (0.0%) |
Income Below Poverty Among Single-Parent Households in Westport
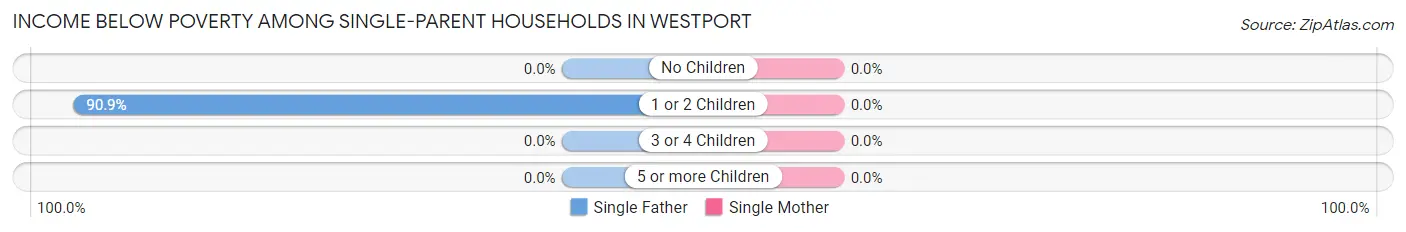
| Children | Single Father | Single Mother |
| No Children | 0 (0.0%) | 0 (0.0%) |
| 1 or 2 Children | 10 (90.9%) | 0 (0.0%) |
| 3 or 4 Children | 0 (0.0%) | 0 (0.0%) |
| 5 or more Children | 0 (0.0%) | 0 (0.0%) |
| Total | 10 (18.9%) | 0 (0.0%) |
Income Below Poverty Among Married-Couple vs Single-Parent Households in Westport
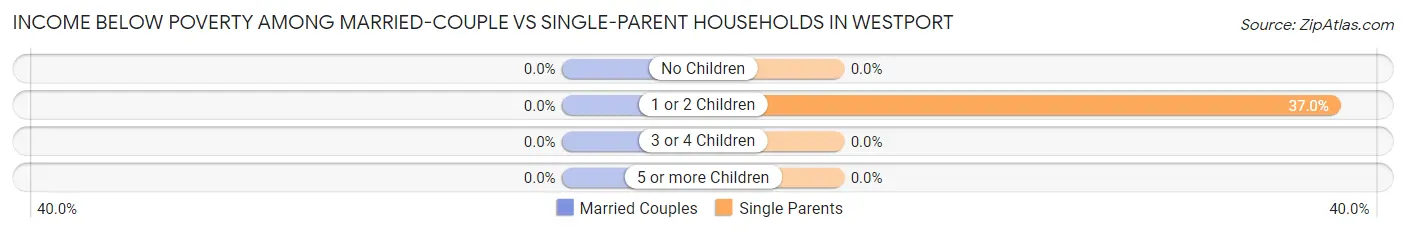
| Children | Married-Couple Families | Single-Parent Households |
| No Children | 0 (0.0%) | 0 (0.0%) |
| 1 or 2 Children | 0 (0.0%) | 10 (37.0%) |
| 3 or 4 Children | 0 (0.0%) | 0 (0.0%) |
| 5 or more Children | 0 (0.0%) | 0 (0.0%) |
| Total | 0 (0.0%) | 10 (13.3%) |
Race in Westport
The most populous races in Westport are White / Caucasian (2,150 | 80.6%), Asian (294 | 11.0%), and Two or more Races (174 | 6.5%).
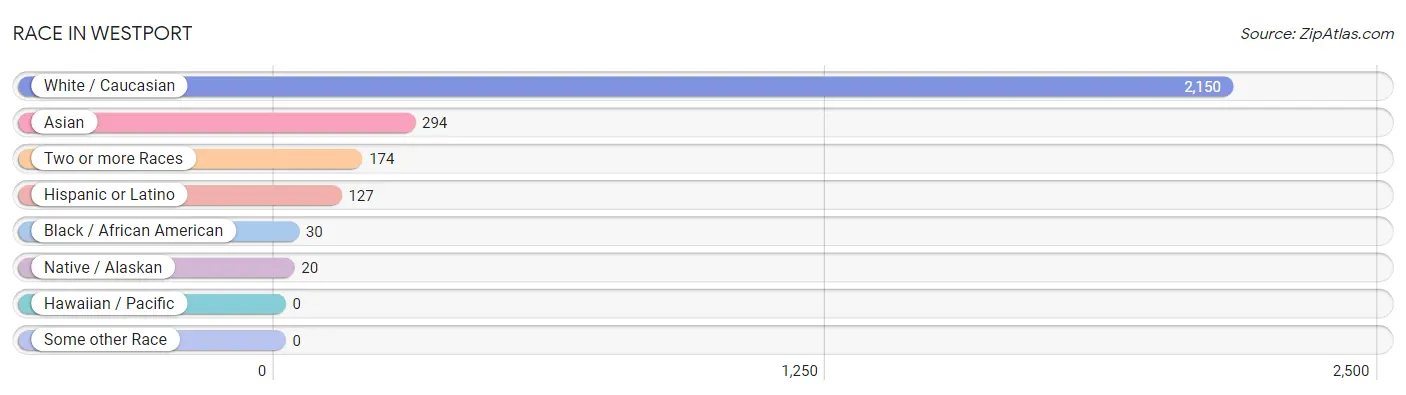
| Race | # Population | % Population |
| Asian | 294 | 11.0% |
| Black / African American | 30 | 1.1% |
| Hawaiian / Pacific | 0 | 0.0% |
| Hispanic or Latino | 127 | 4.8% |
| Native / Alaskan | 20 | 0.7% |
| White / Caucasian | 2,150 | 80.6% |
| Two or more Races | 174 | 6.5% |
| Some other Race | 0 | 0.0% |
| Total | 2,668 | 100.0% |
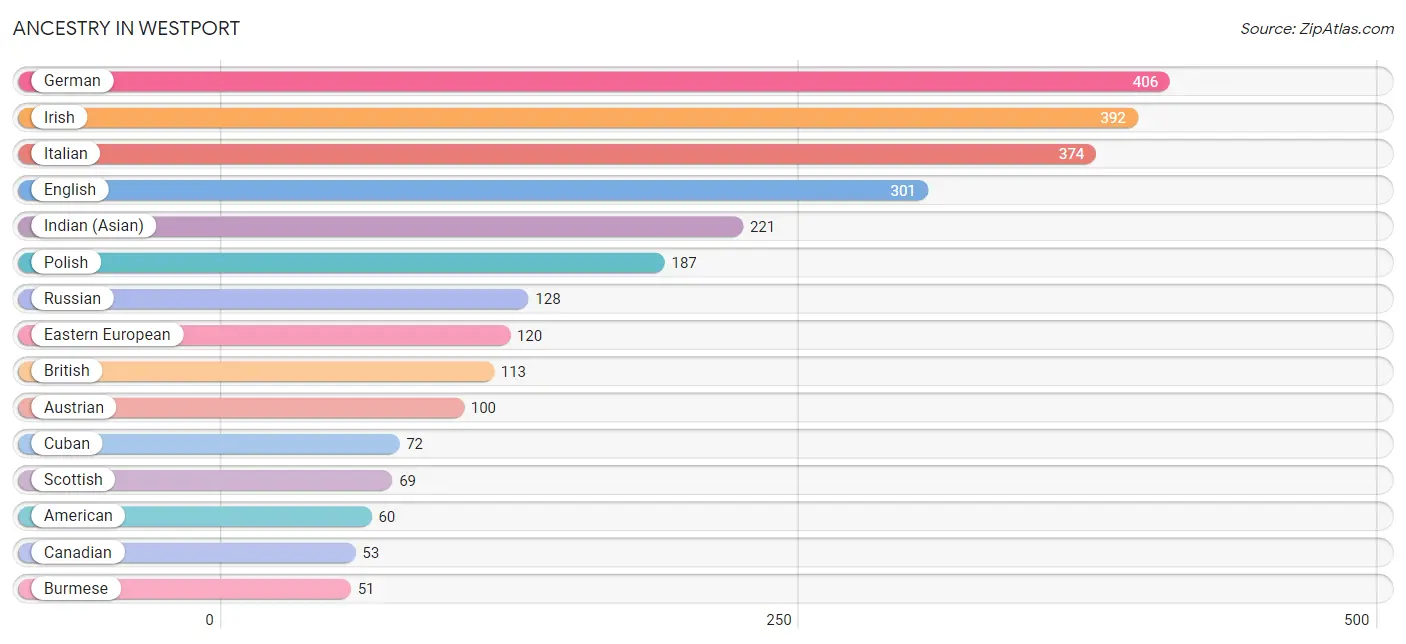
Ancestry in Westport
The most populous ancestries reported in Westport are German (406 | 15.2%), Irish (392 | 14.7%), Italian (374 | 14.0%), English (301 | 11.3%), and Indian (Asian) (221 | 8.3%), together accounting for 63.5% of all Westport residents.
| Ancestry | # Population | % Population |
| American | 60 | 2.2% |
| Arab | 8 | 0.3% |
| Armenian | 25 | 0.9% |
| Austrian | 100 | 3.7% |
| Blackfeet | 15 | 0.6% |
| British | 113 | 4.2% |
| Burmese | 51 | 1.9% |
| Canadian | 53 | 2.0% |
| Cuban | 72 | 2.7% |
| Dutch | 16 | 0.6% |
| Eastern European | 120 | 4.5% |
| Ecuadorian | 25 | 0.9% |
| English | 301 | 11.3% |
| Estonian | 16 | 0.6% |
| European | 36 | 1.3% |
| French | 28 | 1.1% |
| French Canadian | 23 | 0.9% |
| German | 406 | 15.2% |
| Greek | 44 | 1.7% |
| Hungarian | 34 | 1.3% |
| Indian (Asian) | 221 | 8.3% |
| Iranian | 5 | 0.2% |
| Irish | 392 | 14.7% |
| Italian | 374 | 14.0% |
| Korean | 44 | 1.7% |
| Lebanese | 8 | 0.3% |
| Lithuanian | 15 | 0.6% |
| Mexican | 15 | 0.6% |
| Norwegian | 17 | 0.6% |
| Polish | 187 | 7.0% |
| Puerto Rican | 15 | 0.6% |
| Russian | 128 | 4.8% |
| Scandinavian | 14 | 0.5% |
| Scotch-Irish | 13 | 0.5% |
| Scottish | 69 | 2.6% |
| South American | 25 | 0.9% |
| South American Indian | 25 | 0.9% |
| Swedish | 22 | 0.8% |
| Swiss | 46 | 1.7% |
| Thai | 36 | 1.3% |
| Turkish | 16 | 0.6% |
| Ukrainian | 2 | 0.1% |
| Welsh | 16 | 0.6% | View All 43 Rows |
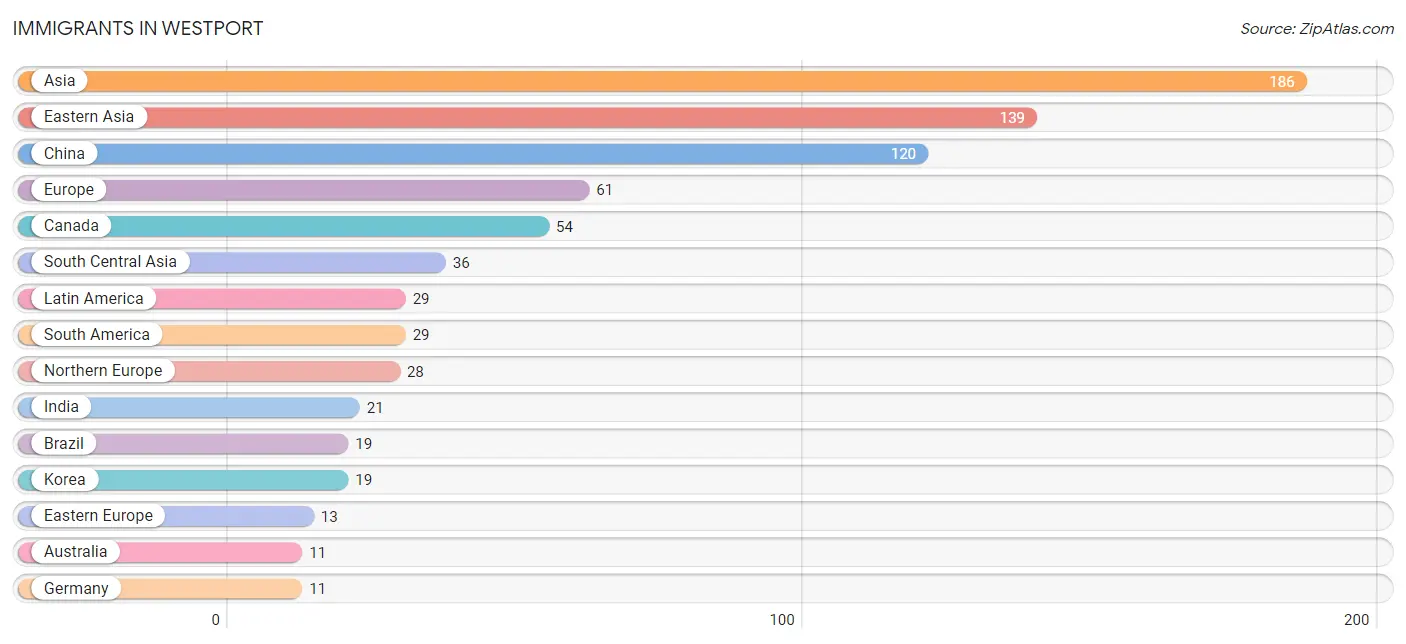
Immigrants in Westport
The most numerous immigrant groups reported in Westport came from Asia (186 | 7.0%), Eastern Asia (139 | 5.2%), China (120 | 4.5%), Europe (61 | 2.3%), and Canada (54 | 2.0%), together accounting for 21.0% of all Westport residents.
| Immigration Origin | # Population | % Population |
| Africa | 3 | 0.1% |
| Asia | 186 | 7.0% |
| Australia | 11 | 0.4% |
| Brazil | 19 | 0.7% |
| Canada | 54 | 2.0% |
| China | 120 | 4.5% |
| Eastern Asia | 139 | 5.2% |
| Eastern Europe | 13 | 0.5% |
| Ecuador | 10 | 0.4% |
| Europe | 61 | 2.3% |
| Germany | 11 | 0.4% |
| Greece | 9 | 0.3% |
| Hong Kong | 7 | 0.3% |
| Hungary | 3 | 0.1% |
| India | 21 | 0.8% |
| Kazakhstan | 9 | 0.3% |
| Korea | 19 | 0.7% |
| Latin America | 29 | 1.1% |
| Northern Europe | 28 | 1.1% |
| Oceania | 11 | 0.4% |
| Pakistan | 6 | 0.2% |
| Philippines | 11 | 0.4% |
| South Africa | 3 | 0.1% |
| South America | 29 | 1.1% |
| South Central Asia | 36 | 1.3% |
| South Eastern Asia | 11 | 0.4% |
| Southern Europe | 9 | 0.3% |
| Taiwan | 6 | 0.2% |
| Ukraine | 10 | 0.4% |
| Western Europe | 11 | 0.4% | View All 30 Rows |
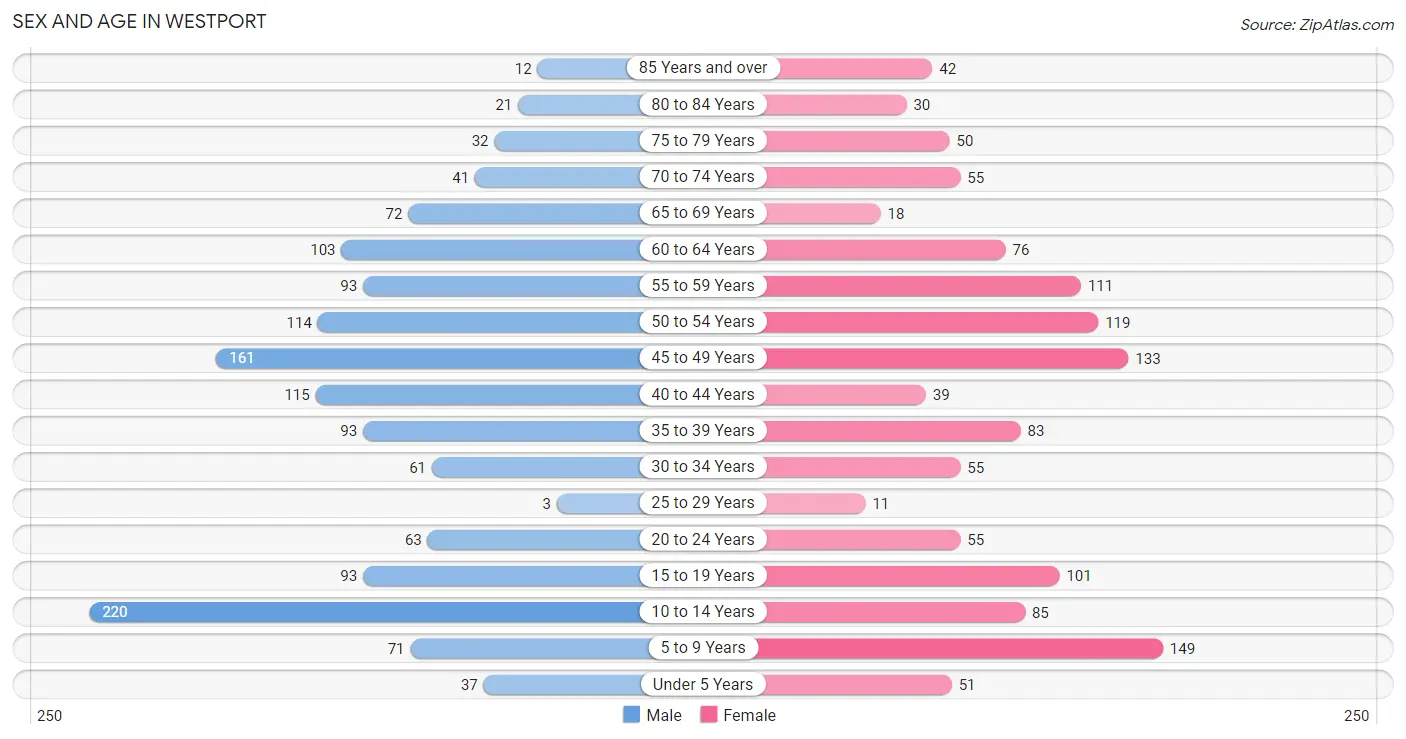
Sex and Age in Westport
Sex and Age in Westport
The most populous age groups in Westport are 10 to 14 Years (220 | 15.7%) for men and 5 to 9 Years (149 | 11.8%) for women.
| Age Bracket | Male | Female |
| Under 5 Years | 37 (2.6%) | 51 (4.0%) |
| 5 to 9 Years | 71 (5.1%) | 149 (11.8%) |
| 10 to 14 Years | 220 (15.7%) | 85 (6.7%) |
| 15 to 19 Years | 93 (6.6%) | 101 (8.0%) |
| 20 to 24 Years | 63 (4.5%) | 55 (4.3%) |
| 25 to 29 Years | 3 (0.2%) | 11 (0.9%) |
| 30 to 34 Years | 61 (4.3%) | 55 (4.3%) |
| 35 to 39 Years | 93 (6.6%) | 83 (6.6%) |
| 40 to 44 Years | 115 (8.2%) | 39 (3.1%) |
| 45 to 49 Years | 161 (11.5%) | 133 (10.5%) |
| 50 to 54 Years | 114 (8.1%) | 119 (9.4%) |
| 55 to 59 Years | 93 (6.6%) | 111 (8.8%) |
| 60 to 64 Years | 103 (7.3%) | 76 (6.0%) |
| 65 to 69 Years | 72 (5.1%) | 18 (1.4%) |
| 70 to 74 Years | 41 (2.9%) | 55 (4.3%) |
| 75 to 79 Years | 32 (2.3%) | 50 (4.0%) |
| 80 to 84 Years | 21 (1.5%) | 30 (2.4%) |
| 85 Years and over | 12 (0.9%) | 42 (3.3%) |
| Total | 1,405 (100.0%) | 1,263 (100.0%) |
Families and Households in Westport
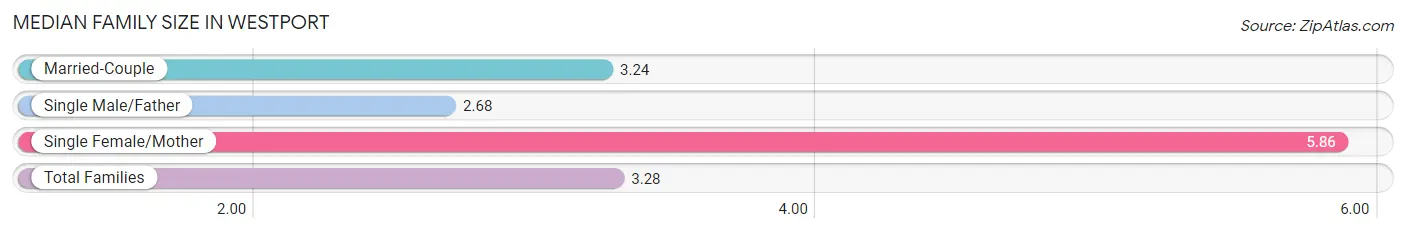
Median Family Size in Westport
The median family size in Westport is 3.28 persons per family, with single female/mother families (22 | 3.0%) accounting for the largest median family size of 5.86 persons per family. On the other hand, single male/father families (53 | 7.2%) represent the smallest median family size with 2.68 persons per family.
| Family Type | # Families | Family Size |
| Married-Couple | 656 (89.7%) | 3.24 |
| Single Male/Father | 53 (7.2%) | 2.68 |
| Single Female/Mother | 22 (3.0%) | 5.86 |
| Total Families | 731 (100.0%) | 3.28 |
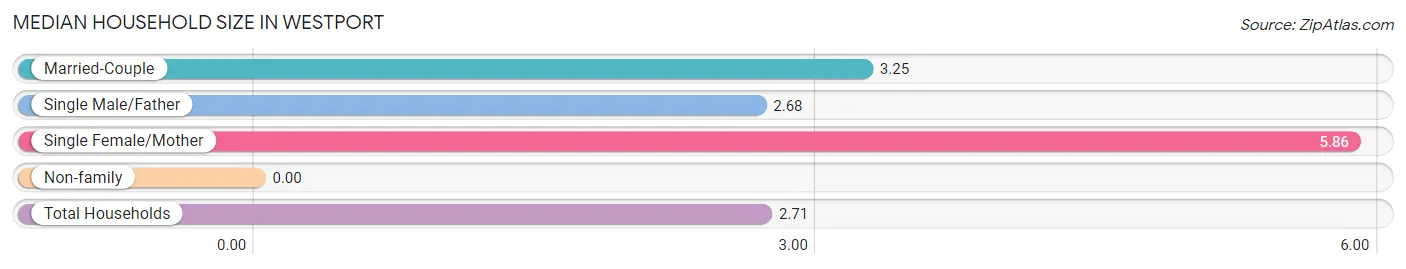
Median Household Size in Westport
| Household Type | # Households | Household Size |
| Married-Couple | 656 (67.2%) | 3.25 |
| Single Male/Father | 53 (5.4%) | 2.68 |
| Single Female/Mother | 22 (2.2%) | 5.86 |
| Non-family | 245 (25.1%) | - |
| Total Households | 976 (100.0%) | 2.71 |
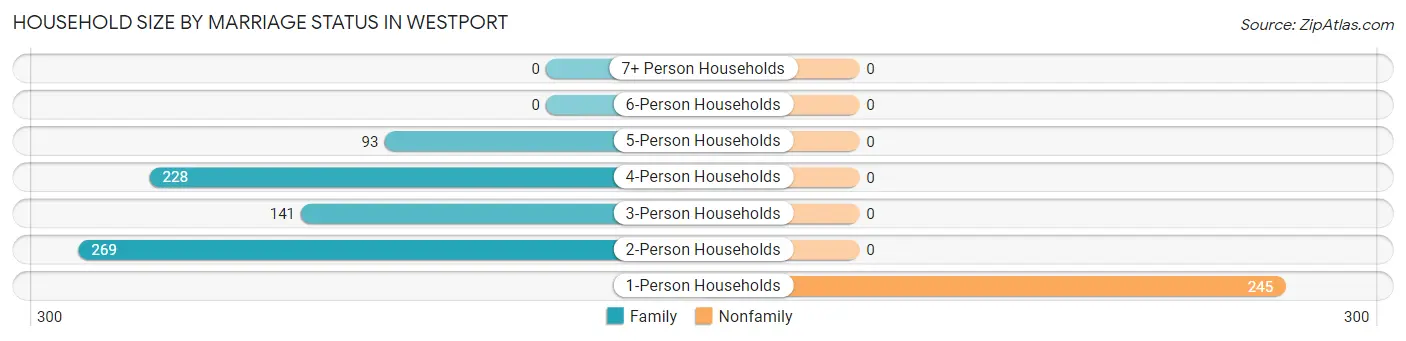
Household Size by Marriage Status in Westport
Out of a total of 976 households in Westport, 731 (74.9%) are family households, while 245 (25.1%) are nonfamily households. The most numerous type of family households are 2-person households, comprising 269, and the most common type of nonfamily households are 1-person households, comprising 245.
| Household Size | Family Households | Nonfamily Households |
| 1-Person Households | - | 245 (25.1%) |
| 2-Person Households | 269 (27.6%) | 0 (0.0%) |
| 3-Person Households | 141 (14.4%) | 0 (0.0%) |
| 4-Person Households | 228 (23.4%) | 0 (0.0%) |
| 5-Person Households | 93 (9.5%) | 0 (0.0%) |
| 6-Person Households | 0 (0.0%) | 0 (0.0%) |
| 7+ Person Households | 0 (0.0%) | 0 (0.0%) |
| Total | 731 (74.9%) | 245 (25.1%) |
Female Fertility in Westport
Fertility by Age in Westport
| Age Bracket | Women with Births | Births / 1,000 Women |
| 15 to 19 years | 0 (0.0%) | 0.0 |
| 20 to 34 years | 0 (0.0%) | 0.0 |
| 35 to 50 years | 0 (0.0%) | 0.0 |
| Total | 0 (0.0%) | 0.0 |
Fertility by Age by Marriage Status in Westport
| Age Bracket | Married | Unmarried |
| 15 to 19 years | 0 (0.0%) | 0 (0.0%) |
| 20 to 34 years | 0 (0.0%) | 0 (0.0%) |
| 35 to 50 years | 0 (0.0%) | 0 (0.0%) |
| Total | 0 (0.0%) | 0 (0.0%) |
Fertility by Education in Westport
| Educational Attainment | Women with Births | Births / 1,000 Women |
| Less than High School | 0 (0.0%) | 0.0 |
| High School Diploma | 0 (0.0%) | 0.0 |
| College or Associate's Degree | 0 (0.0%) | 0.0 |
| Bachelor's Degree | 0 (0.0%) | 0.0 |
| Graduate Degree | 0 (0.0%) | 0.0 |
| Total | 0 (0.0%) | 0.0 |
Fertility by Education by Marriage Status in Westport
| Educational Attainment | Married | Unmarried |
| Less than High School | 0 (0.0%) | 0 (0.0%) |
| High School Diploma | 0 (0.0%) | 0 (0.0%) |
| College or Associate's Degree | 0 (0.0%) | 0 (0.0%) |
| Bachelor's Degree | 0 (0.0%) | 0 (0.0%) |
| Graduate Degree | 0 (0.0%) | 0 (0.0%) |
| Total | 0 (0.0%) | 0 (0.0%) |
Employment Characteristics in Westport
Employment by Class of Employer in Westport
Among the 1,257 employed individuals in Westport, private company employees (824 | 65.5%), not-for-profit organizations (155 | 12.3%), and self-employed (not incorporated) (131 | 10.4%) make up the most common classes of employment.
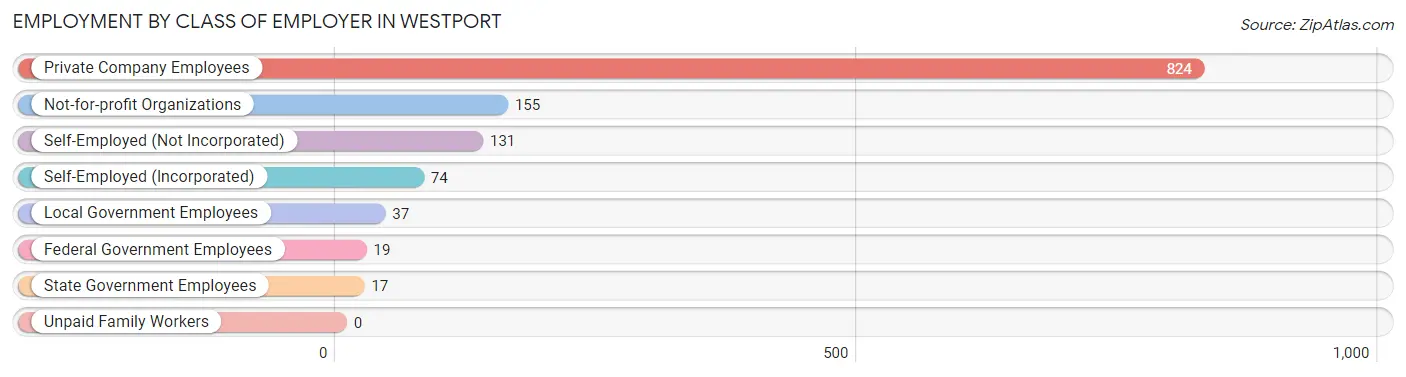
| Employer Class | # Employees | % Employees |
| Private Company Employees | 824 | 65.5% |
| Self-Employed (Incorporated) | 74 | 5.9% |
| Self-Employed (Not Incorporated) | 131 | 10.4% |
| Not-for-profit Organizations | 155 | 12.3% |
| Local Government Employees | 37 | 2.9% |
| State Government Employees | 17 | 1.3% |
| Federal Government Employees | 19 | 1.5% |
| Unpaid Family Workers | 0 | 0.0% |
| Total | 1,257 | 100.0% |
Employment Status by Age in Westport
According to the labor force statistics for Westport, out of the total population over 16 years of age (1,998), 67.6% or 1,351 individuals are in the labor force, with 6.9% or 93 of them unemployed. The age group with the highest labor force participation rate is 30 to 34 years, with 100.0% or 116 individuals in the labor force. Within the labor force, the 65 to 74 years age range has the highest percentage of unemployed individuals, with 20.9% or 18 of them being unemployed.
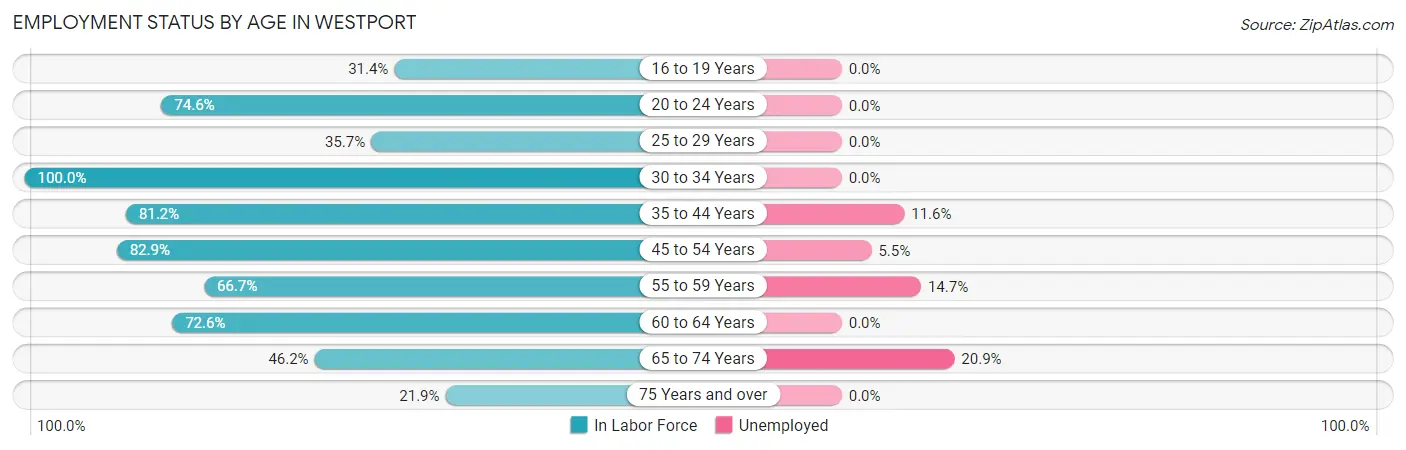
| Age Bracket | In Labor Force | Unemployed |
| 16 to 19 Years | 43 (31.4%) | 0 (0.0%) |
| 20 to 24 Years | 88 (74.6%) | 0 (0.0%) |
| 25 to 29 Years | 5 (35.7%) | 0 (0.0%) |
| 30 to 34 Years | 116 (100.0%) | 0 (0.0%) |
| 35 to 44 Years | 268 (81.2%) | 31 (11.6%) |
| 45 to 54 Years | 437 (82.9%) | 24 (5.5%) |
| 55 to 59 Years | 136 (66.7%) | 20 (14.7%) |
| 60 to 64 Years | 130 (72.6%) | 0 (0.0%) |
| 65 to 74 Years | 86 (46.2%) | 18 (20.9%) |
| 75 Years and over | 41 (21.9%) | 0 (0.0%) |
| Total | 1,351 (67.6%) | 93 (6.9%) |
Employment Status by Educational Attainment in Westport
According to labor force statistics for Westport, 79.7% of individuals (1,092) out of the total population between 25 and 64 years of age (1,370) are in the labor force, with 6.9% or 75 of them being unemployed. The group with the highest labor force participation rate are those with the educational attainment of college / associate degree, with 100.0% or 64 individuals in the labor force. Within the labor force, individuals with high school diploma education have the highest percentage of unemployment, with 38.2% or 13 of them being unemployed.
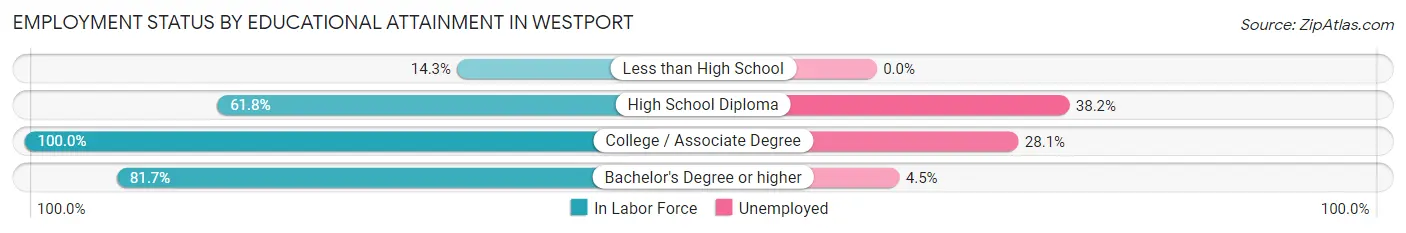
| Educational Attainment | In Labor Force | Unemployed |
| Less than High School | 6 (14.3%) | 0 (0.0%) |
| High School Diploma | 34 (61.8%) | 21 (38.2%) |
| College / Associate Degree | 64 (100.0%) | 18 (28.1%) |
| Bachelor's Degree or higher | 988 (81.7%) | 54 (4.5%) |
| Total | 1,092 (79.7%) | 95 (6.9%) |
Employment Occupations by Sex in Westport
Management, Business, Science and Arts Occupations
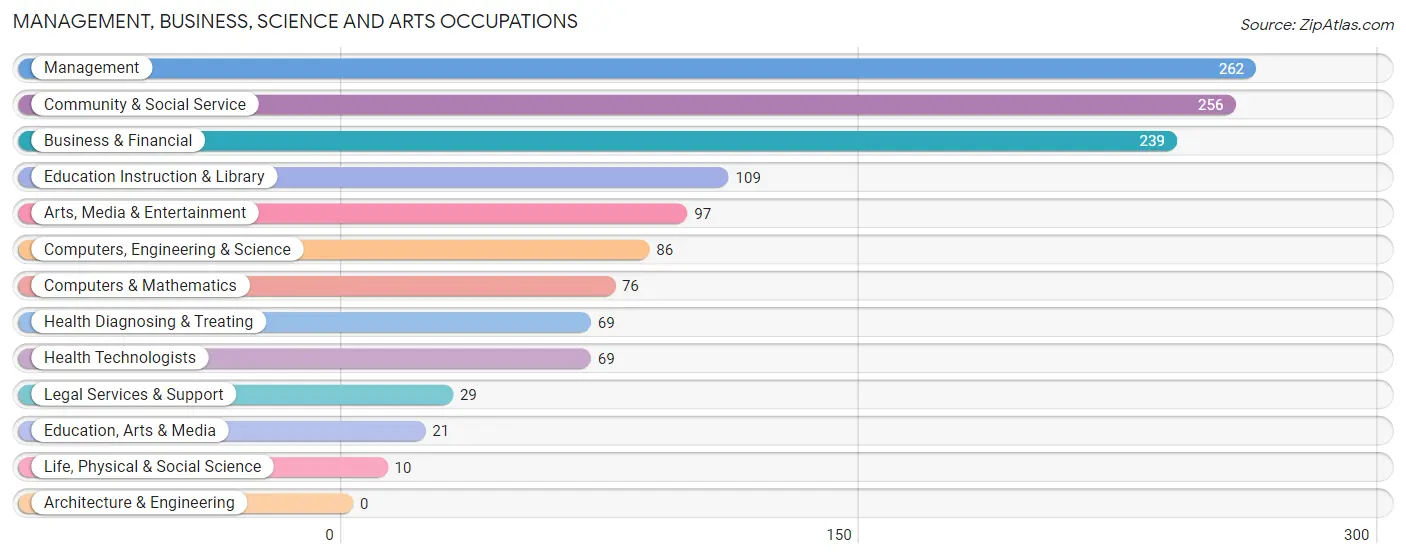
The most common Management, Business, Science and Arts occupations in Westport are Management (262 | 20.8%), Community & Social Service (256 | 20.4%), Business & Financial (239 | 19.0%), Education Instruction & Library (109 | 8.7%), and Arts, Media & Entertainment (97 | 7.7%).
Management, Business, Science and Arts Occupations by Sex
Within the Management, Business, Science and Arts occupations in Westport, the most male-oriented occupations are Life, Physical & Social Science (100.0%), Education, Arts & Media (100.0%), and Business & Financial (81.2%), while the most female-oriented occupations are Education Instruction & Library (78.9%), Health Diagnosing & Treating (62.3%), and Health Technologists (62.3%).
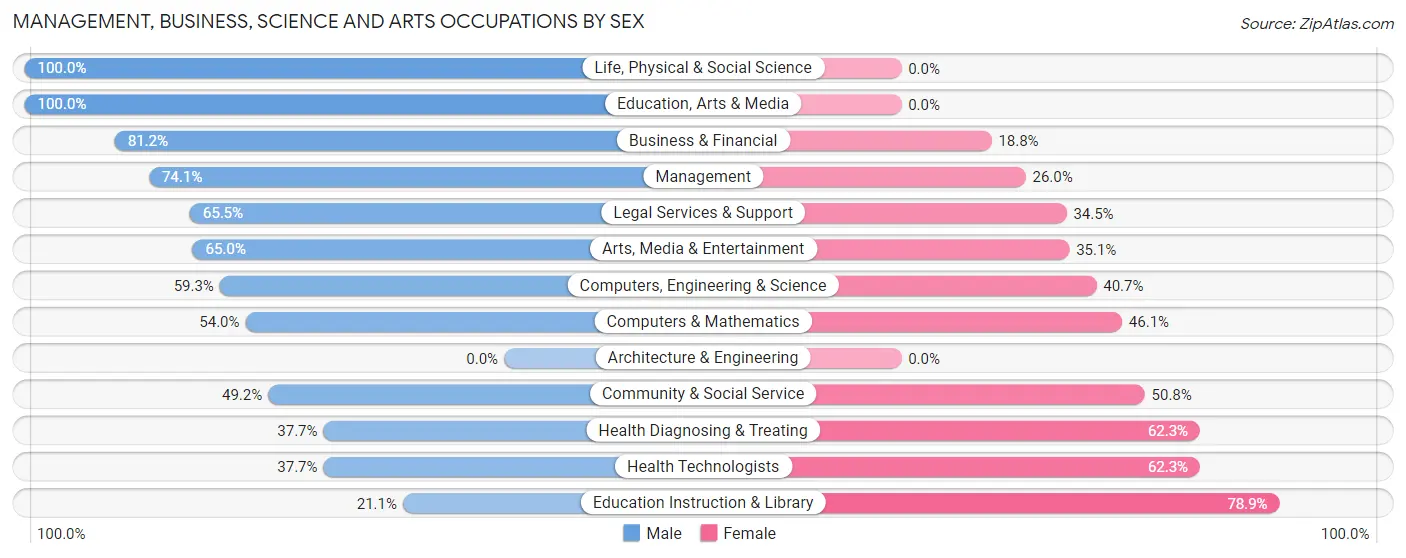
| Occupation | Male | Female |
| Management | 194 (74.1%) | 68 (26.0%) |
| Business & Financial | 194 (81.2%) | 45 (18.8%) |
| Computers, Engineering & Science | 51 (59.3%) | 35 (40.7%) |
| Computers & Mathematics | 41 (53.9%) | 35 (46.1%) |
| Architecture & Engineering | 0 (0.0%) | 0 (0.0%) |
| Life, Physical & Social Science | 10 (100.0%) | 0 (0.0%) |
| Community & Social Service | 126 (49.2%) | 130 (50.8%) |
| Education, Arts & Media | 21 (100.0%) | 0 (0.0%) |
| Legal Services & Support | 19 (65.5%) | 10 (34.5%) |
| Education Instruction & Library | 23 (21.1%) | 86 (78.9%) |
| Arts, Media & Entertainment | 63 (64.9%) | 34 (35.0%) |
| Health Diagnosing & Treating | 26 (37.7%) | 43 (62.3%) |
| Health Technologists | 26 (37.7%) | 43 (62.3%) |
| Total (Category) | 591 (64.8%) | 321 (35.2%) |
| Total (Overall) | 835 (66.4%) | 422 (33.6%) |
Services Occupations
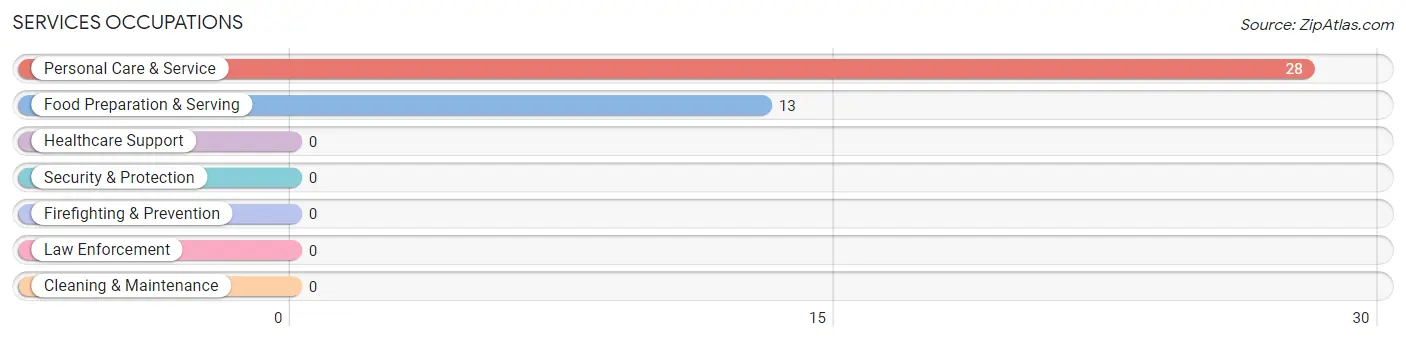
The most common Services occupations in Westport are Personal Care & Service (28 | 2.2%), and Food Preparation & Serving (13 | 1.0%).
Services Occupations by Sex
Within the Services occupations in Westport, the most male-oriented occupations are Food Preparation & Serving (61.5%), and Personal Care & Service (28.6%), while the most female-oriented occupations are Personal Care & Service (71.4%), and Food Preparation & Serving (38.5%).
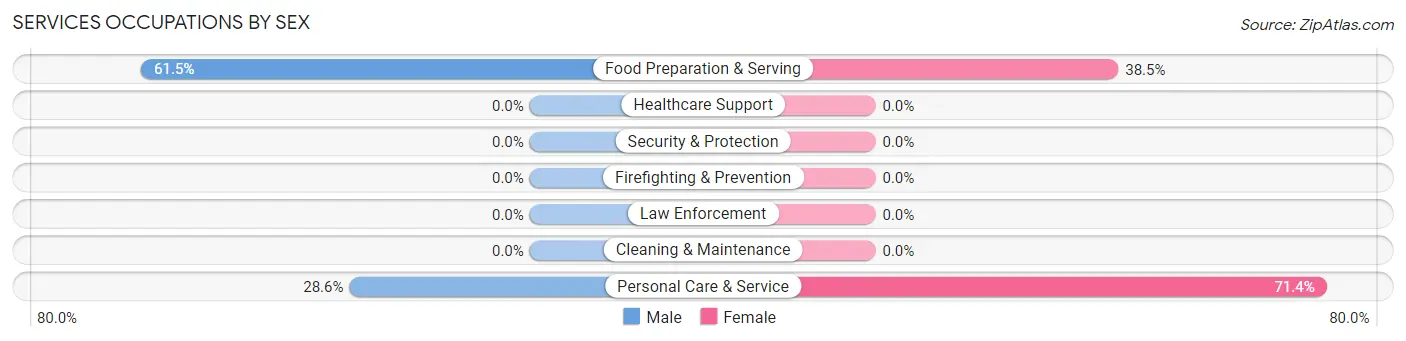
| Occupation | Male | Female |
| Healthcare Support | 0 (0.0%) | 0 (0.0%) |
| Security & Protection | 0 (0.0%) | 0 (0.0%) |
| Firefighting & Prevention | 0 (0.0%) | 0 (0.0%) |
| Law Enforcement | 0 (0.0%) | 0 (0.0%) |
| Food Preparation & Serving | 8 (61.5%) | 5 (38.5%) |
| Cleaning & Maintenance | 0 (0.0%) | 0 (0.0%) |
| Personal Care & Service | 8 (28.6%) | 20 (71.4%) |
| Total (Category) | 16 (39.0%) | 25 (61.0%) |
| Total (Overall) | 835 (66.4%) | 422 (33.6%) |
Sales and Office Occupations
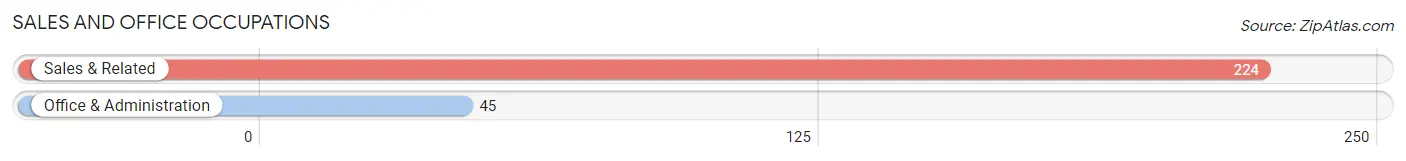
The most common Sales and Office occupations in Westport are Sales & Related (224 | 17.8%), and Office & Administration (45 | 3.6%).
Sales and Office Occupations by Sex

| Occupation | Male | Female |
| Sales & Related | 200 (89.3%) | 24 (10.7%) |
| Office & Administration | 2 (4.4%) | 43 (95.6%) |
| Total (Category) | 202 (75.1%) | 67 (24.9%) |
| Total (Overall) | 835 (66.4%) | 422 (33.6%) |
Natural Resources, Construction and Maintenance Occupations
The most common Natural Resources, Construction and Maintenance occupations in Westport are , and Construction & Extraction (5 | 0.4%).
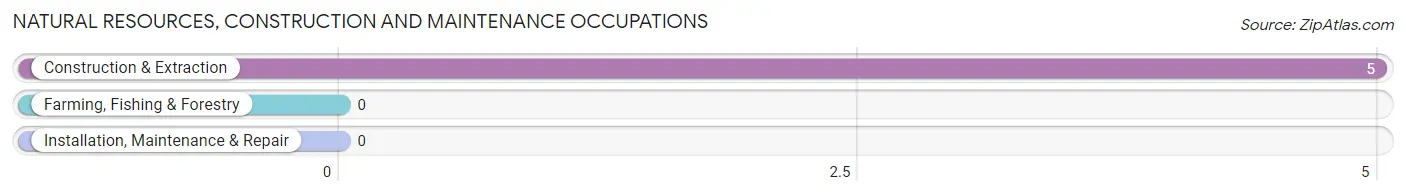
Natural Resources, Construction and Maintenance Occupations by Sex

| Occupation | Male | Female |
| Farming, Fishing & Forestry | 0 (0.0%) | 0 (0.0%) |
| Construction & Extraction | 5 (100.0%) | 0 (0.0%) |
| Installation, Maintenance & Repair | 0 (0.0%) | 0 (0.0%) |
| Total (Category) | 5 (100.0%) | 0 (0.0%) |
| Total (Overall) | 835 (66.4%) | 422 (33.6%) |
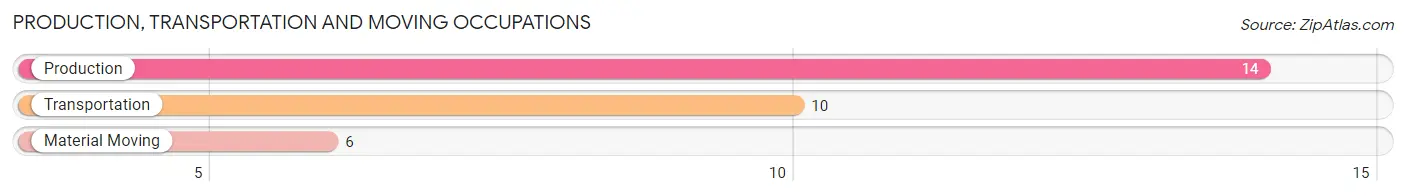
Production, Transportation and Moving Occupations
The most common Production, Transportation and Moving occupations in Westport are Production (14 | 1.1%), Transportation (10 | 0.8%), and Material Moving (6 | 0.5%).
Production, Transportation and Moving Occupations by Sex
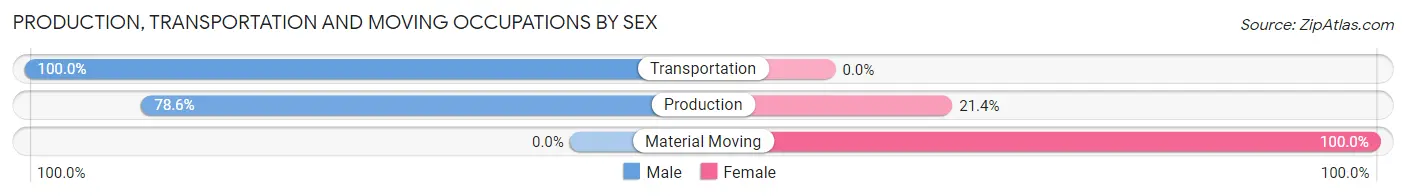
| Occupation | Male | Female |
| Production | 11 (78.6%) | 3 (21.4%) |
| Transportation | 10 (100.0%) | 0 (0.0%) |
| Material Moving | 0 (0.0%) | 6 (100.0%) |
| Total (Category) | 21 (70.0%) | 9 (30.0%) |
| Total (Overall) | 835 (66.4%) | 422 (33.6%) |
Employment Industries by Sex in Westport
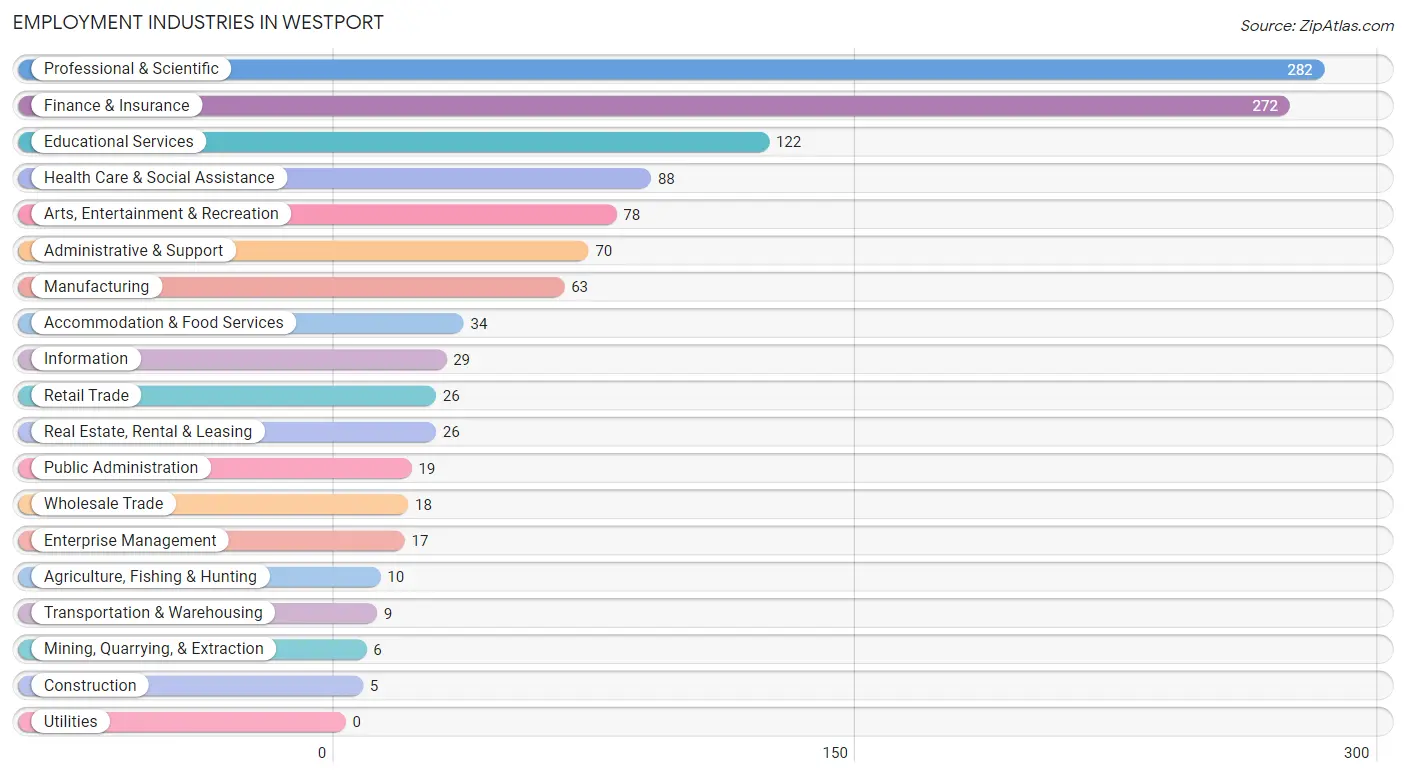
Employment Industries in Westport
The major employment industries in Westport include Professional & Scientific (282 | 22.4%), Finance & Insurance (272 | 21.6%), Educational Services (122 | 9.7%), Health Care & Social Assistance (88 | 7.0%), and Arts, Entertainment & Recreation (78 | 6.2%).
Employment Industries by Sex in Westport
The Westport industries that see more men than women are Agriculture, Fishing & Hunting (100.0%), Construction (100.0%), and Retail Trade (100.0%), whereas the industries that tend to have a higher number of women are Mining, Quarrying, & Extraction (100.0%), Enterprise Management (100.0%), and Real Estate, Rental & Leasing (92.3%).
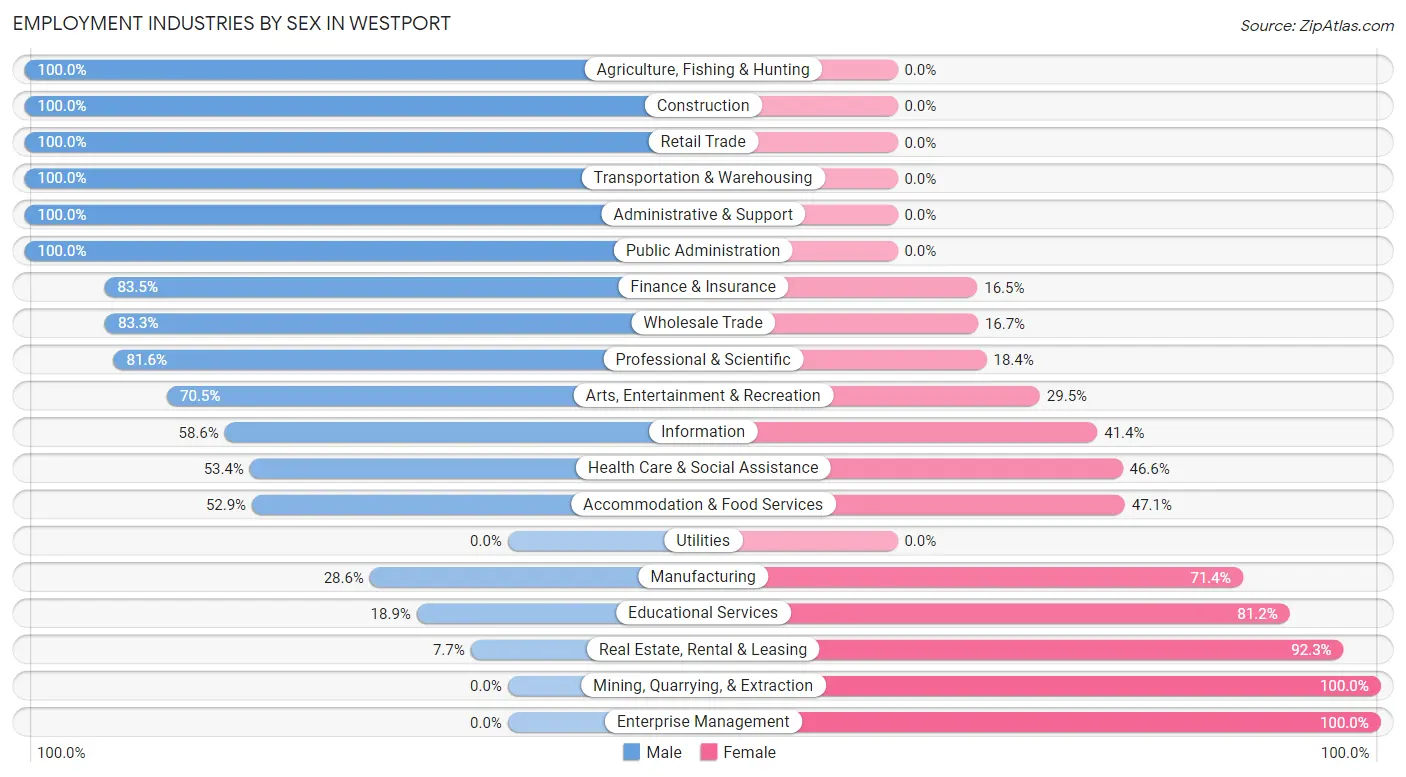
| Industry | Male | Female |
| Agriculture, Fishing & Hunting | 10 (100.0%) | 0 (0.0%) |
| Mining, Quarrying, & Extraction | 0 (0.0%) | 6 (100.0%) |
| Construction | 5 (100.0%) | 0 (0.0%) |
| Manufacturing | 18 (28.6%) | 45 (71.4%) |
| Wholesale Trade | 15 (83.3%) | 3 (16.7%) |
| Retail Trade | 26 (100.0%) | 0 (0.0%) |
| Transportation & Warehousing | 9 (100.0%) | 0 (0.0%) |
| Utilities | 0 (0.0%) | 0 (0.0%) |
| Information | 17 (58.6%) | 12 (41.4%) |
| Finance & Insurance | 227 (83.5%) | 45 (16.5%) |
| Real Estate, Rental & Leasing | 2 (7.7%) | 24 (92.3%) |
| Professional & Scientific | 230 (81.6%) | 52 (18.4%) |
| Enterprise Management | 0 (0.0%) | 17 (100.0%) |
| Administrative & Support | 70 (100.0%) | 0 (0.0%) |
| Educational Services | 23 (18.9%) | 99 (81.1%) |
| Health Care & Social Assistance | 47 (53.4%) | 41 (46.6%) |
| Arts, Entertainment & Recreation | 55 (70.5%) | 23 (29.5%) |
| Accommodation & Food Services | 18 (52.9%) | 16 (47.1%) |
| Public Administration | 19 (100.0%) | 0 (0.0%) |
| Total | 835 (66.4%) | 422 (33.6%) |
Education in Westport
School Enrollment in Westport
The most common levels of schooling among the 832 students in Westport are middle school (277 | 33.3%), high school (200 | 24.0%), and elementary school (164 | 19.7%).
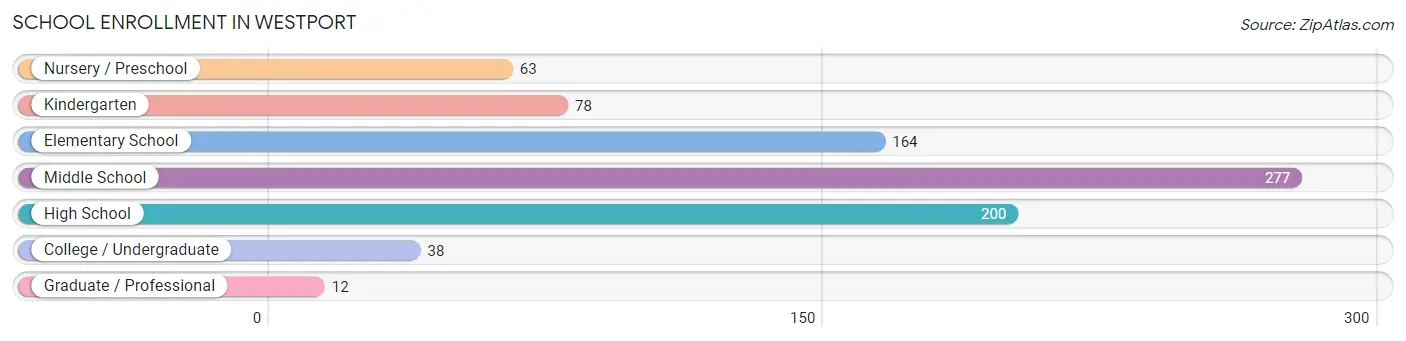
| School Level | # Students | % Students |
| Nursery / Preschool | 63 | 7.6% |
| Kindergarten | 78 | 9.4% |
| Elementary School | 164 | 19.7% |
| Middle School | 277 | 33.3% |
| High School | 200 | 24.0% |
| College / Undergraduate | 38 | 4.6% |
| Graduate / Professional | 12 | 1.4% |
| Total | 832 | 100.0% |
School Enrollment by Age by Funding Source in Westport
Out of a total of 832 students who are enrolled in schools in Westport, 138 (16.6%) attend a private institution, while the remaining 694 (83.4%) are enrolled in public schools. The age group of 25 to 34 year olds has the highest likelihood of being enrolled in private schools, with 3 (100.0% in the age bracket) enrolled. Conversely, the age group of 18 to 19 year olds has the lowest likelihood of being enrolled in a private school, with 10 (100.0% in the age bracket) attending a public institution.
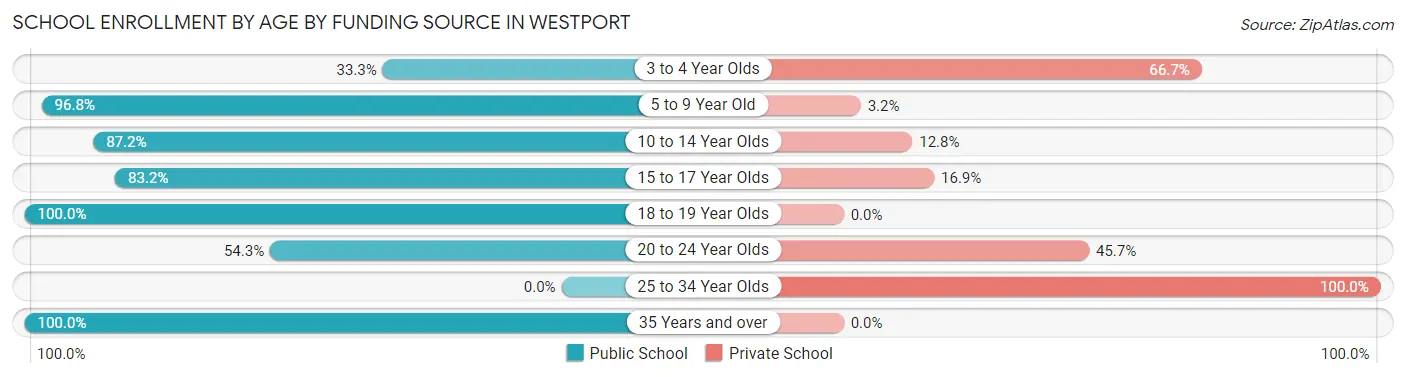
| Age Bracket | Public School | Private School |
| 3 to 4 Year Olds | 21 (33.3%) | 42 (66.7%) |
| 5 to 9 Year Old | 213 (96.8%) | 7 (3.2%) |
| 10 to 14 Year Olds | 266 (87.2%) | 39 (12.8%) |
| 15 to 17 Year Olds | 153 (83.2%) | 31 (16.9%) |
| 18 to 19 Year Olds | 10 (100.0%) | 0 (0.0%) |
| 20 to 24 Year Olds | 19 (54.3%) | 16 (45.7%) |
| 25 to 34 Year Olds | 0 (0.0%) | 3 (100.0%) |
| 35 Years and over | 12 (100.0%) | 0 (0.0%) |
| Total | 694 (83.4%) | 138 (16.6%) |
Educational Attainment by Field of Study in Westport
Business (293 | 18.5%), social sciences (258 | 16.3%), psychology (128 | 8.1%), literature & languages (98 | 6.2%), and engineering (96 | 6.1%) are the most common fields of study among 1,581 individuals in Westport who have obtained a bachelor's degree or higher.
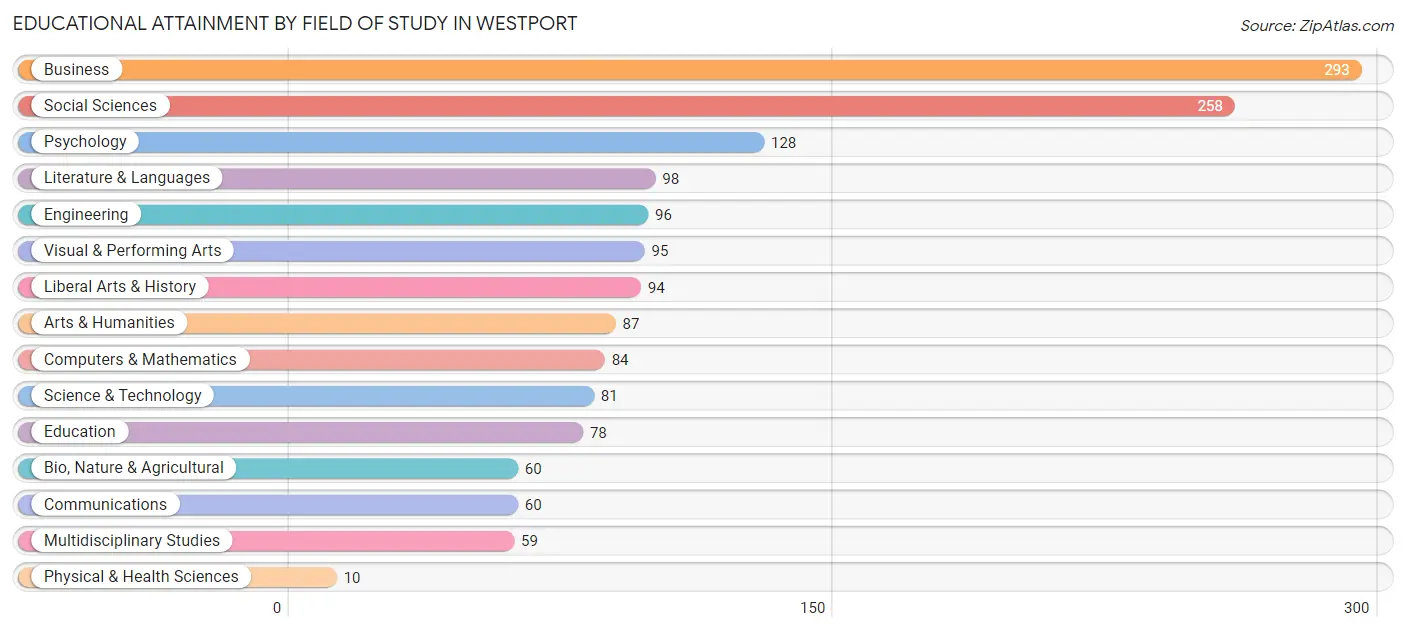
| Field of Study | # Graduates | % Graduates |
| Computers & Mathematics | 84 | 5.3% |
| Bio, Nature & Agricultural | 60 | 3.8% |
| Physical & Health Sciences | 10 | 0.6% |
| Psychology | 128 | 8.1% |
| Social Sciences | 258 | 16.3% |
| Engineering | 96 | 6.1% |
| Multidisciplinary Studies | 59 | 3.7% |
| Science & Technology | 81 | 5.1% |
| Business | 293 | 18.5% |
| Education | 78 | 4.9% |
| Literature & Languages | 98 | 6.2% |
| Liberal Arts & History | 94 | 5.9% |
| Visual & Performing Arts | 95 | 6.0% |
| Communications | 60 | 3.8% |
| Arts & Humanities | 87 | 5.5% |
| Total | 1,581 | 100.0% |
Transportation & Commute in Westport
Vehicle Availability by Sex in Westport
The most prevalent vehicle ownership categories in Westport are males with 2 vehicles (535, accounting for 64.5%) and females with 2 vehicles (280, making up 126.8%).
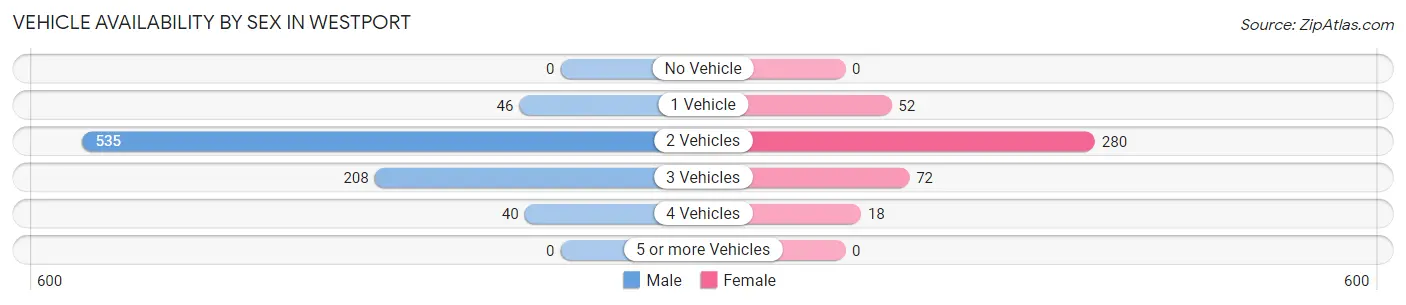
| Vehicles Available | Male | Female |
| No Vehicle | 0 (0.0%) | 0 (0.0%) |
| 1 Vehicle | 46 (5.6%) | 52 (12.3%) |
| 2 Vehicles | 535 (64.5%) | 280 (66.3%) |
| 3 Vehicles | 208 (25.1%) | 72 (17.1%) |
| 4 Vehicles | 40 (4.8%) | 18 (4.3%) |
| 5 or more Vehicles | 0 (0.0%) | 0 (0.0%) |
| Total | 829 (100.0%) | 422 (100.0%) |
Commute Time in Westport
The most frequently occuring commute durations in Westport are 90 or more minutes (153 commuters, 17.1%), 15 to 19 minutes (138 commuters, 15.4%), and 20 to 24 minutes (117 commuters, 13.1%).
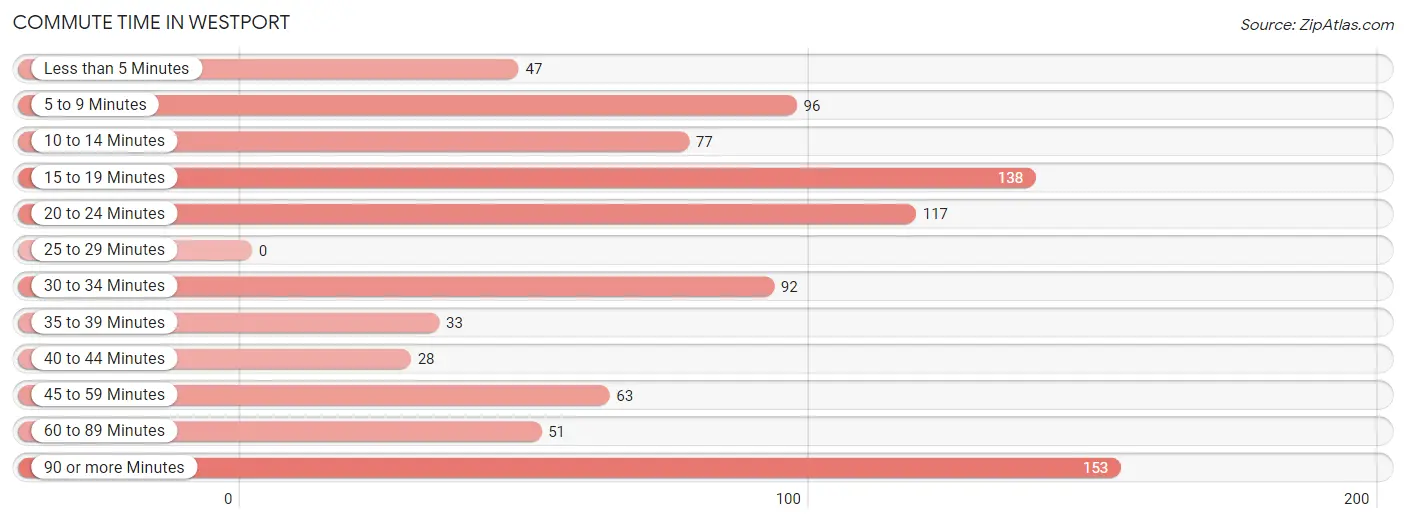
| Commute Time | # Commuters | % Commuters |
| Less than 5 Minutes | 47 | 5.2% |
| 5 to 9 Minutes | 96 | 10.7% |
| 10 to 14 Minutes | 77 | 8.6% |
| 15 to 19 Minutes | 138 | 15.4% |
| 20 to 24 Minutes | 117 | 13.1% |
| 25 to 29 Minutes | 0 | 0.0% |
| 30 to 34 Minutes | 92 | 10.3% |
| 35 to 39 Minutes | 33 | 3.7% |
| 40 to 44 Minutes | 28 | 3.1% |
| 45 to 59 Minutes | 63 | 7.0% |
| 60 to 89 Minutes | 51 | 5.7% |
| 90 or more Minutes | 153 | 17.1% |
Commute Time by Sex in Westport
The most common commute times in Westport are 90 or more minutes (147 commuters, 26.0%) for males and 30 to 34 minutes (78 commuters, 23.6%) for females.
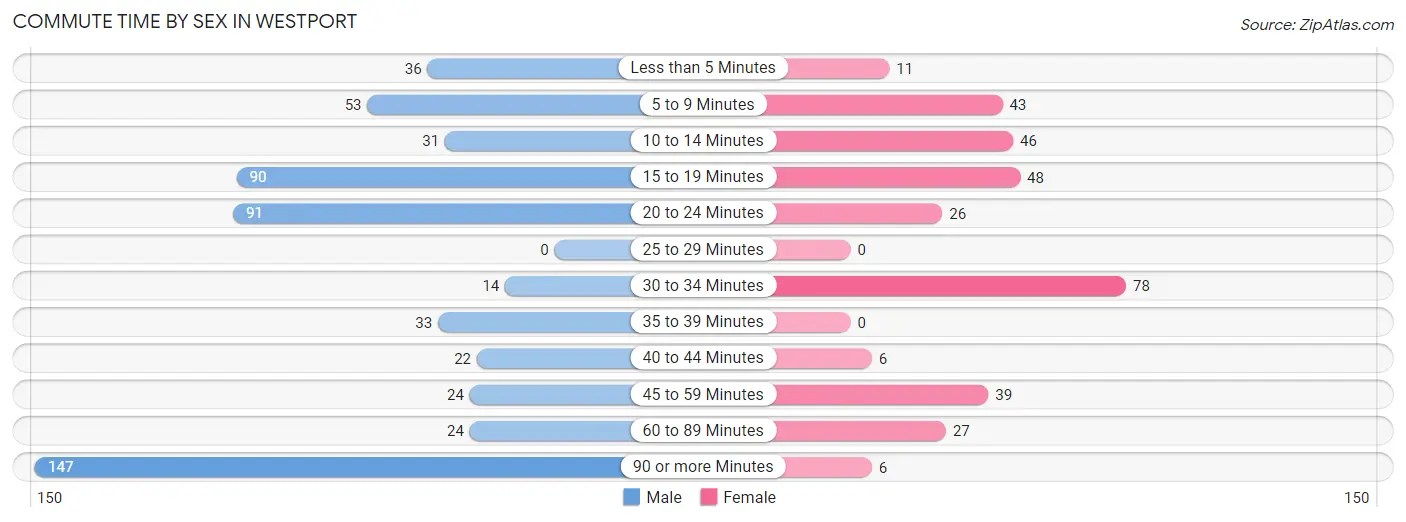
| Commute Time | Male | Female |
| Less than 5 Minutes | 36 (6.4%) | 11 (3.3%) |
| 5 to 9 Minutes | 53 (9.4%) | 43 (13.0%) |
| 10 to 14 Minutes | 31 (5.5%) | 46 (13.9%) |
| 15 to 19 Minutes | 90 (15.9%) | 48 (14.5%) |
| 20 to 24 Minutes | 91 (16.1%) | 26 (7.9%) |
| 25 to 29 Minutes | 0 (0.0%) | 0 (0.0%) |
| 30 to 34 Minutes | 14 (2.5%) | 78 (23.6%) |
| 35 to 39 Minutes | 33 (5.8%) | 0 (0.0%) |
| 40 to 44 Minutes | 22 (3.9%) | 6 (1.8%) |
| 45 to 59 Minutes | 24 (4.3%) | 39 (11.8%) |
| 60 to 89 Minutes | 24 (4.3%) | 27 (8.2%) |
| 90 or more Minutes | 147 (26.0%) | 6 (1.8%) |
Time of Departure to Work by Sex in Westport
The most frequent times of departure to work in Westport are 9:00 AM to 9:59 AM (119, 21.1%) for males and 10:00 AM to 10:59 AM (86, 26.1%) for females.
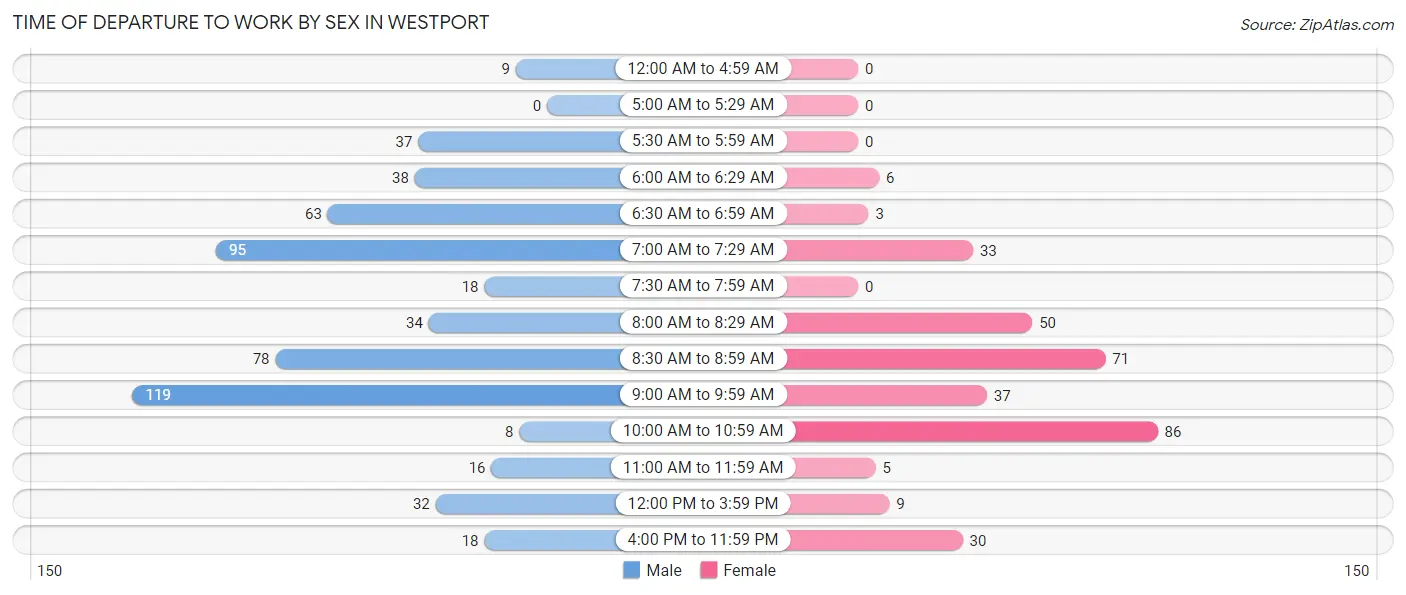
| Time of Departure | Male | Female |
| 12:00 AM to 4:59 AM | 9 (1.6%) | 0 (0.0%) |
| 5:00 AM to 5:29 AM | 0 (0.0%) | 0 (0.0%) |
| 5:30 AM to 5:59 AM | 37 (6.6%) | 0 (0.0%) |
| 6:00 AM to 6:29 AM | 38 (6.7%) | 6 (1.8%) |
| 6:30 AM to 6:59 AM | 63 (11.2%) | 3 (0.9%) |
| 7:00 AM to 7:29 AM | 95 (16.8%) | 33 (10.0%) |
| 7:30 AM to 7:59 AM | 18 (3.2%) | 0 (0.0%) |
| 8:00 AM to 8:29 AM | 34 (6.0%) | 50 (15.1%) |
| 8:30 AM to 8:59 AM | 78 (13.8%) | 71 (21.5%) |
| 9:00 AM to 9:59 AM | 119 (21.1%) | 37 (11.2%) |
| 10:00 AM to 10:59 AM | 8 (1.4%) | 86 (26.1%) |
| 11:00 AM to 11:59 AM | 16 (2.8%) | 5 (1.5%) |
| 12:00 PM to 3:59 PM | 32 (5.7%) | 9 (2.7%) |
| 4:00 PM to 11:59 PM | 18 (3.2%) | 30 (9.1%) |
| Total | 565 (100.0%) | 330 (100.0%) |
Housing Occupancy in Westport
Occupancy by Ownership in Westport
Of the total 976 dwellings in Westport, owner-occupied units account for 831 (85.1%), while renter-occupied units make up 145 (14.9%).
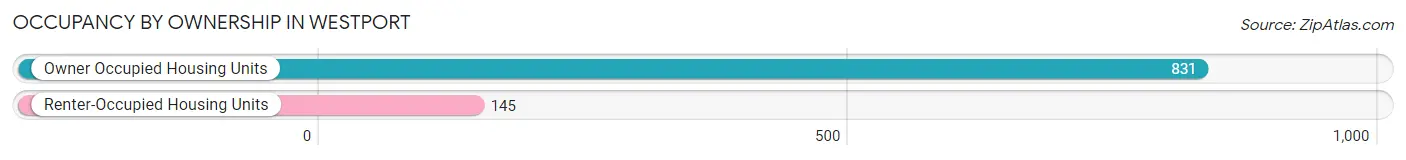
| Occupancy | # Housing Units | % Housing Units |
| Owner Occupied Housing Units | 831 | 85.1% |
| Renter-Occupied Housing Units | 145 | 14.9% |
| Total Occupied Housing Units | 976 | 100.0% |
Occupancy by Household Size in Westport
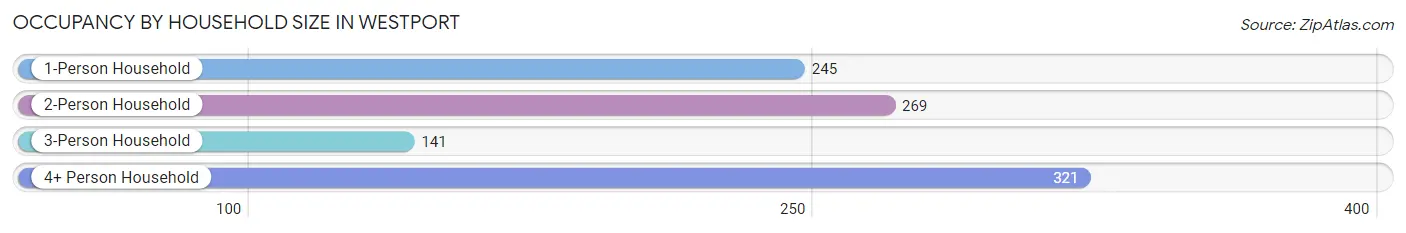
| Household Size | # Housing Units | % Housing Units |
| 1-Person Household | 245 | 25.1% |
| 2-Person Household | 269 | 27.6% |
| 3-Person Household | 141 | 14.4% |
| 4+ Person Household | 321 | 32.9% |
| Total Housing Units | 976 | 100.0% |
Occupancy by Ownership by Household Size in Westport
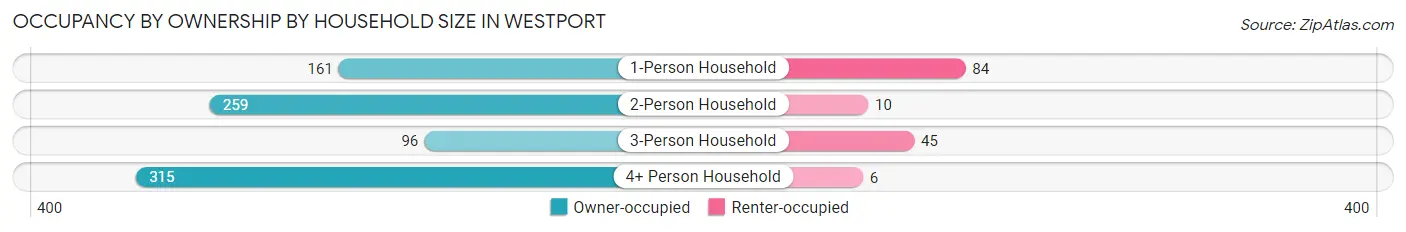
| Household Size | Owner-occupied | Renter-occupied |
| 1-Person Household | 161 (65.7%) | 84 (34.3%) |
| 2-Person Household | 259 (96.3%) | 10 (3.7%) |
| 3-Person Household | 96 (68.1%) | 45 (31.9%) |
| 4+ Person Household | 315 (98.1%) | 6 (1.9%) |
| Total Housing Units | 831 (85.1%) | 145 (14.9%) |
Occupancy by Educational Attainment in Westport
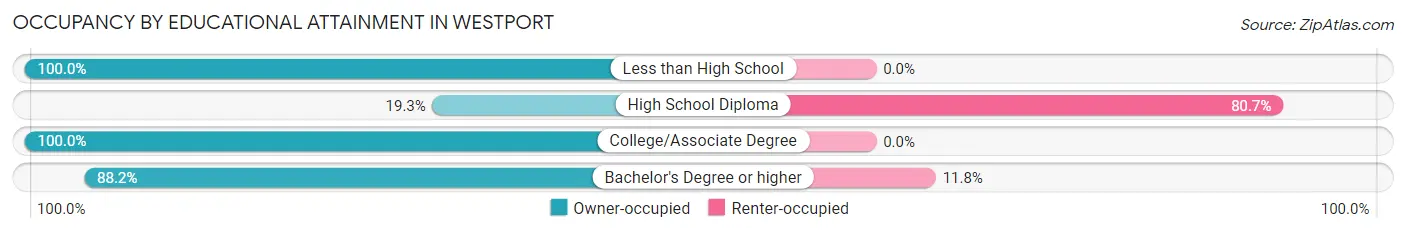
| Household Size | Owner-occupied | Renter-occupied |
| Less than High School | 3 (100.0%) | 0 (0.0%) |
| High School Diploma | 11 (19.3%) | 46 (80.7%) |
| College/Associate Degree | 77 (100.0%) | 0 (0.0%) |
| Bachelor's Degree or higher | 740 (88.2%) | 99 (11.8%) |
Occupancy by Age of Householder in Westport
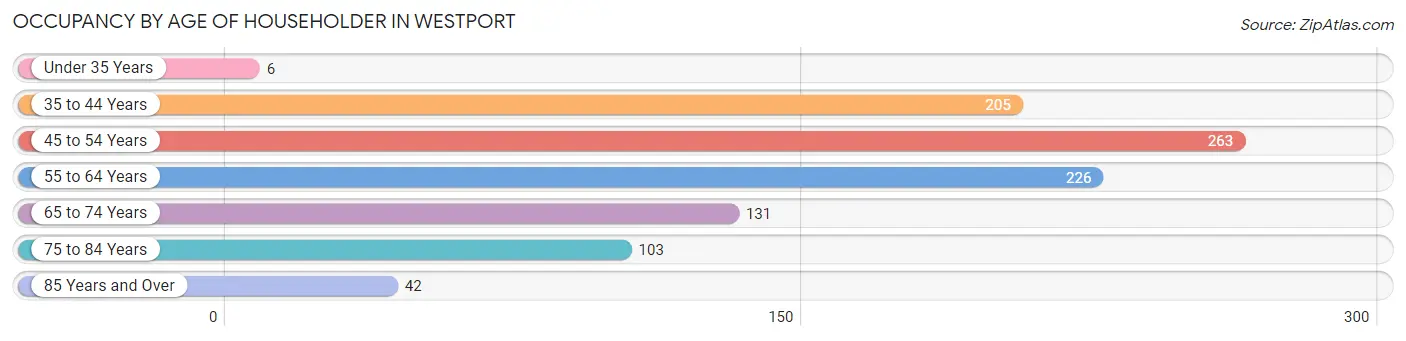
| Age Bracket | # Households | % Households |
| Under 35 Years | 6 | 0.6% |
| 35 to 44 Years | 205 | 21.0% |
| 45 to 54 Years | 263 | 27.0% |
| 55 to 64 Years | 226 | 23.2% |
| 65 to 74 Years | 131 | 13.4% |
| 75 to 84 Years | 103 | 10.5% |
| 85 Years and Over | 42 | 4.3% |
| Total | 976 | 100.0% |
Housing Finances in Westport
Median Income by Occupancy in Westport
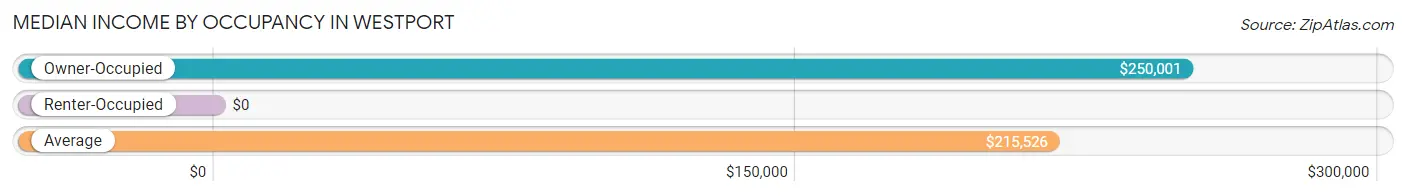
| Occupancy Type | # Households | Median Income |
| Owner-Occupied | 831 (85.1%) | $250,001 |
| Renter-Occupied | 145 (14.9%) | $0 |
| Average | 976 (100.0%) | $215,526 |
Occupancy by Householder Income Bracket in Westport
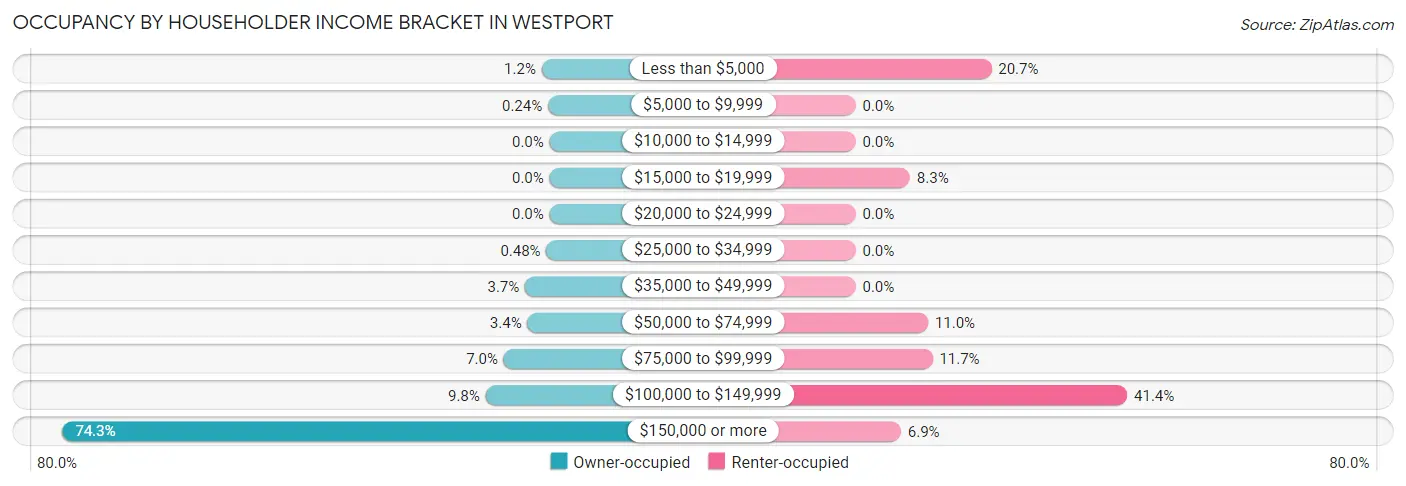
| Income Bracket | Owner-occupied | Renter-occupied |
| Less than $5,000 | 10 (1.2%) | 30 (20.7%) |
| $5,000 to $9,999 | 2 (0.2%) | 0 (0.0%) |
| $10,000 to $14,999 | 0 (0.0%) | 0 (0.0%) |
| $15,000 to $19,999 | 0 (0.0%) | 12 (8.3%) |
| $20,000 to $24,999 | 0 (0.0%) | 0 (0.0%) |
| $25,000 to $34,999 | 4 (0.5%) | 0 (0.0%) |
| $35,000 to $49,999 | 31 (3.7%) | 0 (0.0%) |
| $50,000 to $74,999 | 28 (3.4%) | 16 (11.0%) |
| $75,000 to $99,999 | 58 (7.0%) | 17 (11.7%) |
| $100,000 to $149,999 | 81 (9.8%) | 60 (41.4%) |
| $150,000 or more | 617 (74.3%) | 10 (6.9%) |
| Total | 831 (100.0%) | 145 (100.0%) |
Monthly Housing Cost Tiers in Westport
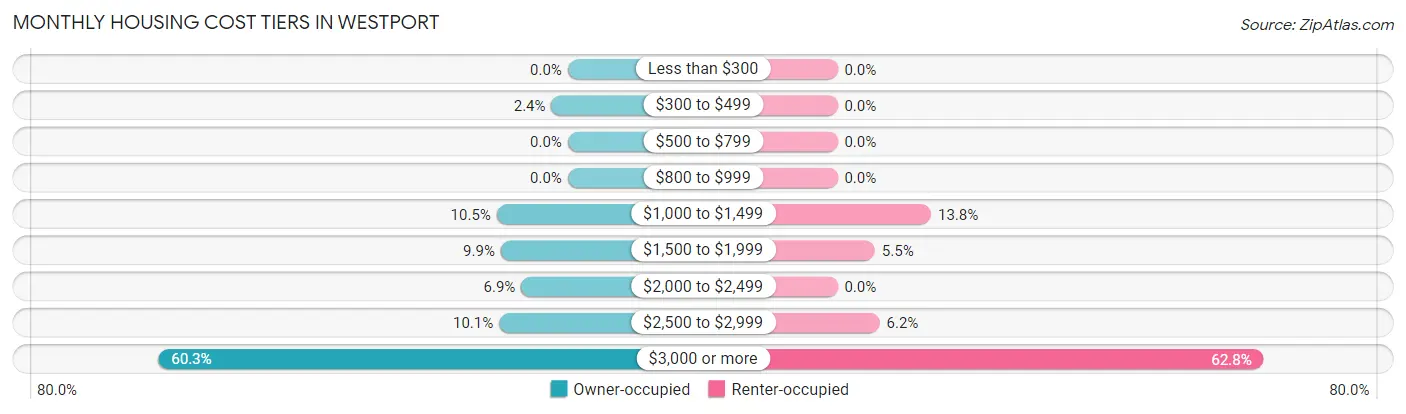
| Monthly Cost | Owner-occupied | Renter-occupied |
| Less than $300 | 0 (0.0%) | 0 (0.0%) |
| $300 to $499 | 20 (2.4%) | 0 (0.0%) |
| $500 to $799 | 0 (0.0%) | 0 (0.0%) |
| $800 to $999 | 0 (0.0%) | 0 (0.0%) |
| $1,000 to $1,499 | 87 (10.5%) | 20 (13.8%) |
| $1,500 to $1,999 | 82 (9.9%) | 8 (5.5%) |
| $2,000 to $2,499 | 57 (6.9%) | 0 (0.0%) |
| $2,500 to $2,999 | 84 (10.1%) | 9 (6.2%) |
| $3,000 or more | 501 (60.3%) | 91 (62.8%) |
| Total | 831 (100.0%) | 145 (100.0%) |
Physical Housing Characteristics in Westport
Housing Structures in Westport
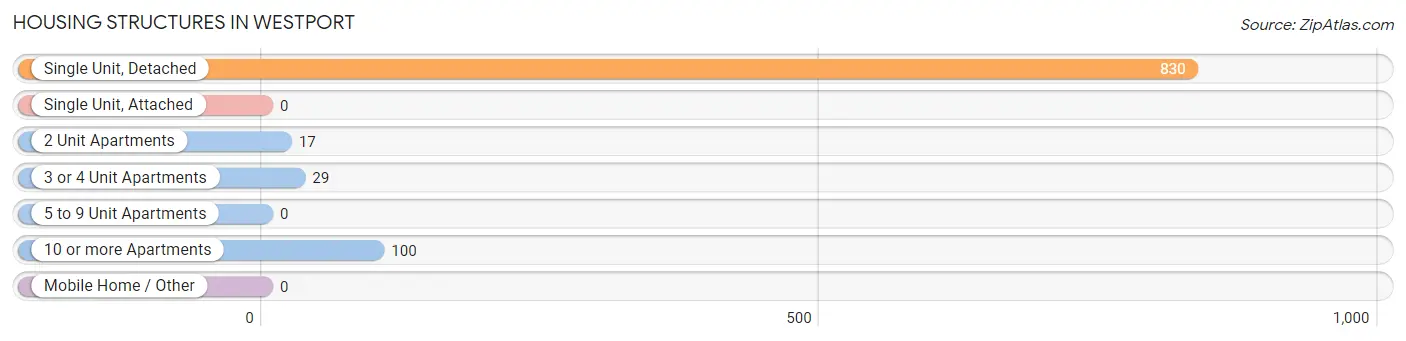
| Structure Type | # Housing Units | % Housing Units |
| Single Unit, Detached | 830 | 85.0% |
| Single Unit, Attached | 0 | 0.0% |
| 2 Unit Apartments | 17 | 1.7% |
| 3 or 4 Unit Apartments | 29 | 3.0% |
| 5 to 9 Unit Apartments | 0 | 0.0% |
| 10 or more Apartments | 100 | 10.2% |
| Mobile Home / Other | 0 | 0.0% |
| Total | 976 | 100.0% |
Housing Structures by Occupancy in Westport
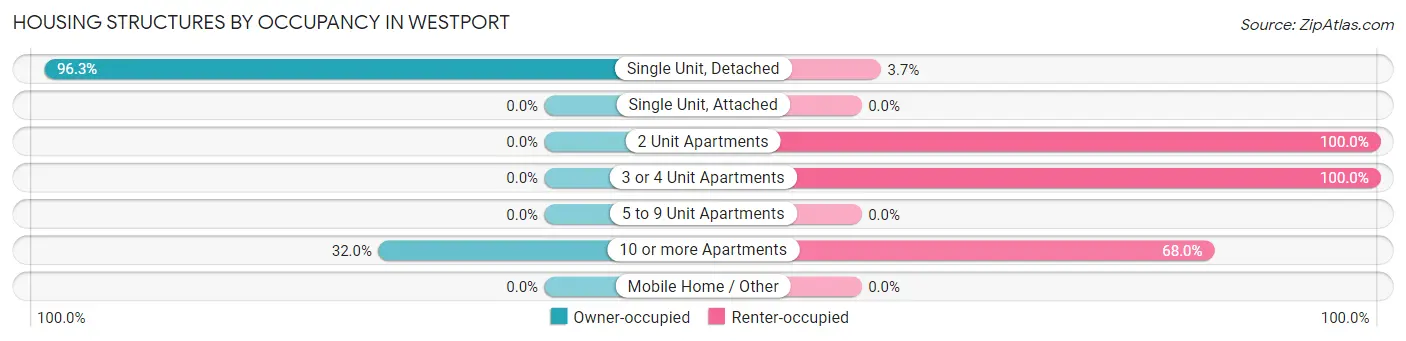
| Structure Type | Owner-occupied | Renter-occupied |
| Single Unit, Detached | 799 (96.3%) | 31 (3.7%) |
| Single Unit, Attached | 0 (0.0%) | 0 (0.0%) |
| 2 Unit Apartments | 0 (0.0%) | 17 (100.0%) |
| 3 or 4 Unit Apartments | 0 (0.0%) | 29 (100.0%) |
| 5 to 9 Unit Apartments | 0 (0.0%) | 0 (0.0%) |
| 10 or more Apartments | 32 (32.0%) | 68 (68.0%) |
| Mobile Home / Other | 0 (0.0%) | 0 (0.0%) |
| Total | 831 (85.1%) | 145 (14.9%) |
Housing Structures by Number of Rooms in Westport
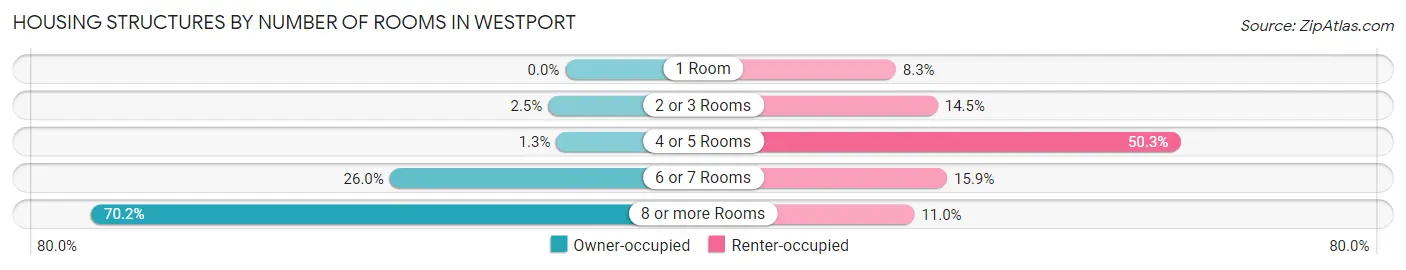
| Number of Rooms | Owner-occupied | Renter-occupied |
| 1 Room | 0 (0.0%) | 12 (8.3%) |
| 2 or 3 Rooms | 21 (2.5%) | 21 (14.5%) |
| 4 or 5 Rooms | 11 (1.3%) | 73 (50.3%) |
| 6 or 7 Rooms | 216 (26.0%) | 23 (15.9%) |
| 8 or more Rooms | 583 (70.2%) | 16 (11.0%) |
| Total | 831 (100.0%) | 145 (100.0%) |
Housing Structure by Heating Type in Westport
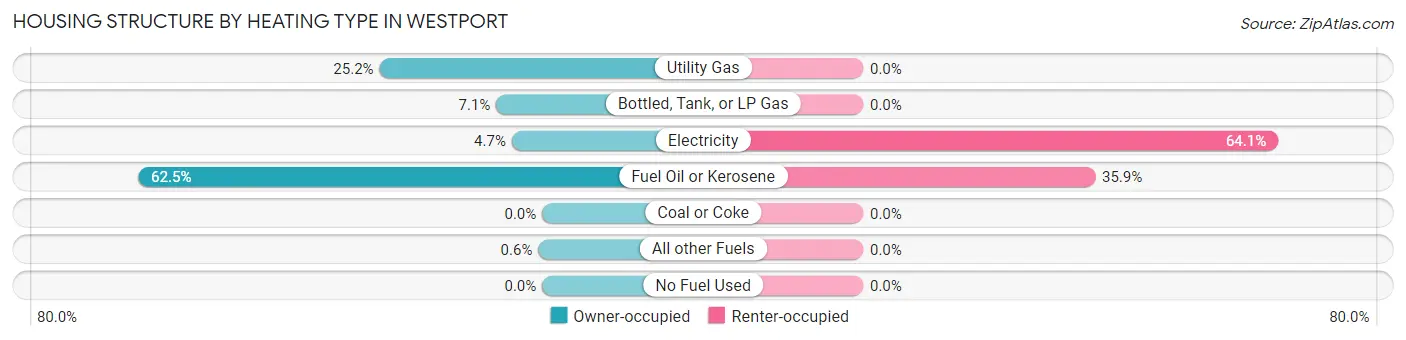
| Heating Type | Owner-occupied | Renter-occupied |
| Utility Gas | 209 (25.2%) | 0 (0.0%) |
| Bottled, Tank, or LP Gas | 59 (7.1%) | 0 (0.0%) |
| Electricity | 39 (4.7%) | 93 (64.1%) |
| Fuel Oil or Kerosene | 519 (62.5%) | 52 (35.9%) |
| Coal or Coke | 0 (0.0%) | 0 (0.0%) |
| All other Fuels | 5 (0.6%) | 0 (0.0%) |
| No Fuel Used | 0 (0.0%) | 0 (0.0%) |
| Total | 831 (100.0%) | 145 (100.0%) |
Household Vehicle Usage in Westport
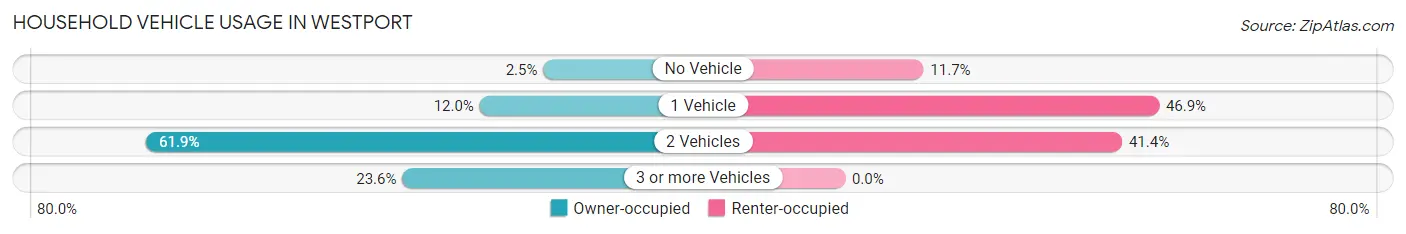
| Vehicles per Household | Owner-occupied | Renter-occupied |
| No Vehicle | 21 (2.5%) | 17 (11.7%) |
| 1 Vehicle | 100 (12.0%) | 68 (46.9%) |
| 2 Vehicles | 514 (61.9%) | 60 (41.4%) |
| 3 or more Vehicles | 196 (23.6%) | 0 (0.0%) |
| Total | 831 (100.0%) | 145 (100.0%) |
Real Estate & Mortgages in Westport
Real Estate and Mortgage Overview in Westport
| Characteristic | Without Mortgage | With Mortgage |
| Housing Units | 306 | 525 |
| Median Property Value | $1,027,800 | $1,281,800 |
| Median Household Income | $194,625 | $426 |
| Monthly Housing Costs | $1,501 | $461 |
| Real Estate Taxes | $10,001 | $0 |
Property Value by Mortgage Status in Westport
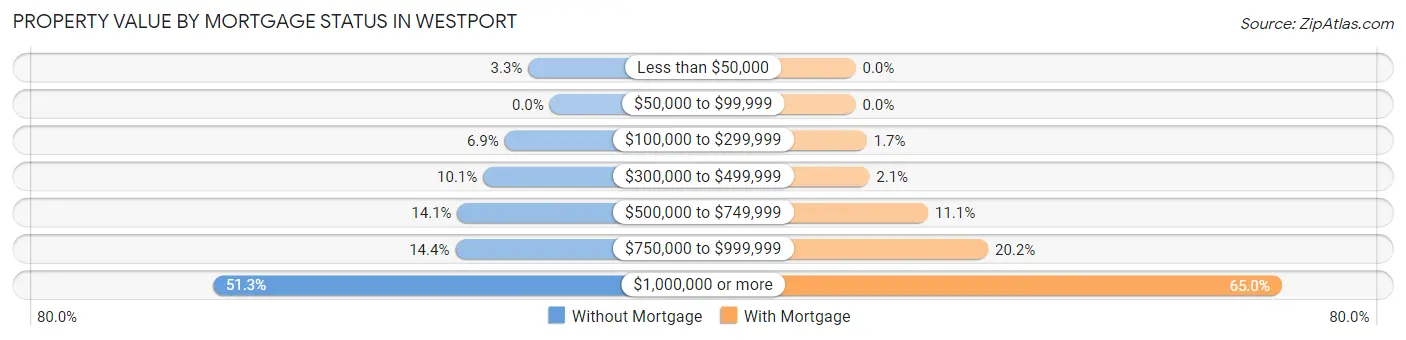
| Property Value | Without Mortgage | With Mortgage |
| Less than $50,000 | 10 (3.3%) | 0 (0.0%) |
| $50,000 to $99,999 | 0 (0.0%) | 0 (0.0%) |
| $100,000 to $299,999 | 21 (6.9%) | 9 (1.7%) |
| $300,000 to $499,999 | 31 (10.1%) | 11 (2.1%) |
| $500,000 to $749,999 | 43 (14.1%) | 58 (11.1%) |
| $750,000 to $999,999 | 44 (14.4%) | 106 (20.2%) |
| $1,000,000 or more | 157 (51.3%) | 341 (64.9%) |
| Total | 306 (100.0%) | 525 (100.0%) |
Household Income by Mortgage Status in Westport
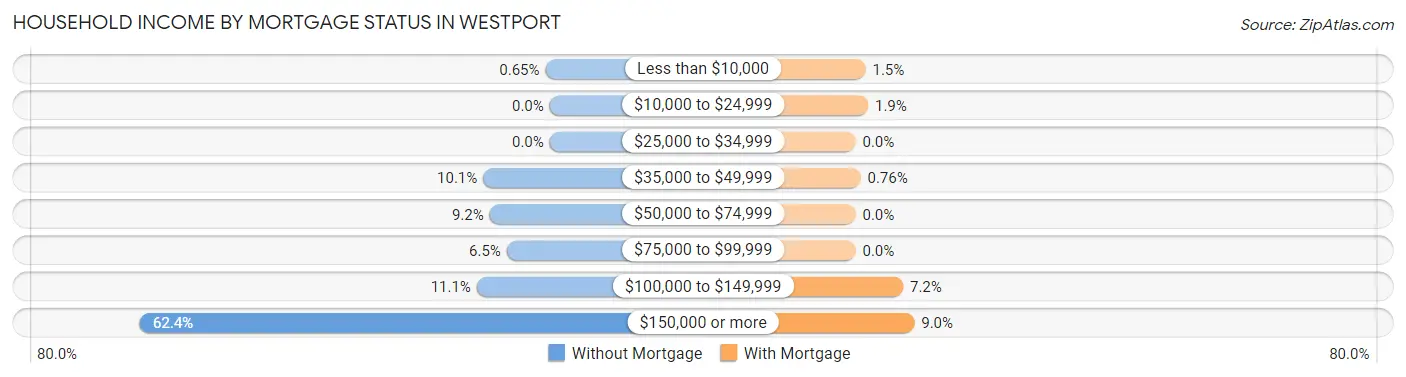
| Household Income | Without Mortgage | With Mortgage |
| Less than $10,000 | 2 (0.6%) | 8 (1.5%) |
| $10,000 to $24,999 | 0 (0.0%) | 10 (1.9%) |
| $25,000 to $34,999 | 0 (0.0%) | 0 (0.0%) |
| $35,000 to $49,999 | 31 (10.1%) | 4 (0.8%) |
| $50,000 to $74,999 | 28 (9.1%) | 0 (0.0%) |
| $75,000 to $99,999 | 20 (6.5%) | 0 (0.0%) |
| $100,000 to $149,999 | 34 (11.1%) | 38 (7.2%) |
| $150,000 or more | 191 (62.4%) | 47 (8.9%) |
| Total | 306 (100.0%) | 525 (100.0%) |
Property Value to Household Income Ratio in Westport
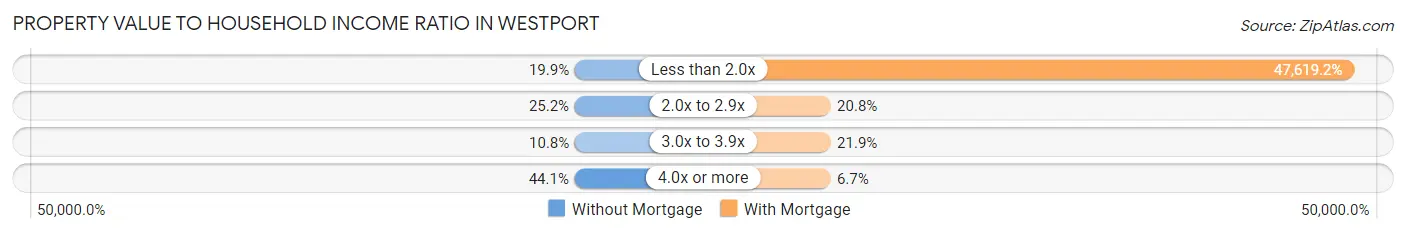
| Value-to-Income Ratio | Without Mortgage | With Mortgage |
| Less than 2.0x | 61 (19.9%) | 250,001 (47,619.2%) |
| 2.0x to 2.9x | 77 (25.2%) | 109 (20.8%) |
| 3.0x to 3.9x | 33 (10.8%) | 115 (21.9%) |
| 4.0x or more | 135 (44.1%) | 35 (6.7%) |
| Total | 306 (100.0%) | 525 (100.0%) |
Real Estate Taxes by Mortgage Status in Westport
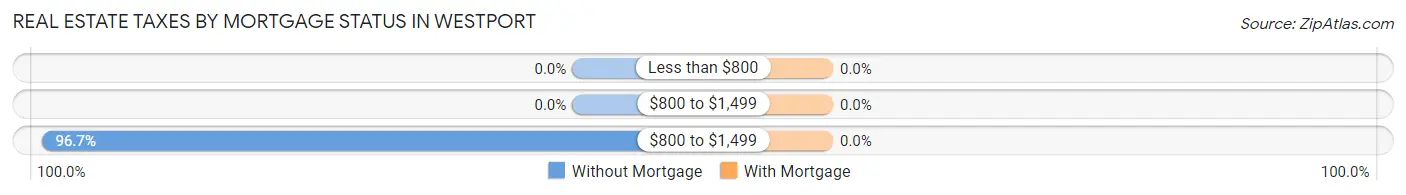
| Property Taxes | Without Mortgage | With Mortgage |
| Less than $800 | 0 (0.0%) | 0 (0.0%) |
| $800 to $1,499 | 0 (0.0%) | 0 (0.0%) |
| $800 to $1,499 | 296 (96.7%) | 0 (0.0%) |
| Total | 306 (100.0%) | 525 (100.0%) |
Health & Disability in Westport
Health Insurance Coverage by Age in Westport
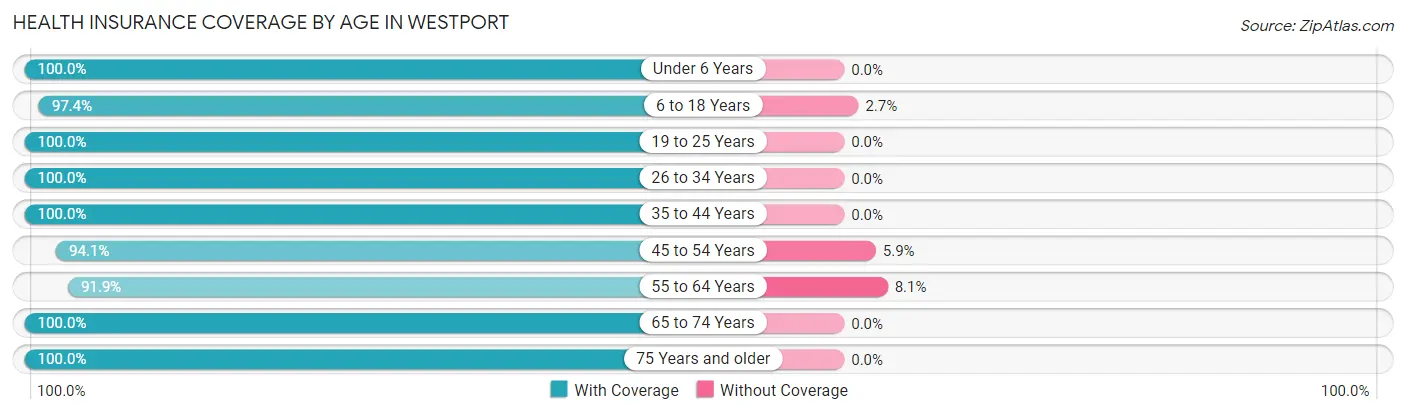
| Age Bracket | With Coverage | Without Coverage |
| Under 6 Years | 166 (100.0%) | 0 (0.0%) |
| 6 to 18 Years | 624 (97.4%) | 17 (2.6%) |
| 19 to 25 Years | 118 (100.0%) | 0 (0.0%) |
| 26 to 34 Years | 130 (100.0%) | 0 (0.0%) |
| 35 to 44 Years | 330 (100.0%) | 0 (0.0%) |
| 45 to 54 Years | 496 (94.1%) | 31 (5.9%) |
| 55 to 64 Years | 352 (91.9%) | 31 (8.1%) |
| 65 to 74 Years | 186 (100.0%) | 0 (0.0%) |
| 75 Years and older | 187 (100.0%) | 0 (0.0%) |
| Total | 2,589 (97.0%) | 79 (3.0%) |
Health Insurance Coverage by Citizenship Status in Westport
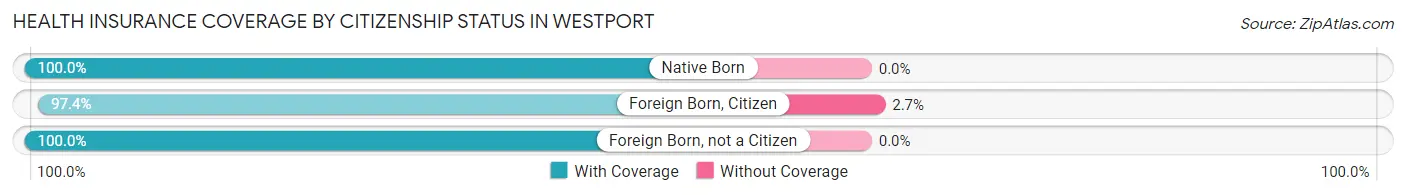
| Citizenship Status | With Coverage | Without Coverage |
| Native Born | 166 (100.0%) | 0 (0.0%) |
| Foreign Born, Citizen | 624 (97.4%) | 17 (2.6%) |
| Foreign Born, not a Citizen | 118 (100.0%) | 0 (0.0%) |
Health Insurance Coverage by Household Income in Westport
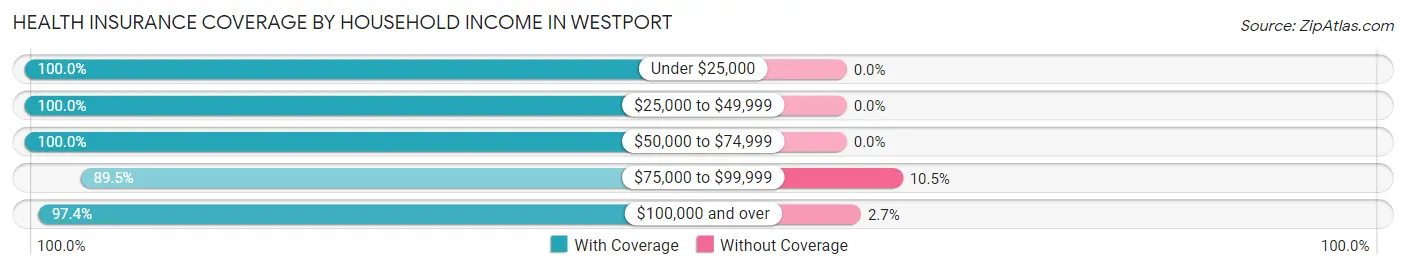
| Household Income | With Coverage | Without Coverage |
| Under $25,000 | 64 (100.0%) | 0 (0.0%) |
| $25,000 to $49,999 | 56 (100.0%) | 0 (0.0%) |
| $50,000 to $74,999 | 53 (100.0%) | 0 (0.0%) |
| $75,000 to $99,999 | 154 (89.5%) | 18 (10.5%) |
| $100,000 and over | 2,243 (97.4%) | 61 (2.6%) |
Public vs Private Health Insurance Coverage by Age in Westport
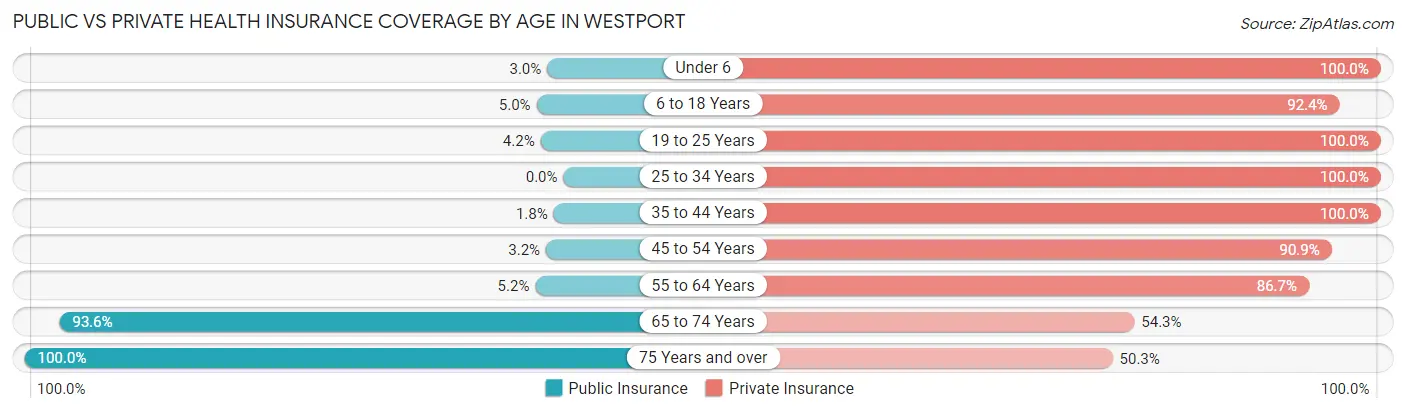
| Age Bracket | Public Insurance | Private Insurance |
| Under 6 | 5 (3.0%) | 166 (100.0%) |
| 6 to 18 Years | 32 (5.0%) | 592 (92.4%) |
| 19 to 25 Years | 5 (4.2%) | 118 (100.0%) |
| 25 to 34 Years | 0 (0.0%) | 130 (100.0%) |
| 35 to 44 Years | 6 (1.8%) | 330 (100.0%) |
| 45 to 54 Years | 17 (3.2%) | 479 (90.9%) |
| 55 to 64 Years | 20 (5.2%) | 332 (86.7%) |
| 65 to 74 Years | 174 (93.5%) | 101 (54.3%) |
| 75 Years and over | 187 (100.0%) | 94 (50.3%) |
| Total | 446 (16.7%) | 2,342 (87.8%) |
Disability Status by Sex by Age in Westport
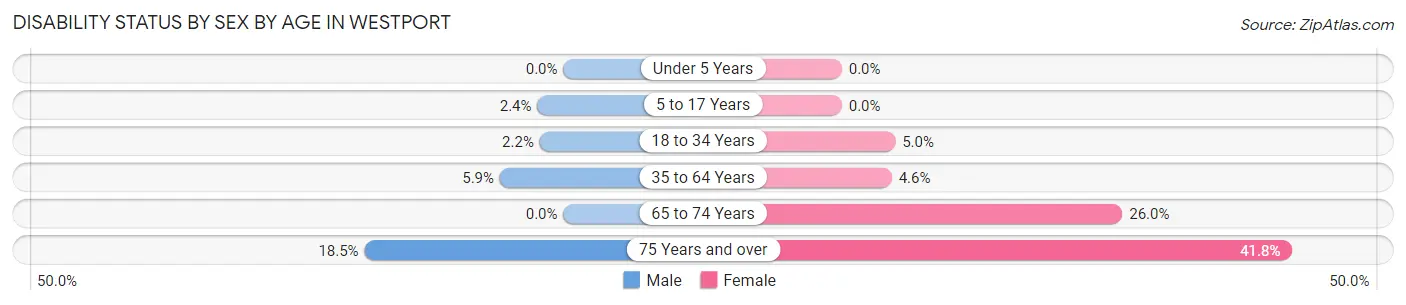
| Age Bracket | Male | Female |
| Under 5 Years | 0 (0.0%) | 0 (0.0%) |
| 5 to 17 Years | 9 (2.4%) | 0 (0.0%) |
| 18 to 34 Years | 3 (2.2%) | 6 (5.0%) |
| 35 to 64 Years | 40 (5.9%) | 26 (4.6%) |
| 65 to 74 Years | 0 (0.0%) | 19 (26.0%) |
| 75 Years and over | 12 (18.5%) | 51 (41.8%) |
Disability Class by Sex by Age in Westport
Disability Class: Hearing Difficulty
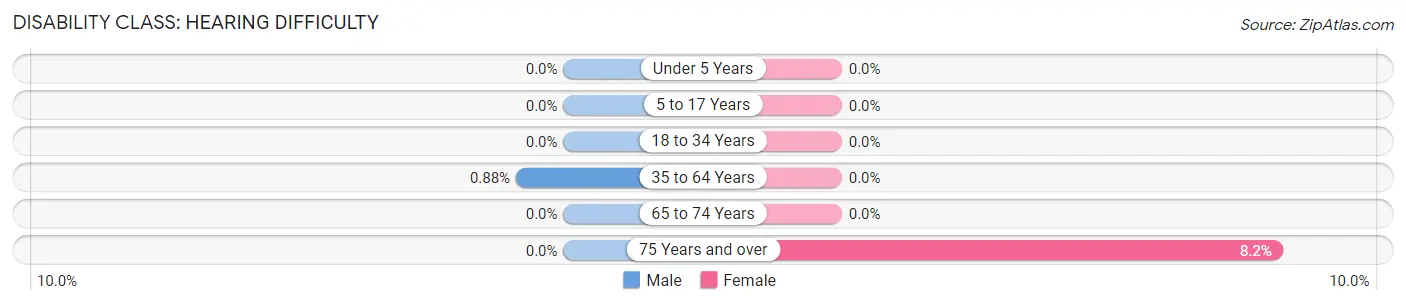
| Age Bracket | Male | Female |
| Under 5 Years | 0 (0.0%) | 0 (0.0%) |
| 5 to 17 Years | 0 (0.0%) | 0 (0.0%) |
| 18 to 34 Years | 0 (0.0%) | 0 (0.0%) |
| 35 to 64 Years | 6 (0.9%) | 0 (0.0%) |
| 65 to 74 Years | 0 (0.0%) | 0 (0.0%) |
| 75 Years and over | 0 (0.0%) | 10 (8.2%) |
Disability Class: Vision Difficulty
| Age Bracket | Male | Female |
| Under 5 Years | 0 (0.0%) | 0 (0.0%) |
| 5 to 17 Years | 0 (0.0%) | 0 (0.0%) |
| 18 to 34 Years | 0 (0.0%) | 0 (0.0%) |
| 35 to 64 Years | 0 (0.0%) | 0 (0.0%) |
| 65 to 74 Years | 0 (0.0%) | 0 (0.0%) |
| 75 Years and over | 0 (0.0%) | 0 (0.0%) |
Disability Class: Cognitive Difficulty
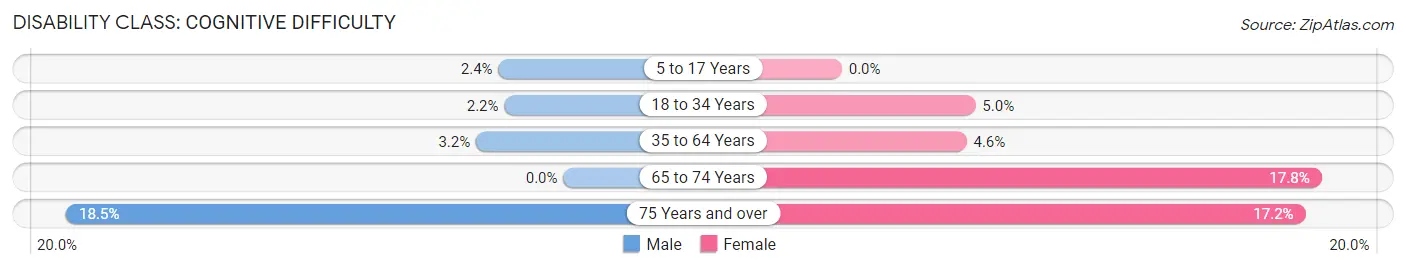
| Age Bracket | Male | Female |
| 5 to 17 Years | 9 (2.4%) | 0 (0.0%) |
| 18 to 34 Years | 3 (2.2%) | 6 (5.0%) |
| 35 to 64 Years | 22 (3.2%) | 26 (4.6%) |
| 65 to 74 Years | 0 (0.0%) | 13 (17.8%) |
| 75 Years and over | 12 (18.5%) | 21 (17.2%) |
Disability Class: Ambulatory Difficulty
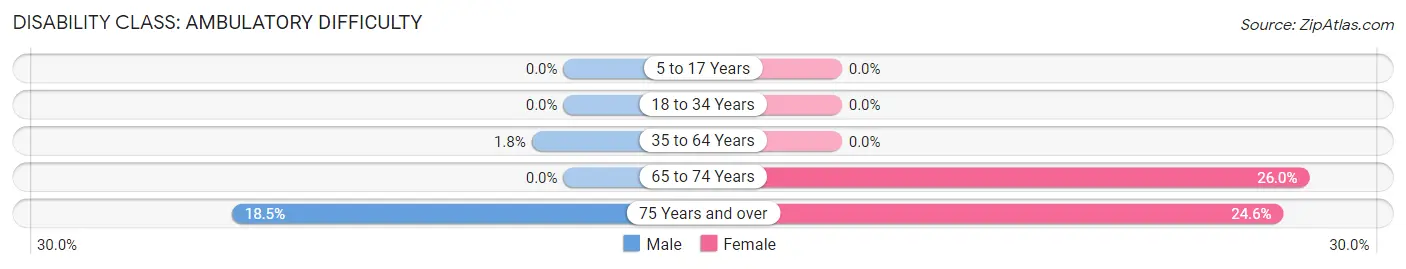
| Age Bracket | Male | Female |
| 5 to 17 Years | 0 (0.0%) | 0 (0.0%) |
| 18 to 34 Years | 0 (0.0%) | 0 (0.0%) |
| 35 to 64 Years | 12 (1.8%) | 0 (0.0%) |
| 65 to 74 Years | 0 (0.0%) | 19 (26.0%) |
| 75 Years and over | 12 (18.5%) | 30 (24.6%) |
Disability Class: Self-Care Difficulty

| Age Bracket | Male | Female |
| 5 to 17 Years | 0 (0.0%) | 0 (0.0%) |
| 18 to 34 Years | 0 (0.0%) | 6 (5.0%) |
| 35 to 64 Years | 0 (0.0%) | 0 (0.0%) |
| 65 to 74 Years | 0 (0.0%) | 0 (0.0%) |
| 75 Years and over | 12 (18.5%) | 21 (17.2%) |
Technology Access in Westport
Computing Device Access in Westport
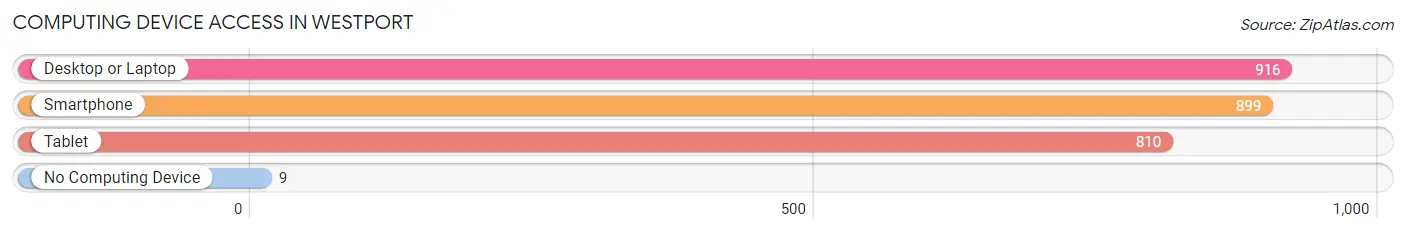
| Device Type | # Households | % Households |
| Desktop or Laptop | 916 | 93.9% |
| Smartphone | 899 | 92.1% |
| Tablet | 810 | 83.0% |
| No Computing Device | 9 | 0.9% |
| Total | 976 | 100.0% |
Internet Access in Westport
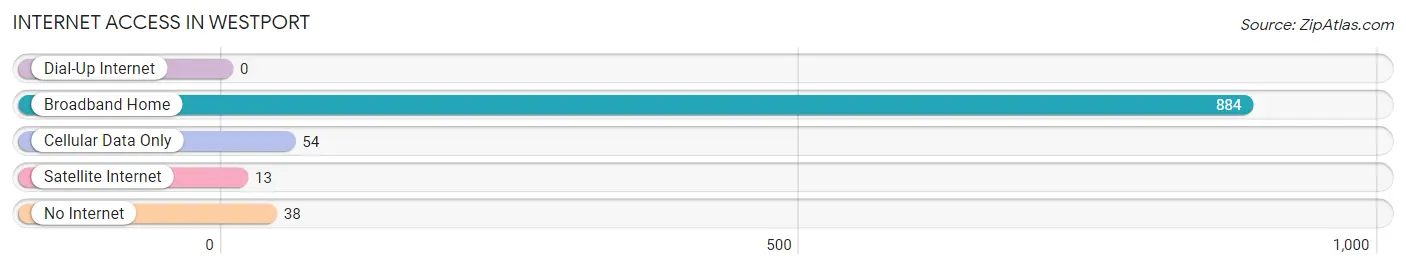
| Internet Type | # Households | % Households |
| Dial-Up Internet | 0 | 0.0% |
| Broadband Home | 884 | 90.6% |
| Cellular Data Only | 54 | 5.5% |
| Satellite Internet | 13 | 1.3% |
| No Internet | 38 | 3.9% |
| Total | 976 | 100.0% |
Westport Summary
Westport, Connecticut is a town located in Fairfield County, Connecticut, United States. It is situated along the Long Island Sound, approximately 50 miles northeast of New York City. The town has a population of approximately 26,000 people and is part of the Greater Bridgeport metropolitan area.
History
Westport was first settled in 1635 by English settlers from Fairfield, Connecticut. The town was originally known as “West Farms” and was part of the town of Fairfield. In 1835, the town was officially incorporated as the Town of Westport.
During the 19th century, Westport was a popular summer resort destination for wealthy New Yorkers. The town was home to several large estates, including the estate of P.T. Barnum, the famous circus showman.
In the 20th century, Westport became a popular commuter town for New York City. The town was also home to several large corporations, including General Electric and Xerox.
Geography
Westport is located in Fairfield County, Connecticut, along the Long Island Sound. The town is bordered by the towns of Weston, Wilton, Norwalk, and Fairfield. The town has a total area of 22.3 square miles, of which 21.2 square miles is land and 1.1 square miles is water.
The town is located in the Saugatuck River Valley, which is a popular recreational area. The town is also home to several parks, including Sherwood Island State Park, Compo Beach Park, and Longshore Park.
Economy
Westport has a strong economy that is largely based on the service industry. The town is home to several large corporations, including General Electric, Xerox, and Pitney Bowes. The town is also home to several financial services firms, including Bridgewater Associates and UBS.
Westport is also home to several retail stores, restaurants, and other businesses. The town is also home to several art galleries, museums, and other cultural attractions.
Demographics
As of the 2010 census, Westport had a population of 26,391 people. The racial makeup of the town was 90.2% White, 2.2% African American, 0.2% Native American, 4.7% Asian, 0.1% Pacific Islander, 1.2% from other races, and 1.5% from two or more races. Hispanic or Latino of any race were 4.9% of the population.
The median income for a household in Westport was $125,865, and the median income for a family was $150,843. The per capita income for the town was $68,945.
Westport is a wealthy town with a high quality of life. The town is home to several large corporations, financial services firms, and other businesses. The town is also home to several parks, museums, and other cultural attractions. Westport is a popular destination for commuters to New York City and is a desirable place to live for many people.
Common Questions
What is Per Capita Income in Westport?
Per Capita income in Westport is $127,477.
What is the Median Family Income in Westport?
Median Family Income in Westport is $250,001.
What is the Median Household income in Westport?
Median Household Income in Westport is $215,526.
What is Income or Wage Gap in Westport?
Income or Wage Gap in Westport is 56.0%.
Women in Westport earn 44.0 cents for every dollar earned by a man.
What is Inequality or Gini Index in Westport?
Inequality or Gini Index in Westport is 0.48.
What is the Total Population of Westport?
Total Population of Westport is 2,668.
What is the Total Male Population of Westport?
Total Male Population of Westport is 1,405.
What is the Total Female Population of Westport?
Total Female Population of Westport is 1,263.
What is the Ratio of Males per 100 Females in Westport?
There are 111.24 Males per 100 Females in Westport.
What is the Ratio of Females per 100 Males in Westport?
There are 89.89 Females per 100 Males in Westport.
What is the Median Population Age in Westport?
Median Population Age in Westport is 44.0 Years.
What is the Average Family Size in Westport
Average Family Size in Westport is 3.3 People.
What is the Average Household Size in Westport
Average Household Size in Westport is 2.7 People.
How Large is the Labor Force in Westport?
There are 1,351 People in the Labor Forcein in Westport.
What is the Percentage of People in the Labor Force in Westport?
67.6% of People are in the Labor Force in Westport.
What is the Unemployment Rate in Westport?
Unemployment Rate in Westport is 6.9%.