Falls Village, CT Map & Demographics
Falls Village Map
Falls Village Overview
$44,892
PER CAPITA INCOME
0.60
INEQUALITY / GINI INDEX
473
TOTAL POPULATION
240
MALE POPULATION
233
FEMALE POPULATION
103.00
MALES / 100 FEMALES
97.08
FEMALES / 100 MALES
43.1
MEDIAN AGE
2.8
AVG FAMILY SIZE
2.5
AVG HOUSEHOLD SIZE
222
LABOR FORCE [ PEOPLE ]
55.0%
PERCENT IN LABOR FORCE
1.4%
UNEMPLOYMENT RATE
Falls Village Zip Codes
Falls Village Area Codes
Income in Falls Village
Income Overview in Falls Village
| Characteristic | Number | Measure |
| Per Capita Income | 473 | $44,892 |
| Median Family Income | 151 | $0 |
| Mean Family Income | 151 | $104,570 |
| Median Household Income | 190 | $0 |
| Mean Household Income | 190 | $99,257 |
| Income Deficit | 151 | $0 |
| Wage / Income Gap (%) | 473 | 0.00% |
| Wage / Income Gap ($) | 473 | 100.00¢ per $1 |
| Gini / Inequality Index | 473 | 0.60 |
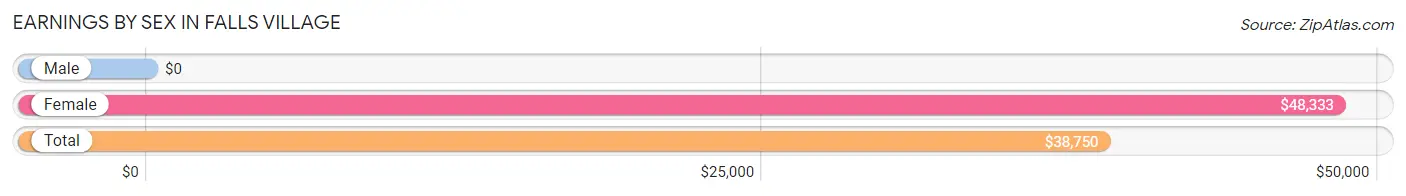
Earnings by Sex in Falls Village
| Sex | Number | Average Earnings |
| Male | 176 (67.7%) | $0 |
| Female | 84 (32.3%) | $48,333 |
| Total | 260 (100.0%) | $38,750 |
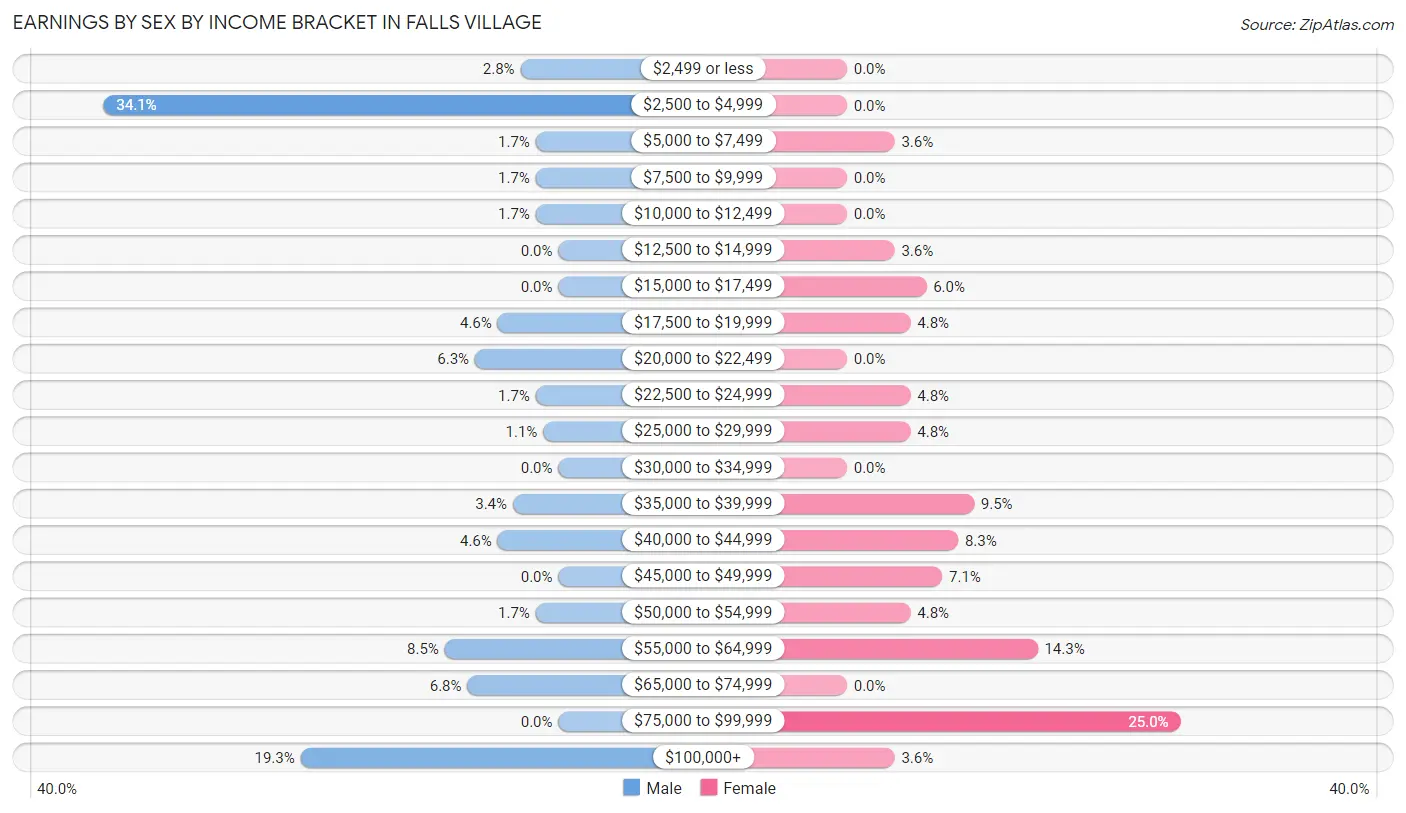
Earnings by Sex by Income Bracket in Falls Village
The most common earnings brackets in Falls Village are $2,500 to $4,999 for men (60 | 34.1%) and $75,000 to $99,999 for women (21 | 25.0%).
| Income | Male | Female |
| $2,499 or less | 5 (2.8%) | 0 (0.0%) |
| $2,500 to $4,999 | 60 (34.1%) | 0 (0.0%) |
| $5,000 to $7,499 | 3 (1.7%) | 3 (3.6%) |
| $7,500 to $9,999 | 3 (1.7%) | 0 (0.0%) |
| $10,000 to $12,499 | 3 (1.7%) | 0 (0.0%) |
| $12,500 to $14,999 | 0 (0.0%) | 3 (3.6%) |
| $15,000 to $17,499 | 0 (0.0%) | 5 (5.9%) |
| $17,500 to $19,999 | 8 (4.5%) | 4 (4.8%) |
| $20,000 to $22,499 | 11 (6.2%) | 0 (0.0%) |
| $22,500 to $24,999 | 3 (1.7%) | 4 (4.8%) |
| $25,000 to $29,999 | 2 (1.1%) | 4 (4.8%) |
| $30,000 to $34,999 | 0 (0.0%) | 0 (0.0%) |
| $35,000 to $39,999 | 6 (3.4%) | 8 (9.5%) |
| $40,000 to $44,999 | 8 (4.5%) | 7 (8.3%) |
| $45,000 to $49,999 | 0 (0.0%) | 6 (7.1%) |
| $50,000 to $54,999 | 3 (1.7%) | 4 (4.8%) |
| $55,000 to $64,999 | 15 (8.5%) | 12 (14.3%) |
| $65,000 to $74,999 | 12 (6.8%) | 0 (0.0%) |
| $75,000 to $99,999 | 0 (0.0%) | 21 (25.0%) |
| $100,000+ | 34 (19.3%) | 3 (3.6%) |
| Total | 176 (100.0%) | 84 (100.0%) |
Earnings by Sex by Educational Attainment in Falls Village
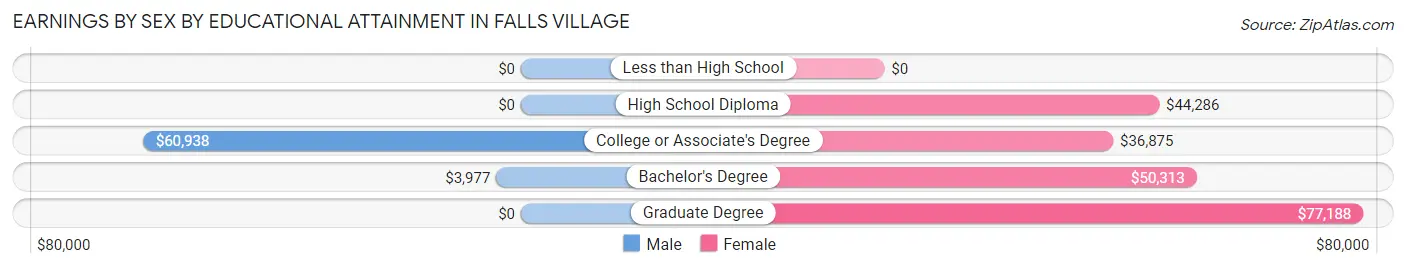
| Educational Attainment | Male Income | Female Income |
| Less than High School | - | - |
| High School Diploma | - | - |
| College or Associate's Degree | $60,938 | $36,875 |
| Bachelor's Degree | $3,977 | $50,313 |
| Graduate Degree | - | - |
| Total | - | - |
Family Income in Falls Village
Family Income Brackets in Falls Village
According to the Falls Village family income data, there are 55 families falling into the less than $10,000 income range, which is the most common income bracket and makes up 36.4% of all families.
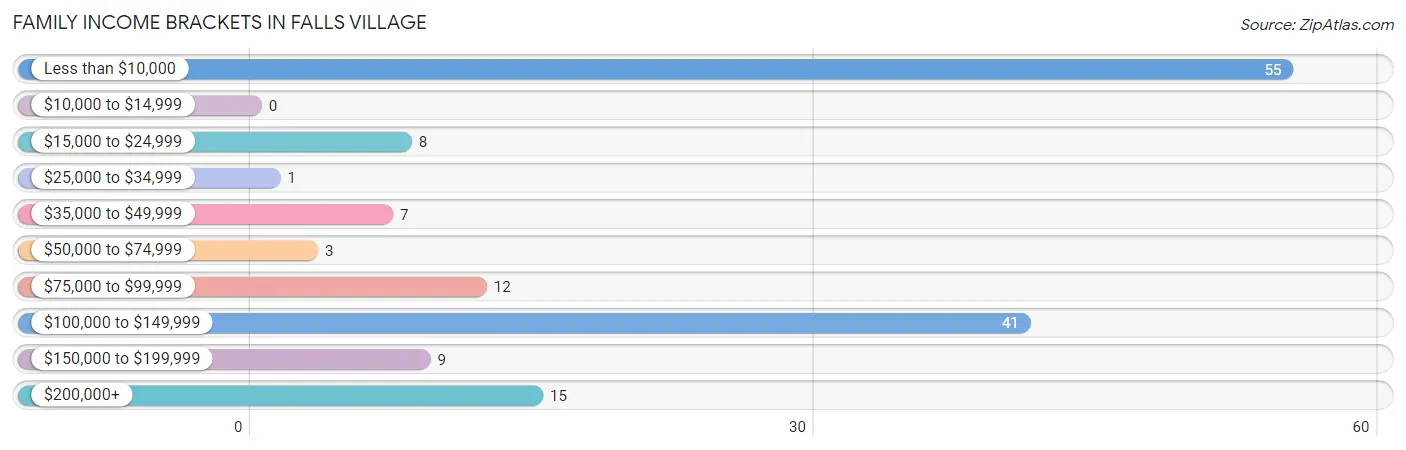
| Income Bracket | # Families | % Families |
| Less than $10,000 | 55 | 36.4% |
| $10,000 to $14,999 | 0 | 0.0% |
| $15,000 to $24,999 | 8 | 5.3% |
| $25,000 to $34,999 | 1 | 0.7% |
| $35,000 to $49,999 | 7 | 4.6% |
| $50,000 to $74,999 | 3 | 2.0% |
| $75,000 to $99,999 | 12 | 7.9% |
| $100,000 to $149,999 | 41 | 27.2% |
| $150,000 to $199,999 | 9 | 6.0% |
| $200,000+ | 15 | 9.9% |
Family Income by Famaliy Size in Falls Village
2-person families (42 | 27.8%) account for the highest median family income in Falls Village with $120,833 per family, while 2-person families (42 | 27.8%) have the highest median income of $60,416 per family member.
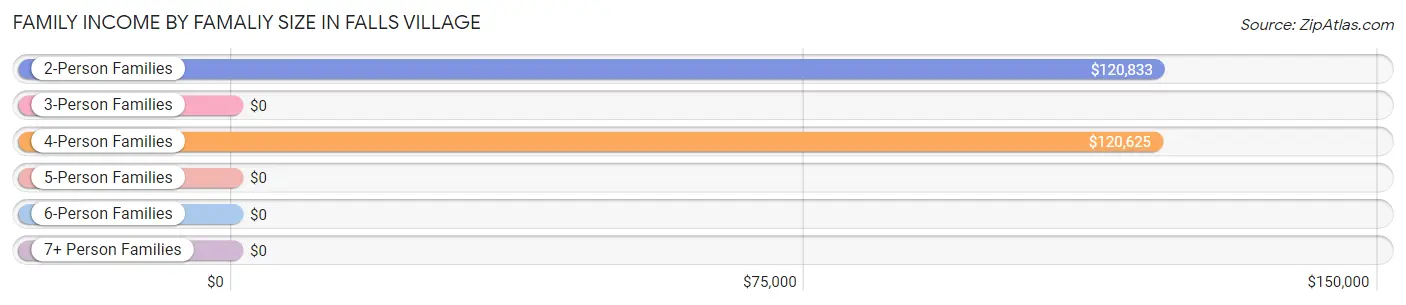
| Income Bracket | # Families | Median Income |
| 2-Person Families | 42 (27.8%) | $120,833 |
| 3-Person Families | 91 (60.3%) | $0 |
| 4-Person Families | 18 (11.9%) | $120,625 |
| 5-Person Families | 0 (0.0%) | $0 |
| 6-Person Families | 0 (0.0%) | $0 |
| 7+ Person Families | 0 (0.0%) | $0 |
| Total | 151 (100.0%) | $0 |
Family Income by Number of Earners in Falls Village
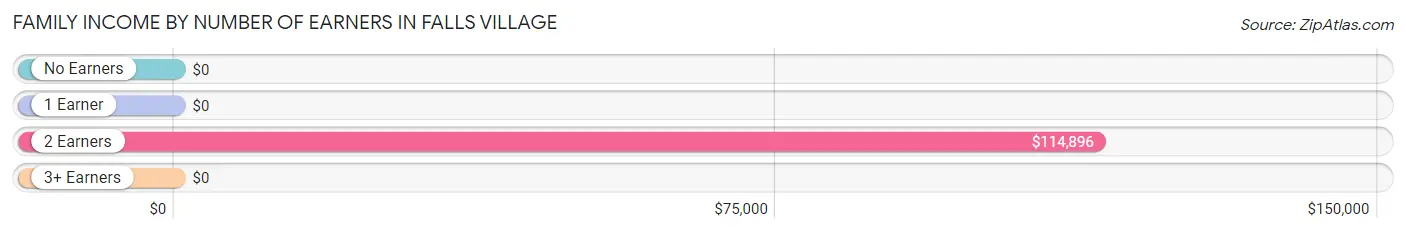
| Number of Earners | # Families | Median Income |
| No Earners | 6 (4.0%) | $0 |
| 1 Earner | 93 (61.6%) | $0 |
| 2 Earners | 45 (29.8%) | $114,896 |
| 3+ Earners | 7 (4.6%) | $0 |
| Total | 151 (100.0%) | $0 |
Household Income in Falls Village
Household Income Brackets in Falls Village
With 55 households falling in the category, the less than $10,000 income range is the most frequent in Falls Village, accounting for 28.9% of all households.
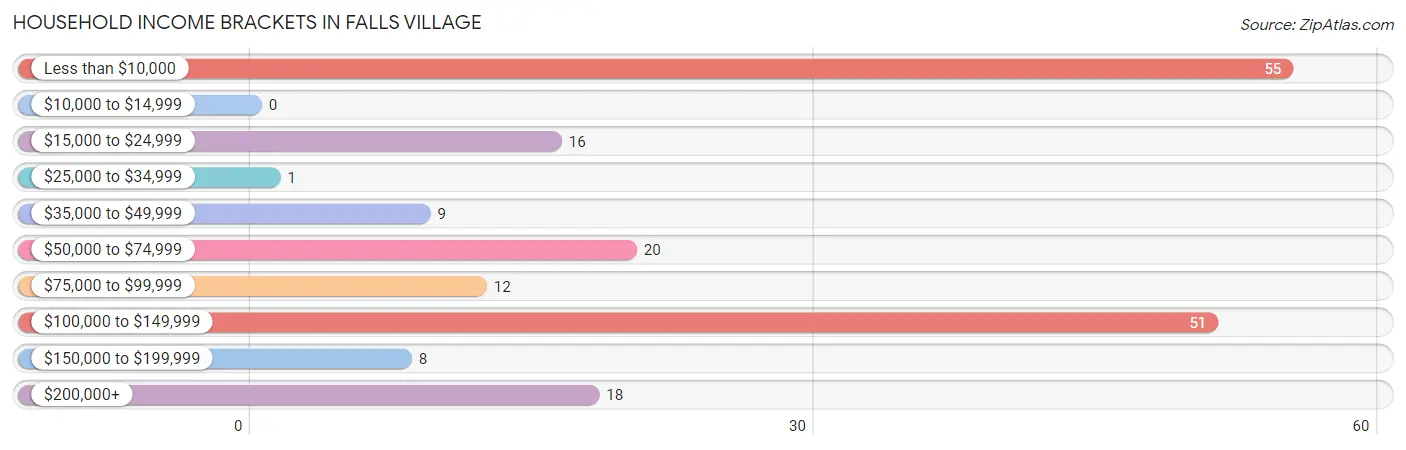
| Income Bracket | # Households | % Households |
| Less than $10,000 | 55 | 28.9% |
| $10,000 to $14,999 | 0 | 0.0% |
| $15,000 to $24,999 | 16 | 8.4% |
| $25,000 to $34,999 | 1 | 0.5% |
| $35,000 to $49,999 | 9 | 4.7% |
| $50,000 to $74,999 | 20 | 10.5% |
| $75,000 to $99,999 | 12 | 6.3% |
| $100,000 to $149,999 | 51 | 26.8% |
| $150,000 to $199,999 | 8 | 4.2% |
| $200,000+ | 18 | 9.5% |
Household Income by Householder Age in Falls Village
The median household income in Falls Village is $0, with the highest median household income of $113,125 found in the 25 to 44 years age bracket for the primary householder. A total of 52 households (27.4%) fall into this category.
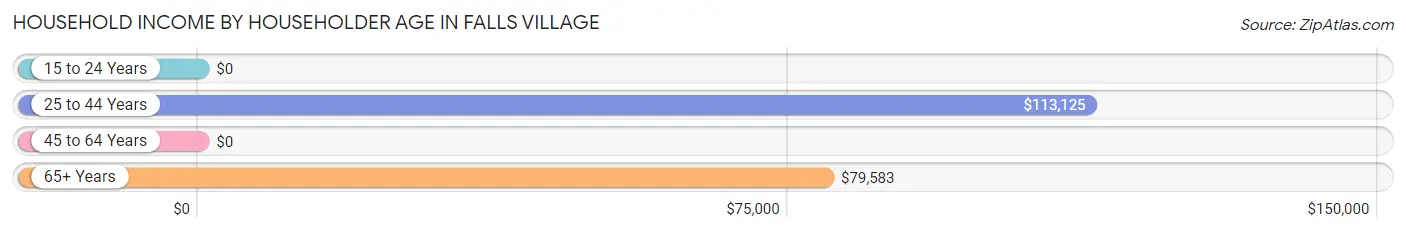
| Income Bracket | # Households | Median Income |
| 15 to 24 Years | 0 (0.0%) | $0 |
| 25 to 44 Years | 52 (27.4%) | $113,125 |
| 45 to 64 Years | 95 (50.0%) | $0 |
| 65+ Years | 43 (22.6%) | $79,583 |
| Total | 190 (100.0%) | $0 |
Poverty in Falls Village
Income Below Poverty by Sex and Age in Falls Village
With 24.6% poverty level for males and 41.6% for females among the residents of Falls Village, 55 to 64 year old males and 5 year old females are the most vulnerable to poverty, with 55 males (72.4%) and 3 females (100.0%) in their respective age groups living below the poverty level.
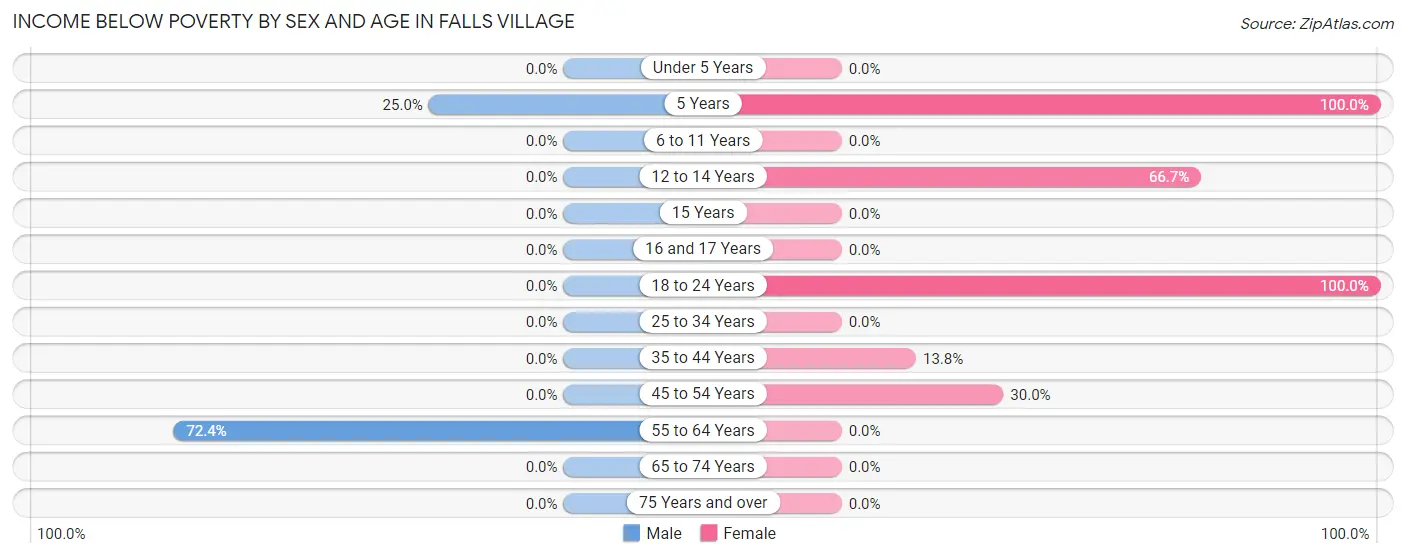
| Age Bracket | Male | Female |
| Under 5 Years | 0 (0.0%) | 0 (0.0%) |
| 5 Years | 4 (25.0%) | 3 (100.0%) |
| 6 to 11 Years | 0 (0.0%) | 0 (0.0%) |
| 12 to 14 Years | 0 (0.0%) | 6 (66.7%) |
| 15 Years | 0 (0.0%) | 0 (0.0%) |
| 16 and 17 Years | 0 (0.0%) | 0 (0.0%) |
| 18 to 24 Years | 0 (0.0%) | 81 (100.0%) |
| 25 to 34 Years | 0 (0.0%) | 0 (0.0%) |
| 35 to 44 Years | 0 (0.0%) | 4 (13.8%) |
| 45 to 54 Years | 0 (0.0%) | 3 (30.0%) |
| 55 to 64 Years | 55 (72.4%) | 0 (0.0%) |
| 65 to 74 Years | 0 (0.0%) | 0 (0.0%) |
| 75 Years and over | 0 (0.0%) | 0 (0.0%) |
| Total | 59 (24.6%) | 97 (41.6%) |
Income Above Poverty by Sex and Age in Falls Village
According to the poverty statistics in Falls Village, males aged under 5 years and females aged under 5 years are the age groups that are most secure financially, with 100.0% of males and 100.0% of females in these age groups living above the poverty line.
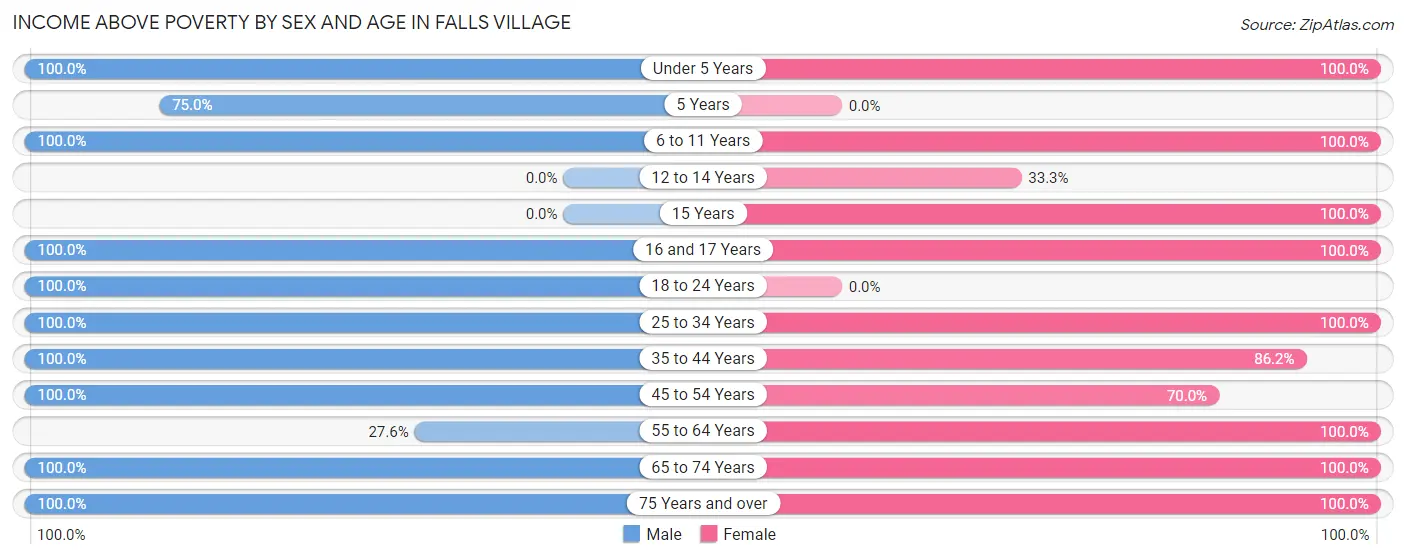
| Age Bracket | Male | Female |
| Under 5 Years | 13 (100.0%) | 4 (100.0%) |
| 5 Years | 12 (75.0%) | 0 (0.0%) |
| 6 to 11 Years | 9 (100.0%) | 12 (100.0%) |
| 12 to 14 Years | 0 (0.0%) | 3 (33.3%) |
| 15 Years | 0 (0.0%) | 3 (100.0%) |
| 16 and 17 Years | 4 (100.0%) | 4 (100.0%) |
| 18 to 24 Years | 8 (100.0%) | 0 (0.0%) |
| 25 to 34 Years | 30 (100.0%) | 13 (100.0%) |
| 35 to 44 Years | 31 (100.0%) | 25 (86.2%) |
| 45 to 54 Years | 13 (100.0%) | 7 (70.0%) |
| 55 to 64 Years | 21 (27.6%) | 36 (100.0%) |
| 65 to 74 Years | 23 (100.0%) | 23 (100.0%) |
| 75 Years and over | 17 (100.0%) | 6 (100.0%) |
| Total | 181 (75.4%) | 136 (58.4%) |
Income Below Poverty Among Married-Couple Families in Falls Village
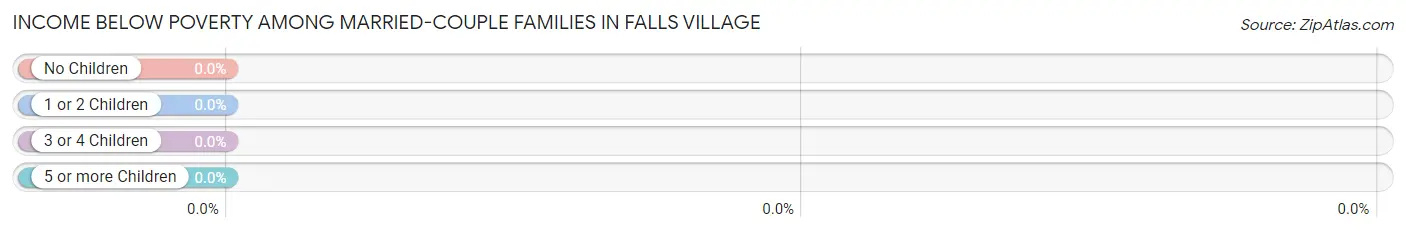
| Children | Above Poverty | Below Poverty |
| No Children | 46 (100.0%) | 0 (0.0%) |
| 1 or 2 Children | 27 (100.0%) | 0 (0.0%) |
| 3 or 4 Children | 0 (0.0%) | 0 (0.0%) |
| 5 or more Children | 0 (0.0%) | 0 (0.0%) |
| Total | 73 (100.0%) | 0 (0.0%) |
Income Below Poverty Among Single-Parent Households in Falls Village
According to the poverty data in Falls Village, 88.7% or 55 single-father households and 43.8% or 7 single-mother households are living below the poverty line. Among single-father households, those with no children have the highest poverty rate, with 55 households (93.2%) experiencing poverty. Likewise, among single-mother households, those with 1 or 2 children have the highest poverty rate, with 7 households (58.3%) falling below the poverty line.
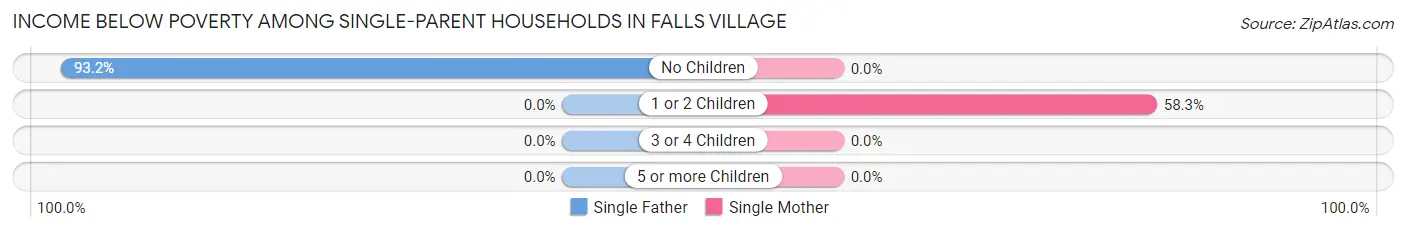
| Children | Single Father | Single Mother |
| No Children | 55 (93.2%) | 0 (0.0%) |
| 1 or 2 Children | 0 (0.0%) | 7 (58.3%) |
| 3 or 4 Children | 0 (0.0%) | 0 (0.0%) |
| 5 or more Children | 0 (0.0%) | 0 (0.0%) |
| Total | 55 (88.7%) | 7 (43.8%) |
Income Below Poverty Among Married-Couple vs Single-Parent Households in Falls Village
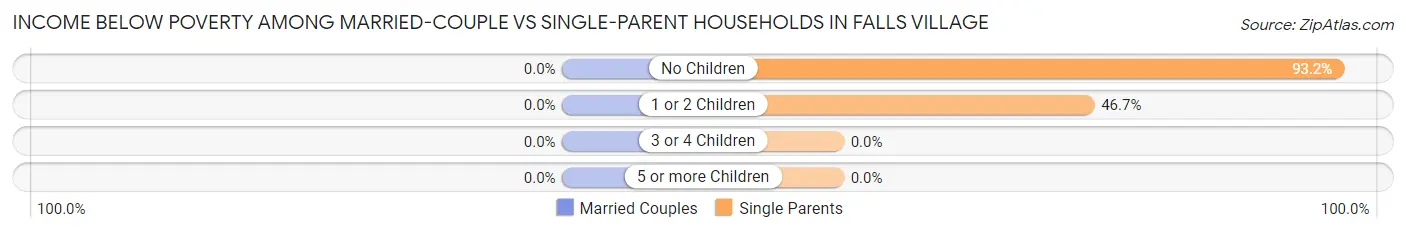
| Children | Married-Couple Families | Single-Parent Households |
| No Children | 0 (0.0%) | 55 (93.2%) |
| 1 or 2 Children | 0 (0.0%) | 7 (46.7%) |
| 3 or 4 Children | 0 (0.0%) | 0 (0.0%) |
| 5 or more Children | 0 (0.0%) | 0 (0.0%) |
| Total | 0 (0.0%) | 62 (79.5%) |
Race in Falls Village
The most populous races in Falls Village are White / Caucasian (446 | 94.3%), Two or more Races (27 | 5.7%), and Hispanic or Latino (14 | 3.0%).
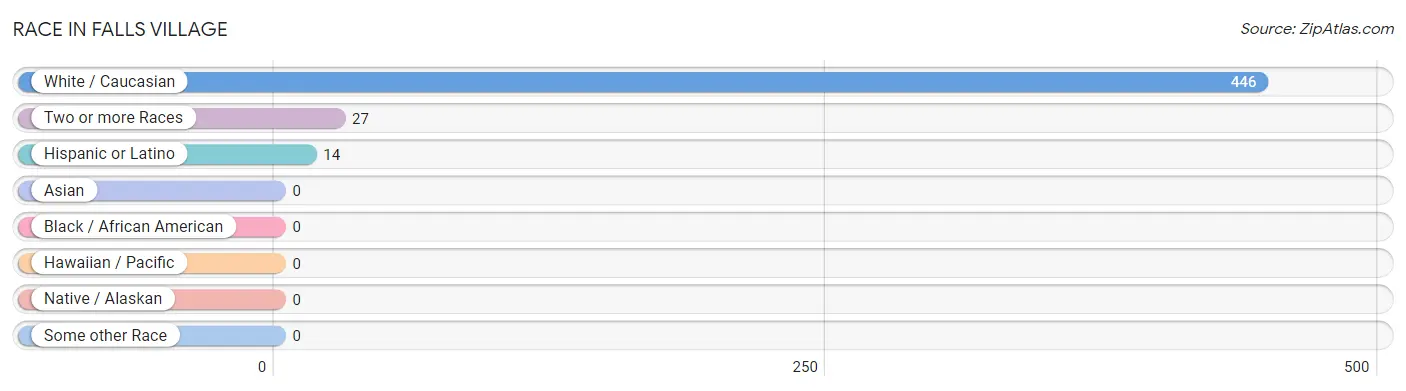
| Race | # Population | % Population |
| Asian | 0 | 0.0% |
| Black / African American | 0 | 0.0% |
| Hawaiian / Pacific | 0 | 0.0% |
| Hispanic or Latino | 14 | 3.0% |
| Native / Alaskan | 0 | 0.0% |
| White / Caucasian | 446 | 94.3% |
| Two or more Races | 27 | 5.7% |
| Some other Race | 0 | 0.0% |
| Total | 473 | 100.0% |
Ancestry in Falls Village
The most populous ancestries reported in Falls Village are European (139 | 29.4%), Italian (115 | 24.3%), English (82 | 17.3%), German (81 | 17.1%), and Irish (58 | 12.3%), together accounting for 100.4% of all Falls Village residents.
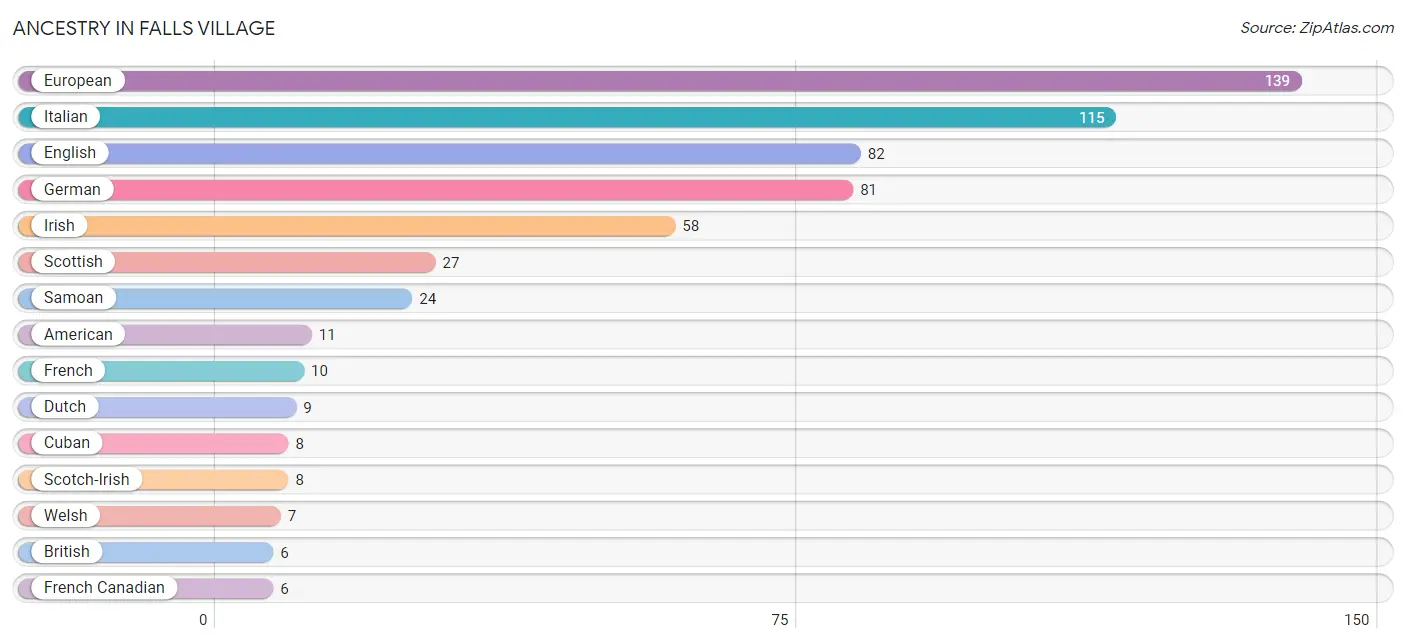
| Ancestry | # Population | % Population |
| American | 11 | 2.3% |
| Arab | 3 | 0.6% |
| British | 6 | 1.3% |
| Cuban | 8 | 1.7% |
| Czech | 2 | 0.4% |
| Danish | 2 | 0.4% |
| Dutch | 9 | 1.9% |
| Eastern European | 3 | 0.6% |
| English | 82 | 17.3% |
| European | 139 | 29.4% |
| French | 10 | 2.1% |
| French American Indian | 2 | 0.4% |
| French Canadian | 6 | 1.3% |
| German | 81 | 17.1% |
| Irish | 58 | 12.3% |
| Italian | 115 | 24.3% |
| Lebanese | 3 | 0.6% |
| Mexican | 6 | 1.3% |
| Norwegian | 6 | 1.3% |
| Portuguese | 3 | 0.6% |
| Samoan | 24 | 5.1% |
| Scotch-Irish | 8 | 1.7% |
| Scottish | 27 | 5.7% |
| Welsh | 7 | 1.5% | View All 24 Rows |
Immigrants in Falls Village
The most numerous immigrant groups reported in Falls Village came from Ecuador (6 | 1.3%), Europe (6 | 1.3%), Latin America (6 | 1.3%), South America (6 | 1.3%), and Italy (3 | 0.6%), together accounting for 5.7% of all Falls Village residents.
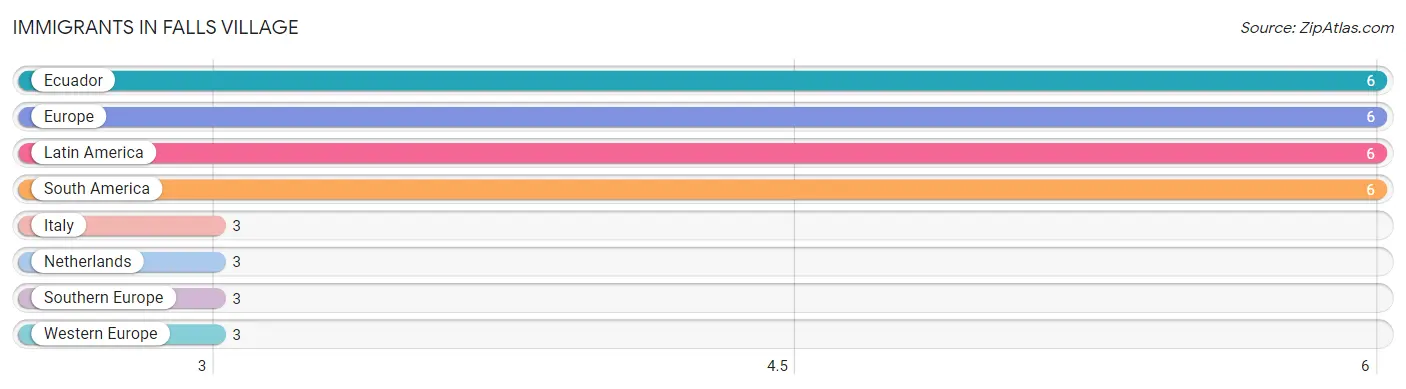
| Immigration Origin | # Population | % Population |
| Ecuador | 6 | 1.3% |
| Europe | 6 | 1.3% |
| Italy | 3 | 0.6% |
| Latin America | 6 | 1.3% |
| Netherlands | 3 | 0.6% |
| South America | 6 | 1.3% |
| Southern Europe | 3 | 0.6% |
| Western Europe | 3 | 0.6% | View All 8 Rows |
Sex and Age in Falls Village
Sex and Age in Falls Village
The most populous age groups in Falls Village are 55 to 59 Years (58 | 24.2%) for men and 20 to 24 Years (54 | 23.2%) for women.
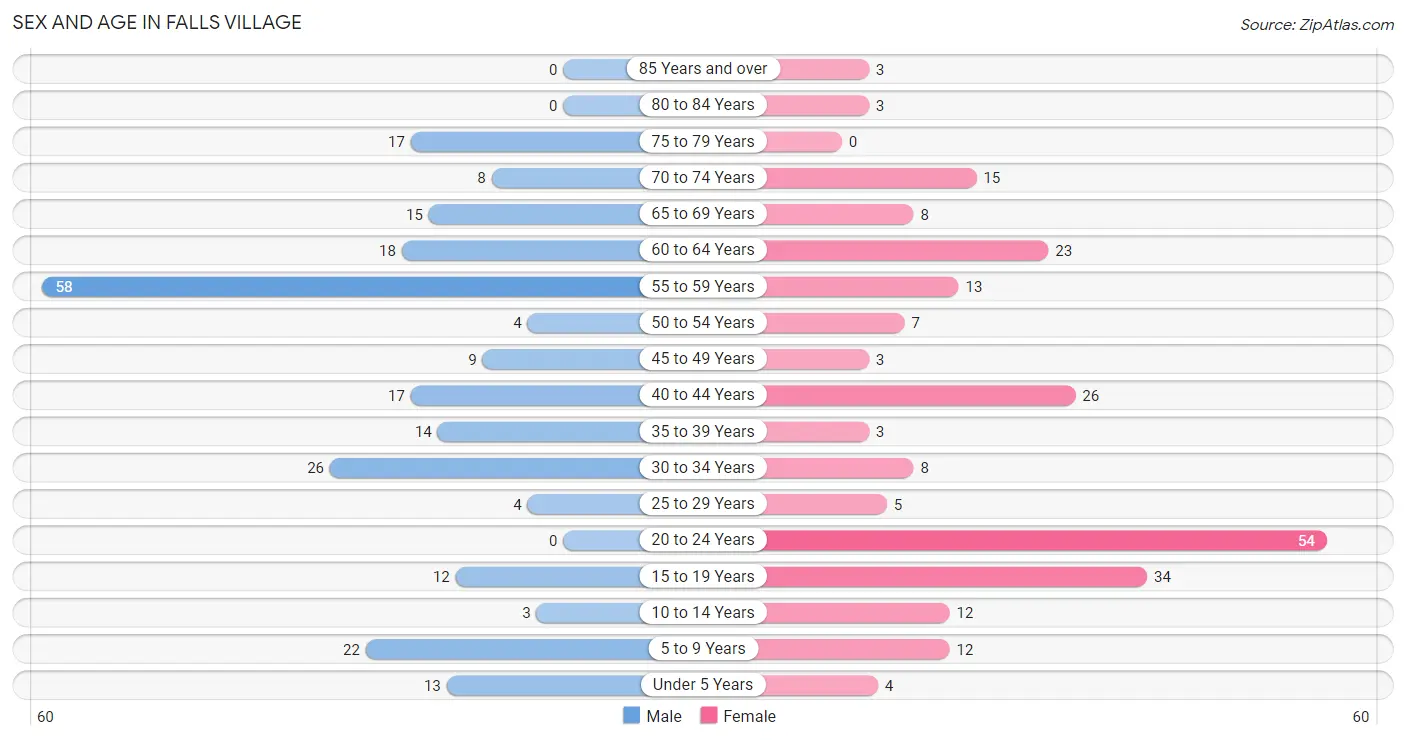
| Age Bracket | Male | Female |
| Under 5 Years | 13 (5.4%) | 4 (1.7%) |
| 5 to 9 Years | 22 (9.2%) | 12 (5.1%) |
| 10 to 14 Years | 3 (1.3%) | 12 (5.1%) |
| 15 to 19 Years | 12 (5.0%) | 34 (14.6%) |
| 20 to 24 Years | 0 (0.0%) | 54 (23.2%) |
| 25 to 29 Years | 4 (1.7%) | 5 (2.1%) |
| 30 to 34 Years | 26 (10.8%) | 8 (3.4%) |
| 35 to 39 Years | 14 (5.8%) | 3 (1.3%) |
| 40 to 44 Years | 17 (7.1%) | 26 (11.2%) |
| 45 to 49 Years | 9 (3.7%) | 3 (1.3%) |
| 50 to 54 Years | 4 (1.7%) | 7 (3.0%) |
| 55 to 59 Years | 58 (24.2%) | 13 (5.6%) |
| 60 to 64 Years | 18 (7.5%) | 23 (9.9%) |
| 65 to 69 Years | 15 (6.2%) | 8 (3.4%) |
| 70 to 74 Years | 8 (3.3%) | 15 (6.4%) |
| 75 to 79 Years | 17 (7.1%) | 0 (0.0%) |
| 80 to 84 Years | 0 (0.0%) | 3 (1.3%) |
| 85 Years and over | 0 (0.0%) | 3 (1.3%) |
| Total | 240 (100.0%) | 233 (100.0%) |
Families and Households in Falls Village
Median Family Size in Falls Village
The median family size in Falls Village is 2.78 persons per family, with single female/mother families (16 | 10.6%) accounting for the largest median family size of 3.13 persons per family. On the other hand, single male/father families (62 | 41.1%) represent the smallest median family size with 2.48 persons per family.
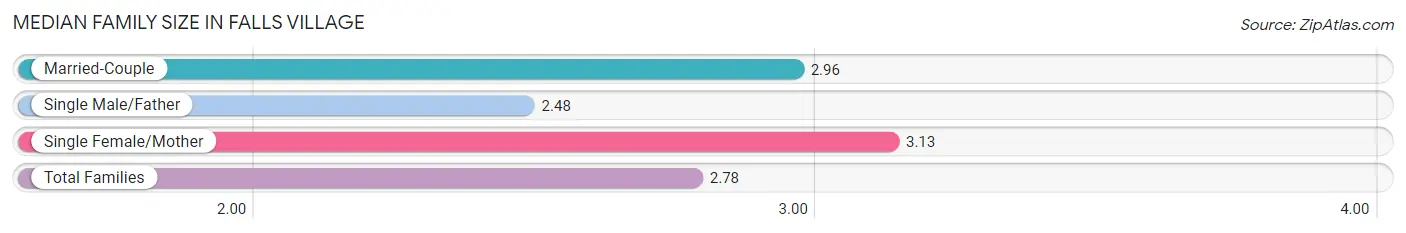
| Family Type | # Families | Family Size |
| Married-Couple | 73 (48.3%) | 2.96 |
| Single Male/Father | 62 (41.1%) | 2.48 |
| Single Female/Mother | 16 (10.6%) | 3.13 |
| Total Families | 151 (100.0%) | 2.78 |
Median Household Size in Falls Village
The median household size in Falls Village is 2.49 persons per household, with single female/mother households (16 | 8.4%) accounting for the largest median household size of 3.5 persons per household. non-family households (39 | 20.5%) represent the smallest median household size with 1.13 persons per household.
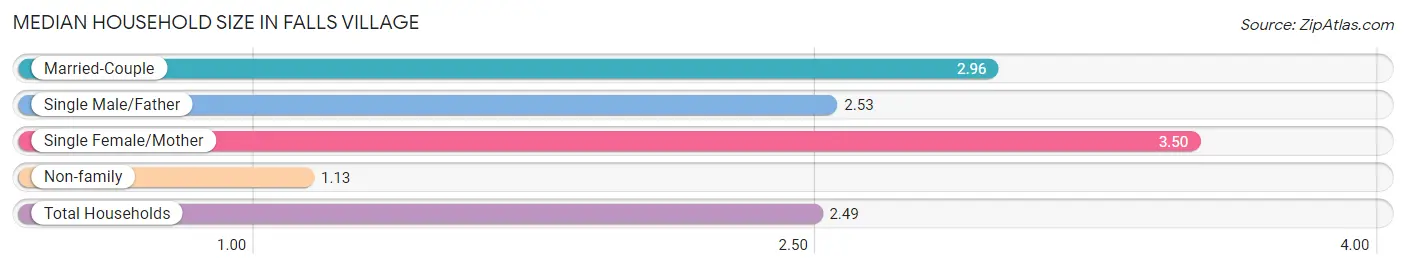
| Household Type | # Households | Household Size |
| Married-Couple | 73 (38.4%) | 2.96 |
| Single Male/Father | 62 (32.6%) | 2.53 |
| Single Female/Mother | 16 (8.4%) | 3.50 |
| Non-family | 39 (20.5%) | 1.13 |
| Total Households | 190 (100.0%) | 2.49 |
Household Size by Marriage Status in Falls Village
Out of a total of 190 households in Falls Village, 151 (79.5%) are family households, while 39 (20.5%) are nonfamily households. The most numerous type of family households are 3-person households, comprising 85, and the most common type of nonfamily households are 1-person households, comprising 35.
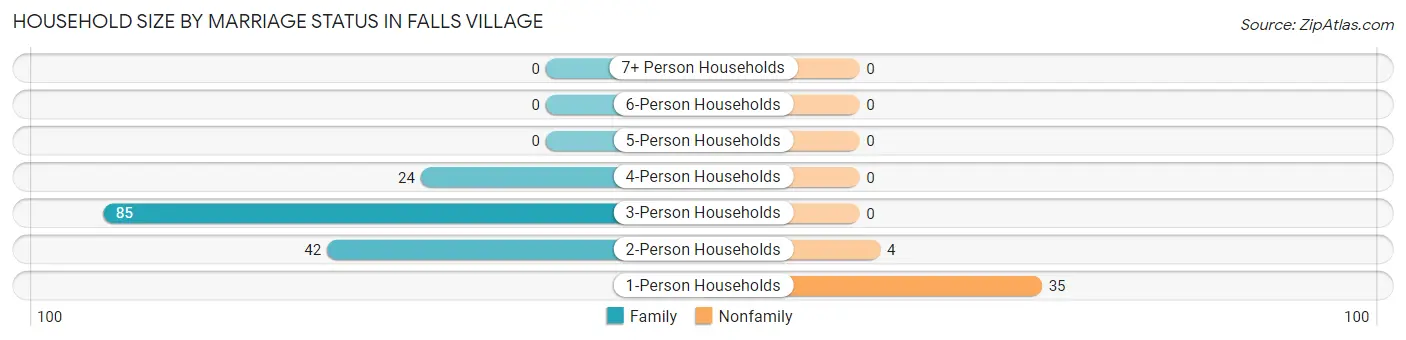
| Household Size | Family Households | Nonfamily Households |
| 1-Person Households | - | 35 (18.4%) |
| 2-Person Households | 42 (22.1%) | 4 (2.1%) |
| 3-Person Households | 85 (44.7%) | 0 (0.0%) |
| 4-Person Households | 24 (12.6%) | 0 (0.0%) |
| 5-Person Households | 0 (0.0%) | 0 (0.0%) |
| 6-Person Households | 0 (0.0%) | 0 (0.0%) |
| 7+ Person Households | 0 (0.0%) | 0 (0.0%) |
| Total | 151 (79.5%) | 39 (20.5%) |
Female Fertility in Falls Village
Fertility by Age in Falls Village
| Age Bracket | Women with Births | Births / 1,000 Women |
| 15 to 19 years | 0 (0.0%) | 0.0 |
| 20 to 34 years | 0 (0.0%) | 0.0 |
| 35 to 50 years | 0 (0.0%) | 0.0 |
| Total | 0 (0.0%) | 0.0 |
Fertility by Age by Marriage Status in Falls Village
| Age Bracket | Married | Unmarried |
| 15 to 19 years | 0 (0.0%) | 0 (0.0%) |
| 20 to 34 years | 0 (0.0%) | 0 (0.0%) |
| 35 to 50 years | 0 (0.0%) | 0 (0.0%) |
| Total | 0 (0.0%) | 0 (0.0%) |
Fertility by Education in Falls Village
| Educational Attainment | Women with Births | Births / 1,000 Women |
| Less than High School | 0 (0.0%) | 0.0 |
| High School Diploma | 0 (0.0%) | 0.0 |
| College or Associate's Degree | 0 (0.0%) | 0.0 |
| Bachelor's Degree | 0 (0.0%) | 0.0 |
| Graduate Degree | 0 (0.0%) | 0.0 |
| Total | 0 (0.0%) | 0.0 |
Fertility by Education by Marriage Status in Falls Village
| Educational Attainment | Married | Unmarried |
| Less than High School | 0 (0.0%) | 0 (0.0%) |
| High School Diploma | 0 (0.0%) | 0 (0.0%) |
| College or Associate's Degree | 0 (0.0%) | 0 (0.0%) |
| Bachelor's Degree | 0 (0.0%) | 0 (0.0%) |
| Graduate Degree | 0 (0.0%) | 0 (0.0%) |
| Total | 0 (0.0%) | 0 (0.0%) |
Employment Characteristics in Falls Village
Employment by Class of Employer in Falls Village
Among the 216 employed individuals in Falls Village, self-employed (incorporated) (68 | 31.5%), private company employees (63 | 29.2%), and self-employed (not incorporated) (36 | 16.7%) make up the most common classes of employment.
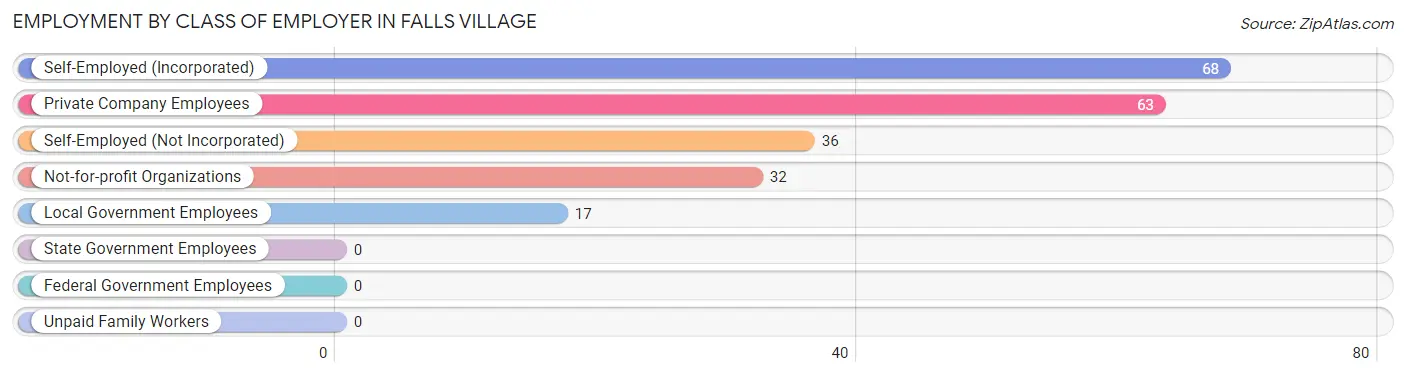
| Employer Class | # Employees | % Employees |
| Private Company Employees | 63 | 29.2% |
| Self-Employed (Incorporated) | 68 | 31.5% |
| Self-Employed (Not Incorporated) | 36 | 16.7% |
| Not-for-profit Organizations | 32 | 14.8% |
| Local Government Employees | 17 | 7.9% |
| State Government Employees | 0 | 0.0% |
| Federal Government Employees | 0 | 0.0% |
| Unpaid Family Workers | 0 | 0.0% |
| Total | 216 | 100.0% |
Employment Status by Age in Falls Village
According to the labor force statistics for Falls Village, out of the total population over 16 years of age (404), 55.0% or 222 individuals are in the labor force, with 1.4% or 3 of them unemployed. The age group with the highest labor force participation rate is 25 to 29 years, with 100.0% or 9 individuals in the labor force. Within the labor force, the 30 to 34 years age range has the highest percentage of unemployed individuals, with 8.8% or 3 of them being unemployed.
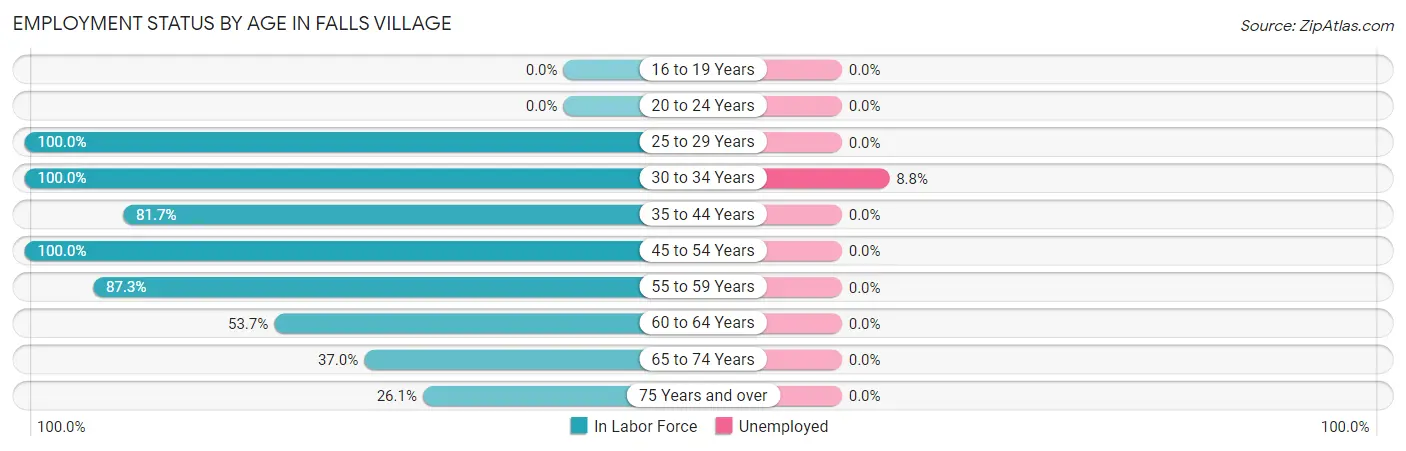
| Age Bracket | In Labor Force | Unemployed |
| 16 to 19 Years | 0 (0.0%) | 0 (0.0%) |
| 20 to 24 Years | 0 (0.0%) | 0 (0.0%) |
| 25 to 29 Years | 9 (100.0%) | 0 (0.0%) |
| 30 to 34 Years | 34 (100.0%) | 3 (8.8%) |
| 35 to 44 Years | 49 (81.7%) | 0 (0.0%) |
| 45 to 54 Years | 23 (100.0%) | 0 (0.0%) |
| 55 to 59 Years | 62 (87.3%) | 0 (0.0%) |
| 60 to 64 Years | 22 (53.7%) | 0 (0.0%) |
| 65 to 74 Years | 17 (37.0%) | 0 (0.0%) |
| 75 Years and over | 6 (26.1%) | 0 (0.0%) |
| Total | 222 (55.0%) | 3 (1.4%) |
Employment Status by Educational Attainment in Falls Village
According to labor force statistics for Falls Village, 83.6% of individuals (199) out of the total population between 25 and 64 years of age (238) are in the labor force, with 1.5% or 3 of them being unemployed. The group with the highest labor force participation rate are those with the educational attainment of bachelor's degree or higher, with 90.2% or 110 individuals in the labor force. Within the labor force, individuals with college / associate degree education have the highest percentage of unemployment, with 5.4% or 3 of them being unemployed.
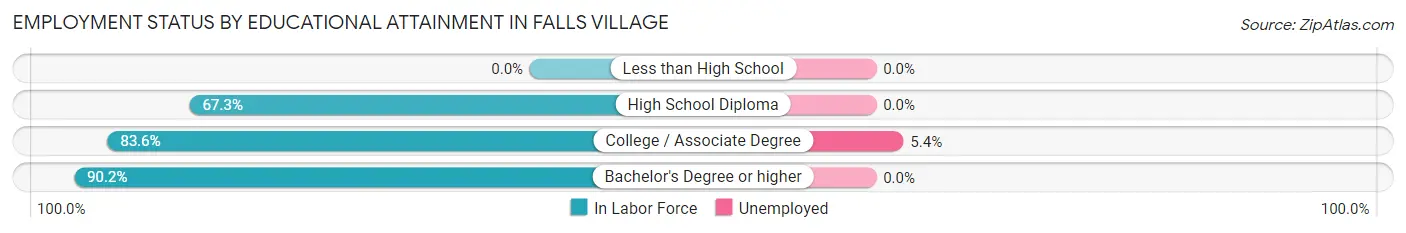
| Educational Attainment | In Labor Force | Unemployed |
| Less than High School | 0 (0.0%) | 0 (0.0%) |
| High School Diploma | 33 (67.3%) | 0 (0.0%) |
| College / Associate Degree | 56 (83.6%) | 4 (5.4%) |
| Bachelor's Degree or higher | 110 (90.2%) | 0 (0.0%) |
| Total | 199 (83.6%) | 4 (1.5%) |
Employment Occupations by Sex in Falls Village
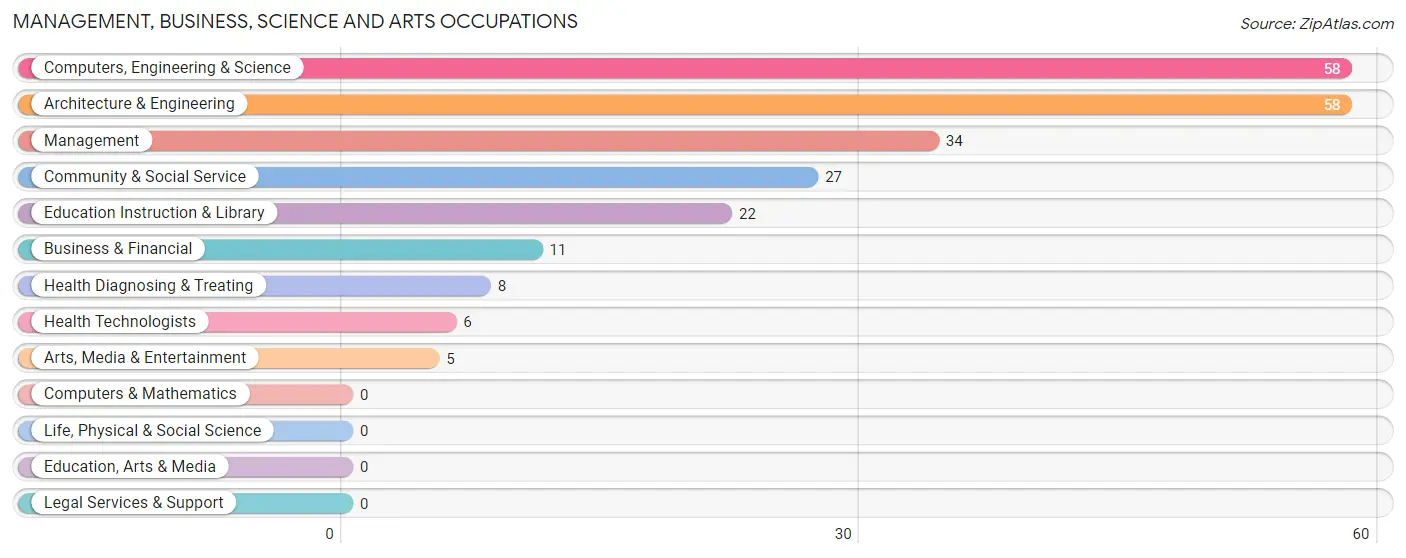
Management, Business, Science and Arts Occupations
The most common Management, Business, Science and Arts occupations in Falls Village are Computers, Engineering & Science (58 | 26.5%), Architecture & Engineering (58 | 26.5%), Management (34 | 15.5%), Community & Social Service (27 | 12.3%), and Education Instruction & Library (22 | 10.1%).
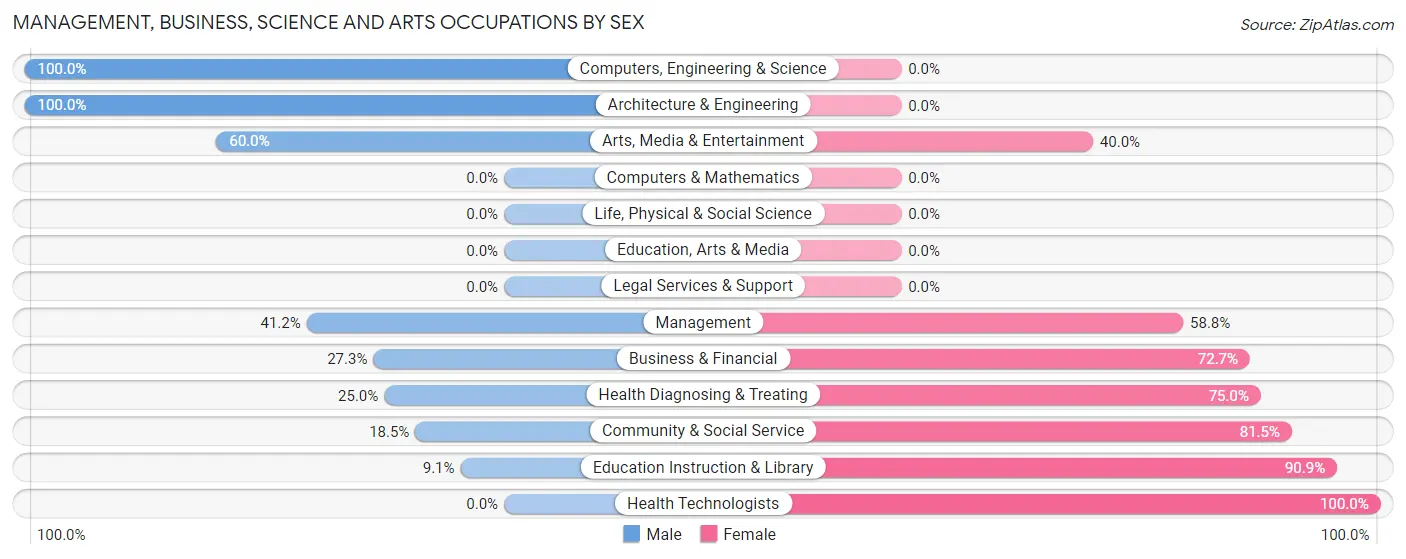
Management, Business, Science and Arts Occupations by Sex
Within the Management, Business, Science and Arts occupations in Falls Village, the most male-oriented occupations are Computers, Engineering & Science (100.0%), Architecture & Engineering (100.0%), and Arts, Media & Entertainment (60.0%), while the most female-oriented occupations are Health Technologists (100.0%), Education Instruction & Library (90.9%), and Community & Social Service (81.5%).
| Occupation | Male | Female |
| Management | 14 (41.2%) | 20 (58.8%) |
| Business & Financial | 3 (27.3%) | 8 (72.7%) |
| Computers, Engineering & Science | 58 (100.0%) | 0 (0.0%) |
| Computers & Mathematics | 0 (0.0%) | 0 (0.0%) |
| Architecture & Engineering | 58 (100.0%) | 0 (0.0%) |
| Life, Physical & Social Science | 0 (0.0%) | 0 (0.0%) |
| Community & Social Service | 5 (18.5%) | 22 (81.5%) |
| Education, Arts & Media | 0 (0.0%) | 0 (0.0%) |
| Legal Services & Support | 0 (0.0%) | 0 (0.0%) |
| Education Instruction & Library | 2 (9.1%) | 20 (90.9%) |
| Arts, Media & Entertainment | 3 (60.0%) | 2 (40.0%) |
| Health Diagnosing & Treating | 2 (25.0%) | 6 (75.0%) |
| Health Technologists | 0 (0.0%) | 6 (100.0%) |
| Total (Category) | 82 (59.4%) | 56 (40.6%) |
| Total (Overall) | 137 (62.6%) | 82 (37.4%) |
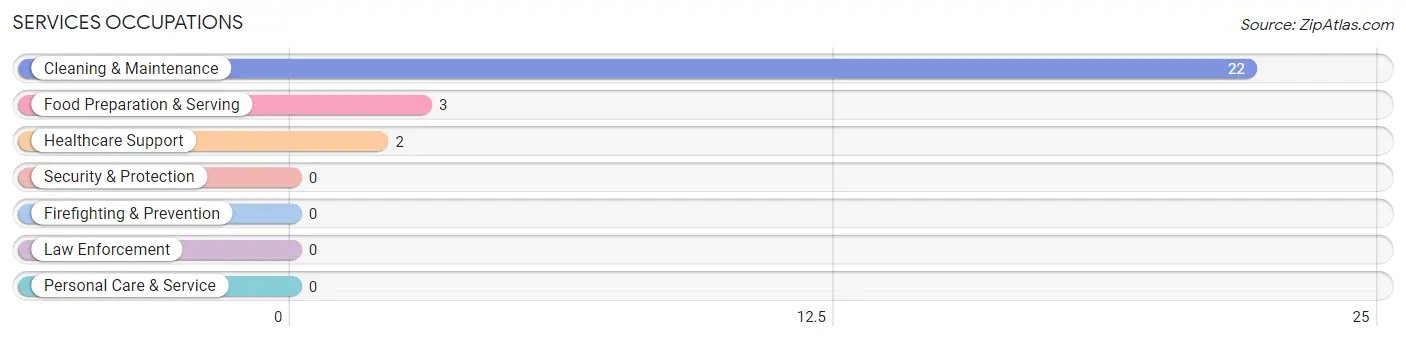
Services Occupations
The most common Services occupations in Falls Village are Cleaning & Maintenance (22 | 10.1%), Food Preparation & Serving (3 | 1.4%), and Healthcare Support (2 | 0.9%).
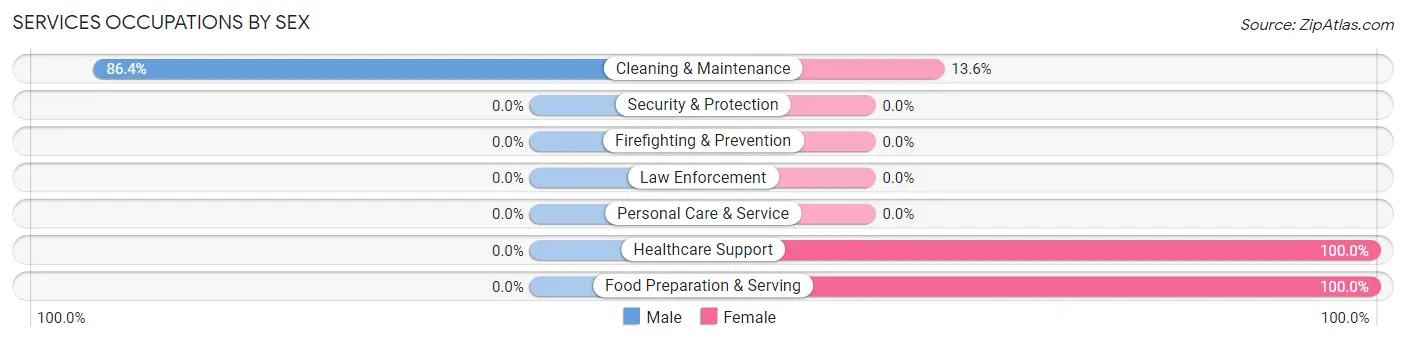
Services Occupations by Sex
| Occupation | Male | Female |
| Healthcare Support | 0 (0.0%) | 2 (100.0%) |
| Security & Protection | 0 (0.0%) | 0 (0.0%) |
| Firefighting & Prevention | 0 (0.0%) | 0 (0.0%) |
| Law Enforcement | 0 (0.0%) | 0 (0.0%) |
| Food Preparation & Serving | 0 (0.0%) | 3 (100.0%) |
| Cleaning & Maintenance | 19 (86.4%) | 3 (13.6%) |
| Personal Care & Service | 0 (0.0%) | 0 (0.0%) |
| Total (Category) | 19 (70.4%) | 8 (29.6%) |
| Total (Overall) | 137 (62.6%) | 82 (37.4%) |
Sales and Office Occupations
The most common Sales and Office occupations in Falls Village are Sales & Related (14 | 6.4%), and Office & Administration (12 | 5.5%).
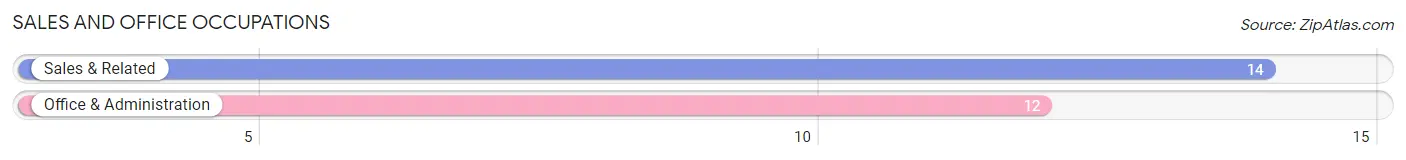
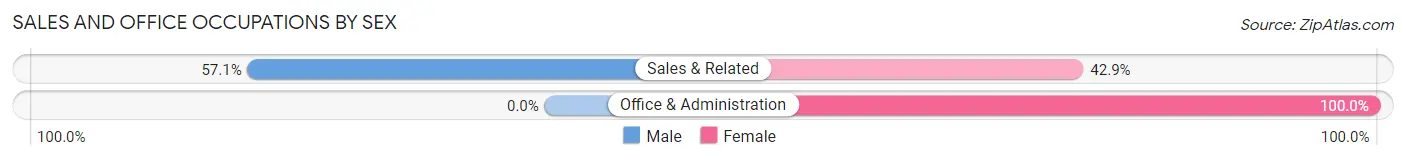
Sales and Office Occupations by Sex
| Occupation | Male | Female |
| Sales & Related | 8 (57.1%) | 6 (42.9%) |
| Office & Administration | 0 (0.0%) | 12 (100.0%) |
| Total (Category) | 8 (30.8%) | 18 (69.2%) |
| Total (Overall) | 137 (62.6%) | 82 (37.4%) |
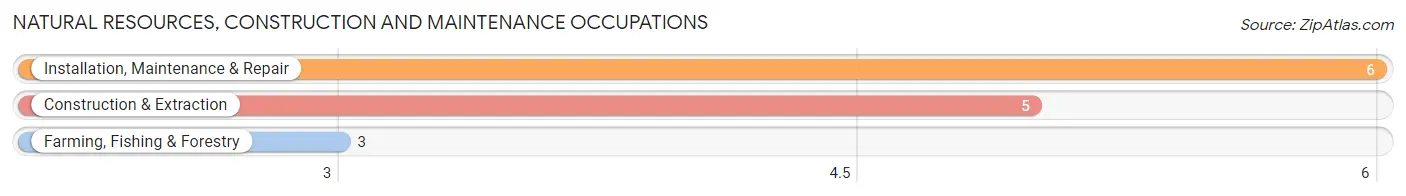
Natural Resources, Construction and Maintenance Occupations
The most common Natural Resources, Construction and Maintenance occupations in Falls Village are Installation, Maintenance & Repair (6 | 2.7%), Construction & Extraction (5 | 2.3%), and Farming, Fishing & Forestry (3 | 1.4%).
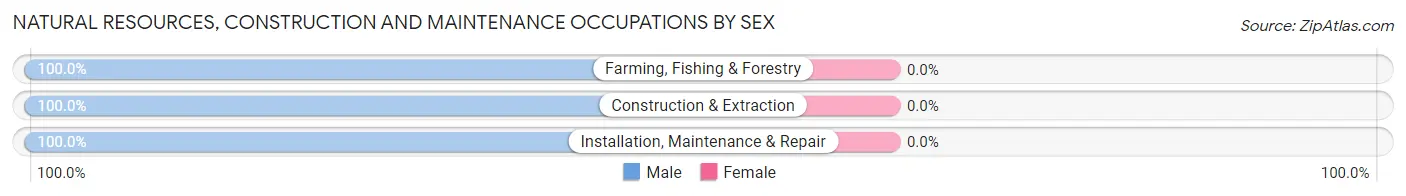
Natural Resources, Construction and Maintenance Occupations by Sex
| Occupation | Male | Female |
| Farming, Fishing & Forestry | 3 (100.0%) | 0 (0.0%) |
| Construction & Extraction | 5 (100.0%) | 0 (0.0%) |
| Installation, Maintenance & Repair | 6 (100.0%) | 0 (0.0%) |
| Total (Category) | 14 (100.0%) | 0 (0.0%) |
| Total (Overall) | 137 (62.6%) | 82 (37.4%) |
Production, Transportation and Moving Occupations
The most common Production, Transportation and Moving occupations in Falls Village are Production (8 | 3.6%), and Transportation (6 | 2.7%).
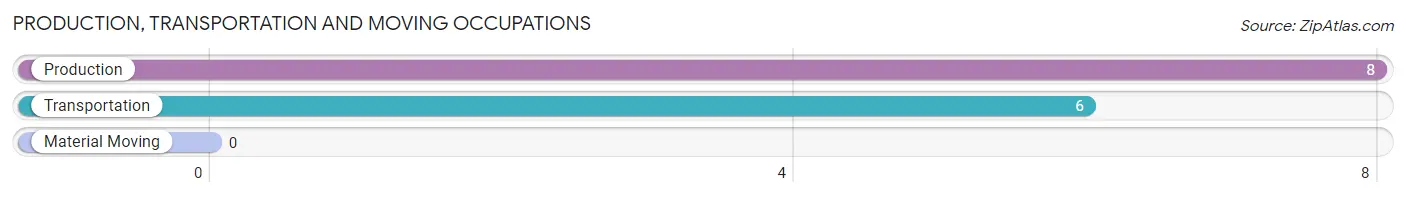
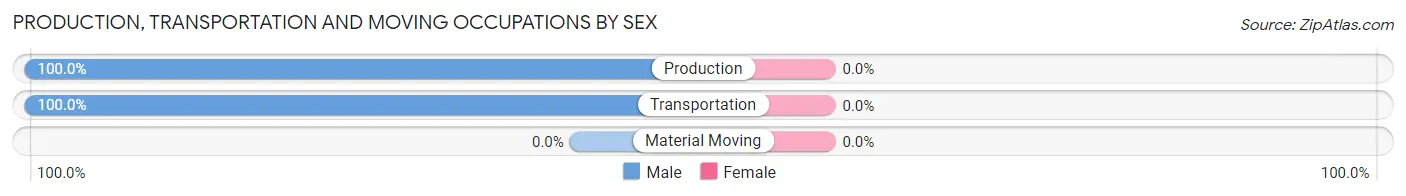
Production, Transportation and Moving Occupations by Sex
| Occupation | Male | Female |
| Production | 8 (100.0%) | 0 (0.0%) |
| Transportation | 6 (100.0%) | 0 (0.0%) |
| Material Moving | 0 (0.0%) | 0 (0.0%) |
| Total (Category) | 14 (100.0%) | 0 (0.0%) |
| Total (Overall) | 137 (62.6%) | 82 (37.4%) |
Employment Industries by Sex in Falls Village
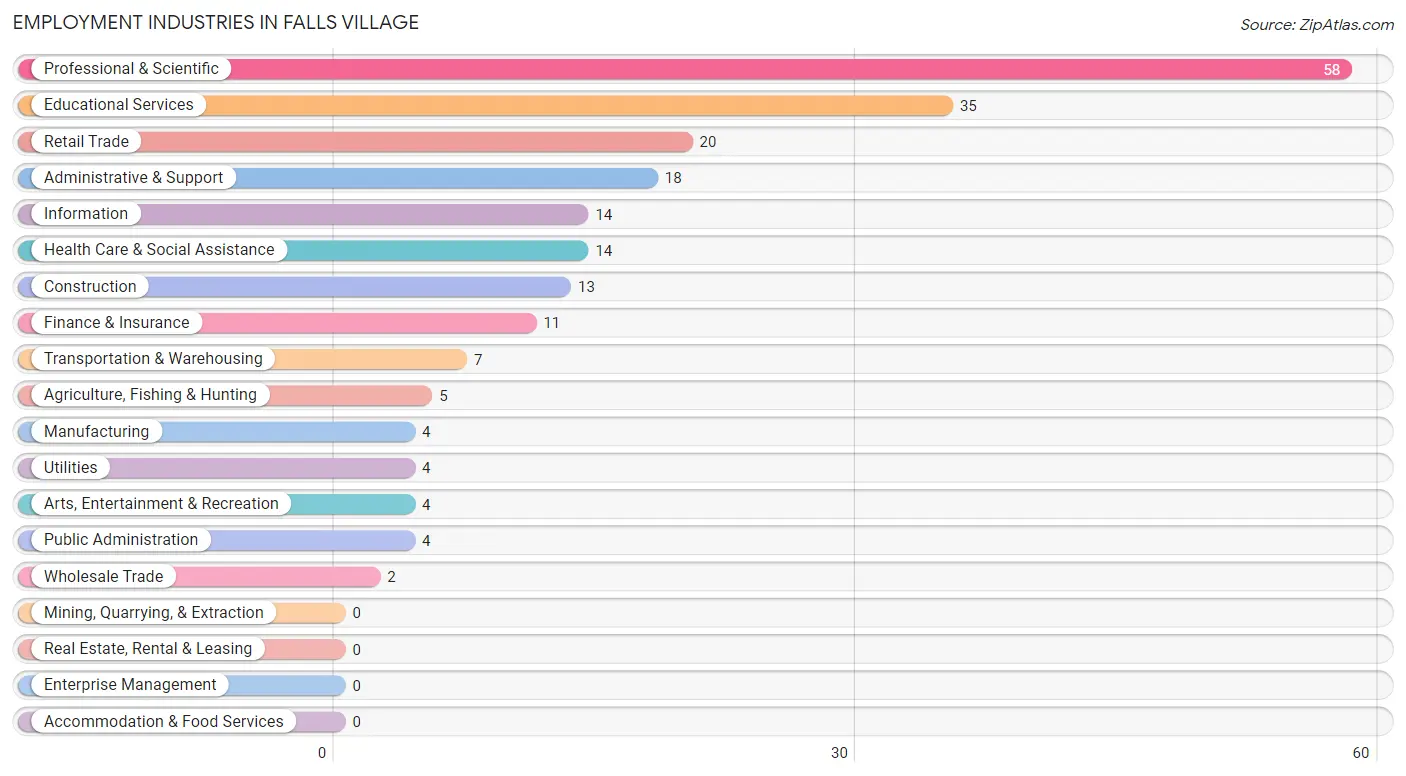
Employment Industries in Falls Village
The major employment industries in Falls Village include Professional & Scientific (58 | 26.5%), Educational Services (35 | 16.0%), Retail Trade (20 | 9.1%), Administrative & Support (18 | 8.2%), and Information (14 | 6.4%).
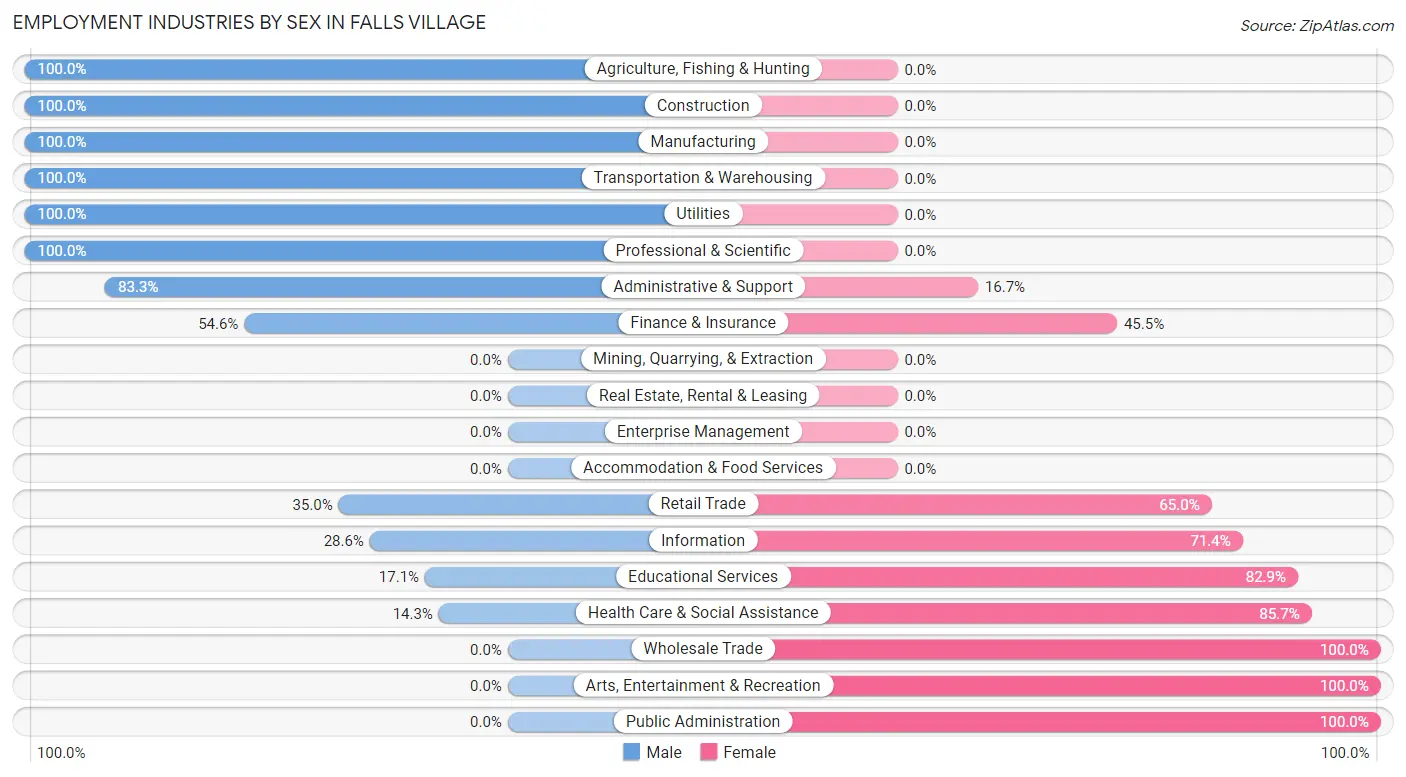
Employment Industries by Sex in Falls Village
The Falls Village industries that see more men than women are Agriculture, Fishing & Hunting (100.0%), Construction (100.0%), and Manufacturing (100.0%), whereas the industries that tend to have a higher number of women are Wholesale Trade (100.0%), Arts, Entertainment & Recreation (100.0%), and Public Administration (100.0%).
| Industry | Male | Female |
| Agriculture, Fishing & Hunting | 5 (100.0%) | 0 (0.0%) |
| Mining, Quarrying, & Extraction | 0 (0.0%) | 0 (0.0%) |
| Construction | 13 (100.0%) | 0 (0.0%) |
| Manufacturing | 4 (100.0%) | 0 (0.0%) |
| Wholesale Trade | 0 (0.0%) | 2 (100.0%) |
| Retail Trade | 7 (35.0%) | 13 (65.0%) |
| Transportation & Warehousing | 7 (100.0%) | 0 (0.0%) |
| Utilities | 4 (100.0%) | 0 (0.0%) |
| Information | 4 (28.6%) | 10 (71.4%) |
| Finance & Insurance | 6 (54.5%) | 5 (45.5%) |
| Real Estate, Rental & Leasing | 0 (0.0%) | 0 (0.0%) |
| Professional & Scientific | 58 (100.0%) | 0 (0.0%) |
| Enterprise Management | 0 (0.0%) | 0 (0.0%) |
| Administrative & Support | 15 (83.3%) | 3 (16.7%) |
| Educational Services | 6 (17.1%) | 29 (82.9%) |
| Health Care & Social Assistance | 2 (14.3%) | 12 (85.7%) |
| Arts, Entertainment & Recreation | 0 (0.0%) | 4 (100.0%) |
| Accommodation & Food Services | 0 (0.0%) | 0 (0.0%) |
| Public Administration | 0 (0.0%) | 4 (100.0%) |
| Total | 137 (62.6%) | 82 (37.4%) |
Education in Falls Village
School Enrollment in Falls Village
The most common levels of schooling among the 153 students in Falls Village are college / undergraduate (89 | 58.2%), kindergarten (29 | 19.0%), and middle school (12 | 7.8%).
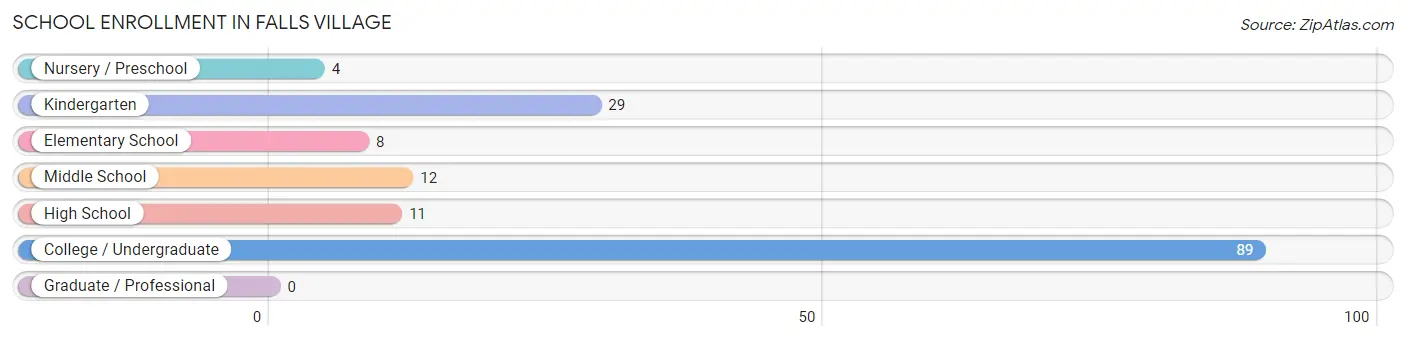
| School Level | # Students | % Students |
| Nursery / Preschool | 4 | 2.6% |
| Kindergarten | 29 | 19.0% |
| Elementary School | 8 | 5.2% |
| Middle School | 12 | 7.8% |
| High School | 11 | 7.2% |
| College / Undergraduate | 89 | 58.2% |
| Graduate / Professional | 0 | 0.0% |
| Total | 153 | 100.0% |
School Enrollment by Age by Funding Source in Falls Village
Out of a total of 153 students who are enrolled in schools in Falls Village, 85 (55.6%) attend a private institution, while the remaining 68 (44.4%) are enrolled in public schools. The age group of 3 to 4 year olds has the highest likelihood of being enrolled in private schools, with 4 (100.0% in the age bracket) enrolled. Conversely, the age group of 5 to 9 year old has the lowest likelihood of being enrolled in a private school, with 34 (100.0% in the age bracket) attending a public institution.
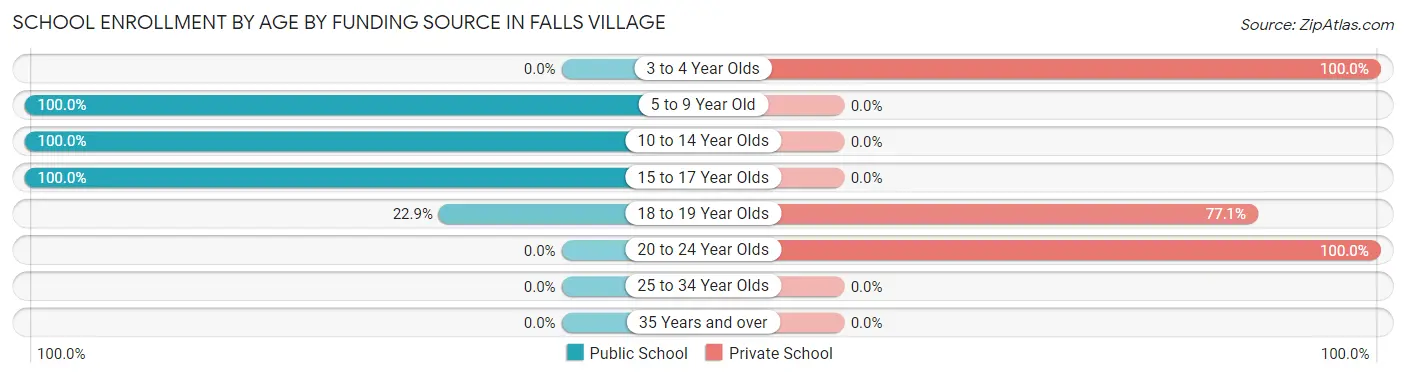
| Age Bracket | Public School | Private School |
| 3 to 4 Year Olds | 0 (0.0%) | 4 (100.0%) |
| 5 to 9 Year Old | 34 (100.0%) | 0 (0.0%) |
| 10 to 14 Year Olds | 15 (100.0%) | 0 (0.0%) |
| 15 to 17 Year Olds | 11 (100.0%) | 0 (0.0%) |
| 18 to 19 Year Olds | 8 (22.9%) | 27 (77.1%) |
| 20 to 24 Year Olds | 0 (0.0%) | 54 (100.0%) |
| 25 to 34 Year Olds | 0 (0.0%) | 0 (0.0%) |
| 35 Years and over | 0 (0.0%) | 0 (0.0%) |
| Total | 68 (44.4%) | 85 (55.6%) |
Educational Attainment by Field of Study in Falls Village
Visual & performing arts (83 | 44.9%), literature & languages (21 | 11.4%), education (18 | 9.7%), engineering (10 | 5.4%), and bio, nature & agricultural (8 | 4.3%) are the most common fields of study among 185 individuals in Falls Village who have obtained a bachelor's degree or higher.
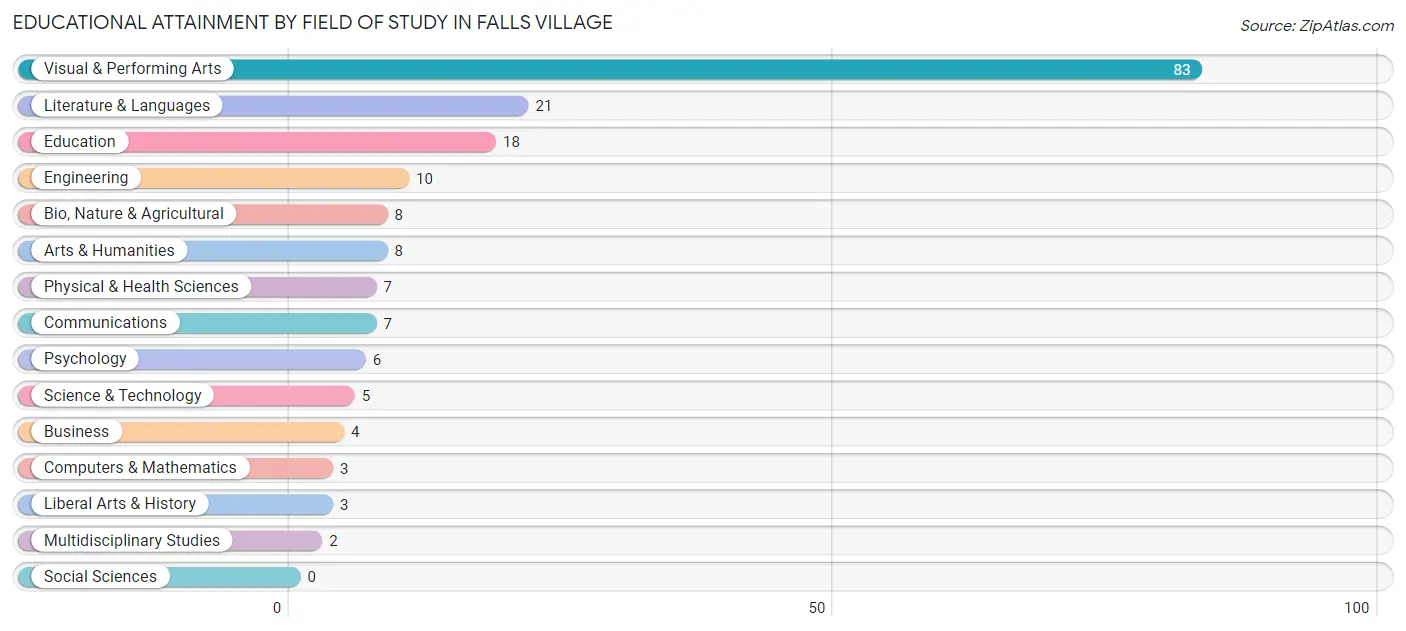
| Field of Study | # Graduates | % Graduates |
| Computers & Mathematics | 3 | 1.6% |
| Bio, Nature & Agricultural | 8 | 4.3% |
| Physical & Health Sciences | 7 | 3.8% |
| Psychology | 6 | 3.2% |
| Social Sciences | 0 | 0.0% |
| Engineering | 10 | 5.4% |
| Multidisciplinary Studies | 2 | 1.1% |
| Science & Technology | 5 | 2.7% |
| Business | 4 | 2.2% |
| Education | 18 | 9.7% |
| Literature & Languages | 21 | 11.4% |
| Liberal Arts & History | 3 | 1.6% |
| Visual & Performing Arts | 83 | 44.9% |
| Communications | 7 | 3.8% |
| Arts & Humanities | 8 | 4.3% |
| Total | 185 | 100.0% |
Transportation & Commute in Falls Village
Vehicle Availability by Sex in Falls Village
The most prevalent vehicle ownership categories in Falls Village are males with 1 vehicle (69, accounting for 50.4%) and females with 1 vehicle (12, making up 87.3%).
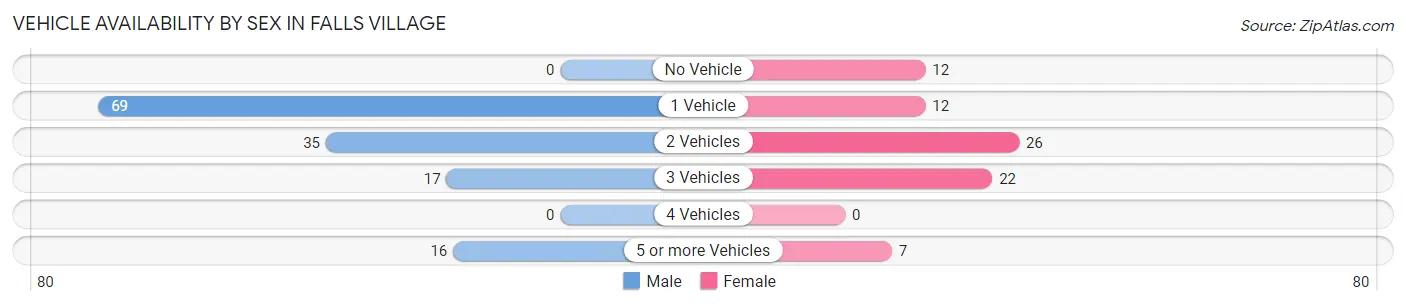
| Vehicles Available | Male | Female |
| No Vehicle | 0 (0.0%) | 12 (15.2%) |
| 1 Vehicle | 69 (50.4%) | 12 (15.2%) |
| 2 Vehicles | 35 (25.6%) | 26 (32.9%) |
| 3 Vehicles | 17 (12.4%) | 22 (27.9%) |
| 4 Vehicles | 0 (0.0%) | 0 (0.0%) |
| 5 or more Vehicles | 16 (11.7%) | 7 (8.9%) |
| Total | 137 (100.0%) | 79 (100.0%) |
Commute Time in Falls Village
The most frequently occuring commute durations in Falls Village are 15 to 19 minutes (26 commuters, 19.9%), 10 to 14 minutes (22 commuters, 16.8%), and 20 to 24 minutes (21 commuters, 16.0%).
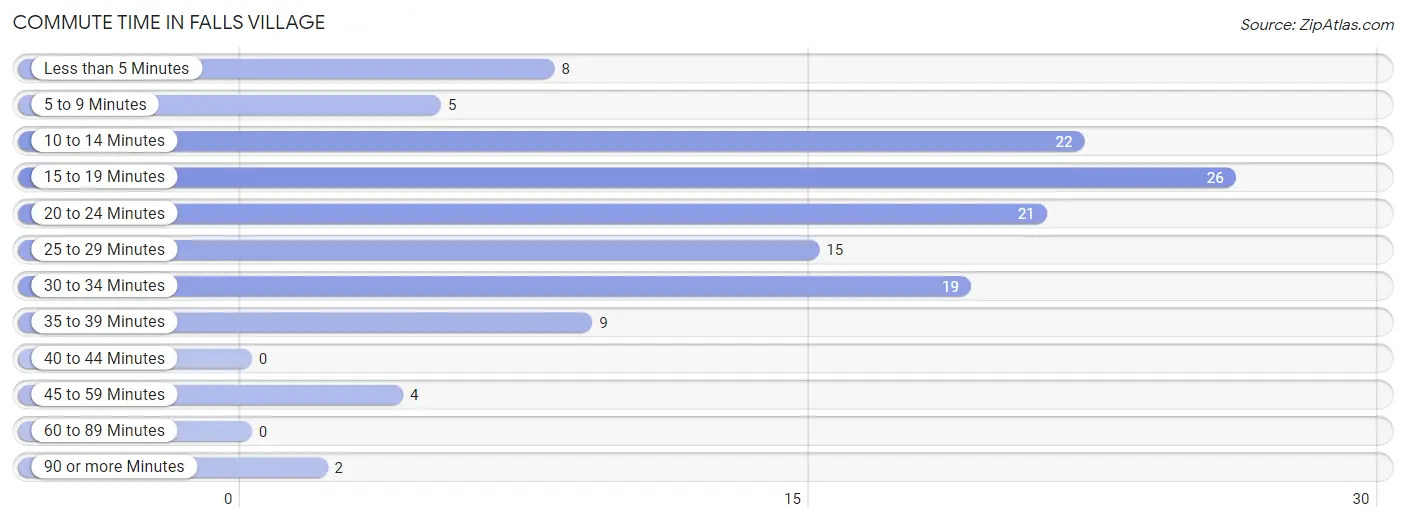
| Commute Time | # Commuters | % Commuters |
| Less than 5 Minutes | 8 | 6.1% |
| 5 to 9 Minutes | 5 | 3.8% |
| 10 to 14 Minutes | 22 | 16.8% |
| 15 to 19 Minutes | 26 | 19.9% |
| 20 to 24 Minutes | 21 | 16.0% |
| 25 to 29 Minutes | 15 | 11.5% |
| 30 to 34 Minutes | 19 | 14.5% |
| 35 to 39 Minutes | 9 | 6.9% |
| 40 to 44 Minutes | 0 | 0.0% |
| 45 to 59 Minutes | 4 | 3.0% |
| 60 to 89 Minutes | 0 | 0.0% |
| 90 or more Minutes | 2 | 1.5% |
Commute Time by Sex in Falls Village
The most common commute times in Falls Village are 10 to 14 minutes (12 commuters, 20.7%) for males and 15 to 19 minutes (22 commuters, 30.1%) for females.
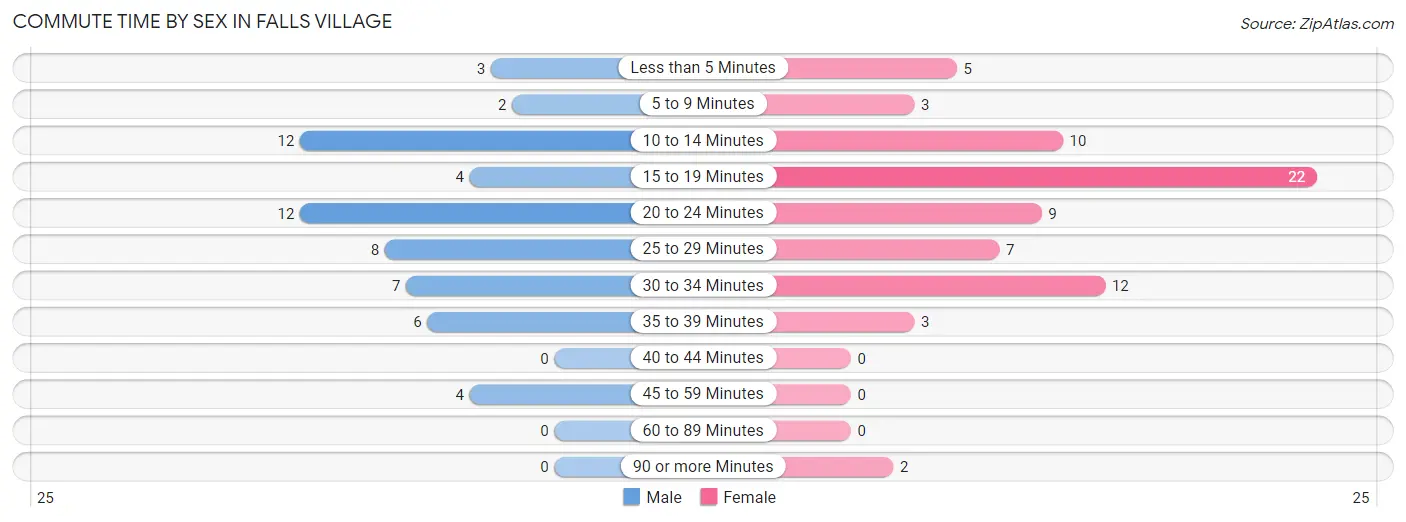
| Commute Time | Male | Female |
| Less than 5 Minutes | 3 (5.2%) | 5 (6.9%) |
| 5 to 9 Minutes | 2 (3.5%) | 3 (4.1%) |
| 10 to 14 Minutes | 12 (20.7%) | 10 (13.7%) |
| 15 to 19 Minutes | 4 (6.9%) | 22 (30.1%) |
| 20 to 24 Minutes | 12 (20.7%) | 9 (12.3%) |
| 25 to 29 Minutes | 8 (13.8%) | 7 (9.6%) |
| 30 to 34 Minutes | 7 (12.1%) | 12 (16.4%) |
| 35 to 39 Minutes | 6 (10.3%) | 3 (4.1%) |
| 40 to 44 Minutes | 0 (0.0%) | 0 (0.0%) |
| 45 to 59 Minutes | 4 (6.9%) | 0 (0.0%) |
| 60 to 89 Minutes | 0 (0.0%) | 0 (0.0%) |
| 90 or more Minutes | 0 (0.0%) | 2 (2.7%) |
Time of Departure to Work by Sex in Falls Village
The most frequent times of departure to work in Falls Village are 7:30 AM to 7:59 AM (10, 17.2%) for males and 7:30 AM to 7:59 AM (23, 31.5%) for females.
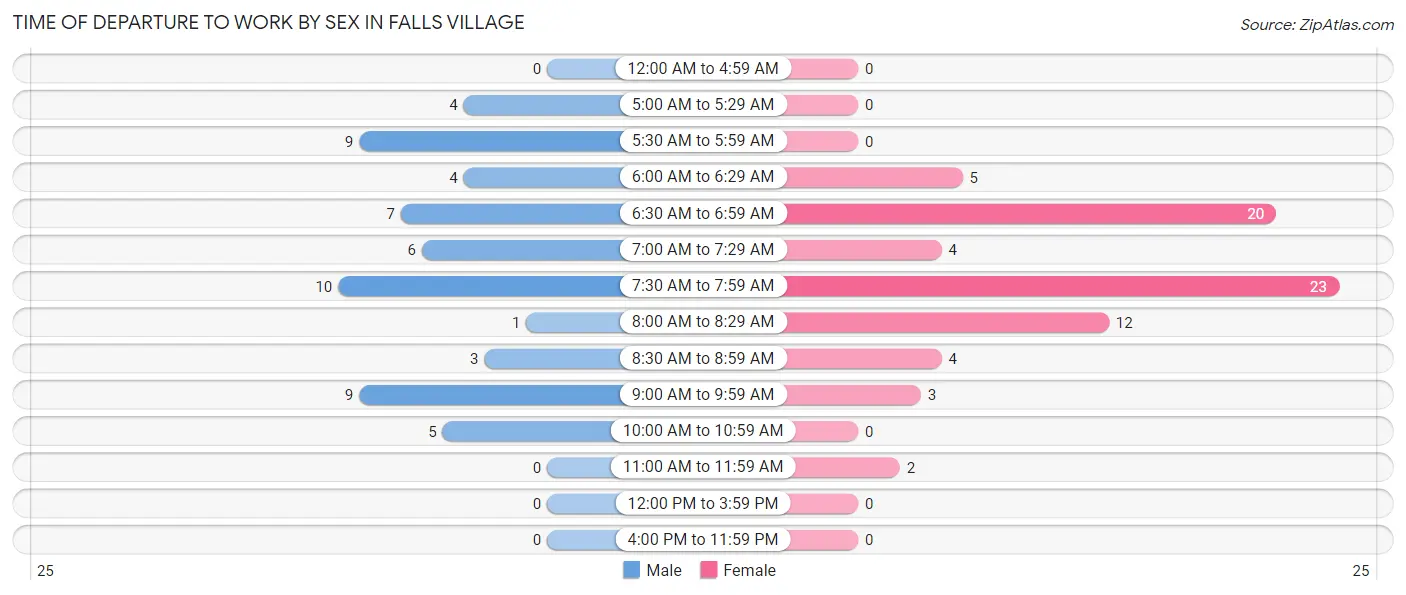
| Time of Departure | Male | Female |
| 12:00 AM to 4:59 AM | 0 (0.0%) | 0 (0.0%) |
| 5:00 AM to 5:29 AM | 4 (6.9%) | 0 (0.0%) |
| 5:30 AM to 5:59 AM | 9 (15.5%) | 0 (0.0%) |
| 6:00 AM to 6:29 AM | 4 (6.9%) | 5 (6.9%) |
| 6:30 AM to 6:59 AM | 7 (12.1%) | 20 (27.4%) |
| 7:00 AM to 7:29 AM | 6 (10.3%) | 4 (5.5%) |
| 7:30 AM to 7:59 AM | 10 (17.2%) | 23 (31.5%) |
| 8:00 AM to 8:29 AM | 1 (1.7%) | 12 (16.4%) |
| 8:30 AM to 8:59 AM | 3 (5.2%) | 4 (5.5%) |
| 9:00 AM to 9:59 AM | 9 (15.5%) | 3 (4.1%) |
| 10:00 AM to 10:59 AM | 5 (8.6%) | 0 (0.0%) |
| 11:00 AM to 11:59 AM | 0 (0.0%) | 2 (2.7%) |
| 12:00 PM to 3:59 PM | 0 (0.0%) | 0 (0.0%) |
| 4:00 PM to 11:59 PM | 0 (0.0%) | 0 (0.0%) |
| Total | 58 (100.0%) | 73 (100.0%) |
Housing Occupancy in Falls Village
Occupancy by Ownership in Falls Village
Of the total 190 dwellings in Falls Village, owner-occupied units account for 173 (91.0%), while renter-occupied units make up 17 (8.9%).
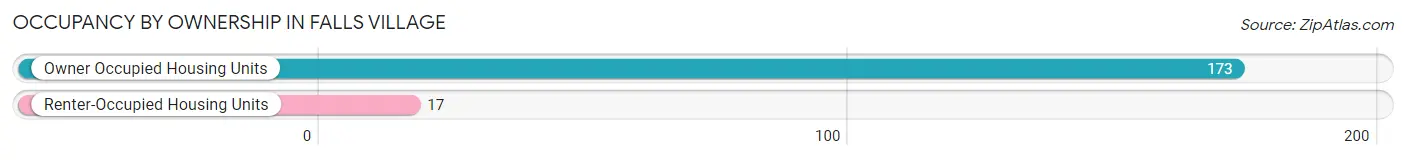
| Occupancy | # Housing Units | % Housing Units |
| Owner Occupied Housing Units | 173 | 91.0% |
| Renter-Occupied Housing Units | 17 | 8.9% |
| Total Occupied Housing Units | 190 | 100.0% |
Occupancy by Household Size in Falls Village
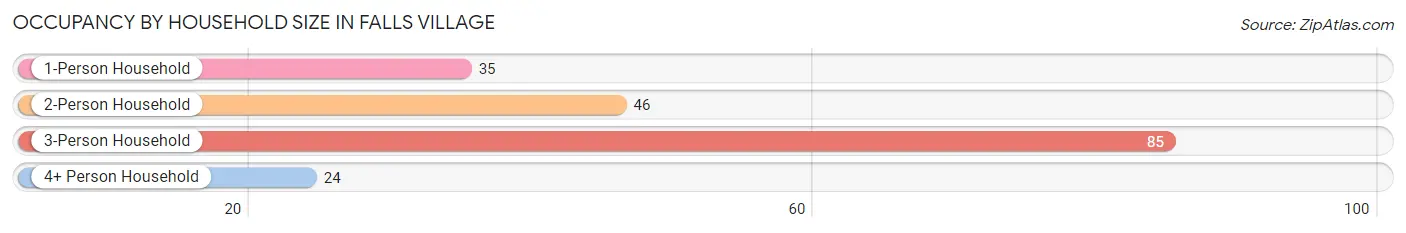
| Household Size | # Housing Units | % Housing Units |
| 1-Person Household | 35 | 18.4% |
| 2-Person Household | 46 | 24.2% |
| 3-Person Household | 85 | 44.7% |
| 4+ Person Household | 24 | 12.6% |
| Total Housing Units | 190 | 100.0% |
Occupancy by Ownership by Household Size in Falls Village
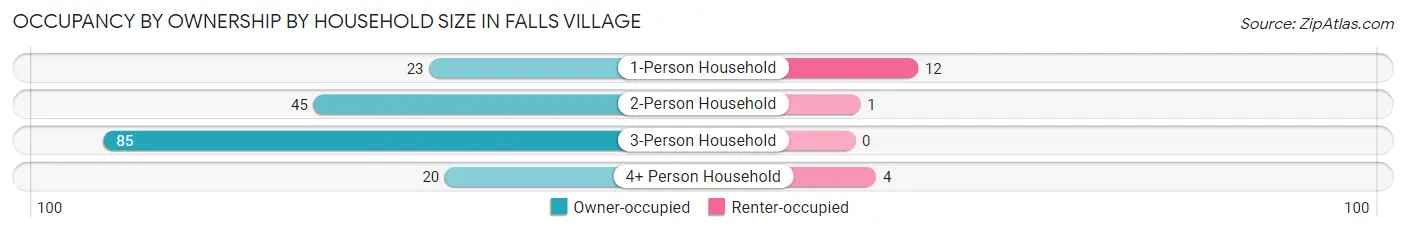
| Household Size | Owner-occupied | Renter-occupied |
| 1-Person Household | 23 (65.7%) | 12 (34.3%) |
| 2-Person Household | 45 (97.8%) | 1 (2.2%) |
| 3-Person Household | 85 (100.0%) | 0 (0.0%) |
| 4+ Person Household | 20 (83.3%) | 4 (16.7%) |
| Total Housing Units | 173 (91.0%) | 17 (8.9%) |
Occupancy by Educational Attainment in Falls Village
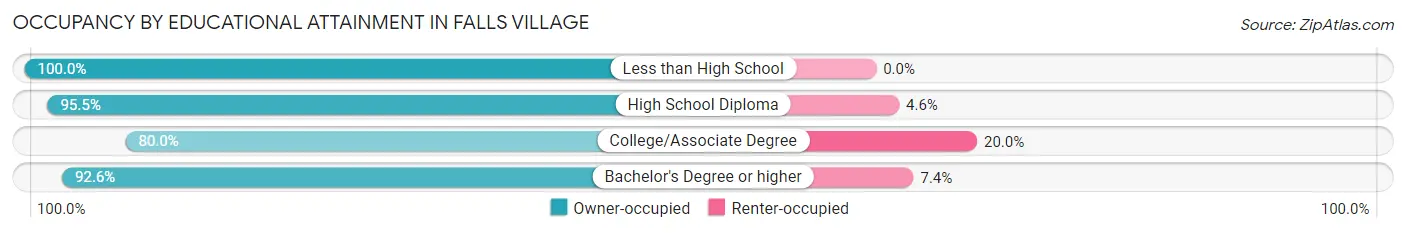
| Household Size | Owner-occupied | Renter-occupied |
| Less than High School | 3 (100.0%) | 0 (0.0%) |
| High School Diploma | 21 (95.5%) | 1 (4.5%) |
| College/Associate Degree | 24 (80.0%) | 6 (20.0%) |
| Bachelor's Degree or higher | 125 (92.6%) | 10 (7.4%) |
Occupancy by Age of Householder in Falls Village
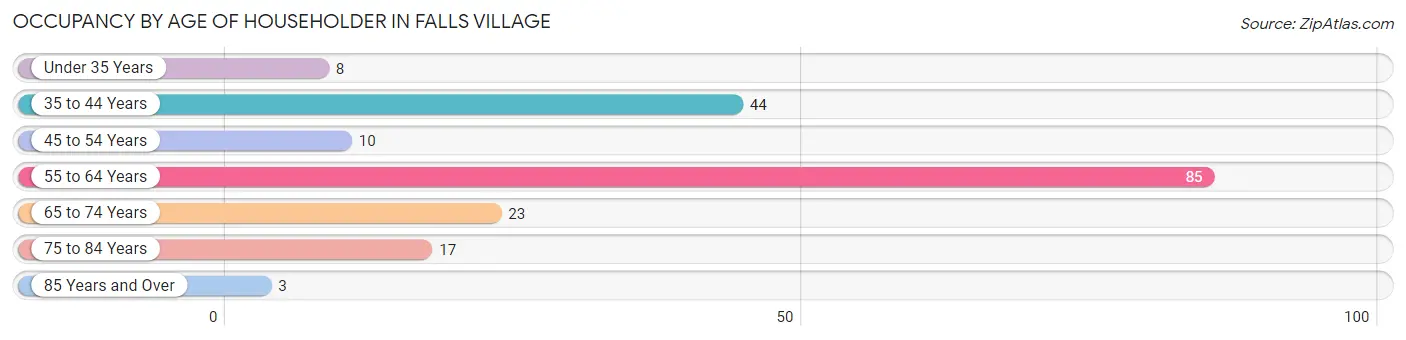
| Age Bracket | # Households | % Households |
| Under 35 Years | 8 | 4.2% |
| 35 to 44 Years | 44 | 23.2% |
| 45 to 54 Years | 10 | 5.3% |
| 55 to 64 Years | 85 | 44.7% |
| 65 to 74 Years | 23 | 12.1% |
| 75 to 84 Years | 17 | 8.9% |
| 85 Years and Over | 3 | 1.6% |
| Total | 190 | 100.0% |
Housing Finances in Falls Village
Median Income by Occupancy in Falls Village
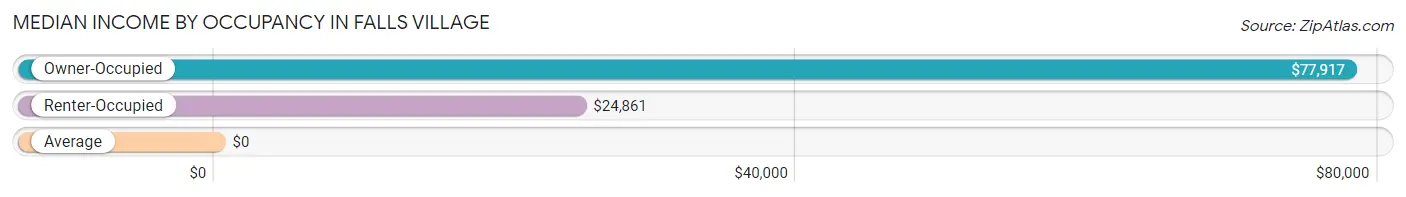
| Occupancy Type | # Households | Median Income |
| Owner-Occupied | 173 (91.0%) | $77,917 |
| Renter-Occupied | 17 (8.9%) | $24,861 |
| Average | 190 (100.0%) | $0 |
Occupancy by Householder Income Bracket in Falls Village
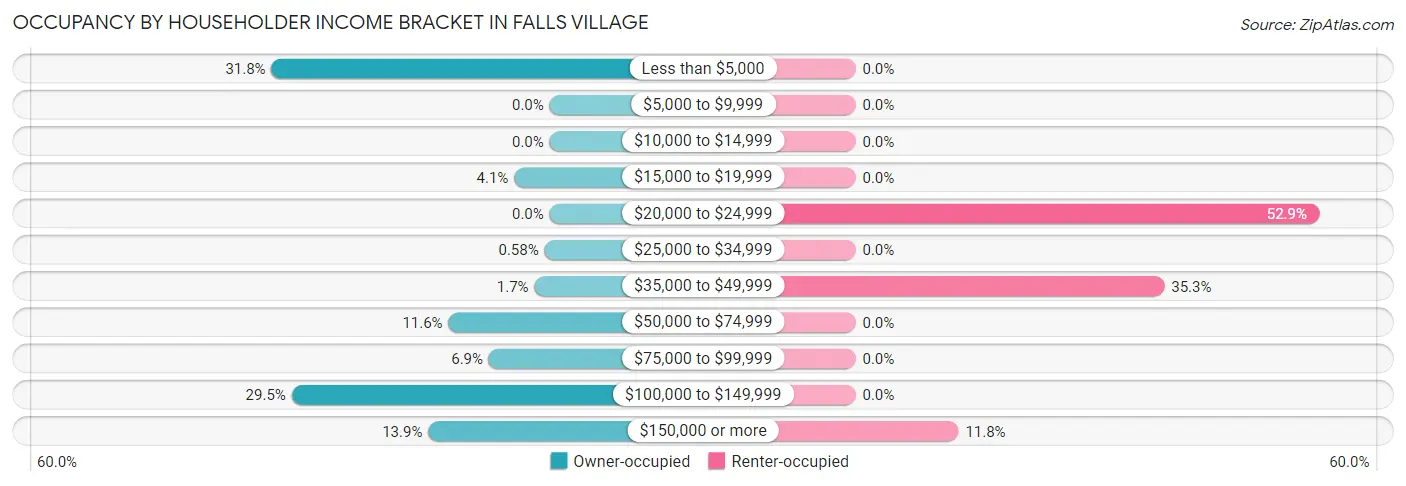
| Income Bracket | Owner-occupied | Renter-occupied |
| Less than $5,000 | 55 (31.8%) | 0 (0.0%) |
| $5,000 to $9,999 | 0 (0.0%) | 0 (0.0%) |
| $10,000 to $14,999 | 0 (0.0%) | 0 (0.0%) |
| $15,000 to $19,999 | 7 (4.1%) | 0 (0.0%) |
| $20,000 to $24,999 | 0 (0.0%) | 9 (52.9%) |
| $25,000 to $34,999 | 1 (0.6%) | 0 (0.0%) |
| $35,000 to $49,999 | 3 (1.7%) | 6 (35.3%) |
| $50,000 to $74,999 | 20 (11.6%) | 0 (0.0%) |
| $75,000 to $99,999 | 12 (6.9%) | 0 (0.0%) |
| $100,000 to $149,999 | 51 (29.5%) | 0 (0.0%) |
| $150,000 or more | 24 (13.9%) | 2 (11.8%) |
| Total | 173 (100.0%) | 17 (100.0%) |
Monthly Housing Cost Tiers in Falls Village
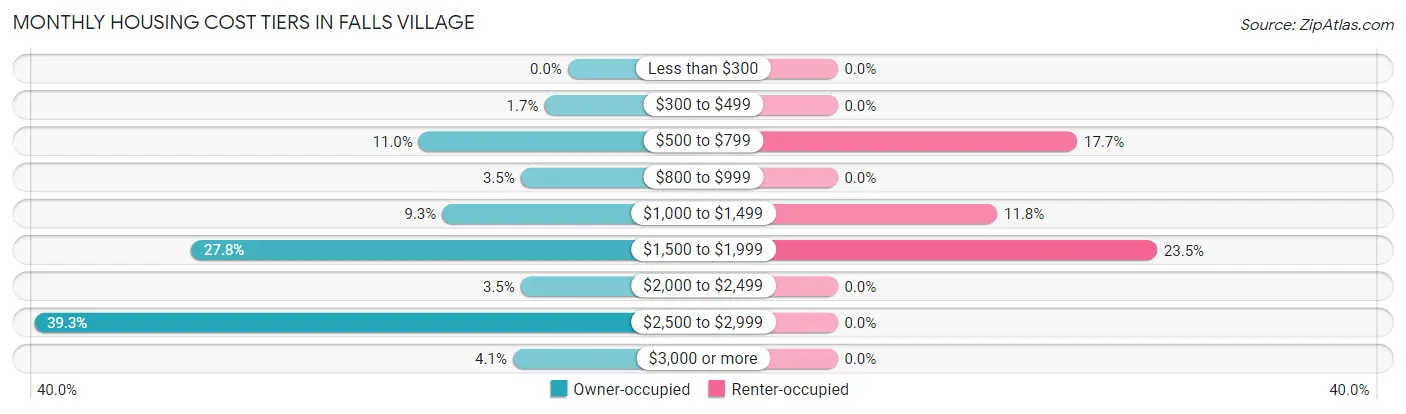
| Monthly Cost | Owner-occupied | Renter-occupied |
| Less than $300 | 0 (0.0%) | 0 (0.0%) |
| $300 to $499 | 3 (1.7%) | 0 (0.0%) |
| $500 to $799 | 19 (11.0%) | 3 (17.6%) |
| $800 to $999 | 6 (3.5%) | 0 (0.0%) |
| $1,000 to $1,499 | 16 (9.2%) | 2 (11.8%) |
| $1,500 to $1,999 | 48 (27.8%) | 4 (23.5%) |
| $2,000 to $2,499 | 6 (3.5%) | 0 (0.0%) |
| $2,500 to $2,999 | 68 (39.3%) | 0 (0.0%) |
| $3,000 or more | 7 (4.1%) | 0 (0.0%) |
| Total | 173 (100.0%) | 17 (100.0%) |
Physical Housing Characteristics in Falls Village
Housing Structures in Falls Village
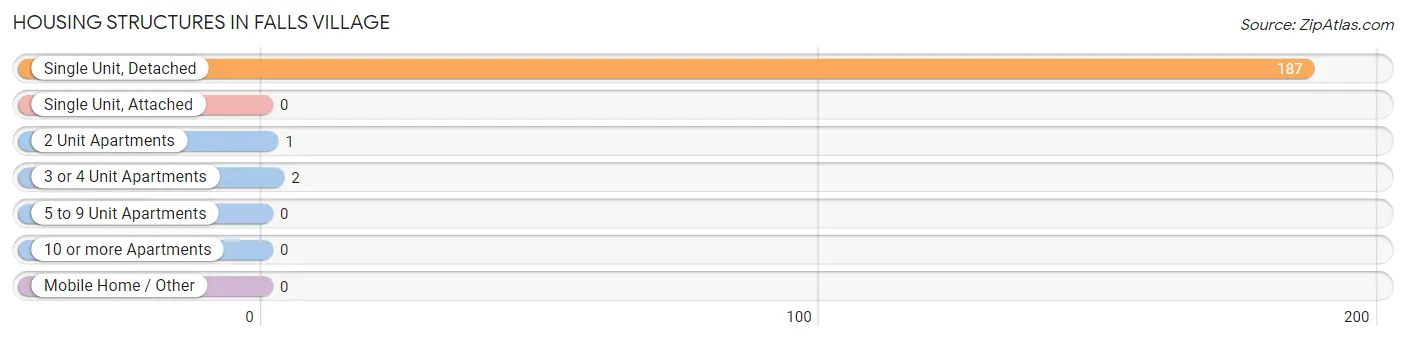
| Structure Type | # Housing Units | % Housing Units |
| Single Unit, Detached | 187 | 98.4% |
| Single Unit, Attached | 0 | 0.0% |
| 2 Unit Apartments | 1 | 0.5% |
| 3 or 4 Unit Apartments | 2 | 1.1% |
| 5 to 9 Unit Apartments | 0 | 0.0% |
| 10 or more Apartments | 0 | 0.0% |
| Mobile Home / Other | 0 | 0.0% |
| Total | 190 | 100.0% |
Housing Structures by Occupancy in Falls Village
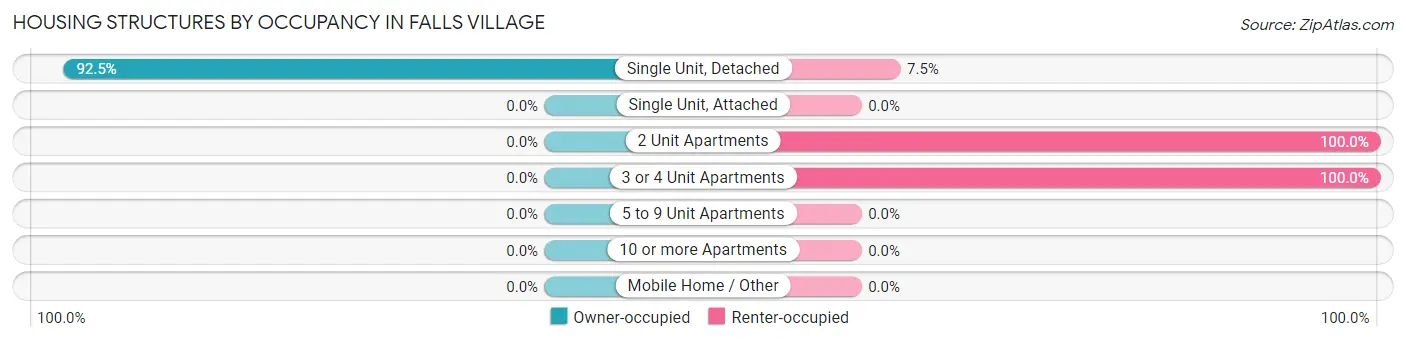
| Structure Type | Owner-occupied | Renter-occupied |
| Single Unit, Detached | 173 (92.5%) | 14 (7.5%) |
| Single Unit, Attached | 0 (0.0%) | 0 (0.0%) |
| 2 Unit Apartments | 0 (0.0%) | 1 (100.0%) |
| 3 or 4 Unit Apartments | 0 (0.0%) | 2 (100.0%) |
| 5 to 9 Unit Apartments | 0 (0.0%) | 0 (0.0%) |
| 10 or more Apartments | 0 (0.0%) | 0 (0.0%) |
| Mobile Home / Other | 0 (0.0%) | 0 (0.0%) |
| Total | 173 (91.0%) | 17 (8.9%) |
Housing Structures by Number of Rooms in Falls Village
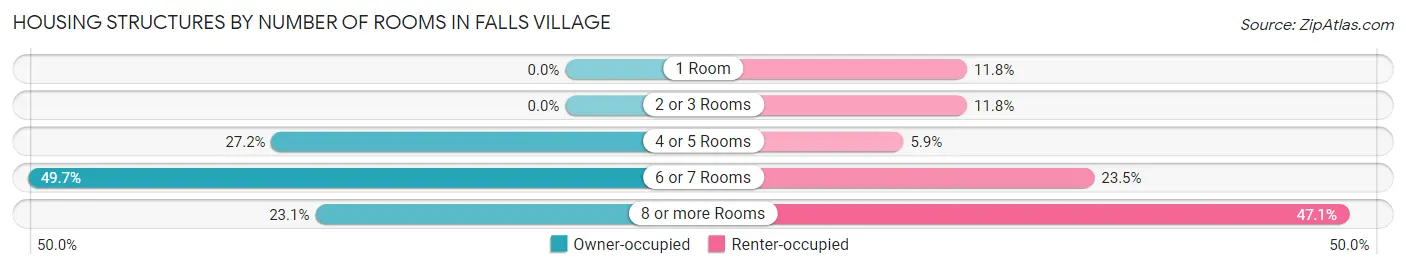
| Number of Rooms | Owner-occupied | Renter-occupied |
| 1 Room | 0 (0.0%) | 2 (11.8%) |
| 2 or 3 Rooms | 0 (0.0%) | 2 (11.8%) |
| 4 or 5 Rooms | 47 (27.2%) | 1 (5.9%) |
| 6 or 7 Rooms | 86 (49.7%) | 4 (23.5%) |
| 8 or more Rooms | 40 (23.1%) | 8 (47.1%) |
| Total | 173 (100.0%) | 17 (100.0%) |
Housing Structure by Heating Type in Falls Village
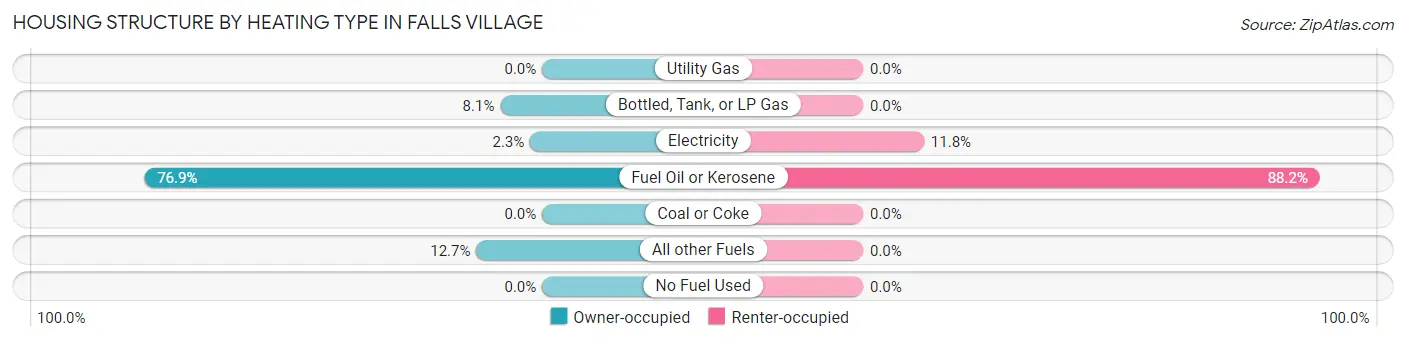
| Heating Type | Owner-occupied | Renter-occupied |
| Utility Gas | 0 (0.0%) | 0 (0.0%) |
| Bottled, Tank, or LP Gas | 14 (8.1%) | 0 (0.0%) |
| Electricity | 4 (2.3%) | 2 (11.8%) |
| Fuel Oil or Kerosene | 133 (76.9%) | 15 (88.2%) |
| Coal or Coke | 0 (0.0%) | 0 (0.0%) |
| All other Fuels | 22 (12.7%) | 0 (0.0%) |
| No Fuel Used | 0 (0.0%) | 0 (0.0%) |
| Total | 173 (100.0%) | 17 (100.0%) |
Household Vehicle Usage in Falls Village
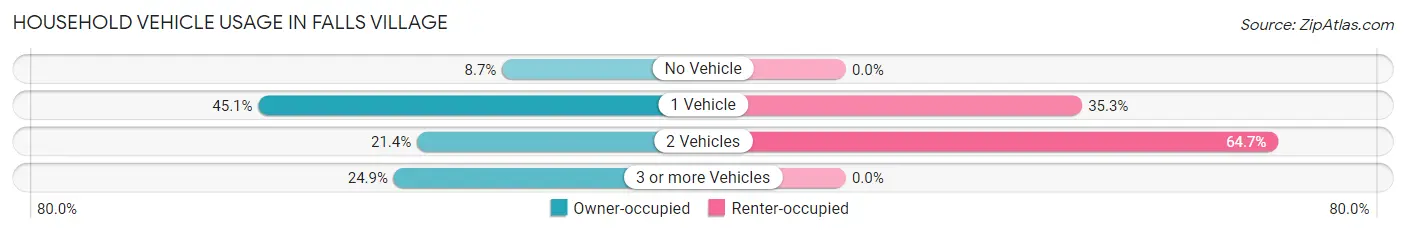
| Vehicles per Household | Owner-occupied | Renter-occupied |
| No Vehicle | 15 (8.7%) | 0 (0.0%) |
| 1 Vehicle | 78 (45.1%) | 6 (35.3%) |
| 2 Vehicles | 37 (21.4%) | 11 (64.7%) |
| 3 or more Vehicles | 43 (24.9%) | 0 (0.0%) |
| Total | 173 (100.0%) | 17 (100.0%) |
Real Estate & Mortgages in Falls Village
Real Estate and Mortgage Overview in Falls Village
| Characteristic | Without Mortgage | With Mortgage |
| Housing Units | 38 | 135 |
| Median Property Value | $290,900 | $411,500 |
| Median Household Income | $122,813 | $12 |
| Monthly Housing Costs | $791 | $4 |
| Real Estate Taxes | $6,250 | $0 |
Property Value by Mortgage Status in Falls Village
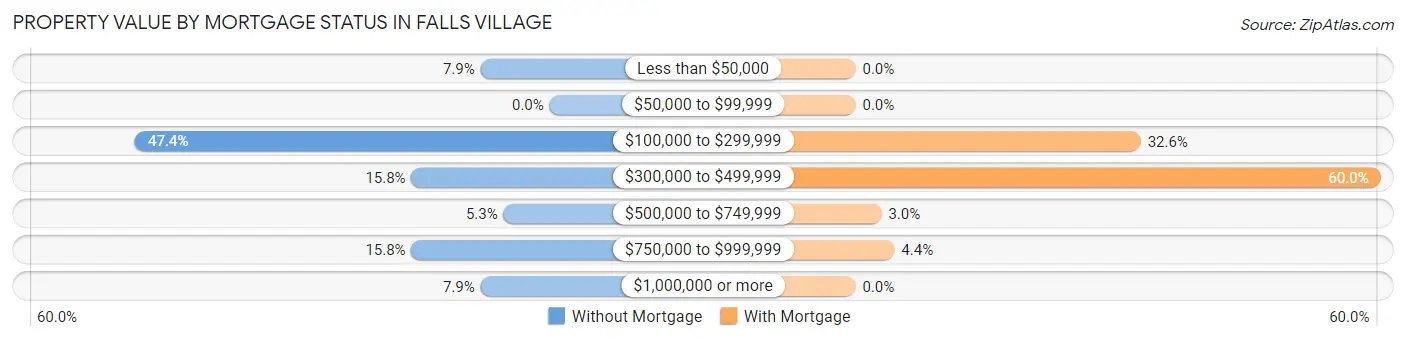
| Property Value | Without Mortgage | With Mortgage |
| Less than $50,000 | 3 (7.9%) | 0 (0.0%) |
| $50,000 to $99,999 | 0 (0.0%) | 0 (0.0%) |
| $100,000 to $299,999 | 18 (47.4%) | 44 (32.6%) |
| $300,000 to $499,999 | 6 (15.8%) | 81 (60.0%) |
| $500,000 to $749,999 | 2 (5.3%) | 4 (3.0%) |
| $750,000 to $999,999 | 6 (15.8%) | 6 (4.4%) |
| $1,000,000 or more | 3 (7.9%) | 0 (0.0%) |
| Total | 38 (100.0%) | 135 (100.0%) |
Household Income by Mortgage Status in Falls Village
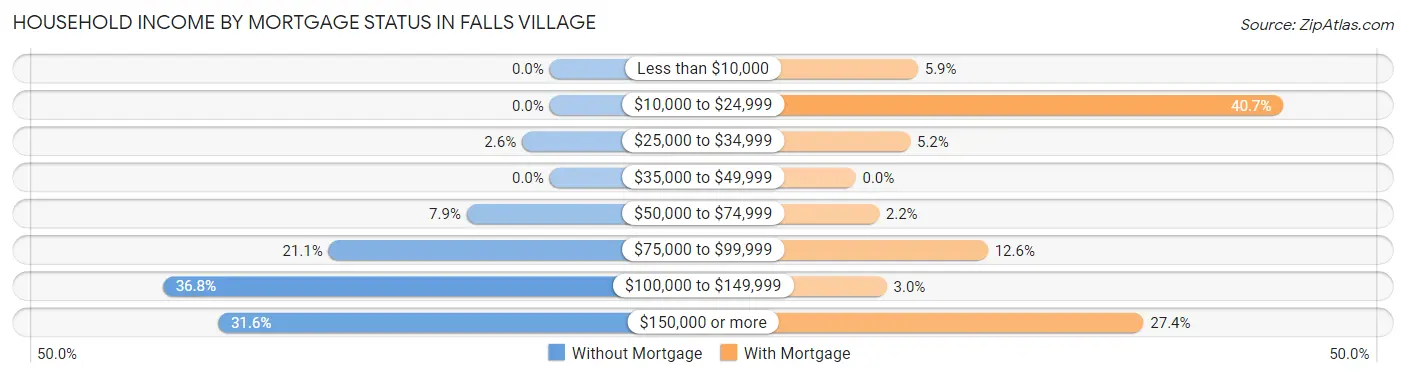
| Household Income | Without Mortgage | With Mortgage |
| Less than $10,000 | 0 (0.0%) | 8 (5.9%) |
| $10,000 to $24,999 | 0 (0.0%) | 55 (40.7%) |
| $25,000 to $34,999 | 1 (2.6%) | 7 (5.2%) |
| $35,000 to $49,999 | 0 (0.0%) | 0 (0.0%) |
| $50,000 to $74,999 | 3 (7.9%) | 3 (2.2%) |
| $75,000 to $99,999 | 8 (21.0%) | 17 (12.6%) |
| $100,000 to $149,999 | 14 (36.8%) | 4 (3.0%) |
| $150,000 or more | 12 (31.6%) | 37 (27.4%) |
| Total | 38 (100.0%) | 135 (100.0%) |
Property Value to Household Income Ratio in Falls Village
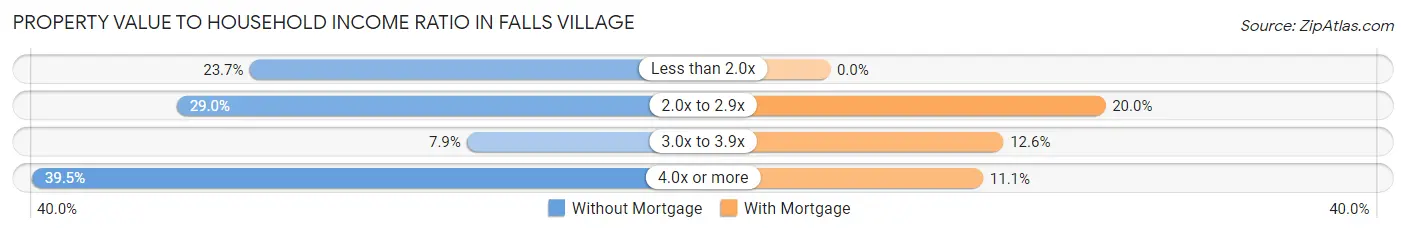
| Value-to-Income Ratio | Without Mortgage | With Mortgage |
| Less than 2.0x | 9 (23.7%) | 0 (0.0%) |
| 2.0x to 2.9x | 11 (28.9%) | 27 (20.0%) |
| 3.0x to 3.9x | 3 (7.9%) | 17 (12.6%) |
| 4.0x or more | 15 (39.5%) | 15 (11.1%) |
| Total | 38 (100.0%) | 135 (100.0%) |
Real Estate Taxes by Mortgage Status in Falls Village
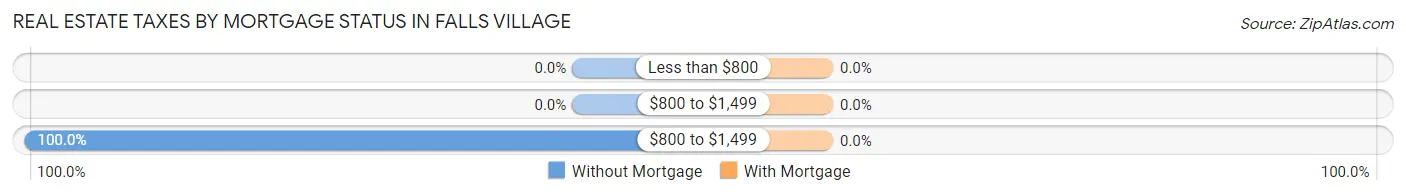
| Property Taxes | Without Mortgage | With Mortgage |
| Less than $800 | 0 (0.0%) | 0 (0.0%) |
| $800 to $1,499 | 0 (0.0%) | 0 (0.0%) |
| $800 to $1,499 | 38 (100.0%) | 0 (0.0%) |
| Total | 38 (100.0%) | 135 (100.0%) |
Health & Disability in Falls Village
Health Insurance Coverage by Age in Falls Village
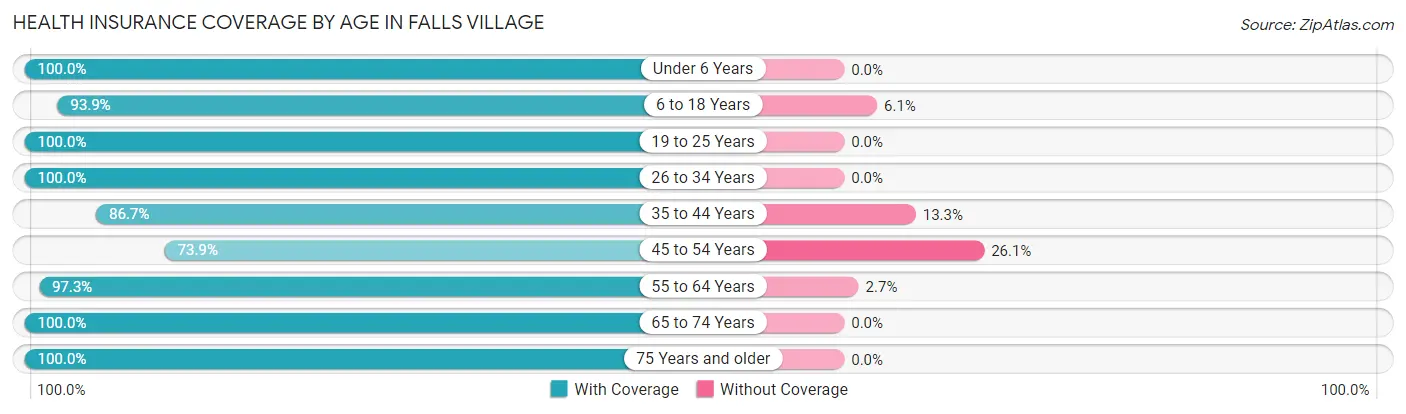
| Age Bracket | With Coverage | Without Coverage |
| Under 6 Years | 36 (100.0%) | 0 (0.0%) |
| 6 to 18 Years | 46 (93.9%) | 3 (6.1%) |
| 19 to 25 Years | 81 (100.0%) | 0 (0.0%) |
| 26 to 34 Years | 43 (100.0%) | 0 (0.0%) |
| 35 to 44 Years | 52 (86.7%) | 8 (13.3%) |
| 45 to 54 Years | 17 (73.9%) | 6 (26.1%) |
| 55 to 64 Years | 109 (97.3%) | 3 (2.7%) |
| 65 to 74 Years | 46 (100.0%) | 0 (0.0%) |
| 75 Years and older | 23 (100.0%) | 0 (0.0%) |
| Total | 453 (95.8%) | 20 (4.2%) |
Health Insurance Coverage by Citizenship Status in Falls Village
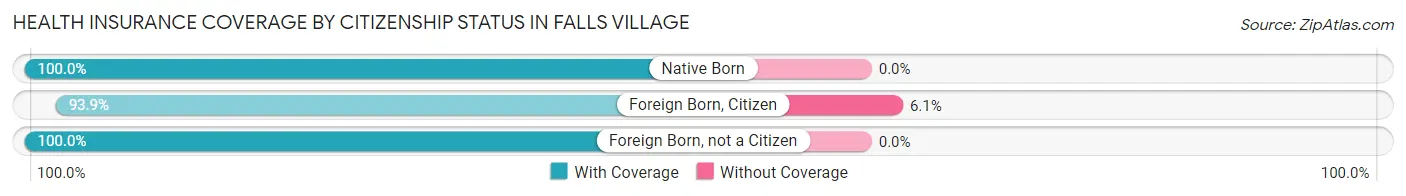
| Citizenship Status | With Coverage | Without Coverage |
| Native Born | 36 (100.0%) | 0 (0.0%) |
| Foreign Born, Citizen | 46 (93.9%) | 3 (6.1%) |
| Foreign Born, not a Citizen | 81 (100.0%) | 0 (0.0%) |
Health Insurance Coverage by Household Income in Falls Village
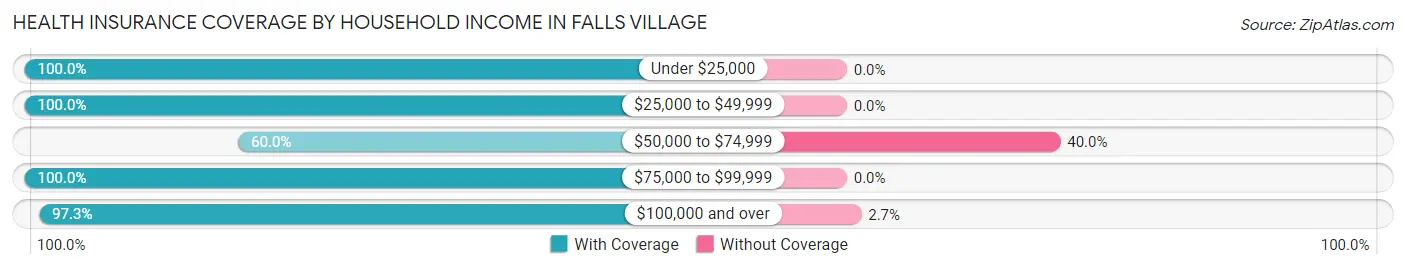
| Household Income | With Coverage | Without Coverage |
| Under $25,000 | 161 (100.0%) | 0 (0.0%) |
| $25,000 to $49,999 | 29 (100.0%) | 0 (0.0%) |
| $50,000 to $74,999 | 21 (60.0%) | 14 (40.0%) |
| $75,000 to $99,999 | 27 (100.0%) | 0 (0.0%) |
| $100,000 and over | 215 (97.3%) | 6 (2.7%) |
Public vs Private Health Insurance Coverage by Age in Falls Village
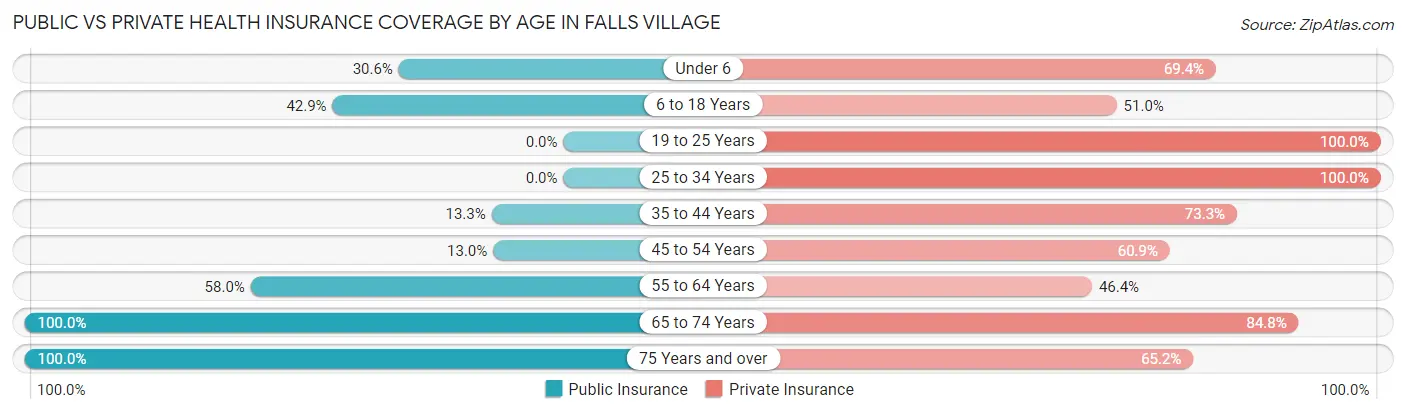
| Age Bracket | Public Insurance | Private Insurance |
| Under 6 | 11 (30.6%) | 25 (69.4%) |
| 6 to 18 Years | 21 (42.9%) | 25 (51.0%) |
| 19 to 25 Years | 0 (0.0%) | 81 (100.0%) |
| 25 to 34 Years | 0 (0.0%) | 43 (100.0%) |
| 35 to 44 Years | 8 (13.3%) | 44 (73.3%) |
| 45 to 54 Years | 3 (13.0%) | 14 (60.9%) |
| 55 to 64 Years | 65 (58.0%) | 52 (46.4%) |
| 65 to 74 Years | 46 (100.0%) | 39 (84.8%) |
| 75 Years and over | 23 (100.0%) | 15 (65.2%) |
| Total | 177 (37.4%) | 338 (71.5%) |
Disability Status by Sex by Age in Falls Village
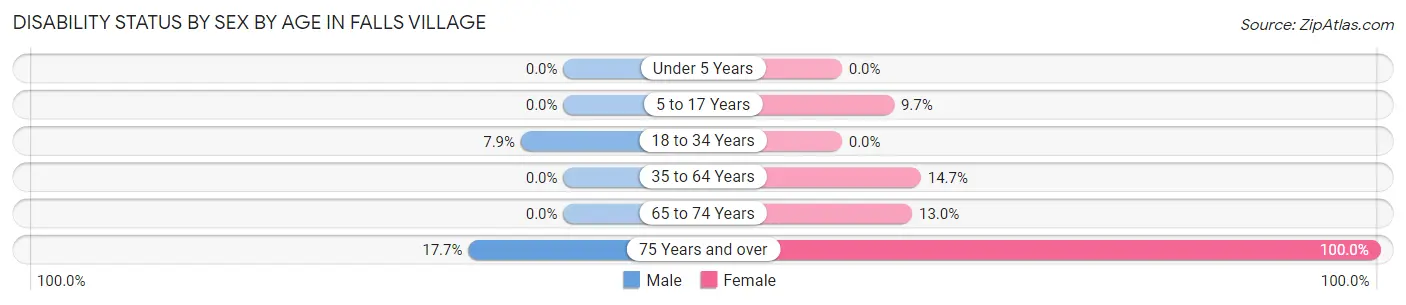
| Age Bracket | Male | Female |
| Under 5 Years | 0 (0.0%) | 0 (0.0%) |
| 5 to 17 Years | 0 (0.0%) | 3 (9.7%) |
| 18 to 34 Years | 3 (7.9%) | 0 (0.0%) |
| 35 to 64 Years | 0 (0.0%) | 11 (14.7%) |
| 65 to 74 Years | 0 (0.0%) | 3 (13.0%) |
| 75 Years and over | 3 (17.6%) | 6 (100.0%) |
Disability Class by Sex by Age in Falls Village
Disability Class: Hearing Difficulty
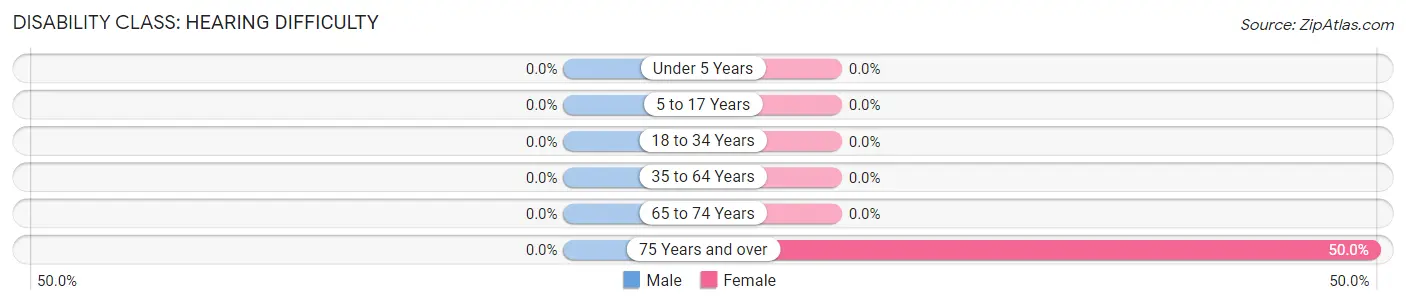
| Age Bracket | Male | Female |
| Under 5 Years | 0 (0.0%) | 0 (0.0%) |
| 5 to 17 Years | 0 (0.0%) | 0 (0.0%) |
| 18 to 34 Years | 0 (0.0%) | 0 (0.0%) |
| 35 to 64 Years | 0 (0.0%) | 0 (0.0%) |
| 65 to 74 Years | 0 (0.0%) | 0 (0.0%) |
| 75 Years and over | 0 (0.0%) | 3 (50.0%) |
Disability Class: Vision Difficulty
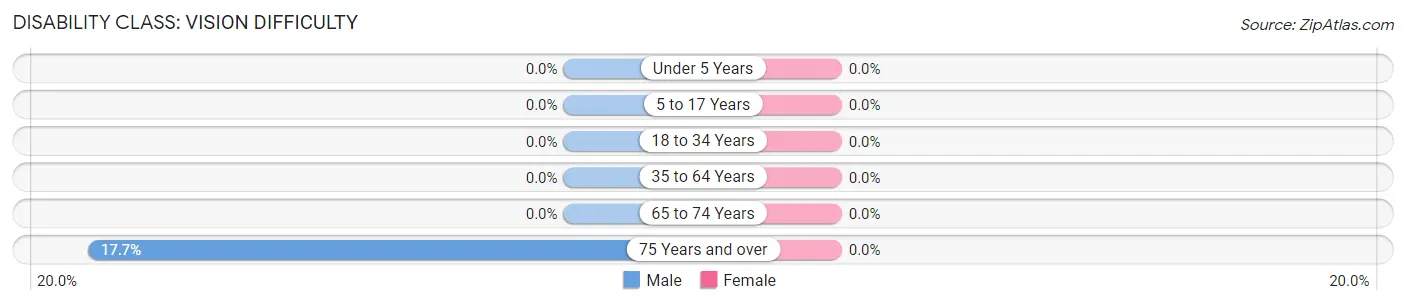
| Age Bracket | Male | Female |
| Under 5 Years | 0 (0.0%) | 0 (0.0%) |
| 5 to 17 Years | 0 (0.0%) | 0 (0.0%) |
| 18 to 34 Years | 0 (0.0%) | 0 (0.0%) |
| 35 to 64 Years | 0 (0.0%) | 0 (0.0%) |
| 65 to 74 Years | 0 (0.0%) | 0 (0.0%) |
| 75 Years and over | 3 (17.6%) | 0 (0.0%) |
Disability Class: Cognitive Difficulty
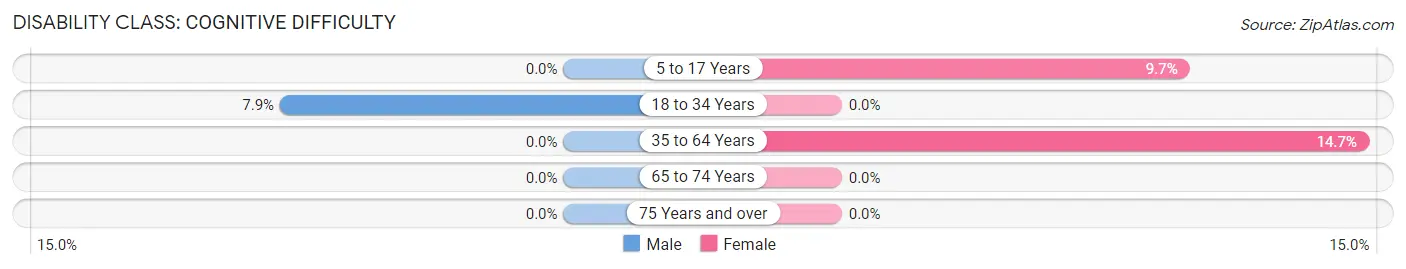
| Age Bracket | Male | Female |
| 5 to 17 Years | 0 (0.0%) | 3 (9.7%) |
| 18 to 34 Years | 3 (7.9%) | 0 (0.0%) |
| 35 to 64 Years | 0 (0.0%) | 11 (14.7%) |
| 65 to 74 Years | 0 (0.0%) | 0 (0.0%) |
| 75 Years and over | 0 (0.0%) | 0 (0.0%) |
Disability Class: Ambulatory Difficulty
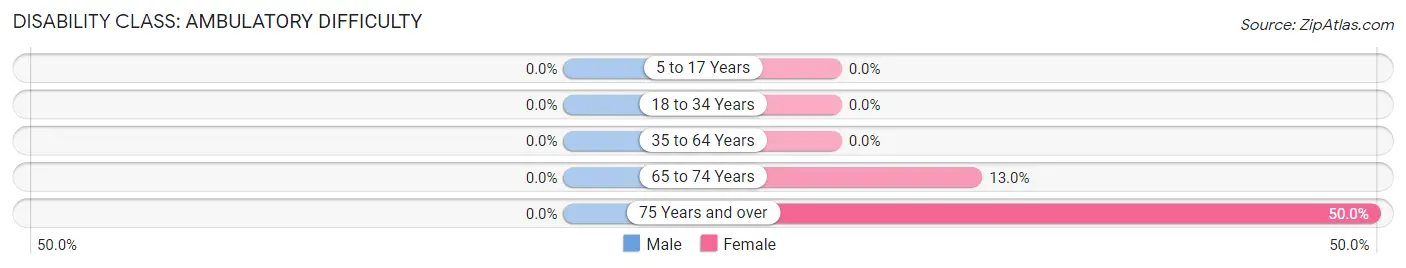
| Age Bracket | Male | Female |
| 5 to 17 Years | 0 (0.0%) | 0 (0.0%) |
| 18 to 34 Years | 0 (0.0%) | 0 (0.0%) |
| 35 to 64 Years | 0 (0.0%) | 0 (0.0%) |
| 65 to 74 Years | 0 (0.0%) | 3 (13.0%) |
| 75 Years and over | 0 (0.0%) | 3 (50.0%) |
Disability Class: Self-Care Difficulty
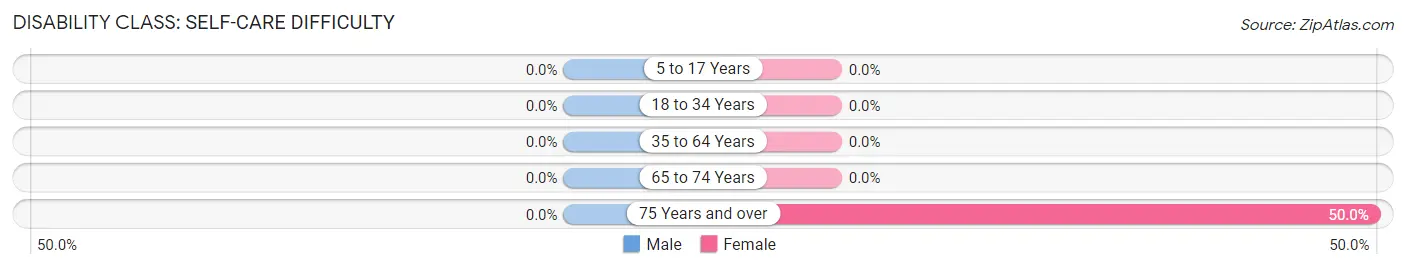
| Age Bracket | Male | Female |
| 5 to 17 Years | 0 (0.0%) | 0 (0.0%) |
| 18 to 34 Years | 0 (0.0%) | 0 (0.0%) |
| 35 to 64 Years | 0 (0.0%) | 0 (0.0%) |
| 65 to 74 Years | 0 (0.0%) | 0 (0.0%) |
| 75 Years and over | 0 (0.0%) | 3 (50.0%) |
Technology Access in Falls Village
Computing Device Access in Falls Village
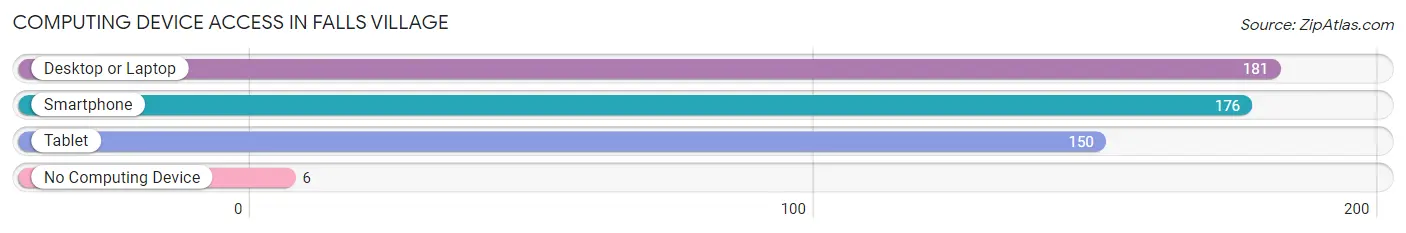
| Device Type | # Households | % Households |
| Desktop or Laptop | 181 | 95.3% |
| Smartphone | 176 | 92.6% |
| Tablet | 150 | 78.9% |
| No Computing Device | 6 | 3.2% |
| Total | 190 | 100.0% |
Internet Access in Falls Village
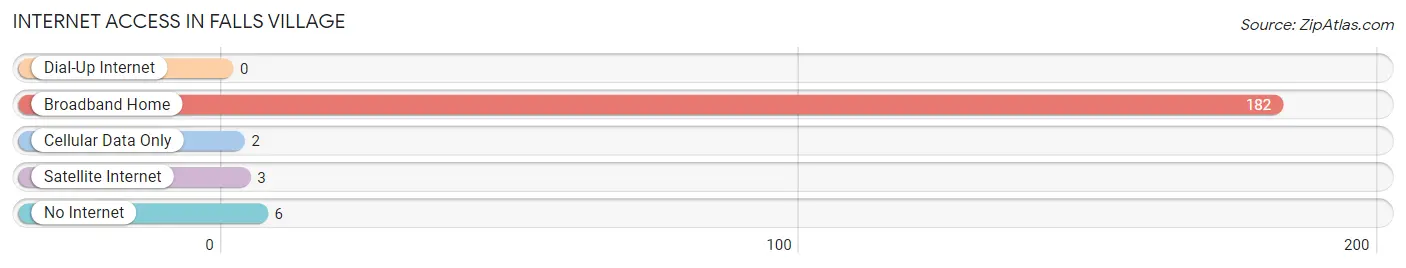
| Internet Type | # Households | % Households |
| Dial-Up Internet | 0 | 0.0% |
| Broadband Home | 182 | 95.8% |
| Cellular Data Only | 2 | 1.1% |
| Satellite Internet | 3 | 1.6% |
| No Internet | 6 | 3.2% |
| Total | 190 | 100.0% |
Falls Village Summary
Falls Village is a small town located in the northwest corner of Connecticut in Litchfield County. It is situated in the Housatonic River Valley, and is bordered by the towns of Canaan, Cornwall, Salisbury, and Norfolk. The town has a population of 1,719 people, according to the 2010 census.
History
Falls Village was first settled in 1750 by a group of settlers from Massachusetts. The town was originally known as Great Falls, and was incorporated in 1824. The town was named after the Great Falls of the Housatonic River, which is located in the center of the town. The falls were used to power several mills in the area, including a paper mill, a grist mill, and a saw mill.
The town was an important stop on the Housatonic Railroad, which ran from New York City to Pittsfield, Massachusetts. The railroad was completed in 1842, and was the first railroad in Connecticut. The railroad brought tourists to the area, and helped to spur the development of the town.
Geography
Falls Village is located in the Housatonic River Valley, and is bordered by the towns of Canaan, Cornwall, Salisbury, and Norfolk. The town is situated on the banks of the Housatonic River, and is surrounded by rolling hills and forests. The town is located in the foothills of the Berkshire Mountains, and is approximately 25 miles from the Massachusetts border.
The town has a total area of 8.3 square miles, of which 8.2 square miles is land and 0.1 square miles is water. The town is located in the Central Lowlands region of Connecticut, and is part of the Housatonic Valley region.
Economy
Falls Village is a rural town, and the economy is largely based on agriculture and tourism. The town is home to several small businesses, including a general store, a hardware store, and a restaurant. The town is also home to several small farms, which produce a variety of crops, including corn, hay, and vegetables.
The town is also home to several small manufacturing companies, including a paper mill, a grist mill, and a saw mill. The town is also home to several small art galleries, which feature the work of local artists.
Demographics
According to the 2010 census, Falls Village has a population of 1,719 people. The town has a median household income of $60,000, and a median family income of $68,000. The town has a poverty rate of 8.3%, and a median age of 44.7 years.
The town is predominantly white, with 92.3% of the population identifying as white. The town also has a small Hispanic population, with 4.2% of the population identifying as Hispanic or Latino. The town also has a small African American population, with 1.2% of the population identifying as African American.
Conclusion
Falls Village is a small town located in the northwest corner of Connecticut in Litchfield County. The town has a population of 1,719 people, and is situated in the Housatonic River Valley. The town was first settled in 1750, and was an important stop on the Housatonic Railroad. The town has a largely rural economy, and is home to several small businesses and farms. The town is predominantly white, with 92.3% of the population identifying as white. The town also has a small Hispanic population, with 4.2% of the population identifying as Hispanic or Latino. The town also has a small African American population, with 1.2% of the population identifying as African American.
Common Questions
What is Per Capita Income in Falls Village?
Per Capita income in Falls Village is $44,892.
What is Inequality or Gini Index in Falls Village?
Inequality or Gini Index in Falls Village is 0.60.
What is the Total Population of Falls Village?
Total Population of Falls Village is 473.
What is the Total Male Population of Falls Village?
Total Male Population of Falls Village is 240.
What is the Total Female Population of Falls Village?
Total Female Population of Falls Village is 233.
What is the Ratio of Males per 100 Females in Falls Village?
There are 103.00 Males per 100 Females in Falls Village.
What is the Ratio of Females per 100 Males in Falls Village?
There are 97.08 Females per 100 Males in Falls Village.
What is the Median Population Age in Falls Village?
Median Population Age in Falls Village is 43.1 Years.
What is the Average Family Size in Falls Village
Average Family Size in Falls Village is 2.8 People.
What is the Average Household Size in Falls Village
Average Household Size in Falls Village is 2.5 People.
How Large is the Labor Force in Falls Village?
There are 222 People in the Labor Forcein in Falls Village.
What is the Percentage of People in the Labor Force in Falls Village?
55.0% of People are in the Labor Force in Falls Village.
What is the Unemployment Rate in Falls Village?
Unemployment Rate in Falls Village is 1.4%.