Old Saybrook Center, CT Map & Demographics
Old Saybrook Center Map
Old Saybrook Center Overview
$72,434
PER CAPITA INCOME
$145,500
AVG FAMILY INCOME
$79,712
AVG HOUSEHOLD INCOME
16.3%
WAGE / INCOME GAP [ % ]
83.7¢/ $1
WAGE / INCOME GAP [ $ ]
0.52
INEQUALITY / GINI INDEX
2,017
TOTAL POPULATION
792
MALE POPULATION
1,225
FEMALE POPULATION
64.65
MALES / 100 FEMALES
154.67
FEMALES / 100 MALES
60.4
MEDIAN AGE
2.6
AVG FAMILY SIZE
1.8
AVG HOUSEHOLD SIZE
1,053
LABOR FORCE [ PEOPLE ]
56.5%
PERCENT IN LABOR FORCE
Income in Old Saybrook Center
Income Overview in Old Saybrook Center
Per Capita Income in Old Saybrook Center is $72,434, while median incomes of families and households are $145,500 and $79,712 respectively.
| Characteristic | Number | Measure |
| Per Capita Income | 2,017 | $72,434 |
| Median Family Income | 466 | $145,500 |
| Mean Family Income | 466 | $211,650 |
| Median Household Income | 1,132 | $79,712 |
| Mean Household Income | 1,132 | $127,263 |
| Income Deficit | 466 | $0 |
| Wage / Income Gap (%) | 2,017 | 16.32% |
| Wage / Income Gap ($) | 2,017 | 83.68¢ per $1 |
| Gini / Inequality Index | 2,017 | 0.52 |
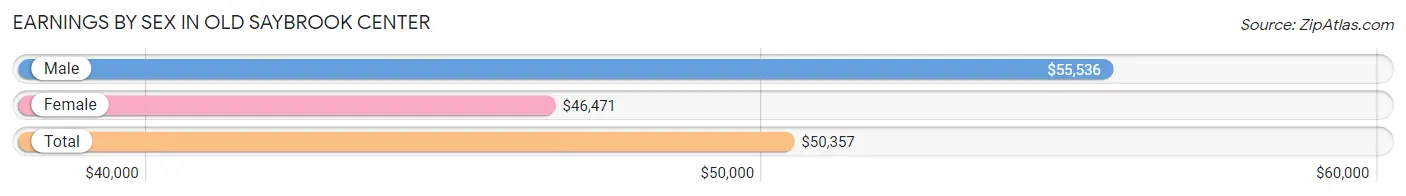
Earnings by Sex in Old Saybrook Center
Average Earnings in Old Saybrook Center are $50,357, $55,536 for men and $46,471 for women, a difference of 16.3%.
| Sex | Number | Average Earnings |
| Male | 406 (36.4%) | $55,536 |
| Female | 710 (63.6%) | $46,471 |
| Total | 1,116 (100.0%) | $50,357 |
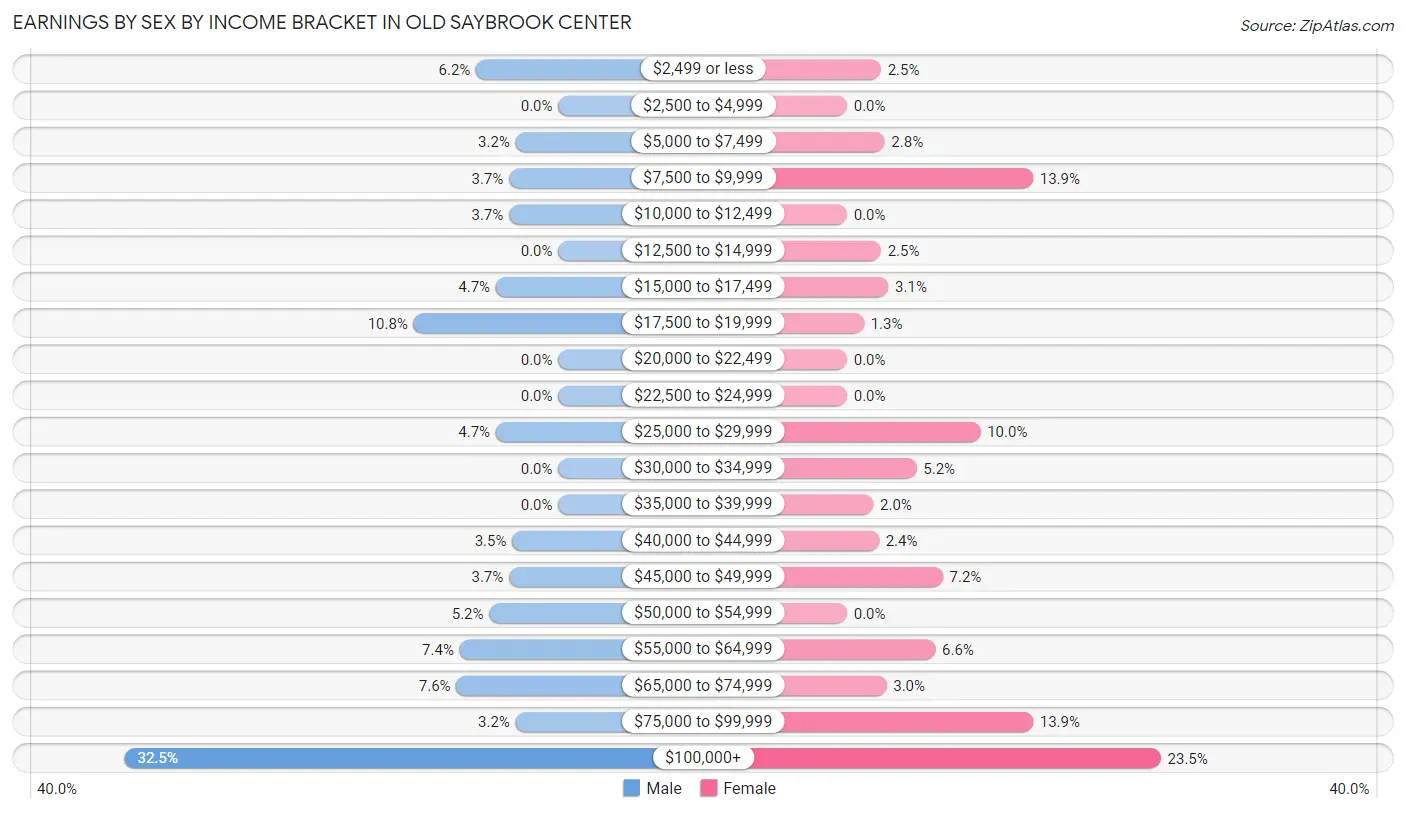
Earnings by Sex by Income Bracket in Old Saybrook Center
The most common earnings brackets in Old Saybrook Center are $100,000+ for men (132 | 32.5%) and $100,000+ for women (167 | 23.5%).
| Income | Male | Female |
| $2,499 or less | 25 (6.2%) | 18 (2.5%) |
| $2,500 to $4,999 | 0 (0.0%) | 0 (0.0%) |
| $5,000 to $7,499 | 13 (3.2%) | 20 (2.8%) |
| $7,500 to $9,999 | 15 (3.7%) | 99 (13.9%) |
| $10,000 to $12,499 | 15 (3.7%) | 0 (0.0%) |
| $12,500 to $14,999 | 0 (0.0%) | 18 (2.5%) |
| $15,000 to $17,499 | 19 (4.7%) | 22 (3.1%) |
| $17,500 to $19,999 | 44 (10.8%) | 9 (1.3%) |
| $20,000 to $22,499 | 0 (0.0%) | 0 (0.0%) |
| $22,500 to $24,999 | 0 (0.0%) | 0 (0.0%) |
| $25,000 to $29,999 | 19 (4.7%) | 71 (10.0%) |
| $30,000 to $34,999 | 0 (0.0%) | 37 (5.2%) |
| $35,000 to $39,999 | 0 (0.0%) | 14 (2.0%) |
| $40,000 to $44,999 | 14 (3.5%) | 17 (2.4%) |
| $45,000 to $49,999 | 15 (3.7%) | 51 (7.2%) |
| $50,000 to $54,999 | 21 (5.2%) | 0 (0.0%) |
| $55,000 to $64,999 | 30 (7.4%) | 47 (6.6%) |
| $65,000 to $74,999 | 31 (7.6%) | 21 (3.0%) |
| $75,000 to $99,999 | 13 (3.2%) | 99 (13.9%) |
| $100,000+ | 132 (32.5%) | 167 (23.5%) |
| Total | 406 (100.0%) | 710 (100.0%) |
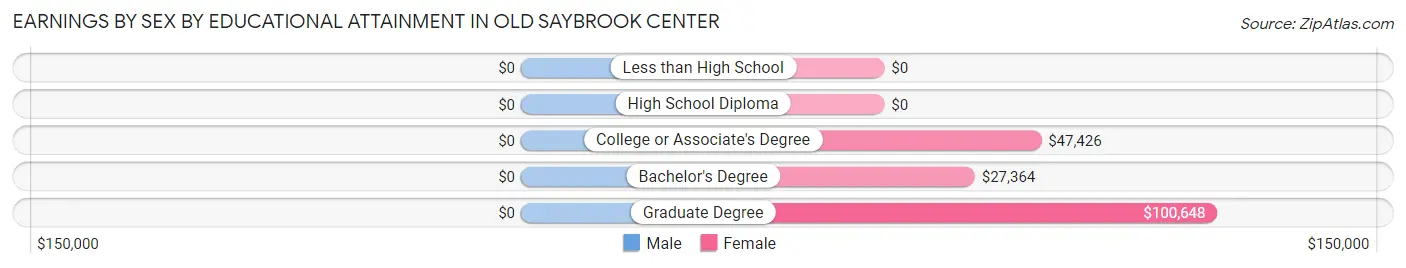
Earnings by Sex by Educational Attainment in Old Saybrook Center
| Educational Attainment | Male Income | Female Income |
| Less than High School | - | - |
| High School Diploma | - | - |
| College or Associate's Degree | - | - |
| Bachelor's Degree | - | - |
| Graduate Degree | - | - |
| Total | $59,375 | $46,569 |
Family Income in Old Saybrook Center
Family Income Brackets in Old Saybrook Center
According to the Old Saybrook Center family income data, there are 173 families falling into the $200,000+ income range, which is the most common income bracket and makes up 37.1% of all families.
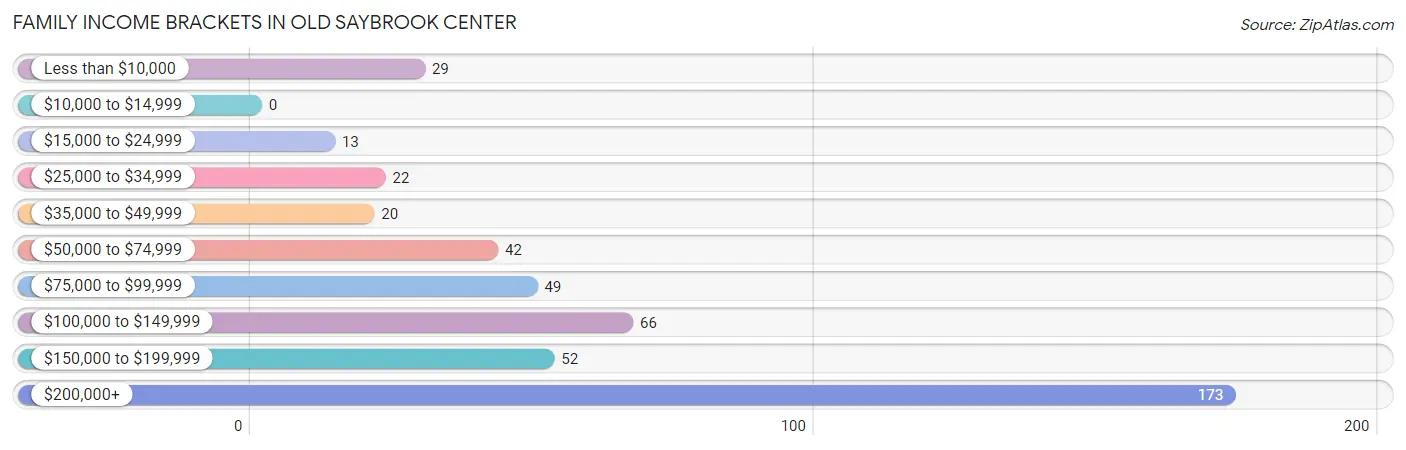
| Income Bracket | # Families | % Families |
| Less than $10,000 | 29 | 6.2% |
| $10,000 to $14,999 | 0 | 0.0% |
| $15,000 to $24,999 | 13 | 2.8% |
| $25,000 to $34,999 | 22 | 4.7% |
| $35,000 to $49,999 | 20 | 4.3% |
| $50,000 to $74,999 | 42 | 9.0% |
| $75,000 to $99,999 | 49 | 10.5% |
| $100,000 to $149,999 | 66 | 14.2% |
| $150,000 to $199,999 | 52 | 11.2% |
| $200,000+ | 173 | 37.1% |
Family Income by Famaliy Size in Old Saybrook Center
4-person families (95 | 20.4%) account for the highest median family income in Old Saybrook Center with $209,861 per family, while 4-person families (95 | 20.4%) have the highest median income of $52,465 per family member.
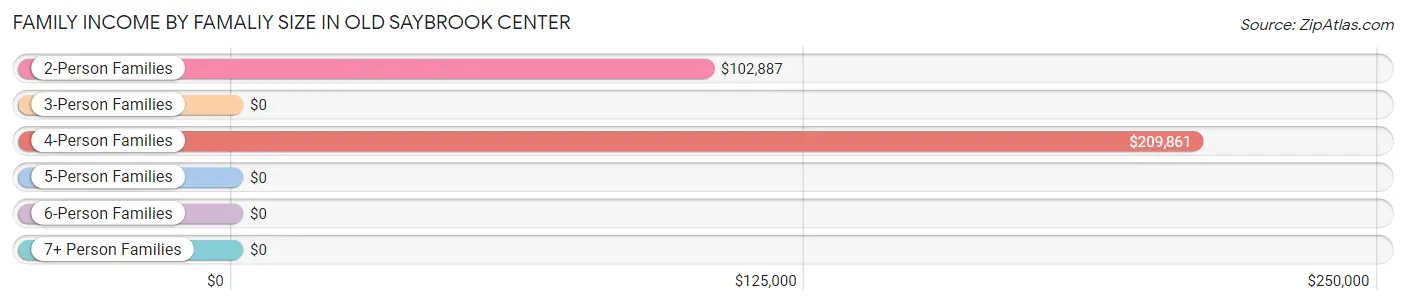
| Income Bracket | # Families | Median Income |
| 2-Person Families | 319 (68.4%) | $102,887 |
| 3-Person Families | 31 (6.7%) | $0 |
| 4-Person Families | 95 (20.4%) | $209,861 |
| 5-Person Families | 21 (4.5%) | $0 |
| 6-Person Families | 0 (0.0%) | $0 |
| 7+ Person Families | 0 (0.0%) | $0 |
| Total | 466 (100.0%) | $145,500 |
Family Income by Number of Earners in Old Saybrook Center
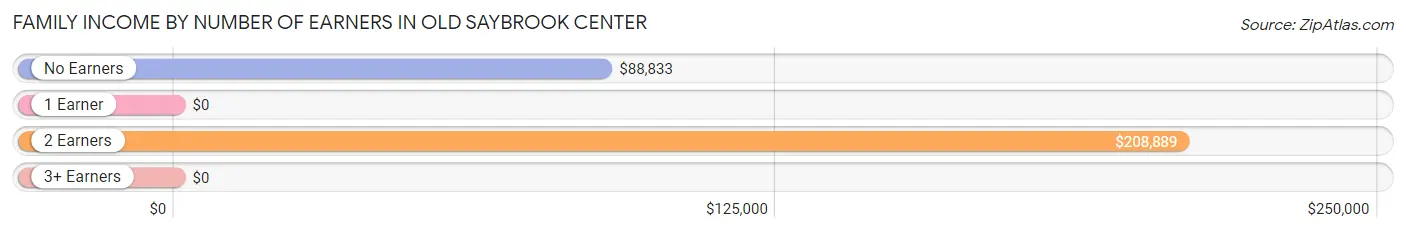
| Number of Earners | # Families | Median Income |
| No Earners | 154 (33.1%) | $88,833 |
| 1 Earner | 43 (9.2%) | $0 |
| 2 Earners | 236 (50.6%) | $208,889 |
| 3+ Earners | 33 (7.1%) | $0 |
| Total | 466 (100.0%) | $145,500 |
Household Income in Old Saybrook Center
Household Income Brackets in Old Saybrook Center
With 234 households falling in the category, the $75,000 to $99,999 income range is the most frequent in Old Saybrook Center, accounting for 20.7% of all households.
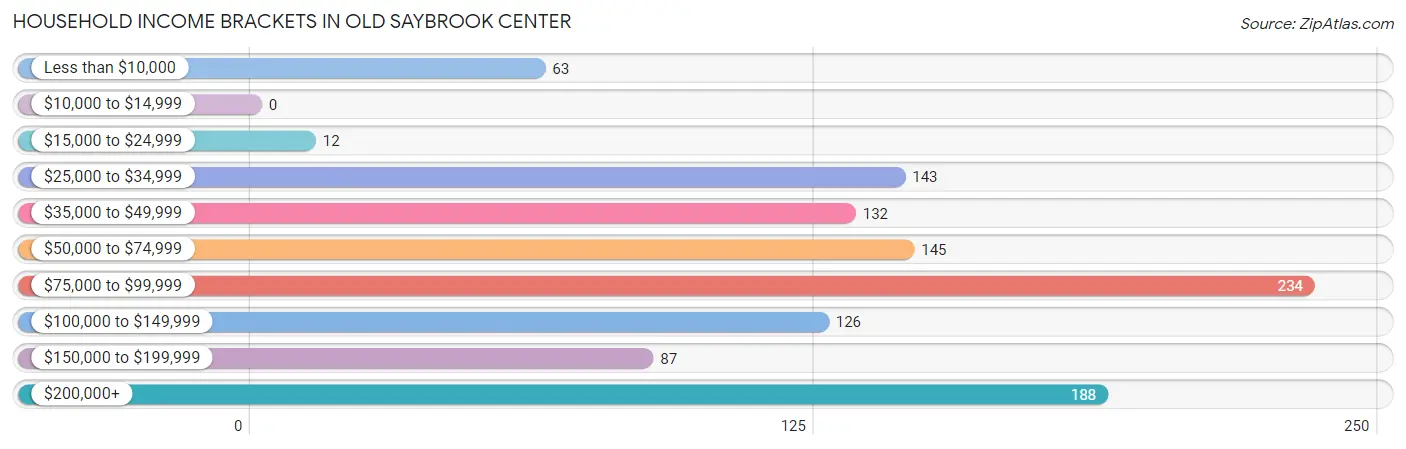
| Income Bracket | # Households | % Households |
| Less than $10,000 | 63 | 5.6% |
| $10,000 to $14,999 | 0 | 0.0% |
| $15,000 to $24,999 | 12 | 1.1% |
| $25,000 to $34,999 | 143 | 12.6% |
| $35,000 to $49,999 | 132 | 11.7% |
| $50,000 to $74,999 | 145 | 12.8% |
| $75,000 to $99,999 | 234 | 20.7% |
| $100,000 to $149,999 | 126 | 11.1% |
| $150,000 to $199,999 | 87 | 7.7% |
| $200,000+ | 188 | 16.6% |
Household Income by Householder Age in Old Saybrook Center
The median household income in Old Saybrook Center is $79,712, with the highest median household income of $89,917 found in the 45 to 64 years age bracket for the primary householder. A total of 407 households (35.9%) fall into this category. Meanwhile, the 15 to 24 years age bracket for the primary householder has the lowest median household income of $0, with 14 households (1.2%) in this group.
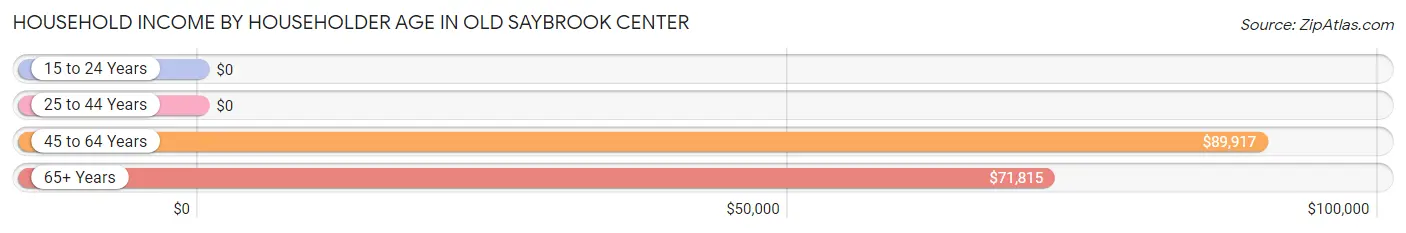
| Income Bracket | # Households | Median Income |
| 15 to 24 Years | 14 (1.2%) | $0 |
| 25 to 44 Years | 158 (14.0%) | $0 |
| 45 to 64 Years | 407 (35.9%) | $89,917 |
| 65+ Years | 553 (48.8%) | $71,815 |
| Total | 1,132 (100.0%) | $79,712 |
Poverty in Old Saybrook Center
Income Below Poverty by Sex and Age in Old Saybrook Center
With 4.0% poverty level for males and 5.4% for females among the residents of Old Saybrook Center, 75 year old and over males and 75 year old and over females are the most vulnerable to poverty, with 29 males (14.1%) and 63 females (18.7%) in their respective age groups living below the poverty level.
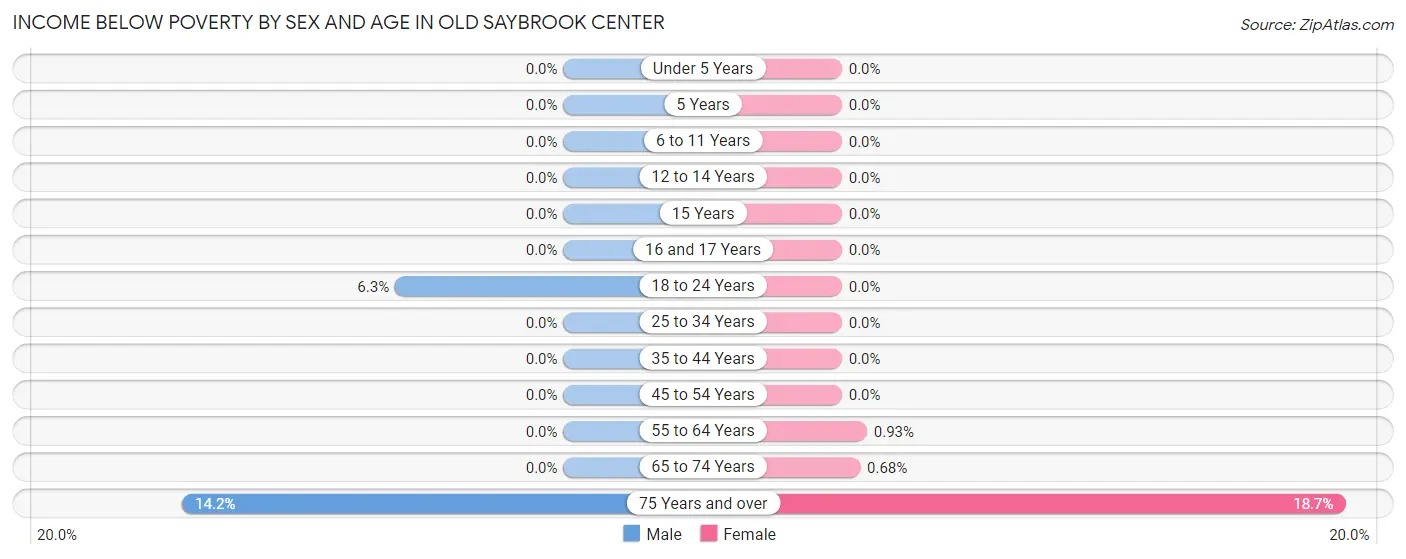
| Age Bracket | Male | Female |
| Under 5 Years | 0 (0.0%) | 0 (0.0%) |
| 5 Years | 0 (0.0%) | 0 (0.0%) |
| 6 to 11 Years | 0 (0.0%) | 0 (0.0%) |
| 12 to 14 Years | 0 (0.0%) | 0 (0.0%) |
| 15 Years | 0 (0.0%) | 0 (0.0%) |
| 16 and 17 Years | 0 (0.0%) | 0 (0.0%) |
| 18 to 24 Years | 3 (6.2%) | 0 (0.0%) |
| 25 to 34 Years | 0 (0.0%) | 0 (0.0%) |
| 35 to 44 Years | 0 (0.0%) | 0 (0.0%) |
| 45 to 54 Years | 0 (0.0%) | 0 (0.0%) |
| 55 to 64 Years | 0 (0.0%) | 2 (0.9%) |
| 65 to 74 Years | 0 (0.0%) | 1 (0.7%) |
| 75 Years and over | 29 (14.1%) | 63 (18.7%) |
| Total | 32 (4.0%) | 66 (5.4%) |
Income Above Poverty by Sex and Age in Old Saybrook Center
According to the poverty statistics in Old Saybrook Center, males aged under 5 years and females aged under 5 years are the age groups that are most secure financially, with 100.0% of males and 100.0% of females in these age groups living above the poverty line.
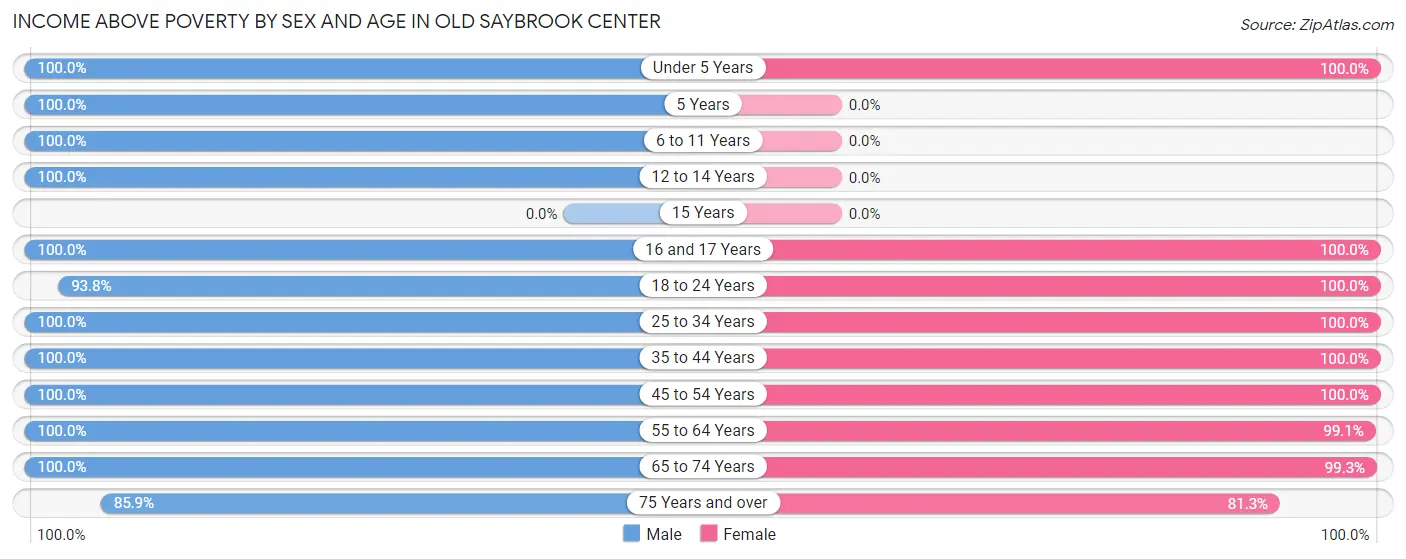
| Age Bracket | Male | Female |
| Under 5 Years | 22 (100.0%) | 63 (100.0%) |
| 5 Years | 27 (100.0%) | 0 (0.0%) |
| 6 to 11 Years | 26 (100.0%) | 0 (0.0%) |
| 12 to 14 Years | 15 (100.0%) | 0 (0.0%) |
| 15 Years | 0 (0.0%) | 0 (0.0%) |
| 16 and 17 Years | 51 (100.0%) | 38 (100.0%) |
| 18 to 24 Years | 45 (93.8%) | 14 (100.0%) |
| 25 to 34 Years | 63 (100.0%) | 157 (100.0%) |
| 35 to 44 Years | 78 (100.0%) | 69 (100.0%) |
| 45 to 54 Years | 61 (100.0%) | 184 (100.0%) |
| 55 to 64 Years | 87 (100.0%) | 214 (99.1%) |
| 65 to 74 Years | 109 (100.0%) | 146 (99.3%) |
| 75 Years and over | 176 (85.9%) | 274 (81.3%) |
| Total | 760 (96.0%) | 1,159 (94.6%) |
Income Below Poverty Among Married-Couple Families in Old Saybrook Center
The poverty statistics for married-couple families in Old Saybrook Center show that 7.0% or 29 of the total 412 families live below the poverty line. Families with no children have the highest poverty rate of 9.1%, comprising of 29 families. On the other hand, families with 1 or 2 children have the lowest poverty rate of 0.0%, which includes 0 families.
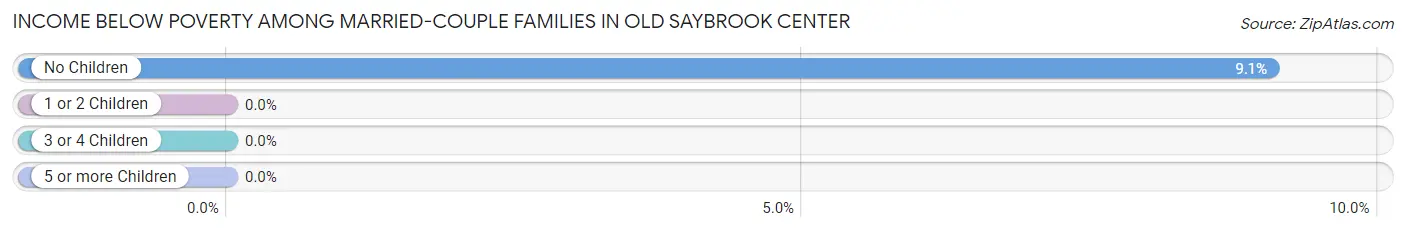
| Children | Above Poverty | Below Poverty |
| No Children | 291 (90.9%) | 29 (9.1%) |
| 1 or 2 Children | 92 (100.0%) | 0 (0.0%) |
| 3 or 4 Children | 0 (0.0%) | 0 (0.0%) |
| 5 or more Children | 0 (0.0%) | 0 (0.0%) |
| Total | 383 (93.0%) | 29 (7.0%) |
Income Below Poverty Among Single-Parent Households in Old Saybrook Center
| Children | Single Father | Single Mother |
| No Children | 0 (0.0%) | 0 (0.0%) |
| 1 or 2 Children | 0 (0.0%) | 0 (0.0%) |
| 3 or 4 Children | 0 (0.0%) | 0 (0.0%) |
| 5 or more Children | 0 (0.0%) | 0 (0.0%) |
| Total | 0 (0.0%) | 0 (0.0%) |
Income Below Poverty Among Married-Couple vs Single-Parent Households in Old Saybrook Center
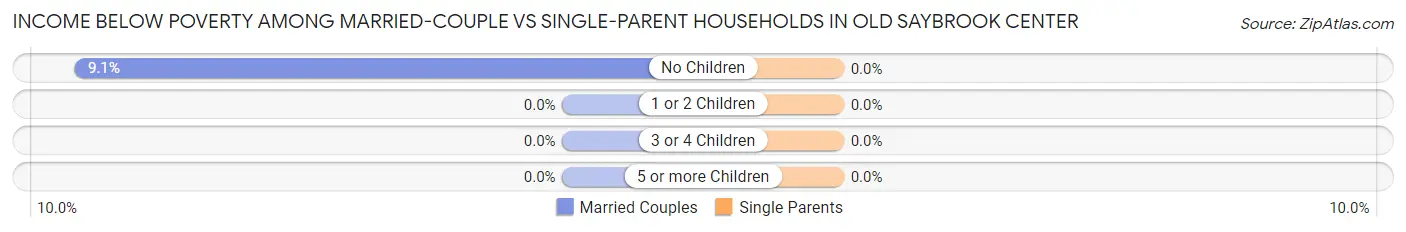
| Children | Married-Couple Families | Single-Parent Households |
| No Children | 29 (9.1%) | 0 (0.0%) |
| 1 or 2 Children | 0 (0.0%) | 0 (0.0%) |
| 3 or 4 Children | 0 (0.0%) | 0 (0.0%) |
| 5 or more Children | 0 (0.0%) | 0 (0.0%) |
| Total | 29 (7.0%) | 0 (0.0%) |
Race in Old Saybrook Center
The most populous races in Old Saybrook Center are White / Caucasian (1,955 | 96.9%), Hispanic or Latino (84 | 4.2%), and Asian (47 | 2.3%).
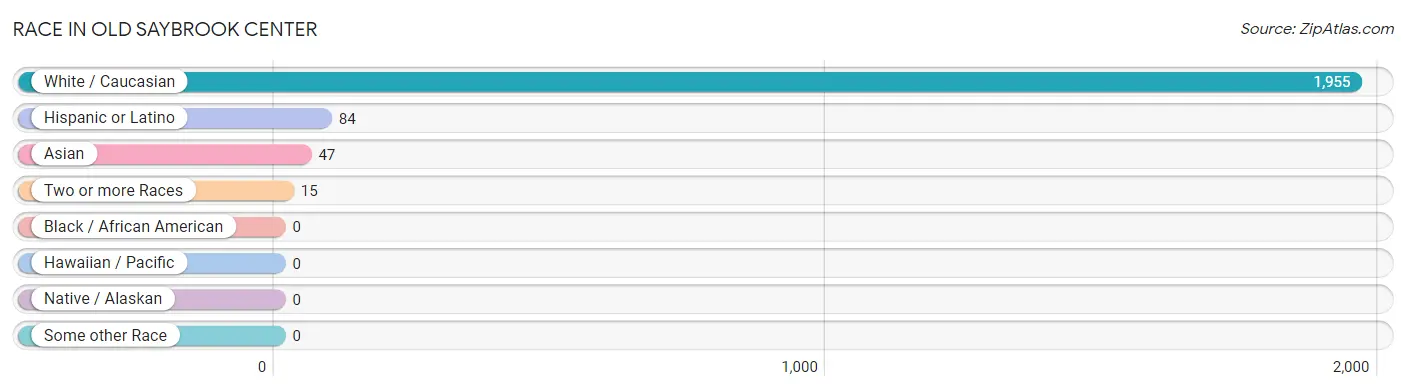
| Race | # Population | % Population |
| Asian | 47 | 2.3% |
| Black / African American | 0 | 0.0% |
| Hawaiian / Pacific | 0 | 0.0% |
| Hispanic or Latino | 84 | 4.2% |
| Native / Alaskan | 0 | 0.0% |
| White / Caucasian | 1,955 | 96.9% |
| Two or more Races | 15 | 0.7% |
| Some other Race | 0 | 0.0% |
| Total | 2,017 | 100.0% |
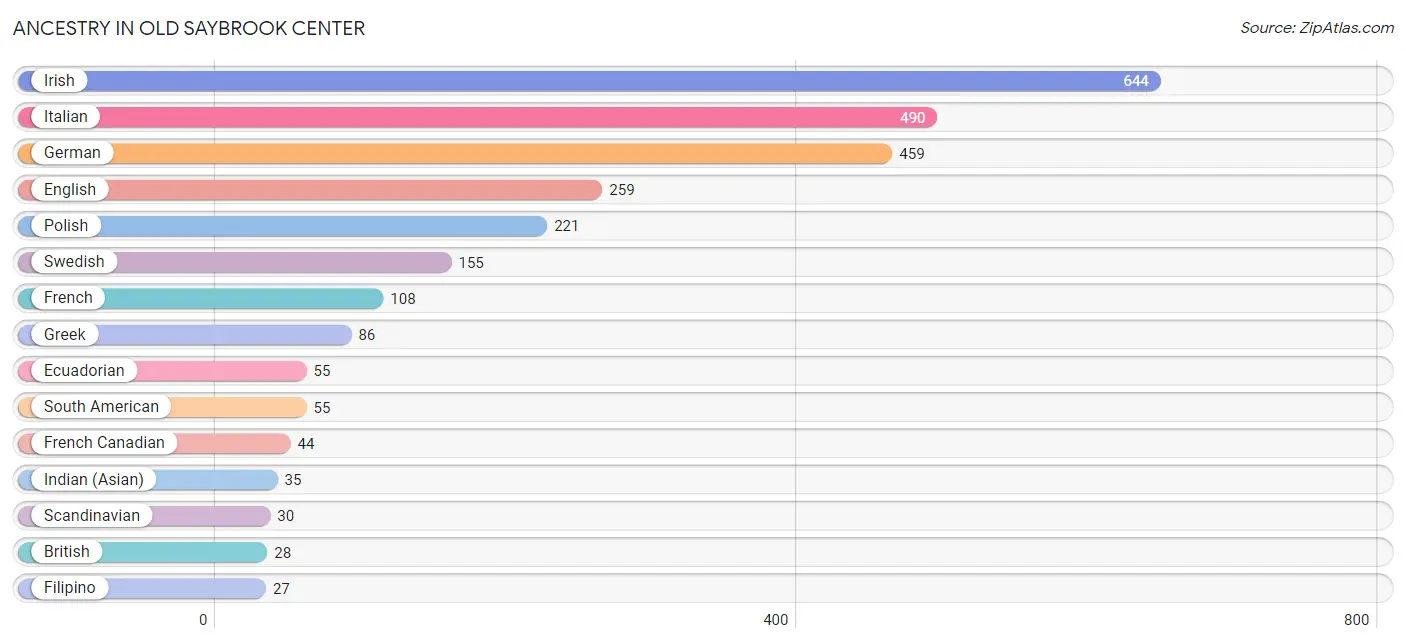
Ancestry in Old Saybrook Center
The most populous ancestries reported in Old Saybrook Center are Irish (644 | 31.9%), Italian (490 | 24.3%), German (459 | 22.8%), English (259 | 12.8%), and Polish (221 | 11.0%), together accounting for 102.8% of all Old Saybrook Center residents.
| Ancestry | # Population | % Population |
| American | 17 | 0.8% |
| British | 28 | 1.4% |
| Czechoslovakian | 15 | 0.7% |
| Dutch | 23 | 1.1% |
| Eastern European | 16 | 0.8% |
| Ecuadorian | 55 | 2.7% |
| English | 259 | 12.8% |
| Filipino | 27 | 1.3% |
| Finnish | 22 | 1.1% |
| French | 108 | 5.3% |
| French Canadian | 44 | 2.2% |
| German | 459 | 22.8% |
| Greek | 86 | 4.3% |
| Indian (Asian) | 35 | 1.7% |
| Irish | 644 | 31.9% |
| Italian | 490 | 24.3% |
| Polish | 221 | 11.0% |
| Puerto Rican | 20 | 1.0% |
| Russian | 16 | 0.8% |
| Scandinavian | 30 | 1.5% |
| Scotch-Irish | 18 | 0.9% |
| Scottish | 13 | 0.6% |
| South American | 55 | 2.7% |
| Spaniard | 9 | 0.4% |
| Swedish | 155 | 7.7% | View All 25 Rows |
Immigrants in Old Saybrook Center
The most numerous immigrant groups reported in Old Saybrook Center came from Europe (81 | 4.0%), Ecuador (55 | 2.7%), Latin America (55 | 2.7%), South America (55 | 2.7%), and Asia (47 | 2.3%), together accounting for 14.5% of all Old Saybrook Center residents.
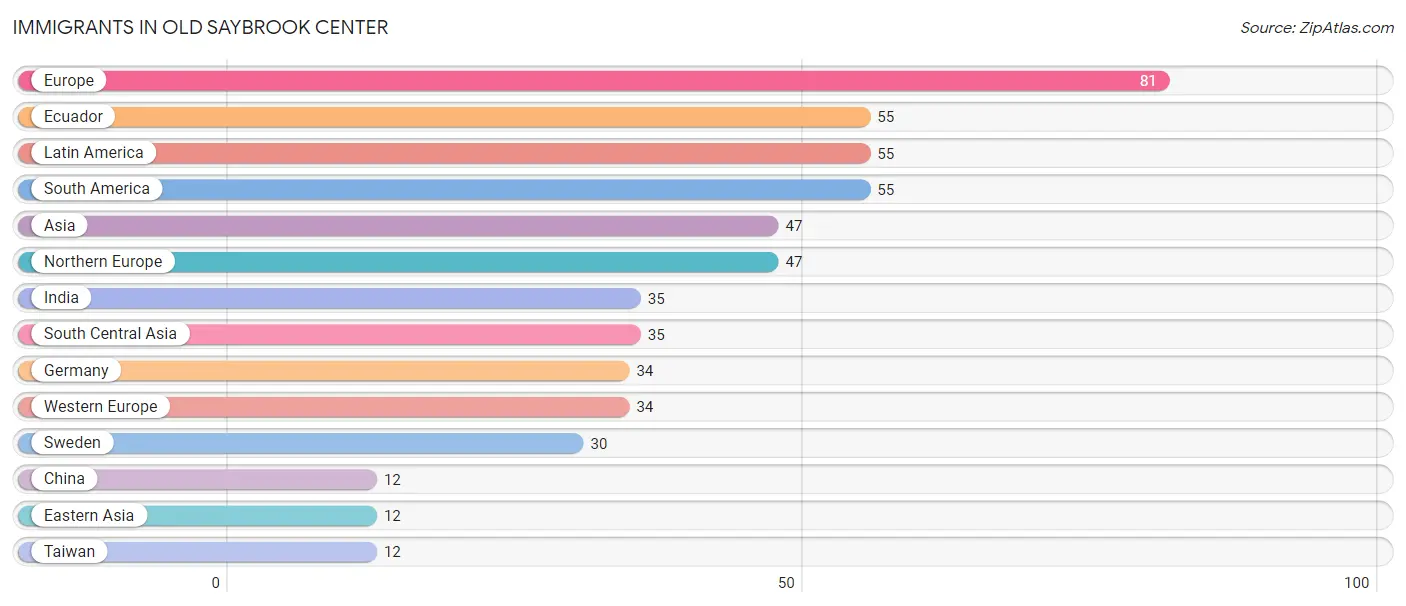
| Immigration Origin | # Population | % Population |
| Asia | 47 | 2.3% |
| China | 12 | 0.6% |
| Eastern Asia | 12 | 0.6% |
| Ecuador | 55 | 2.7% |
| Europe | 81 | 4.0% |
| Germany | 34 | 1.7% |
| India | 35 | 1.7% |
| Latin America | 55 | 2.7% |
| Northern Europe | 47 | 2.3% |
| South America | 55 | 2.7% |
| South Central Asia | 35 | 1.7% |
| Sweden | 30 | 1.5% |
| Taiwan | 12 | 0.6% |
| Western Europe | 34 | 1.7% | View All 14 Rows |
Sex and Age in Old Saybrook Center
Sex and Age in Old Saybrook Center
The most populous age groups in Old Saybrook Center are 75 to 79 Years (140 | 17.7%) for men and 75 to 79 Years (212 | 17.3%) for women.
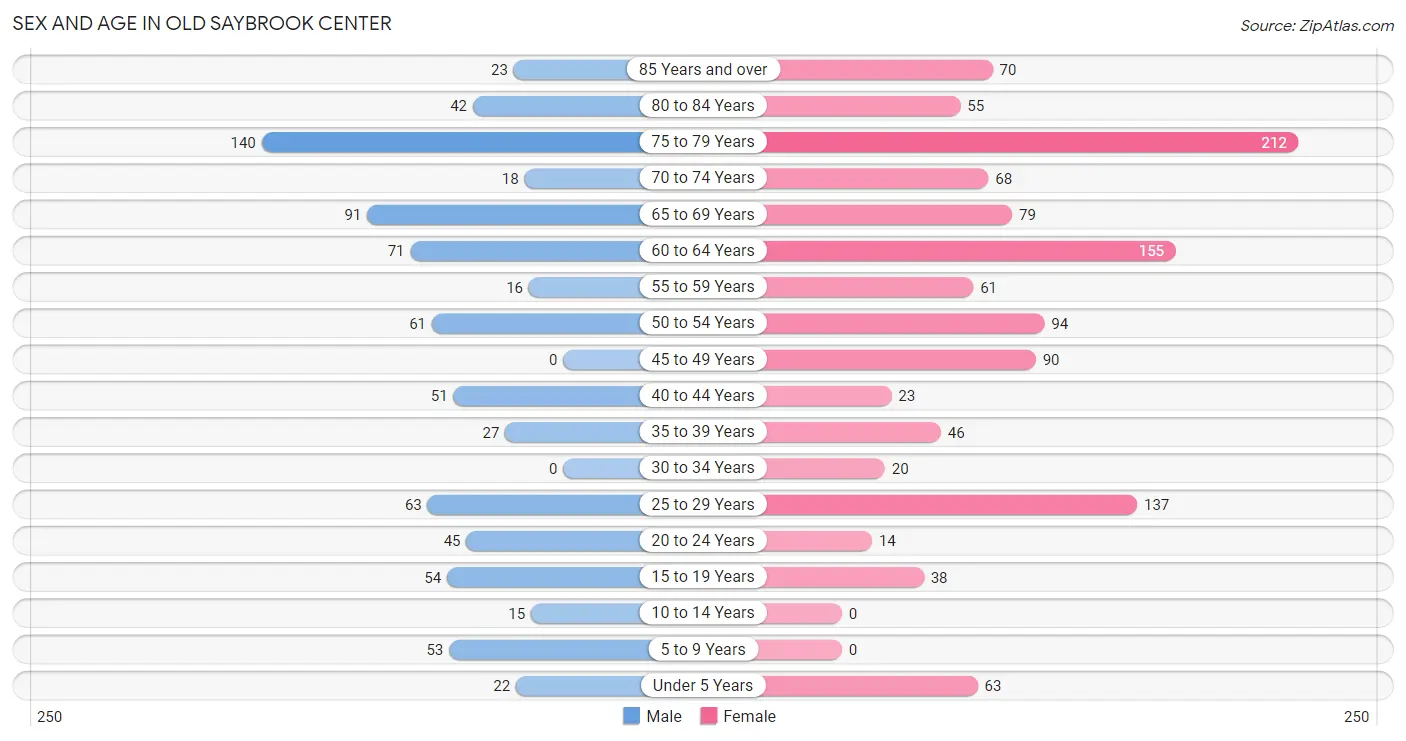
| Age Bracket | Male | Female |
| Under 5 Years | 22 (2.8%) | 63 (5.1%) |
| 5 to 9 Years | 53 (6.7%) | 0 (0.0%) |
| 10 to 14 Years | 15 (1.9%) | 0 (0.0%) |
| 15 to 19 Years | 54 (6.8%) | 38 (3.1%) |
| 20 to 24 Years | 45 (5.7%) | 14 (1.1%) |
| 25 to 29 Years | 63 (8.0%) | 137 (11.2%) |
| 30 to 34 Years | 0 (0.0%) | 20 (1.6%) |
| 35 to 39 Years | 27 (3.4%) | 46 (3.8%) |
| 40 to 44 Years | 51 (6.4%) | 23 (1.9%) |
| 45 to 49 Years | 0 (0.0%) | 90 (7.3%) |
| 50 to 54 Years | 61 (7.7%) | 94 (7.7%) |
| 55 to 59 Years | 16 (2.0%) | 61 (5.0%) |
| 60 to 64 Years | 71 (9.0%) | 155 (12.7%) |
| 65 to 69 Years | 91 (11.5%) | 79 (6.5%) |
| 70 to 74 Years | 18 (2.3%) | 68 (5.6%) |
| 75 to 79 Years | 140 (17.7%) | 212 (17.3%) |
| 80 to 84 Years | 42 (5.3%) | 55 (4.5%) |
| 85 Years and over | 23 (2.9%) | 70 (5.7%) |
| Total | 792 (100.0%) | 1,225 (100.0%) |
Families and Households in Old Saybrook Center
Median Family Size in Old Saybrook Center
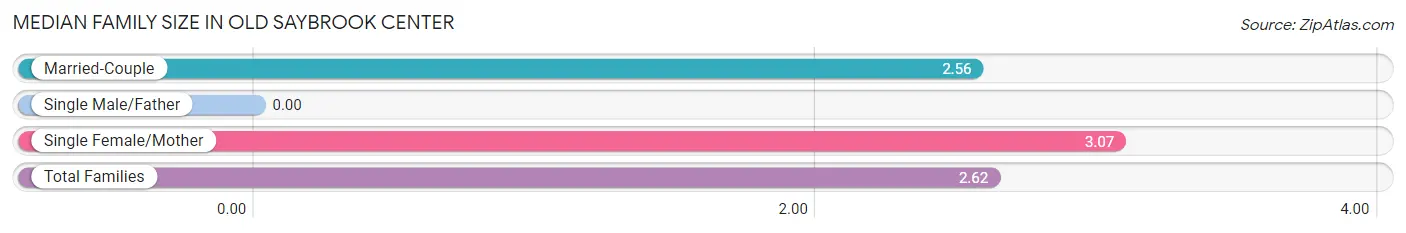
| Family Type | # Families | Family Size |
| Married-Couple | 412 (88.4%) | 2.56 |
| Single Male/Father | 0 (0.0%) | - |
| Single Female/Mother | 54 (11.6%) | 3.07 |
| Total Families | 466 (100.0%) | 2.62 |
Median Household Size in Old Saybrook Center
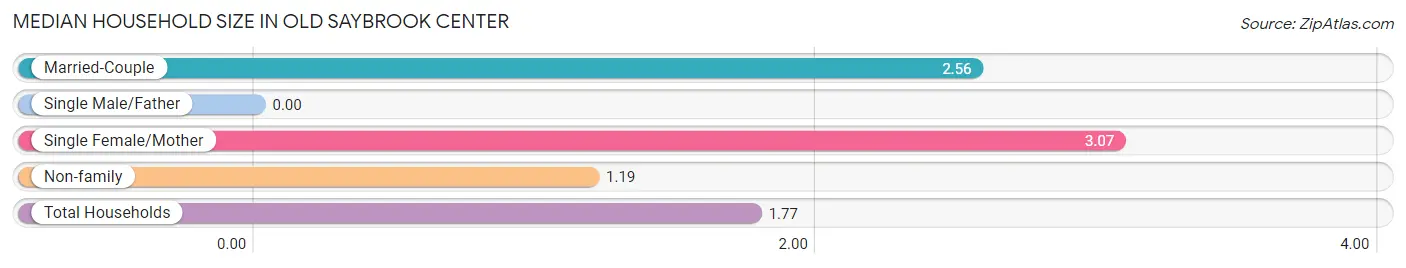
| Household Type | # Households | Household Size |
| Married-Couple | 412 (36.4%) | 2.56 |
| Single Male/Father | 0 (0.0%) | - |
| Single Female/Mother | 54 (4.8%) | 3.07 |
| Non-family | 666 (58.8%) | 1.19 |
| Total Households | 1,132 (100.0%) | 1.77 |
Household Size by Marriage Status in Old Saybrook Center
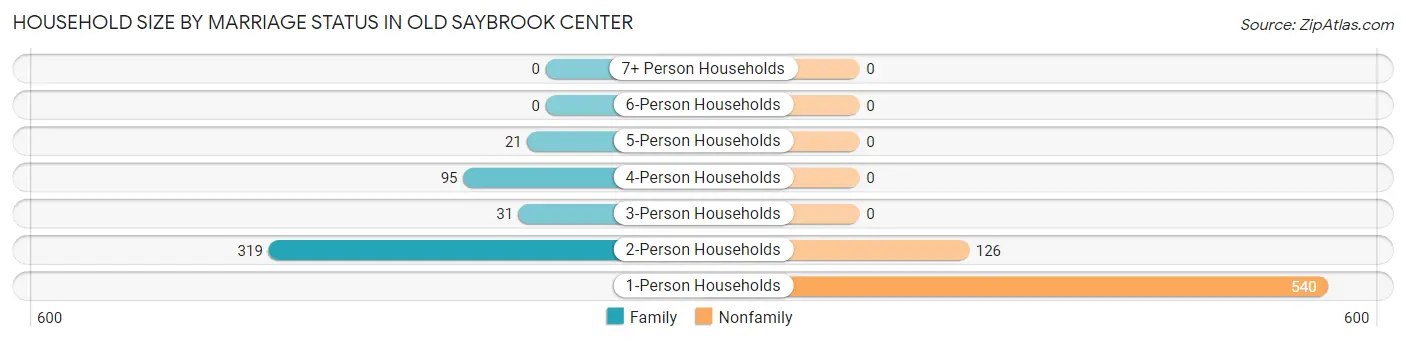
Out of a total of 1,132 households in Old Saybrook Center, 466 (41.2%) are family households, while 666 (58.8%) are nonfamily households. The most numerous type of family households are 2-person households, comprising 319, and the most common type of nonfamily households are 1-person households, comprising 540.
| Household Size | Family Households | Nonfamily Households |
| 1-Person Households | - | 540 (47.7%) |
| 2-Person Households | 319 (28.2%) | 126 (11.1%) |
| 3-Person Households | 31 (2.7%) | 0 (0.0%) |
| 4-Person Households | 95 (8.4%) | 0 (0.0%) |
| 5-Person Households | 21 (1.9%) | 0 (0.0%) |
| 6-Person Households | 0 (0.0%) | 0 (0.0%) |
| 7+ Person Households | 0 (0.0%) | 0 (0.0%) |
| Total | 466 (41.2%) | 666 (58.8%) |
Female Fertility in Old Saybrook Center
Fertility by Age in Old Saybrook Center
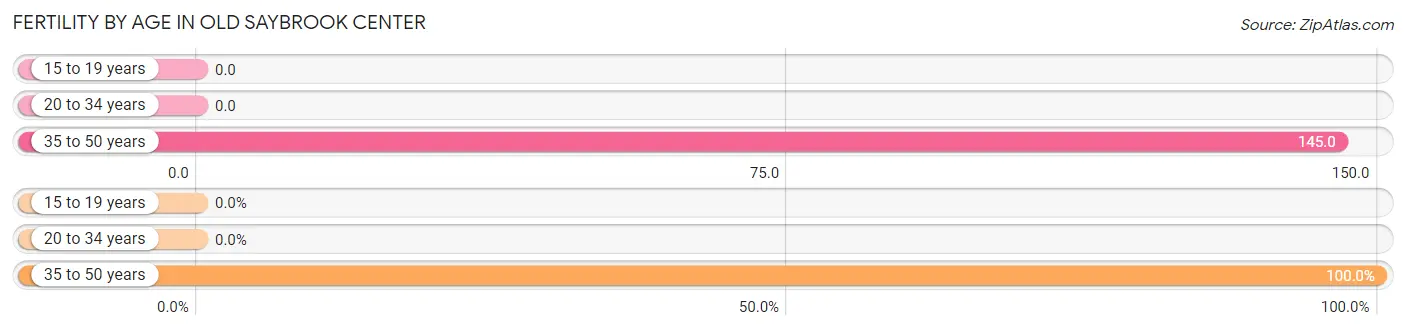
Average fertility rate in Old Saybrook Center is 63.0 births per 1,000 women. Women in the age bracket of 35 to 50 years have the highest fertility rate with 145.0 births per 1,000 women. Women in the age bracket of 35 to 50 years acount for 100.0% of all women with births.
| Age Bracket | Women with Births | Births / 1,000 Women |
| 15 to 19 years | 0 (0.0%) | 0.0 |
| 20 to 34 years | 0 (0.0%) | 0.0 |
| 35 to 50 years | 23 (100.0%) | 145.0 |
| Total | 23 (100.0%) | 63.0 |
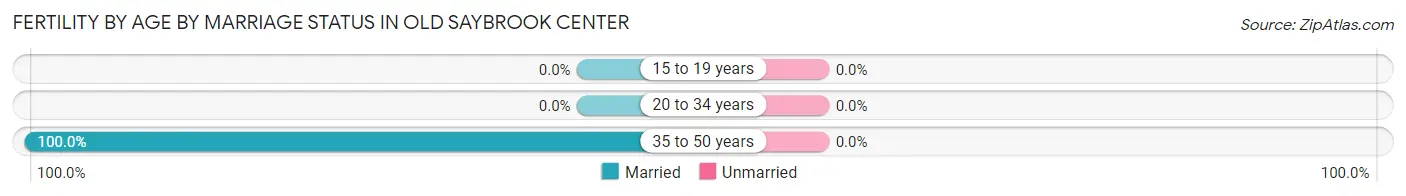
Fertility by Age by Marriage Status in Old Saybrook Center
| Age Bracket | Married | Unmarried |
| 15 to 19 years | 0 (0.0%) | 0 (0.0%) |
| 20 to 34 years | 0 (0.0%) | 0 (0.0%) |
| 35 to 50 years | 23 (100.0%) | 0 (0.0%) |
| Total | 23 (100.0%) | 0 (0.0%) |
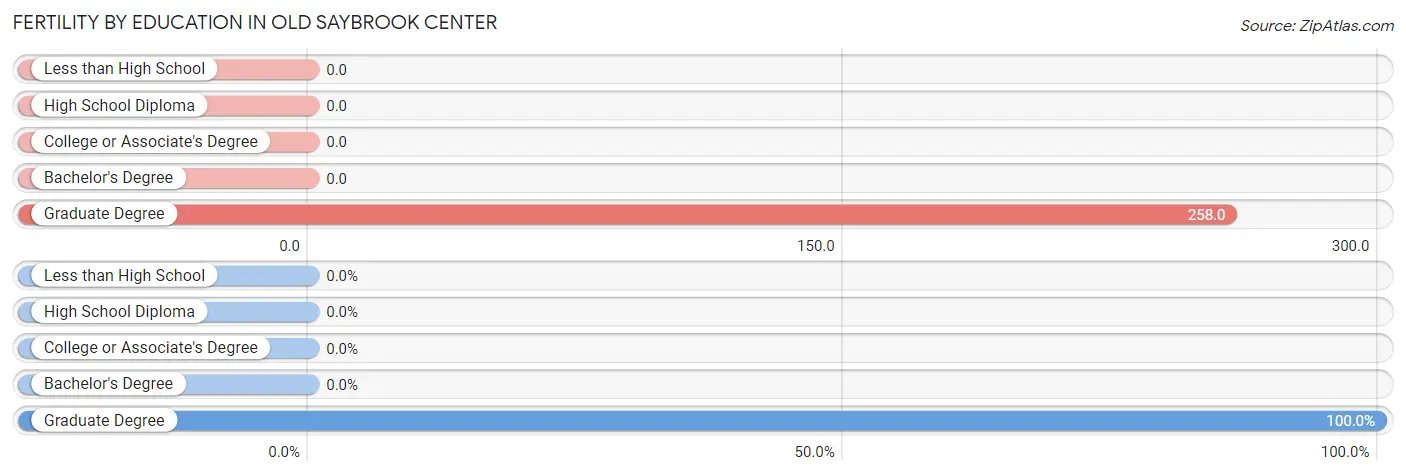
Fertility by Education in Old Saybrook Center
| Educational Attainment | Women with Births | Births / 1,000 Women |
| Less than High School | 0 (0.0%) | 0.0 |
| High School Diploma | 0 (0.0%) | 0.0 |
| College or Associate's Degree | 0 (0.0%) | 0.0 |
| Bachelor's Degree | 0 (0.0%) | 0.0 |
| Graduate Degree | 23 (100.0%) | 258.0 |
| Total | 23 (100.0%) | 63.0 |
Fertility by Education by Marriage Status in Old Saybrook Center
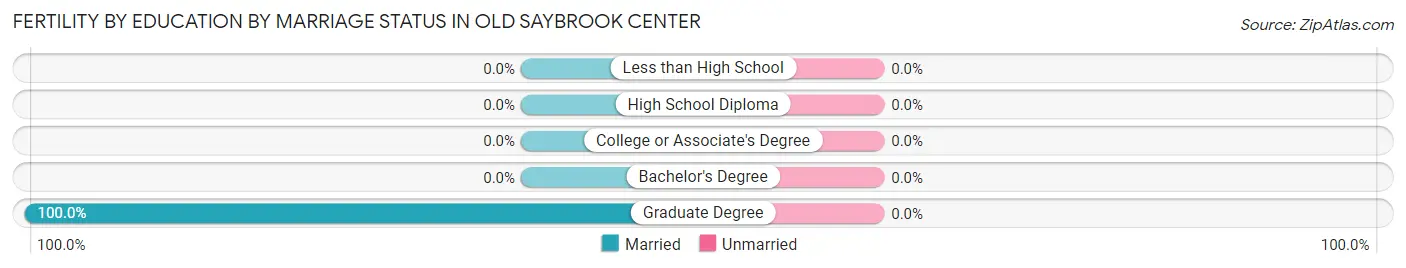
| Educational Attainment | Married | Unmarried |
| Less than High School | 0 (0.0%) | 0 (0.0%) |
| High School Diploma | 0 (0.0%) | 0 (0.0%) |
| College or Associate's Degree | 0 (0.0%) | 0 (0.0%) |
| Bachelor's Degree | 0 (0.0%) | 0 (0.0%) |
| Graduate Degree | 23 (100.0%) | 0 (0.0%) |
| Total | 23 (100.0%) | 0 (0.0%) |
Employment Characteristics in Old Saybrook Center
Employment by Class of Employer in Old Saybrook Center
Among the 1,044 employed individuals in Old Saybrook Center, private company employees (691 | 66.2%), self-employed (not incorporated) (129 | 12.4%), and local government employees (80 | 7.7%) make up the most common classes of employment.
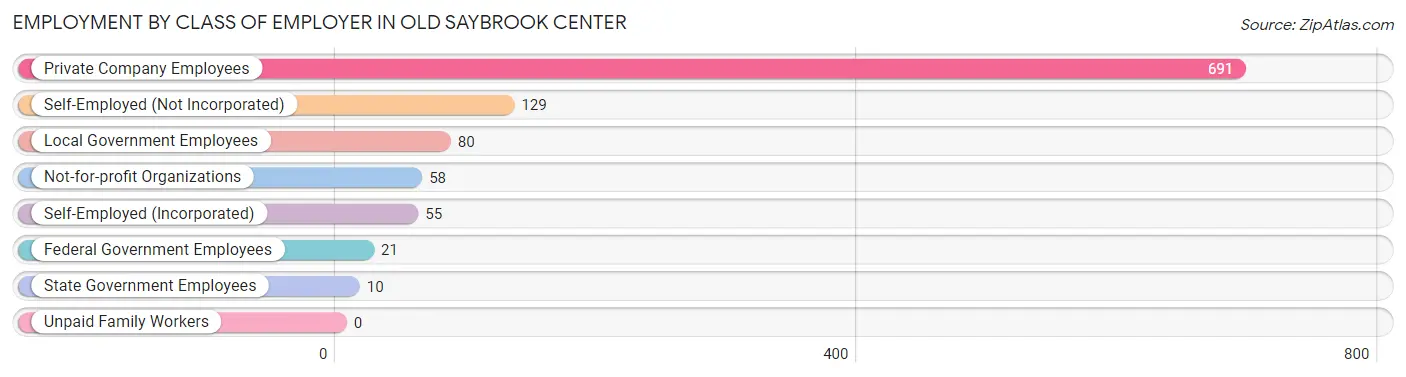
| Employer Class | # Employees | % Employees |
| Private Company Employees | 691 | 66.2% |
| Self-Employed (Incorporated) | 55 | 5.3% |
| Self-Employed (Not Incorporated) | 129 | 12.4% |
| Not-for-profit Organizations | 58 | 5.6% |
| Local Government Employees | 80 | 7.7% |
| State Government Employees | 10 | 1.0% |
| Federal Government Employees | 21 | 2.0% |
| Unpaid Family Workers | 0 | 0.0% |
| Total | 1,044 | 100.0% |
Employment Status by Age in Old Saybrook Center
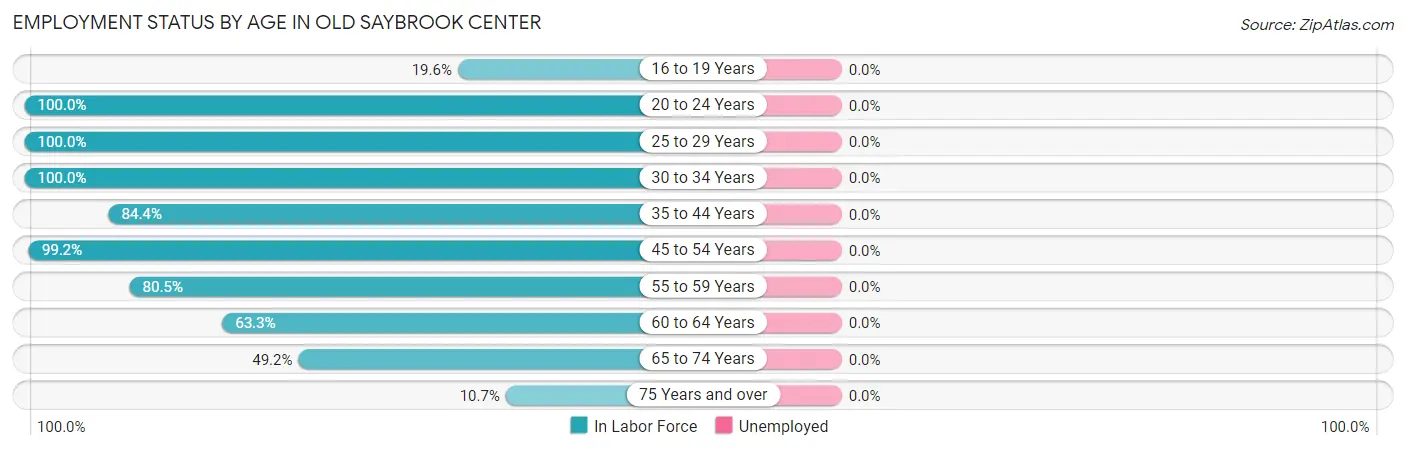
| Age Bracket | In Labor Force | Unemployed |
| 16 to 19 Years | 18 (19.6%) | 0 (0.0%) |
| 20 to 24 Years | 59 (100.0%) | 0 (0.0%) |
| 25 to 29 Years | 200 (100.0%) | 0 (0.0%) |
| 30 to 34 Years | 20 (100.0%) | 0 (0.0%) |
| 35 to 44 Years | 124 (84.4%) | 0 (0.0%) |
| 45 to 54 Years | 243 (99.2%) | 0 (0.0%) |
| 55 to 59 Years | 62 (80.5%) | 0 (0.0%) |
| 60 to 64 Years | 143 (63.3%) | 0 (0.0%) |
| 65 to 74 Years | 126 (49.2%) | 0 (0.0%) |
| 75 Years and over | 58 (10.7%) | 0 (0.0%) |
| Total | 1,053 (56.5%) | 0 (0.0%) |
Employment Status by Educational Attainment in Old Saybrook Center
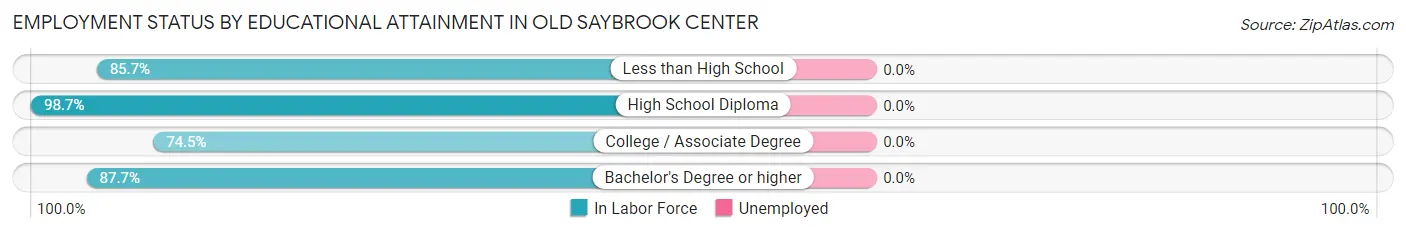
| Educational Attainment | In Labor Force | Unemployed |
| Less than High School | 12 (85.7%) | 0 (0.0%) |
| High School Diploma | 154 (98.7%) | 0 (0.0%) |
| College / Associate Degree | 155 (74.5%) | 0 (0.0%) |
| Bachelor's Degree or higher | 471 (87.7%) | 0 (0.0%) |
| Total | 792 (86.6%) | 0 (0.0%) |
Employment Occupations by Sex in Old Saybrook Center
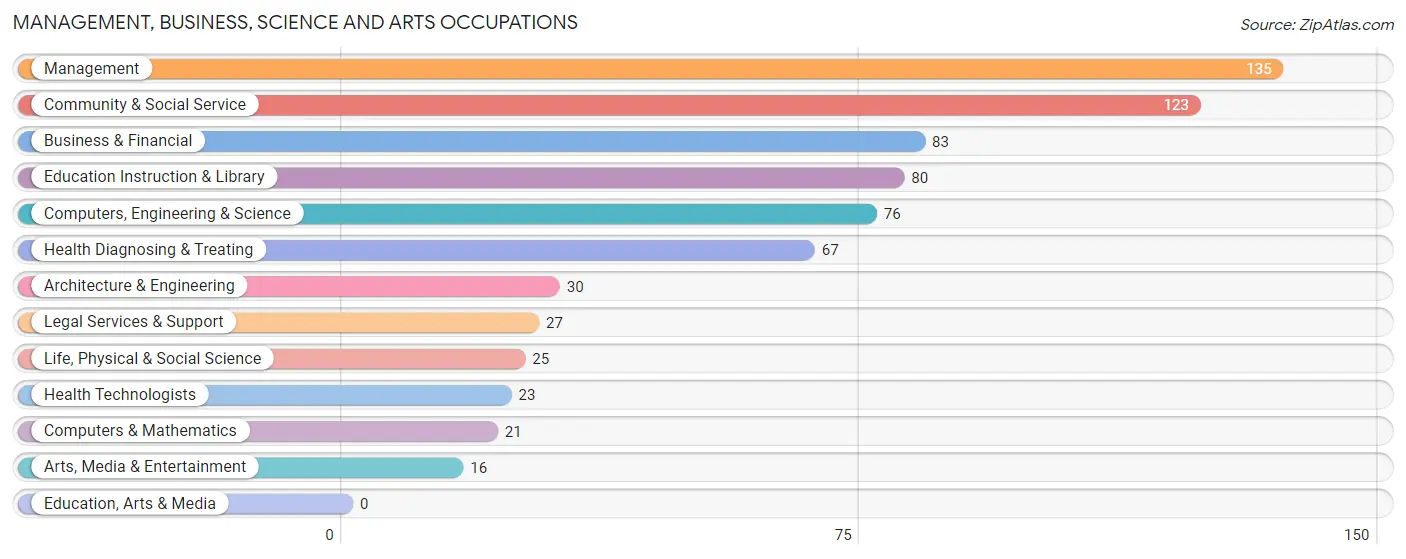
Management, Business, Science and Arts Occupations
The most common Management, Business, Science and Arts occupations in Old Saybrook Center are Management (135 | 12.8%), Community & Social Service (123 | 11.7%), Business & Financial (83 | 7.9%), Education Instruction & Library (80 | 7.6%), and Computers, Engineering & Science (76 | 7.2%).
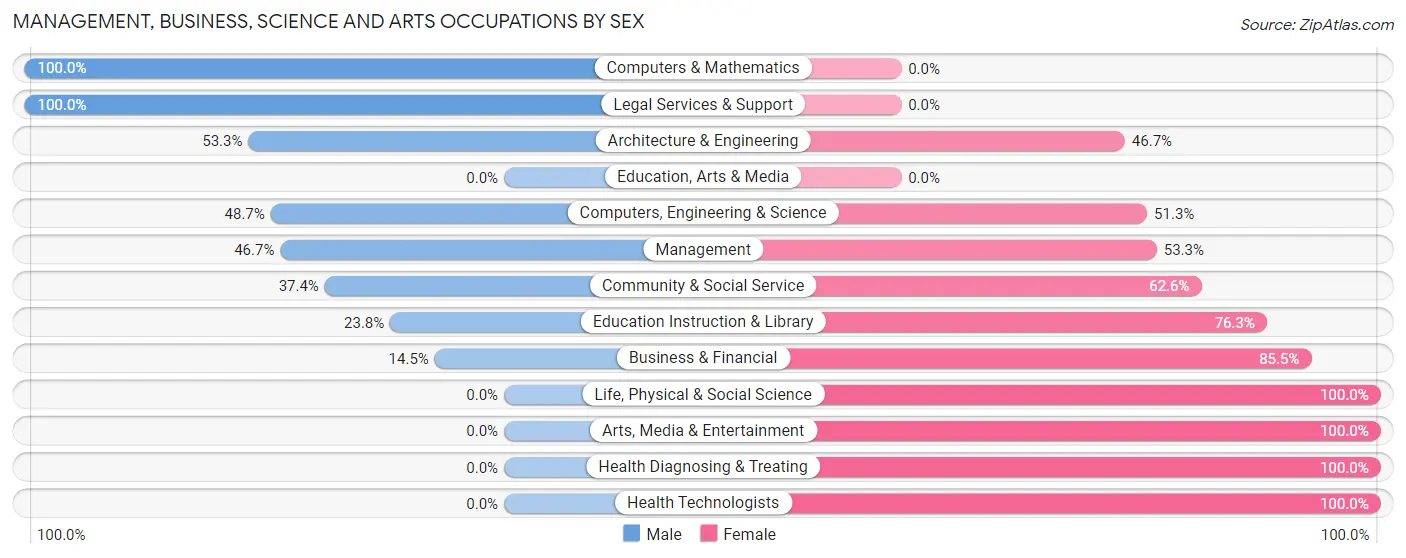
Management, Business, Science and Arts Occupations by Sex
Within the Management, Business, Science and Arts occupations in Old Saybrook Center, the most male-oriented occupations are Computers & Mathematics (100.0%), Legal Services & Support (100.0%), and Architecture & Engineering (53.3%), while the most female-oriented occupations are Life, Physical & Social Science (100.0%), Arts, Media & Entertainment (100.0%), and Health Diagnosing & Treating (100.0%).
| Occupation | Male | Female |
| Management | 63 (46.7%) | 72 (53.3%) |
| Business & Financial | 12 (14.5%) | 71 (85.5%) |
| Computers, Engineering & Science | 37 (48.7%) | 39 (51.3%) |
| Computers & Mathematics | 21 (100.0%) | 0 (0.0%) |
| Architecture & Engineering | 16 (53.3%) | 14 (46.7%) |
| Life, Physical & Social Science | 0 (0.0%) | 25 (100.0%) |
| Community & Social Service | 46 (37.4%) | 77 (62.6%) |
| Education, Arts & Media | 0 (0.0%) | 0 (0.0%) |
| Legal Services & Support | 27 (100.0%) | 0 (0.0%) |
| Education Instruction & Library | 19 (23.7%) | 61 (76.2%) |
| Arts, Media & Entertainment | 0 (0.0%) | 16 (100.0%) |
| Health Diagnosing & Treating | 0 (0.0%) | 67 (100.0%) |
| Health Technologists | 0 (0.0%) | 23 (100.0%) |
| Total (Category) | 158 (32.6%) | 326 (67.4%) |
| Total (Overall) | 381 (36.2%) | 672 (63.8%) |
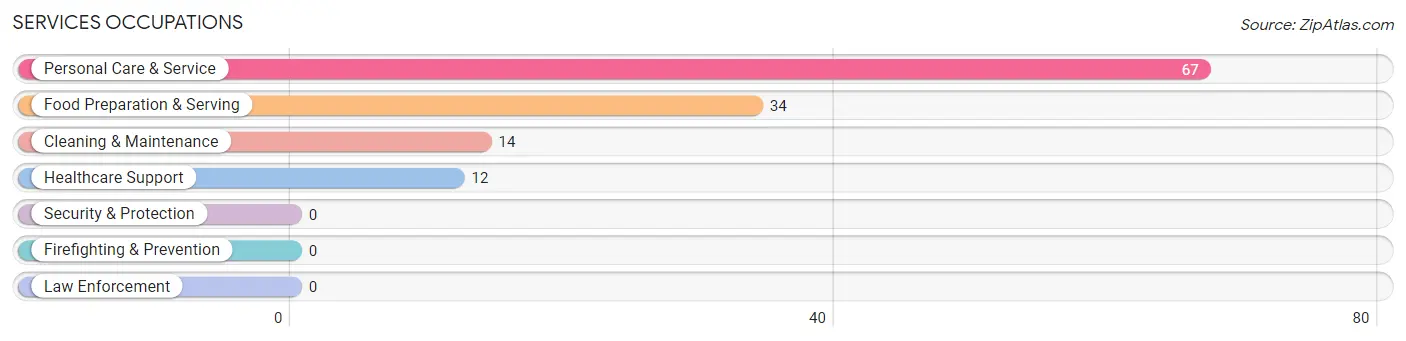
Services Occupations
The most common Services occupations in Old Saybrook Center are Personal Care & Service (67 | 6.4%), Food Preparation & Serving (34 | 3.2%), Cleaning & Maintenance (14 | 1.3%), and Healthcare Support (12 | 1.1%).
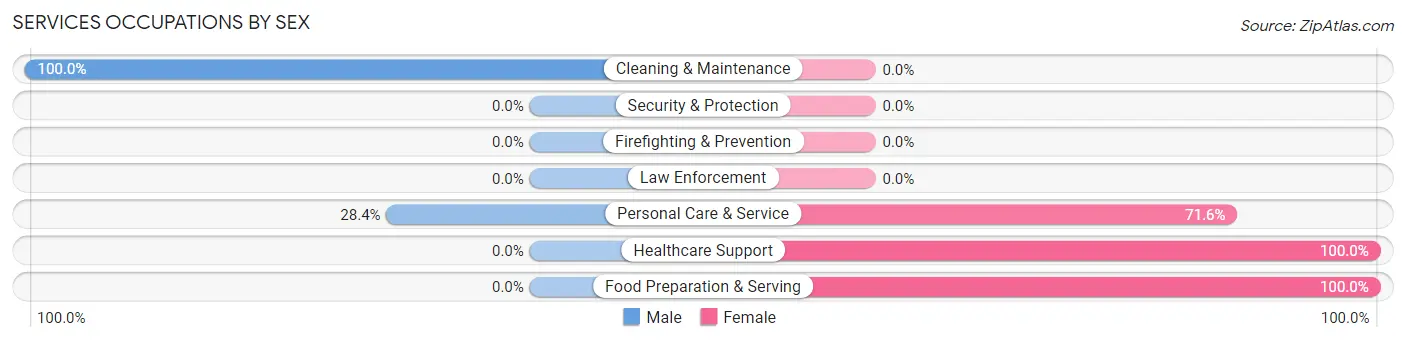
Services Occupations by Sex
Within the Services occupations in Old Saybrook Center, the most male-oriented occupations are Cleaning & Maintenance (100.0%), and Personal Care & Service (28.4%), while the most female-oriented occupations are Healthcare Support (100.0%), Food Preparation & Serving (100.0%), and Personal Care & Service (71.6%).
| Occupation | Male | Female |
| Healthcare Support | 0 (0.0%) | 12 (100.0%) |
| Security & Protection | 0 (0.0%) | 0 (0.0%) |
| Firefighting & Prevention | 0 (0.0%) | 0 (0.0%) |
| Law Enforcement | 0 (0.0%) | 0 (0.0%) |
| Food Preparation & Serving | 0 (0.0%) | 34 (100.0%) |
| Cleaning & Maintenance | 14 (100.0%) | 0 (0.0%) |
| Personal Care & Service | 19 (28.4%) | 48 (71.6%) |
| Total (Category) | 33 (26.0%) | 94 (74.0%) |
| Total (Overall) | 381 (36.2%) | 672 (63.8%) |
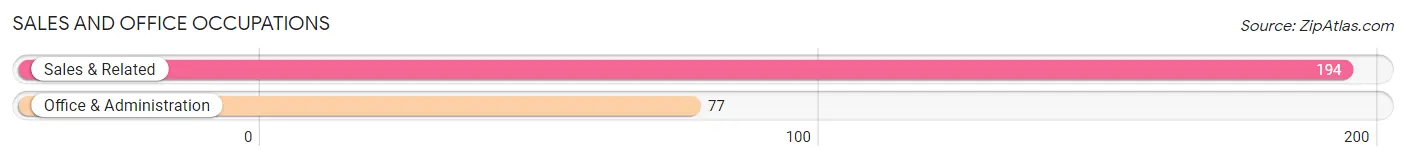
Sales and Office Occupations
The most common Sales and Office occupations in Old Saybrook Center are Sales & Related (194 | 18.4%), and Office & Administration (77 | 7.3%).
Sales and Office Occupations by Sex
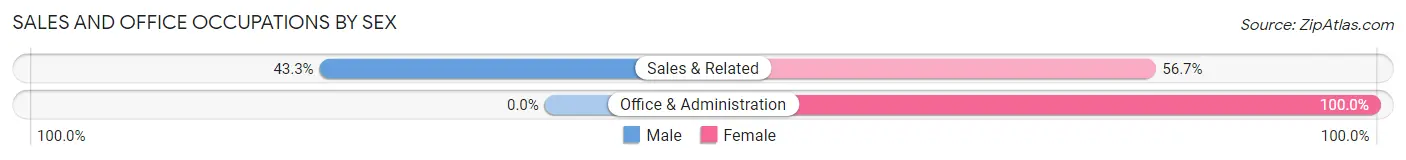
| Occupation | Male | Female |
| Sales & Related | 84 (43.3%) | 110 (56.7%) |
| Office & Administration | 0 (0.0%) | 77 (100.0%) |
| Total (Category) | 84 (31.0%) | 187 (69.0%) |
| Total (Overall) | 381 (36.2%) | 672 (63.8%) |
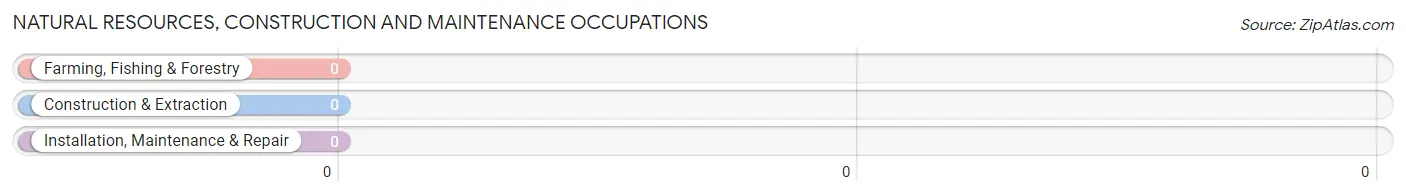
Natural Resources, Construction and Maintenance Occupations
Natural Resources, Construction and Maintenance Occupations by Sex
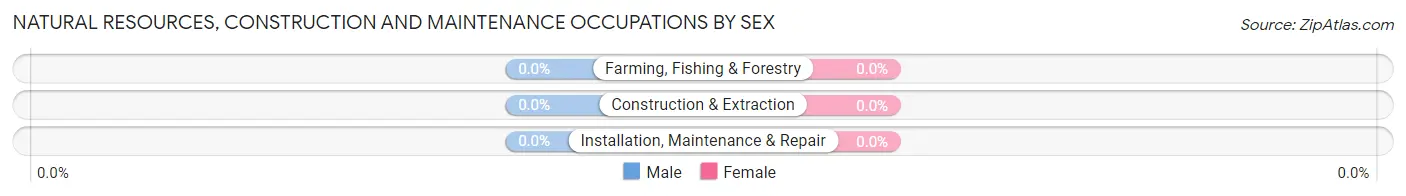
| Occupation | Male | Female |
| Farming, Fishing & Forestry | 0 (0.0%) | 0 (0.0%) |
| Construction & Extraction | 0 (0.0%) | 0 (0.0%) |
| Installation, Maintenance & Repair | 0 (0.0%) | 0 (0.0%) |
| Total (Category) | 0 (0.0%) | 0 (0.0%) |
| Total (Overall) | 381 (36.2%) | 672 (63.8%) |
Production, Transportation and Moving Occupations
The most common Production, Transportation and Moving occupations in Old Saybrook Center are Production (115 | 10.9%), and Material Moving (56 | 5.3%).
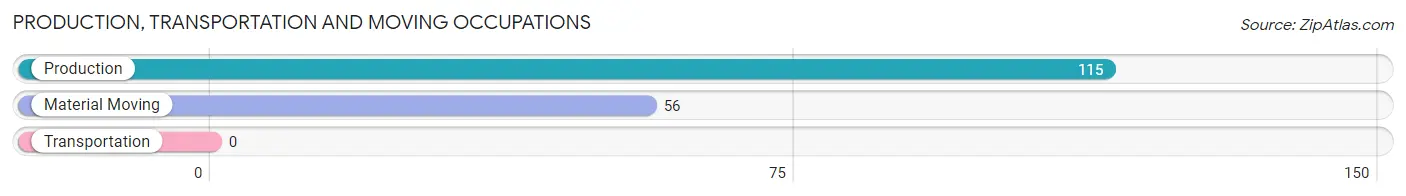
Production, Transportation and Moving Occupations by Sex
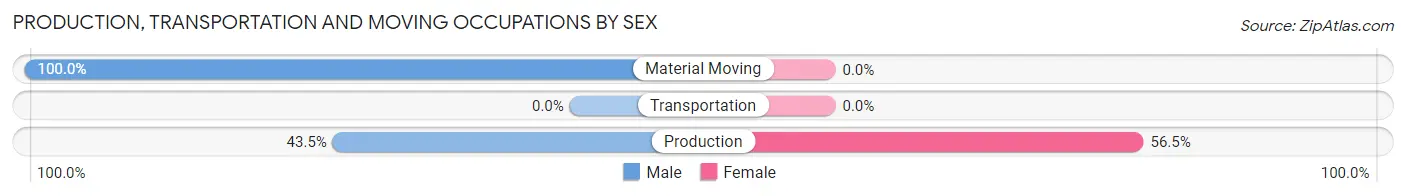
| Occupation | Male | Female |
| Production | 50 (43.5%) | 65 (56.5%) |
| Transportation | 0 (0.0%) | 0 (0.0%) |
| Material Moving | 56 (100.0%) | 0 (0.0%) |
| Total (Category) | 106 (62.0%) | 65 (38.0%) |
| Total (Overall) | 381 (36.2%) | 672 (63.8%) |
Employment Industries by Sex in Old Saybrook Center
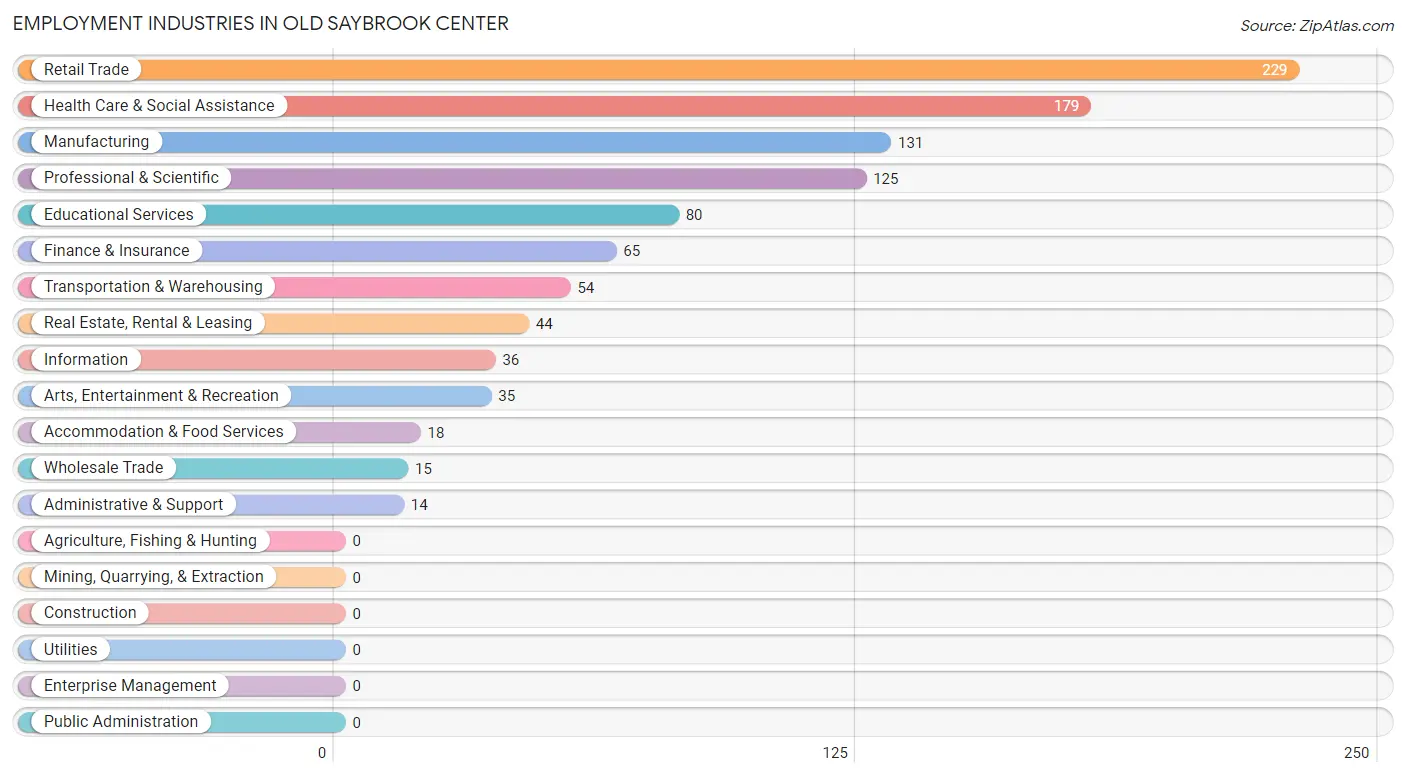
Employment Industries in Old Saybrook Center
The major employment industries in Old Saybrook Center include Retail Trade (229 | 21.7%), Health Care & Social Assistance (179 | 17.0%), Manufacturing (131 | 12.4%), Professional & Scientific (125 | 11.9%), and Educational Services (80 | 7.6%).
Employment Industries by Sex in Old Saybrook Center
The Old Saybrook Center industries that see more men than women are Wholesale Trade (100.0%), Administrative & Support (100.0%), and Manufacturing (59.5%), whereas the industries that tend to have a higher number of women are Information (100.0%), Health Care & Social Assistance (100.0%), and Accommodation & Food Services (100.0%).
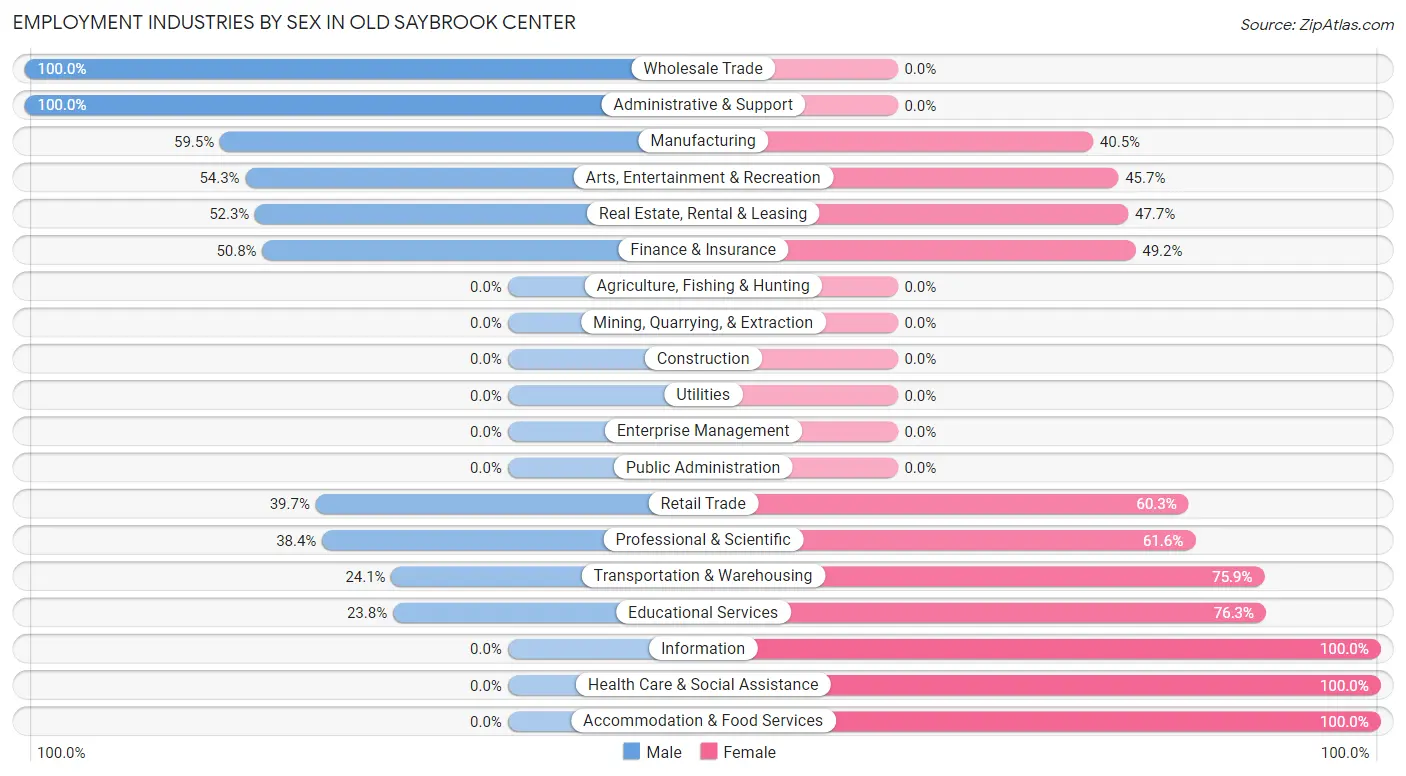
| Industry | Male | Female |
| Agriculture, Fishing & Hunting | 0 (0.0%) | 0 (0.0%) |
| Mining, Quarrying, & Extraction | 0 (0.0%) | 0 (0.0%) |
| Construction | 0 (0.0%) | 0 (0.0%) |
| Manufacturing | 78 (59.5%) | 53 (40.5%) |
| Wholesale Trade | 15 (100.0%) | 0 (0.0%) |
| Retail Trade | 91 (39.7%) | 138 (60.3%) |
| Transportation & Warehousing | 13 (24.1%) | 41 (75.9%) |
| Utilities | 0 (0.0%) | 0 (0.0%) |
| Information | 0 (0.0%) | 36 (100.0%) |
| Finance & Insurance | 33 (50.8%) | 32 (49.2%) |
| Real Estate, Rental & Leasing | 23 (52.3%) | 21 (47.7%) |
| Professional & Scientific | 48 (38.4%) | 77 (61.6%) |
| Enterprise Management | 0 (0.0%) | 0 (0.0%) |
| Administrative & Support | 14 (100.0%) | 0 (0.0%) |
| Educational Services | 19 (23.7%) | 61 (76.2%) |
| Health Care & Social Assistance | 0 (0.0%) | 179 (100.0%) |
| Arts, Entertainment & Recreation | 19 (54.3%) | 16 (45.7%) |
| Accommodation & Food Services | 0 (0.0%) | 18 (100.0%) |
| Public Administration | 0 (0.0%) | 0 (0.0%) |
| Total | 381 (36.2%) | 672 (63.8%) |
Education in Old Saybrook Center
School Enrollment in Old Saybrook Center
The most common levels of schooling among the 259 students in Old Saybrook Center are high school (89 | 34.4%), college / undergraduate (40 | 15.4%), and graduate / professional (40 | 15.4%).
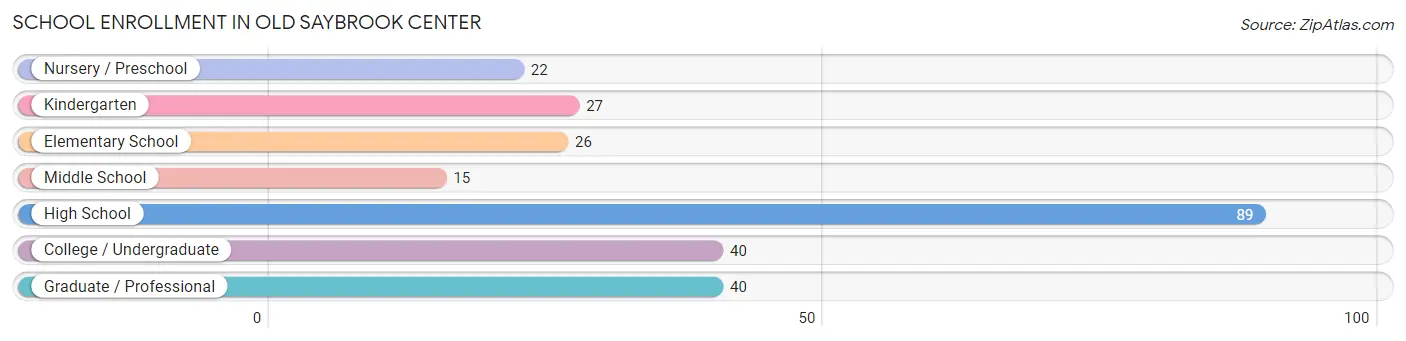
| School Level | # Students | % Students |
| Nursery / Preschool | 22 | 8.5% |
| Kindergarten | 27 | 10.4% |
| Elementary School | 26 | 10.0% |
| Middle School | 15 | 5.8% |
| High School | 89 | 34.4% |
| College / Undergraduate | 40 | 15.4% |
| Graduate / Professional | 40 | 15.4% |
| Total | 259 | 100.0% |
School Enrollment by Age by Funding Source in Old Saybrook Center
Out of a total of 259 students who are enrolled in schools in Old Saybrook Center, 55 (21.2%) attend a private institution, while the remaining 204 (78.8%) are enrolled in public schools. The age group of 3 to 4 year olds has the highest likelihood of being enrolled in private schools, with 22 (100.0% in the age bracket) enrolled. Conversely, the age group of 5 to 9 year old has the lowest likelihood of being enrolled in a private school, with 53 (100.0% in the age bracket) attending a public institution.
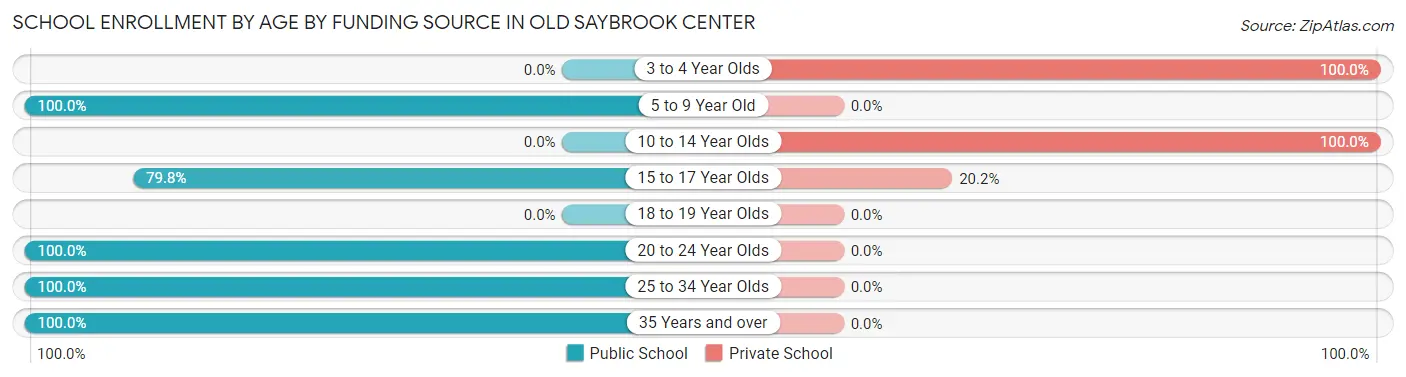
| Age Bracket | Public School | Private School |
| 3 to 4 Year Olds | 0 (0.0%) | 22 (100.0%) |
| 5 to 9 Year Old | 53 (100.0%) | 0 (0.0%) |
| 10 to 14 Year Olds | 0 (0.0%) | 15 (100.0%) |
| 15 to 17 Year Olds | 71 (79.8%) | 18 (20.2%) |
| 18 to 19 Year Olds | 0 (0.0%) | 0 (0.0%) |
| 20 to 24 Year Olds | 19 (100.0%) | 0 (0.0%) |
| 25 to 34 Year Olds | 21 (100.0%) | 0 (0.0%) |
| 35 Years and over | 40 (100.0%) | 0 (0.0%) |
| Total | 204 (78.8%) | 55 (21.2%) |
Educational Attainment by Field of Study in Old Saybrook Center
Education (249 | 25.3%), business (198 | 20.1%), social sciences (145 | 14.7%), psychology (104 | 10.5%), and literature & languages (63 | 6.4%) are the most common fields of study among 986 individuals in Old Saybrook Center who have obtained a bachelor's degree or higher.
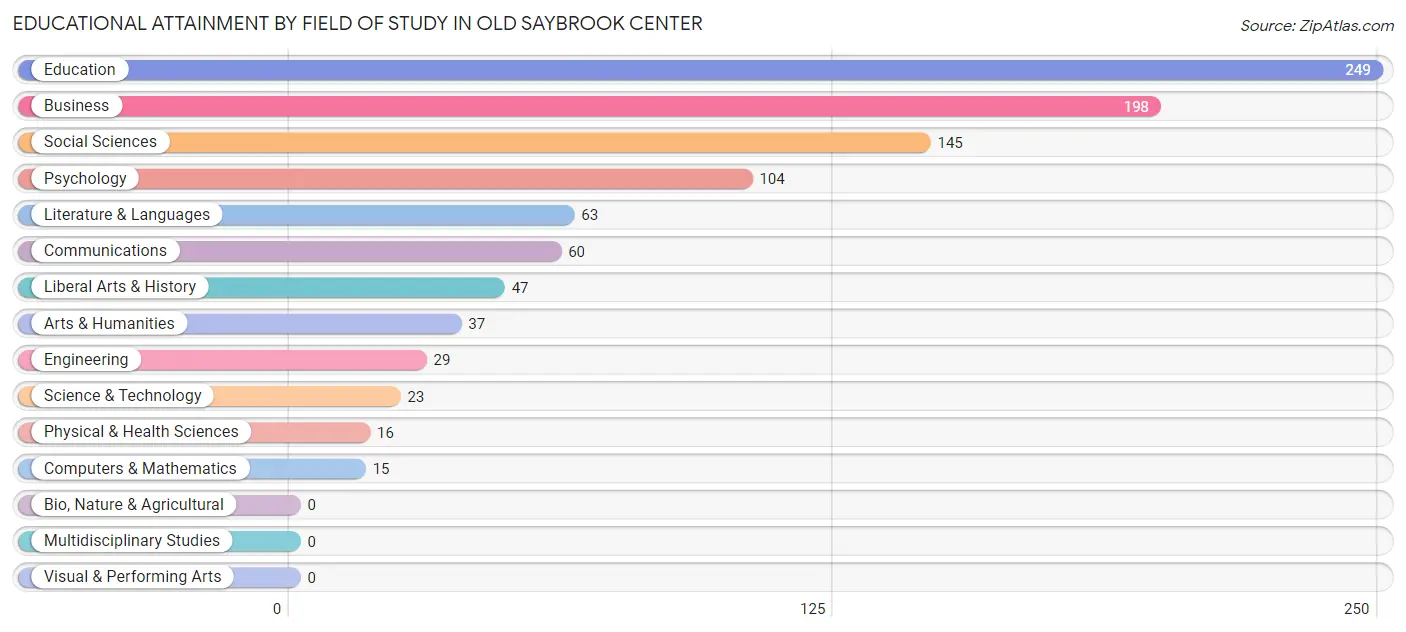
| Field of Study | # Graduates | % Graduates |
| Computers & Mathematics | 15 | 1.5% |
| Bio, Nature & Agricultural | 0 | 0.0% |
| Physical & Health Sciences | 16 | 1.6% |
| Psychology | 104 | 10.5% |
| Social Sciences | 145 | 14.7% |
| Engineering | 29 | 2.9% |
| Multidisciplinary Studies | 0 | 0.0% |
| Science & Technology | 23 | 2.3% |
| Business | 198 | 20.1% |
| Education | 249 | 25.3% |
| Literature & Languages | 63 | 6.4% |
| Liberal Arts & History | 47 | 4.8% |
| Visual & Performing Arts | 0 | 0.0% |
| Communications | 60 | 6.1% |
| Arts & Humanities | 37 | 3.7% |
| Total | 986 | 100.0% |
Transportation & Commute in Old Saybrook Center
Vehicle Availability by Sex in Old Saybrook Center
The most prevalent vehicle ownership categories in Old Saybrook Center are males with 2 vehicles (177, accounting for 46.5%) and females with 2 vehicles (159, making up 26.7%).
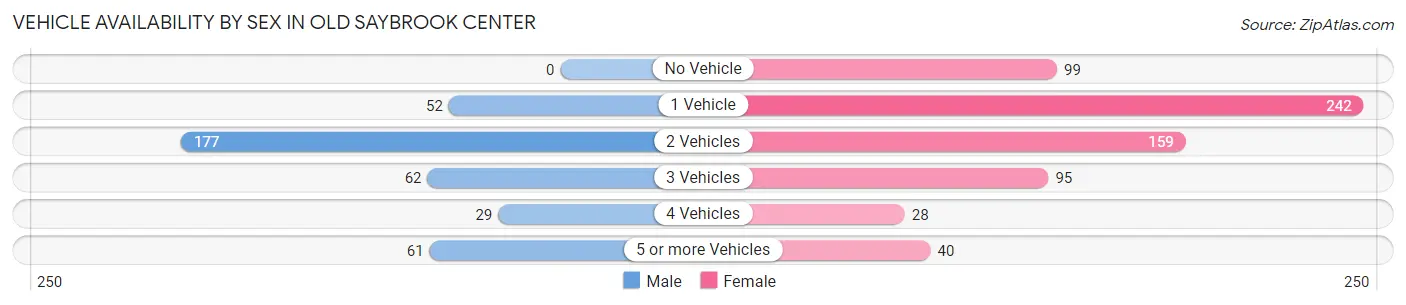
| Vehicles Available | Male | Female |
| No Vehicle | 0 (0.0%) | 99 (14.9%) |
| 1 Vehicle | 52 (13.7%) | 242 (36.5%) |
| 2 Vehicles | 177 (46.5%) | 159 (24.0%) |
| 3 Vehicles | 62 (16.3%) | 95 (14.3%) |
| 4 Vehicles | 29 (7.6%) | 28 (4.2%) |
| 5 or more Vehicles | 61 (16.0%) | 40 (6.0%) |
| Total | 381 (100.0%) | 663 (100.0%) |
Commute Time in Old Saybrook Center
The most frequently occuring commute durations in Old Saybrook Center are 5 to 9 minutes (254 commuters, 28.9%), 45 to 59 minutes (114 commuters, 13.0%), and less than 5 minutes (92 commuters, 10.4%).
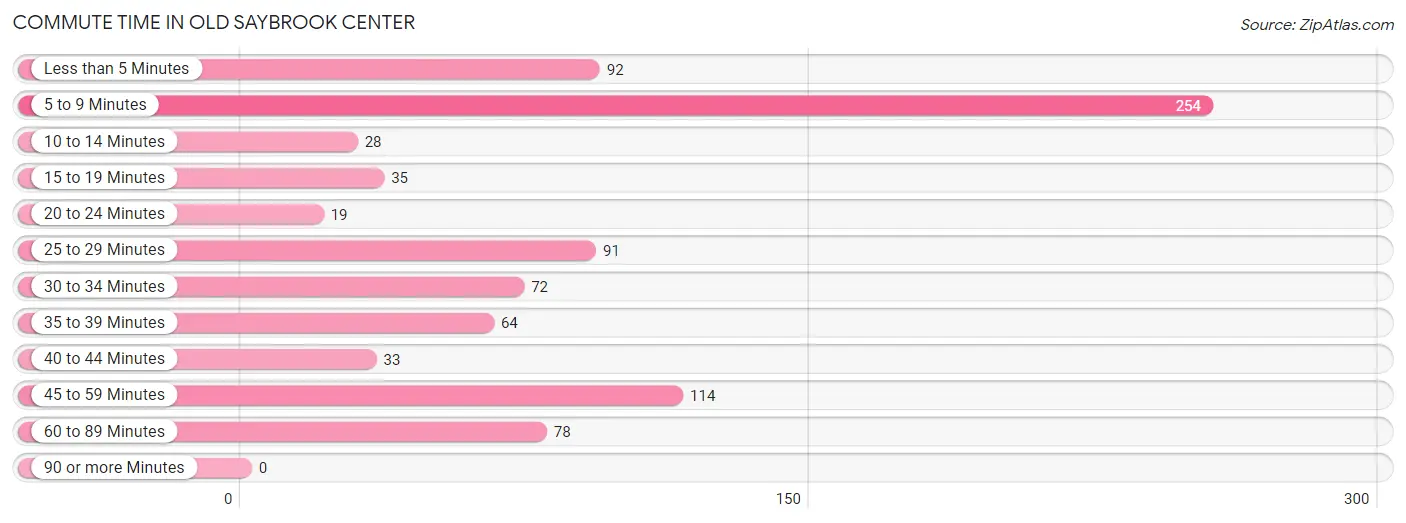
| Commute Time | # Commuters | % Commuters |
| Less than 5 Minutes | 92 | 10.4% |
| 5 to 9 Minutes | 254 | 28.9% |
| 10 to 14 Minutes | 28 | 3.2% |
| 15 to 19 Minutes | 35 | 4.0% |
| 20 to 24 Minutes | 19 | 2.2% |
| 25 to 29 Minutes | 91 | 10.3% |
| 30 to 34 Minutes | 72 | 8.2% |
| 35 to 39 Minutes | 64 | 7.3% |
| 40 to 44 Minutes | 33 | 3.7% |
| 45 to 59 Minutes | 114 | 13.0% |
| 60 to 89 Minutes | 78 | 8.9% |
| 90 or more Minutes | 0 | 0.0% |
Commute Time by Sex in Old Saybrook Center
The most common commute times in Old Saybrook Center are 45 to 59 minutes (72 commuters, 24.2%) for males and 5 to 9 minutes (214 commuters, 36.7%) for females.
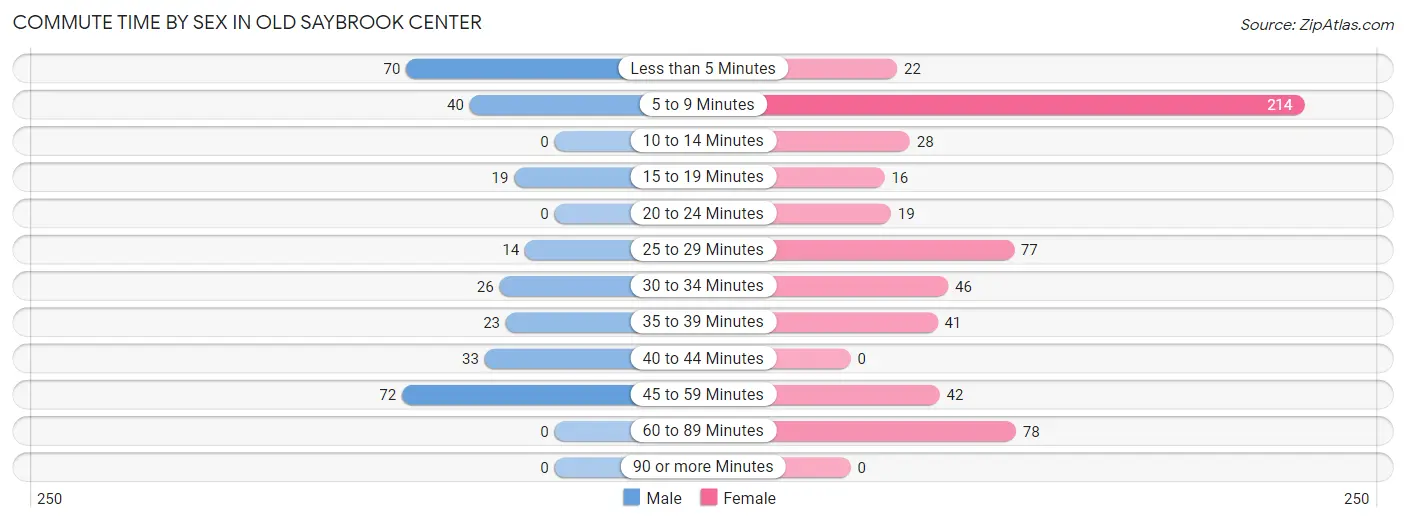
| Commute Time | Male | Female |
| Less than 5 Minutes | 70 (23.6%) | 22 (3.8%) |
| 5 to 9 Minutes | 40 (13.5%) | 214 (36.7%) |
| 10 to 14 Minutes | 0 (0.0%) | 28 (4.8%) |
| 15 to 19 Minutes | 19 (6.4%) | 16 (2.7%) |
| 20 to 24 Minutes | 0 (0.0%) | 19 (3.3%) |
| 25 to 29 Minutes | 14 (4.7%) | 77 (13.2%) |
| 30 to 34 Minutes | 26 (8.7%) | 46 (7.9%) |
| 35 to 39 Minutes | 23 (7.7%) | 41 (7.0%) |
| 40 to 44 Minutes | 33 (11.1%) | 0 (0.0%) |
| 45 to 59 Minutes | 72 (24.2%) | 42 (7.2%) |
| 60 to 89 Minutes | 0 (0.0%) | 78 (13.4%) |
| 90 or more Minutes | 0 (0.0%) | 0 (0.0%) |
Time of Departure to Work by Sex in Old Saybrook Center
The most frequent times of departure to work in Old Saybrook Center are 7:00 AM to 7:29 AM (66, 22.2%) for males and 7:00 AM to 7:29 AM (140, 24.0%) for females.
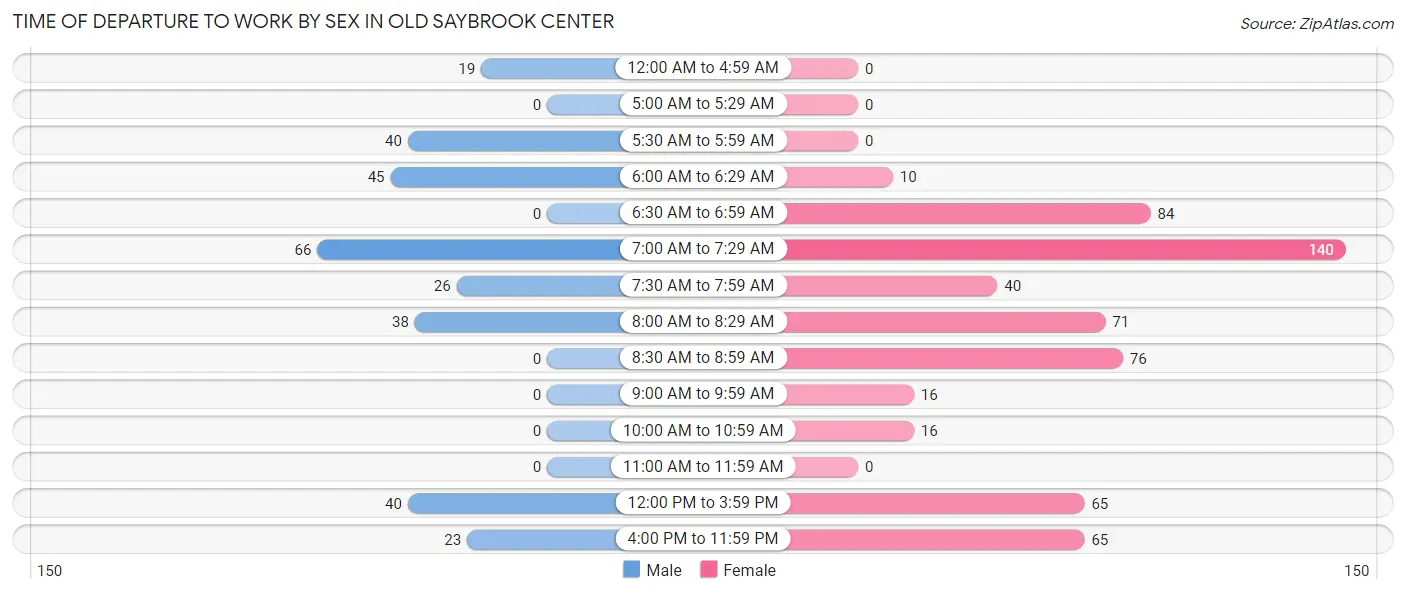
| Time of Departure | Male | Female |
| 12:00 AM to 4:59 AM | 19 (6.4%) | 0 (0.0%) |
| 5:00 AM to 5:29 AM | 0 (0.0%) | 0 (0.0%) |
| 5:30 AM to 5:59 AM | 40 (13.5%) | 0 (0.0%) |
| 6:00 AM to 6:29 AM | 45 (15.1%) | 10 (1.7%) |
| 6:30 AM to 6:59 AM | 0 (0.0%) | 84 (14.4%) |
| 7:00 AM to 7:29 AM | 66 (22.2%) | 140 (24.0%) |
| 7:30 AM to 7:59 AM | 26 (8.7%) | 40 (6.9%) |
| 8:00 AM to 8:29 AM | 38 (12.8%) | 71 (12.2%) |
| 8:30 AM to 8:59 AM | 0 (0.0%) | 76 (13.0%) |
| 9:00 AM to 9:59 AM | 0 (0.0%) | 16 (2.7%) |
| 10:00 AM to 10:59 AM | 0 (0.0%) | 16 (2.7%) |
| 11:00 AM to 11:59 AM | 0 (0.0%) | 0 (0.0%) |
| 12:00 PM to 3:59 PM | 40 (13.5%) | 65 (11.2%) |
| 4:00 PM to 11:59 PM | 23 (7.7%) | 65 (11.2%) |
| Total | 297 (100.0%) | 583 (100.0%) |
Housing Occupancy in Old Saybrook Center
Occupancy by Ownership in Old Saybrook Center
Of the total 1,132 dwellings in Old Saybrook Center, owner-occupied units account for 880 (77.7%), while renter-occupied units make up 252 (22.3%).
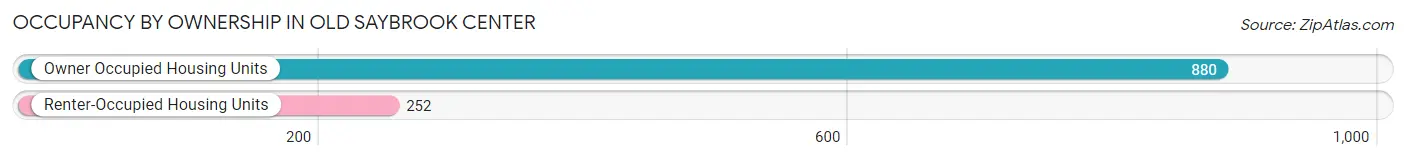
| Occupancy | # Housing Units | % Housing Units |
| Owner Occupied Housing Units | 880 | 77.7% |
| Renter-Occupied Housing Units | 252 | 22.3% |
| Total Occupied Housing Units | 1,132 | 100.0% |
Occupancy by Household Size in Old Saybrook Center
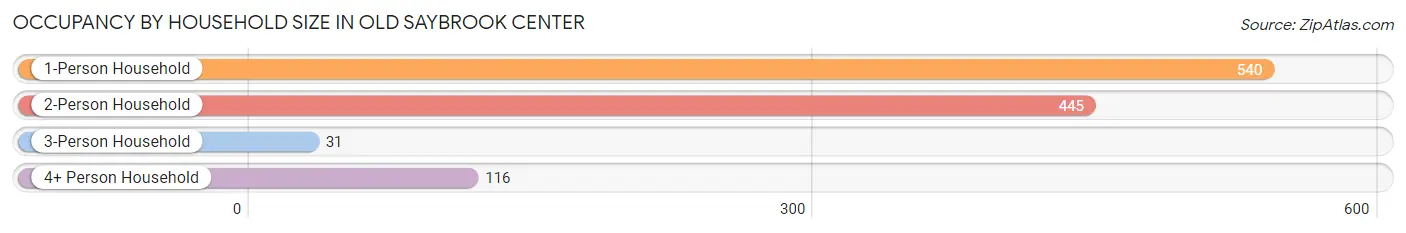
| Household Size | # Housing Units | % Housing Units |
| 1-Person Household | 540 | 47.7% |
| 2-Person Household | 445 | 39.3% |
| 3-Person Household | 31 | 2.7% |
| 4+ Person Household | 116 | 10.2% |
| Total Housing Units | 1,132 | 100.0% |
Occupancy by Ownership by Household Size in Old Saybrook Center
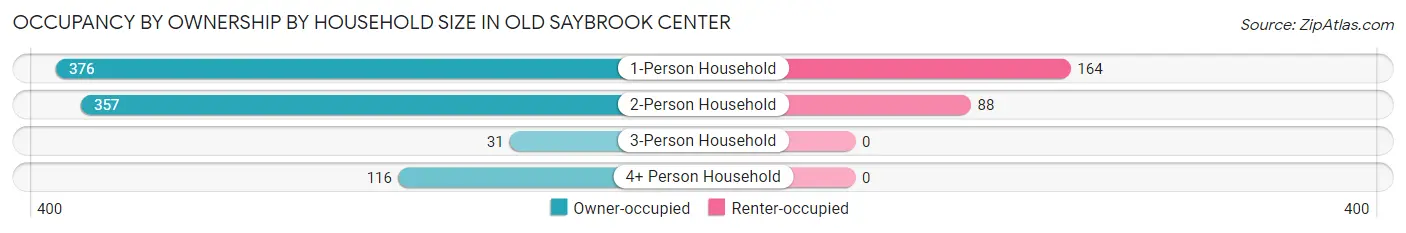
| Household Size | Owner-occupied | Renter-occupied |
| 1-Person Household | 376 (69.6%) | 164 (30.4%) |
| 2-Person Household | 357 (80.2%) | 88 (19.8%) |
| 3-Person Household | 31 (100.0%) | 0 (0.0%) |
| 4+ Person Household | 116 (100.0%) | 0 (0.0%) |
| Total Housing Units | 880 (77.7%) | 252 (22.3%) |
Occupancy by Educational Attainment in Old Saybrook Center
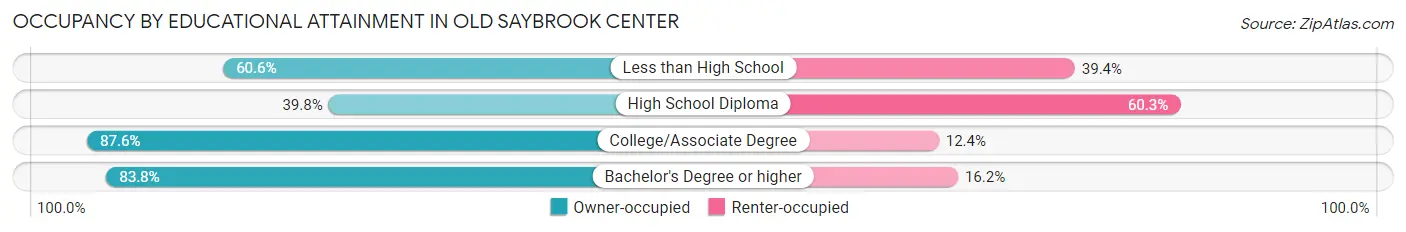
| Household Size | Owner-occupied | Renter-occupied |
| Less than High School | 20 (60.6%) | 13 (39.4%) |
| High School Diploma | 64 (39.8%) | 97 (60.3%) |
| College/Associate Degree | 233 (87.6%) | 33 (12.4%) |
| Bachelor's Degree or higher | 563 (83.8%) | 109 (16.2%) |
Occupancy by Age of Householder in Old Saybrook Center
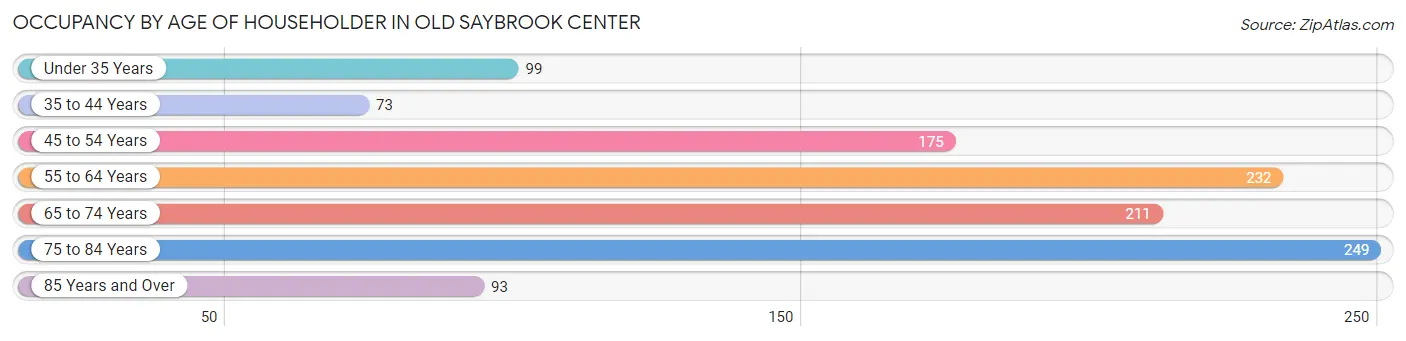
| Age Bracket | # Households | % Households |
| Under 35 Years | 99 | 8.7% |
| 35 to 44 Years | 73 | 6.5% |
| 45 to 54 Years | 175 | 15.5% |
| 55 to 64 Years | 232 | 20.5% |
| 65 to 74 Years | 211 | 18.6% |
| 75 to 84 Years | 249 | 22.0% |
| 85 Years and Over | 93 | 8.2% |
| Total | 1,132 | 100.0% |
Housing Finances in Old Saybrook Center
Median Income by Occupancy in Old Saybrook Center
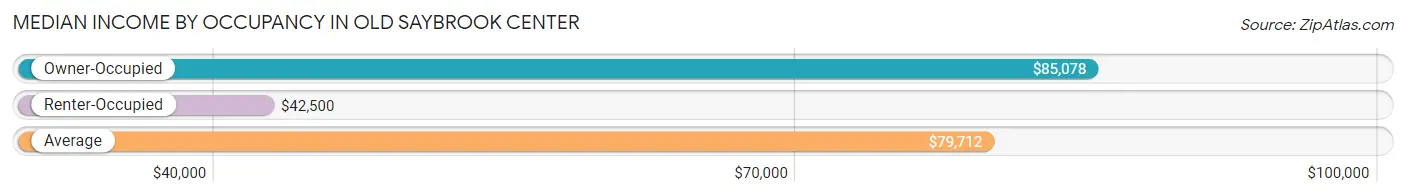
| Occupancy Type | # Households | Median Income |
| Owner-Occupied | 880 (77.7%) | $85,078 |
| Renter-Occupied | 252 (22.3%) | $42,500 |
| Average | 1,132 (100.0%) | $79,712 |
Occupancy by Householder Income Bracket in Old Saybrook Center
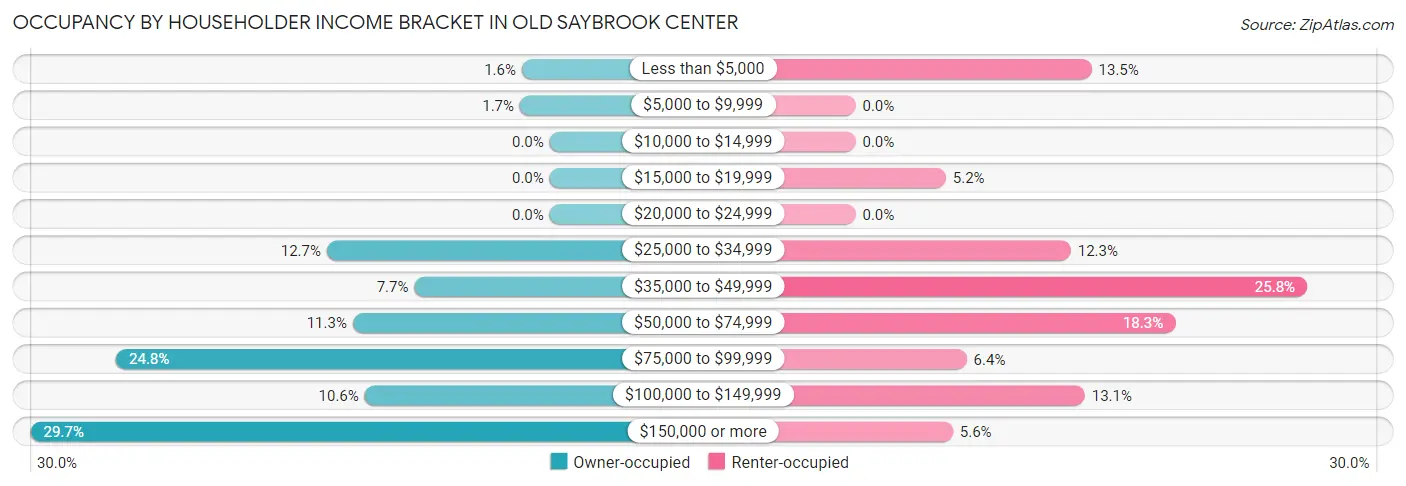
| Income Bracket | Owner-occupied | Renter-occupied |
| Less than $5,000 | 14 (1.6%) | 34 (13.5%) |
| $5,000 to $9,999 | 15 (1.7%) | 0 (0.0%) |
| $10,000 to $14,999 | 0 (0.0%) | 0 (0.0%) |
| $15,000 to $19,999 | 0 (0.0%) | 13 (5.2%) |
| $20,000 to $24,999 | 0 (0.0%) | 0 (0.0%) |
| $25,000 to $34,999 | 112 (12.7%) | 31 (12.3%) |
| $35,000 to $49,999 | 68 (7.7%) | 65 (25.8%) |
| $50,000 to $74,999 | 99 (11.3%) | 46 (18.2%) |
| $75,000 to $99,999 | 218 (24.8%) | 16 (6.4%) |
| $100,000 to $149,999 | 93 (10.6%) | 33 (13.1%) |
| $150,000 or more | 261 (29.7%) | 14 (5.6%) |
| Total | 880 (100.0%) | 252 (100.0%) |
Monthly Housing Cost Tiers in Old Saybrook Center
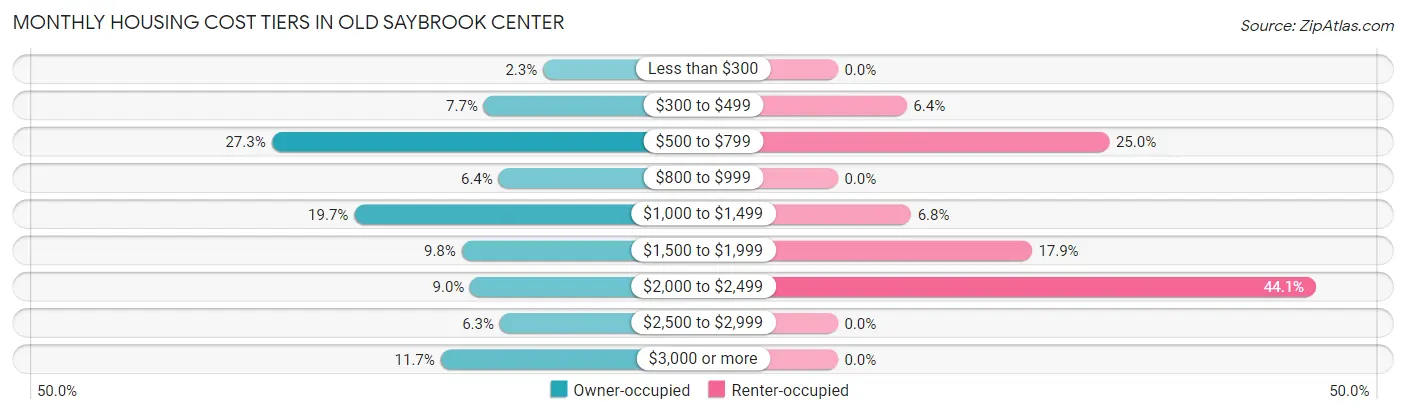
| Monthly Cost | Owner-occupied | Renter-occupied |
| Less than $300 | 20 (2.3%) | 0 (0.0%) |
| $300 to $499 | 68 (7.7%) | 16 (6.4%) |
| $500 to $799 | 240 (27.3%) | 63 (25.0%) |
| $800 to $999 | 56 (6.4%) | 0 (0.0%) |
| $1,000 to $1,499 | 173 (19.7%) | 17 (6.8%) |
| $1,500 to $1,999 | 86 (9.8%) | 45 (17.9%) |
| $2,000 to $2,499 | 79 (9.0%) | 111 (44.1%) |
| $2,500 to $2,999 | 55 (6.2%) | 0 (0.0%) |
| $3,000 or more | 103 (11.7%) | 0 (0.0%) |
| Total | 880 (100.0%) | 252 (100.0%) |
Physical Housing Characteristics in Old Saybrook Center
Housing Structures in Old Saybrook Center
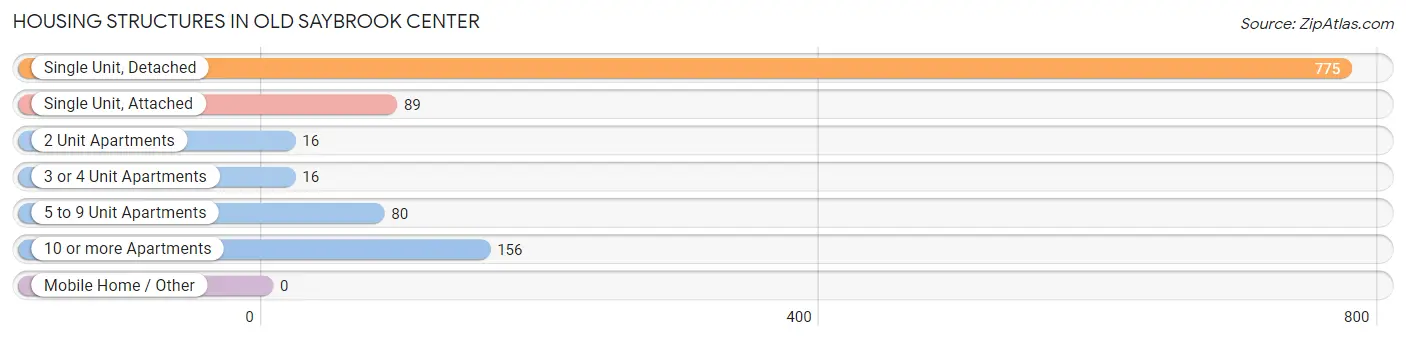
| Structure Type | # Housing Units | % Housing Units |
| Single Unit, Detached | 775 | 68.5% |
| Single Unit, Attached | 89 | 7.9% |
| 2 Unit Apartments | 16 | 1.4% |
| 3 or 4 Unit Apartments | 16 | 1.4% |
| 5 to 9 Unit Apartments | 80 | 7.1% |
| 10 or more Apartments | 156 | 13.8% |
| Mobile Home / Other | 0 | 0.0% |
| Total | 1,132 | 100.0% |
Housing Structures by Occupancy in Old Saybrook Center
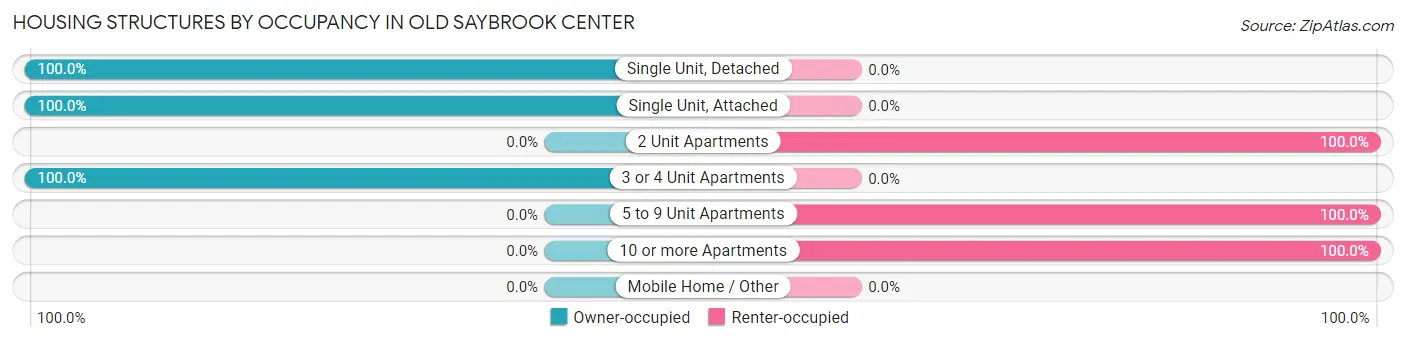
| Structure Type | Owner-occupied | Renter-occupied |
| Single Unit, Detached | 775 (100.0%) | 0 (0.0%) |
| Single Unit, Attached | 89 (100.0%) | 0 (0.0%) |
| 2 Unit Apartments | 0 (0.0%) | 16 (100.0%) |
| 3 or 4 Unit Apartments | 16 (100.0%) | 0 (0.0%) |
| 5 to 9 Unit Apartments | 0 (0.0%) | 80 (100.0%) |
| 10 or more Apartments | 0 (0.0%) | 156 (100.0%) |
| Mobile Home / Other | 0 (0.0%) | 0 (0.0%) |
| Total | 880 (77.7%) | 252 (22.3%) |
Housing Structures by Number of Rooms in Old Saybrook Center
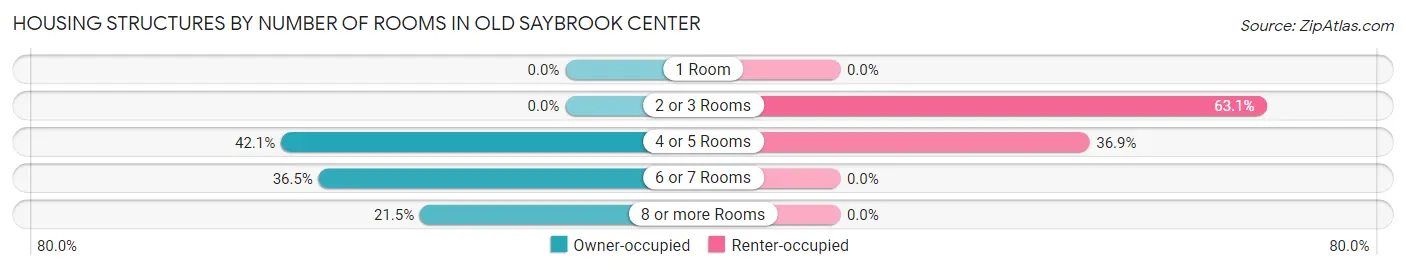
| Number of Rooms | Owner-occupied | Renter-occupied |
| 1 Room | 0 (0.0%) | 0 (0.0%) |
| 2 or 3 Rooms | 0 (0.0%) | 159 (63.1%) |
| 4 or 5 Rooms | 370 (42.0%) | 93 (36.9%) |
| 6 or 7 Rooms | 321 (36.5%) | 0 (0.0%) |
| 8 or more Rooms | 189 (21.5%) | 0 (0.0%) |
| Total | 880 (100.0%) | 252 (100.0%) |
Housing Structure by Heating Type in Old Saybrook Center
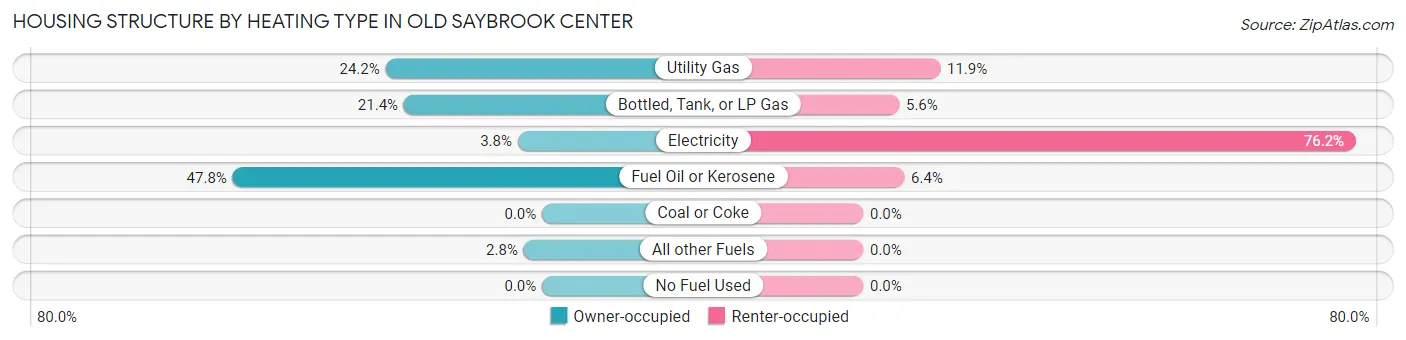
| Heating Type | Owner-occupied | Renter-occupied |
| Utility Gas | 213 (24.2%) | 30 (11.9%) |
| Bottled, Tank, or LP Gas | 188 (21.4%) | 14 (5.6%) |
| Electricity | 33 (3.7%) | 192 (76.2%) |
| Fuel Oil or Kerosene | 421 (47.8%) | 16 (6.4%) |
| Coal or Coke | 0 (0.0%) | 0 (0.0%) |
| All other Fuels | 25 (2.8%) | 0 (0.0%) |
| No Fuel Used | 0 (0.0%) | 0 (0.0%) |
| Total | 880 (100.0%) | 252 (100.0%) |
Household Vehicle Usage in Old Saybrook Center
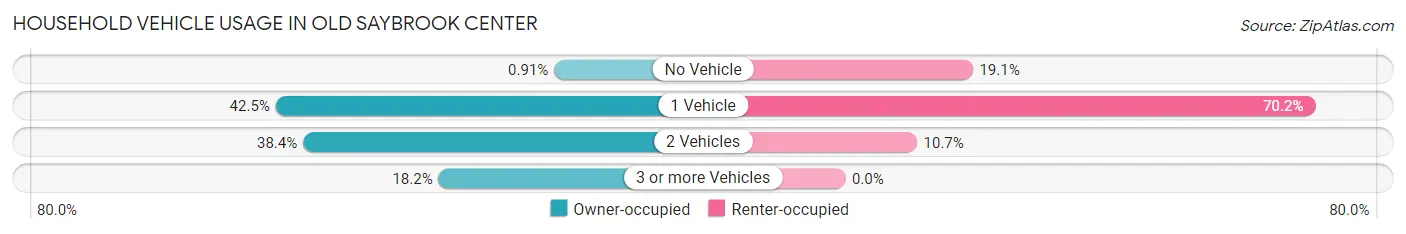
| Vehicles per Household | Owner-occupied | Renter-occupied |
| No Vehicle | 8 (0.9%) | 48 (19.1%) |
| 1 Vehicle | 374 (42.5%) | 177 (70.2%) |
| 2 Vehicles | 338 (38.4%) | 27 (10.7%) |
| 3 or more Vehicles | 160 (18.2%) | 0 (0.0%) |
| Total | 880 (100.0%) | 252 (100.0%) |
Real Estate & Mortgages in Old Saybrook Center
Real Estate and Mortgage Overview in Old Saybrook Center
| Characteristic | Without Mortgage | With Mortgage |
| Housing Units | 544 | 336 |
| Median Property Value | $374,600 | $438,500 |
| Median Household Income | $83,726 | $98 |
| Monthly Housing Costs | $702 | $103 |
| Real Estate Taxes | $4,433 | $0 |
Property Value by Mortgage Status in Old Saybrook Center
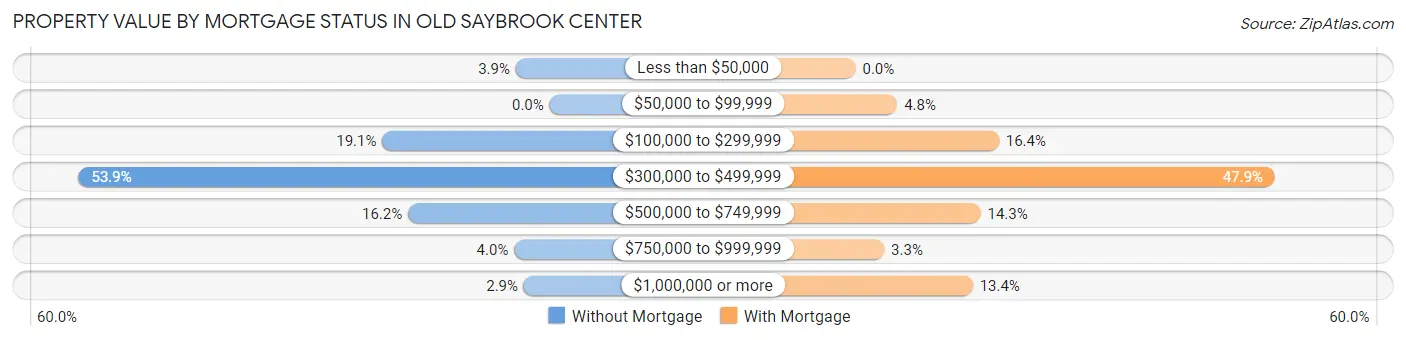
| Property Value | Without Mortgage | With Mortgage |
| Less than $50,000 | 21 (3.9%) | 0 (0.0%) |
| $50,000 to $99,999 | 0 (0.0%) | 16 (4.8%) |
| $100,000 to $299,999 | 104 (19.1%) | 55 (16.4%) |
| $300,000 to $499,999 | 293 (53.9%) | 161 (47.9%) |
| $500,000 to $749,999 | 88 (16.2%) | 48 (14.3%) |
| $750,000 to $999,999 | 22 (4.0%) | 11 (3.3%) |
| $1,000,000 or more | 16 (2.9%) | 45 (13.4%) |
| Total | 544 (100.0%) | 336 (100.0%) |
Household Income by Mortgage Status in Old Saybrook Center
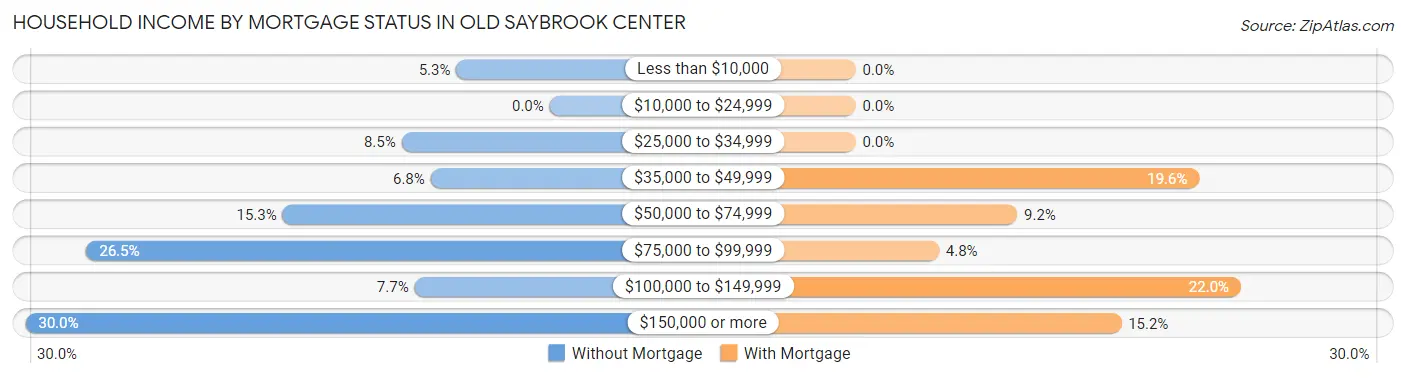
| Household Income | Without Mortgage | With Mortgage |
| Less than $10,000 | 29 (5.3%) | 0 (0.0%) |
| $10,000 to $24,999 | 0 (0.0%) | 0 (0.0%) |
| $25,000 to $34,999 | 46 (8.5%) | 0 (0.0%) |
| $35,000 to $49,999 | 37 (6.8%) | 66 (19.6%) |
| $50,000 to $74,999 | 83 (15.3%) | 31 (9.2%) |
| $75,000 to $99,999 | 144 (26.5%) | 16 (4.8%) |
| $100,000 to $149,999 | 42 (7.7%) | 74 (22.0%) |
| $150,000 or more | 163 (30.0%) | 51 (15.2%) |
| Total | 544 (100.0%) | 336 (100.0%) |
Property Value to Household Income Ratio in Old Saybrook Center
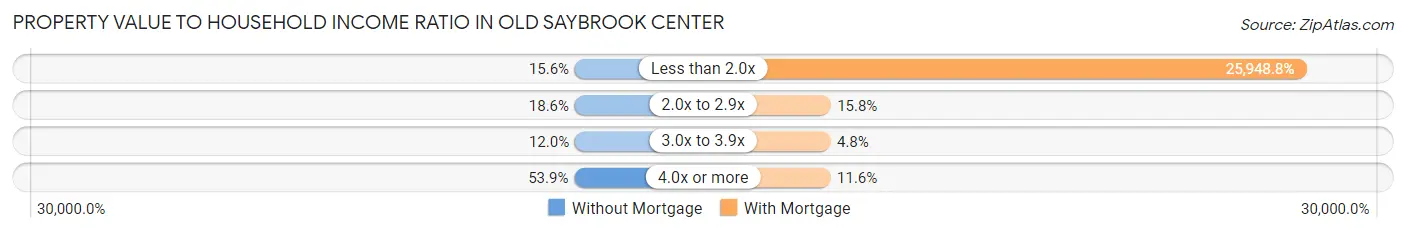
| Value-to-Income Ratio | Without Mortgage | With Mortgage |
| Less than 2.0x | 85 (15.6%) | 87,188 (25,948.8%) |
| 2.0x to 2.9x | 101 (18.6%) | 53 (15.8%) |
| 3.0x to 3.9x | 65 (11.9%) | 16 (4.8%) |
| 4.0x or more | 293 (53.9%) | 39 (11.6%) |
| Total | 544 (100.0%) | 336 (100.0%) |
Real Estate Taxes by Mortgage Status in Old Saybrook Center
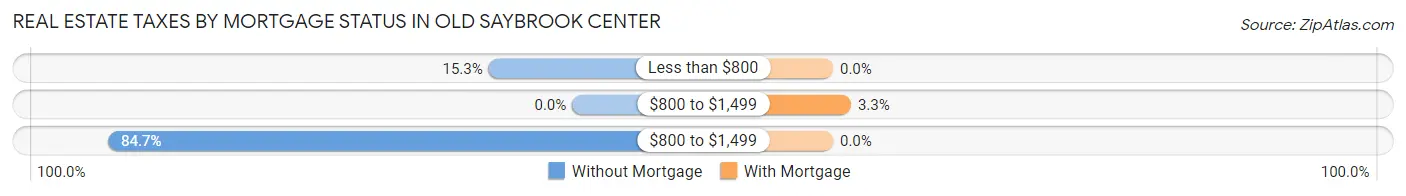
| Property Taxes | Without Mortgage | With Mortgage |
| Less than $800 | 83 (15.3%) | 0 (0.0%) |
| $800 to $1,499 | 0 (0.0%) | 11 (3.3%) |
| $800 to $1,499 | 461 (84.7%) | 0 (0.0%) |
| Total | 544 (100.0%) | 336 (100.0%) |
Health & Disability in Old Saybrook Center
Health Insurance Coverage by Age in Old Saybrook Center
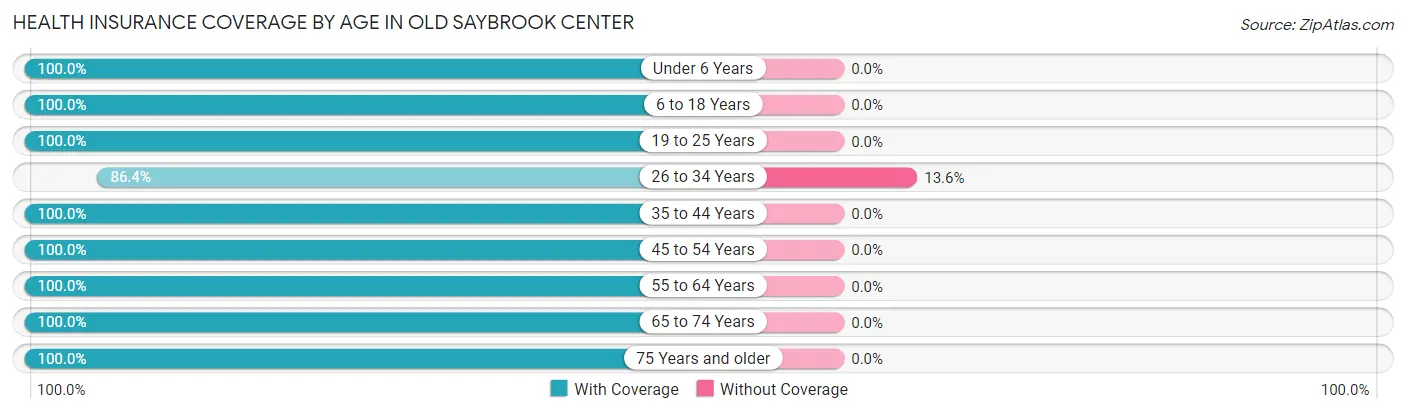
| Age Bracket | With Coverage | Without Coverage |
| Under 6 Years | 112 (100.0%) | 0 (0.0%) |
| 6 to 18 Years | 130 (100.0%) | 0 (0.0%) |
| 19 to 25 Years | 113 (100.0%) | 0 (0.0%) |
| 26 to 34 Years | 146 (86.4%) | 23 (13.6%) |
| 35 to 44 Years | 147 (100.0%) | 0 (0.0%) |
| 45 to 54 Years | 245 (100.0%) | 0 (0.0%) |
| 55 to 64 Years | 303 (100.0%) | 0 (0.0%) |
| 65 to 74 Years | 256 (100.0%) | 0 (0.0%) |
| 75 Years and older | 542 (100.0%) | 0 (0.0%) |
| Total | 1,994 (98.9%) | 23 (1.1%) |
Health Insurance Coverage by Citizenship Status in Old Saybrook Center
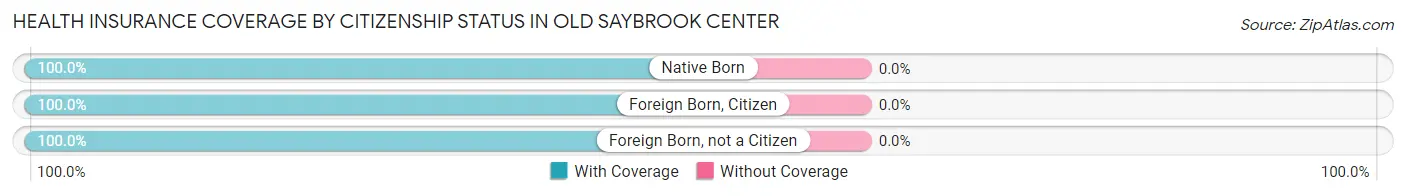
| Citizenship Status | With Coverage | Without Coverage |
| Native Born | 112 (100.0%) | 0 (0.0%) |
| Foreign Born, Citizen | 130 (100.0%) | 0 (0.0%) |
| Foreign Born, not a Citizen | 113 (100.0%) | 0 (0.0%) |
Health Insurance Coverage by Household Income in Old Saybrook Center
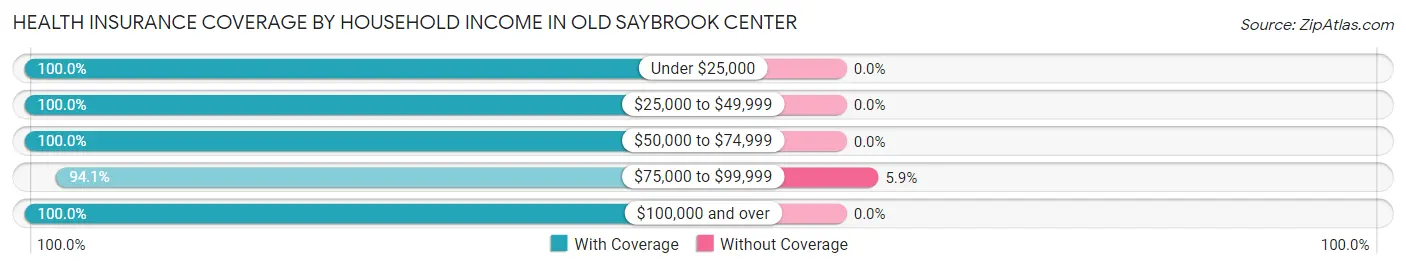
| Household Income | With Coverage | Without Coverage |
| Under $25,000 | 119 (100.0%) | 0 (0.0%) |
| $25,000 to $49,999 | 374 (100.0%) | 0 (0.0%) |
| $50,000 to $74,999 | 204 (100.0%) | 0 (0.0%) |
| $75,000 to $99,999 | 364 (94.1%) | 23 (5.9%) |
| $100,000 and over | 925 (100.0%) | 0 (0.0%) |
Public vs Private Health Insurance Coverage by Age in Old Saybrook Center
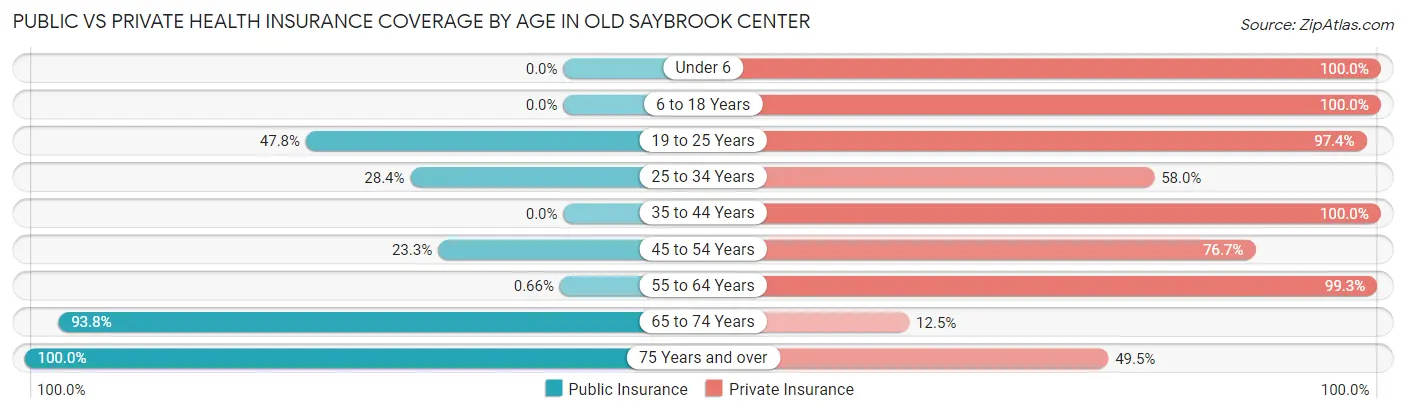
| Age Bracket | Public Insurance | Private Insurance |
| Under 6 | 0 (0.0%) | 112 (100.0%) |
| 6 to 18 Years | 0 (0.0%) | 130 (100.0%) |
| 19 to 25 Years | 54 (47.8%) | 110 (97.4%) |
| 25 to 34 Years | 48 (28.4%) | 98 (58.0%) |
| 35 to 44 Years | 0 (0.0%) | 147 (100.0%) |
| 45 to 54 Years | 57 (23.3%) | 188 (76.7%) |
| 55 to 64 Years | 2 (0.7%) | 301 (99.3%) |
| 65 to 74 Years | 240 (93.8%) | 32 (12.5%) |
| 75 Years and over | 542 (100.0%) | 268 (49.4%) |
| Total | 943 (46.8%) | 1,386 (68.7%) |
Disability Status by Sex by Age in Old Saybrook Center
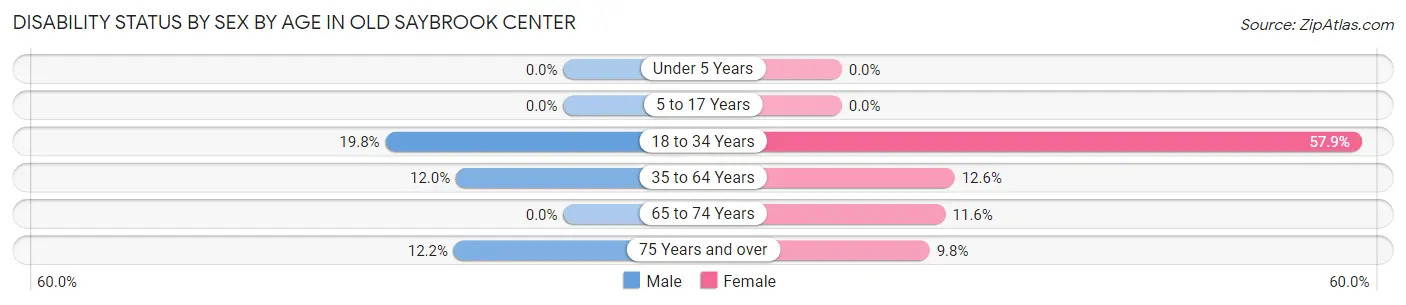
| Age Bracket | Male | Female |
| Under 5 Years | 0 (0.0%) | 0 (0.0%) |
| 5 to 17 Years | 0 (0.0%) | 0 (0.0%) |
| 18 to 34 Years | 22 (19.8%) | 99 (57.9%) |
| 35 to 64 Years | 27 (11.9%) | 59 (12.6%) |
| 65 to 74 Years | 0 (0.0%) | 17 (11.6%) |
| 75 Years and over | 25 (12.2%) | 33 (9.8%) |
Disability Class by Sex by Age in Old Saybrook Center
Disability Class: Hearing Difficulty
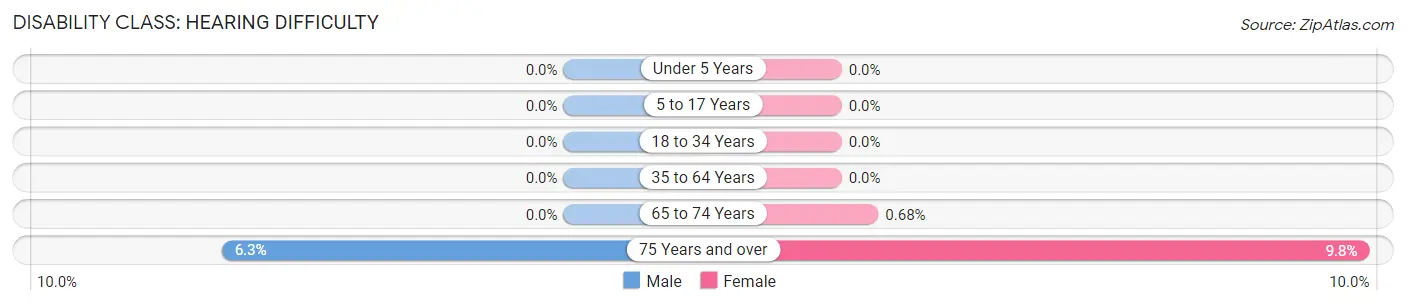
| Age Bracket | Male | Female |
| Under 5 Years | 0 (0.0%) | 0 (0.0%) |
| 5 to 17 Years | 0 (0.0%) | 0 (0.0%) |
| 18 to 34 Years | 0 (0.0%) | 0 (0.0%) |
| 35 to 64 Years | 0 (0.0%) | 0 (0.0%) |
| 65 to 74 Years | 0 (0.0%) | 1 (0.7%) |
| 75 Years and over | 13 (6.3%) | 33 (9.8%) |
Disability Class: Vision Difficulty
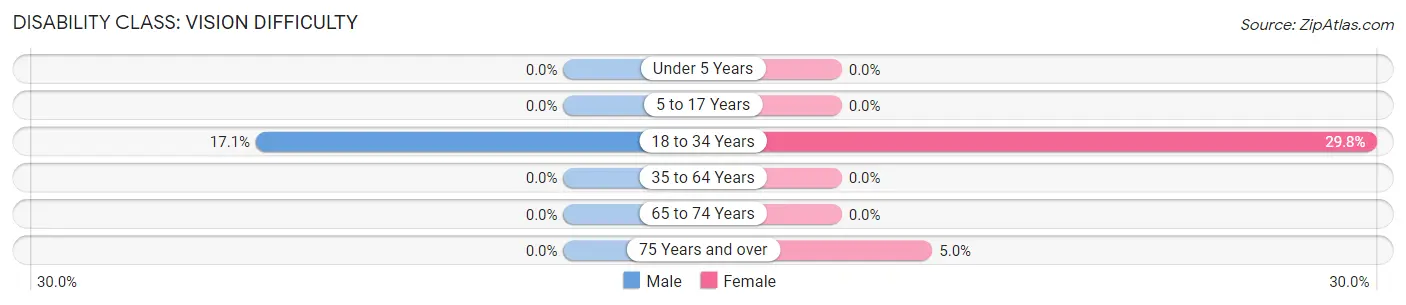
| Age Bracket | Male | Female |
| Under 5 Years | 0 (0.0%) | 0 (0.0%) |
| 5 to 17 Years | 0 (0.0%) | 0 (0.0%) |
| 18 to 34 Years | 19 (17.1%) | 51 (29.8%) |
| 35 to 64 Years | 0 (0.0%) | 0 (0.0%) |
| 65 to 74 Years | 0 (0.0%) | 0 (0.0%) |
| 75 Years and over | 0 (0.0%) | 17 (5.0%) |
Disability Class: Cognitive Difficulty
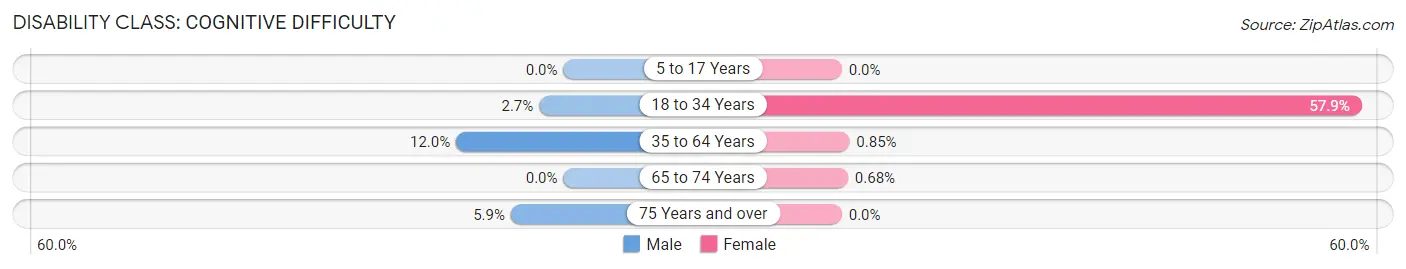
| Age Bracket | Male | Female |
| 5 to 17 Years | 0 (0.0%) | 0 (0.0%) |
| 18 to 34 Years | 3 (2.7%) | 99 (57.9%) |
| 35 to 64 Years | 27 (11.9%) | 4 (0.9%) |
| 65 to 74 Years | 0 (0.0%) | 1 (0.7%) |
| 75 Years and over | 12 (5.9%) | 0 (0.0%) |
Disability Class: Ambulatory Difficulty
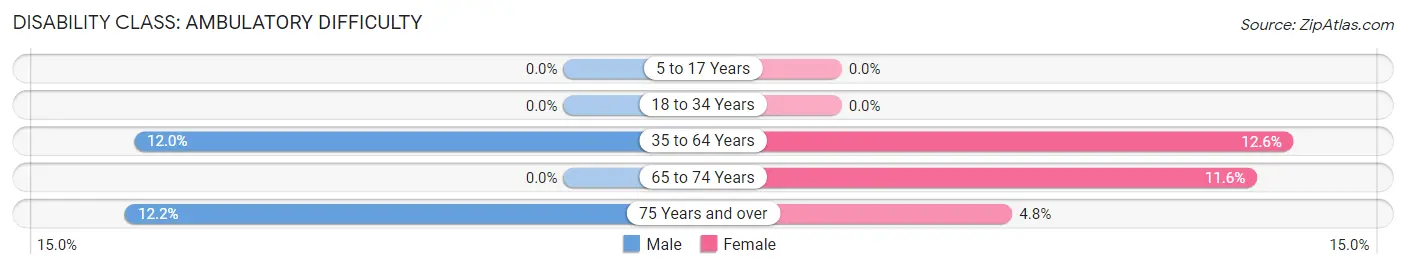
| Age Bracket | Male | Female |
| 5 to 17 Years | 0 (0.0%) | 0 (0.0%) |
| 18 to 34 Years | 0 (0.0%) | 0 (0.0%) |
| 35 to 64 Years | 27 (11.9%) | 59 (12.6%) |
| 65 to 74 Years | 0 (0.0%) | 17 (11.6%) |
| 75 Years and over | 25 (12.2%) | 16 (4.8%) |
Disability Class: Self-Care Difficulty
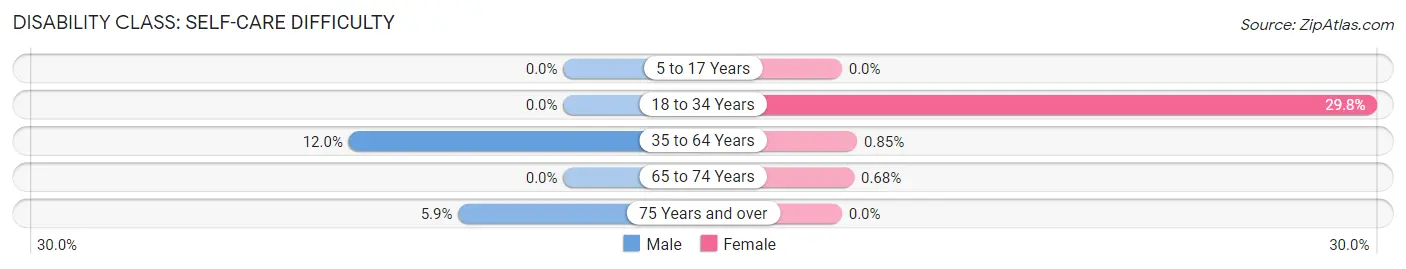
| Age Bracket | Male | Female |
| 5 to 17 Years | 0 (0.0%) | 0 (0.0%) |
| 18 to 34 Years | 0 (0.0%) | 51 (29.8%) |
| 35 to 64 Years | 27 (11.9%) | 4 (0.9%) |
| 65 to 74 Years | 0 (0.0%) | 1 (0.7%) |
| 75 Years and over | 12 (5.9%) | 0 (0.0%) |
Technology Access in Old Saybrook Center
Computing Device Access in Old Saybrook Center
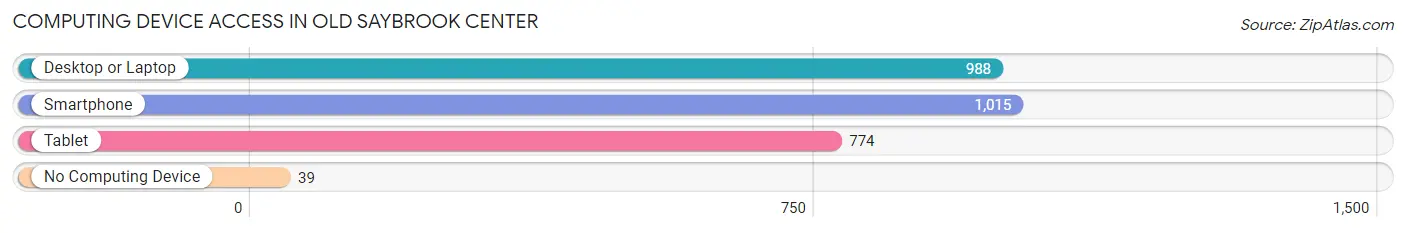
| Device Type | # Households | % Households |
| Desktop or Laptop | 988 | 87.3% |
| Smartphone | 1,015 | 89.7% |
| Tablet | 774 | 68.4% |
| No Computing Device | 39 | 3.5% |
| Total | 1,132 | 100.0% |
Internet Access in Old Saybrook Center
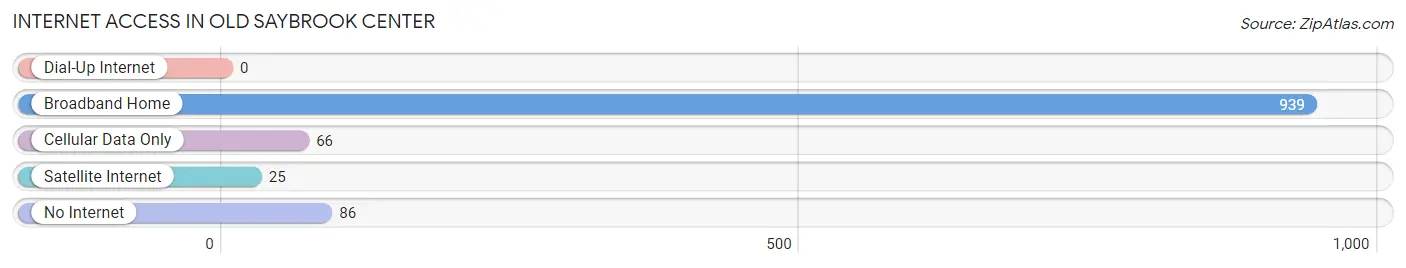
| Internet Type | # Households | % Households |
| Dial-Up Internet | 0 | 0.0% |
| Broadband Home | 939 | 83.0% |
| Cellular Data Only | 66 | 5.8% |
| Satellite Internet | 25 | 2.2% |
| No Internet | 86 | 7.6% |
| Total | 1,132 | 100.0% |
Old Saybrook Center Summary
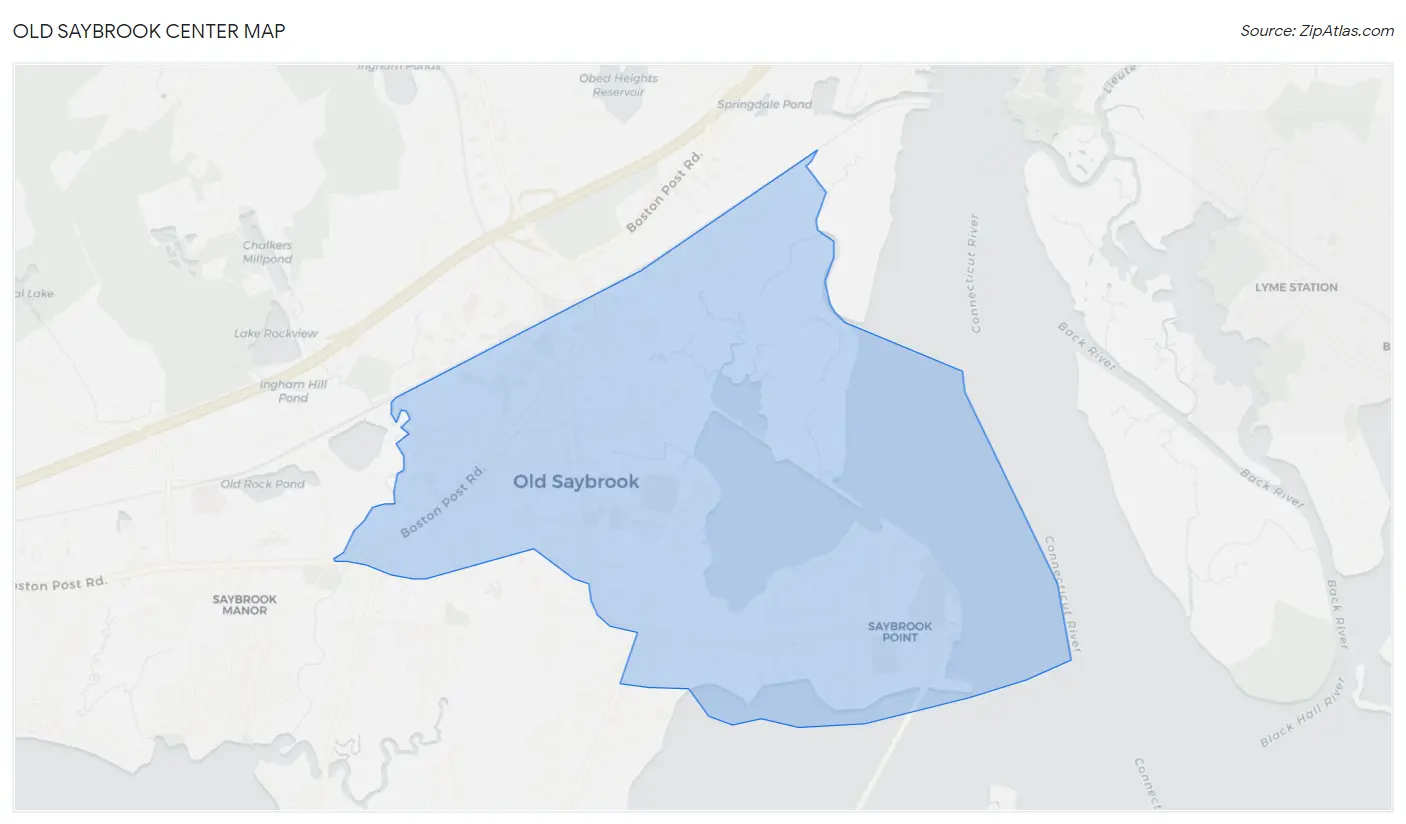
Old Saybrook Center is a census-designated place (CDP) located in the town of Old Saybrook, Connecticut, in Middlesex County. It is situated on the east bank of the Connecticut River, at the mouth of the Connecticut River, and is part of the larger New Haven-Bridgeport-Stamford-New London metropolitan area. As of the 2010 census, the population of Old Saybrook Center was 1,717.
History
The area that is now Old Saybrook Center was originally inhabited by the Wangunk Native American tribe. The first European settlers arrived in the area in 1635, and the town of Old Saybrook was officially established in 1636. The town was named after Saye and Sele, two English lords who had been granted the land by King Charles I.
In the late 17th century, Old Saybrook became an important port for the Connecticut Colony. It was the site of the first lighthouse in the state, and was a major center for shipbuilding and trade. During the Revolutionary War, the town was the site of a major battle between the British and American forces.
In the 19th century, Old Saybrook Center became a popular summer resort destination. The town was home to several large hotels, and was a popular spot for wealthy New Yorkers to escape the summer heat.
Geography
Old Saybrook Center is located at 41°17'25" North, 72°30'17" West (41.290278, -72.504722). It is situated on the east bank of the Connecticut River, at the mouth of the Connecticut River, and is part of the larger New Haven-Bridgeport-Stamford-New London metropolitan area.
The CDP has a total area of 1.3 square miles, all of which is land. It is bordered by the towns of Old Saybrook, Westbrook, and Essex.
Economy
The economy of Old Saybrook Center is largely based on tourism and retail. The town is home to several small businesses, including restaurants, shops, and galleries. It is also home to the Old Saybrook Shopping Center, which features a variety of stores and restaurants.
The town is also home to several marinas, which provide services to boaters and fishermen. The marinas also offer boat rentals and fishing charters.
Demographics
As of the 2010 census, there were 1,717 people, 745 households, and 463 families residing in the CDP. The population density was 1,312.7 people per square mile. There were 817 housing units at an average density of 622.7 per square mile.
The racial makeup of the CDP was 95.2% White, 0.9% African American, 0.6% Native American, 0.9% Asian, 0.1% Pacific Islander, 0.7% from other races, and 1.6% from two or more races. Hispanic or Latino of any race were 3.2% of the population.
There were 745 households, out of which 24.3% had children under the age of 18 living with them, 48.2% were married couples living together, 10.2% had a female householder with no husband present, and 37.3% were non-families. 32.2% of all households were made up of individuals, and 14.2% had someone living alone who was 65 years of age or older. The average household size was 2.30 and the average family size was 2.90.
In the CDP, the population was spread out, with 20.3% under the age of 18, 5.2% from 18 to 24, 24.2% from 25 to 44, 30.2% from 45 to 64, and 20.1% who were 65 years of age or older. The median age was 45 years. For every 100 females, there were 91.2 males. For every 100 females age 18 and over, there were 88.2 males.
The median income for a household in the CDP was $60,938, and the median income for a family was $76,250. Males had a median income of $50,000 versus $41,250 for females. The per capita income for the CDP was $35,945. About 4.2% of families and 6.2% of the population were below the poverty line, including 8.3% of those under age 18 and 4.2% of those age 65 or over.
Common Questions
What is Per Capita Income in Old Saybrook Center?
Per Capita income in Old Saybrook Center is $72,434.
What is the Median Family Income in Old Saybrook Center?
Median Family Income in Old Saybrook Center is $145,500.
What is the Median Household income in Old Saybrook Center?
Median Household Income in Old Saybrook Center is $79,712.
What is Income or Wage Gap in Old Saybrook Center?
Income or Wage Gap in Old Saybrook Center is 16.3%.
Women in Old Saybrook Center earn 83.7 cents for every dollar earned by a man.
What is Inequality or Gini Index in Old Saybrook Center?
Inequality or Gini Index in Old Saybrook Center is 0.52.
What is the Total Population of Old Saybrook Center?
Total Population of Old Saybrook Center is 2,017.
What is the Total Male Population of Old Saybrook Center?
Total Male Population of Old Saybrook Center is 792.
What is the Total Female Population of Old Saybrook Center?
Total Female Population of Old Saybrook Center is 1,225.
What is the Ratio of Males per 100 Females in Old Saybrook Center?
There are 64.65 Males per 100 Females in Old Saybrook Center.
What is the Ratio of Females per 100 Males in Old Saybrook Center?
There are 154.67 Females per 100 Males in Old Saybrook Center.
What is the Median Population Age in Old Saybrook Center?
Median Population Age in Old Saybrook Center is 60.4 Years.
What is the Average Family Size in Old Saybrook Center
Average Family Size in Old Saybrook Center is 2.6 People.
What is the Average Household Size in Old Saybrook Center
Average Household Size in Old Saybrook Center is 1.8 People.
How Large is the Labor Force in Old Saybrook Center?
There are 1,053 People in the Labor Forcein in Old Saybrook Center.
What is the Percentage of People in the Labor Force in Old Saybrook Center?
56.5% of People are in the Labor Force in Old Saybrook Center.