New Preston, CT Map & Demographics
New Preston Map
New Preston Overview
$63,182
PER CAPITA INCOME
$87,054
AVG FAMILY INCOME
$85,357
AVG HOUSEHOLD INCOME
0.52
INEQUALITY / GINI INDEX
1,026
TOTAL POPULATION
405
MALE POPULATION
621
FEMALE POPULATION
65.22
MALES / 100 FEMALES
153.33
FEMALES / 100 MALES
48.9
MEDIAN AGE
2.8
AVG FAMILY SIZE
2.3
AVG HOUSEHOLD SIZE
494
LABOR FORCE [ PEOPLE ]
62.8%
PERCENT IN LABOR FORCE
1.4%
UNEMPLOYMENT RATE
New Preston Area Codes
Income in New Preston
Income Overview in New Preston
Per Capita Income in New Preston is $63,182, while median incomes of families and households are $87,054 and $85,357 respectively.
| Characteristic | Number | Measure |
| Per Capita Income | 1,026 | $63,182 |
| Median Family Income | 245 | $87,054 |
| Mean Family Income | 245 | $117,923 |
| Median Household Income | 420 | $85,357 |
| Mean Household Income | 420 | $127,512 |
| Income Deficit | 245 | $0 |
| Wage / Income Gap (%) | 1,026 | 0.00% |
| Wage / Income Gap ($) | 1,026 | 100.00¢ per $1 |
| Gini / Inequality Index | 1,026 | 0.52 |
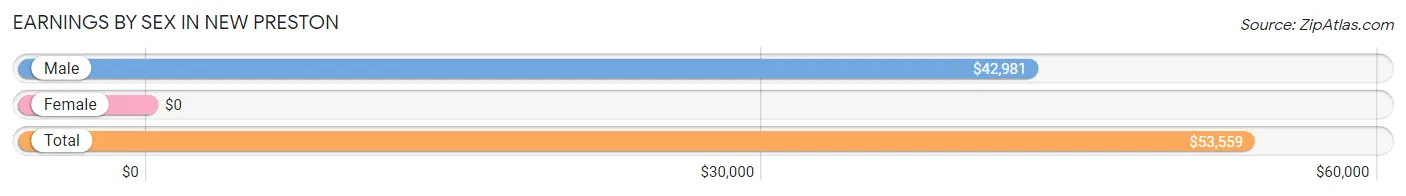
Earnings by Sex in New Preston
| Sex | Number | Average Earnings |
| Male | 199 (39.8%) | $42,981 |
| Female | 301 (60.2%) | $0 |
| Total | 500 (100.0%) | $53,559 |
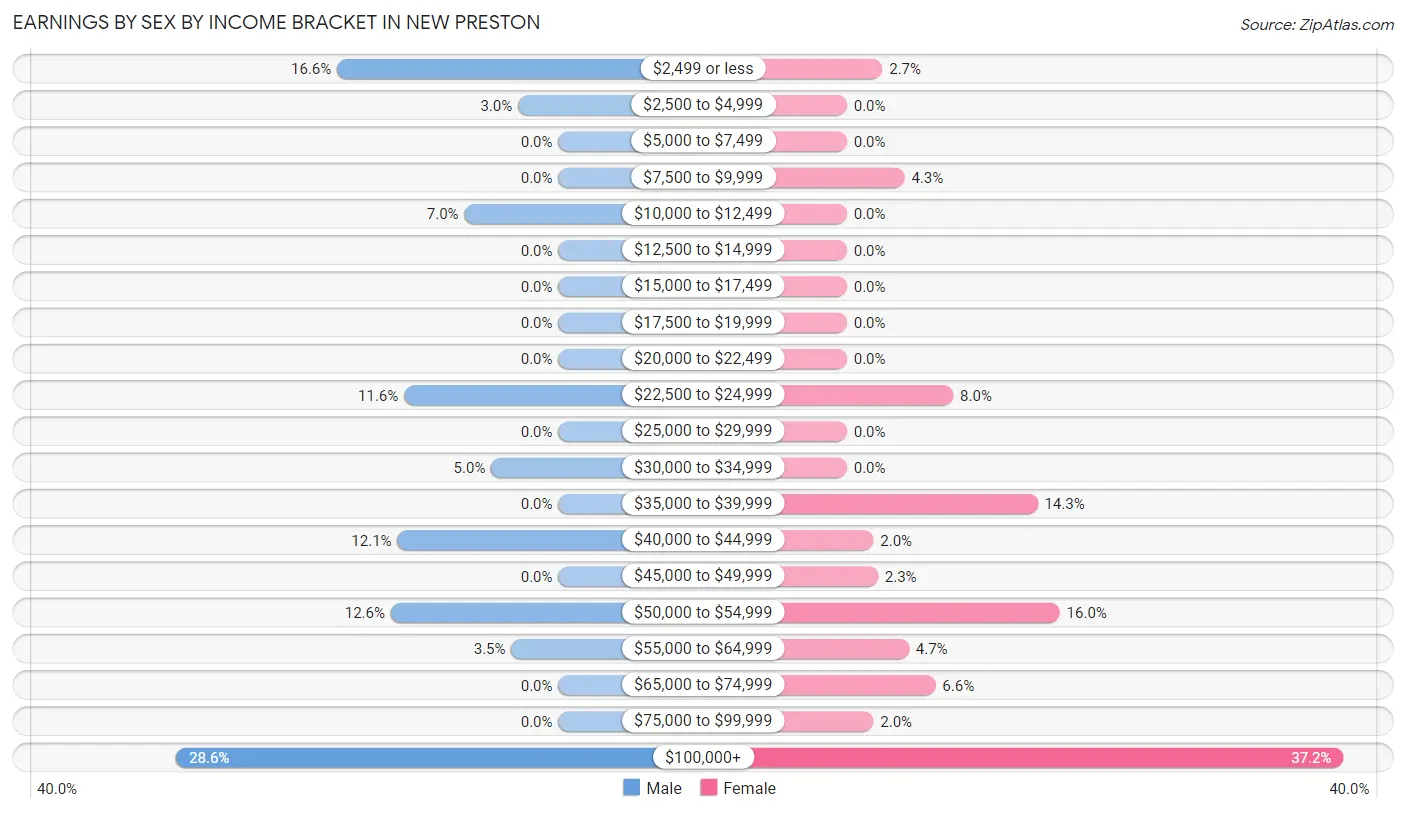
Earnings by Sex by Income Bracket in New Preston
The most common earnings brackets in New Preston are $100,000+ for men (57 | 28.6%) and $100,000+ for women (112 | 37.2%).
| Income | Male | Female |
| $2,499 or less | 33 (16.6%) | 8 (2.7%) |
| $2,500 to $4,999 | 6 (3.0%) | 0 (0.0%) |
| $5,000 to $7,499 | 0 (0.0%) | 0 (0.0%) |
| $7,500 to $9,999 | 0 (0.0%) | 13 (4.3%) |
| $10,000 to $12,499 | 14 (7.0%) | 0 (0.0%) |
| $12,500 to $14,999 | 0 (0.0%) | 0 (0.0%) |
| $15,000 to $17,499 | 0 (0.0%) | 0 (0.0%) |
| $17,500 to $19,999 | 0 (0.0%) | 0 (0.0%) |
| $20,000 to $22,499 | 0 (0.0%) | 0 (0.0%) |
| $22,500 to $24,999 | 23 (11.6%) | 24 (8.0%) |
| $25,000 to $29,999 | 0 (0.0%) | 0 (0.0%) |
| $30,000 to $34,999 | 10 (5.0%) | 0 (0.0%) |
| $35,000 to $39,999 | 0 (0.0%) | 43 (14.3%) |
| $40,000 to $44,999 | 24 (12.1%) | 6 (2.0%) |
| $45,000 to $49,999 | 0 (0.0%) | 7 (2.3%) |
| $50,000 to $54,999 | 25 (12.6%) | 48 (16.0%) |
| $55,000 to $64,999 | 7 (3.5%) | 14 (4.6%) |
| $65,000 to $74,999 | 0 (0.0%) | 20 (6.6%) |
| $75,000 to $99,999 | 0 (0.0%) | 6 (2.0%) |
| $100,000+ | 57 (28.6%) | 112 (37.2%) |
| Total | 199 (100.0%) | 301 (100.0%) |
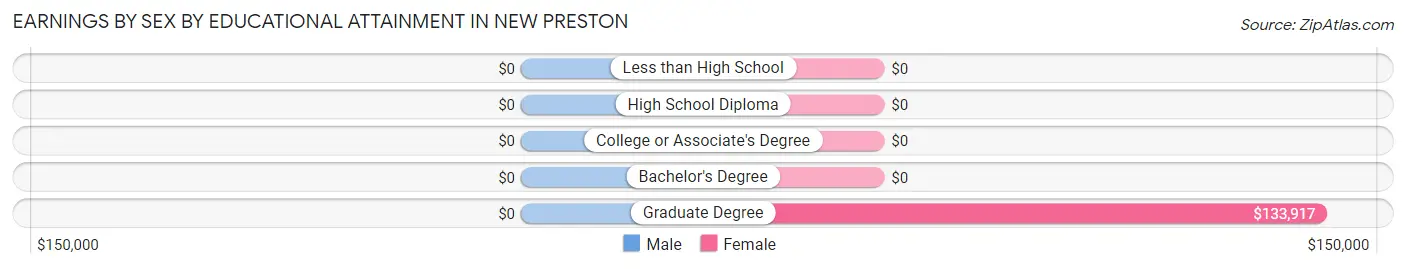
Earnings by Sex by Educational Attainment in New Preston
| Educational Attainment | Male Income | Female Income |
| Less than High School | - | - |
| High School Diploma | - | - |
| College or Associate's Degree | - | - |
| Bachelor's Degree | - | - |
| Graduate Degree | - | - |
| Total | $47,500 | $0 |
Family Income in New Preston
Family Income Brackets in New Preston
According to the New Preston family income data, there are 60 families falling into the $100,000 to $149,999 income range, which is the most common income bracket and makes up 24.5% of all families.
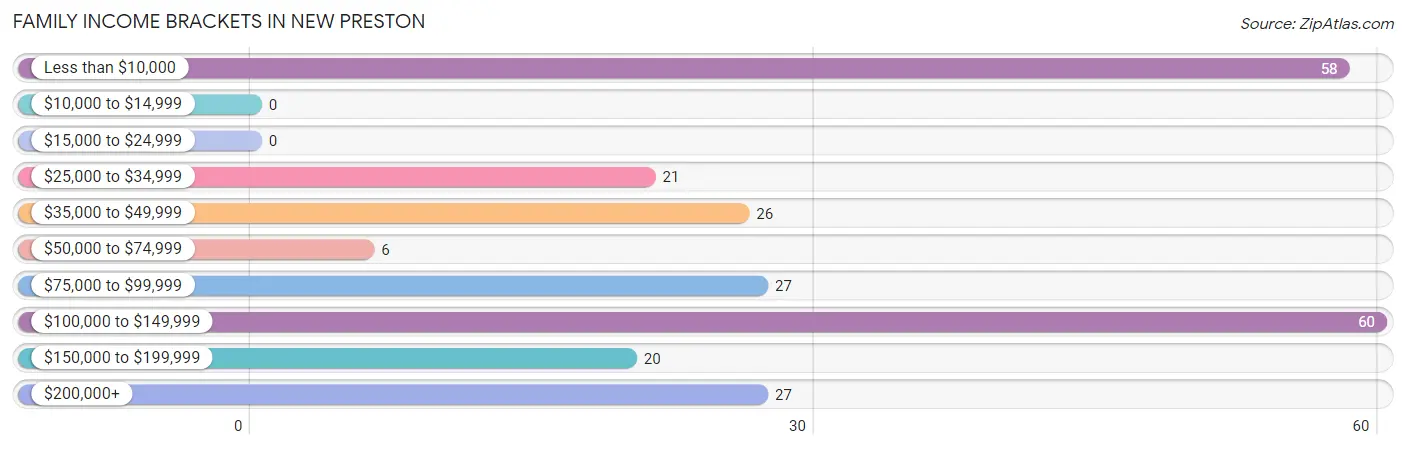
| Income Bracket | # Families | % Families |
| Less than $10,000 | 58 | 23.7% |
| $10,000 to $14,999 | 0 | 0.0% |
| $15,000 to $24,999 | 0 | 0.0% |
| $25,000 to $34,999 | 21 | 8.6% |
| $35,000 to $49,999 | 26 | 10.6% |
| $50,000 to $74,999 | 6 | 2.4% |
| $75,000 to $99,999 | 27 | 11.0% |
| $100,000 to $149,999 | 60 | 24.5% |
| $150,000 to $199,999 | 20 | 8.2% |
| $200,000+ | 27 | 11.0% |
Family Income by Famaliy Size in New Preston
3-person families (69 | 28.2%) account for the highest median family income in New Preston with $133,917 per family, while 3-person families (69 | 28.2%) have the highest median income of $44,639 per family member.
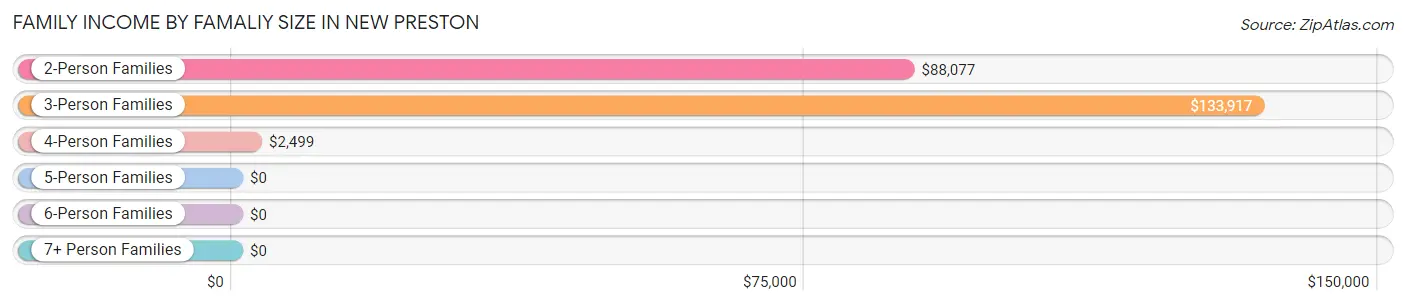
| Income Bracket | # Families | Median Income |
| 2-Person Families | 98 (40.0%) | $88,077 |
| 3-Person Families | 69 (28.2%) | $133,917 |
| 4-Person Families | 78 (31.8%) | $2,499 |
| 5-Person Families | 0 (0.0%) | $0 |
| 6-Person Families | 0 (0.0%) | $0 |
| 7+ Person Families | 0 (0.0%) | $0 |
| Total | 245 (100.0%) | $87,054 |
Family Income by Number of Earners in New Preston
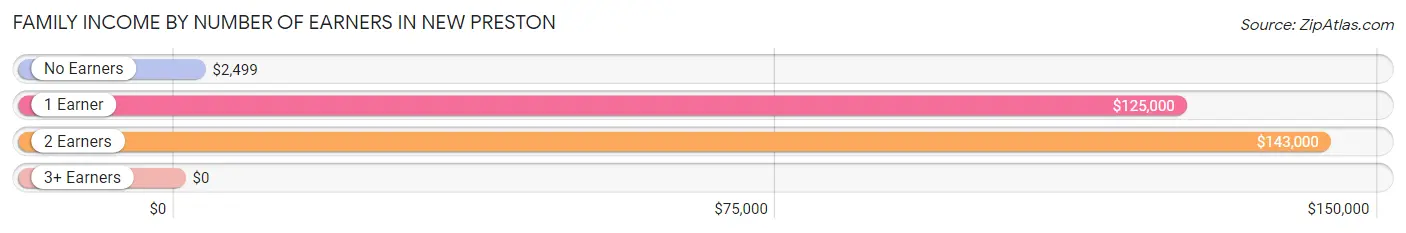
| Number of Earners | # Families | Median Income |
| No Earners | 105 (42.9%) | $2,499 |
| 1 Earner | 62 (25.3%) | $125,000 |
| 2 Earners | 72 (29.4%) | $143,000 |
| 3+ Earners | 6 (2.5%) | $0 |
| Total | 245 (100.0%) | $87,054 |
Household Income in New Preston
Household Income Brackets in New Preston
With 74 households falling in the category, the $15,000 to $24,999 income range is the most frequent in New Preston, accounting for 17.6% of all households. In contrast, only 6 households (1.4%) fall into the $10,000 to $14,999 income bracket, making it the least populous group.
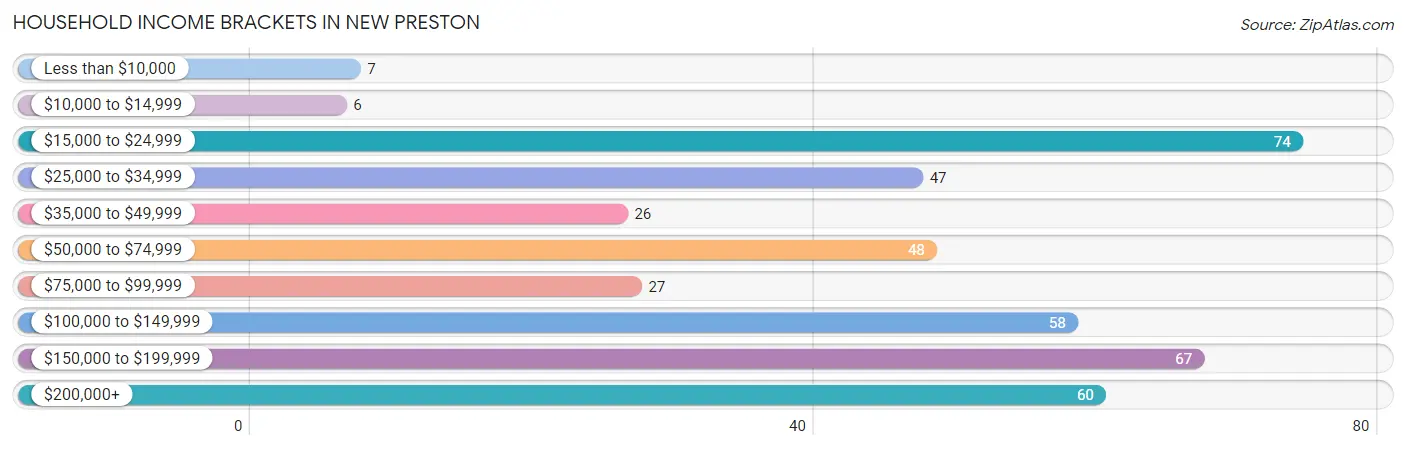
| Income Bracket | # Households | % Households |
| Less than $10,000 | 7 | 1.7% |
| $10,000 to $14,999 | 6 | 1.4% |
| $15,000 to $24,999 | 74 | 17.6% |
| $25,000 to $34,999 | 47 | 11.2% |
| $35,000 to $49,999 | 26 | 6.2% |
| $50,000 to $74,999 | 48 | 11.4% |
| $75,000 to $99,999 | 27 | 6.4% |
| $100,000 to $149,999 | 58 | 13.8% |
| $150,000 to $199,999 | 67 | 16.0% |
| $200,000+ | 60 | 14.3% |
Household Income by Householder Age in New Preston
The median household income in New Preston is $85,357, with the highest median household income of $144,083 found in the 45 to 64 years age bracket for the primary householder. A total of 145 households (34.5%) fall into this category.
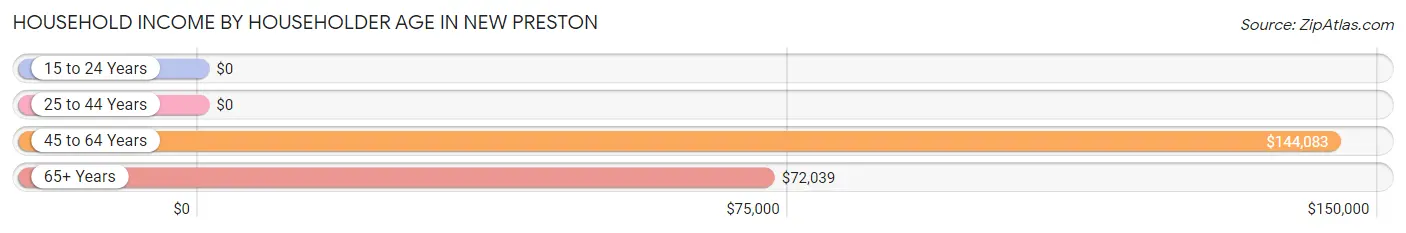
| Income Bracket | # Households | Median Income |
| 15 to 24 Years | 0 (0.0%) | $0 |
| 25 to 44 Years | 100 (23.8%) | $0 |
| 45 to 64 Years | 145 (34.5%) | $144,083 |
| 65+ Years | 175 (41.7%) | $72,039 |
| Total | 420 (100.0%) | $85,357 |
Poverty in New Preston
Income Below Poverty by Sex and Age in New Preston
With 29.6% poverty level for males and 20.4% for females among the residents of New Preston, under 5 year old males and 15 year old females are the most vulnerable to poverty, with 87 males (84.5%) and 9 females (100.0%) in their respective age groups living below the poverty level.
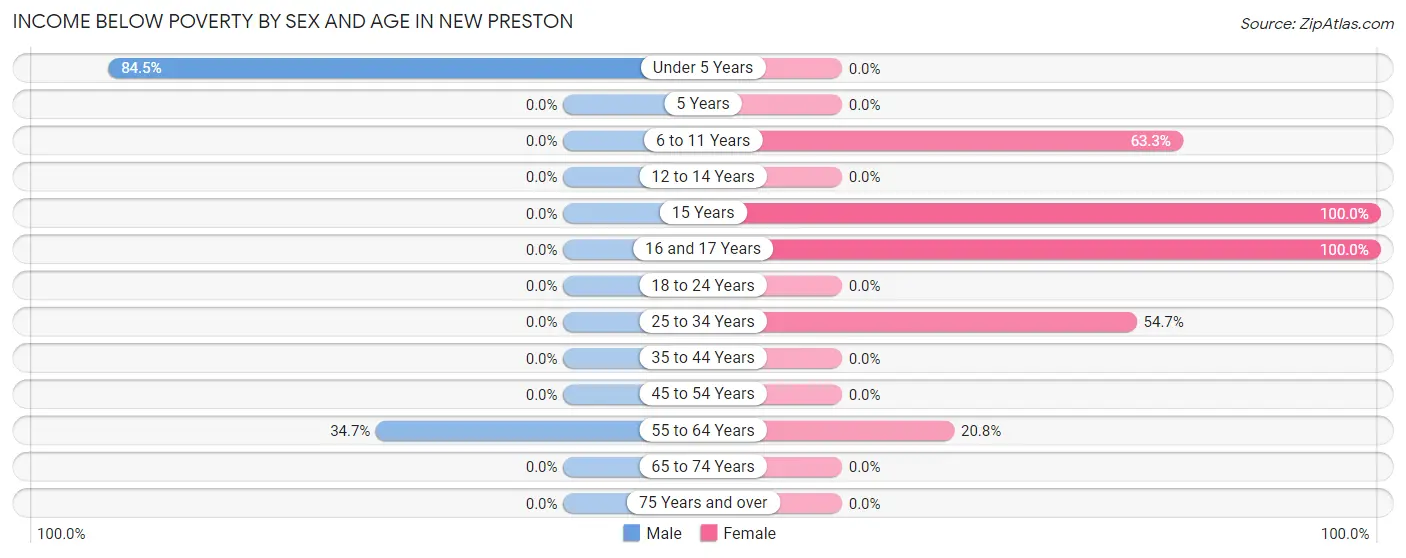
| Age Bracket | Male | Female |
| Under 5 Years | 87 (84.5%) | 0 (0.0%) |
| 5 Years | 0 (0.0%) | 0 (0.0%) |
| 6 to 11 Years | 0 (0.0%) | 31 (63.3%) |
| 12 to 14 Years | 0 (0.0%) | 0 (0.0%) |
| 15 Years | 0 (0.0%) | 9 (100.0%) |
| 16 and 17 Years | 0 (0.0%) | 9 (100.0%) |
| 18 to 24 Years | 0 (0.0%) | 0 (0.0%) |
| 25 to 34 Years | 0 (0.0%) | 58 (54.7%) |
| 35 to 44 Years | 0 (0.0%) | 0 (0.0%) |
| 45 to 54 Years | 0 (0.0%) | 0 (0.0%) |
| 55 to 64 Years | 33 (34.7%) | 20 (20.8%) |
| 65 to 74 Years | 0 (0.0%) | 0 (0.0%) |
| 75 Years and over | 0 (0.0%) | 0 (0.0%) |
| Total | 120 (29.6%) | 127 (20.4%) |
Income Above Poverty by Sex and Age in New Preston
According to the poverty statistics in New Preston, males aged 6 to 11 years and females aged under 5 years are the age groups that are most secure financially, with 100.0% of males and 100.0% of females in these age groups living above the poverty line.
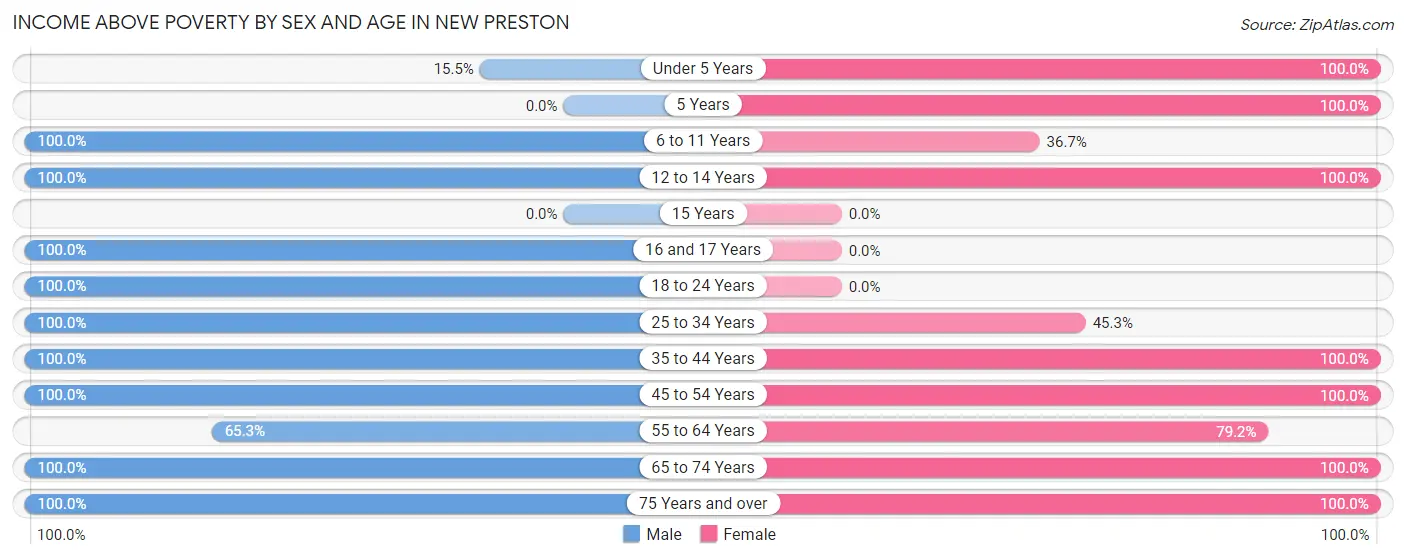
| Age Bracket | Male | Female |
| Under 5 Years | 16 (15.5%) | 6 (100.0%) |
| 5 Years | 0 (0.0%) | 12 (100.0%) |
| 6 to 11 Years | 25 (100.0%) | 18 (36.7%) |
| 12 to 14 Years | 20 (100.0%) | 15 (100.0%) |
| 15 Years | 0 (0.0%) | 0 (0.0%) |
| 16 and 17 Years | 21 (100.0%) | 0 (0.0%) |
| 18 to 24 Years | 8 (100.0%) | 0 (0.0%) |
| 25 to 34 Years | 10 (100.0%) | 48 (45.3%) |
| 35 to 44 Years | 53 (100.0%) | 22 (100.0%) |
| 45 to 54 Years | 7 (100.0%) | 128 (100.0%) |
| 55 to 64 Years | 62 (65.3%) | 76 (79.2%) |
| 65 to 74 Years | 34 (100.0%) | 118 (100.0%) |
| 75 Years and over | 29 (100.0%) | 51 (100.0%) |
| Total | 285 (70.4%) | 494 (79.5%) |
Income Below Poverty Among Married-Couple Families in New Preston
The poverty statistics for married-couple families in New Preston show that 5.3% or 7 of the total 132 families live below the poverty line. Families with 1 or 2 children have the highest poverty rate of 13.2%, comprising of 7 families. On the other hand, families with no children have the lowest poverty rate of 0.0%, which includes 0 families.
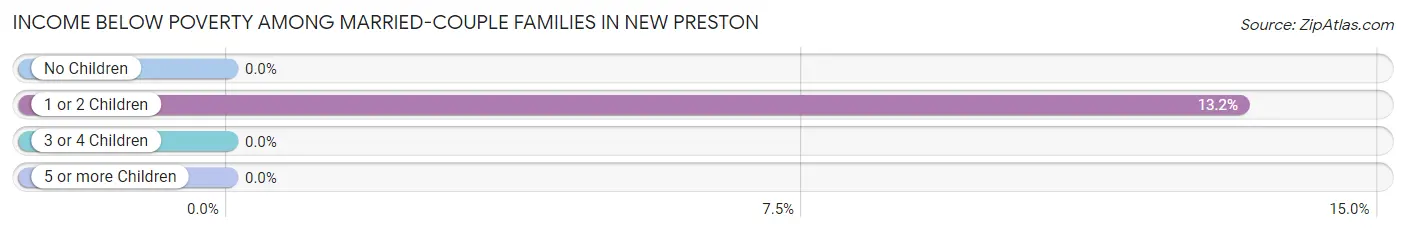
| Children | Above Poverty | Below Poverty |
| No Children | 79 (100.0%) | 0 (0.0%) |
| 1 or 2 Children | 46 (86.8%) | 7 (13.2%) |
| 3 or 4 Children | 0 (0.0%) | 0 (0.0%) |
| 5 or more Children | 0 (0.0%) | 0 (0.0%) |
| Total | 125 (94.7%) | 7 (5.3%) |
Income Below Poverty Among Single-Parent Households in New Preston
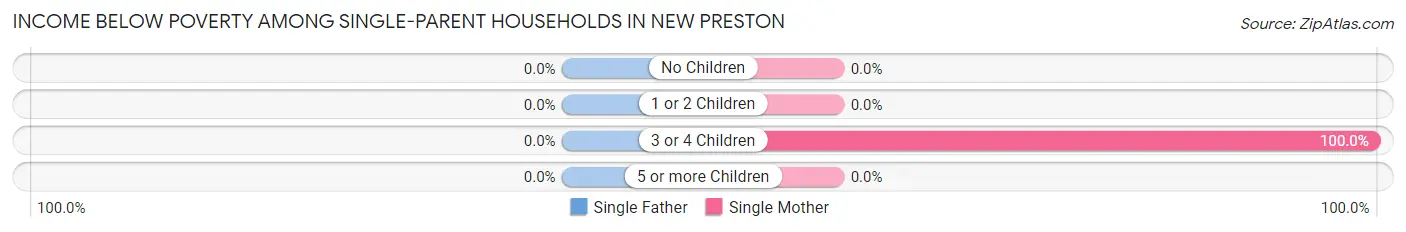
| Children | Single Father | Single Mother |
| No Children | 0 (0.0%) | 0 (0.0%) |
| 1 or 2 Children | 0 (0.0%) | 0 (0.0%) |
| 3 or 4 Children | 0 (0.0%) | 58 (100.0%) |
| 5 or more Children | 0 (0.0%) | 0 (0.0%) |
| Total | 0 (0.0%) | 58 (51.3%) |
Income Below Poverty Among Married-Couple vs Single-Parent Households in New Preston
The poverty data for New Preston shows that 7 of the married-couple family households (5.3%) and 58 of the single-parent households (51.3%) are living below the poverty level. Within the married-couple family households, those with 1 or 2 children have the highest poverty rate, with 7 households (13.2%) falling below the poverty line. Among the single-parent households, those with 3 or 4 children have the highest poverty rate, with 58 household (100.0%) living below poverty.
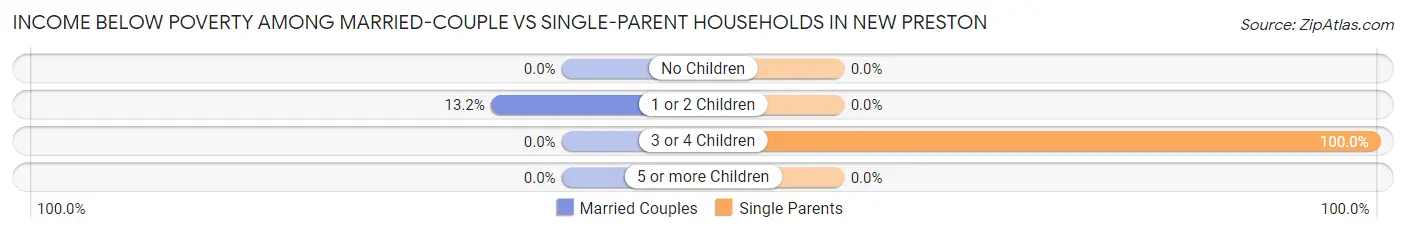
| Children | Married-Couple Families | Single-Parent Households |
| No Children | 0 (0.0%) | 0 (0.0%) |
| 1 or 2 Children | 7 (13.2%) | 0 (0.0%) |
| 3 or 4 Children | 0 (0.0%) | 58 (100.0%) |
| 5 or more Children | 0 (0.0%) | 0 (0.0%) |
| Total | 7 (5.3%) | 58 (51.3%) |
Race in New Preston
The most populous races in New Preston are White / Caucasian (752 | 73.3%), Two or more Races (206 | 20.1%), and Hispanic or Latino (176 | 17.2%).
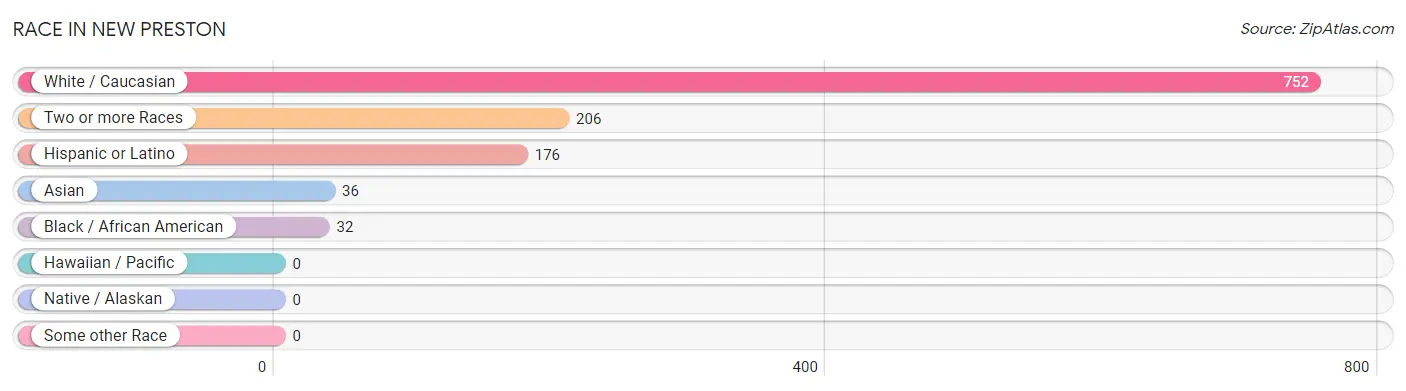
| Race | # Population | % Population |
| Asian | 36 | 3.5% |
| Black / African American | 32 | 3.1% |
| Hawaiian / Pacific | 0 | 0.0% |
| Hispanic or Latino | 176 | 17.2% |
| Native / Alaskan | 0 | 0.0% |
| White / Caucasian | 752 | 73.3% |
| Two or more Races | 206 | 20.1% |
| Some other Race | 0 | 0.0% |
| Total | 1,026 | 100.0% |
Ancestry in New Preston
The most populous ancestries reported in New Preston are Irish (274 | 26.7%), Italian (262 | 25.5%), German (250 | 24.4%), Cherokee (176 | 17.2%), and Colombian (176 | 17.2%), together accounting for 110.9% of all New Preston residents.
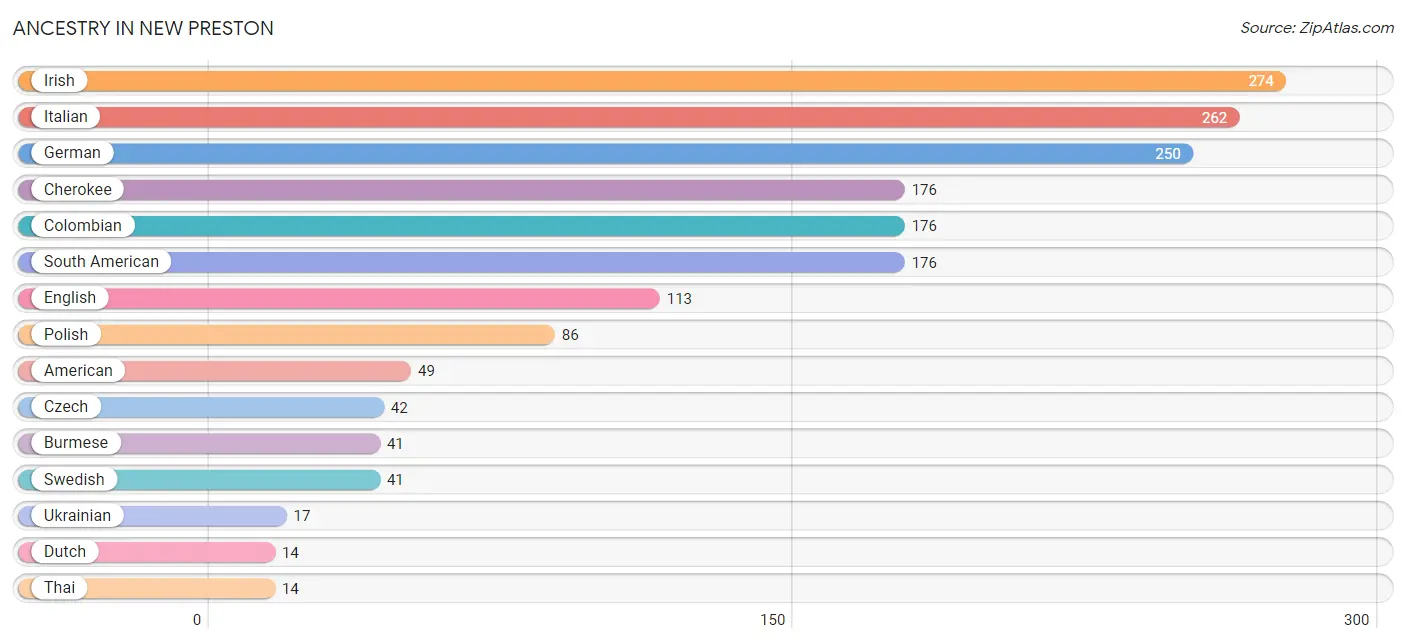
| Ancestry | # Population | % Population |
| American | 49 | 4.8% |
| Burmese | 41 | 4.0% |
| Cherokee | 176 | 17.2% |
| Colombian | 176 | 17.2% |
| Croatian | 8 | 0.8% |
| Czech | 42 | 4.1% |
| Dutch | 14 | 1.4% |
| English | 113 | 11.0% |
| European | 13 | 1.3% |
| French | 13 | 1.3% |
| French Canadian | 10 | 1.0% |
| German | 250 | 24.4% |
| Irish | 274 | 26.7% |
| Italian | 262 | 25.5% |
| Norwegian | 7 | 0.7% |
| Polish | 86 | 8.4% |
| Russian | 7 | 0.7% |
| Slovene | 7 | 0.7% |
| South American | 176 | 17.2% |
| Swedish | 41 | 4.0% |
| Thai | 14 | 1.4% |
| Ukrainian | 17 | 1.7% | View All 22 Rows |
Immigrants in New Preston
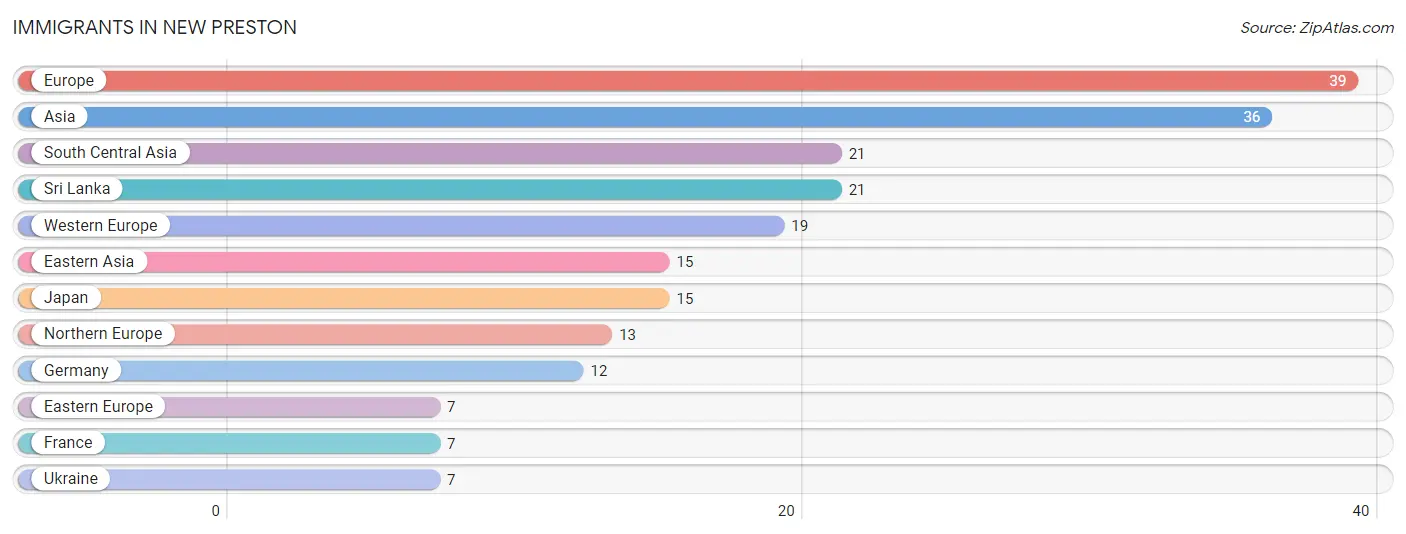
The most numerous immigrant groups reported in New Preston came from Europe (39 | 3.8%), Asia (36 | 3.5%), South Central Asia (21 | 2.1%), Sri Lanka (21 | 2.1%), and Western Europe (19 | 1.8%), together accounting for 13.3% of all New Preston residents.
| Immigration Origin | # Population | % Population |
| Asia | 36 | 3.5% |
| Eastern Asia | 15 | 1.5% |
| Eastern Europe | 7 | 0.7% |
| Europe | 39 | 3.8% |
| France | 7 | 0.7% |
| Germany | 12 | 1.2% |
| Japan | 15 | 1.5% |
| Northern Europe | 13 | 1.3% |
| South Central Asia | 21 | 2.1% |
| Sri Lanka | 21 | 2.1% |
| Ukraine | 7 | 0.7% |
| Western Europe | 19 | 1.8% | View All 12 Rows |
Sex and Age in New Preston
Sex and Age in New Preston
The most populous age groups in New Preston are Under 5 Years (103 | 25.4%) for men and 70 to 74 Years (91 | 14.6%) for women.
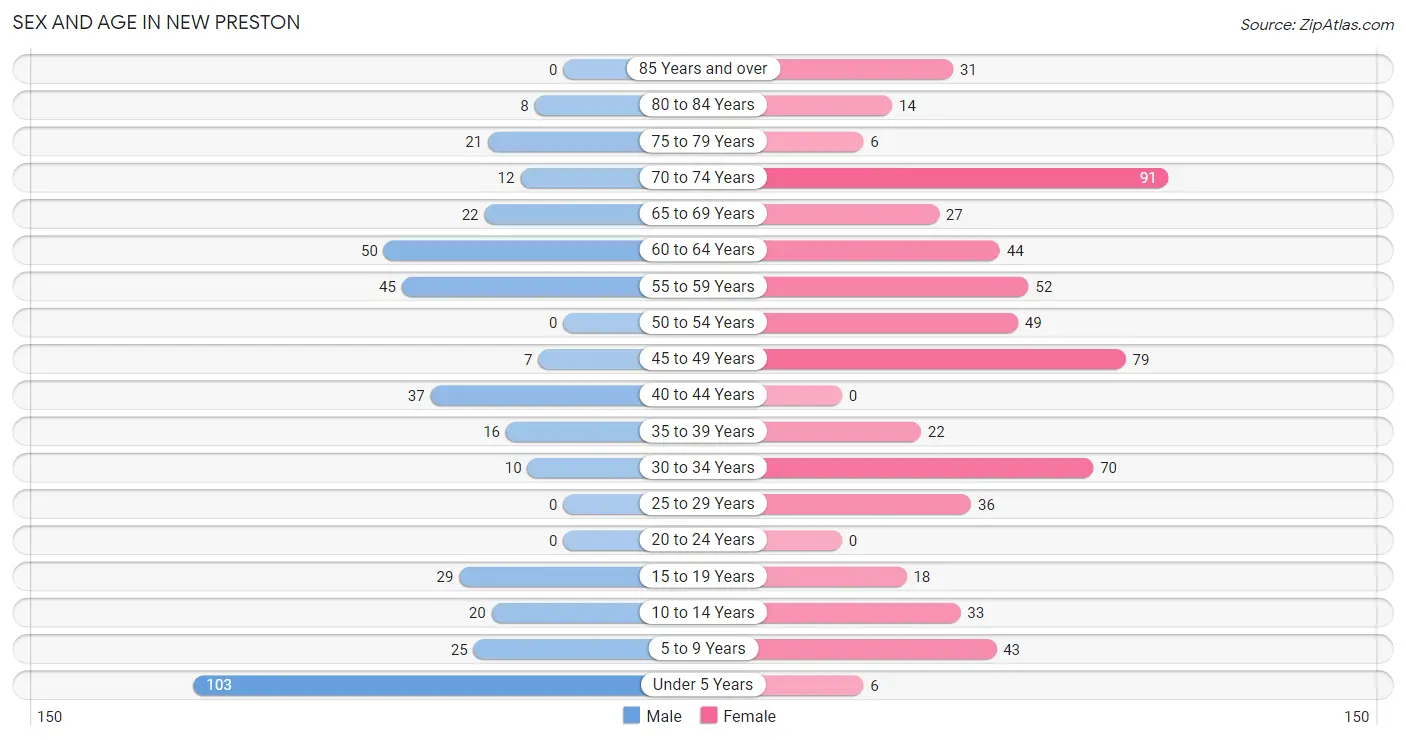
| Age Bracket | Male | Female |
| Under 5 Years | 103 (25.4%) | 6 (1.0%) |
| 5 to 9 Years | 25 (6.2%) | 43 (6.9%) |
| 10 to 14 Years | 20 (4.9%) | 33 (5.3%) |
| 15 to 19 Years | 29 (7.2%) | 18 (2.9%) |
| 20 to 24 Years | 0 (0.0%) | 0 (0.0%) |
| 25 to 29 Years | 0 (0.0%) | 36 (5.8%) |
| 30 to 34 Years | 10 (2.5%) | 70 (11.3%) |
| 35 to 39 Years | 16 (4.0%) | 22 (3.5%) |
| 40 to 44 Years | 37 (9.1%) | 0 (0.0%) |
| 45 to 49 Years | 7 (1.7%) | 79 (12.7%) |
| 50 to 54 Years | 0 (0.0%) | 49 (7.9%) |
| 55 to 59 Years | 45 (11.1%) | 52 (8.4%) |
| 60 to 64 Years | 50 (12.3%) | 44 (7.1%) |
| 65 to 69 Years | 22 (5.4%) | 27 (4.3%) |
| 70 to 74 Years | 12 (3.0%) | 91 (14.6%) |
| 75 to 79 Years | 21 (5.2%) | 6 (1.0%) |
| 80 to 84 Years | 8 (2.0%) | 14 (2.2%) |
| 85 Years and over | 0 (0.0%) | 31 (5.0%) |
| Total | 405 (100.0%) | 621 (100.0%) |
Families and Households in New Preston
Median Family Size in New Preston
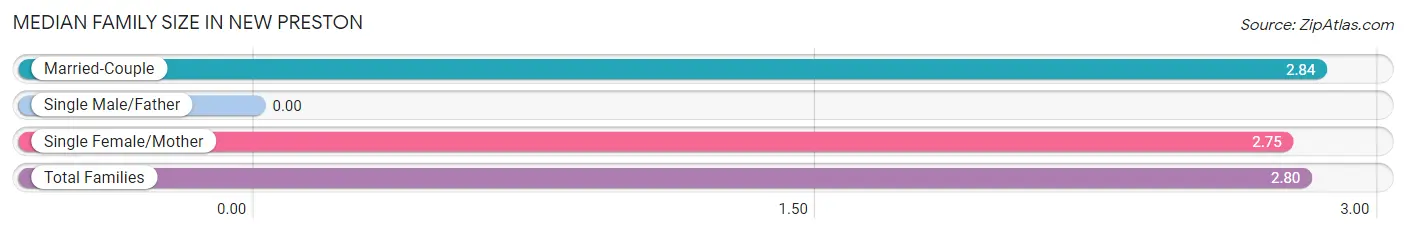
| Family Type | # Families | Family Size |
| Married-Couple | 132 (53.9%) | 2.84 |
| Single Male/Father | 0 (0.0%) | - |
| Single Female/Mother | 113 (46.1%) | 2.75 |
| Total Families | 245 (100.0%) | 2.80 |
Median Household Size in New Preston
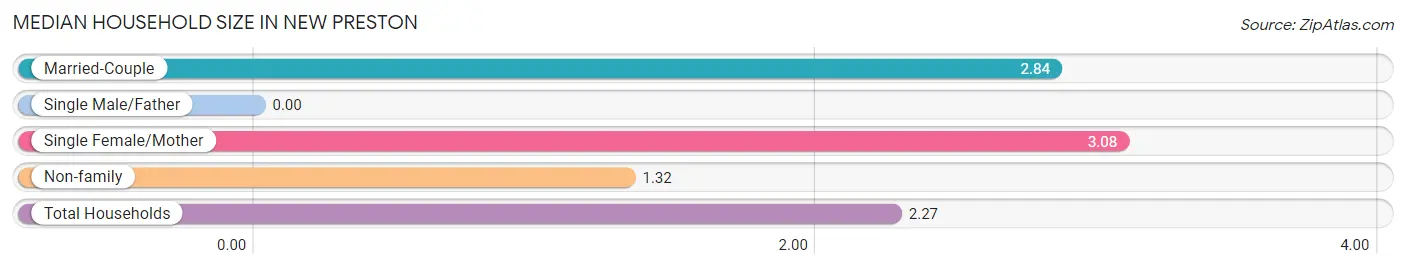
| Household Type | # Households | Household Size |
| Married-Couple | 132 (31.4%) | 2.84 |
| Single Male/Father | 0 (0.0%) | - |
| Single Female/Mother | 113 (26.9%) | 3.08 |
| Non-family | 175 (41.7%) | 1.32 |
| Total Households | 420 (100.0%) | 2.27 |
Household Size by Marriage Status in New Preston
Out of a total of 420 households in New Preston, 245 (58.3%) are family households, while 175 (41.7%) are nonfamily households. The most numerous type of family households are 2-person households, comprising 98, and the most common type of nonfamily households are 1-person households, comprising 136.
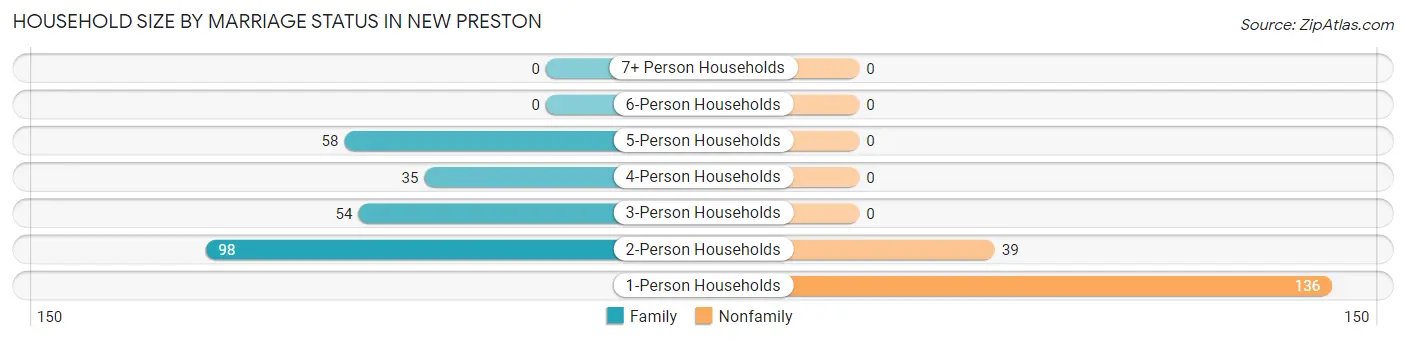
| Household Size | Family Households | Nonfamily Households |
| 1-Person Households | - | 136 (32.4%) |
| 2-Person Households | 98 (23.3%) | 39 (9.3%) |
| 3-Person Households | 54 (12.9%) | 0 (0.0%) |
| 4-Person Households | 35 (8.3%) | 0 (0.0%) |
| 5-Person Households | 58 (13.8%) | 0 (0.0%) |
| 6-Person Households | 0 (0.0%) | 0 (0.0%) |
| 7+ Person Households | 0 (0.0%) | 0 (0.0%) |
| Total | 245 (58.3%) | 175 (41.7%) |
Female Fertility in New Preston
Fertility by Age in New Preston
Average fertility rate in New Preston is 31.0 births per 1,000 women. Women in the age bracket of 35 to 50 years have the highest fertility rate with 69.0 births per 1,000 women. Women in the age bracket of 35 to 50 years acount for 100.0% of all women with births.
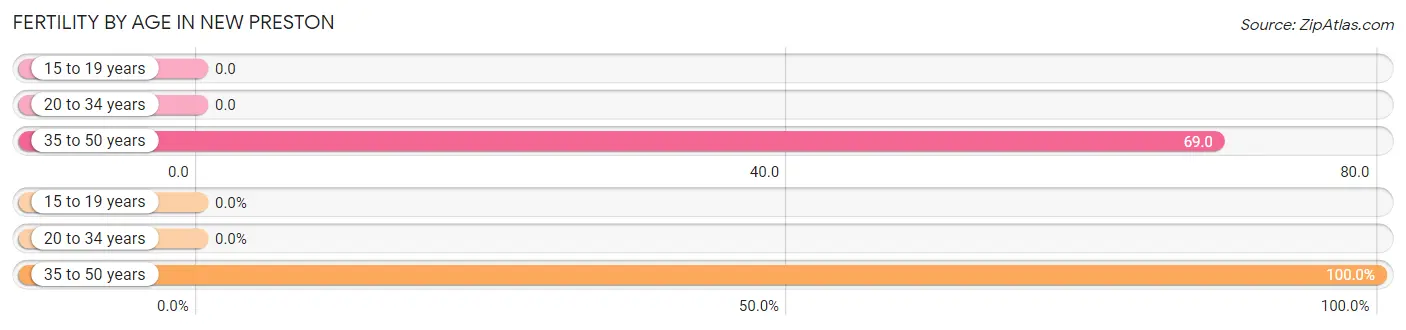
| Age Bracket | Women with Births | Births / 1,000 Women |
| 15 to 19 years | 0 (0.0%) | 0.0 |
| 20 to 34 years | 0 (0.0%) | 0.0 |
| 35 to 50 years | 7 (100.0%) | 69.0 |
| Total | 7 (100.0%) | 31.0 |
Fertility by Age by Marriage Status in New Preston
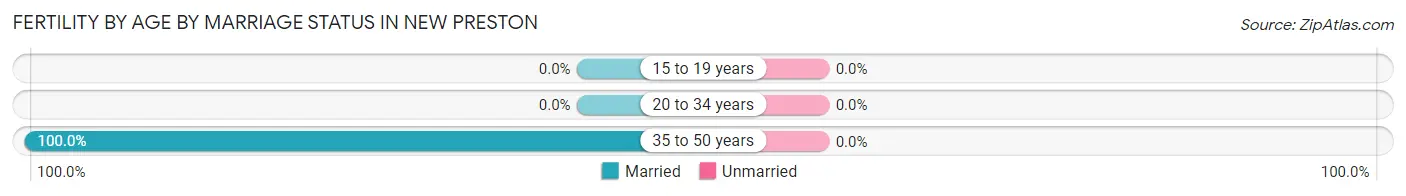
| Age Bracket | Married | Unmarried |
| 15 to 19 years | 0 (0.0%) | 0 (0.0%) |
| 20 to 34 years | 0 (0.0%) | 0 (0.0%) |
| 35 to 50 years | 7 (100.0%) | 0 (0.0%) |
| Total | 7 (100.0%) | 0 (0.0%) |
Fertility by Education in New Preston
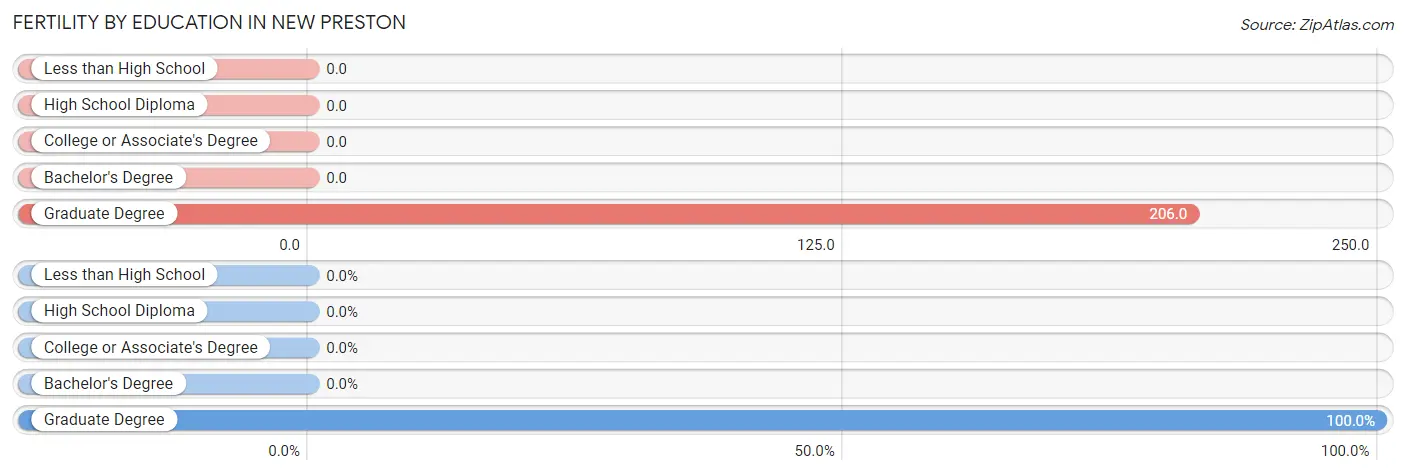
| Educational Attainment | Women with Births | Births / 1,000 Women |
| Less than High School | 0 (0.0%) | 0.0 |
| High School Diploma | 0 (0.0%) | 0.0 |
| College or Associate's Degree | 0 (0.0%) | 0.0 |
| Bachelor's Degree | 0 (0.0%) | 0.0 |
| Graduate Degree | 7 (100.0%) | 206.0 |
| Total | 7 (100.0%) | 31.0 |
Fertility by Education by Marriage Status in New Preston
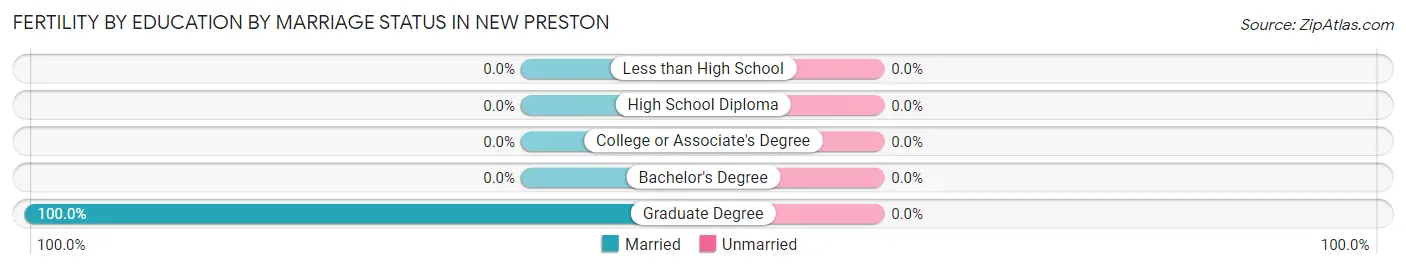
| Educational Attainment | Married | Unmarried |
| Less than High School | 0 (0.0%) | 0 (0.0%) |
| High School Diploma | 0 (0.0%) | 0 (0.0%) |
| College or Associate's Degree | 0 (0.0%) | 0 (0.0%) |
| Bachelor's Degree | 0 (0.0%) | 0 (0.0%) |
| Graduate Degree | 7 (100.0%) | 0 (0.0%) |
| Total | 7 (100.0%) | 0 (0.0%) |
Employment Characteristics in New Preston
Employment by Class of Employer in New Preston
Among the 471 employed individuals in New Preston, private company employees (247 | 52.4%), self-employed (not incorporated) (123 | 26.1%), and not-for-profit organizations (67 | 14.2%) make up the most common classes of employment.
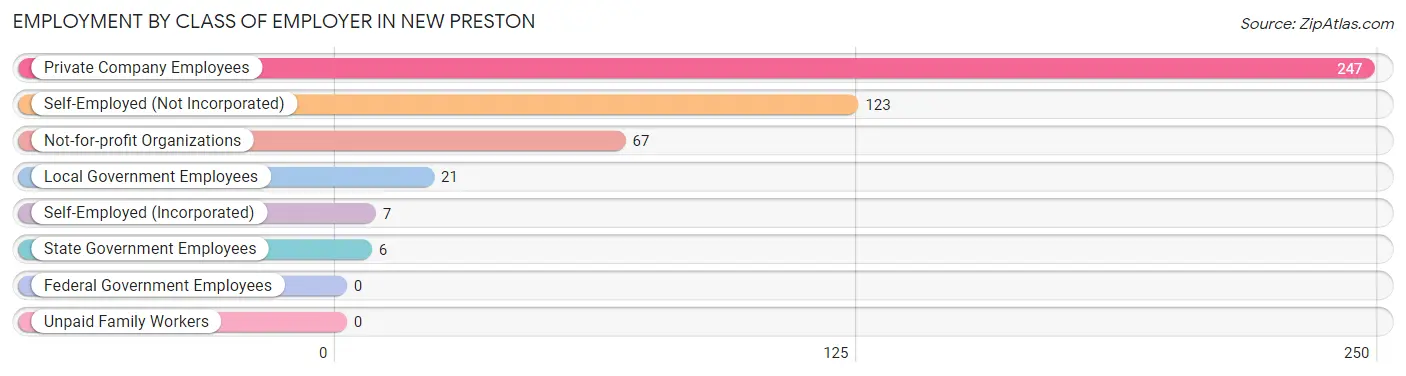
| Employer Class | # Employees | % Employees |
| Private Company Employees | 247 | 52.4% |
| Self-Employed (Incorporated) | 7 | 1.5% |
| Self-Employed (Not Incorporated) | 123 | 26.1% |
| Not-for-profit Organizations | 67 | 14.2% |
| Local Government Employees | 21 | 4.5% |
| State Government Employees | 6 | 1.3% |
| Federal Government Employees | 0 | 0.0% |
| Unpaid Family Workers | 0 | 0.0% |
| Total | 471 | 100.0% |
Employment Status by Age in New Preston
According to the labor force statistics for New Preston, out of the total population over 16 years of age (787), 62.8% or 494 individuals are in the labor force, with 1.4% or 7 of them unemployed. The age group with the highest labor force participation rate is 25 to 29 years, with 100.0% or 36 individuals in the labor force. Within the labor force, the 60 to 64 years age range has the highest percentage of unemployed individuals, with 11.9% or 7 of them being unemployed.
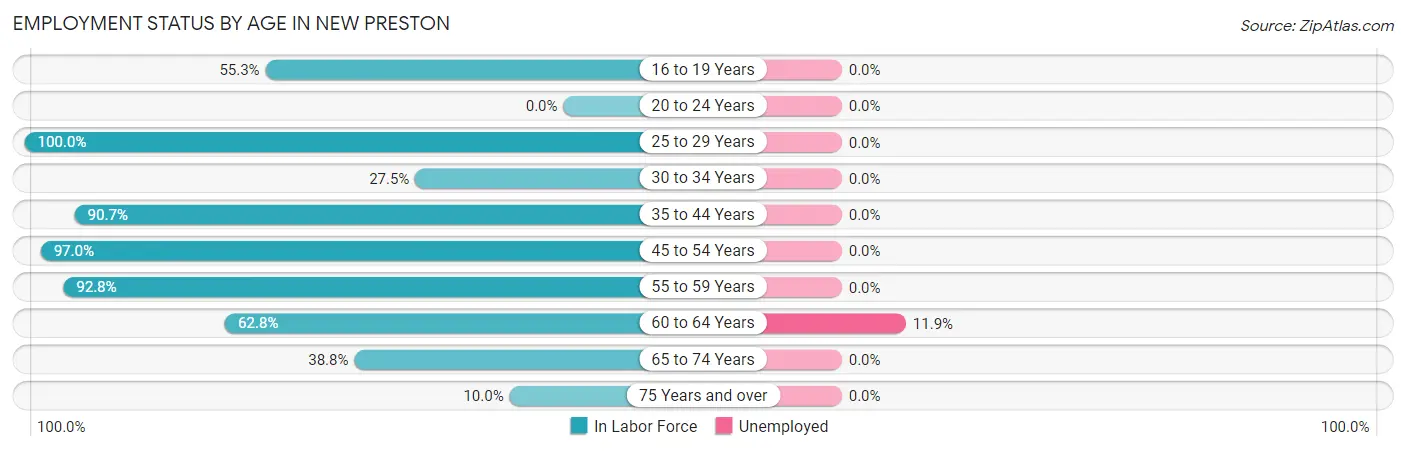
| Age Bracket | In Labor Force | Unemployed |
| 16 to 19 Years | 21 (55.3%) | 0 (0.0%) |
| 20 to 24 Years | 0 (0.0%) | 0 (0.0%) |
| 25 to 29 Years | 36 (100.0%) | 0 (0.0%) |
| 30 to 34 Years | 22 (27.5%) | 0 (0.0%) |
| 35 to 44 Years | 68 (90.7%) | 0 (0.0%) |
| 45 to 54 Years | 131 (97.0%) | 0 (0.0%) |
| 55 to 59 Years | 90 (92.8%) | 0 (0.0%) |
| 60 to 64 Years | 59 (62.8%) | 7 (11.9%) |
| 65 to 74 Years | 59 (38.8%) | 0 (0.0%) |
| 75 Years and over | 8 (10.0%) | 0 (0.0%) |
| Total | 494 (62.8%) | 7 (1.4%) |
Employment Status by Educational Attainment in New Preston
According to labor force statistics for New Preston, 78.5% of individuals (406) out of the total population between 25 and 64 years of age (517) are in the labor force, with 1.7% or 7 of them being unemployed. The group with the highest labor force participation rate are those with the educational attainment of college / associate degree, with 100.0% or 101 individuals in the labor force. Within the labor force, individuals with high school diploma education have the highest percentage of unemployment, with 21.2% or 7 of them being unemployed.
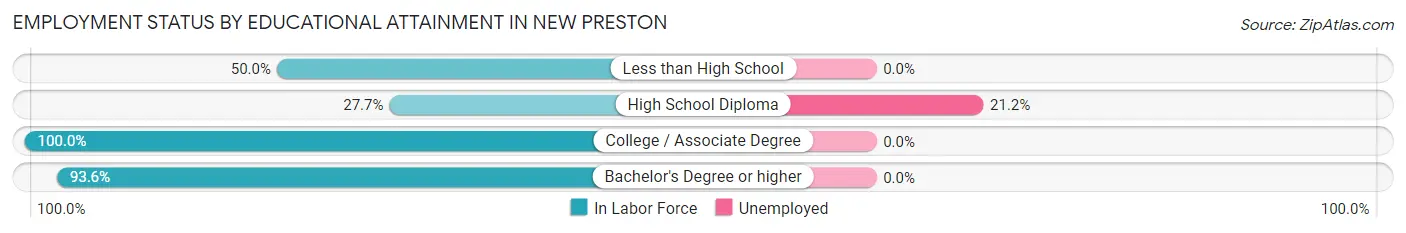
| Educational Attainment | In Labor Force | Unemployed |
| Less than High School | 7 (50.0%) | 0 (0.0%) |
| High School Diploma | 33 (27.7%) | 25 (21.2%) |
| College / Associate Degree | 101 (100.0%) | 0 (0.0%) |
| Bachelor's Degree or higher | 265 (93.6%) | 0 (0.0%) |
| Total | 406 (78.5%) | 9 (1.7%) |
Employment Occupations by Sex in New Preston
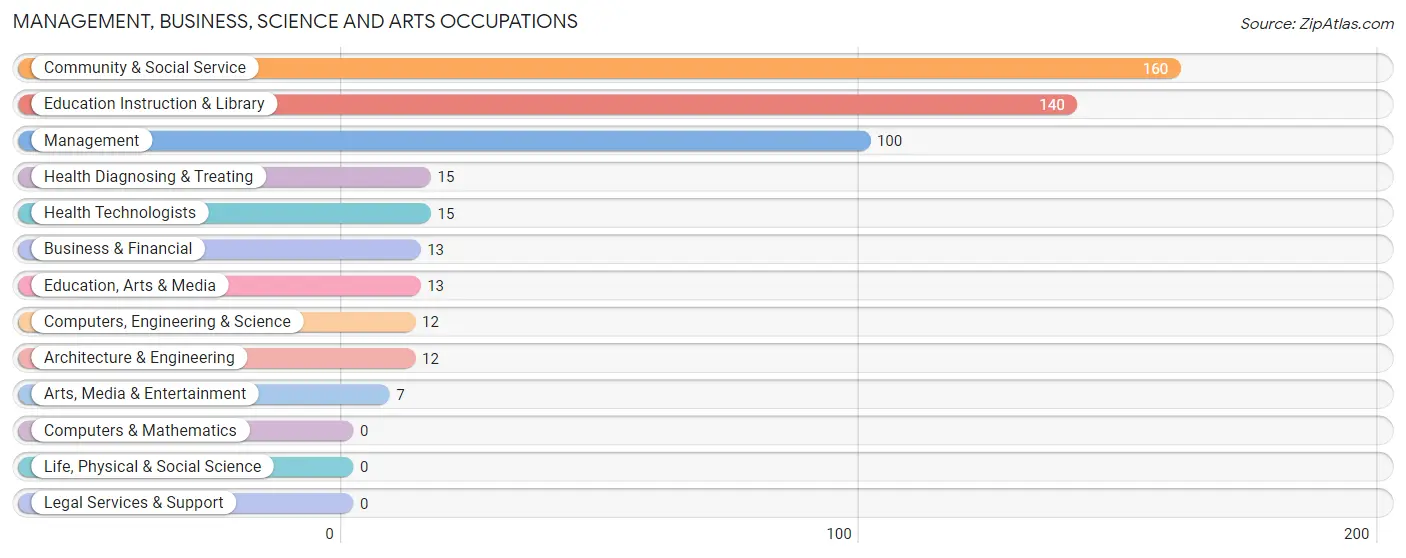
Management, Business, Science and Arts Occupations
The most common Management, Business, Science and Arts occupations in New Preston are Community & Social Service (160 | 32.9%), Education Instruction & Library (140 | 28.7%), Management (100 | 20.5%), Health Diagnosing & Treating (15 | 3.1%), and Health Technologists (15 | 3.1%).
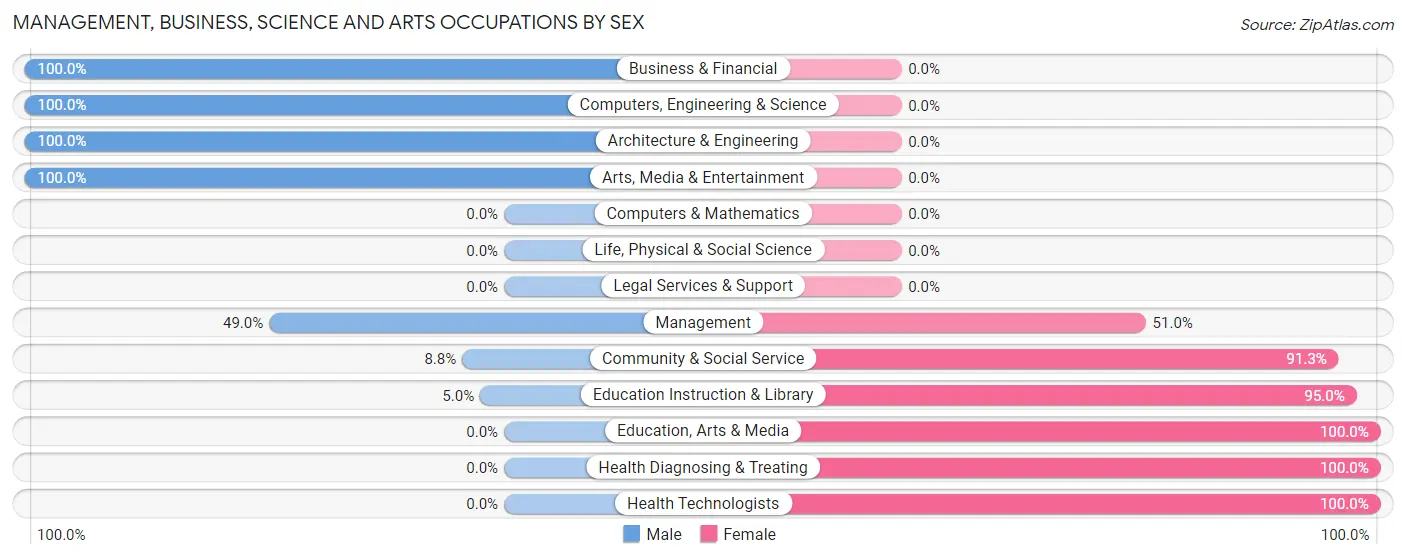
Management, Business, Science and Arts Occupations by Sex
Within the Management, Business, Science and Arts occupations in New Preston, the most male-oriented occupations are Business & Financial (100.0%), Computers, Engineering & Science (100.0%), and Architecture & Engineering (100.0%), while the most female-oriented occupations are Education, Arts & Media (100.0%), Health Diagnosing & Treating (100.0%), and Health Technologists (100.0%).
| Occupation | Male | Female |
| Management | 49 (49.0%) | 51 (51.0%) |
| Business & Financial | 13 (100.0%) | 0 (0.0%) |
| Computers, Engineering & Science | 12 (100.0%) | 0 (0.0%) |
| Computers & Mathematics | 0 (0.0%) | 0 (0.0%) |
| Architecture & Engineering | 12 (100.0%) | 0 (0.0%) |
| Life, Physical & Social Science | 0 (0.0%) | 0 (0.0%) |
| Community & Social Service | 14 (8.7%) | 146 (91.2%) |
| Education, Arts & Media | 0 (0.0%) | 13 (100.0%) |
| Legal Services & Support | 0 (0.0%) | 0 (0.0%) |
| Education Instruction & Library | 7 (5.0%) | 133 (95.0%) |
| Arts, Media & Entertainment | 7 (100.0%) | 0 (0.0%) |
| Health Diagnosing & Treating | 0 (0.0%) | 15 (100.0%) |
| Health Technologists | 0 (0.0%) | 15 (100.0%) |
| Total (Category) | 88 (29.3%) | 212 (70.7%) |
| Total (Overall) | 193 (39.6%) | 294 (60.4%) |
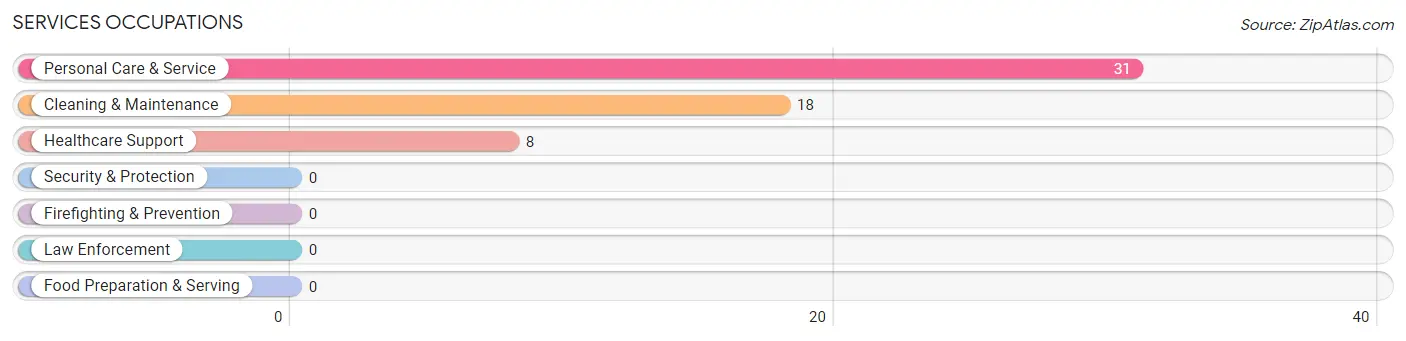
Services Occupations
The most common Services occupations in New Preston are Personal Care & Service (31 | 6.4%), Cleaning & Maintenance (18 | 3.7%), and Healthcare Support (8 | 1.6%).
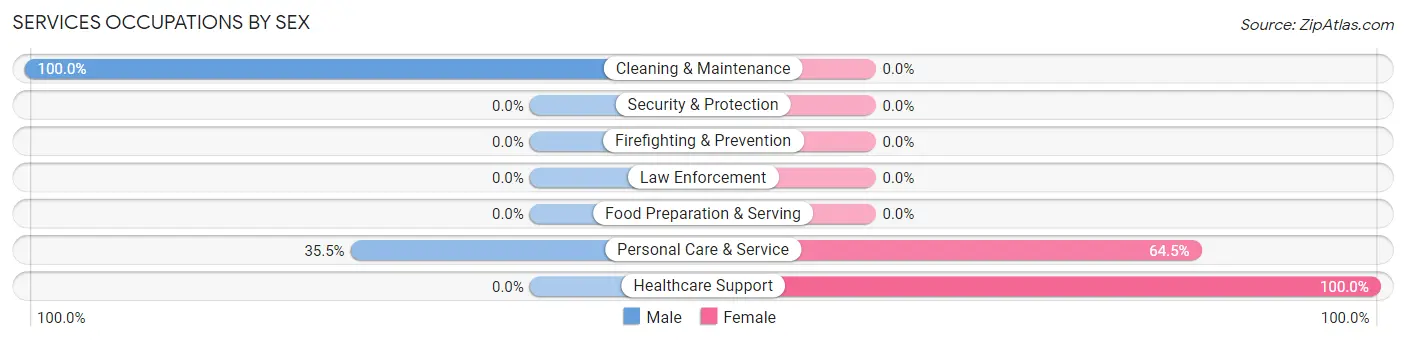
Services Occupations by Sex
Within the Services occupations in New Preston, the most male-oriented occupations are Cleaning & Maintenance (100.0%), and Personal Care & Service (35.5%), while the most female-oriented occupations are Healthcare Support (100.0%), and Personal Care & Service (64.5%).
| Occupation | Male | Female |
| Healthcare Support | 0 (0.0%) | 8 (100.0%) |
| Security & Protection | 0 (0.0%) | 0 (0.0%) |
| Firefighting & Prevention | 0 (0.0%) | 0 (0.0%) |
| Law Enforcement | 0 (0.0%) | 0 (0.0%) |
| Food Preparation & Serving | 0 (0.0%) | 0 (0.0%) |
| Cleaning & Maintenance | 18 (100.0%) | 0 (0.0%) |
| Personal Care & Service | 11 (35.5%) | 20 (64.5%) |
| Total (Category) | 29 (50.9%) | 28 (49.1%) |
| Total (Overall) | 193 (39.6%) | 294 (60.4%) |
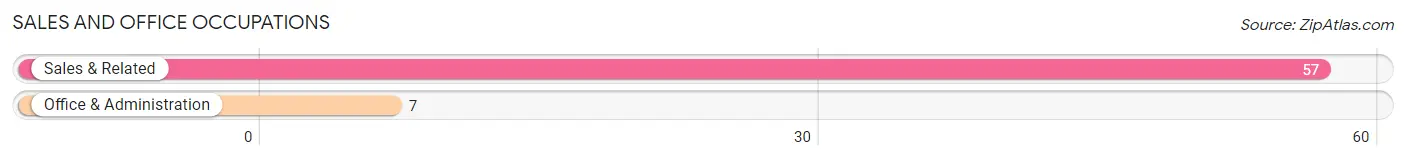
Sales and Office Occupations
The most common Sales and Office occupations in New Preston are Sales & Related (57 | 11.7%), and Office & Administration (7 | 1.4%).
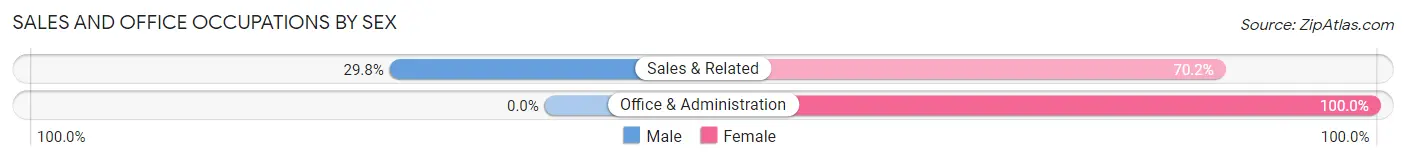
Sales and Office Occupations by Sex
| Occupation | Male | Female |
| Sales & Related | 17 (29.8%) | 40 (70.2%) |
| Office & Administration | 0 (0.0%) | 7 (100.0%) |
| Total (Category) | 17 (26.6%) | 47 (73.4%) |
| Total (Overall) | 193 (39.6%) | 294 (60.4%) |
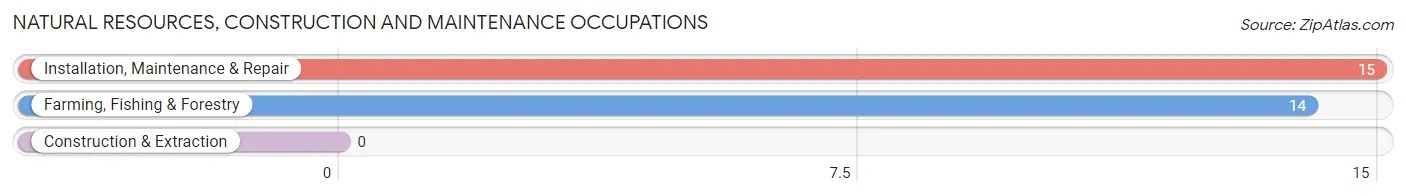
Natural Resources, Construction and Maintenance Occupations
The most common Natural Resources, Construction and Maintenance occupations in New Preston are Installation, Maintenance & Repair (15 | 3.1%), and Farming, Fishing & Forestry (14 | 2.9%).
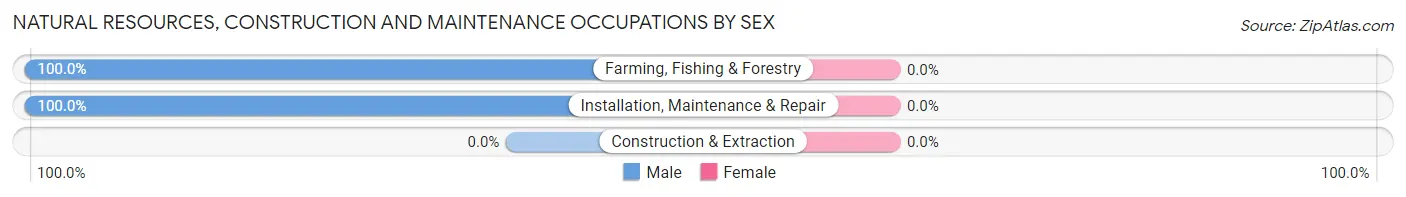
Natural Resources, Construction and Maintenance Occupations by Sex
| Occupation | Male | Female |
| Farming, Fishing & Forestry | 14 (100.0%) | 0 (0.0%) |
| Construction & Extraction | 0 (0.0%) | 0 (0.0%) |
| Installation, Maintenance & Repair | 15 (100.0%) | 0 (0.0%) |
| Total (Category) | 29 (100.0%) | 0 (0.0%) |
| Total (Overall) | 193 (39.6%) | 294 (60.4%) |
Production, Transportation and Moving Occupations
The most common Production, Transportation and Moving occupations in New Preston are Material Moving (23 | 4.7%), Production (7 | 1.4%), and Transportation (7 | 1.4%).
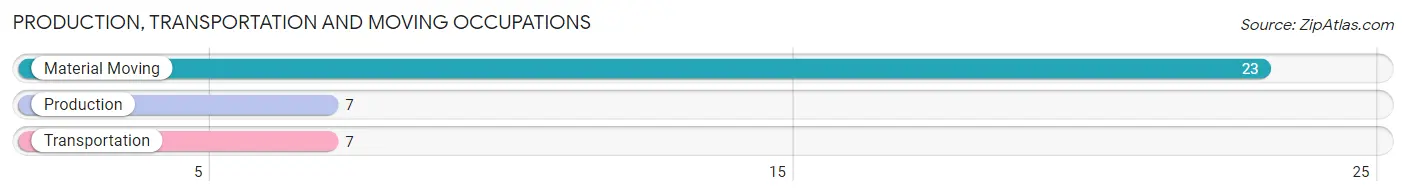
Production, Transportation and Moving Occupations by Sex
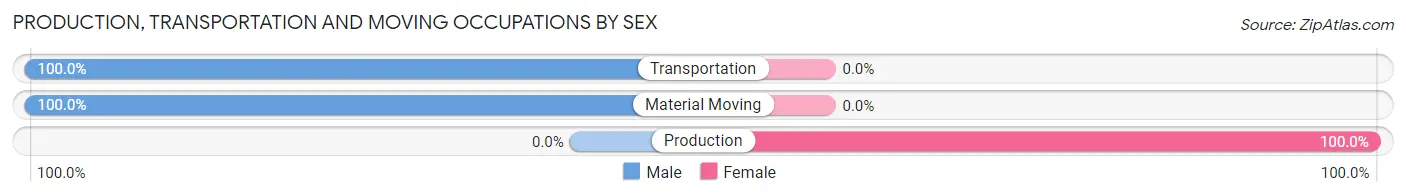
| Occupation | Male | Female |
| Production | 0 (0.0%) | 7 (100.0%) |
| Transportation | 7 (100.0%) | 0 (0.0%) |
| Material Moving | 23 (100.0%) | 0 (0.0%) |
| Total (Category) | 30 (81.1%) | 7 (18.9%) |
| Total (Overall) | 193 (39.6%) | 294 (60.4%) |
Employment Industries by Sex in New Preston
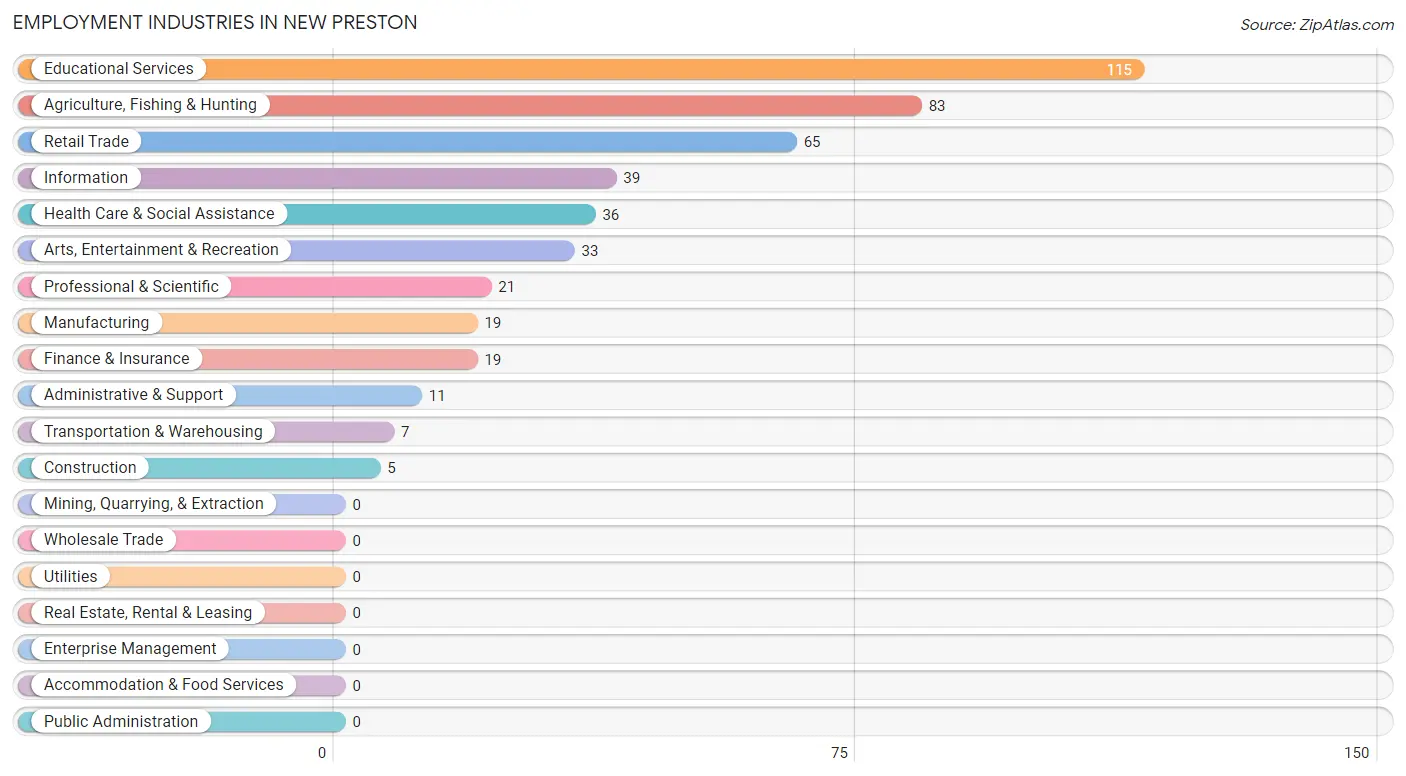
Employment Industries in New Preston
The major employment industries in New Preston include Educational Services (115 | 23.6%), Agriculture, Fishing & Hunting (83 | 17.0%), Retail Trade (65 | 13.4%), Information (39 | 8.0%), and Health Care & Social Assistance (36 | 7.4%).
Employment Industries by Sex in New Preston
The New Preston industries that see more men than women are Construction (100.0%), Manufacturing (100.0%), and Transportation & Warehousing (100.0%), whereas the industries that tend to have a higher number of women are Health Care & Social Assistance (100.0%), Educational Services (87.8%), and Information (82.1%).
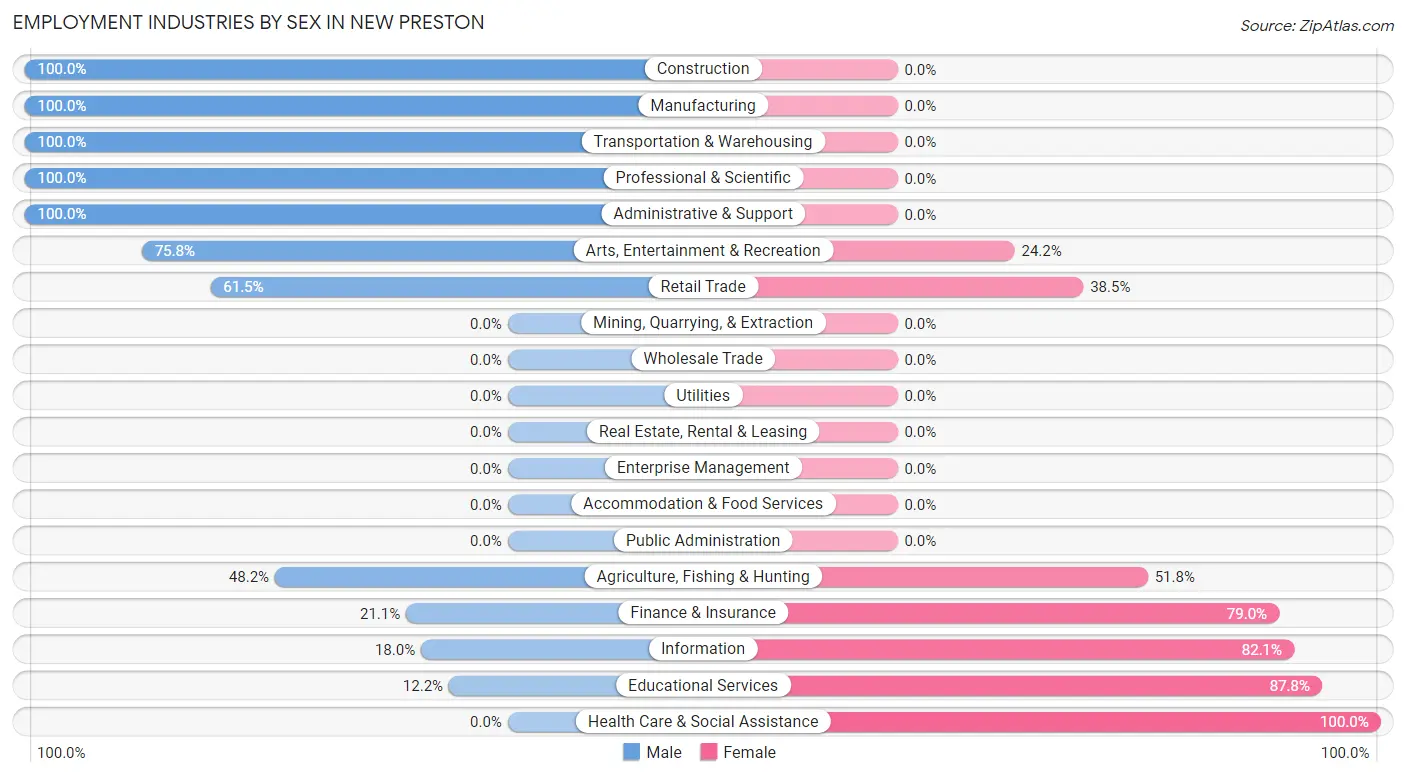
| Industry | Male | Female |
| Agriculture, Fishing & Hunting | 40 (48.2%) | 43 (51.8%) |
| Mining, Quarrying, & Extraction | 0 (0.0%) | 0 (0.0%) |
| Construction | 5 (100.0%) | 0 (0.0%) |
| Manufacturing | 19 (100.0%) | 0 (0.0%) |
| Wholesale Trade | 0 (0.0%) | 0 (0.0%) |
| Retail Trade | 40 (61.5%) | 25 (38.5%) |
| Transportation & Warehousing | 7 (100.0%) | 0 (0.0%) |
| Utilities | 0 (0.0%) | 0 (0.0%) |
| Information | 7 (17.9%) | 32 (82.1%) |
| Finance & Insurance | 4 (21.0%) | 15 (78.9%) |
| Real Estate, Rental & Leasing | 0 (0.0%) | 0 (0.0%) |
| Professional & Scientific | 21 (100.0%) | 0 (0.0%) |
| Enterprise Management | 0 (0.0%) | 0 (0.0%) |
| Administrative & Support | 11 (100.0%) | 0 (0.0%) |
| Educational Services | 14 (12.2%) | 101 (87.8%) |
| Health Care & Social Assistance | 0 (0.0%) | 36 (100.0%) |
| Arts, Entertainment & Recreation | 25 (75.8%) | 8 (24.2%) |
| Accommodation & Food Services | 0 (0.0%) | 0 (0.0%) |
| Public Administration | 0 (0.0%) | 0 (0.0%) |
| Total | 193 (39.6%) | 294 (60.4%) |
Education in New Preston
School Enrollment in New Preston
The most common levels of schooling among the 230 students in New Preston are elementary school (70 | 30.4%), high school (67 | 29.1%), and college / undergraduate (58 | 25.2%).
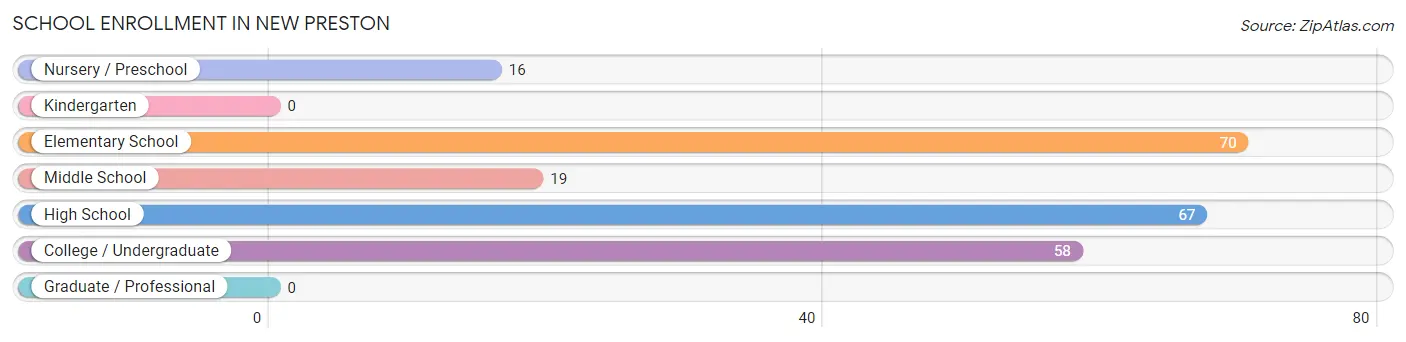
| School Level | # Students | % Students |
| Nursery / Preschool | 16 | 7.0% |
| Kindergarten | 0 | 0.0% |
| Elementary School | 70 | 30.4% |
| Middle School | 19 | 8.3% |
| High School | 67 | 29.1% |
| College / Undergraduate | 58 | 25.2% |
| Graduate / Professional | 0 | 0.0% |
| Total | 230 | 100.0% |
School Enrollment by Age by Funding Source in New Preston
Out of a total of 230 students who are enrolled in schools in New Preston, 49 (21.3%) attend a private institution, while the remaining 181 (78.7%) are enrolled in public schools. The age group of 10 to 14 year olds has the highest likelihood of being enrolled in private schools, with 23 (43.4% in the age bracket) enrolled. Conversely, the age group of 3 to 4 year olds has the lowest likelihood of being enrolled in a private school, with 4 (100.0% in the age bracket) attending a public institution.
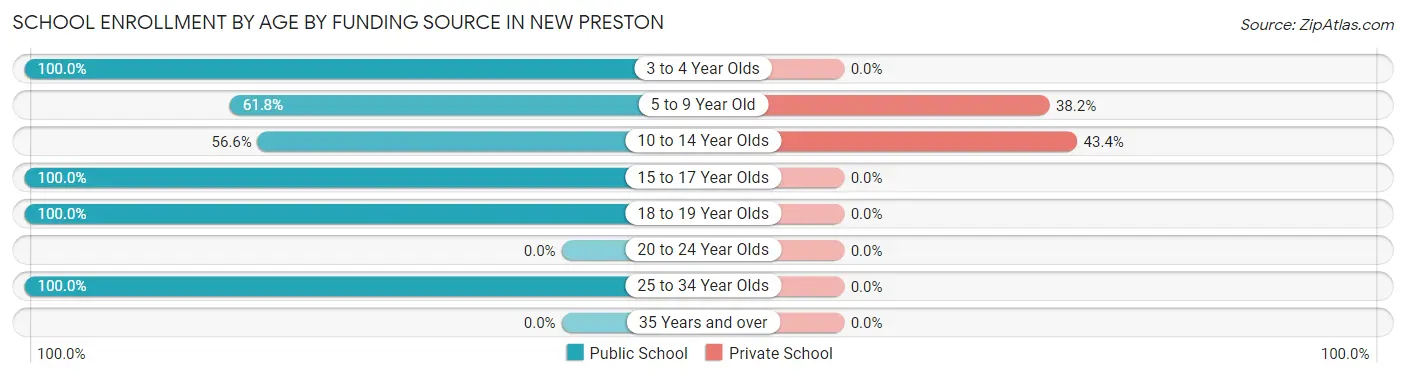
| Age Bracket | Public School | Private School |
| 3 to 4 Year Olds | 4 (100.0%) | 0 (0.0%) |
| 5 to 9 Year Old | 42 (61.8%) | 26 (38.2%) |
| 10 to 14 Year Olds | 30 (56.6%) | 23 (43.4%) |
| 15 to 17 Year Olds | 39 (100.0%) | 0 (0.0%) |
| 18 to 19 Year Olds | 8 (100.0%) | 0 (0.0%) |
| 20 to 24 Year Olds | 0 (0.0%) | 0 (0.0%) |
| 25 to 34 Year Olds | 58 (100.0%) | 0 (0.0%) |
| 35 Years and over | 0 (0.0%) | 0 (0.0%) |
| Total | 181 (78.7%) | 49 (21.3%) |
Educational Attainment by Field of Study in New Preston
Literature & languages (109 | 21.3%), education (93 | 18.2%), social sciences (78 | 15.3%), bio, nature & agricultural (76 | 14.9%), and liberal arts & history (46 | 9.0%) are the most common fields of study among 511 individuals in New Preston who have obtained a bachelor's degree or higher.
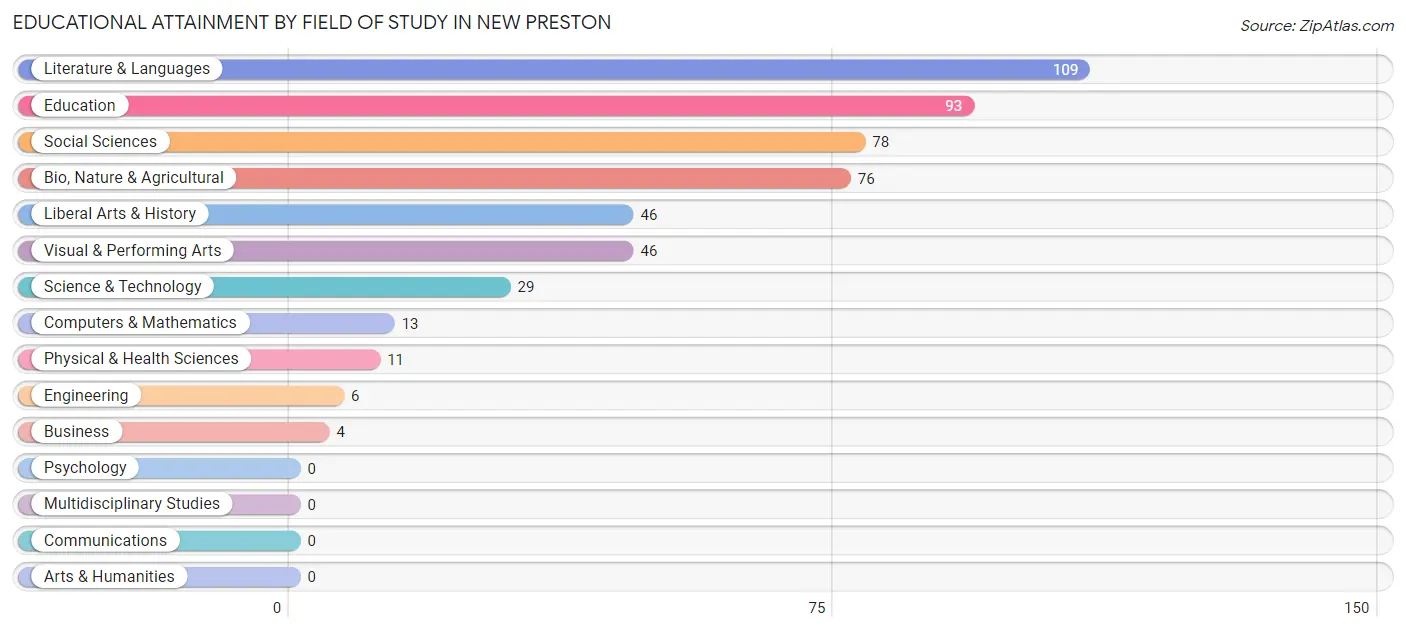
| Field of Study | # Graduates | % Graduates |
| Computers & Mathematics | 13 | 2.5% |
| Bio, Nature & Agricultural | 76 | 14.9% |
| Physical & Health Sciences | 11 | 2.1% |
| Psychology | 0 | 0.0% |
| Social Sciences | 78 | 15.3% |
| Engineering | 6 | 1.2% |
| Multidisciplinary Studies | 0 | 0.0% |
| Science & Technology | 29 | 5.7% |
| Business | 4 | 0.8% |
| Education | 93 | 18.2% |
| Literature & Languages | 109 | 21.3% |
| Liberal Arts & History | 46 | 9.0% |
| Visual & Performing Arts | 46 | 9.0% |
| Communications | 0 | 0.0% |
| Arts & Humanities | 0 | 0.0% |
| Total | 511 | 100.0% |
Transportation & Commute in New Preston
Vehicle Availability by Sex in New Preston
The most prevalent vehicle ownership categories in New Preston are males with 2 vehicles (94, accounting for 48.7%) and females with 2 vehicles (125, making up 45.6%).
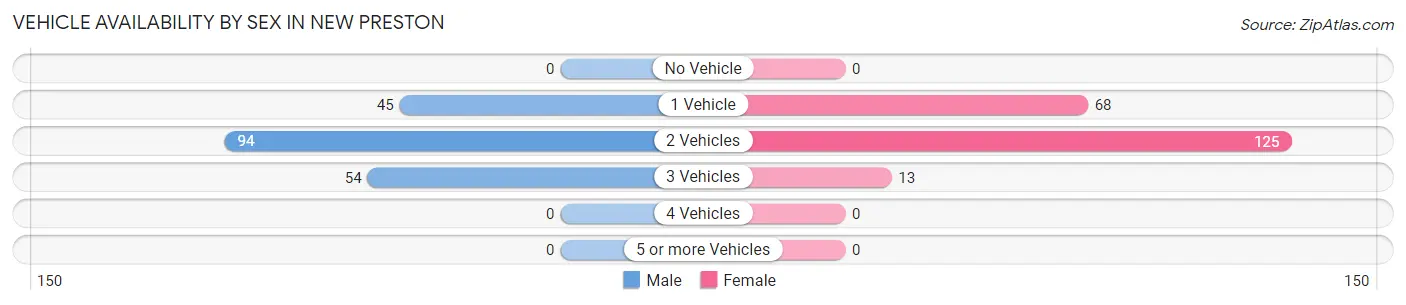
| Vehicles Available | Male | Female |
| No Vehicle | 0 (0.0%) | 0 (0.0%) |
| 1 Vehicle | 45 (23.3%) | 68 (33.0%) |
| 2 Vehicles | 94 (48.7%) | 125 (60.7%) |
| 3 Vehicles | 54 (28.0%) | 13 (6.3%) |
| 4 Vehicles | 0 (0.0%) | 0 (0.0%) |
| 5 or more Vehicles | 0 (0.0%) | 0 (0.0%) |
| Total | 193 (100.0%) | 206 (100.0%) |
Commute Time in New Preston
The most frequently occuring commute durations in New Preston are 10 to 14 minutes (53 commuters, 21.5%), 35 to 39 minutes (52 commuters, 21.1%), and 20 to 24 minutes (31 commuters, 12.6%).
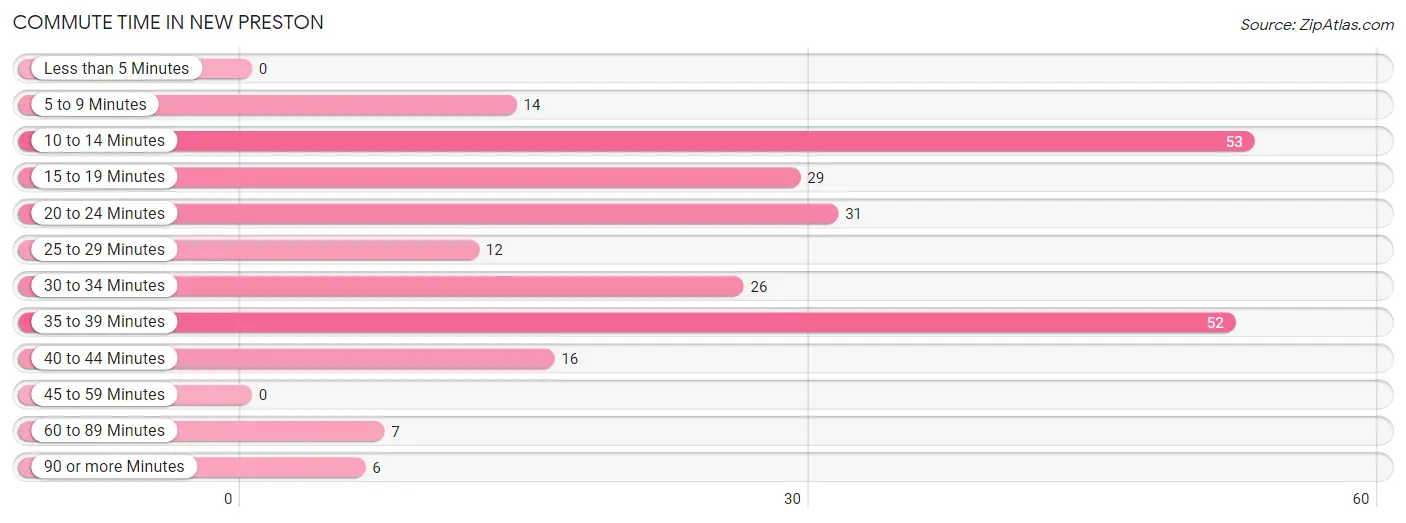
| Commute Time | # Commuters | % Commuters |
| Less than 5 Minutes | 0 | 0.0% |
| 5 to 9 Minutes | 14 | 5.7% |
| 10 to 14 Minutes | 53 | 21.5% |
| 15 to 19 Minutes | 29 | 11.8% |
| 20 to 24 Minutes | 31 | 12.6% |
| 25 to 29 Minutes | 12 | 4.9% |
| 30 to 34 Minutes | 26 | 10.6% |
| 35 to 39 Minutes | 52 | 21.1% |
| 40 to 44 Minutes | 16 | 6.5% |
| 45 to 59 Minutes | 0 | 0.0% |
| 60 to 89 Minutes | 7 | 2.9% |
| 90 or more Minutes | 6 | 2.4% |
Commute Time by Sex in New Preston
The most common commute times in New Preston are 15 to 19 minutes (29 commuters, 21.3%) for males and 35 to 39 minutes (36 commuters, 32.7%) for females.
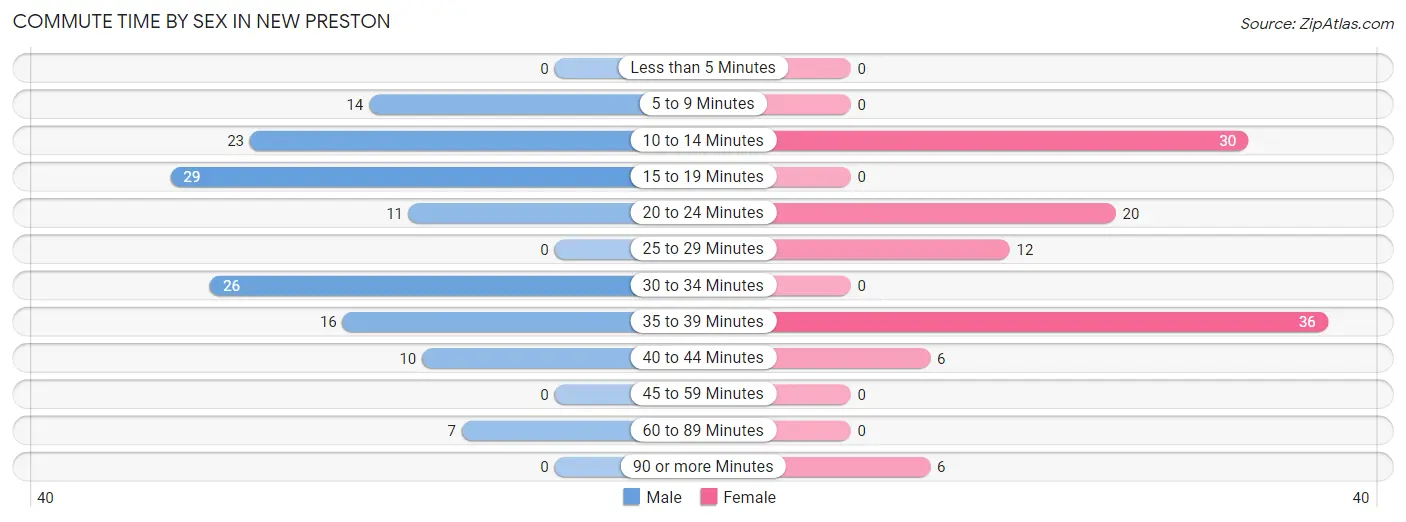
| Commute Time | Male | Female |
| Less than 5 Minutes | 0 (0.0%) | 0 (0.0%) |
| 5 to 9 Minutes | 14 (10.3%) | 0 (0.0%) |
| 10 to 14 Minutes | 23 (16.9%) | 30 (27.3%) |
| 15 to 19 Minutes | 29 (21.3%) | 0 (0.0%) |
| 20 to 24 Minutes | 11 (8.1%) | 20 (18.2%) |
| 25 to 29 Minutes | 0 (0.0%) | 12 (10.9%) |
| 30 to 34 Minutes | 26 (19.1%) | 0 (0.0%) |
| 35 to 39 Minutes | 16 (11.8%) | 36 (32.7%) |
| 40 to 44 Minutes | 10 (7.3%) | 6 (5.4%) |
| 45 to 59 Minutes | 0 (0.0%) | 0 (0.0%) |
| 60 to 89 Minutes | 7 (5.1%) | 0 (0.0%) |
| 90 or more Minutes | 0 (0.0%) | 6 (5.4%) |
Time of Departure to Work by Sex in New Preston
The most frequent times of departure to work in New Preston are 5:00 AM to 5:29 AM (31, 22.8%) for males and 7:30 AM to 7:59 AM (29, 26.4%) for females.
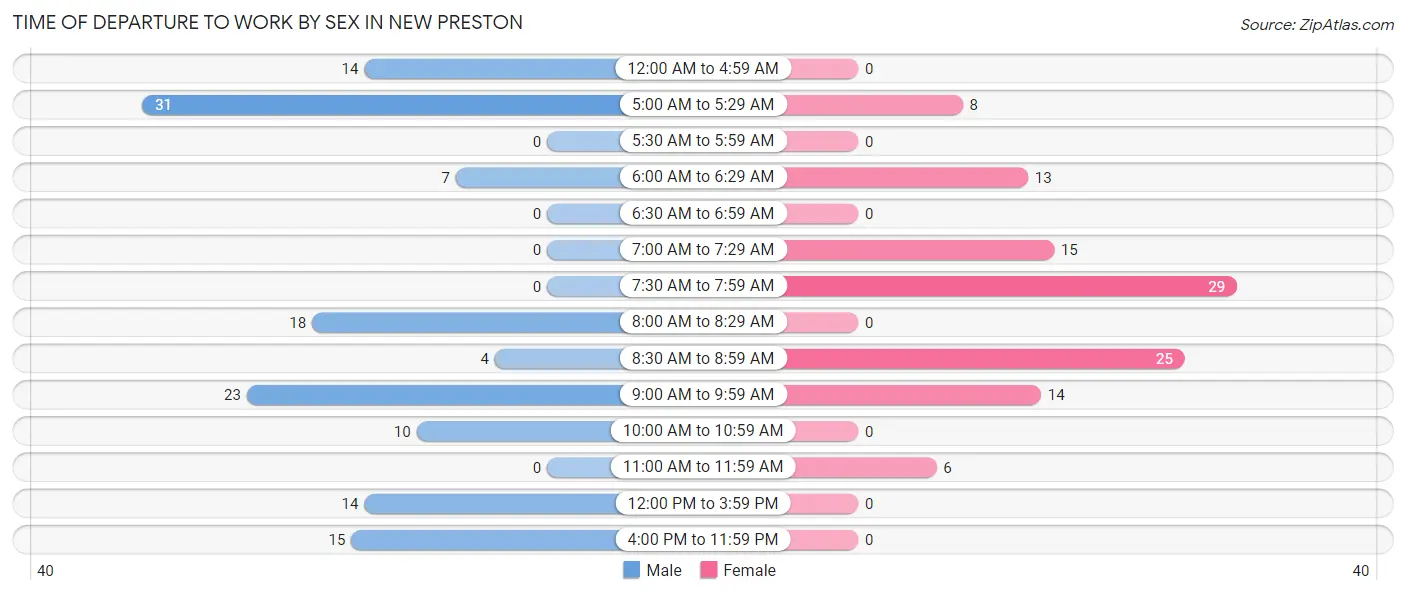
| Time of Departure | Male | Female |
| 12:00 AM to 4:59 AM | 14 (10.3%) | 0 (0.0%) |
| 5:00 AM to 5:29 AM | 31 (22.8%) | 8 (7.3%) |
| 5:30 AM to 5:59 AM | 0 (0.0%) | 0 (0.0%) |
| 6:00 AM to 6:29 AM | 7 (5.1%) | 13 (11.8%) |
| 6:30 AM to 6:59 AM | 0 (0.0%) | 0 (0.0%) |
| 7:00 AM to 7:29 AM | 0 (0.0%) | 15 (13.6%) |
| 7:30 AM to 7:59 AM | 0 (0.0%) | 29 (26.4%) |
| 8:00 AM to 8:29 AM | 18 (13.2%) | 0 (0.0%) |
| 8:30 AM to 8:59 AM | 4 (2.9%) | 25 (22.7%) |
| 9:00 AM to 9:59 AM | 23 (16.9%) | 14 (12.7%) |
| 10:00 AM to 10:59 AM | 10 (7.3%) | 0 (0.0%) |
| 11:00 AM to 11:59 AM | 0 (0.0%) | 6 (5.4%) |
| 12:00 PM to 3:59 PM | 14 (10.3%) | 0 (0.0%) |
| 4:00 PM to 11:59 PM | 15 (11.0%) | 0 (0.0%) |
| Total | 136 (100.0%) | 110 (100.0%) |
Housing Occupancy in New Preston
Occupancy by Ownership in New Preston
Of the total 420 dwellings in New Preston, owner-occupied units account for 334 (79.5%), while renter-occupied units make up 86 (20.5%).
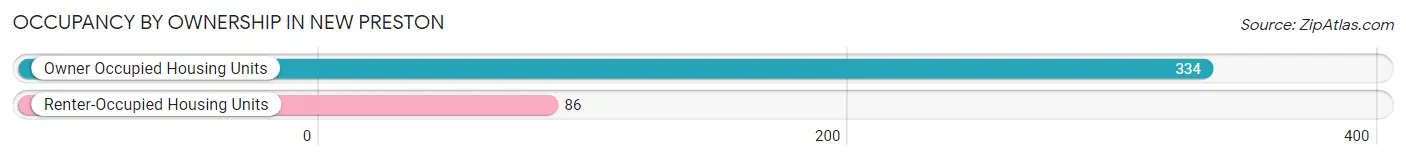
| Occupancy | # Housing Units | % Housing Units |
| Owner Occupied Housing Units | 334 | 79.5% |
| Renter-Occupied Housing Units | 86 | 20.5% |
| Total Occupied Housing Units | 420 | 100.0% |
Occupancy by Household Size in New Preston
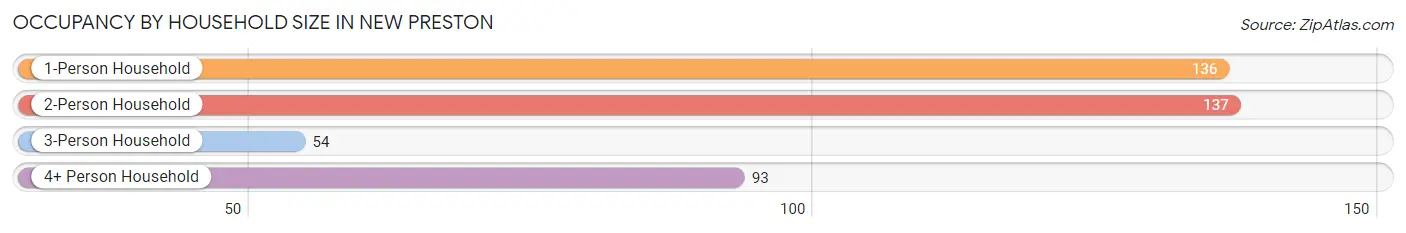
| Household Size | # Housing Units | % Housing Units |
| 1-Person Household | 136 | 32.4% |
| 2-Person Household | 137 | 32.6% |
| 3-Person Household | 54 | 12.9% |
| 4+ Person Household | 93 | 22.1% |
| Total Housing Units | 420 | 100.0% |
Occupancy by Ownership by Household Size in New Preston
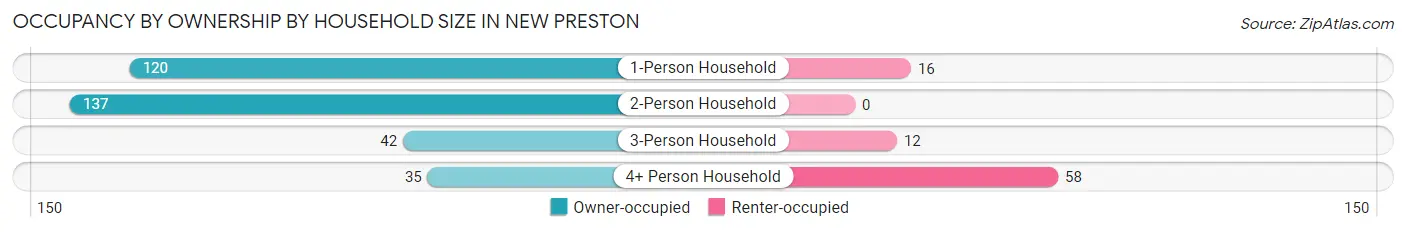
| Household Size | Owner-occupied | Renter-occupied |
| 1-Person Household | 120 (88.2%) | 16 (11.8%) |
| 2-Person Household | 137 (100.0%) | 0 (0.0%) |
| 3-Person Household | 42 (77.8%) | 12 (22.2%) |
| 4+ Person Household | 35 (37.6%) | 58 (62.4%) |
| Total Housing Units | 334 (79.5%) | 86 (20.5%) |
Occupancy by Educational Attainment in New Preston
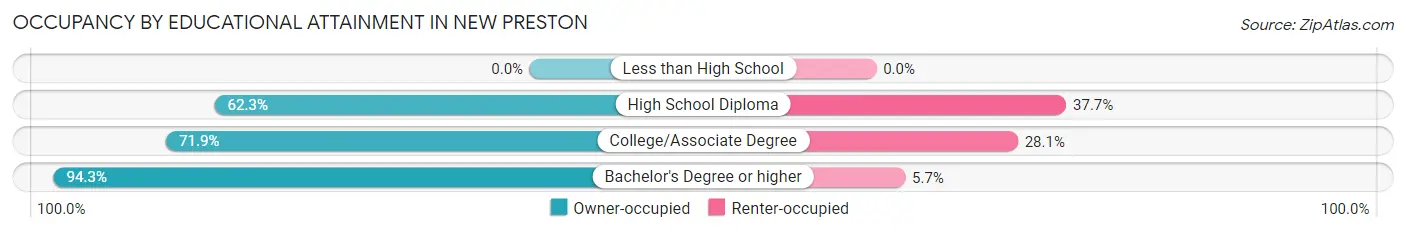
| Household Size | Owner-occupied | Renter-occupied |
| Less than High School | 0 (0.0%) | 0 (0.0%) |
| High School Diploma | 96 (62.3%) | 58 (37.7%) |
| College/Associate Degree | 41 (71.9%) | 16 (28.1%) |
| Bachelor's Degree or higher | 197 (94.3%) | 12 (5.7%) |
Occupancy by Age of Householder in New Preston
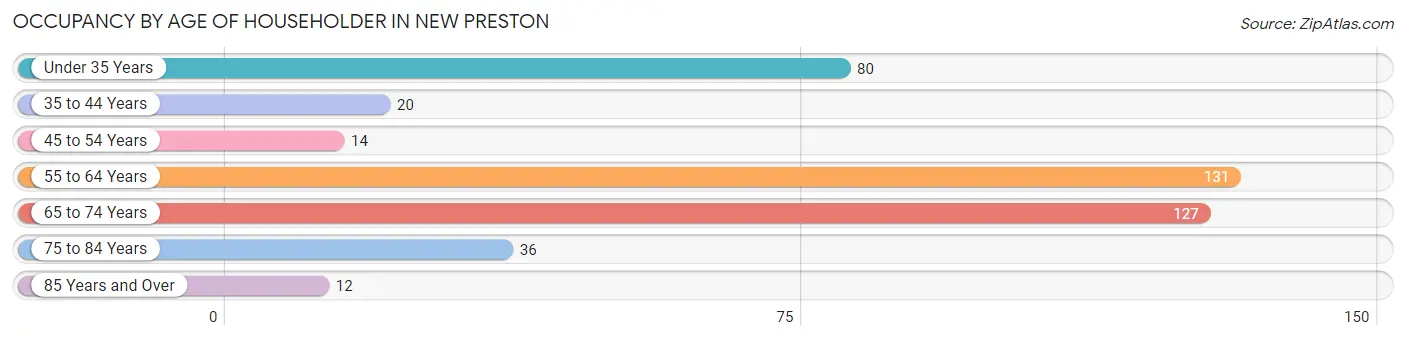
| Age Bracket | # Households | % Households |
| Under 35 Years | 80 | 19.1% |
| 35 to 44 Years | 20 | 4.8% |
| 45 to 54 Years | 14 | 3.3% |
| 55 to 64 Years | 131 | 31.2% |
| 65 to 74 Years | 127 | 30.2% |
| 75 to 84 Years | 36 | 8.6% |
| 85 Years and Over | 12 | 2.9% |
| Total | 420 | 100.0% |
Housing Finances in New Preston
Median Income by Occupancy in New Preston
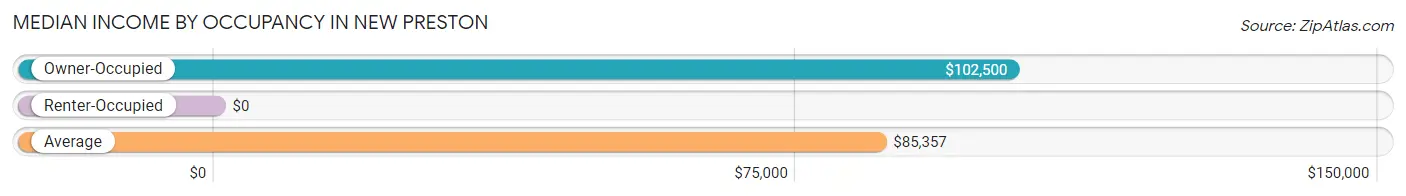
| Occupancy Type | # Households | Median Income |
| Owner-Occupied | 334 (79.5%) | $102,500 |
| Renter-Occupied | 86 (20.5%) | $0 |
| Average | 420 (100.0%) | $85,357 |
Occupancy by Householder Income Bracket in New Preston
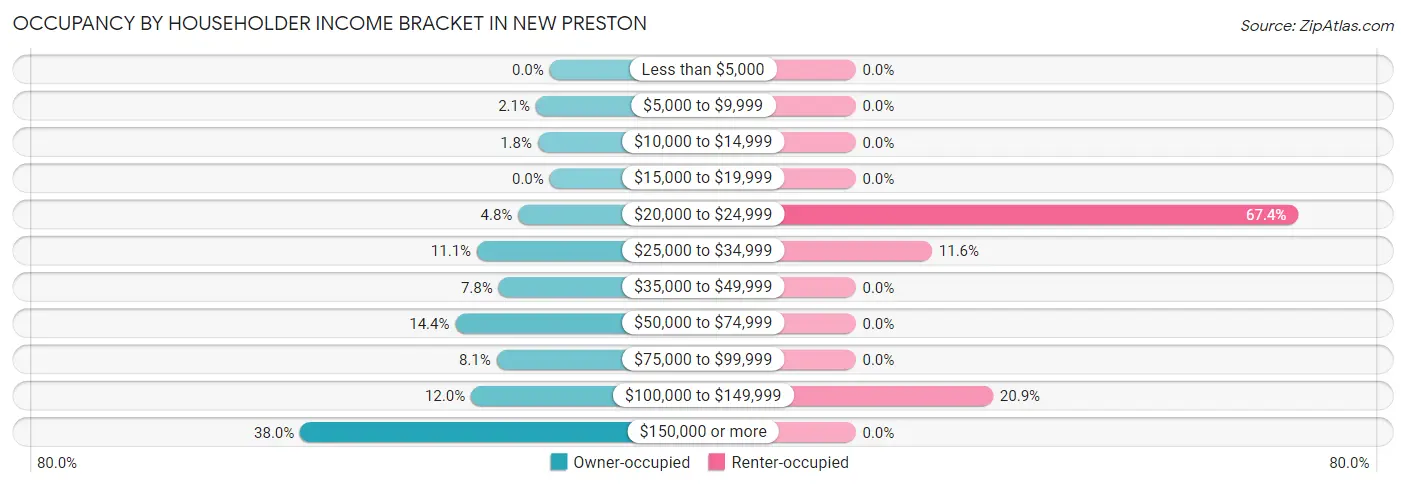
| Income Bracket | Owner-occupied | Renter-occupied |
| Less than $5,000 | 0 (0.0%) | 0 (0.0%) |
| $5,000 to $9,999 | 7 (2.1%) | 0 (0.0%) |
| $10,000 to $14,999 | 6 (1.8%) | 0 (0.0%) |
| $15,000 to $19,999 | 0 (0.0%) | 0 (0.0%) |
| $20,000 to $24,999 | 16 (4.8%) | 58 (67.4%) |
| $25,000 to $34,999 | 37 (11.1%) | 10 (11.6%) |
| $35,000 to $49,999 | 26 (7.8%) | 0 (0.0%) |
| $50,000 to $74,999 | 48 (14.4%) | 0 (0.0%) |
| $75,000 to $99,999 | 27 (8.1%) | 0 (0.0%) |
| $100,000 to $149,999 | 40 (12.0%) | 18 (20.9%) |
| $150,000 or more | 127 (38.0%) | 0 (0.0%) |
| Total | 334 (100.0%) | 86 (100.0%) |
Monthly Housing Cost Tiers in New Preston
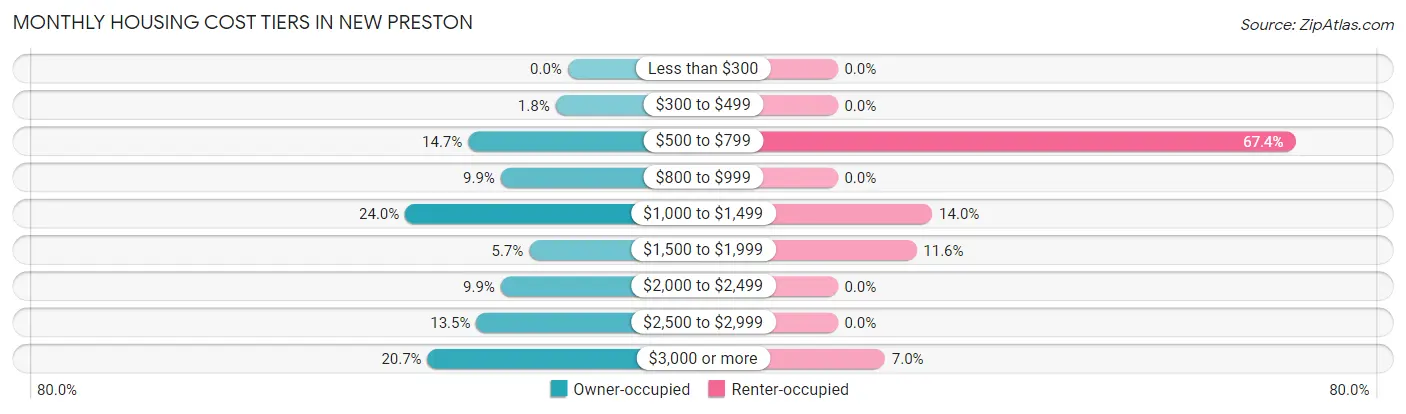
| Monthly Cost | Owner-occupied | Renter-occupied |
| Less than $300 | 0 (0.0%) | 0 (0.0%) |
| $300 to $499 | 6 (1.8%) | 0 (0.0%) |
| $500 to $799 | 49 (14.7%) | 58 (67.4%) |
| $800 to $999 | 33 (9.9%) | 0 (0.0%) |
| $1,000 to $1,499 | 80 (23.9%) | 12 (14.0%) |
| $1,500 to $1,999 | 19 (5.7%) | 10 (11.6%) |
| $2,000 to $2,499 | 33 (9.9%) | 0 (0.0%) |
| $2,500 to $2,999 | 45 (13.5%) | 0 (0.0%) |
| $3,000 or more | 69 (20.7%) | 6 (7.0%) |
| Total | 334 (100.0%) | 86 (100.0%) |
Physical Housing Characteristics in New Preston
Housing Structures in New Preston
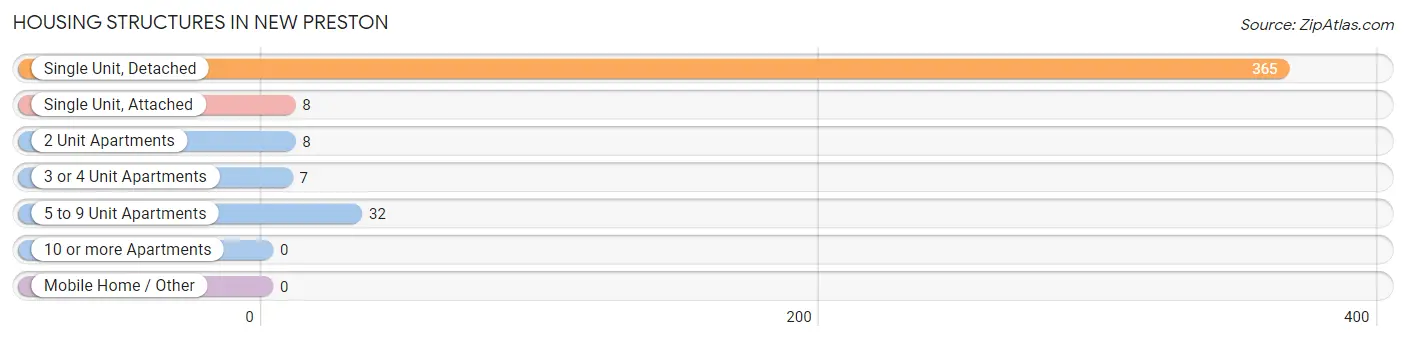
| Structure Type | # Housing Units | % Housing Units |
| Single Unit, Detached | 365 | 86.9% |
| Single Unit, Attached | 8 | 1.9% |
| 2 Unit Apartments | 8 | 1.9% |
| 3 or 4 Unit Apartments | 7 | 1.7% |
| 5 to 9 Unit Apartments | 32 | 7.6% |
| 10 or more Apartments | 0 | 0.0% |
| Mobile Home / Other | 0 | 0.0% |
| Total | 420 | 100.0% |
Housing Structures by Occupancy in New Preston
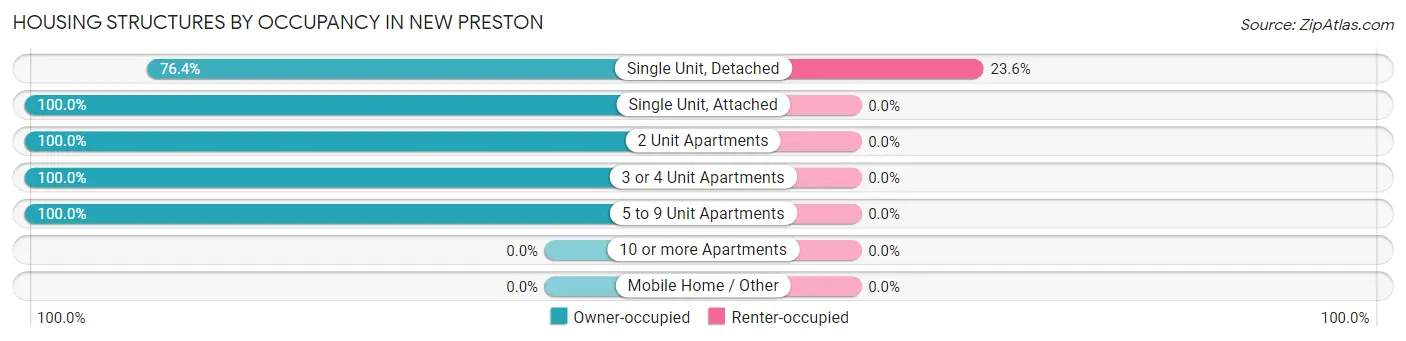
| Structure Type | Owner-occupied | Renter-occupied |
| Single Unit, Detached | 279 (76.4%) | 86 (23.6%) |
| Single Unit, Attached | 8 (100.0%) | 0 (0.0%) |
| 2 Unit Apartments | 8 (100.0%) | 0 (0.0%) |
| 3 or 4 Unit Apartments | 7 (100.0%) | 0 (0.0%) |
| 5 to 9 Unit Apartments | 32 (100.0%) | 0 (0.0%) |
| 10 or more Apartments | 0 (0.0%) | 0 (0.0%) |
| Mobile Home / Other | 0 (0.0%) | 0 (0.0%) |
| Total | 334 (79.5%) | 86 (20.5%) |
Housing Structures by Number of Rooms in New Preston
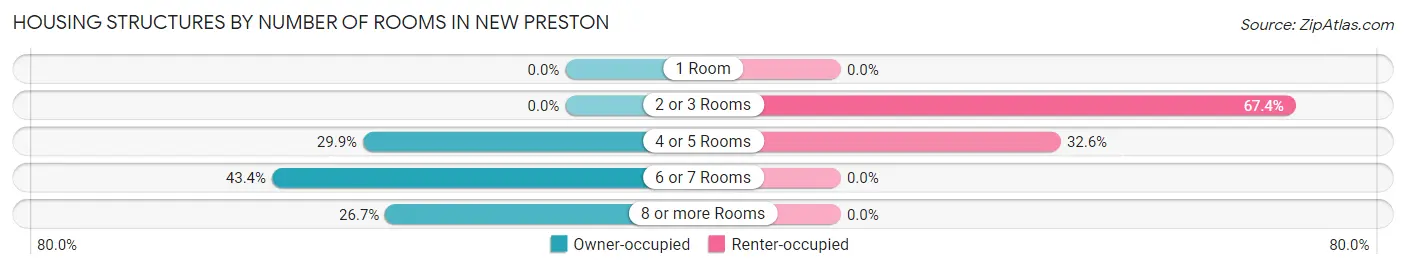
| Number of Rooms | Owner-occupied | Renter-occupied |
| 1 Room | 0 (0.0%) | 0 (0.0%) |
| 2 or 3 Rooms | 0 (0.0%) | 58 (67.4%) |
| 4 or 5 Rooms | 100 (29.9%) | 28 (32.6%) |
| 6 or 7 Rooms | 145 (43.4%) | 0 (0.0%) |
| 8 or more Rooms | 89 (26.7%) | 0 (0.0%) |
| Total | 334 (100.0%) | 86 (100.0%) |
Housing Structure by Heating Type in New Preston
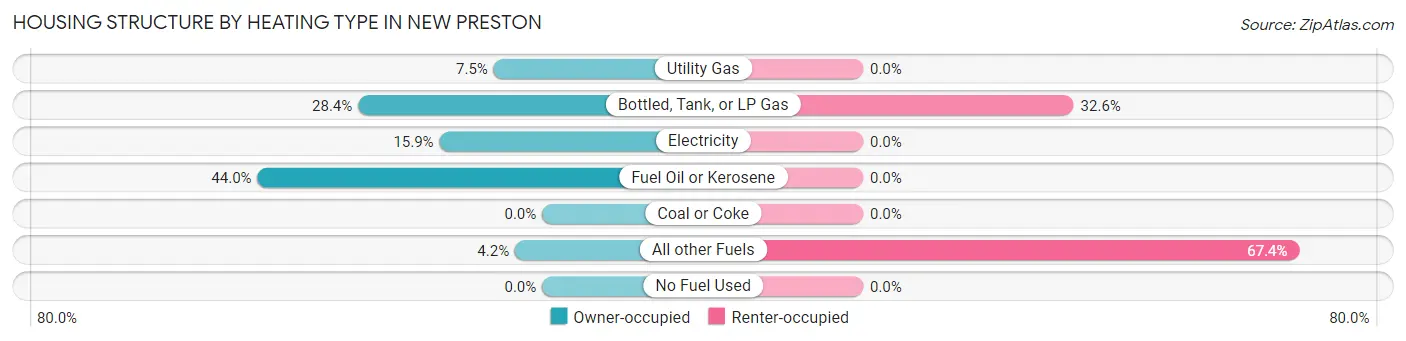
| Heating Type | Owner-occupied | Renter-occupied |
| Utility Gas | 25 (7.5%) | 0 (0.0%) |
| Bottled, Tank, or LP Gas | 95 (28.4%) | 28 (32.6%) |
| Electricity | 53 (15.9%) | 0 (0.0%) |
| Fuel Oil or Kerosene | 147 (44.0%) | 0 (0.0%) |
| Coal or Coke | 0 (0.0%) | 0 (0.0%) |
| All other Fuels | 14 (4.2%) | 58 (67.4%) |
| No Fuel Used | 0 (0.0%) | 0 (0.0%) |
| Total | 334 (100.0%) | 86 (100.0%) |
Household Vehicle Usage in New Preston
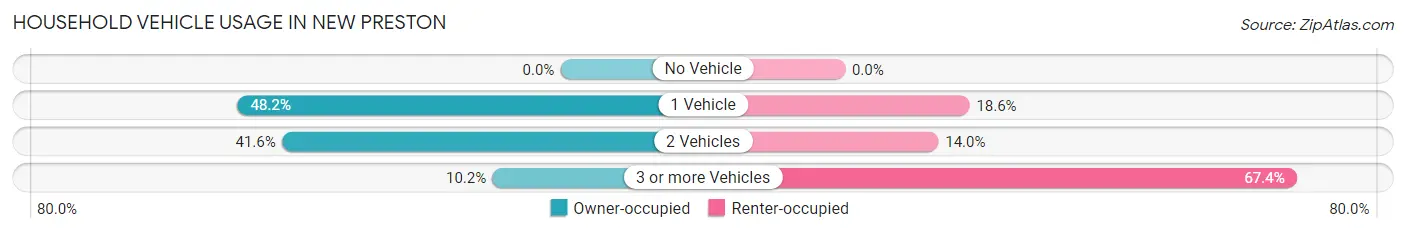
| Vehicles per Household | Owner-occupied | Renter-occupied |
| No Vehicle | 0 (0.0%) | 0 (0.0%) |
| 1 Vehicle | 161 (48.2%) | 16 (18.6%) |
| 2 Vehicles | 139 (41.6%) | 12 (14.0%) |
| 3 or more Vehicles | 34 (10.2%) | 58 (67.4%) |
| Total | 334 (100.0%) | 86 (100.0%) |
Real Estate & Mortgages in New Preston
Real Estate and Mortgage Overview in New Preston
| Characteristic | Without Mortgage | With Mortgage |
| Housing Units | 142 | 192 |
| Median Property Value | $351,600 | $416,700 |
| Median Household Income | $85,179 | $75 |
| Monthly Housing Costs | $864 | $69 |
| Real Estate Taxes | $3,661 | $0 |
Property Value by Mortgage Status in New Preston
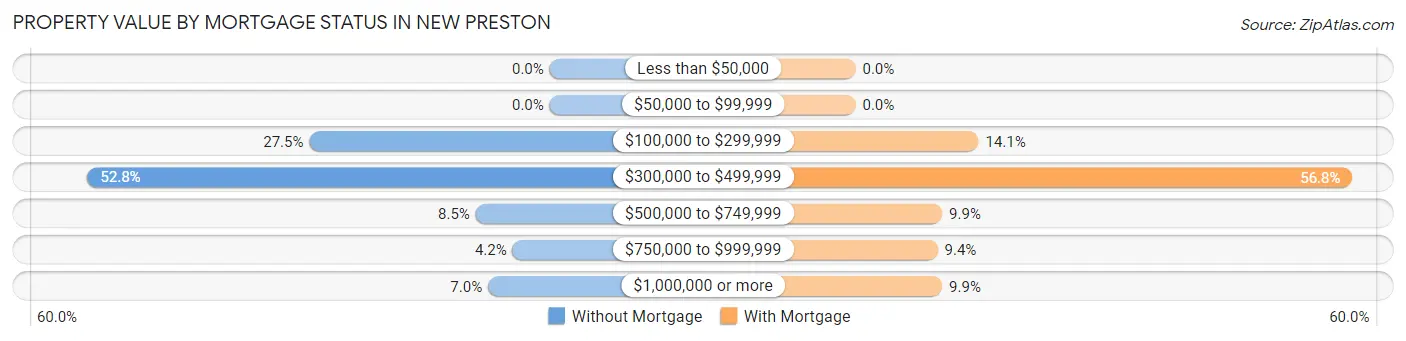
| Property Value | Without Mortgage | With Mortgage |
| Less than $50,000 | 0 (0.0%) | 0 (0.0%) |
| $50,000 to $99,999 | 0 (0.0%) | 0 (0.0%) |
| $100,000 to $299,999 | 39 (27.5%) | 27 (14.1%) |
| $300,000 to $499,999 | 75 (52.8%) | 109 (56.8%) |
| $500,000 to $749,999 | 12 (8.5%) | 19 (9.9%) |
| $750,000 to $999,999 | 6 (4.2%) | 18 (9.4%) |
| $1,000,000 or more | 10 (7.0%) | 19 (9.9%) |
| Total | 142 (100.0%) | 192 (100.0%) |
Household Income by Mortgage Status in New Preston
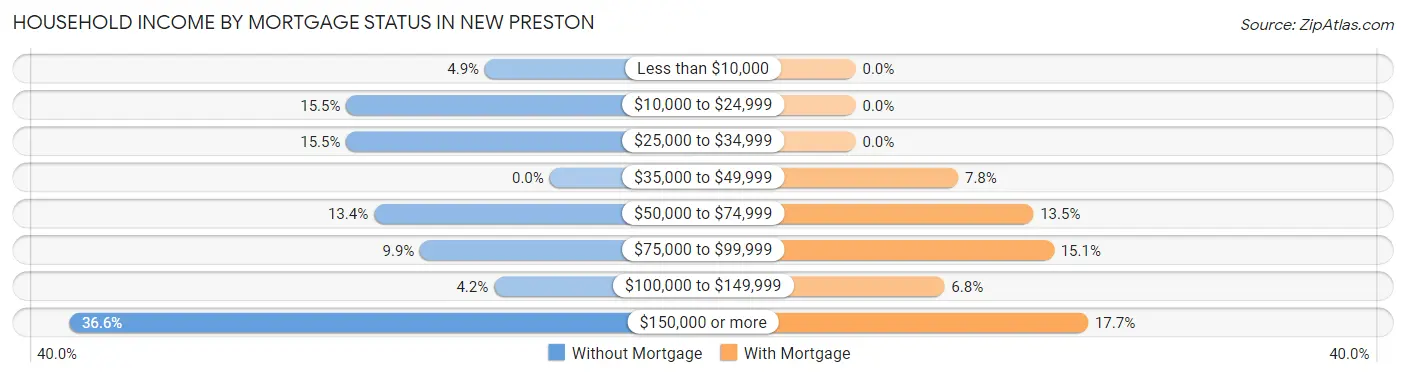
| Household Income | Without Mortgage | With Mortgage |
| Less than $10,000 | 7 (4.9%) | 0 (0.0%) |
| $10,000 to $24,999 | 22 (15.5%) | 0 (0.0%) |
| $25,000 to $34,999 | 22 (15.5%) | 0 (0.0%) |
| $35,000 to $49,999 | 0 (0.0%) | 15 (7.8%) |
| $50,000 to $74,999 | 19 (13.4%) | 26 (13.5%) |
| $75,000 to $99,999 | 14 (9.9%) | 29 (15.1%) |
| $100,000 to $149,999 | 6 (4.2%) | 13 (6.8%) |
| $150,000 or more | 52 (36.6%) | 34 (17.7%) |
| Total | 142 (100.0%) | 192 (100.0%) |
Property Value to Household Income Ratio in New Preston
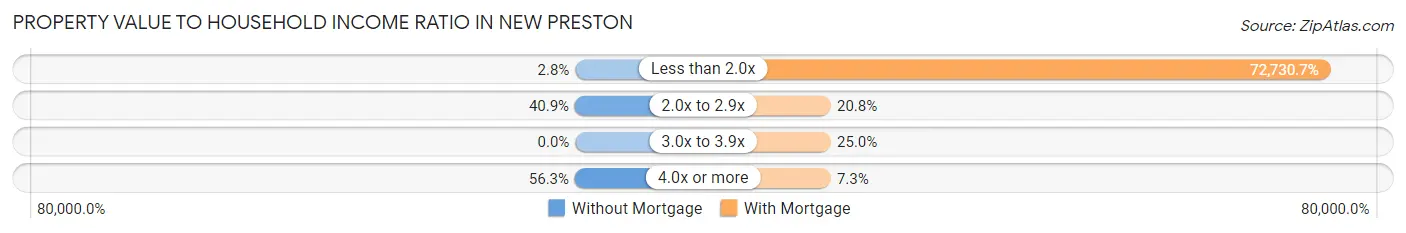
| Value-to-Income Ratio | Without Mortgage | With Mortgage |
| Less than 2.0x | 4 (2.8%) | 139,643 (72,730.7%) |
| 2.0x to 2.9x | 58 (40.8%) | 40 (20.8%) |
| 3.0x to 3.9x | 0 (0.0%) | 48 (25.0%) |
| 4.0x or more | 80 (56.3%) | 14 (7.3%) |
| Total | 142 (100.0%) | 192 (100.0%) |
Real Estate Taxes by Mortgage Status in New Preston
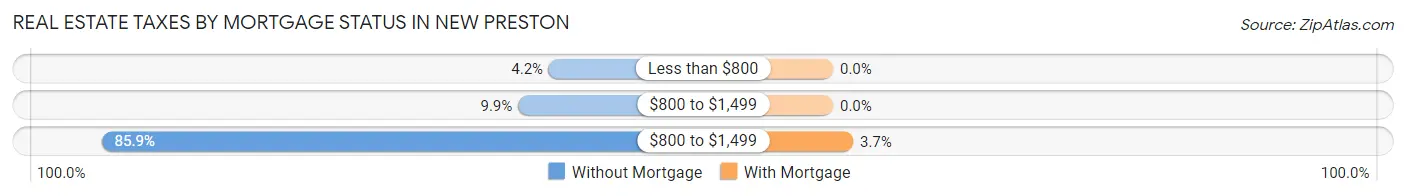
| Property Taxes | Without Mortgage | With Mortgage |
| Less than $800 | 6 (4.2%) | 0 (0.0%) |
| $800 to $1,499 | 14 (9.9%) | 0 (0.0%) |
| $800 to $1,499 | 122 (85.9%) | 7 (3.6%) |
| Total | 142 (100.0%) | 192 (100.0%) |
Health & Disability in New Preston
Health Insurance Coverage by Age in New Preston
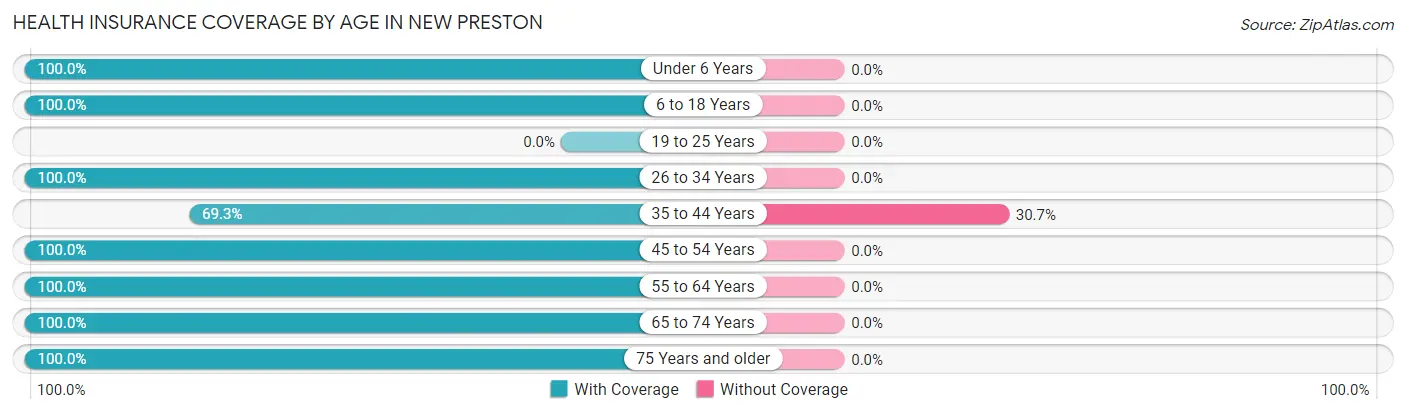
| Age Bracket | With Coverage | Without Coverage |
| Under 6 Years | 121 (100.0%) | 0 (0.0%) |
| 6 to 18 Years | 156 (100.0%) | 0 (0.0%) |
| 19 to 25 Years | 0 (0.0%) | 0 (0.0%) |
| 26 to 34 Years | 116 (100.0%) | 0 (0.0%) |
| 35 to 44 Years | 52 (69.3%) | 23 (30.7%) |
| 45 to 54 Years | 135 (100.0%) | 0 (0.0%) |
| 55 to 64 Years | 191 (100.0%) | 0 (0.0%) |
| 65 to 74 Years | 152 (100.0%) | 0 (0.0%) |
| 75 Years and older | 80 (100.0%) | 0 (0.0%) |
| Total | 1,003 (97.8%) | 23 (2.2%) |
Health Insurance Coverage by Citizenship Status in New Preston
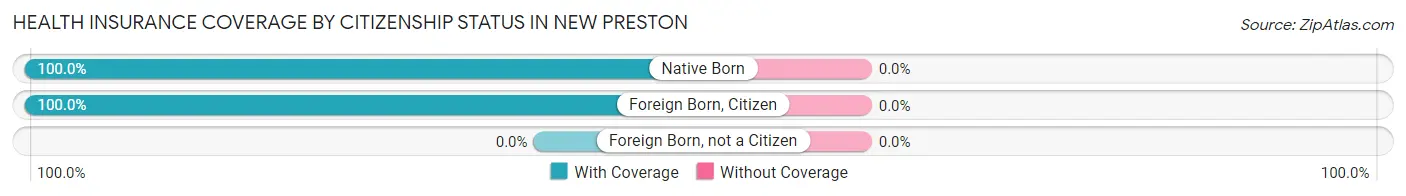
| Citizenship Status | With Coverage | Without Coverage |
| Native Born | 121 (100.0%) | 0 (0.0%) |
| Foreign Born, Citizen | 156 (100.0%) | 0 (0.0%) |
| Foreign Born, not a Citizen | 0 (0.0%) | 0 (0.0%) |
Health Insurance Coverage by Household Income in New Preston
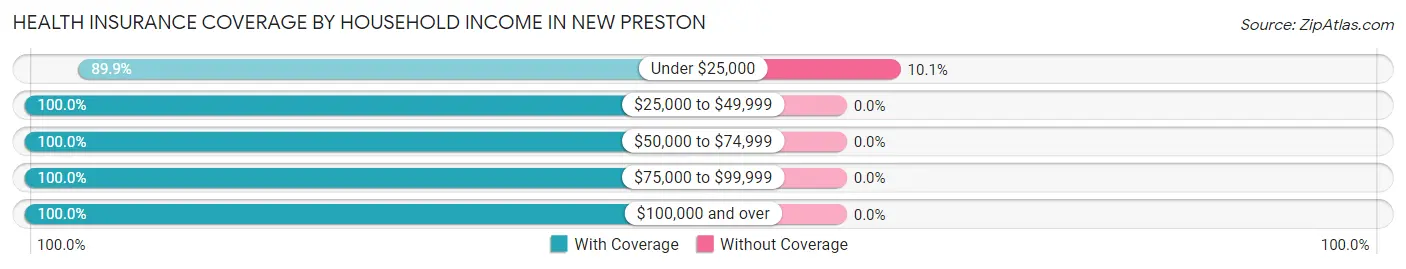
| Household Income | With Coverage | Without Coverage |
| Under $25,000 | 205 (89.9%) | 23 (10.1%) |
| $25,000 to $49,999 | 130 (100.0%) | 0 (0.0%) |
| $50,000 to $74,999 | 61 (100.0%) | 0 (0.0%) |
| $75,000 to $99,999 | 67 (100.0%) | 0 (0.0%) |
| $100,000 and over | 468 (100.0%) | 0 (0.0%) |
Public vs Private Health Insurance Coverage by Age in New Preston
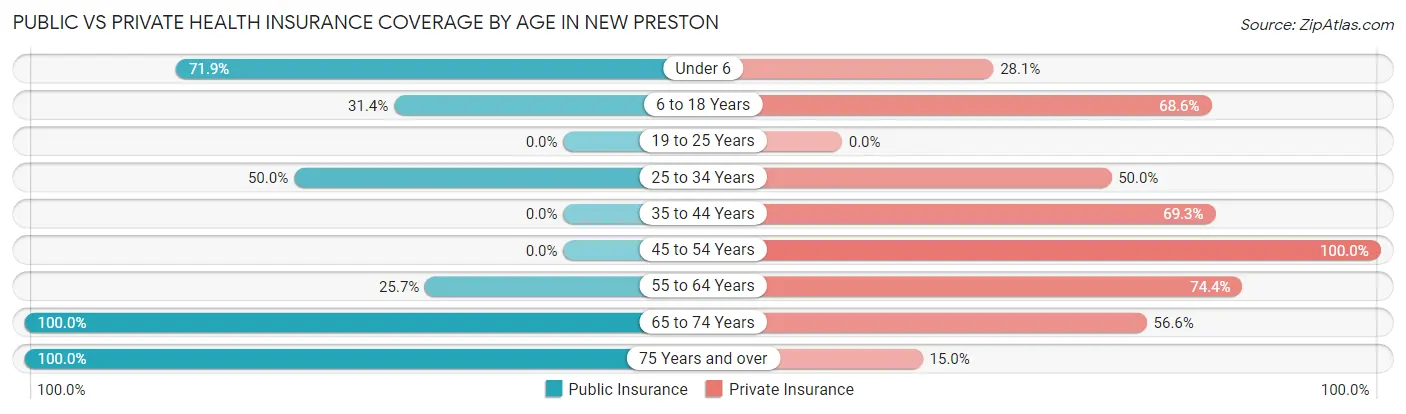
| Age Bracket | Public Insurance | Private Insurance |
| Under 6 | 87 (71.9%) | 34 (28.1%) |
| 6 to 18 Years | 49 (31.4%) | 107 (68.6%) |
| 19 to 25 Years | 0 (0.0%) | 0 (0.0%) |
| 25 to 34 Years | 58 (50.0%) | 58 (50.0%) |
| 35 to 44 Years | 0 (0.0%) | 52 (69.3%) |
| 45 to 54 Years | 0 (0.0%) | 135 (100.0%) |
| 55 to 64 Years | 49 (25.7%) | 142 (74.4%) |
| 65 to 74 Years | 152 (100.0%) | 86 (56.6%) |
| 75 Years and over | 80 (100.0%) | 12 (15.0%) |
| Total | 475 (46.3%) | 626 (61.0%) |
Disability Status by Sex by Age in New Preston
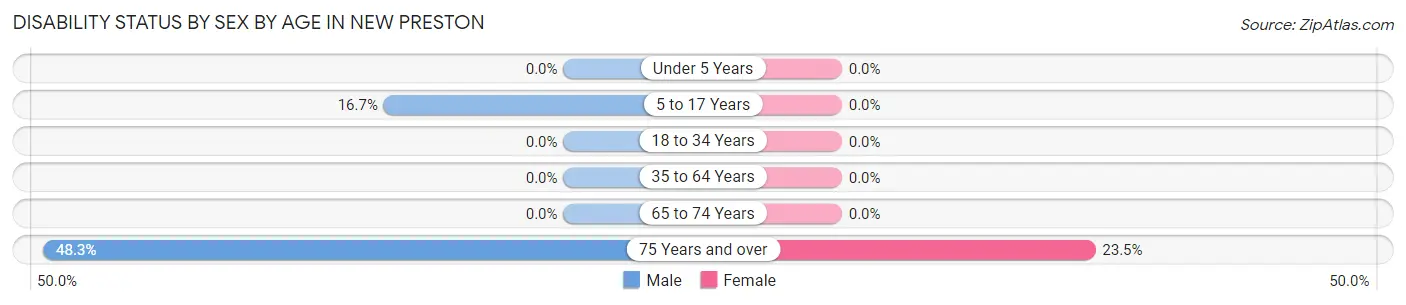
| Age Bracket | Male | Female |
| Under 5 Years | 0 (0.0%) | 0 (0.0%) |
| 5 to 17 Years | 11 (16.7%) | 0 (0.0%) |
| 18 to 34 Years | 0 (0.0%) | 0 (0.0%) |
| 35 to 64 Years | 0 (0.0%) | 0 (0.0%) |
| 65 to 74 Years | 0 (0.0%) | 0 (0.0%) |
| 75 Years and over | 14 (48.3%) | 12 (23.5%) |
Disability Class by Sex by Age in New Preston
Disability Class: Hearing Difficulty
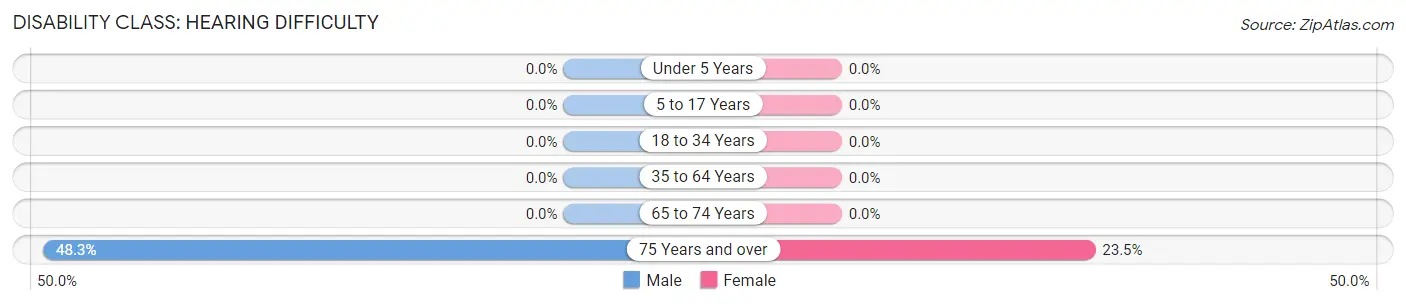
| Age Bracket | Male | Female |
| Under 5 Years | 0 (0.0%) | 0 (0.0%) |
| 5 to 17 Years | 0 (0.0%) | 0 (0.0%) |
| 18 to 34 Years | 0 (0.0%) | 0 (0.0%) |
| 35 to 64 Years | 0 (0.0%) | 0 (0.0%) |
| 65 to 74 Years | 0 (0.0%) | 0 (0.0%) |
| 75 Years and over | 14 (48.3%) | 12 (23.5%) |
Disability Class: Vision Difficulty
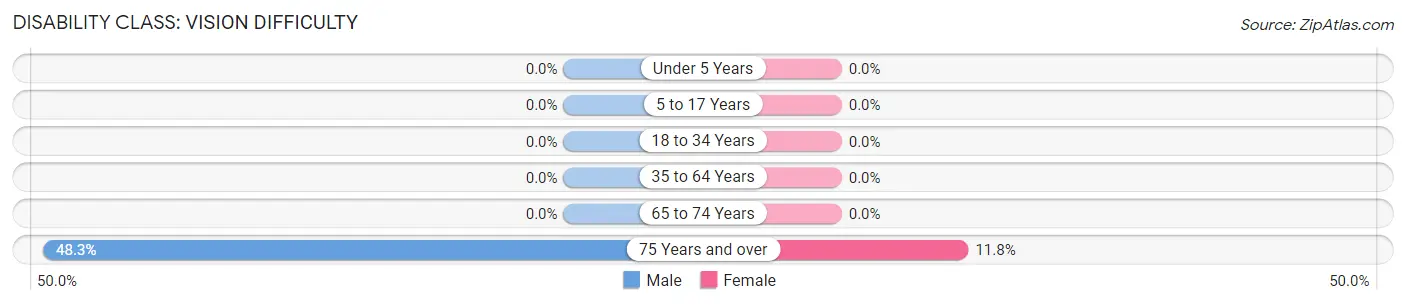
| Age Bracket | Male | Female |
| Under 5 Years | 0 (0.0%) | 0 (0.0%) |
| 5 to 17 Years | 0 (0.0%) | 0 (0.0%) |
| 18 to 34 Years | 0 (0.0%) | 0 (0.0%) |
| 35 to 64 Years | 0 (0.0%) | 0 (0.0%) |
| 65 to 74 Years | 0 (0.0%) | 0 (0.0%) |
| 75 Years and over | 14 (48.3%) | 6 (11.8%) |
Disability Class: Cognitive Difficulty
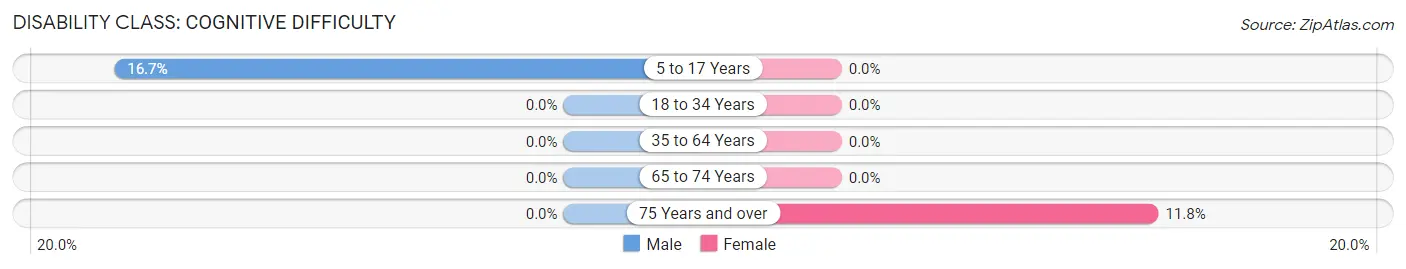
| Age Bracket | Male | Female |
| 5 to 17 Years | 11 (16.7%) | 0 (0.0%) |
| 18 to 34 Years | 0 (0.0%) | 0 (0.0%) |
| 35 to 64 Years | 0 (0.0%) | 0 (0.0%) |
| 65 to 74 Years | 0 (0.0%) | 0 (0.0%) |
| 75 Years and over | 0 (0.0%) | 6 (11.8%) |
Disability Class: Ambulatory Difficulty
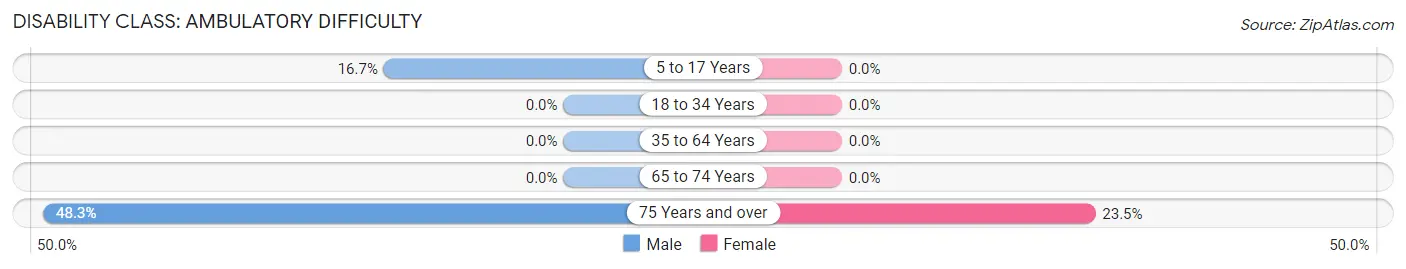
| Age Bracket | Male | Female |
| 5 to 17 Years | 11 (16.7%) | 0 (0.0%) |
| 18 to 34 Years | 0 (0.0%) | 0 (0.0%) |
| 35 to 64 Years | 0 (0.0%) | 0 (0.0%) |
| 65 to 74 Years | 0 (0.0%) | 0 (0.0%) |
| 75 Years and over | 14 (48.3%) | 12 (23.5%) |
Disability Class: Self-Care Difficulty
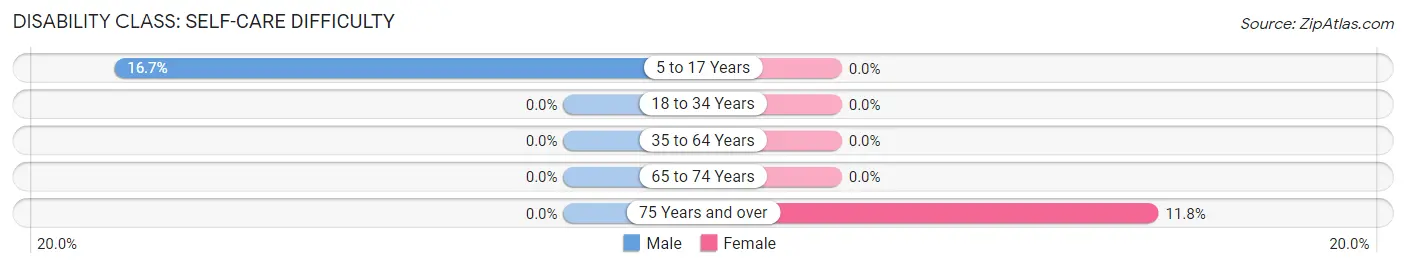
| Age Bracket | Male | Female |
| 5 to 17 Years | 11 (16.7%) | 0 (0.0%) |
| 18 to 34 Years | 0 (0.0%) | 0 (0.0%) |
| 35 to 64 Years | 0 (0.0%) | 0 (0.0%) |
| 65 to 74 Years | 0 (0.0%) | 0 (0.0%) |
| 75 Years and over | 0 (0.0%) | 6 (11.8%) |
Technology Access in New Preston
Computing Device Access in New Preston
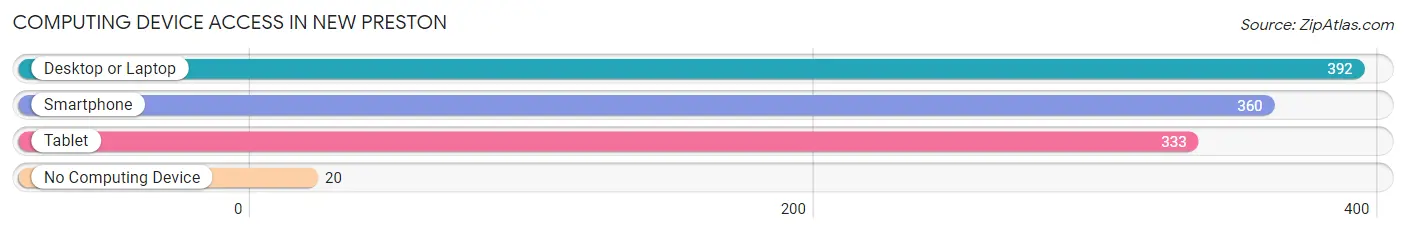
| Device Type | # Households | % Households |
| Desktop or Laptop | 392 | 93.3% |
| Smartphone | 360 | 85.7% |
| Tablet | 333 | 79.3% |
| No Computing Device | 20 | 4.8% |
| Total | 420 | 100.0% |
Internet Access in New Preston
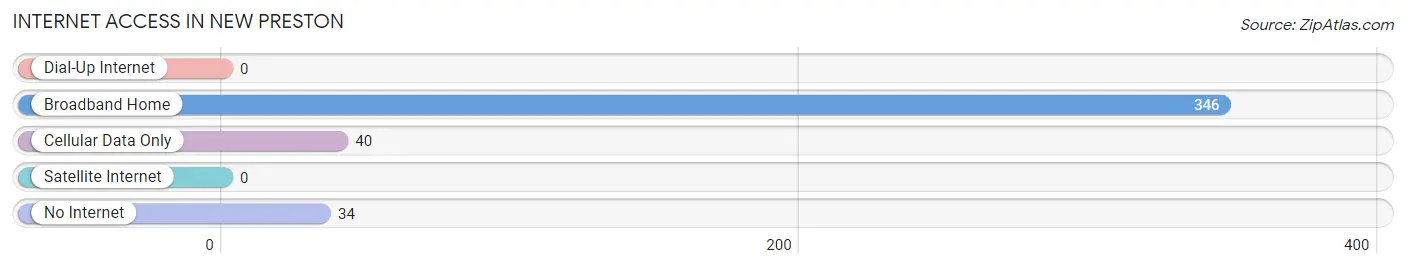
| Internet Type | # Households | % Households |
| Dial-Up Internet | 0 | 0.0% |
| Broadband Home | 346 | 82.4% |
| Cellular Data Only | 40 | 9.5% |
| Satellite Internet | 0 | 0.0% |
| No Internet | 34 | 8.1% |
| Total | 420 | 100.0% |
New Preston Summary
Preston, Connecticut is a small town located in New London County, Connecticut. It is bordered by the towns of Griswold, Norwich, and North Stonington. The town was incorporated in 1786 and is home to approximately 4,000 people.
History
Preston was originally part of the Mohegan Indian Reservation, which was established in 1640. The Mohegans were a tribe of Algonquian-speaking Native Americans who lived in the area. In 1659, the Mohegans sold the land to the English settlers, who then divided it into several townships. Preston was one of these townships, and was named after the English town of Preston, Lancashire.
In 1786, Preston was officially incorporated as a town. During the 19th century, Preston was a rural farming community. The town was known for its dairy farms, and the local economy was largely based on agriculture.
In the late 19th century, the town began to experience a period of growth and development. The town was connected to the railroad in 1871, and the population began to increase. The town also began to attract new industries, such as the Preston Manufacturing Company, which produced woolen goods.
Geography
Preston is located in southeastern Connecticut, in New London County. The town is bordered by the towns of Griswold, Norwich, and North Stonington. The town is situated on the banks of the Quinebaug River, which flows through the town.
The town has a total area of 24.2 square miles, of which 23.9 square miles is land and 0.3 square miles is water. The town is mostly rural, with a few small villages and hamlets. The highest point in the town is the summit of Mount Misery, which has an elevation of 590 feet.
Economy
The economy of Preston is largely based on agriculture and tourism. The town is home to several dairy farms, as well as a number of apple orchards. The town also has several wineries and vineyards, which attract tourists from all over the region.
In addition to agriculture, the town is home to several small businesses, such as restaurants, retail stores, and professional services. The town is also home to the Preston Manufacturing Company, which produces woolen goods.
Demographics
As of the 2010 census, the town had a population of 4,247. The racial makeup of the town was 94.3% White, 1.3% African American, 0.5% Native American, 0.7% Asian, 0.1% Pacific Islander, 1.2% from other races, and 2.0% from two or more races. Hispanic or Latino of any race were 3.2% of the population.
The median household income in the town was $60,938, and the median family income was $71,250. The per capita income for the town was $27,945. About 5.3% of families and 7.2% of the population were below the poverty line, including 8.3% of those under age 18 and 5.2% of those age 65 or over.
Common Questions
What is Per Capita Income in New Preston?
Per Capita income in New Preston is $63,182.
What is the Median Family Income in New Preston?
Median Family Income in New Preston is $87,054.
What is the Median Household income in New Preston?
Median Household Income in New Preston is $85,357.
What is Inequality or Gini Index in New Preston?
Inequality or Gini Index in New Preston is 0.52.
What is the Total Population of New Preston?
Total Population of New Preston is 1,026.
What is the Total Male Population of New Preston?
Total Male Population of New Preston is 405.
What is the Total Female Population of New Preston?
Total Female Population of New Preston is 621.
What is the Ratio of Males per 100 Females in New Preston?
There are 65.22 Males per 100 Females in New Preston.
What is the Ratio of Females per 100 Males in New Preston?
There are 153.33 Females per 100 Males in New Preston.
What is the Median Population Age in New Preston?
Median Population Age in New Preston is 48.9 Years.
What is the Average Family Size in New Preston
Average Family Size in New Preston is 2.8 People.
What is the Average Household Size in New Preston
Average Household Size in New Preston is 2.3 People.
How Large is the Labor Force in New Preston?
There are 494 People in the Labor Forcein in New Preston.
What is the Percentage of People in the Labor Force in New Preston?
62.8% of People are in the Labor Force in New Preston.
What is the Unemployment Rate in New Preston?
Unemployment Rate in New Preston is 1.4%.