Riverside, CT Map & Demographics
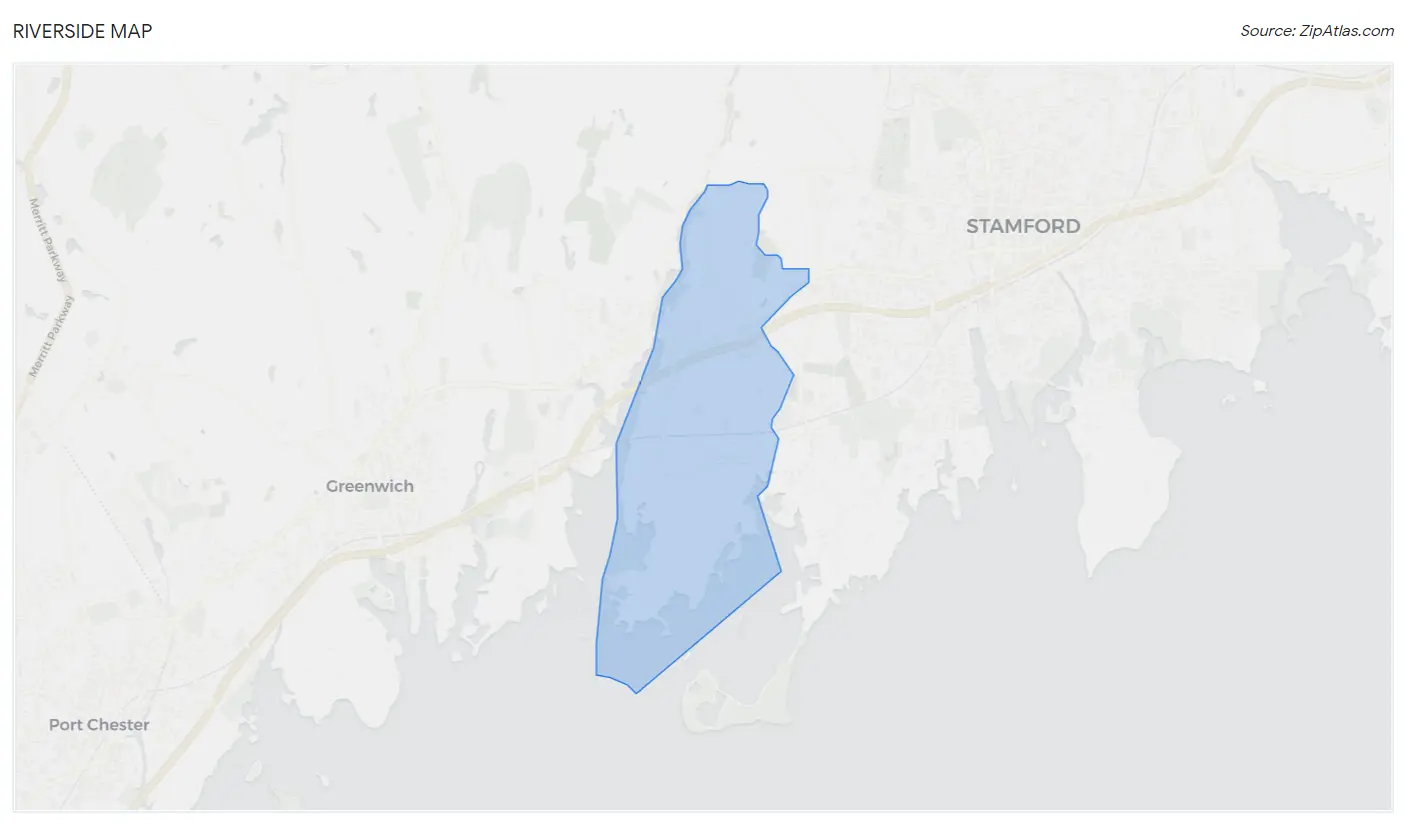
Riverside Map
Riverside Overview
$129,919
PER CAPITA INCOME
$250,001
AVG FAMILY INCOME
$250,001
AVG HOUSEHOLD INCOME
70.0%
WAGE / INCOME GAP [ % ]
30.0¢/ $1
WAGE / INCOME GAP [ $ ]
0.49
INEQUALITY / GINI INDEX
9,093
TOTAL POPULATION
4,314
MALE POPULATION
4,779
FEMALE POPULATION
90.27
MALES / 100 FEMALES
110.78
FEMALES / 100 MALES
40.7
MEDIAN AGE
3.5
AVG FAMILY SIZE
3.1
AVG HOUSEHOLD SIZE
4,149
LABOR FORCE [ PEOPLE ]
62.4%
PERCENT IN LABOR FORCE
5.6%
UNEMPLOYMENT RATE
Riverside Zip Codes
Riverside Area Codes
Income in Riverside
Income Overview in Riverside
Per Capita Income in Riverside is $129,919, while median incomes of families and households are $250,001 and $250,001 respectively.
| Characteristic | Number | Measure |
| Per Capita Income | 9,093 | $129,919 |
| Median Family Income | 2,324 | $250,001 |
| Mean Family Income | 2,324 | $444,257 |
| Median Household Income | 2,938 | $250,001 |
| Mean Household Income | 2,938 | $399,039 |
| Income Deficit | 2,324 | $0 |
| Wage / Income Gap (%) | 9,093 | 69.97% |
| Wage / Income Gap ($) | 9,093 | 30.03¢ per $1 |
| Gini / Inequality Index | 9,093 | 0.49 |
Earnings by Sex in Riverside
Average Earnings in Riverside are $107,632, $166,875 for men and $50,118 for women, a difference of 70.0%.
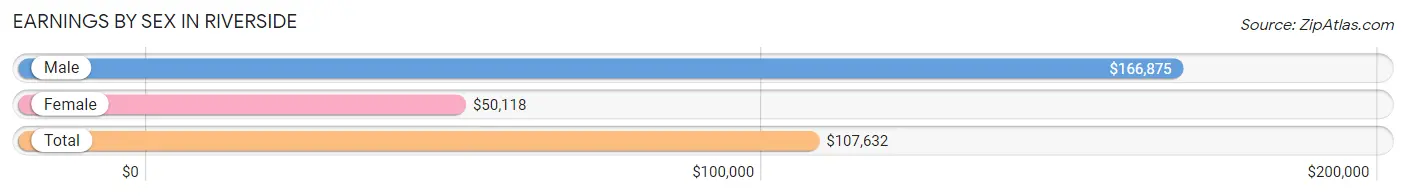
| Sex | Number | Average Earnings |
| Male | 2,589 (60.6%) | $166,875 |
| Female | 1,681 (39.4%) | $50,118 |
| Total | 4,270 (100.0%) | $107,632 |
Earnings by Sex by Income Bracket in Riverside
The most common earnings brackets in Riverside are $100,000+ for men (1,638 | 63.3%) and $100,000+ for women (558 | 33.2%).
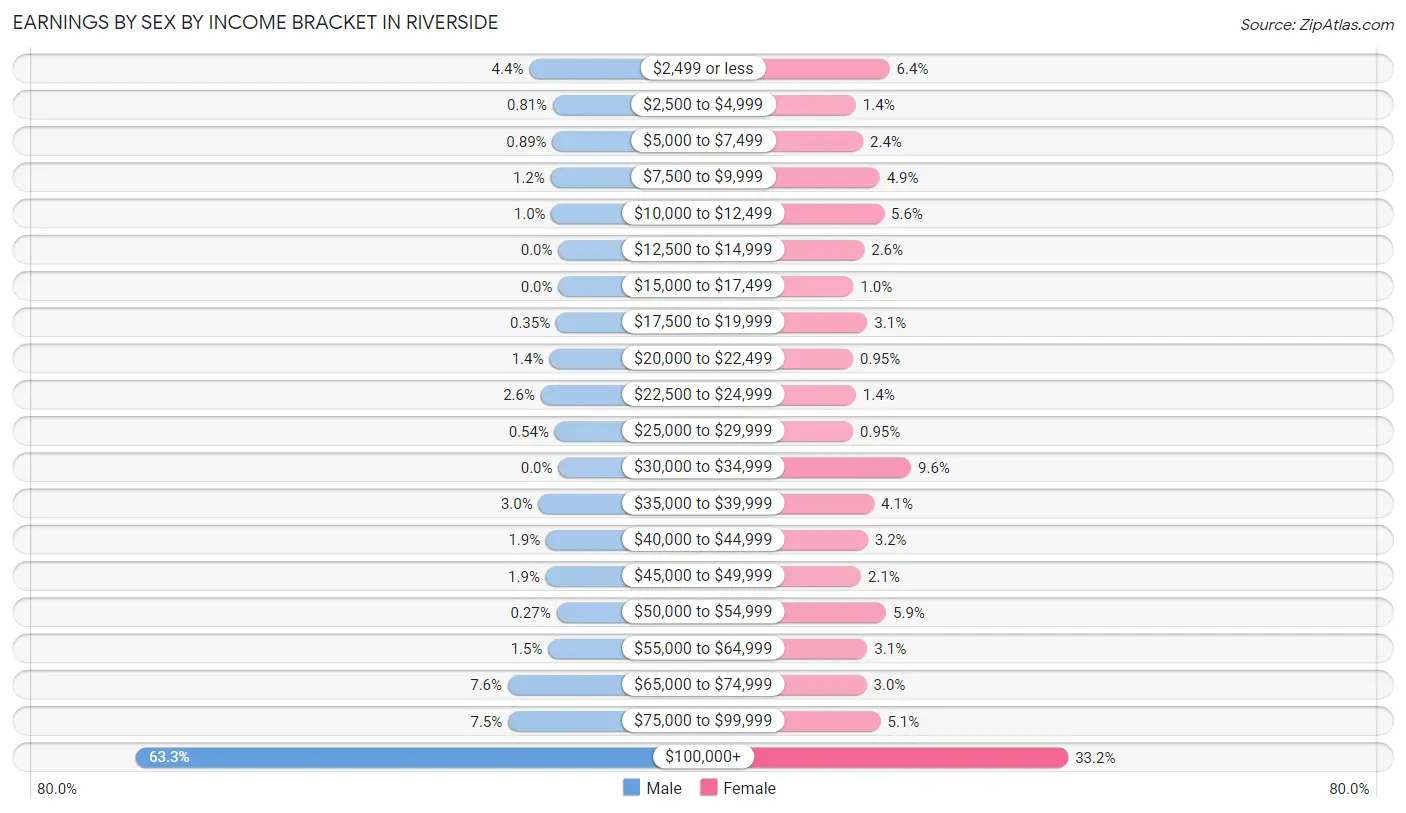
| Income | Male | Female |
| $2,499 or less | 113 (4.4%) | 108 (6.4%) |
| $2,500 to $4,999 | 21 (0.8%) | 23 (1.4%) |
| $5,000 to $7,499 | 23 (0.9%) | 41 (2.4%) |
| $7,500 to $9,999 | 30 (1.2%) | 83 (4.9%) |
| $10,000 to $12,499 | 27 (1.0%) | 94 (5.6%) |
| $12,500 to $14,999 | 0 (0.0%) | 44 (2.6%) |
| $15,000 to $17,499 | 0 (0.0%) | 17 (1.0%) |
| $17,500 to $19,999 | 9 (0.4%) | 52 (3.1%) |
| $20,000 to $22,499 | 35 (1.3%) | 16 (0.9%) |
| $22,500 to $24,999 | 68 (2.6%) | 23 (1.4%) |
| $25,000 to $29,999 | 14 (0.5%) | 16 (0.9%) |
| $30,000 to $34,999 | 0 (0.0%) | 162 (9.6%) |
| $35,000 to $39,999 | 77 (3.0%) | 69 (4.1%) |
| $40,000 to $44,999 | 48 (1.8%) | 53 (3.2%) |
| $45,000 to $49,999 | 49 (1.9%) | 36 (2.1%) |
| $50,000 to $54,999 | 7 (0.3%) | 99 (5.9%) |
| $55,000 to $64,999 | 39 (1.5%) | 52 (3.1%) |
| $65,000 to $74,999 | 196 (7.6%) | 50 (3.0%) |
| $75,000 to $99,999 | 195 (7.5%) | 85 (5.1%) |
| $100,000+ | 1,638 (63.3%) | 558 (33.2%) |
| Total | 2,589 (100.0%) | 1,681 (100.0%) |
Earnings by Sex by Educational Attainment in Riverside
Average earnings in Riverside are $209,932 for men and $60,625 for women, a difference of 71.1%. Men with an educational attainment of bachelor's degree enjoy the highest average annual earnings of $250,001, while those with college or associate's degree education earn the least with $89,625. Women with an educational attainment of graduate degree earn the most with the average annual earnings of $111,574, while those with high school diploma education have the smallest earnings of $38,979.
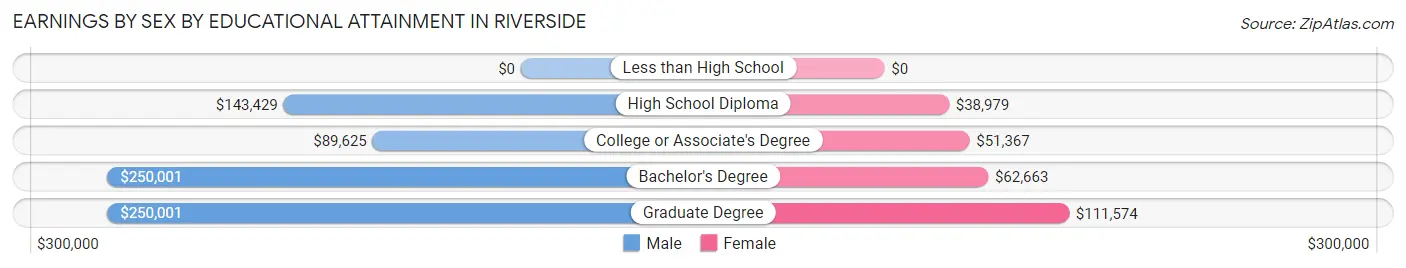
| Educational Attainment | Male Income | Female Income |
| Less than High School | - | - |
| High School Diploma | $143,429 | $38,979 |
| College or Associate's Degree | $89,625 | $51,367 |
| Bachelor's Degree | $250,001 | $62,663 |
| Graduate Degree | $250,001 | $111,574 |
| Total | $209,932 | $60,625 |
Family Income in Riverside
Family Income Brackets in Riverside
According to the Riverside family income data, there are 1,627 families falling into the $200,000+ income range, which is the most common income bracket and makes up 70.0% of all families. Conversely, the $15,000 to $24,999 income bracket is the least frequent group with only 7 families (0.3%) belonging to this category.
| Income Bracket | # Families | % Families |
| Less than $10,000 | 33 | 1.4% |
| $10,000 to $14,999 | 14 | 0.6% |
| $15,000 to $24,999 | 7 | 0.3% |
| $25,000 to $34,999 | 21 | 0.9% |
| $35,000 to $49,999 | 23 | 1.0% |
| $50,000 to $74,999 | 125 | 5.4% |
| $75,000 to $99,999 | 53 | 2.3% |
| $100,000 to $149,999 | 290 | 12.5% |
| $150,000 to $199,999 | 130 | 5.6% |
| $200,000+ | 1,627 | 70.0% |
Family Income by Famaliy Size in Riverside
3-person families (641 | 27.6%) account for the highest median family income in Riverside with $250,001 per family, while 2-person families (639 | 27.5%) have the highest median income of $88,496 per family member.
| Income Bracket | # Families | Median Income |
| 2-Person Families | 639 (27.5%) | $176,991 |
| 3-Person Families | 641 (27.6%) | $250,001 |
| 4-Person Families | 480 (20.6%) | $250,001 |
| 5-Person Families | 495 (21.3%) | $250,001 |
| 6-Person Families | 69 (3.0%) | $250,001 |
| 7+ Person Families | 0 (0.0%) | $0 |
| Total | 2,324 (100.0%) | $250,001 |
Family Income by Number of Earners in Riverside
| Number of Earners | # Families | Median Income |
| No Earners | 245 (10.5%) | $0 |
| 1 Earner | 927 (39.9%) | $250,001 |
| 2 Earners | 843 (36.3%) | $250,001 |
| 3+ Earners | 309 (13.3%) | $250,001 |
| Total | 2,324 (100.0%) | $250,001 |
Household Income in Riverside
Household Income Brackets in Riverside
With 1,898 households falling in the category, the $200,000+ income range is the most frequent in Riverside, accounting for 64.6% of all households. In contrast, only 9 households (0.3%) fall into the $10,000 to $14,999 income bracket, making it the least populous group.
| Income Bracket | # Households | % Households |
| Less than $10,000 | 68 | 2.3% |
| $10,000 to $14,999 | 9 | 0.3% |
| $15,000 to $24,999 | 53 | 1.8% |
| $25,000 to $34,999 | 53 | 1.8% |
| $35,000 to $49,999 | 156 | 5.3% |
| $50,000 to $74,999 | 170 | 5.8% |
| $75,000 to $99,999 | 91 | 3.1% |
| $100,000 to $149,999 | 285 | 9.7% |
| $150,000 to $199,999 | 156 | 5.3% |
| $200,000+ | 1,898 | 64.6% |
Household Income by Householder Age in Riverside
The median household income in Riverside is $250,001, with the highest median household income of $250,001 found in the 25 to 44 years age bracket for the primary householder. A total of 614 households (20.9%) fall into this category. Meanwhile, the 15 to 24 years age bracket for the primary householder has the lowest median household income of $0, with 64 households (2.2%) in this group.
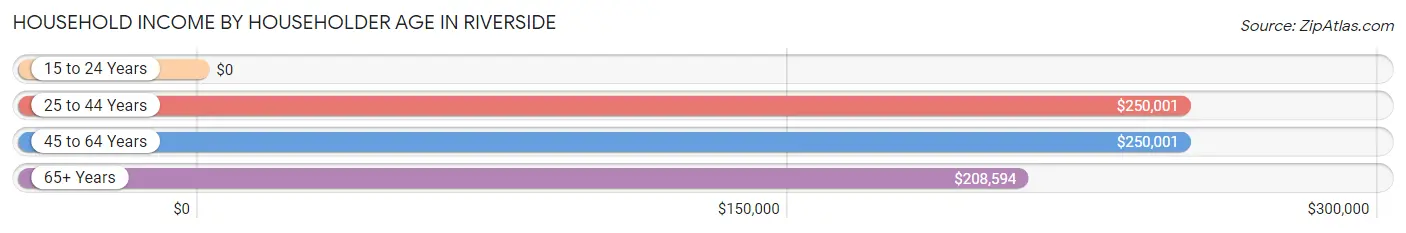
| Income Bracket | # Households | Median Income |
| 15 to 24 Years | 64 (2.2%) | $0 |
| 25 to 44 Years | 614 (20.9%) | $250,001 |
| 45 to 64 Years | 1,496 (50.9%) | $250,001 |
| 65+ Years | 764 (26.0%) | $208,594 |
| Total | 2,938 (100.0%) | $250,001 |
Poverty in Riverside
Income Below Poverty by Sex and Age in Riverside
With 2.3% poverty level for males and 4.3% for females among the residents of Riverside, 5 year old males and 25 to 34 year old females are the most vulnerable to poverty, with 22 males (23.7%) and 53 females (21.2%) in their respective age groups living below the poverty level.
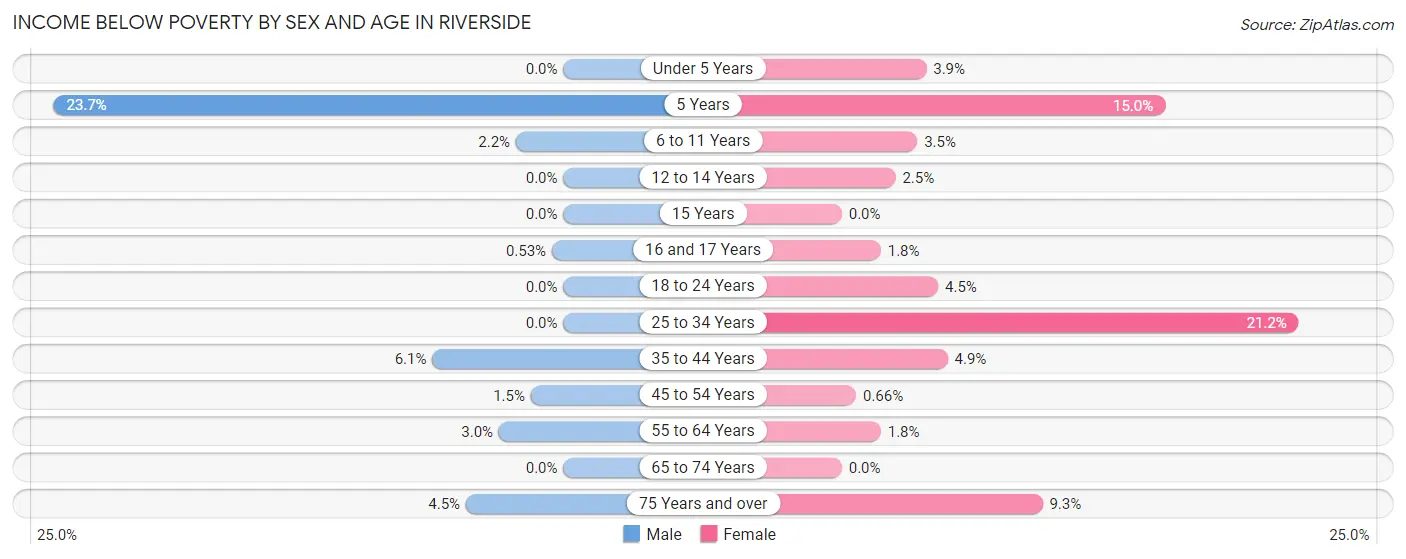
| Age Bracket | Male | Female |
| Under 5 Years | 0 (0.0%) | 13 (3.9%) |
| 5 Years | 22 (23.7%) | 21 (15.0%) |
| 6 to 11 Years | 10 (2.2%) | 15 (3.5%) |
| 12 to 14 Years | 0 (0.0%) | 8 (2.5%) |
| 15 Years | 0 (0.0%) | 0 (0.0%) |
| 16 and 17 Years | 1 (0.5%) | 5 (1.8%) |
| 18 to 24 Years | 0 (0.0%) | 11 (4.5%) |
| 25 to 34 Years | 0 (0.0%) | 53 (21.2%) |
| 35 to 44 Years | 29 (6.1%) | 31 (4.9%) |
| 45 to 54 Years | 12 (1.5%) | 5 (0.7%) |
| 55 to 64 Years | 18 (3.0%) | 10 (1.8%) |
| 65 to 74 Years | 0 (0.0%) | 0 (0.0%) |
| 75 Years and over | 9 (4.5%) | 31 (9.3%) |
| Total | 101 (2.3%) | 203 (4.3%) |
Income Above Poverty by Sex and Age in Riverside
According to the poverty statistics in Riverside, males aged under 5 years and females aged 15 years are the age groups that are most secure financially, with 100.0% of males and 100.0% of females in these age groups living above the poverty line.
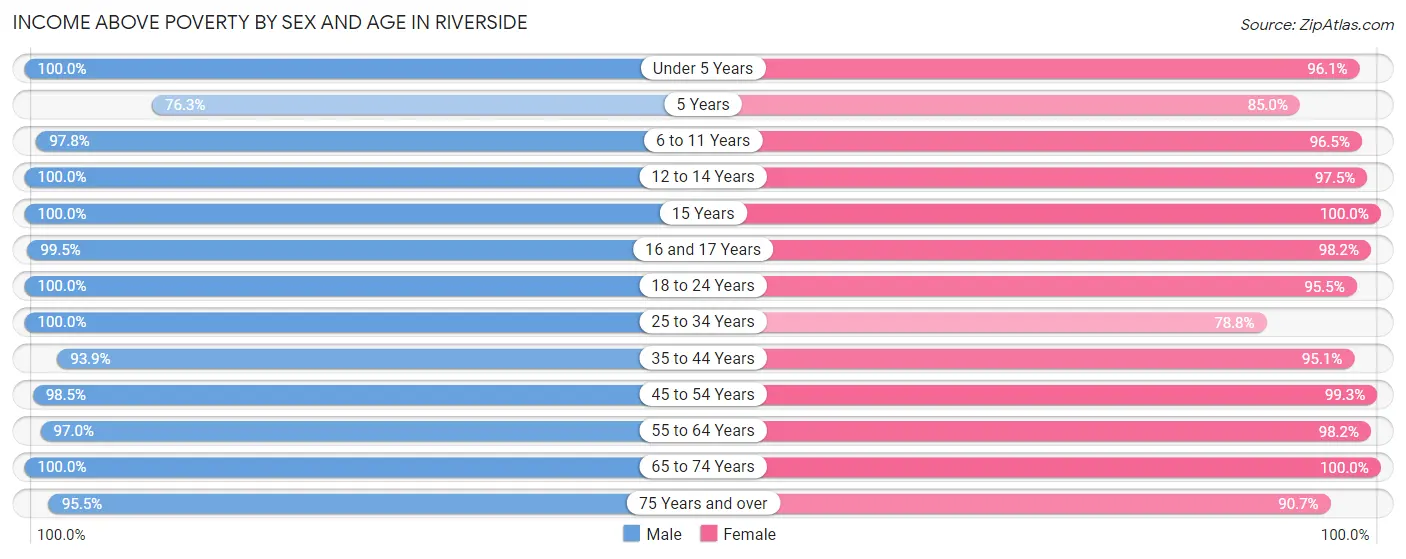
| Age Bracket | Male | Female |
| Under 5 Years | 184 (100.0%) | 319 (96.1%) |
| 5 Years | 71 (76.3%) | 119 (85.0%) |
| 6 to 11 Years | 444 (97.8%) | 413 (96.5%) |
| 12 to 14 Years | 241 (100.0%) | 313 (97.5%) |
| 15 Years | 125 (100.0%) | 126 (100.0%) |
| 16 and 17 Years | 187 (99.5%) | 272 (98.2%) |
| 18 to 24 Years | 388 (100.0%) | 235 (95.5%) |
| 25 to 34 Years | 273 (100.0%) | 197 (78.8%) |
| 35 to 44 Years | 448 (93.9%) | 601 (95.1%) |
| 45 to 54 Years | 783 (98.5%) | 749 (99.3%) |
| 55 to 64 Years | 584 (97.0%) | 541 (98.2%) |
| 65 to 74 Years | 295 (100.0%) | 389 (100.0%) |
| 75 Years and over | 190 (95.5%) | 302 (90.7%) |
| Total | 4,213 (97.7%) | 4,576 (95.8%) |
Income Below Poverty Among Married-Couple Families in Riverside
The poverty statistics for married-couple families in Riverside show that 2.0% or 40 of the total 2,027 families live below the poverty line. Families with 1 or 2 children have the highest poverty rate of 3.4%, comprising of 26 families. On the other hand, families with no children have the lowest poverty rate of 1.1%, which includes 9 families.
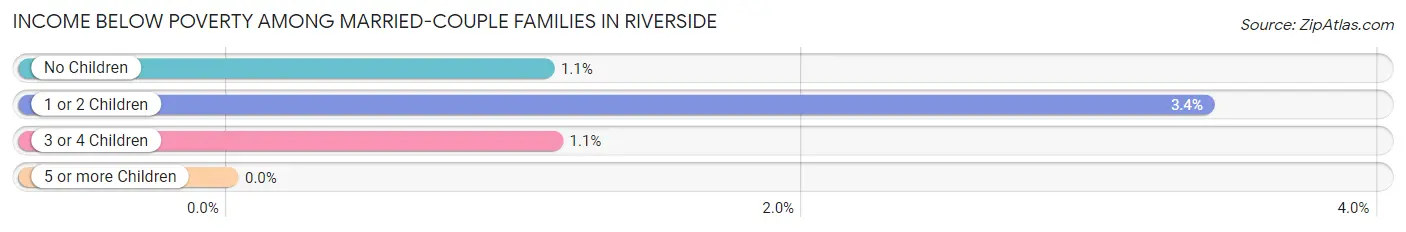
| Children | Above Poverty | Below Poverty |
| No Children | 811 (98.9%) | 9 (1.1%) |
| 1 or 2 Children | 739 (96.6%) | 26 (3.4%) |
| 3 or 4 Children | 437 (98.9%) | 5 (1.1%) |
| 5 or more Children | 0 (0.0%) | 0 (0.0%) |
| Total | 1,987 (98.0%) | 40 (2.0%) |
Income Below Poverty Among Single-Parent Households in Riverside
| Children | Single Father | Single Mother |
| No Children | 0 (0.0%) | 0 (0.0%) |
| 1 or 2 Children | 0 (0.0%) | 14 (10.3%) |
| 3 or 4 Children | 0 (0.0%) | 0 (0.0%) |
| 5 or more Children | 0 (0.0%) | 0 (0.0%) |
| Total | 0 (0.0%) | 14 (6.5%) |
Income Below Poverty Among Married-Couple vs Single-Parent Households in Riverside
The poverty data for Riverside shows that 40 of the married-couple family households (2.0%) and 14 of the single-parent households (4.7%) are living below the poverty level. Within the married-couple family households, those with 1 or 2 children have the highest poverty rate, with 26 households (3.4%) falling below the poverty line. Among the single-parent households, those with 1 or 2 children have the highest poverty rate, with 14 household (8.1%) living below poverty.
| Children | Married-Couple Families | Single-Parent Households |
| No Children | 9 (1.1%) | 0 (0.0%) |
| 1 or 2 Children | 26 (3.4%) | 14 (8.1%) |
| 3 or 4 Children | 5 (1.1%) | 0 (0.0%) |
| 5 or more Children | 0 (0.0%) | 0 (0.0%) |
| Total | 40 (2.0%) | 14 (4.7%) |
Race in Riverside
The most populous races in Riverside are White / Caucasian (6,233 | 68.5%), Hispanic or Latino (1,423 | 15.7%), and Asian (1,372 | 15.1%).
| Race | # Population | % Population |
| Asian | 1,372 | 15.1% |
| Black / African American | 402 | 4.4% |
| Hawaiian / Pacific | 0 | 0.0% |
| Hispanic or Latino | 1,423 | 15.7% |
| Native / Alaskan | 18 | 0.2% |
| White / Caucasian | 6,233 | 68.5% |
| Two or more Races | 892 | 9.8% |
| Some other Race | 176 | 1.9% |
| Total | 9,093 | 100.0% |
Ancestry in Riverside
The most populous ancestries reported in Riverside are Italian (1,374 | 15.1%), Irish (935 | 10.3%), English (771 | 8.5%), South American (770 | 8.5%), and German (564 | 6.2%), together accounting for 48.5% of all Riverside residents.
| Ancestry | # Population | % Population |
| Albanian | 17 | 0.2% |
| American | 212 | 2.3% |
| Arab | 174 | 1.9% |
| Argentinean | 405 | 4.4% |
| Armenian | 18 | 0.2% |
| Australian | 67 | 0.7% |
| Austrian | 56 | 0.6% |
| Belgian | 9 | 0.1% |
| Bhutanese | 370 | 4.1% |
| Brazilian | 124 | 1.4% |
| British | 141 | 1.5% |
| British West Indian | 9 | 0.1% |
| Burmese | 278 | 3.1% |
| Canadian | 116 | 1.3% |
| Cape Verdean | 43 | 0.5% |
| Central American | 38 | 0.4% |
| Cherokee | 27 | 0.3% |
| Chilean | 126 | 1.4% |
| Colombian | 131 | 1.4% |
| Croatian | 28 | 0.3% |
| Czech | 31 | 0.3% |
| Danish | 16 | 0.2% |
| Dutch | 234 | 2.6% |
| Eastern European | 33 | 0.4% |
| Ecuadorian | 57 | 0.6% |
| English | 771 | 8.5% |
| European | 251 | 2.8% |
| Finnish | 33 | 0.4% |
| French | 275 | 3.0% |
| French Canadian | 32 | 0.4% |
| German | 564 | 6.2% |
| Greek | 86 | 0.9% |
| Guatemalan | 38 | 0.4% |
| Haitian | 34 | 0.4% |
| Hungarian | 7 | 0.1% |
| Indian (Asian) | 560 | 6.2% |
| Irish | 935 | 10.3% |
| Italian | 1,374 | 15.1% |
| Jamaican | 110 | 1.2% |
| Korean | 48 | 0.5% |
| Lebanese | 19 | 0.2% |
| Lithuanian | 25 | 0.3% |
| Mexican | 339 | 3.7% |
| Moroccan | 85 | 0.9% |
| Northern European | 17 | 0.2% |
| Norwegian | 97 | 1.1% |
| Okinawan | 14 | 0.2% |
| Peruvian | 32 | 0.4% |
| Polish | 204 | 2.2% |
| Portuguese | 31 | 0.3% |
| Puerto Rican | 124 | 1.4% |
| Romanian | 33 | 0.4% |
| Russian | 86 | 0.9% |
| Scandinavian | 57 | 0.6% |
| Scotch-Irish | 19 | 0.2% |
| Scottish | 274 | 3.0% |
| Serbian | 86 | 0.9% |
| Slovak | 7 | 0.1% |
| South African | 14 | 0.2% |
| South American | 770 | 8.5% |
| Spaniard | 52 | 0.6% |
| Spanish | 90 | 1.0% |
| Subsaharan African | 57 | 0.6% |
| Swedish | 43 | 0.5% |
| Swiss | 7 | 0.1% |
| Thai | 272 | 3.0% |
| Ukrainian | 19 | 0.2% |
| Venezuelan | 19 | 0.2% |
| Welsh | 10 | 0.1% |
| West Indian | 15 | 0.2% | View All 70 Rows |
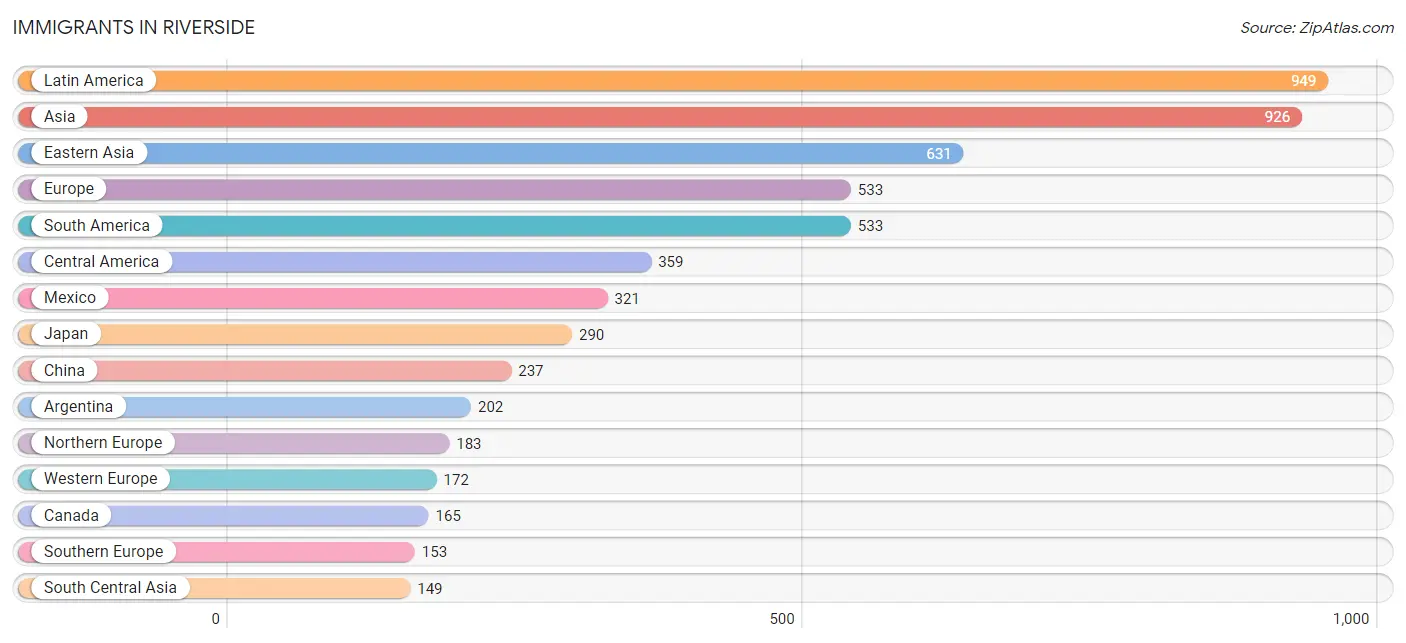
Immigrants in Riverside
The most numerous immigrant groups reported in Riverside came from Latin America (949 | 10.4%), Asia (926 | 10.2%), Eastern Asia (631 | 6.9%), Europe (533 | 5.9%), and South America (533 | 5.9%), together accounting for 39.3% of all Riverside residents.
| Immigration Origin | # Population | % Population |
| Africa | 65 | 0.7% |
| Argentina | 202 | 2.2% |
| Asia | 926 | 10.2% |
| Australia | 20 | 0.2% |
| Belgium | 22 | 0.2% |
| Brazil | 87 | 1.0% |
| Canada | 165 | 1.8% |
| Caribbean | 57 | 0.6% |
| Central America | 359 | 4.0% |
| Chile | 76 | 0.8% |
| China | 237 | 2.6% |
| Colombia | 75 | 0.8% |
| Eastern Asia | 631 | 6.9% |
| Eastern Europe | 25 | 0.3% |
| Ecuador | 42 | 0.5% |
| Egypt | 13 | 0.1% |
| England | 9 | 0.1% |
| Europe | 533 | 5.9% |
| France | 36 | 0.4% |
| Germany | 72 | 0.8% |
| Greece | 18 | 0.2% |
| Guatemala | 30 | 0.3% |
| Haiti | 34 | 0.4% |
| Honduras | 8 | 0.1% |
| Hong Kong | 12 | 0.1% |
| India | 136 | 1.5% |
| Indonesia | 13 | 0.1% |
| Ireland | 9 | 0.1% |
| Israel | 18 | 0.2% |
| Italy | 61 | 0.7% |
| Jamaica | 23 | 0.3% |
| Japan | 290 | 3.2% |
| Korea | 104 | 1.1% |
| Latin America | 949 | 10.4% |
| Lebanon | 4 | 0.0% |
| Mexico | 321 | 3.5% |
| Morocco | 35 | 0.4% |
| Netherlands | 32 | 0.4% |
| Northern Africa | 48 | 0.5% |
| Northern Europe | 183 | 2.0% |
| Oceania | 20 | 0.2% |
| Pakistan | 10 | 0.1% |
| Peru | 32 | 0.4% |
| Philippines | 65 | 0.7% |
| Scotland | 49 | 0.5% |
| Serbia | 18 | 0.2% |
| Singapore | 46 | 0.5% |
| South Africa | 17 | 0.2% |
| South America | 533 | 5.9% |
| South Central Asia | 149 | 1.6% |
| South Eastern Asia | 124 | 1.4% |
| Southern Europe | 153 | 1.7% |
| Spain | 74 | 0.8% |
| Switzerland | 10 | 0.1% |
| Taiwan | 9 | 0.1% |
| Ukraine | 7 | 0.1% |
| Uzbekistan | 3 | 0.0% |
| Venezuela | 19 | 0.2% |
| Western Asia | 22 | 0.2% |
| Western Europe | 172 | 1.9% | View All 60 Rows |
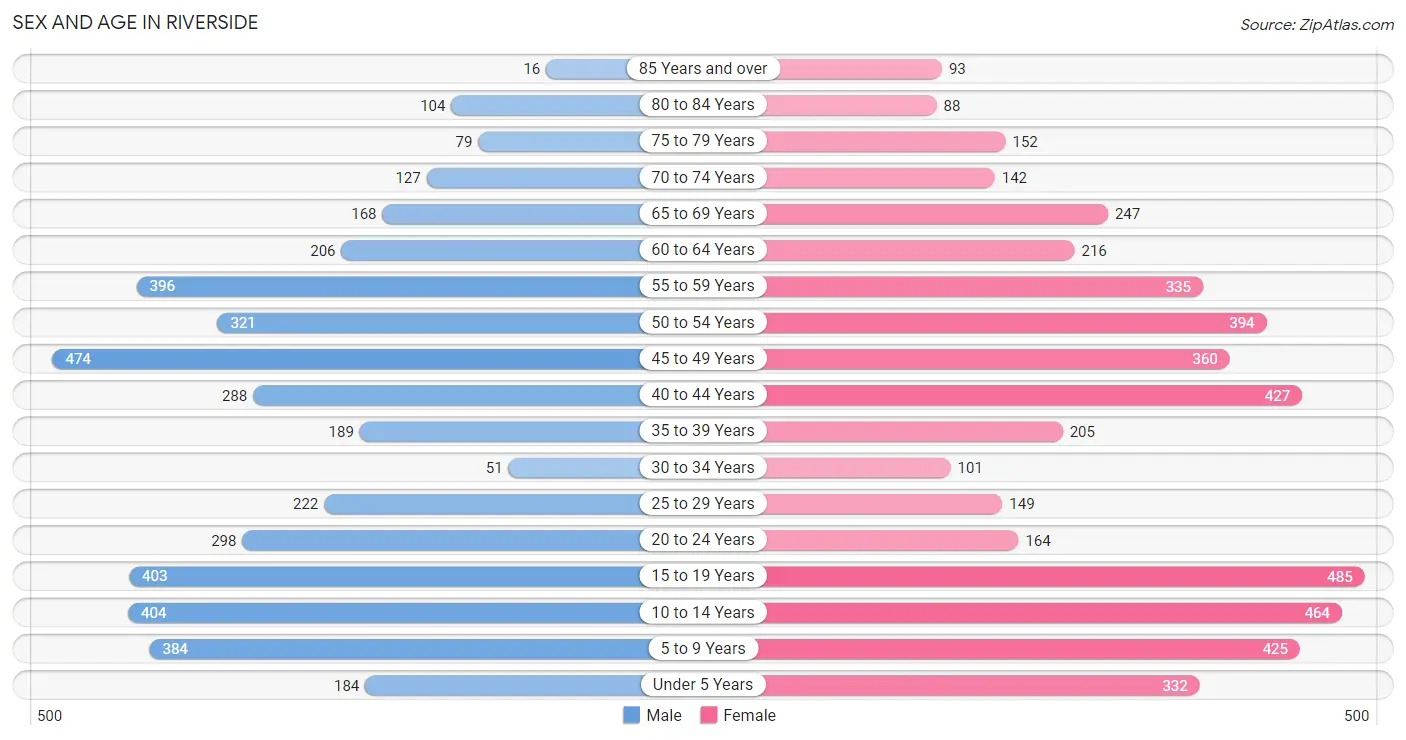
Sex and Age in Riverside
Sex and Age in Riverside
The most populous age groups in Riverside are 45 to 49 Years (474 | 11.0%) for men and 15 to 19 Years (485 | 10.2%) for women.
| Age Bracket | Male | Female |
| Under 5 Years | 184 (4.3%) | 332 (7.0%) |
| 5 to 9 Years | 384 (8.9%) | 425 (8.9%) |
| 10 to 14 Years | 404 (9.4%) | 464 (9.7%) |
| 15 to 19 Years | 403 (9.3%) | 485 (10.2%) |
| 20 to 24 Years | 298 (6.9%) | 164 (3.4%) |
| 25 to 29 Years | 222 (5.1%) | 149 (3.1%) |
| 30 to 34 Years | 51 (1.2%) | 101 (2.1%) |
| 35 to 39 Years | 189 (4.4%) | 205 (4.3%) |
| 40 to 44 Years | 288 (6.7%) | 427 (8.9%) |
| 45 to 49 Years | 474 (11.0%) | 360 (7.5%) |
| 50 to 54 Years | 321 (7.4%) | 394 (8.2%) |
| 55 to 59 Years | 396 (9.2%) | 335 (7.0%) |
| 60 to 64 Years | 206 (4.8%) | 216 (4.5%) |
| 65 to 69 Years | 168 (3.9%) | 247 (5.2%) |
| 70 to 74 Years | 127 (2.9%) | 142 (3.0%) |
| 75 to 79 Years | 79 (1.8%) | 152 (3.2%) |
| 80 to 84 Years | 104 (2.4%) | 88 (1.8%) |
| 85 Years and over | 16 (0.4%) | 93 (1.9%) |
| Total | 4,314 (100.0%) | 4,779 (100.0%) |
Families and Households in Riverside
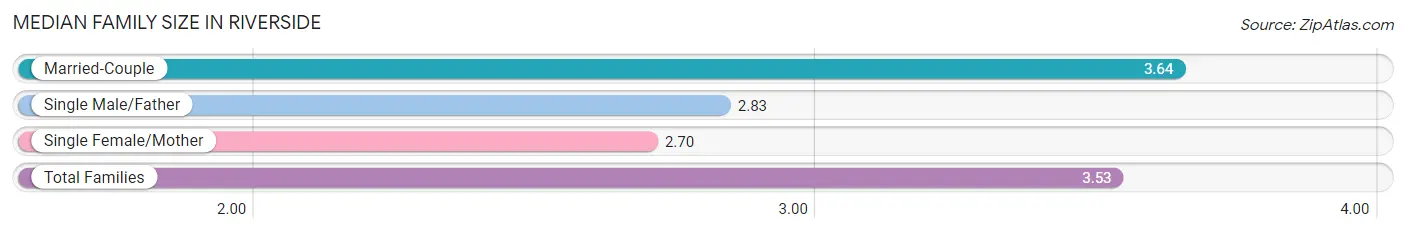
Median Family Size in Riverside
The median family size in Riverside is 3.53 persons per family, with married-couple families (2,027 | 87.2%) accounting for the largest median family size of 3.64 persons per family. On the other hand, single female/mother families (215 | 9.2%) represent the smallest median family size with 2.70 persons per family.
| Family Type | # Families | Family Size |
| Married-Couple | 2,027 (87.2%) | 3.64 |
| Single Male/Father | 82 (3.5%) | 2.83 |
| Single Female/Mother | 215 (9.2%) | 2.70 |
| Total Families | 2,324 (100.0%) | 3.53 |
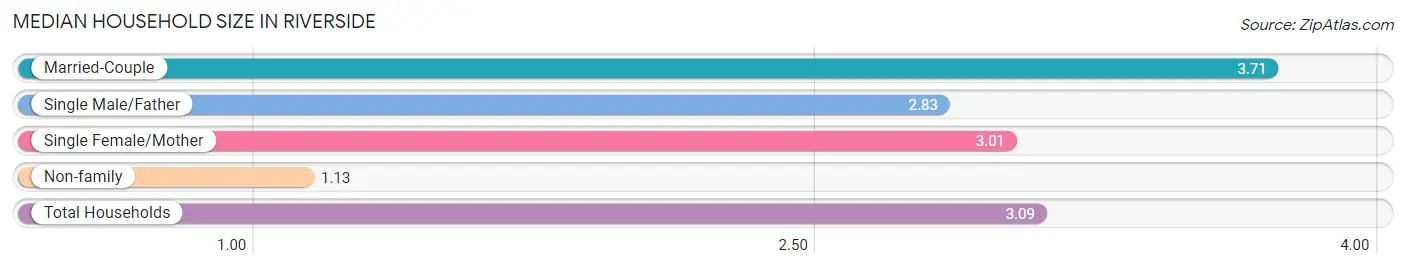
Median Household Size in Riverside
The median household size in Riverside is 3.09 persons per household, with married-couple households (2,027 | 69.0%) accounting for the largest median household size of 3.71 persons per household. non-family households (614 | 20.9%) represent the smallest median household size with 1.13 persons per household.
| Household Type | # Households | Household Size |
| Married-Couple | 2,027 (69.0%) | 3.71 |
| Single Male/Father | 82 (2.8%) | 2.83 |
| Single Female/Mother | 215 (7.3%) | 3.01 |
| Non-family | 614 (20.9%) | 1.13 |
| Total Households | 2,938 (100.0%) | 3.09 |
Household Size by Marriage Status in Riverside
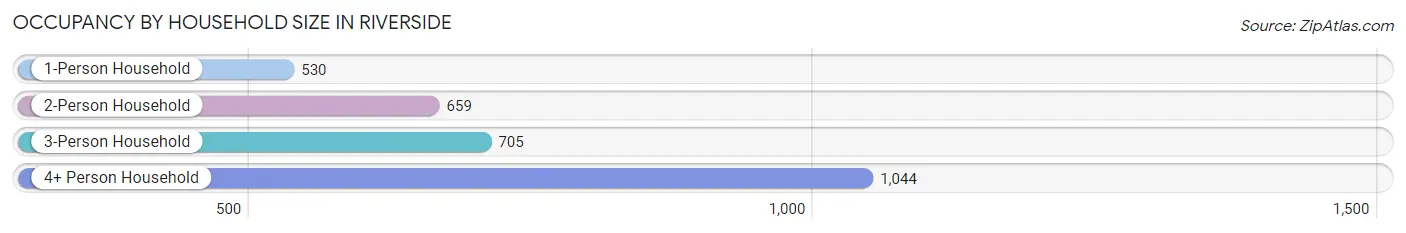
Out of a total of 2,938 households in Riverside, 2,324 (79.1%) are family households, while 614 (20.9%) are nonfamily households. The most numerous type of family households are 3-person households, comprising 705, and the most common type of nonfamily households are 1-person households, comprising 530.
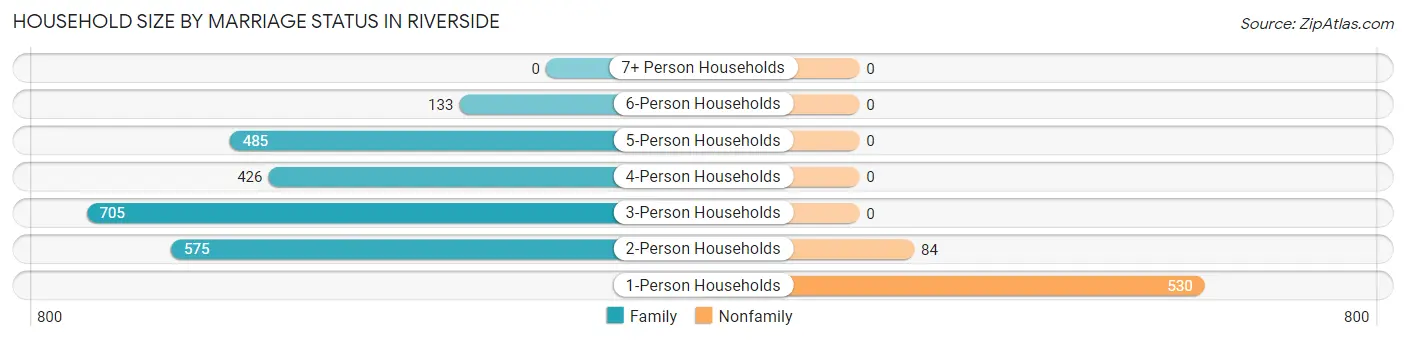
| Household Size | Family Households | Nonfamily Households |
| 1-Person Households | - | 530 (18.0%) |
| 2-Person Households | 575 (19.6%) | 84 (2.9%) |
| 3-Person Households | 705 (24.0%) | 0 (0.0%) |
| 4-Person Households | 426 (14.5%) | 0 (0.0%) |
| 5-Person Households | 485 (16.5%) | 0 (0.0%) |
| 6-Person Households | 133 (4.5%) | 0 (0.0%) |
| 7+ Person Households | 0 (0.0%) | 0 (0.0%) |
| Total | 2,324 (79.1%) | 614 (20.9%) |
Female Fertility in Riverside
Fertility by Age in Riverside
Average fertility rate in Riverside is 45.0 births per 1,000 women. Women in the age bracket of 35 to 50 years have the highest fertility rate with 75.0 births per 1,000 women. Women in the age bracket of 35 to 50 years acount for 89.9% of all women with births.
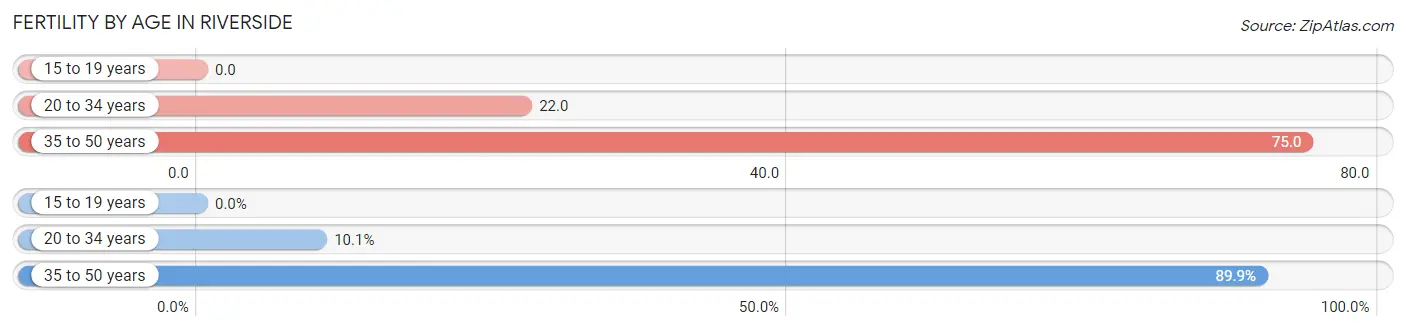
| Age Bracket | Women with Births | Births / 1,000 Women |
| 15 to 19 years | 0 (0.0%) | 0.0 |
| 20 to 34 years | 9 (10.1%) | 22.0 |
| 35 to 50 years | 80 (89.9%) | 75.0 |
| Total | 89 (100.0%) | 45.0 |
Fertility by Age by Marriage Status in Riverside
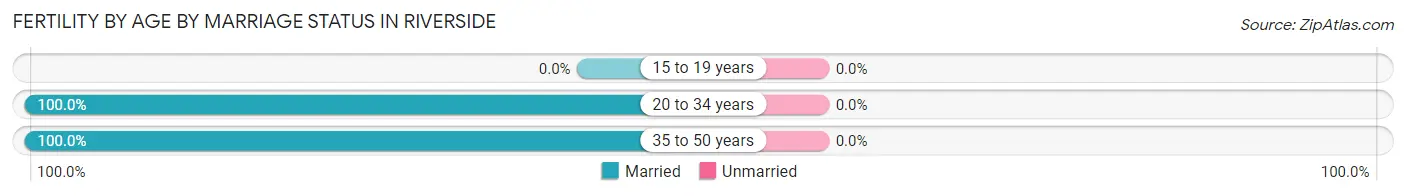
| Age Bracket | Married | Unmarried |
| 15 to 19 years | 0 (0.0%) | 0 (0.0%) |
| 20 to 34 years | 9 (100.0%) | 0 (0.0%) |
| 35 to 50 years | 80 (100.0%) | 0 (0.0%) |
| Total | 89 (100.0%) | 0 (0.0%) |
Fertility by Education in Riverside
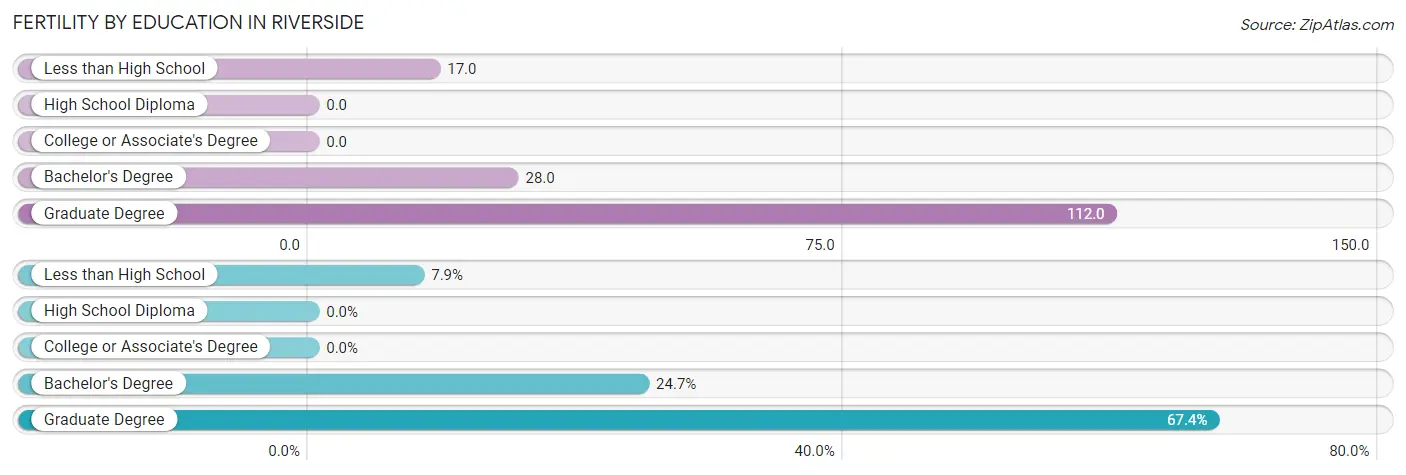
| Educational Attainment | Women with Births | Births / 1,000 Women |
| Less than High School | 7 (7.9%) | 17.0 |
| High School Diploma | 0 (0.0%) | 0.0 |
| College or Associate's Degree | 0 (0.0%) | 0.0 |
| Bachelor's Degree | 22 (24.7%) | 28.0 |
| Graduate Degree | 60 (67.4%) | 112.0 |
| Total | 89 (100.0%) | 45.0 |
Fertility by Education by Marriage Status in Riverside
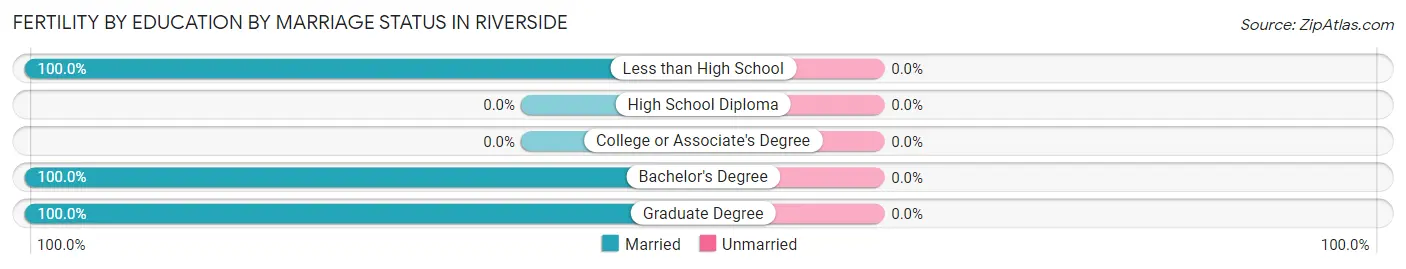
| Educational Attainment | Married | Unmarried |
| Less than High School | 7 (100.0%) | 0 (0.0%) |
| High School Diploma | 0 (0.0%) | 0 (0.0%) |
| College or Associate's Degree | 0 (0.0%) | 0 (0.0%) |
| Bachelor's Degree | 22 (100.0%) | 0 (0.0%) |
| Graduate Degree | 60 (100.0%) | 0 (0.0%) |
| Total | 89 (100.0%) | 0 (0.0%) |
Employment Characteristics in Riverside
Employment by Class of Employer in Riverside
Among the 3,827 employed individuals in Riverside, private company employees (2,517 | 65.8%), self-employed (not incorporated) (463 | 12.1%), and not-for-profit organizations (383 | 10.0%) make up the most common classes of employment.
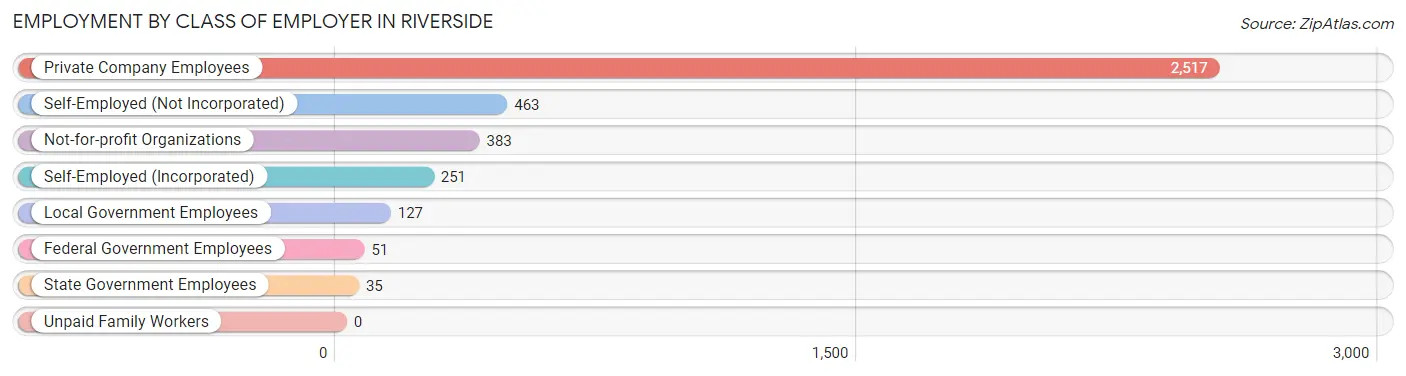
| Employer Class | # Employees | % Employees |
| Private Company Employees | 2,517 | 65.8% |
| Self-Employed (Incorporated) | 251 | 6.6% |
| Self-Employed (Not Incorporated) | 463 | 12.1% |
| Not-for-profit Organizations | 383 | 10.0% |
| Local Government Employees | 127 | 3.3% |
| State Government Employees | 35 | 0.9% |
| Federal Government Employees | 51 | 1.3% |
| Unpaid Family Workers | 0 | 0.0% |
| Total | 3,827 | 100.0% |
Employment Status by Age in Riverside
According to the labor force statistics for Riverside, out of the total population over 16 years of age (6,649), 62.4% or 4,149 individuals are in the labor force, with 5.6% or 232 of them unemployed. The age group with the highest labor force participation rate is 25 to 29 years, with 96.8% or 359 individuals in the labor force. Within the labor force, the 25 to 29 years age range has the highest percentage of unemployed individuals, with 27.3% or 98 of them being unemployed.
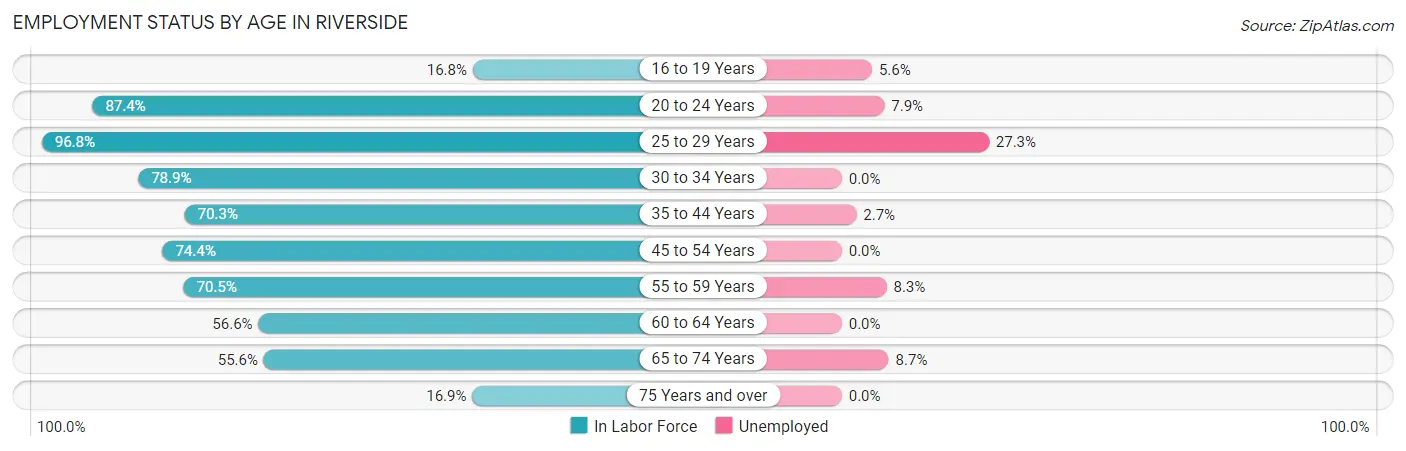
| Age Bracket | In Labor Force | Unemployed |
| 16 to 19 Years | 107 (16.8%) | 6 (5.6%) |
| 20 to 24 Years | 404 (87.4%) | 32 (7.9%) |
| 25 to 29 Years | 359 (96.8%) | 98 (27.3%) |
| 30 to 34 Years | 120 (78.9%) | 0 (0.0%) |
| 35 to 44 Years | 780 (70.3%) | 21 (2.7%) |
| 45 to 54 Years | 1,152 (74.4%) | 0 (0.0%) |
| 55 to 59 Years | 515 (70.5%) | 43 (8.3%) |
| 60 to 64 Years | 239 (56.6%) | 0 (0.0%) |
| 65 to 74 Years | 380 (55.6%) | 33 (8.7%) |
| 75 Years and over | 90 (16.9%) | 0 (0.0%) |
| Total | 4,149 (62.4%) | 232 (5.6%) |
Employment Status by Educational Attainment in Riverside
According to labor force statistics for Riverside, 73.1% of individuals (3,168) out of the total population between 25 and 64 years of age (4,334) are in the labor force, with 5.1% or 162 of them being unemployed. The group with the highest labor force participation rate are those with the educational attainment of bachelor's degree or higher, with 73.8% or 2,681 individuals in the labor force. Within the labor force, individuals with bachelor's degree or higher education have the highest percentage of unemployment, with 6.0% or 161 of them being unemployed.
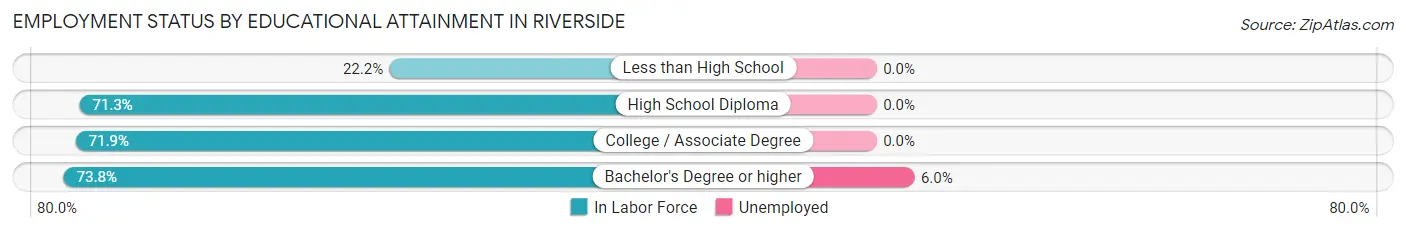
| Educational Attainment | In Labor Force | Unemployed |
| Less than High School | 8 (22.2%) | 0 (0.0%) |
| High School Diploma | 159 (71.3%) | 0 (0.0%) |
| College / Associate Degree | 318 (71.9%) | 0 (0.0%) |
| Bachelor's Degree or higher | 2,681 (73.8%) | 218 (6.0%) |
| Total | 3,168 (73.1%) | 221 (5.1%) |
Employment Occupations by Sex in Riverside
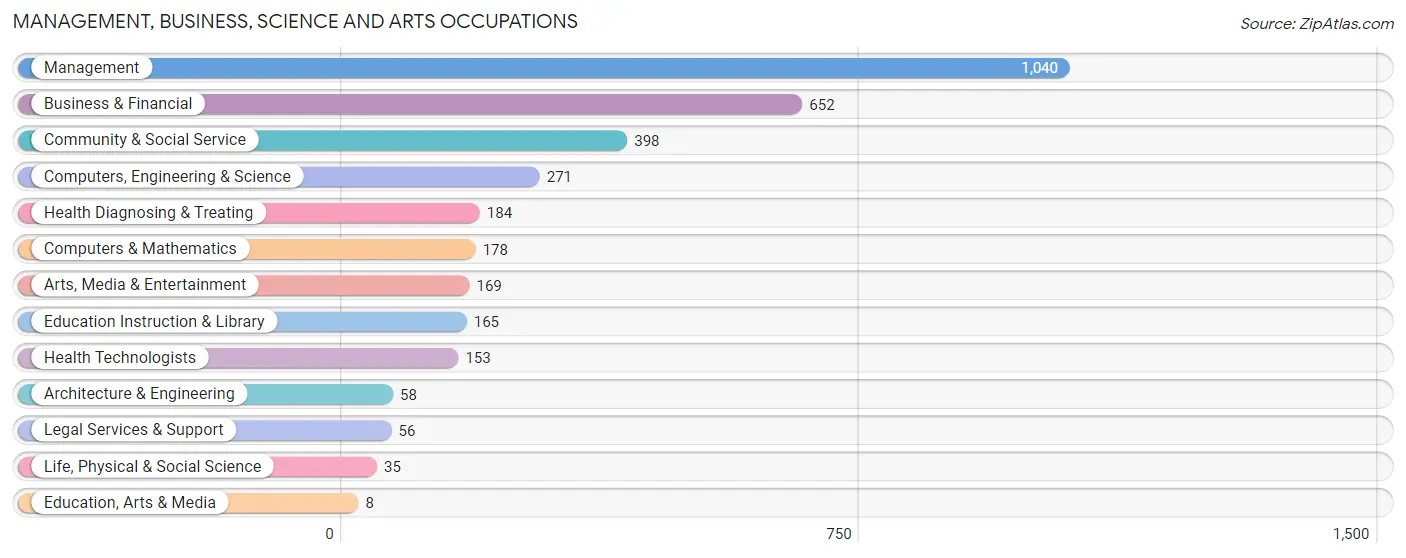
Management, Business, Science and Arts Occupations
The most common Management, Business, Science and Arts occupations in Riverside are Management (1,040 | 26.8%), Business & Financial (652 | 16.8%), Community & Social Service (398 | 10.3%), Computers, Engineering & Science (271 | 7.0%), and Health Diagnosing & Treating (184 | 4.7%).
Management, Business, Science and Arts Occupations by Sex
Within the Management, Business, Science and Arts occupations in Riverside, the most male-oriented occupations are Education, Arts & Media (100.0%), Architecture & Engineering (74.1%), and Management (71.9%), while the most female-oriented occupations are Education Instruction & Library (70.3%), Life, Physical & Social Science (60.0%), and Community & Social Service (54.0%).
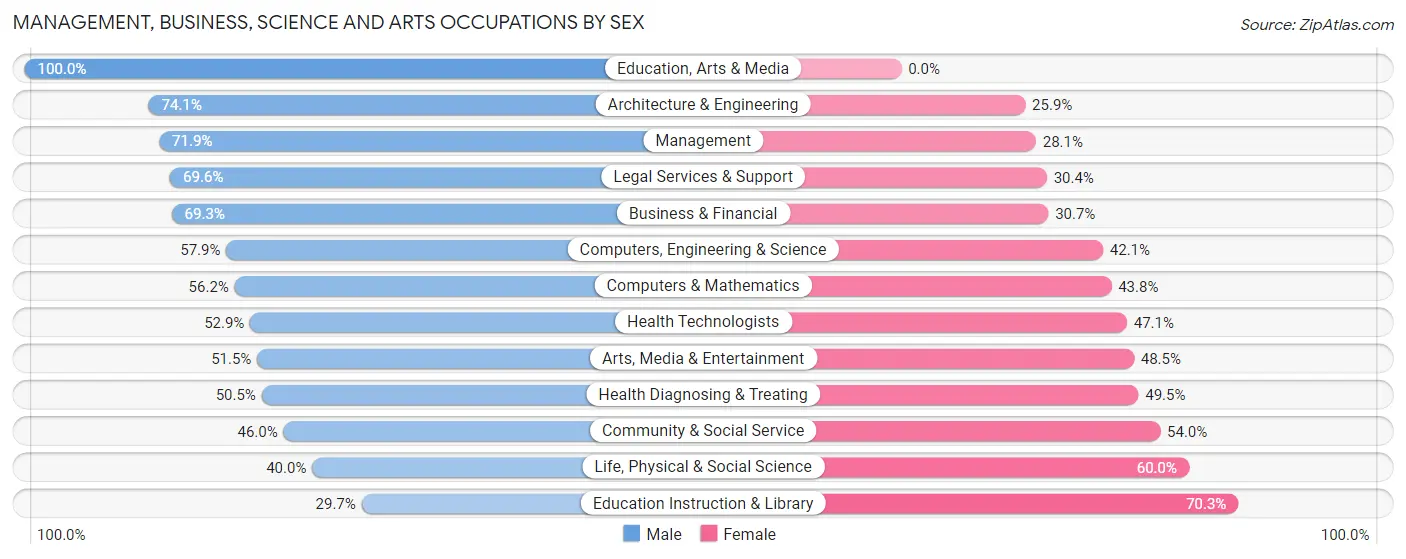
| Occupation | Male | Female |
| Management | 748 (71.9%) | 292 (28.1%) |
| Business & Financial | 452 (69.3%) | 200 (30.7%) |
| Computers, Engineering & Science | 157 (57.9%) | 114 (42.1%) |
| Computers & Mathematics | 100 (56.2%) | 78 (43.8%) |
| Architecture & Engineering | 43 (74.1%) | 15 (25.9%) |
| Life, Physical & Social Science | 14 (40.0%) | 21 (60.0%) |
| Community & Social Service | 183 (46.0%) | 215 (54.0%) |
| Education, Arts & Media | 8 (100.0%) | 0 (0.0%) |
| Legal Services & Support | 39 (69.6%) | 17 (30.4%) |
| Education Instruction & Library | 49 (29.7%) | 116 (70.3%) |
| Arts, Media & Entertainment | 87 (51.5%) | 82 (48.5%) |
| Health Diagnosing & Treating | 93 (50.5%) | 91 (49.5%) |
| Health Technologists | 81 (52.9%) | 72 (47.1%) |
| Total (Category) | 1,633 (64.2%) | 912 (35.8%) |
| Total (Overall) | 2,414 (62.2%) | 1,466 (37.8%) |
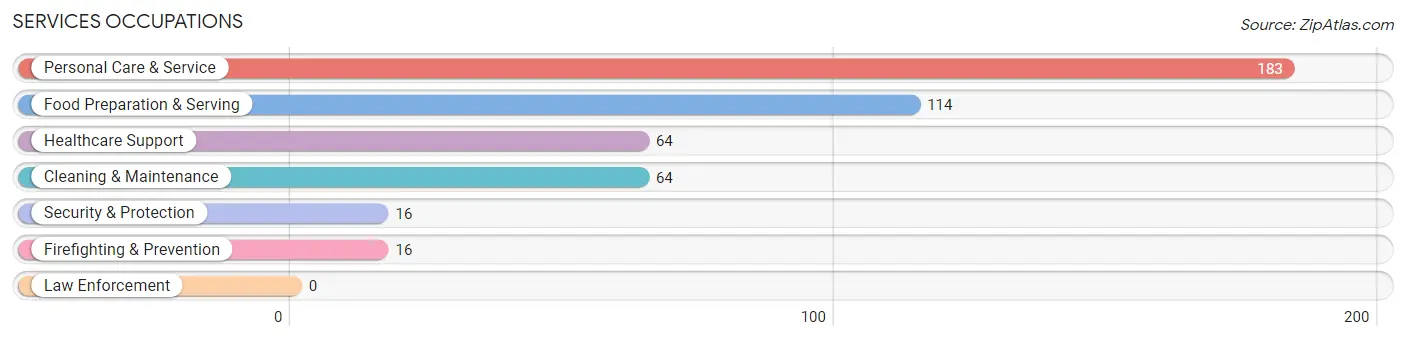
Services Occupations
The most common Services occupations in Riverside are Personal Care & Service (183 | 4.7%), Food Preparation & Serving (114 | 2.9%), Healthcare Support (64 | 1.7%), Cleaning & Maintenance (64 | 1.7%), and Security & Protection (16 | 0.4%).
Services Occupations by Sex
Within the Services occupations in Riverside, the most male-oriented occupations are Security & Protection (100.0%), Firefighting & Prevention (100.0%), and Food Preparation & Serving (58.8%), while the most female-oriented occupations are Cleaning & Maintenance (100.0%), Personal Care & Service (94.0%), and Healthcare Support (71.9%).
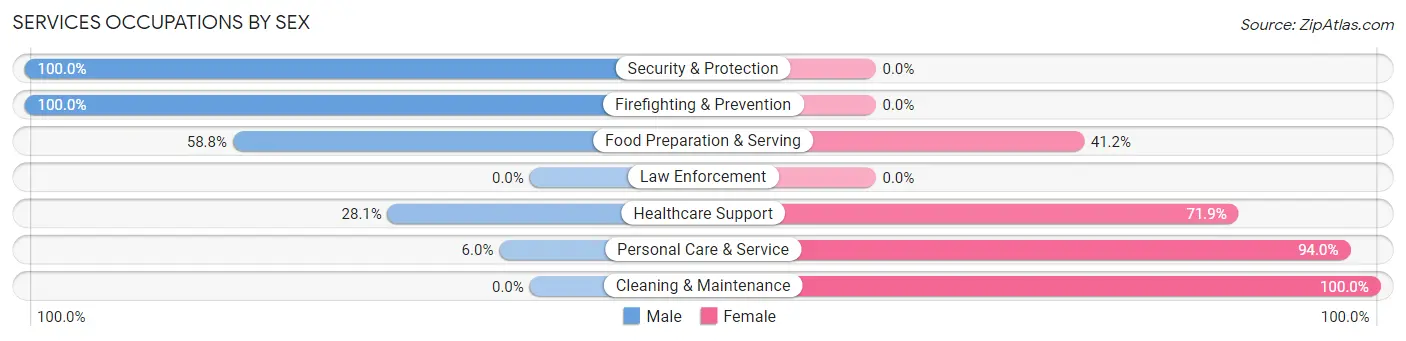
| Occupation | Male | Female |
| Healthcare Support | 18 (28.1%) | 46 (71.9%) |
| Security & Protection | 16 (100.0%) | 0 (0.0%) |
| Firefighting & Prevention | 16 (100.0%) | 0 (0.0%) |
| Law Enforcement | 0 (0.0%) | 0 (0.0%) |
| Food Preparation & Serving | 67 (58.8%) | 47 (41.2%) |
| Cleaning & Maintenance | 0 (0.0%) | 64 (100.0%) |
| Personal Care & Service | 11 (6.0%) | 172 (94.0%) |
| Total (Category) | 112 (25.4%) | 329 (74.6%) |
| Total (Overall) | 2,414 (62.2%) | 1,466 (37.8%) |
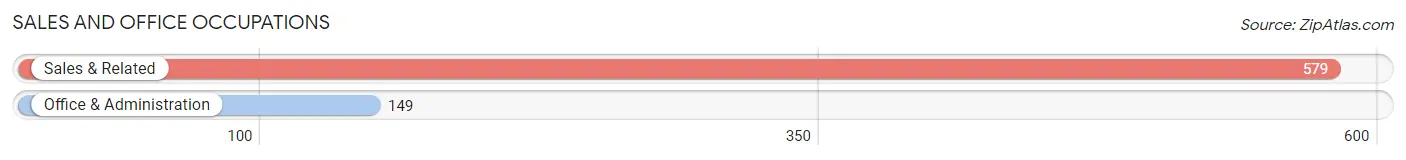
Sales and Office Occupations
The most common Sales and Office occupations in Riverside are Sales & Related (579 | 14.9%), and Office & Administration (149 | 3.8%).
Sales and Office Occupations by Sex
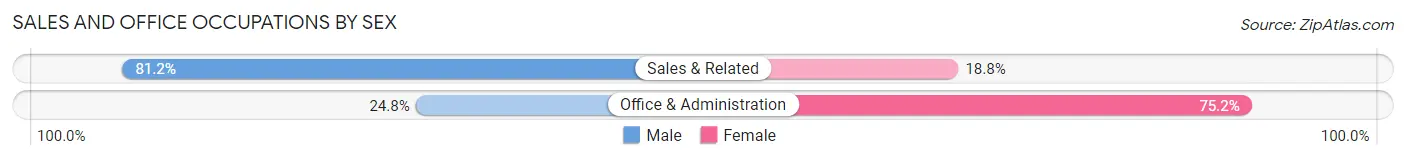
| Occupation | Male | Female |
| Sales & Related | 470 (81.2%) | 109 (18.8%) |
| Office & Administration | 37 (24.8%) | 112 (75.2%) |
| Total (Category) | 507 (69.6%) | 221 (30.4%) |
| Total (Overall) | 2,414 (62.2%) | 1,466 (37.8%) |
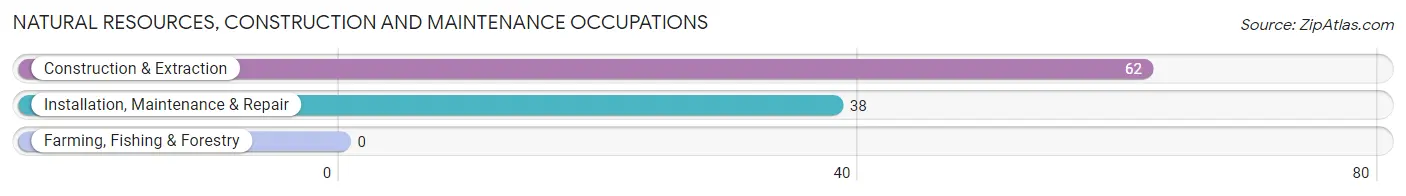
Natural Resources, Construction and Maintenance Occupations
The most common Natural Resources, Construction and Maintenance occupations in Riverside are Construction & Extraction (62 | 1.6%), and Installation, Maintenance & Repair (38 | 1.0%).
Natural Resources, Construction and Maintenance Occupations by Sex
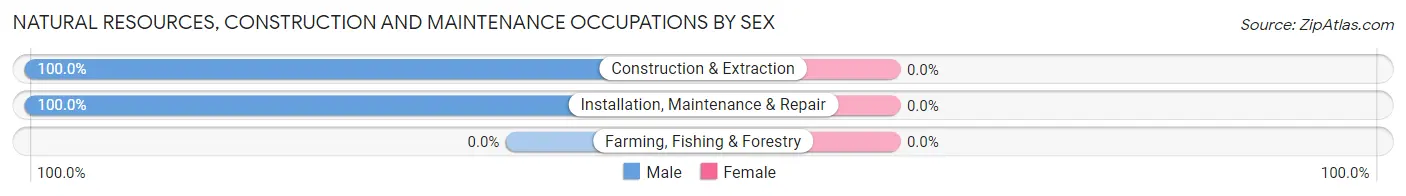
| Occupation | Male | Female |
| Farming, Fishing & Forestry | 0 (0.0%) | 0 (0.0%) |
| Construction & Extraction | 62 (100.0%) | 0 (0.0%) |
| Installation, Maintenance & Repair | 38 (100.0%) | 0 (0.0%) |
| Total (Category) | 100 (100.0%) | 0 (0.0%) |
| Total (Overall) | 2,414 (62.2%) | 1,466 (37.8%) |
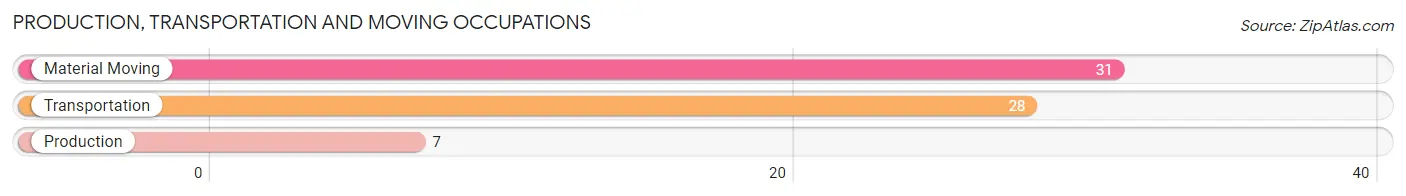
Production, Transportation and Moving Occupations
The most common Production, Transportation and Moving occupations in Riverside are Material Moving (31 | 0.8%), Transportation (28 | 0.7%), and Production (7 | 0.2%).
Production, Transportation and Moving Occupations by Sex
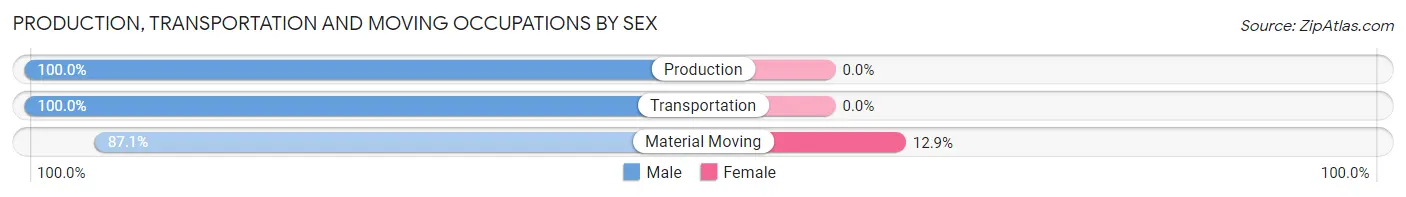
| Occupation | Male | Female |
| Production | 7 (100.0%) | 0 (0.0%) |
| Transportation | 28 (100.0%) | 0 (0.0%) |
| Material Moving | 27 (87.1%) | 4 (12.9%) |
| Total (Category) | 62 (93.9%) | 4 (6.1%) |
| Total (Overall) | 2,414 (62.2%) | 1,466 (37.8%) |
Employment Industries by Sex in Riverside
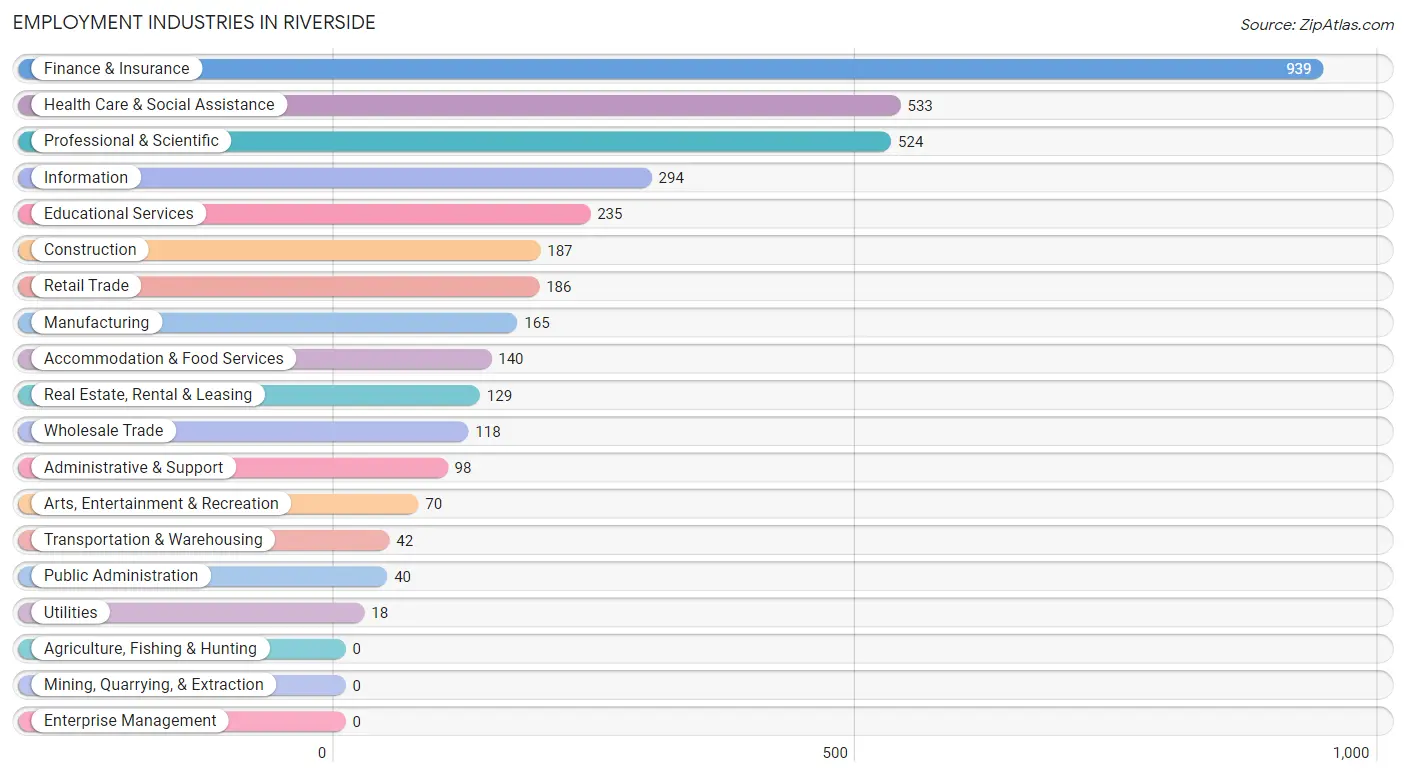
Employment Industries in Riverside
The major employment industries in Riverside include Finance & Insurance (939 | 24.2%), Health Care & Social Assistance (533 | 13.7%), Professional & Scientific (524 | 13.5%), Information (294 | 7.6%), and Educational Services (235 | 6.1%).
Employment Industries by Sex in Riverside
The Riverside industries that see more men than women are Transportation & Warehousing (100.0%), Arts, Entertainment & Recreation (87.1%), and Finance & Insurance (86.5%), whereas the industries that tend to have a higher number of women are Educational Services (62.1%), Public Administration (60.0%), and Retail Trade (55.9%).
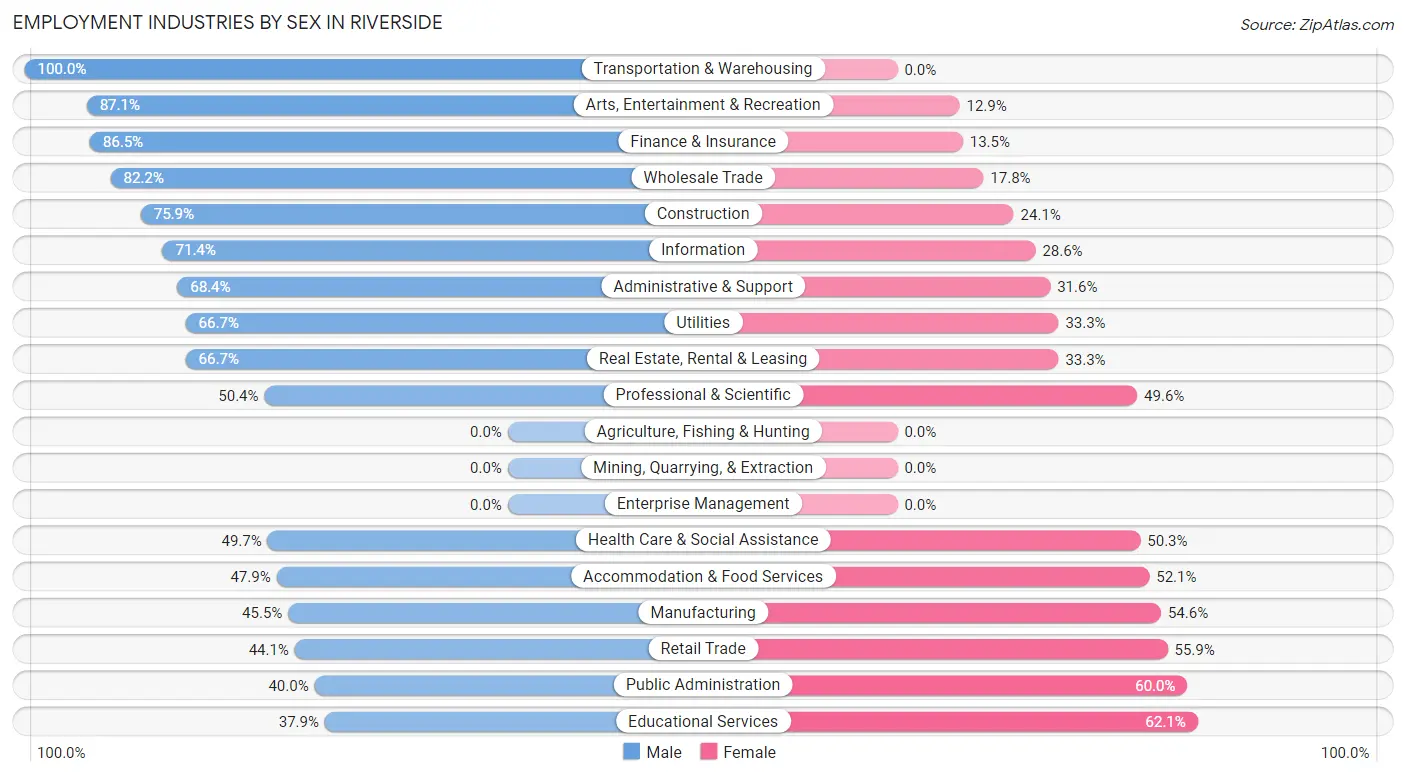
| Industry | Male | Female |
| Agriculture, Fishing & Hunting | 0 (0.0%) | 0 (0.0%) |
| Mining, Quarrying, & Extraction | 0 (0.0%) | 0 (0.0%) |
| Construction | 142 (75.9%) | 45 (24.1%) |
| Manufacturing | 75 (45.5%) | 90 (54.5%) |
| Wholesale Trade | 97 (82.2%) | 21 (17.8%) |
| Retail Trade | 82 (44.1%) | 104 (55.9%) |
| Transportation & Warehousing | 42 (100.0%) | 0 (0.0%) |
| Utilities | 12 (66.7%) | 6 (33.3%) |
| Information | 210 (71.4%) | 84 (28.6%) |
| Finance & Insurance | 812 (86.5%) | 127 (13.5%) |
| Real Estate, Rental & Leasing | 86 (66.7%) | 43 (33.3%) |
| Professional & Scientific | 264 (50.4%) | 260 (49.6%) |
| Enterprise Management | 0 (0.0%) | 0 (0.0%) |
| Administrative & Support | 67 (68.4%) | 31 (31.6%) |
| Educational Services | 89 (37.9%) | 146 (62.1%) |
| Health Care & Social Assistance | 265 (49.7%) | 268 (50.3%) |
| Arts, Entertainment & Recreation | 61 (87.1%) | 9 (12.9%) |
| Accommodation & Food Services | 67 (47.9%) | 73 (52.1%) |
| Public Administration | 16 (40.0%) | 24 (60.0%) |
| Total | 2,414 (62.2%) | 1,466 (37.8%) |
Education in Riverside
School Enrollment in Riverside
The most common levels of schooling among the 3,170 students in Riverside are high school (833 | 26.3%), middle school (717 | 22.6%), and elementary school (618 | 19.5%).
| School Level | # Students | % Students |
| Nursery / Preschool | 260 | 8.2% |
| Kindergarten | 218 | 6.9% |
| Elementary School | 618 | 19.5% |
| Middle School | 717 | 22.6% |
| High School | 833 | 26.3% |
| College / Undergraduate | 374 | 11.8% |
| Graduate / Professional | 150 | 4.7% |
| Total | 3,170 | 100.0% |
School Enrollment by Age by Funding Source in Riverside
Out of a total of 3,170 students who are enrolled in schools in Riverside, 1,141 (36.0%) attend a private institution, while the remaining 2,029 (64.0%) are enrolled in public schools. The age group of 3 to 4 year olds has the highest likelihood of being enrolled in private schools, with 181 (86.2% in the age bracket) enrolled. Conversely, the age group of 18 to 19 year olds has the lowest likelihood of being enrolled in a private school, with 132 (88.0% in the age bracket) attending a public institution.
| Age Bracket | Public School | Private School |
| 3 to 4 Year Olds | 29 (13.8%) | 181 (86.2%) |
| 5 to 9 Year Old | 611 (76.9%) | 183 (23.1%) |
| 10 to 14 Year Olds | 547 (64.0%) | 307 (35.9%) |
| 15 to 17 Year Olds | 515 (71.9%) | 201 (28.1%) |
| 18 to 19 Year Olds | 132 (88.0%) | 18 (12.0%) |
| 20 to 24 Year Olds | 102 (39.8%) | 154 (60.2%) |
| 25 to 34 Year Olds | 31 (49.2%) | 32 (50.8%) |
| 35 Years and over | 61 (48.0%) | 66 (52.0%) |
| Total | 2,029 (64.0%) | 1,141 (36.0%) |
Educational Attainment by Field of Study in Riverside
Business (1,069 | 21.8%), social sciences (981 | 20.0%), engineering (445 | 9.1%), liberal arts & history (401 | 8.2%), and literature & languages (364 | 7.4%) are the most common fields of study among 4,911 individuals in Riverside who have obtained a bachelor's degree or higher.
| Field of Study | # Graduates | % Graduates |
| Computers & Mathematics | 314 | 6.4% |
| Bio, Nature & Agricultural | 237 | 4.8% |
| Physical & Health Sciences | 153 | 3.1% |
| Psychology | 128 | 2.6% |
| Social Sciences | 981 | 20.0% |
| Engineering | 445 | 9.1% |
| Multidisciplinary Studies | 8 | 0.2% |
| Science & Technology | 152 | 3.1% |
| Business | 1,069 | 21.8% |
| Education | 97 | 2.0% |
| Literature & Languages | 364 | 7.4% |
| Liberal Arts & History | 401 | 8.2% |
| Visual & Performing Arts | 335 | 6.8% |
| Communications | 159 | 3.2% |
| Arts & Humanities | 68 | 1.4% |
| Total | 4,911 | 100.0% |
Transportation & Commute in Riverside
Vehicle Availability by Sex in Riverside
The most prevalent vehicle ownership categories in Riverside are males with 2 vehicles (1,426, accounting for 58.5%) and females with 2 vehicles (700, making up 102.9%).
| Vehicles Available | Male | Female |
| No Vehicle | 0 (0.0%) | 20 (1.4%) |
| 1 Vehicle | 271 (11.1%) | 277 (20.0%) |
| 2 Vehicles | 1,426 (58.5%) | 700 (50.5%) |
| 3 Vehicles | 606 (24.8%) | 327 (23.6%) |
| 4 Vehicles | 115 (4.7%) | 33 (2.4%) |
| 5 or more Vehicles | 21 (0.9%) | 29 (2.1%) |
| Total | 2,439 (100.0%) | 1,386 (100.0%) |
Commute Time in Riverside
The most frequently occuring commute durations in Riverside are 15 to 19 minutes (671 commuters, 24.5%), 60 to 89 minutes (431 commuters, 15.8%), and 90 or more minutes (343 commuters, 12.5%).
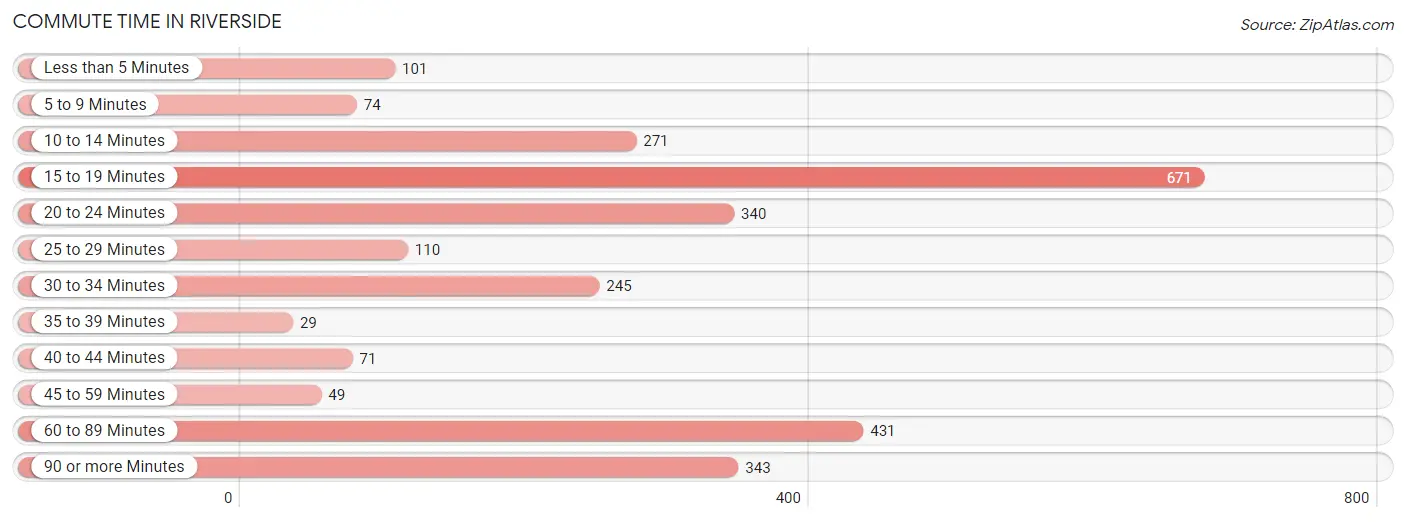
| Commute Time | # Commuters | % Commuters |
| Less than 5 Minutes | 101 | 3.7% |
| 5 to 9 Minutes | 74 | 2.7% |
| 10 to 14 Minutes | 271 | 9.9% |
| 15 to 19 Minutes | 671 | 24.5% |
| 20 to 24 Minutes | 340 | 12.4% |
| 25 to 29 Minutes | 110 | 4.0% |
| 30 to 34 Minutes | 245 | 9.0% |
| 35 to 39 Minutes | 29 | 1.1% |
| 40 to 44 Minutes | 71 | 2.6% |
| 45 to 59 Minutes | 49 | 1.8% |
| 60 to 89 Minutes | 431 | 15.8% |
| 90 or more Minutes | 343 | 12.5% |
Commute Time by Sex in Riverside
The most common commute times in Riverside are 15 to 19 minutes (473 commuters, 26.2%) for males and 15 to 19 minutes (198 commuters, 21.3%) for females.
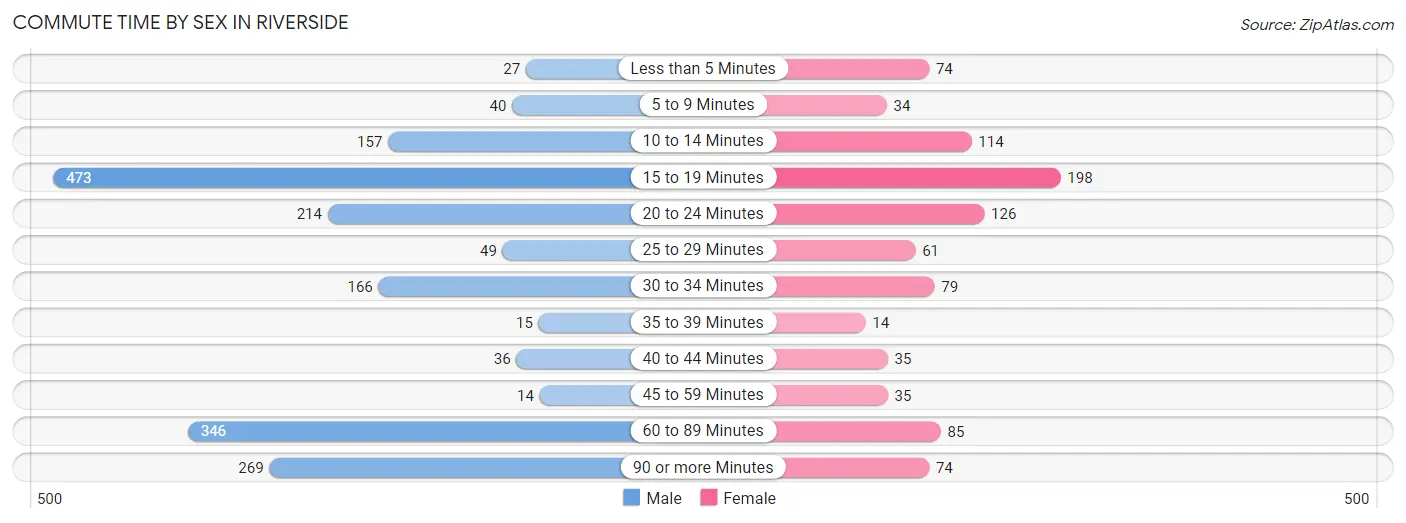
| Commute Time | Male | Female |
| Less than 5 Minutes | 27 (1.5%) | 74 (8.0%) |
| 5 to 9 Minutes | 40 (2.2%) | 34 (3.7%) |
| 10 to 14 Minutes | 157 (8.7%) | 114 (12.3%) |
| 15 to 19 Minutes | 473 (26.2%) | 198 (21.3%) |
| 20 to 24 Minutes | 214 (11.8%) | 126 (13.6%) |
| 25 to 29 Minutes | 49 (2.7%) | 61 (6.6%) |
| 30 to 34 Minutes | 166 (9.2%) | 79 (8.5%) |
| 35 to 39 Minutes | 15 (0.8%) | 14 (1.5%) |
| 40 to 44 Minutes | 36 (2.0%) | 35 (3.8%) |
| 45 to 59 Minutes | 14 (0.8%) | 35 (3.8%) |
| 60 to 89 Minutes | 346 (19.2%) | 85 (9.1%) |
| 90 or more Minutes | 269 (14.9%) | 74 (8.0%) |
Time of Departure to Work by Sex in Riverside
The most frequent times of departure to work in Riverside are 7:30 AM to 7:59 AM (375, 20.8%) for males and 9:00 AM to 9:59 AM (204, 22.0%) for females.
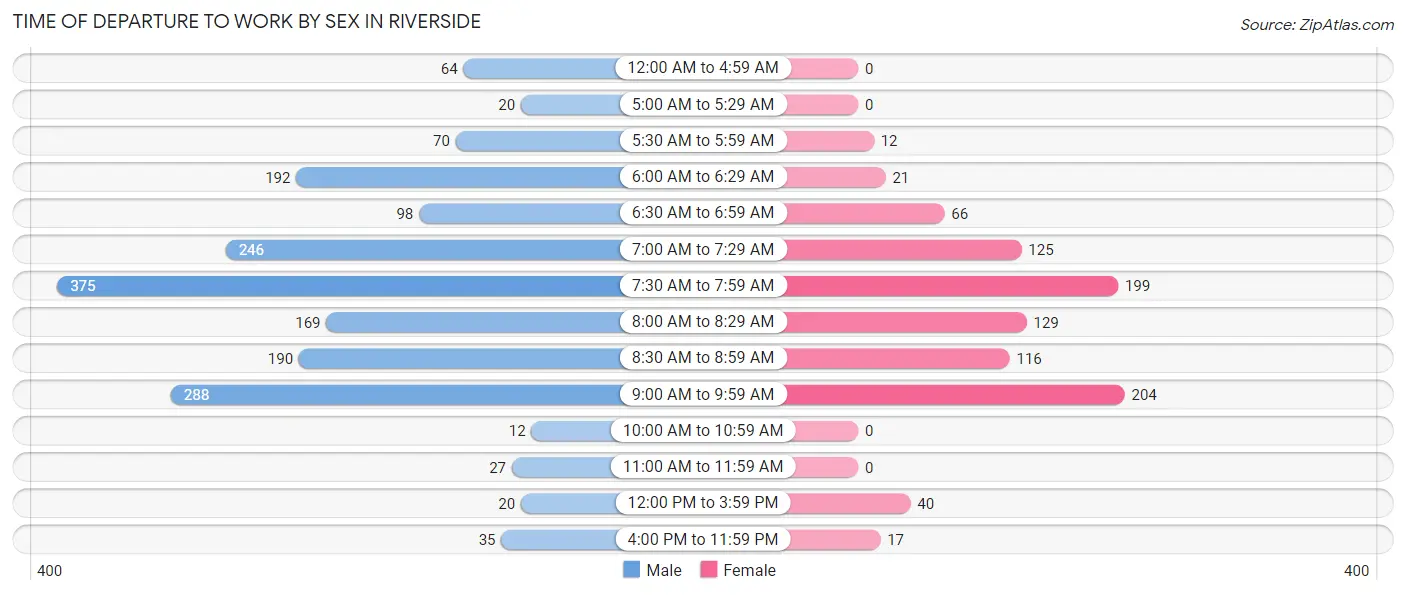
| Time of Departure | Male | Female |
| 12:00 AM to 4:59 AM | 64 (3.5%) | 0 (0.0%) |
| 5:00 AM to 5:29 AM | 20 (1.1%) | 0 (0.0%) |
| 5:30 AM to 5:59 AM | 70 (3.9%) | 12 (1.3%) |
| 6:00 AM to 6:29 AM | 192 (10.6%) | 21 (2.3%) |
| 6:30 AM to 6:59 AM | 98 (5.4%) | 66 (7.1%) |
| 7:00 AM to 7:29 AM | 246 (13.6%) | 125 (13.5%) |
| 7:30 AM to 7:59 AM | 375 (20.8%) | 199 (21.4%) |
| 8:00 AM to 8:29 AM | 169 (9.4%) | 129 (13.9%) |
| 8:30 AM to 8:59 AM | 190 (10.5%) | 116 (12.5%) |
| 9:00 AM to 9:59 AM | 288 (16.0%) | 204 (22.0%) |
| 10:00 AM to 10:59 AM | 12 (0.7%) | 0 (0.0%) |
| 11:00 AM to 11:59 AM | 27 (1.5%) | 0 (0.0%) |
| 12:00 PM to 3:59 PM | 20 (1.1%) | 40 (4.3%) |
| 4:00 PM to 11:59 PM | 35 (1.9%) | 17 (1.8%) |
| Total | 1,806 (100.0%) | 929 (100.0%) |
Housing Occupancy in Riverside
Occupancy by Ownership in Riverside
Of the total 2,938 dwellings in Riverside, owner-occupied units account for 2,397 (81.6%), while renter-occupied units make up 541 (18.4%).
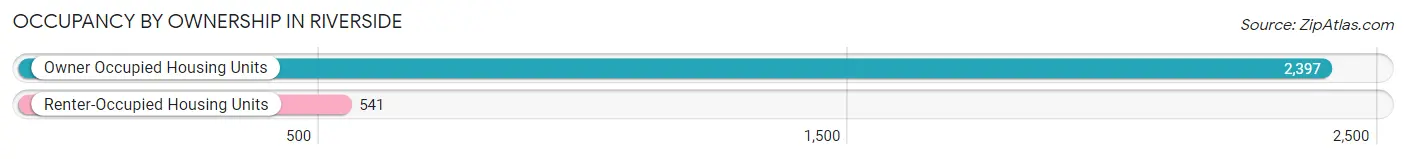
| Occupancy | # Housing Units | % Housing Units |
| Owner Occupied Housing Units | 2,397 | 81.6% |
| Renter-Occupied Housing Units | 541 | 18.4% |
| Total Occupied Housing Units | 2,938 | 100.0% |
Occupancy by Household Size in Riverside
| Household Size | # Housing Units | % Housing Units |
| 1-Person Household | 530 | 18.0% |
| 2-Person Household | 659 | 22.4% |
| 3-Person Household | 705 | 24.0% |
| 4+ Person Household | 1,044 | 35.5% |
| Total Housing Units | 2,938 | 100.0% |
Occupancy by Ownership by Household Size in Riverside
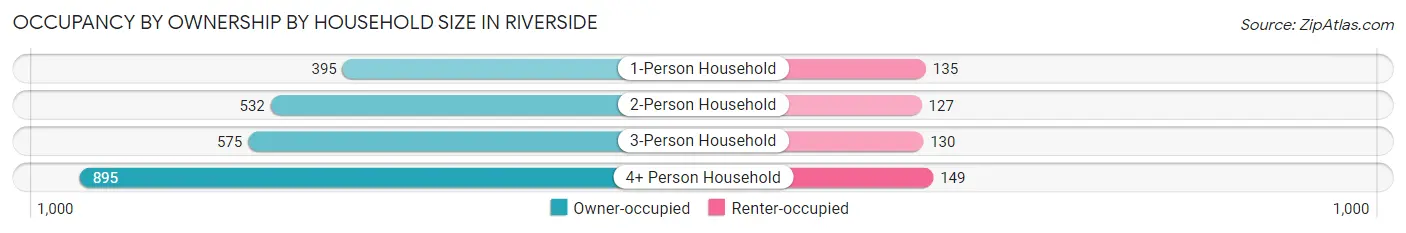
| Household Size | Owner-occupied | Renter-occupied |
| 1-Person Household | 395 (74.5%) | 135 (25.5%) |
| 2-Person Household | 532 (80.7%) | 127 (19.3%) |
| 3-Person Household | 575 (81.6%) | 130 (18.4%) |
| 4+ Person Household | 895 (85.7%) | 149 (14.3%) |
| Total Housing Units | 2,397 (81.6%) | 541 (18.4%) |
Occupancy by Educational Attainment in Riverside
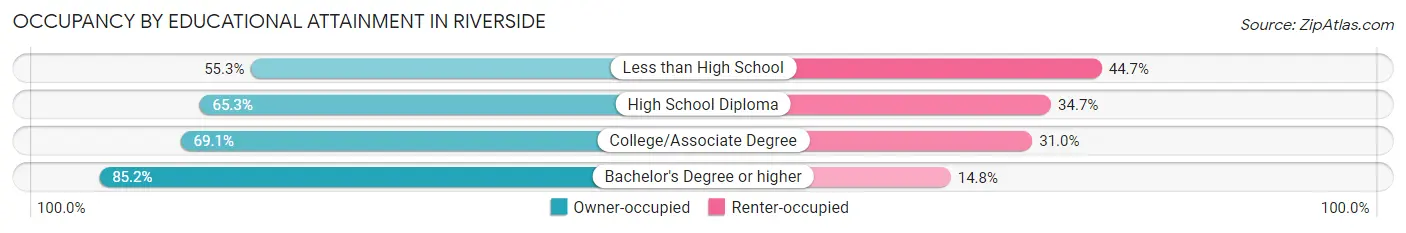
| Household Size | Owner-occupied | Renter-occupied |
| Less than High School | 42 (55.3%) | 34 (44.7%) |
| High School Diploma | 96 (65.3%) | 51 (34.7%) |
| College/Associate Degree | 232 (69.1%) | 104 (30.9%) |
| Bachelor's Degree or higher | 2,027 (85.2%) | 352 (14.8%) |
Occupancy by Age of Householder in Riverside
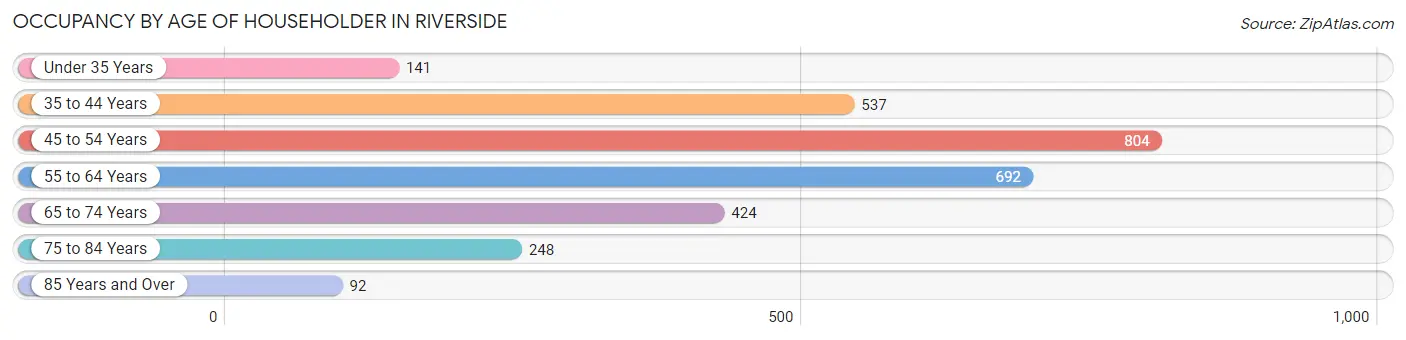
| Age Bracket | # Households | % Households |
| Under 35 Years | 141 | 4.8% |
| 35 to 44 Years | 537 | 18.3% |
| 45 to 54 Years | 804 | 27.4% |
| 55 to 64 Years | 692 | 23.5% |
| 65 to 74 Years | 424 | 14.4% |
| 75 to 84 Years | 248 | 8.4% |
| 85 Years and Over | 92 | 3.1% |
| Total | 2,938 | 100.0% |
Housing Finances in Riverside
Median Income by Occupancy in Riverside
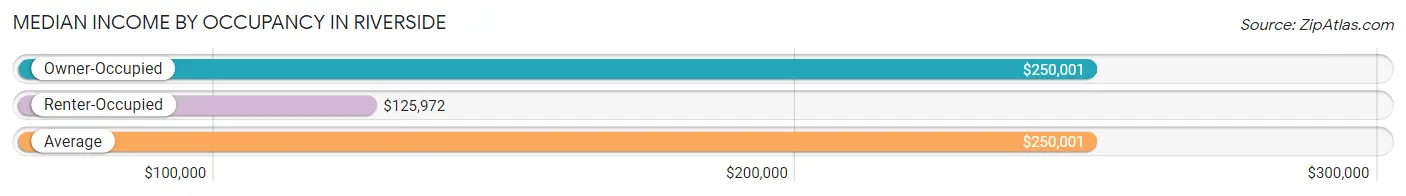
| Occupancy Type | # Households | Median Income |
| Owner-Occupied | 2,397 (81.6%) | $250,001 |
| Renter-Occupied | 541 (18.4%) | $125,972 |
| Average | 2,938 (100.0%) | $250,001 |
Occupancy by Householder Income Bracket in Riverside
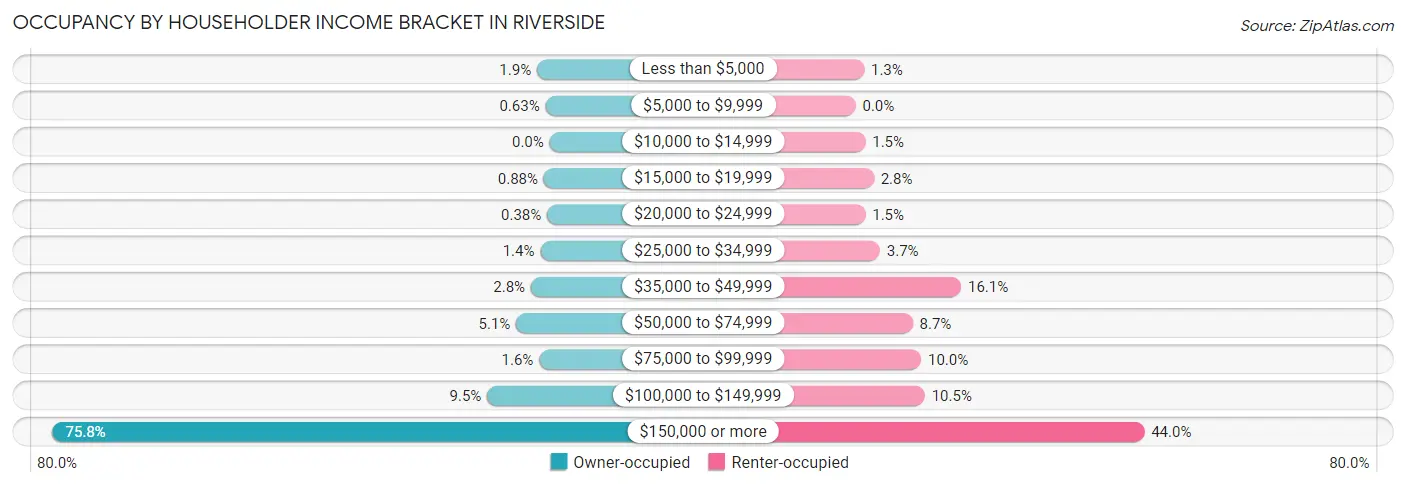
| Income Bracket | Owner-occupied | Renter-occupied |
| Less than $5,000 | 46 (1.9%) | 7 (1.3%) |
| $5,000 to $9,999 | 15 (0.6%) | 0 (0.0%) |
| $10,000 to $14,999 | 0 (0.0%) | 8 (1.5%) |
| $15,000 to $19,999 | 21 (0.9%) | 15 (2.8%) |
| $20,000 to $24,999 | 9 (0.4%) | 8 (1.5%) |
| $25,000 to $34,999 | 34 (1.4%) | 20 (3.7%) |
| $35,000 to $49,999 | 68 (2.8%) | 87 (16.1%) |
| $50,000 to $74,999 | 122 (5.1%) | 47 (8.7%) |
| $75,000 to $99,999 | 38 (1.6%) | 54 (10.0%) |
| $100,000 to $149,999 | 228 (9.5%) | 57 (10.5%) |
| $150,000 or more | 1,816 (75.8%) | 238 (44.0%) |
| Total | 2,397 (100.0%) | 541 (100.0%) |
Monthly Housing Cost Tiers in Riverside
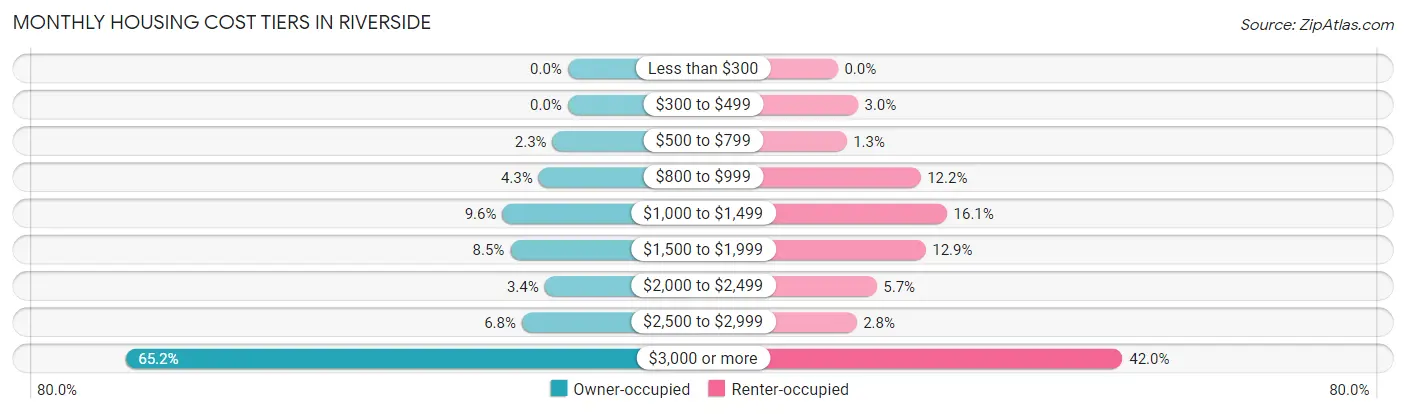
| Monthly Cost | Owner-occupied | Renter-occupied |
| Less than $300 | 0 (0.0%) | 0 (0.0%) |
| $300 to $499 | 0 (0.0%) | 16 (3.0%) |
| $500 to $799 | 54 (2.2%) | 7 (1.3%) |
| $800 to $999 | 103 (4.3%) | 66 (12.2%) |
| $1,000 to $1,499 | 231 (9.6%) | 87 (16.1%) |
| $1,500 to $1,999 | 203 (8.5%) | 70 (12.9%) |
| $2,000 to $2,499 | 82 (3.4%) | 31 (5.7%) |
| $2,500 to $2,999 | 162 (6.8%) | 15 (2.8%) |
| $3,000 or more | 1,562 (65.2%) | 227 (42.0%) |
| Total | 2,397 (100.0%) | 541 (100.0%) |
Physical Housing Characteristics in Riverside
Housing Structures in Riverside
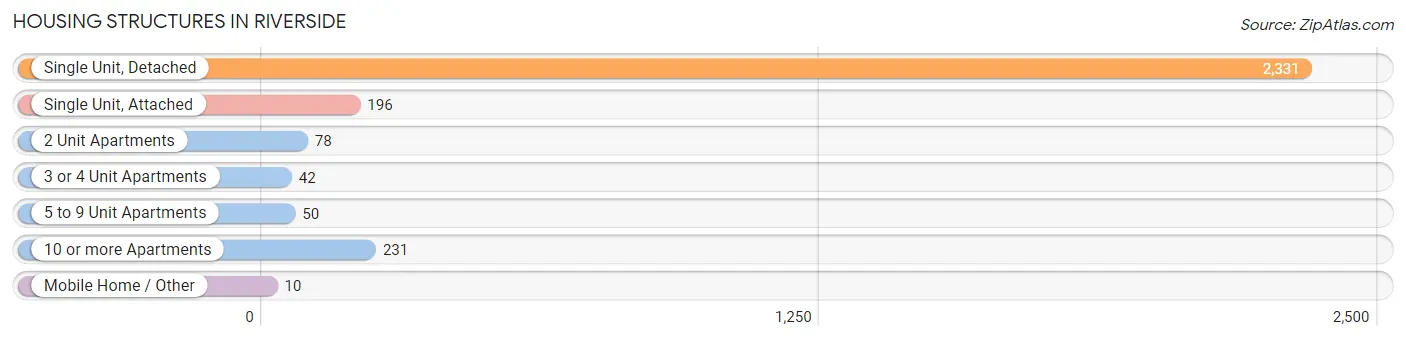
| Structure Type | # Housing Units | % Housing Units |
| Single Unit, Detached | 2,331 | 79.3% |
| Single Unit, Attached | 196 | 6.7% |
| 2 Unit Apartments | 78 | 2.6% |
| 3 or 4 Unit Apartments | 42 | 1.4% |
| 5 to 9 Unit Apartments | 50 | 1.7% |
| 10 or more Apartments | 231 | 7.9% |
| Mobile Home / Other | 10 | 0.3% |
| Total | 2,938 | 100.0% |
Housing Structures by Occupancy in Riverside
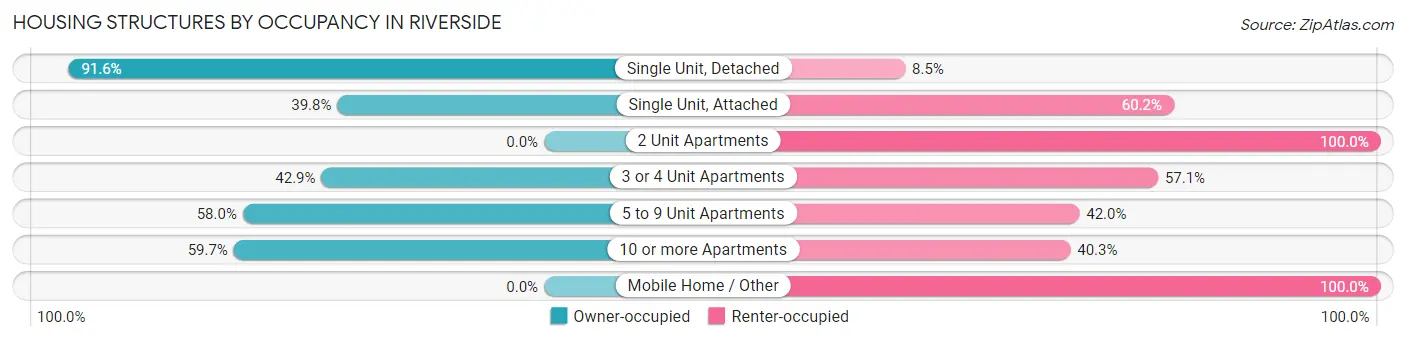
| Structure Type | Owner-occupied | Renter-occupied |
| Single Unit, Detached | 2,134 (91.5%) | 197 (8.5%) |
| Single Unit, Attached | 78 (39.8%) | 118 (60.2%) |
| 2 Unit Apartments | 0 (0.0%) | 78 (100.0%) |
| 3 or 4 Unit Apartments | 18 (42.9%) | 24 (57.1%) |
| 5 to 9 Unit Apartments | 29 (58.0%) | 21 (42.0%) |
| 10 or more Apartments | 138 (59.7%) | 93 (40.3%) |
| Mobile Home / Other | 0 (0.0%) | 10 (100.0%) |
| Total | 2,397 (81.6%) | 541 (18.4%) |
Housing Structures by Number of Rooms in Riverside
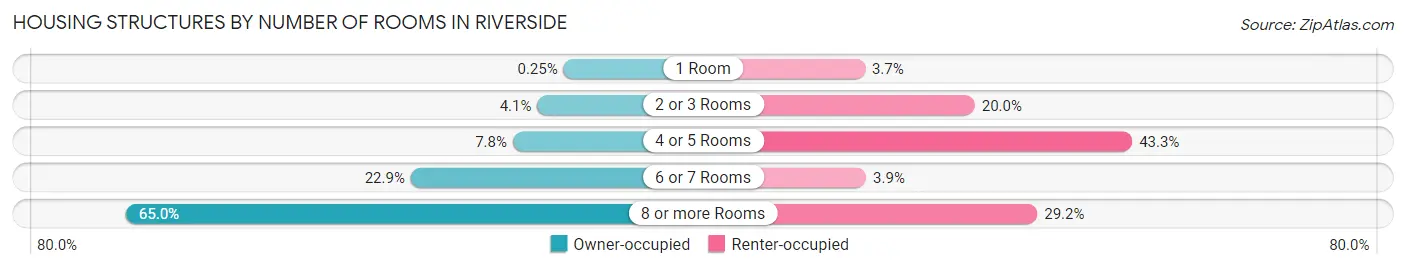
| Number of Rooms | Owner-occupied | Renter-occupied |
| 1 Room | 6 (0.3%) | 20 (3.7%) |
| 2 or 3 Rooms | 99 (4.1%) | 108 (20.0%) |
| 4 or 5 Rooms | 186 (7.8%) | 234 (43.2%) |
| 6 or 7 Rooms | 548 (22.9%) | 21 (3.9%) |
| 8 or more Rooms | 1,558 (65.0%) | 158 (29.2%) |
| Total | 2,397 (100.0%) | 541 (100.0%) |
Housing Structure by Heating Type in Riverside
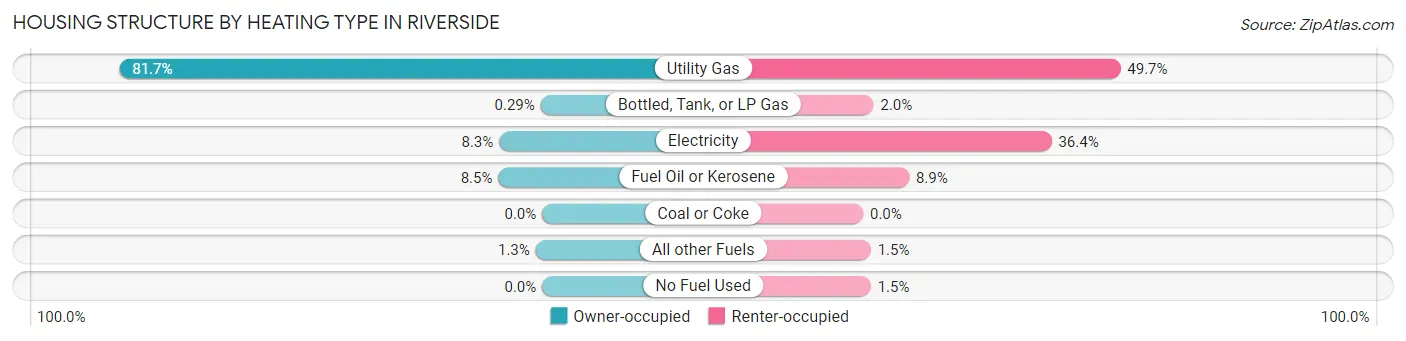
| Heating Type | Owner-occupied | Renter-occupied |
| Utility Gas | 1,958 (81.7%) | 269 (49.7%) |
| Bottled, Tank, or LP Gas | 7 (0.3%) | 11 (2.0%) |
| Electricity | 199 (8.3%) | 197 (36.4%) |
| Fuel Oil or Kerosene | 203 (8.5%) | 48 (8.9%) |
| Coal or Coke | 0 (0.0%) | 0 (0.0%) |
| All other Fuels | 30 (1.3%) | 8 (1.5%) |
| No Fuel Used | 0 (0.0%) | 8 (1.5%) |
| Total | 2,397 (100.0%) | 541 (100.0%) |
Household Vehicle Usage in Riverside
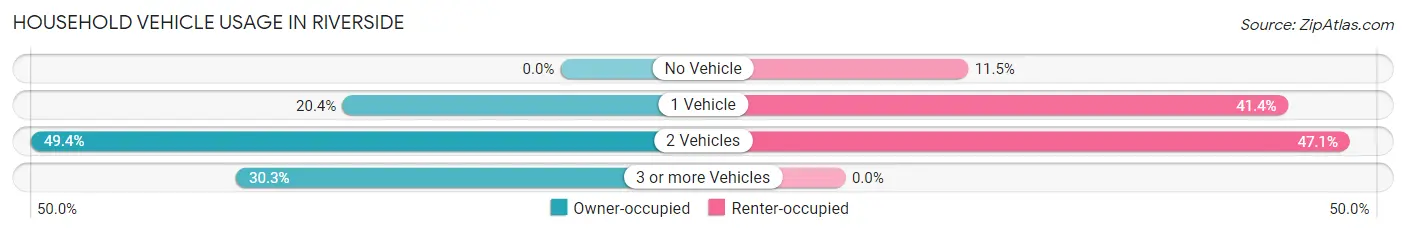
| Vehicles per Household | Owner-occupied | Renter-occupied |
| No Vehicle | 0 (0.0%) | 62 (11.5%) |
| 1 Vehicle | 488 (20.4%) | 224 (41.4%) |
| 2 Vehicles | 1,184 (49.4%) | 255 (47.1%) |
| 3 or more Vehicles | 725 (30.2%) | 0 (0.0%) |
| Total | 2,397 (100.0%) | 541 (100.0%) |
Real Estate & Mortgages in Riverside
Real Estate and Mortgage Overview in Riverside
| Characteristic | Without Mortgage | With Mortgage |
| Housing Units | 699 | 1,698 |
| Median Property Value | $1,485,500 | $1,689,600 |
| Median Household Income | $199,464 | $1,414 |
| Monthly Housing Costs | $1,501 | $1,462 |
| Real Estate Taxes | $10,001 | $19 |
Property Value by Mortgage Status in Riverside
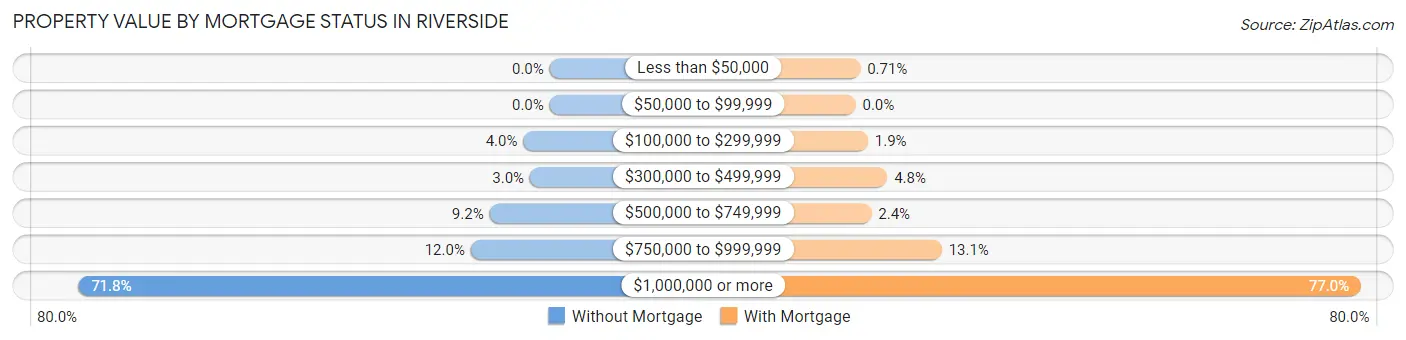
| Property Value | Without Mortgage | With Mortgage |
| Less than $50,000 | 0 (0.0%) | 12 (0.7%) |
| $50,000 to $99,999 | 0 (0.0%) | 0 (0.0%) |
| $100,000 to $299,999 | 28 (4.0%) | 32 (1.9%) |
| $300,000 to $499,999 | 21 (3.0%) | 82 (4.8%) |
| $500,000 to $749,999 | 64 (9.2%) | 41 (2.4%) |
| $750,000 to $999,999 | 84 (12.0%) | 223 (13.1%) |
| $1,000,000 or more | 502 (71.8%) | 1,308 (77.0%) |
| Total | 699 (100.0%) | 1,698 (100.0%) |
Household Income by Mortgage Status in Riverside
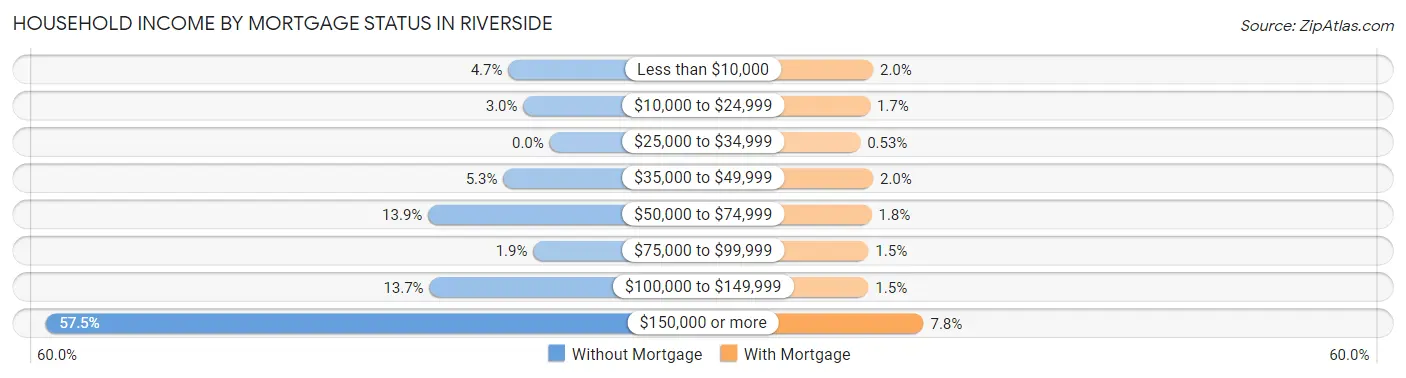
| Household Income | Without Mortgage | With Mortgage |
| Less than $10,000 | 33 (4.7%) | 34 (2.0%) |
| $10,000 to $24,999 | 21 (3.0%) | 28 (1.7%) |
| $25,000 to $34,999 | 0 (0.0%) | 9 (0.5%) |
| $35,000 to $49,999 | 37 (5.3%) | 34 (2.0%) |
| $50,000 to $74,999 | 97 (13.9%) | 31 (1.8%) |
| $75,000 to $99,999 | 13 (1.9%) | 25 (1.5%) |
| $100,000 to $149,999 | 96 (13.7%) | 25 (1.5%) |
| $150,000 or more | 402 (57.5%) | 132 (7.8%) |
| Total | 699 (100.0%) | 1,698 (100.0%) |
Property Value to Household Income Ratio in Riverside
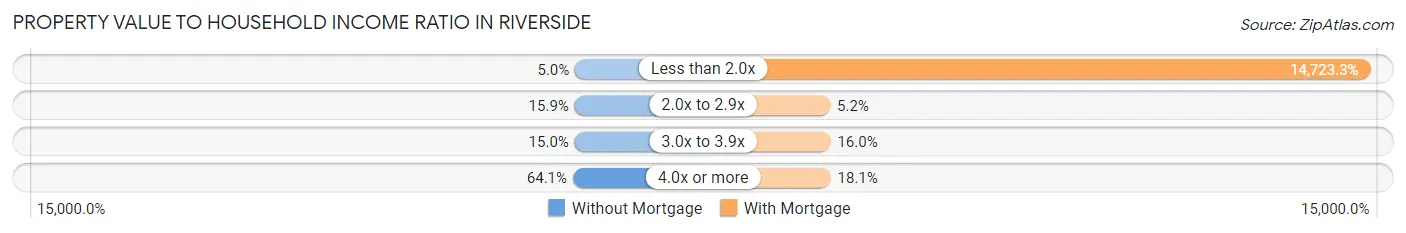
| Value-to-Income Ratio | Without Mortgage | With Mortgage |
| Less than 2.0x | 35 (5.0%) | 250,001 (14,723.3%) |
| 2.0x to 2.9x | 111 (15.9%) | 89 (5.2%) |
| 3.0x to 3.9x | 105 (15.0%) | 271 (16.0%) |
| 4.0x or more | 448 (64.1%) | 307 (18.1%) |
| Total | 699 (100.0%) | 1,698 (100.0%) |
Real Estate Taxes by Mortgage Status in Riverside
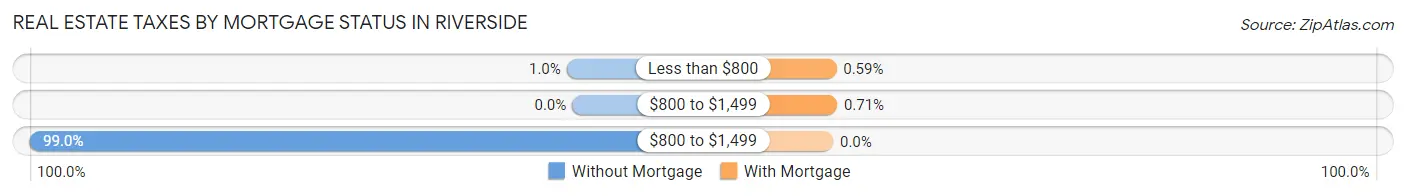
| Property Taxes | Without Mortgage | With Mortgage |
| Less than $800 | 7 (1.0%) | 10 (0.6%) |
| $800 to $1,499 | 0 (0.0%) | 12 (0.7%) |
| $800 to $1,499 | 692 (99.0%) | 0 (0.0%) |
| Total | 699 (100.0%) | 1,698 (100.0%) |
Health & Disability in Riverside
Health Insurance Coverage by Age in Riverside
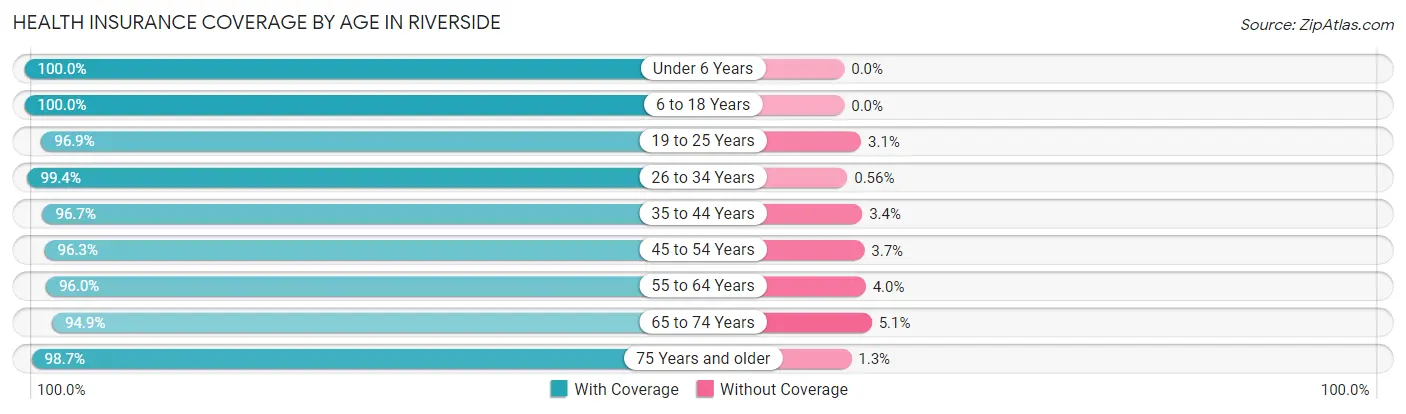
| Age Bracket | With Coverage | Without Coverage |
| Under 6 Years | 749 (100.0%) | 0 (0.0%) |
| 6 to 18 Years | 2,255 (100.0%) | 0 (0.0%) |
| 19 to 25 Years | 681 (96.9%) | 22 (3.1%) |
| 26 to 34 Years | 357 (99.4%) | 2 (0.6%) |
| 35 to 44 Years | 1,038 (96.7%) | 36 (3.4%) |
| 45 to 54 Years | 1,491 (96.3%) | 58 (3.7%) |
| 55 to 64 Years | 1,107 (96.0%) | 46 (4.0%) |
| 65 to 74 Years | 649 (94.9%) | 35 (5.1%) |
| 75 Years and older | 525 (98.7%) | 7 (1.3%) |
| Total | 8,852 (97.7%) | 206 (2.3%) |
Health Insurance Coverage by Citizenship Status in Riverside
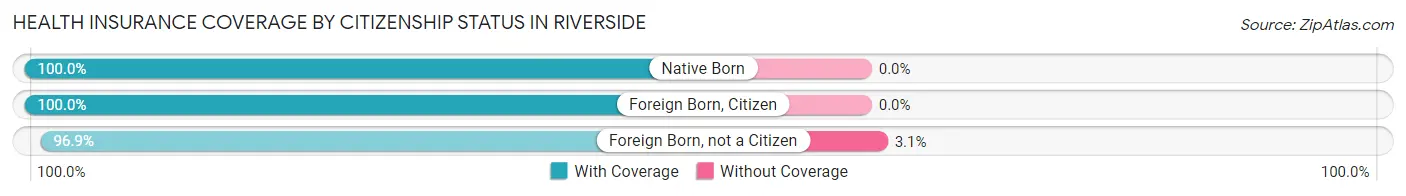
| Citizenship Status | With Coverage | Without Coverage |
| Native Born | 749 (100.0%) | 0 (0.0%) |
| Foreign Born, Citizen | 2,255 (100.0%) | 0 (0.0%) |
| Foreign Born, not a Citizen | 681 (96.9%) | 22 (3.1%) |
Health Insurance Coverage by Household Income in Riverside
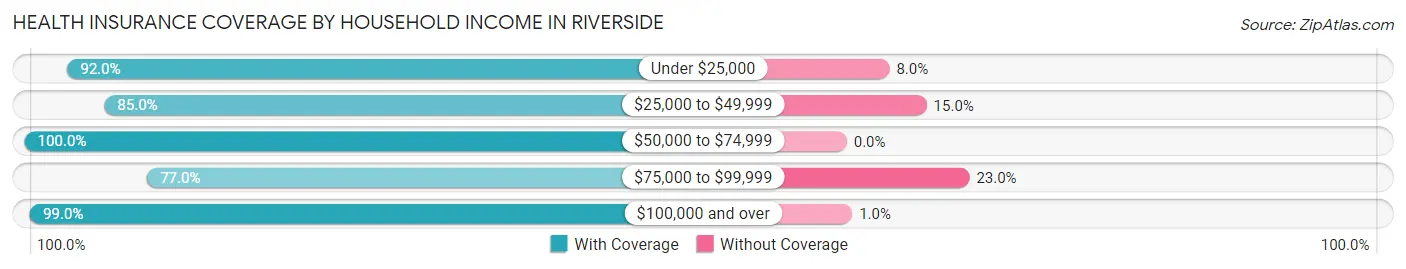
| Household Income | With Coverage | Without Coverage |
| Under $25,000 | 207 (92.0%) | 18 (8.0%) |
| $25,000 to $49,999 | 307 (85.0%) | 54 (15.0%) |
| $50,000 to $74,999 | 386 (100.0%) | 0 (0.0%) |
| $75,000 to $99,999 | 181 (77.0%) | 54 (23.0%) |
| $100,000 and over | 7,766 (99.0%) | 80 (1.0%) |
Public vs Private Health Insurance Coverage by Age in Riverside
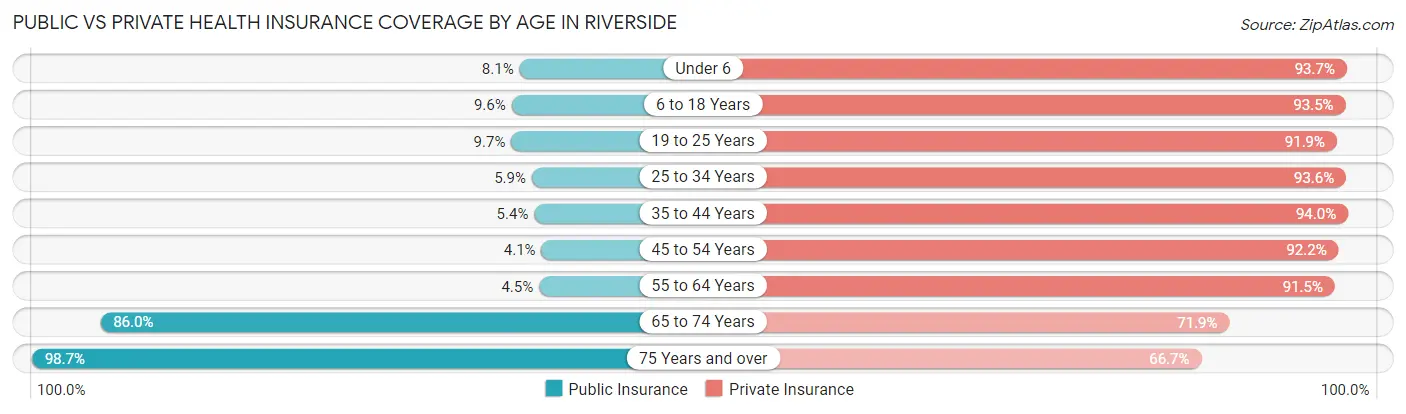
| Age Bracket | Public Insurance | Private Insurance |
| Under 6 | 61 (8.1%) | 702 (93.7%) |
| 6 to 18 Years | 217 (9.6%) | 2,108 (93.5%) |
| 19 to 25 Years | 68 (9.7%) | 646 (91.9%) |
| 25 to 34 Years | 21 (5.9%) | 336 (93.6%) |
| 35 to 44 Years | 58 (5.4%) | 1,009 (94.0%) |
| 45 to 54 Years | 63 (4.1%) | 1,428 (92.2%) |
| 55 to 64 Years | 52 (4.5%) | 1,055 (91.5%) |
| 65 to 74 Years | 588 (86.0%) | 492 (71.9%) |
| 75 Years and over | 525 (98.7%) | 355 (66.7%) |
| Total | 1,653 (18.2%) | 8,131 (89.8%) |
Disability Status by Sex by Age in Riverside
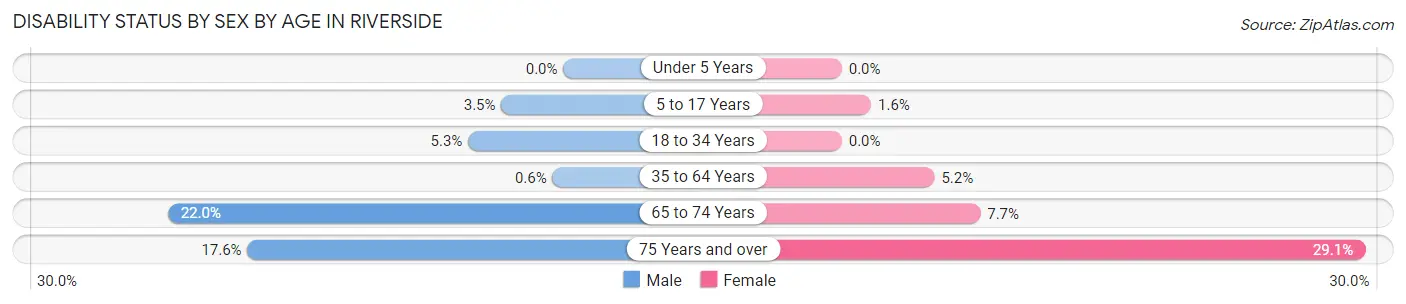
| Age Bracket | Male | Female |
| Under 5 Years | 0 (0.0%) | 0 (0.0%) |
| 5 to 17 Years | 38 (3.5%) | 21 (1.6%) |
| 18 to 34 Years | 35 (5.3%) | 0 (0.0%) |
| 35 to 64 Years | 11 (0.6%) | 100 (5.2%) |
| 65 to 74 Years | 65 (22.0%) | 30 (7.7%) |
| 75 Years and over | 35 (17.6%) | 97 (29.1%) |
Disability Class by Sex by Age in Riverside
Disability Class: Hearing Difficulty
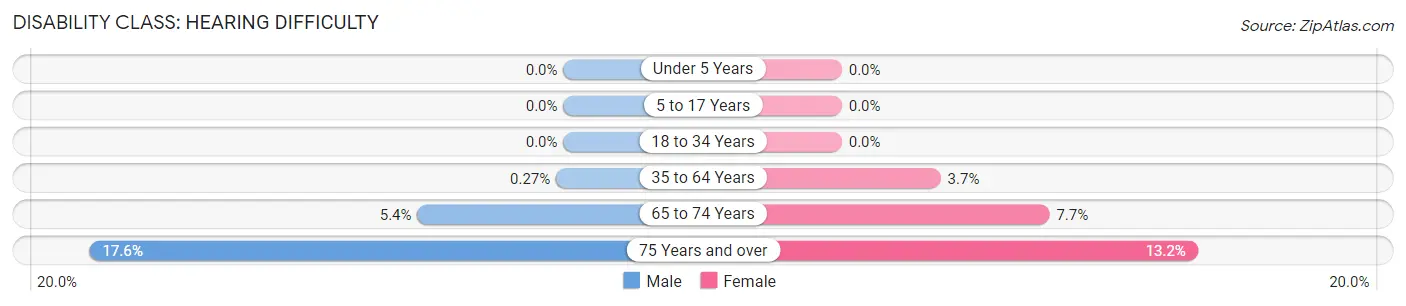
| Age Bracket | Male | Female |
| Under 5 Years | 0 (0.0%) | 0 (0.0%) |
| 5 to 17 Years | 0 (0.0%) | 0 (0.0%) |
| 18 to 34 Years | 0 (0.0%) | 0 (0.0%) |
| 35 to 64 Years | 5 (0.3%) | 71 (3.7%) |
| 65 to 74 Years | 16 (5.4%) | 30 (7.7%) |
| 75 Years and over | 35 (17.6%) | 44 (13.2%) |
Disability Class: Vision Difficulty
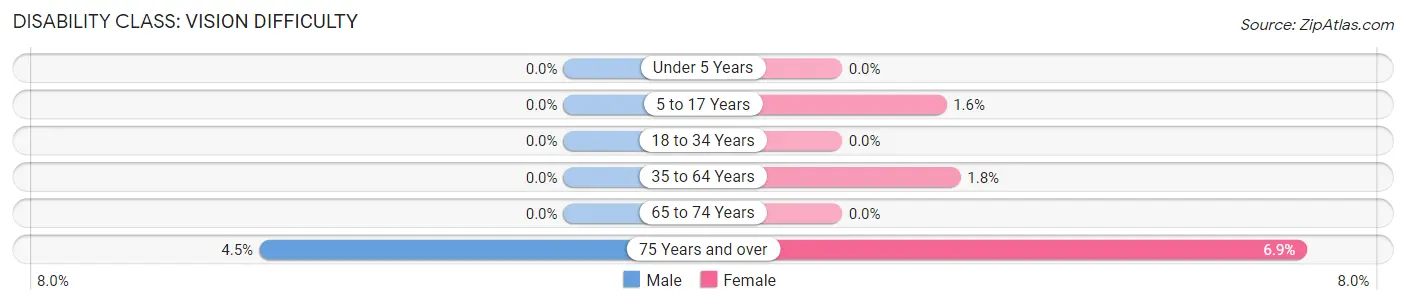
| Age Bracket | Male | Female |
| Under 5 Years | 0 (0.0%) | 0 (0.0%) |
| 5 to 17 Years | 0 (0.0%) | 20 (1.5%) |
| 18 to 34 Years | 0 (0.0%) | 0 (0.0%) |
| 35 to 64 Years | 0 (0.0%) | 34 (1.8%) |
| 65 to 74 Years | 0 (0.0%) | 0 (0.0%) |
| 75 Years and over | 9 (4.5%) | 23 (6.9%) |
Disability Class: Cognitive Difficulty
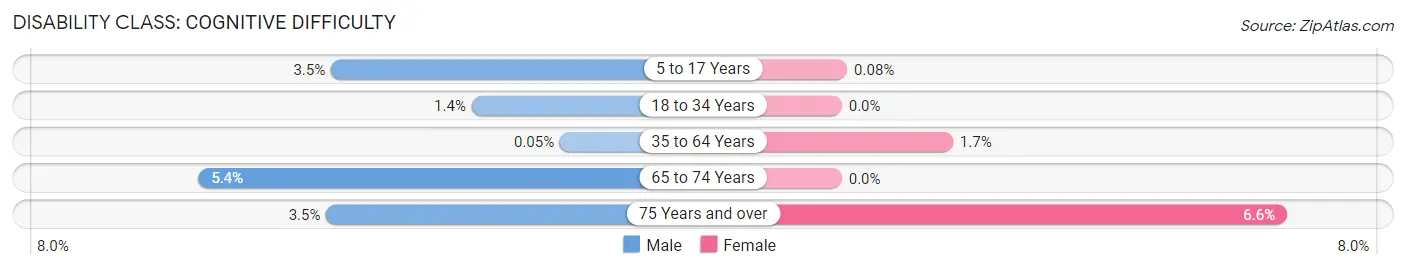
| Age Bracket | Male | Female |
| 5 to 17 Years | 38 (3.5%) | 1 (0.1%) |
| 18 to 34 Years | 9 (1.4%) | 0 (0.0%) |
| 35 to 64 Years | 1 (0.1%) | 32 (1.7%) |
| 65 to 74 Years | 16 (5.4%) | 0 (0.0%) |
| 75 Years and over | 7 (3.5%) | 22 (6.6%) |
Disability Class: Ambulatory Difficulty
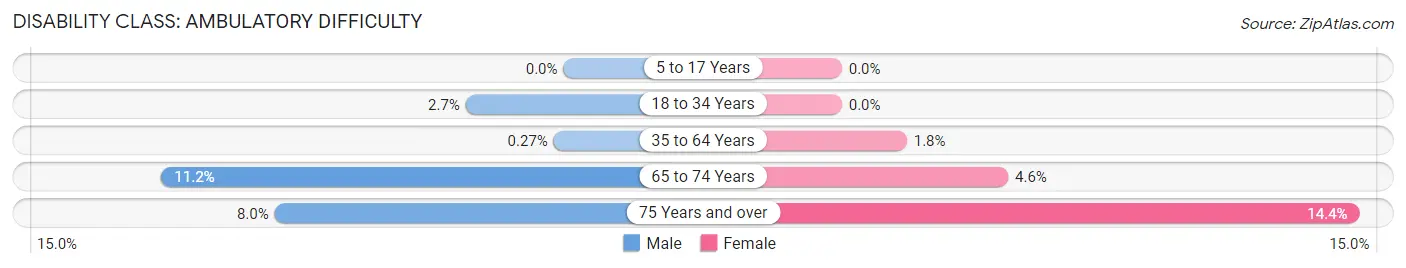
| Age Bracket | Male | Female |
| 5 to 17 Years | 0 (0.0%) | 0 (0.0%) |
| 18 to 34 Years | 18 (2.7%) | 0 (0.0%) |
| 35 to 64 Years | 5 (0.3%) | 35 (1.8%) |
| 65 to 74 Years | 33 (11.2%) | 18 (4.6%) |
| 75 Years and over | 16 (8.0%) | 48 (14.4%) |
Disability Class: Self-Care Difficulty
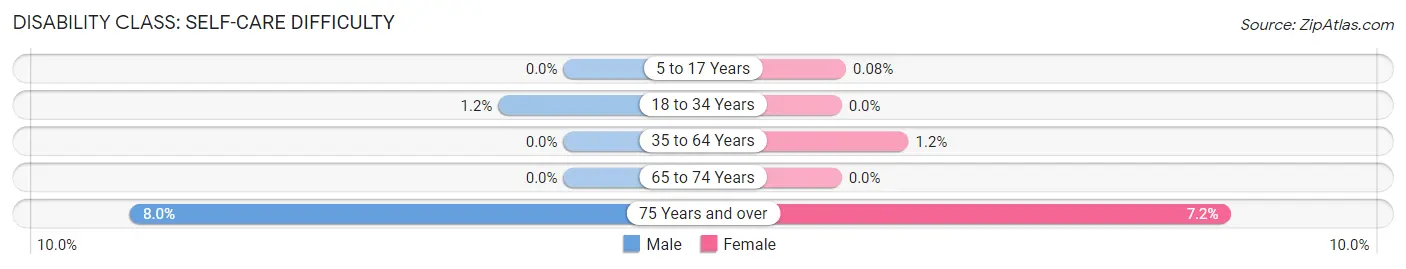
| Age Bracket | Male | Female |
| 5 to 17 Years | 0 (0.0%) | 1 (0.1%) |
| 18 to 34 Years | 8 (1.2%) | 0 (0.0%) |
| 35 to 64 Years | 0 (0.0%) | 24 (1.2%) |
| 65 to 74 Years | 0 (0.0%) | 0 (0.0%) |
| 75 Years and over | 16 (8.0%) | 24 (7.2%) |
Technology Access in Riverside
Computing Device Access in Riverside
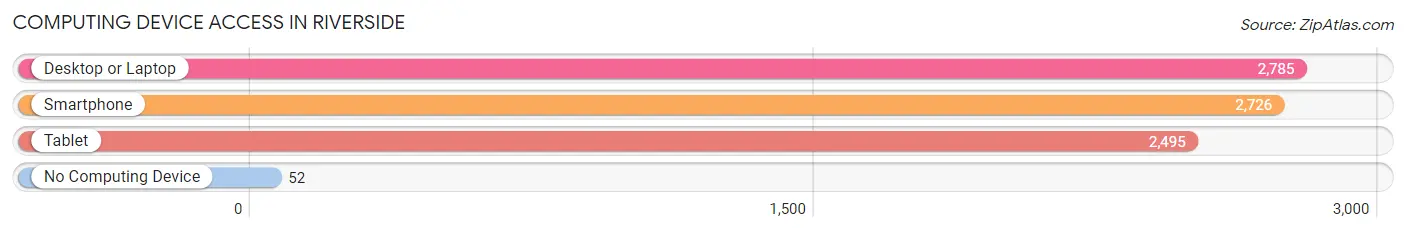
| Device Type | # Households | % Households |
| Desktop or Laptop | 2,785 | 94.8% |
| Smartphone | 2,726 | 92.8% |
| Tablet | 2,495 | 84.9% |
| No Computing Device | 52 | 1.8% |
| Total | 2,938 | 100.0% |
Internet Access in Riverside
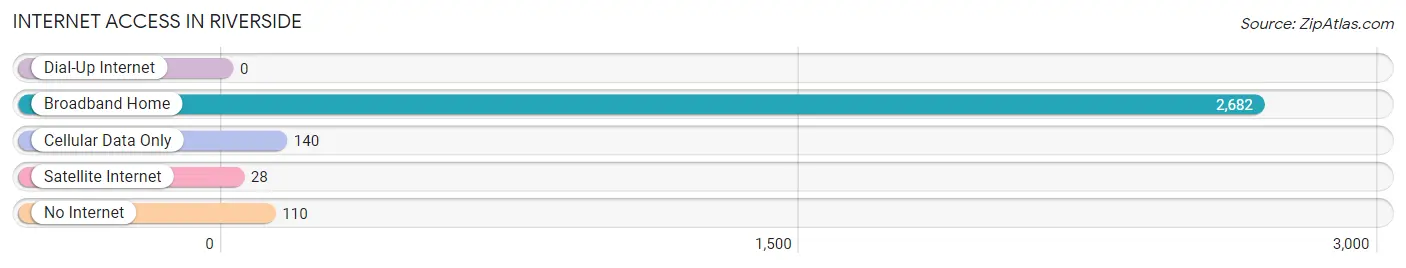
| Internet Type | # Households | % Households |
| Dial-Up Internet | 0 | 0.0% |
| Broadband Home | 2,682 | 91.3% |
| Cellular Data Only | 140 | 4.8% |
| Satellite Internet | 28 | 0.9% |
| No Internet | 110 | 3.7% |
| Total | 2,938 | 100.0% |
Riverside Summary
Riverside is a town located in Fairfield County, Connecticut, United States. It is situated on the east bank of the Connecticut River, and is bordered by the towns of Greenwich, Stamford, and Norwalk. The population was 8,867 at the 2010 census.
History
Riverside was originally part of the town of Greenwich, and was known as "East Greenwich" until 1868. The area was first settled in 1640 by English colonists, and was incorporated as a separate town in 1868. The town was named for its location on the east bank of the Connecticut River.
Riverside was a popular summer resort destination in the late 19th and early 20th centuries, and was home to several large estates. The town was also home to the Riverside Yacht Club, which was founded in 1883 and is still in operation today.
Geography
Riverside is located in southwestern Fairfield County, on the east bank of the Connecticut River. It is bordered by the towns of Greenwich to the north, Stamford to the east, and Norwalk to the south. The town has a total area of 4.2 square miles, of which 4.1 square miles is land and 0.1 square miles (2.45%) is water.
Economy
Riverside is primarily a residential community, and the town's economy is largely based on the service industry. The town is home to several small businesses, including restaurants, retail stores, and professional services. The town is also home to several corporate headquarters, including the headquarters of the Hearst Corporation and the headquarters of the United Illuminating Company.
Demographics
As of the 2010 census, there were 8,867 people, 3,541 households, and 2,541 families residing in the town. The population density was 2,164.2 people per square mile. The racial makeup of the town was 87.2% White, 4.3% African American, 0.2% Native American, 5.3% Asian, 0.1% Pacific Islander, 1.2% from other races, and 1.7% from two or more races. Hispanic or Latino of any race were 5.2% of the population.
The median income for a household in the town was $117,945, and the median income for a family was $142,917. The per capita income for the town was $60,945. About 2.2% of families and 3.3% of the population were below the poverty line, including 3.7% of those under age 18 and 2.2% of those age 65 or over.
Common Questions
What is Per Capita Income in Riverside?
Per Capita income in Riverside is $129,919.
What is the Median Family Income in Riverside?
Median Family Income in Riverside is $250,001.
What is the Median Household income in Riverside?
Median Household Income in Riverside is $250,001.
What is Income or Wage Gap in Riverside?
Income or Wage Gap in Riverside is 70.0%.
Women in Riverside earn 30.0 cents for every dollar earned by a man.
What is Inequality or Gini Index in Riverside?
Inequality or Gini Index in Riverside is 0.49.
What is the Total Population of Riverside?
Total Population of Riverside is 9,093.
What is the Total Male Population of Riverside?
Total Male Population of Riverside is 4,314.
What is the Total Female Population of Riverside?
Total Female Population of Riverside is 4,779.
What is the Ratio of Males per 100 Females in Riverside?
There are 90.27 Males per 100 Females in Riverside.
What is the Ratio of Females per 100 Males in Riverside?
There are 110.78 Females per 100 Males in Riverside.
What is the Median Population Age in Riverside?
Median Population Age in Riverside is 40.7 Years.
What is the Average Family Size in Riverside
Average Family Size in Riverside is 3.5 People.
What is the Average Household Size in Riverside
Average Household Size in Riverside is 3.1 People.
How Large is the Labor Force in Riverside?
There are 4,149 People in the Labor Forcein in Riverside.
What is the Percentage of People in the Labor Force in Riverside?
62.4% of People are in the Labor Force in Riverside.
What is the Unemployment Rate in Riverside?
Unemployment Rate in Riverside is 5.6%.