Zip Codes with the Highest Percentage of Families with Income Below $10,000 in Meriden, CT
RELATED REPORTS & OPTIONS
Family Income | $0-10k
Meriden
Compare Zip Codes
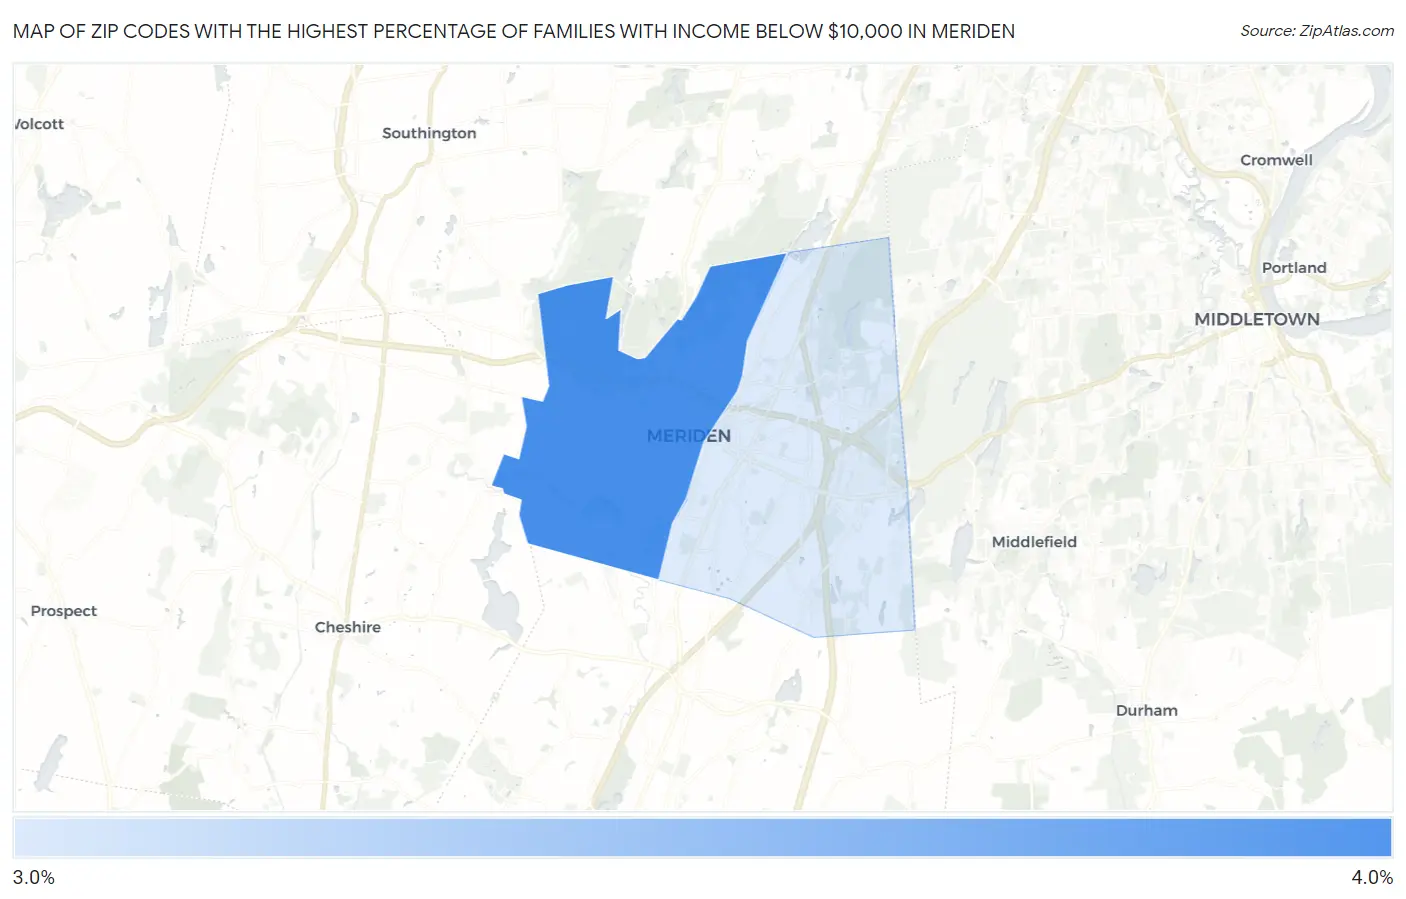
Map of Zip Codes with the Highest Percentage of Families with Income Below $10,000 in Meriden
3.2%
4.0%
Zip Codes with the Highest Percentage of Families with Income Below $10,000 in Meriden, CT
| Zip Code | Families with Income < $10k | vs State | vs National | |
| 1. | 06451 | 4.0% | 2.4%(+1.60)#50 | 3.1%(+0.900)#8,174 |
| 2. | 06450 | 3.2% | 2.4%(+0.800)#61 | 3.1%(+0.100)#10,434 |
1
Common Questions
What are the Top Zip Codes with the Highest Percentage of Families with Income Below $10,000 in Meriden, CT?
Top Zip Codes with the Highest Percentage of Families with Income Below $10,000 in Meriden, CT are:
What zip code has the Highest Percentage of Families with Income Below $10,000 in Meriden, CT?
06451 has the Highest Percentage of Families with Income Below $10,000 in Meriden, CT with 4.0%.
What is the Percentage of Families with Income Below $10,000 in Meriden, CT?
Percentage of Families with Income Below $10,000 in Meriden is 3.5%.
What is the Percentage of Families with Income Below $10,000 in Connecticut?
Percentage of Families with Income Below $10,000 in Connecticut is 2.4%.
What is the Percentage of Families with Income Below $10,000 in the United States?
Percentage of Families with Income Below $10,000 in the United States is 3.1%.