Old Greenwich, CT Map & Demographics
Old Greenwich Map
Old Greenwich Overview
$120,032
PER CAPITA INCOME
$250,001
AVG FAMILY INCOME
$240,417
AVG HOUSEHOLD INCOME
59.0%
WAGE / INCOME GAP [ % ]
41.0¢/ $1
WAGE / INCOME GAP [ $ ]
0.50
INEQUALITY / GINI INDEX
7,060
TOTAL POPULATION
3,345
MALE POPULATION
3,715
FEMALE POPULATION
90.04
MALES / 100 FEMALES
111.06
FEMALES / 100 MALES
41.0
MEDIAN AGE
3.6
AVG FAMILY SIZE
3.0
AVG HOUSEHOLD SIZE
3,082
LABOR FORCE [ PEOPLE ]
63.2%
PERCENT IN LABOR FORCE
4.5%
UNEMPLOYMENT RATE
Old Greenwich Zip Codes
Old Greenwich Area Codes
Income in Old Greenwich
Income Overview in Old Greenwich
Per Capita Income in Old Greenwich is $120,032, while median incomes of families and households are $250,001 and $240,417 respectively.
| Characteristic | Number | Measure |
| Per Capita Income | 7,060 | $120,032 |
| Median Family Income | 1,796 | $250,001 |
| Mean Family Income | 1,796 | $426,775 |
| Median Household Income | 2,321 | $240,417 |
| Mean Household Income | 2,321 | $360,476 |
| Income Deficit | 1,796 | $0 |
| Wage / Income Gap (%) | 7,060 | 59.03% |
| Wage / Income Gap ($) | 7,060 | 40.97¢ per $1 |
| Gini / Inequality Index | 7,060 | 0.50 |
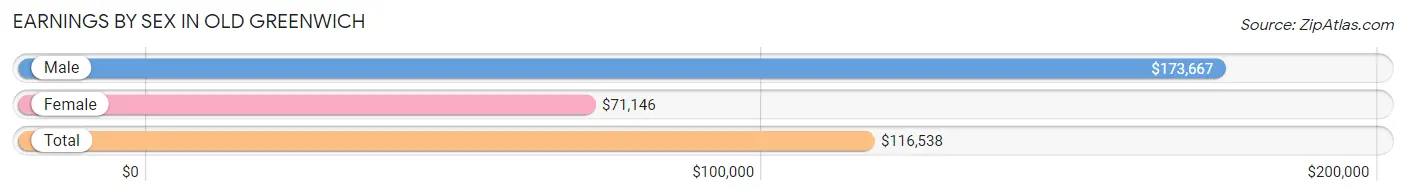
Earnings by Sex in Old Greenwich
Average Earnings in Old Greenwich are $116,538, $173,667 for men and $71,146 for women, a difference of 59.0%.
| Sex | Number | Average Earnings |
| Male | 1,796 (54.6%) | $173,667 |
| Female | 1,496 (45.4%) | $71,146 |
| Total | 3,292 (100.0%) | $116,538 |
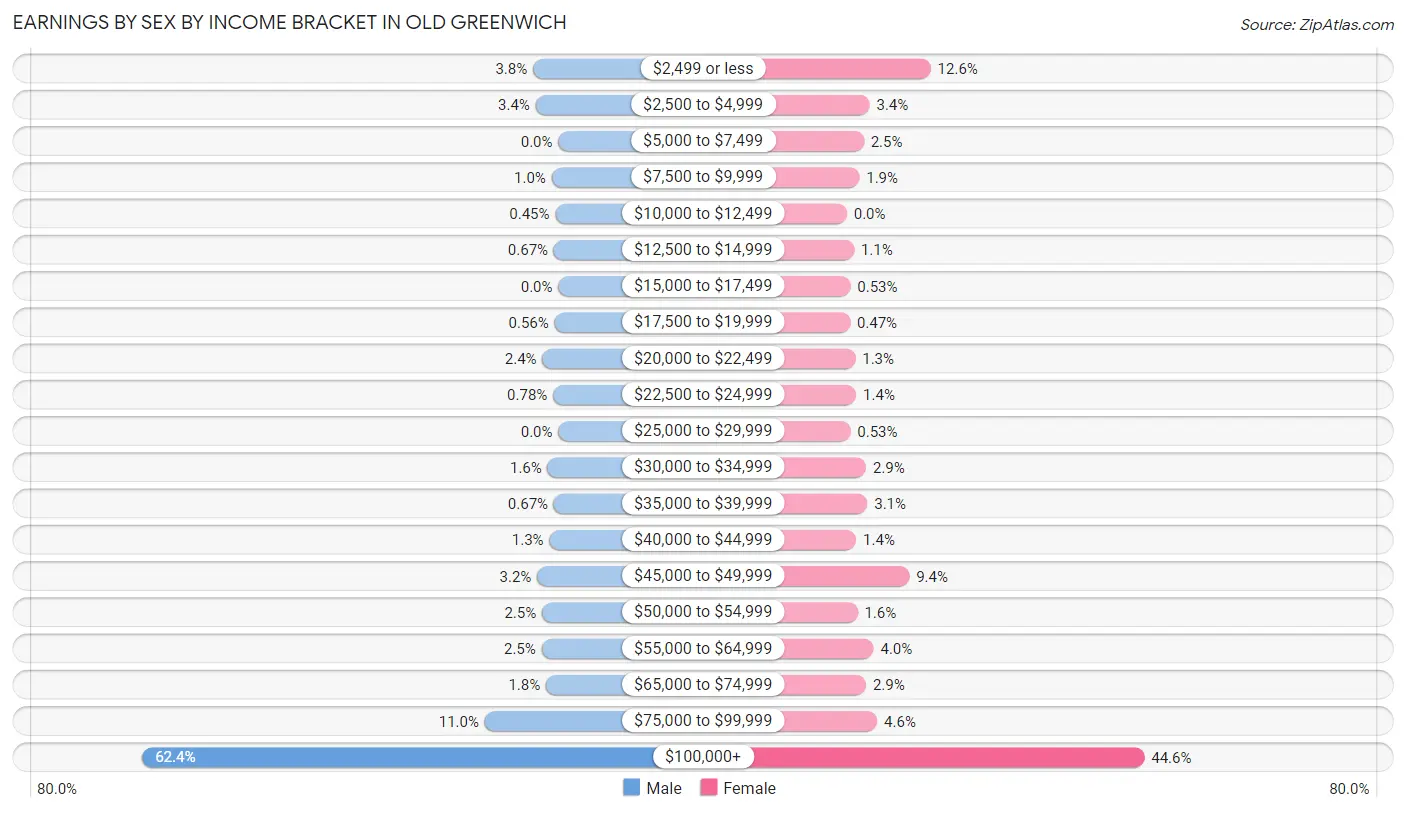
Earnings by Sex by Income Bracket in Old Greenwich
The most common earnings brackets in Old Greenwich are $100,000+ for men (1,120 | 62.4%) and $100,000+ for women (667 | 44.6%).
| Income | Male | Female |
| $2,499 or less | 68 (3.8%) | 188 (12.6%) |
| $2,500 to $4,999 | 61 (3.4%) | 51 (3.4%) |
| $5,000 to $7,499 | 0 (0.0%) | 38 (2.5%) |
| $7,500 to $9,999 | 18 (1.0%) | 28 (1.9%) |
| $10,000 to $12,499 | 8 (0.4%) | 0 (0.0%) |
| $12,500 to $14,999 | 12 (0.7%) | 16 (1.1%) |
| $15,000 to $17,499 | 0 (0.0%) | 8 (0.5%) |
| $17,500 to $19,999 | 10 (0.6%) | 7 (0.5%) |
| $20,000 to $22,499 | 43 (2.4%) | 19 (1.3%) |
| $22,500 to $24,999 | 14 (0.8%) | 21 (1.4%) |
| $25,000 to $29,999 | 0 (0.0%) | 8 (0.5%) |
| $30,000 to $34,999 | 29 (1.6%) | 43 (2.9%) |
| $35,000 to $39,999 | 12 (0.7%) | 46 (3.1%) |
| $40,000 to $44,999 | 24 (1.3%) | 21 (1.4%) |
| $45,000 to $49,999 | 57 (3.2%) | 140 (9.4%) |
| $50,000 to $54,999 | 44 (2.5%) | 24 (1.6%) |
| $55,000 to $64,999 | 45 (2.5%) | 60 (4.0%) |
| $65,000 to $74,999 | 33 (1.8%) | 43 (2.9%) |
| $75,000 to $99,999 | 198 (11.0%) | 68 (4.5%) |
| $100,000+ | 1,120 (62.4%) | 667 (44.6%) |
| Total | 1,796 (100.0%) | 1,496 (100.0%) |
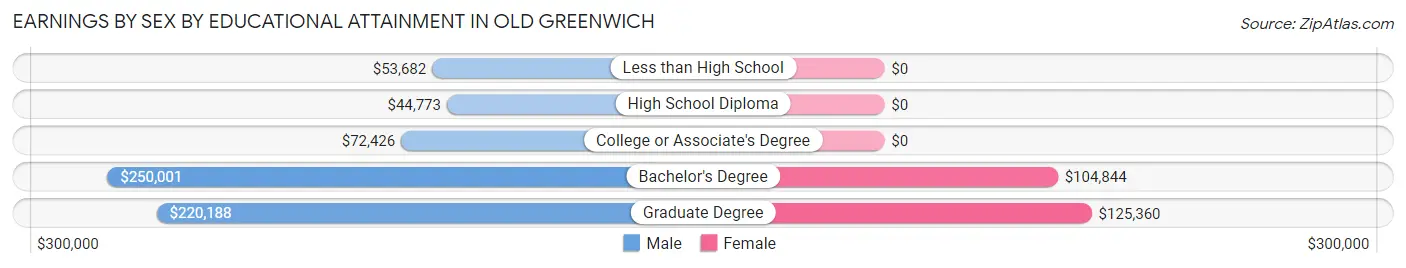
Earnings by Sex by Educational Attainment in Old Greenwich
Average earnings in Old Greenwich are $189,028 for men and $109,492 for women, a difference of 42.1%. Men with an educational attainment of bachelor's degree enjoy the highest average annual earnings of $250,001, while those with high school diploma education earn the least with $44,773. Women with an educational attainment of graduate degree earn the most with the average annual earnings of $125,360, while those with bachelor's degree education have the smallest earnings of $104,844.
| Educational Attainment | Male Income | Female Income |
| Less than High School | $53,682 | $0 |
| High School Diploma | $44,773 | $0 |
| College or Associate's Degree | $72,426 | $0 |
| Bachelor's Degree | $250,001 | $104,844 |
| Graduate Degree | $220,188 | $125,360 |
| Total | $189,028 | $109,492 |
Family Income in Old Greenwich
Family Income Brackets in Old Greenwich
According to the Old Greenwich family income data, there are 1,243 families falling into the $200,000+ income range, which is the most common income bracket and makes up 69.2% of all families.
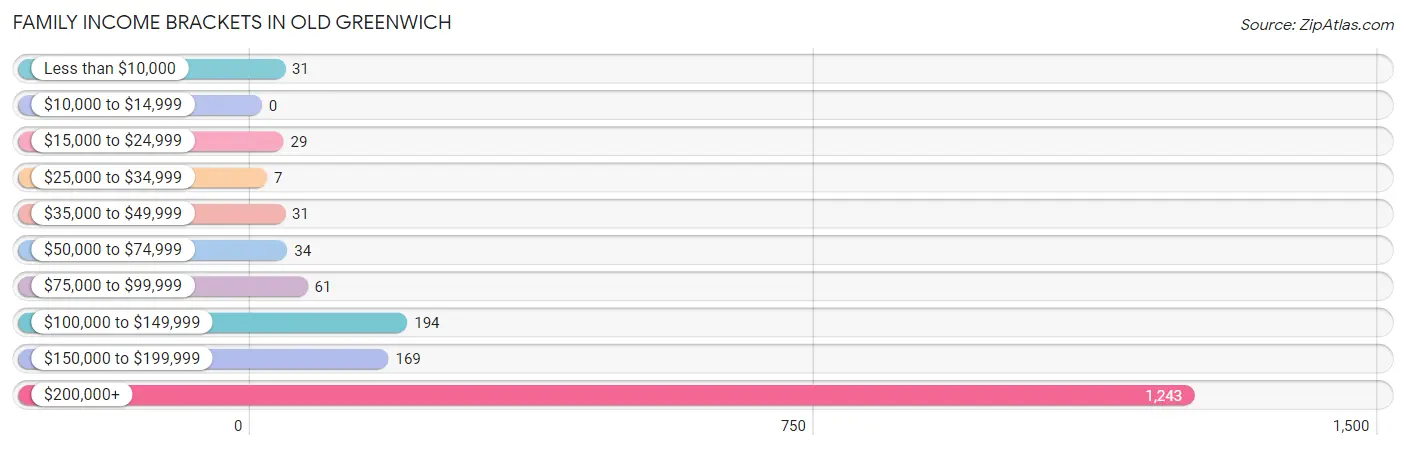
| Income Bracket | # Families | % Families |
| Less than $10,000 | 31 | 1.7% |
| $10,000 to $14,999 | 0 | 0.0% |
| $15,000 to $24,999 | 29 | 1.6% |
| $25,000 to $34,999 | 7 | 0.4% |
| $35,000 to $49,999 | 31 | 1.7% |
| $50,000 to $74,999 | 34 | 1.9% |
| $75,000 to $99,999 | 61 | 3.4% |
| $100,000 to $149,999 | 194 | 10.8% |
| $150,000 to $199,999 | 169 | 9.4% |
| $200,000+ | 1,243 | 69.2% |
Family Income by Famaliy Size in Old Greenwich
2-person families (615 | 34.2%) account for the highest median family income in Old Greenwich with $250,001 per family, while 2-person families (615 | 34.2%) have the highest median income of $125,000 per family member.
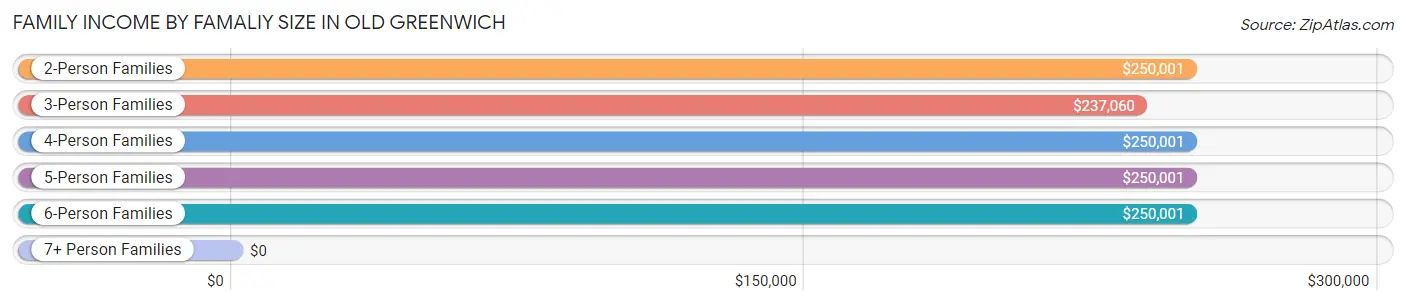
| Income Bracket | # Families | Median Income |
| 2-Person Families | 615 (34.2%) | $250,001 |
| 3-Person Families | 251 (14.0%) | $237,060 |
| 4-Person Families | 575 (32.0%) | $250,001 |
| 5-Person Families | 318 (17.7%) | $250,001 |
| 6-Person Families | 28 (1.6%) | $250,001 |
| 7+ Person Families | 9 (0.5%) | $0 |
| Total | 1,796 (100.0%) | $250,001 |
Family Income by Number of Earners in Old Greenwich
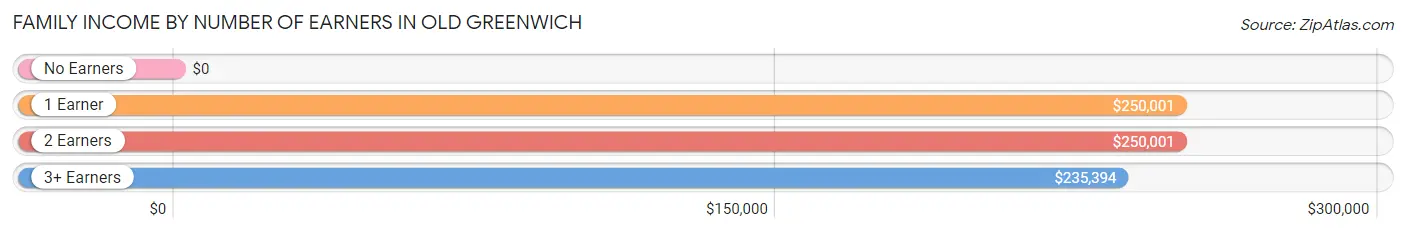
| Number of Earners | # Families | Median Income |
| No Earners | 169 (9.4%) | $0 |
| 1 Earner | 724 (40.3%) | $250,001 |
| 2 Earners | 738 (41.1%) | $250,001 |
| 3+ Earners | 165 (9.2%) | $235,394 |
| Total | 1,796 (100.0%) | $250,001 |
Household Income in Old Greenwich
Household Income Brackets in Old Greenwich
With 1,337 households falling in the category, the $200,000+ income range is the most frequent in Old Greenwich, accounting for 57.6% of all households. In contrast, only 7 households (0.3%) fall into the $25,000 to $34,999 income bracket, making it the least populous group.
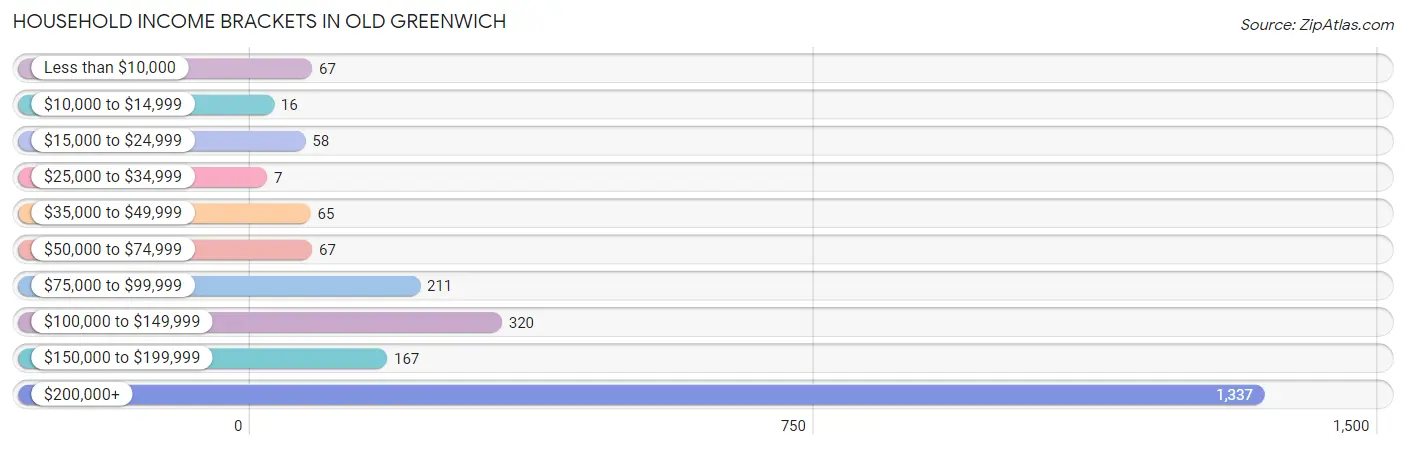
| Income Bracket | # Households | % Households |
| Less than $10,000 | 67 | 2.9% |
| $10,000 to $14,999 | 16 | 0.7% |
| $15,000 to $24,999 | 58 | 2.5% |
| $25,000 to $34,999 | 7 | 0.3% |
| $35,000 to $49,999 | 65 | 2.8% |
| $50,000 to $74,999 | 67 | 2.9% |
| $75,000 to $99,999 | 211 | 9.1% |
| $100,000 to $149,999 | 320 | 13.8% |
| $150,000 to $199,999 | 167 | 7.2% |
| $200,000+ | 1,337 | 57.6% |
Household Income by Householder Age in Old Greenwich
The median household income in Old Greenwich is $240,417, with the highest median household income of $250,001 found in the 25 to 44 years age bracket for the primary householder. A total of 710 households (30.6%) fall into this category. Meanwhile, the 15 to 24 years age bracket for the primary householder has the lowest median household income of $0, with 15 households (0.6%) in this group.
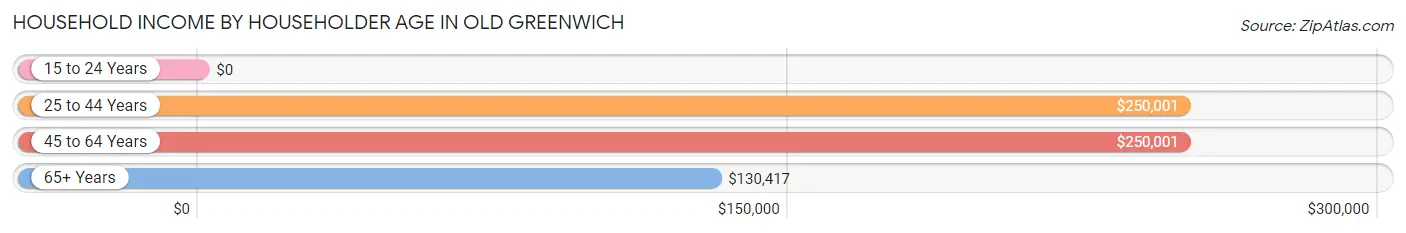
| Income Bracket | # Households | Median Income |
| 15 to 24 Years | 15 (0.6%) | $0 |
| 25 to 44 Years | 710 (30.6%) | $250,001 |
| 45 to 64 Years | 964 (41.5%) | $250,001 |
| 65+ Years | 632 (27.2%) | $130,417 |
| Total | 2,321 (100.0%) | $240,417 |
Poverty in Old Greenwich
Income Below Poverty by Sex and Age in Old Greenwich
With 3.4% poverty level for males and 2.8% for females among the residents of Old Greenwich, 25 to 34 year old males and 75 year old and over females are the most vulnerable to poverty, with 25 males (29.8%) and 32 females (12.9%) in their respective age groups living below the poverty level.
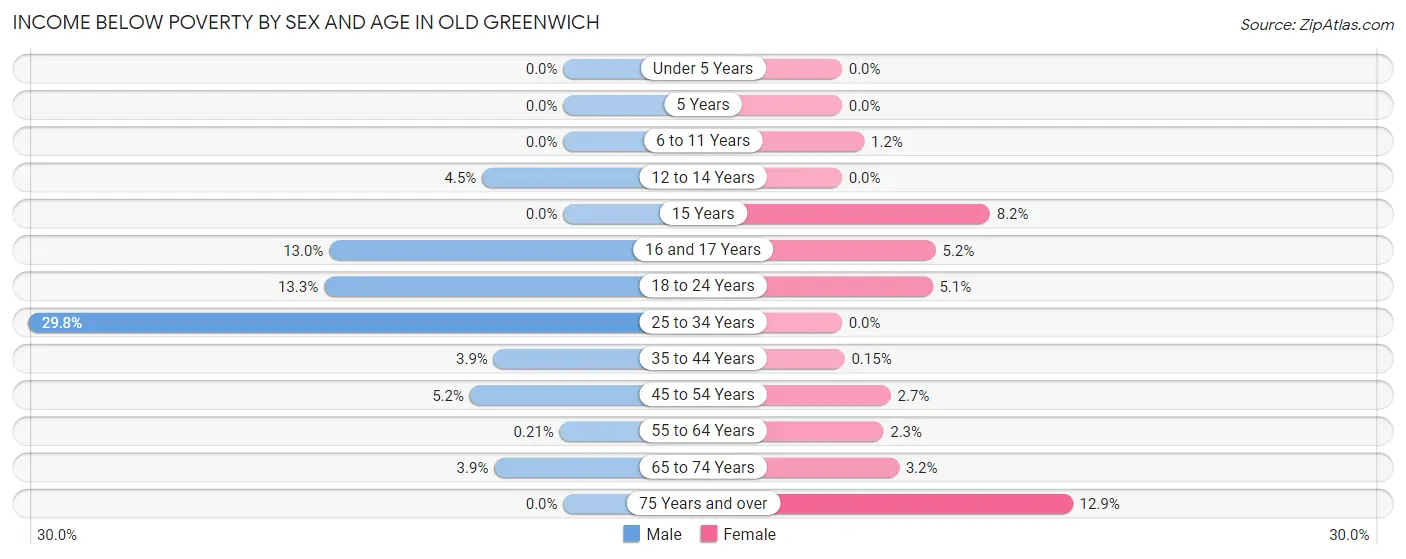
| Age Bracket | Male | Female |
| Under 5 Years | 0 (0.0%) | 0 (0.0%) |
| 5 Years | 0 (0.0%) | 0 (0.0%) |
| 6 to 11 Years | 0 (0.0%) | 7 (1.2%) |
| 12 to 14 Years | 8 (4.5%) | 0 (0.0%) |
| 15 Years | 0 (0.0%) | 7 (8.2%) |
| 16 and 17 Years | 6 (13.0%) | 7 (5.2%) |
| 18 to 24 Years | 16 (13.3%) | 15 (5.1%) |
| 25 to 34 Years | 25 (29.8%) | 0 (0.0%) |
| 35 to 44 Years | 23 (3.9%) | 1 (0.2%) |
| 45 to 54 Years | 25 (5.2%) | 14 (2.7%) |
| 55 to 64 Years | 1 (0.2%) | 10 (2.3%) |
| 65 to 74 Years | 10 (3.8%) | 10 (3.2%) |
| 75 Years and over | 0 (0.0%) | 32 (12.9%) |
| Total | 114 (3.4%) | 103 (2.8%) |
Income Above Poverty by Sex and Age in Old Greenwich
According to the poverty statistics in Old Greenwich, males aged under 5 years and females aged under 5 years are the age groups that are most secure financially, with 100.0% of males and 100.0% of females in these age groups living above the poverty line.
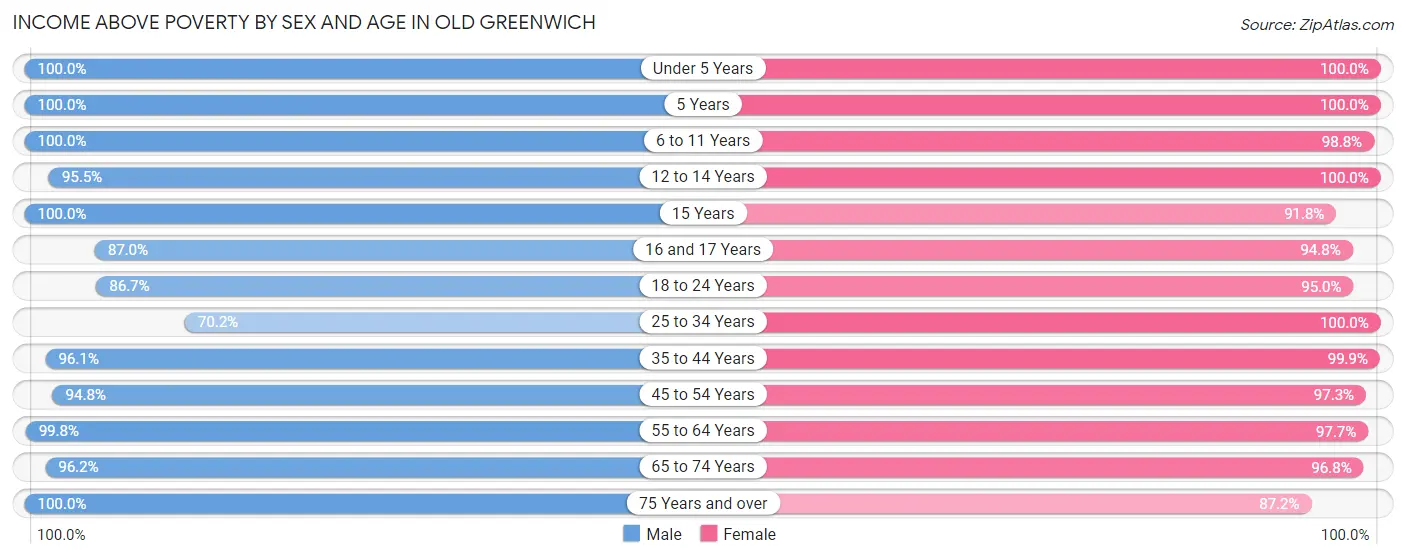
| Age Bracket | Male | Female |
| Under 5 Years | 340 (100.0%) | 189 (100.0%) |
| 5 Years | 168 (100.0%) | 70 (100.0%) |
| 6 to 11 Years | 379 (100.0%) | 556 (98.8%) |
| 12 to 14 Years | 169 (95.5%) | 169 (100.0%) |
| 15 Years | 43 (100.0%) | 78 (91.8%) |
| 16 and 17 Years | 40 (87.0%) | 127 (94.8%) |
| 18 to 24 Years | 104 (86.7%) | 282 (95.0%) |
| 25 to 34 Years | 59 (70.2%) | 21 (100.0%) |
| 35 to 44 Years | 570 (96.1%) | 675 (99.9%) |
| 45 to 54 Years | 455 (94.8%) | 501 (97.3%) |
| 55 to 64 Years | 482 (99.8%) | 422 (97.7%) |
| 65 to 74 Years | 250 (96.2%) | 305 (96.8%) |
| 75 Years and over | 172 (100.0%) | 217 (87.2%) |
| Total | 3,231 (96.6%) | 3,612 (97.2%) |
Income Below Poverty Among Married-Couple Families in Old Greenwich
The poverty statistics for married-couple families in Old Greenwich show that 1.1% or 17 of the total 1,594 families live below the poverty line. Families with 3 or 4 children have the highest poverty rate of 2.4%, comprising of 7 families. On the other hand, families with 1 or 2 children have the lowest poverty rate of 0.0%, which includes 0 families.
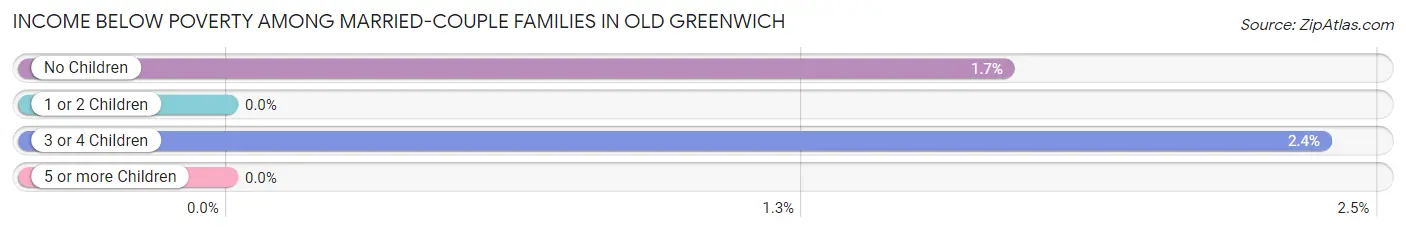
| Children | Above Poverty | Below Poverty |
| No Children | 582 (98.3%) | 10 (1.7%) |
| 1 or 2 Children | 699 (100.0%) | 0 (0.0%) |
| 3 or 4 Children | 287 (97.6%) | 7 (2.4%) |
| 5 or more Children | 9 (100.0%) | 0 (0.0%) |
| Total | 1,577 (98.9%) | 17 (1.1%) |
Income Below Poverty Among Single-Parent Households in Old Greenwich
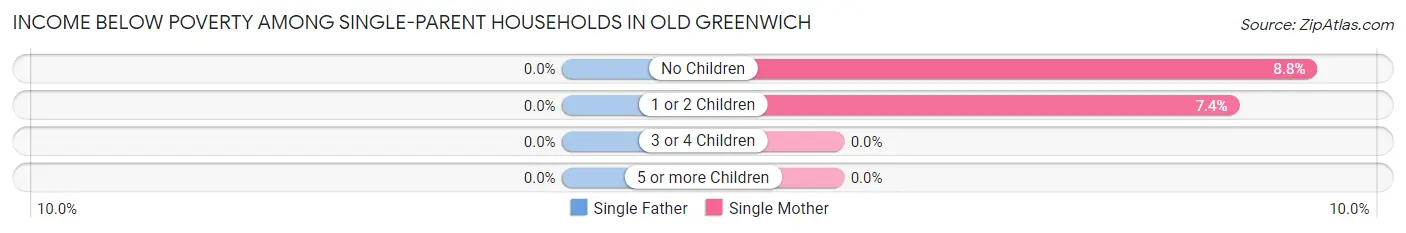
| Children | Single Father | Single Mother |
| No Children | 0 (0.0%) | 6 (8.8%) |
| 1 or 2 Children | 0 (0.0%) | 7 (7.4%) |
| 3 or 4 Children | 0 (0.0%) | 0 (0.0%) |
| 5 or more Children | 0 (0.0%) | 0 (0.0%) |
| Total | 0 (0.0%) | 13 (8.0%) |
Income Below Poverty Among Married-Couple vs Single-Parent Households in Old Greenwich
The poverty data for Old Greenwich shows that 17 of the married-couple family households (1.1%) and 13 of the single-parent households (6.4%) are living below the poverty level. Within the married-couple family households, those with 3 or 4 children have the highest poverty rate, with 7 households (2.4%) falling below the poverty line. Among the single-parent households, those with 1 or 2 children have the highest poverty rate, with 7 household (7.4%) living below poverty.
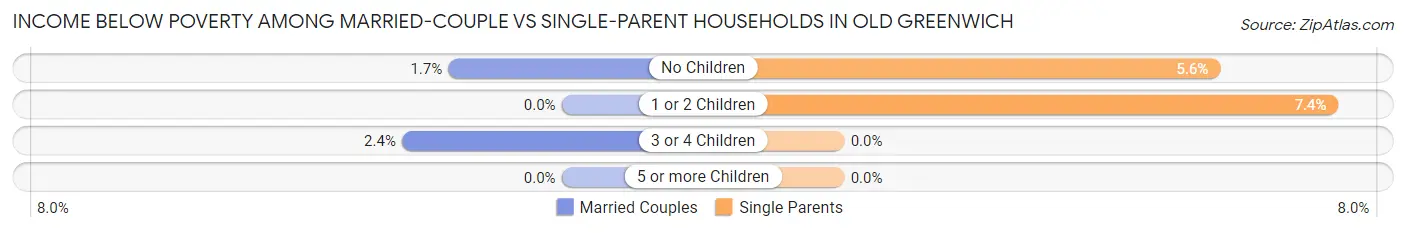
| Children | Married-Couple Families | Single-Parent Households |
| No Children | 10 (1.7%) | 6 (5.6%) |
| 1 or 2 Children | 0 (0.0%) | 7 (7.4%) |
| 3 or 4 Children | 7 (2.4%) | 0 (0.0%) |
| 5 or more Children | 0 (0.0%) | 0 (0.0%) |
| Total | 17 (1.1%) | 13 (6.4%) |
Race in Old Greenwich
The most populous races in Old Greenwich are White / Caucasian (5,839 | 82.7%), Asian (549 | 7.8%), and Two or more Races (509 | 7.2%).
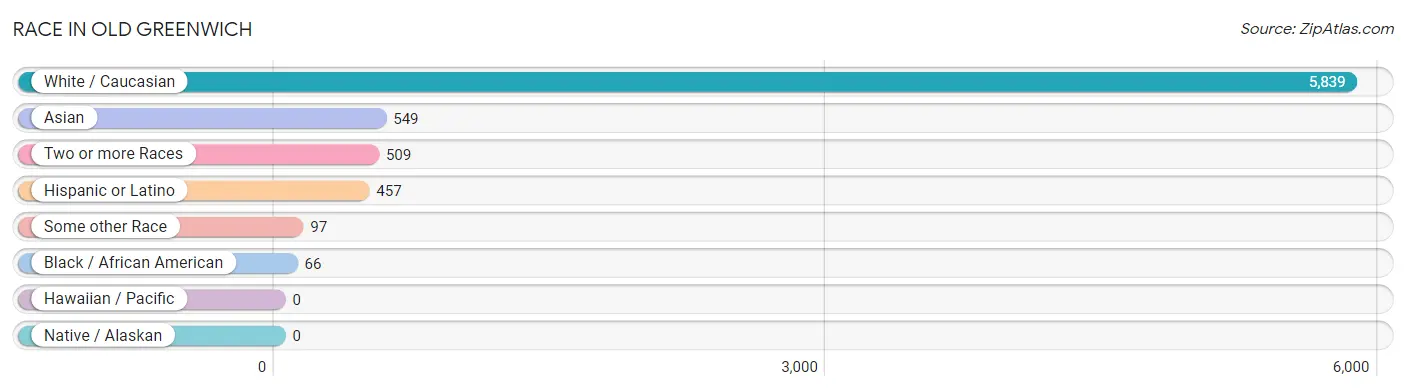
| Race | # Population | % Population |
| Asian | 549 | 7.8% |
| Black / African American | 66 | 0.9% |
| Hawaiian / Pacific | 0 | 0.0% |
| Hispanic or Latino | 457 | 6.5% |
| Native / Alaskan | 0 | 0.0% |
| White / Caucasian | 5,839 | 82.7% |
| Two or more Races | 509 | 7.2% |
| Some other Race | 97 | 1.4% |
| Total | 7,060 | 100.0% |
Ancestry in Old Greenwich
The most populous ancestries reported in Old Greenwich are Italian (1,223 | 17.3%), Irish (1,114 | 15.8%), English (1,007 | 14.3%), German (717 | 10.2%), and Polish (376 | 5.3%), together accounting for 62.8% of all Old Greenwich residents.
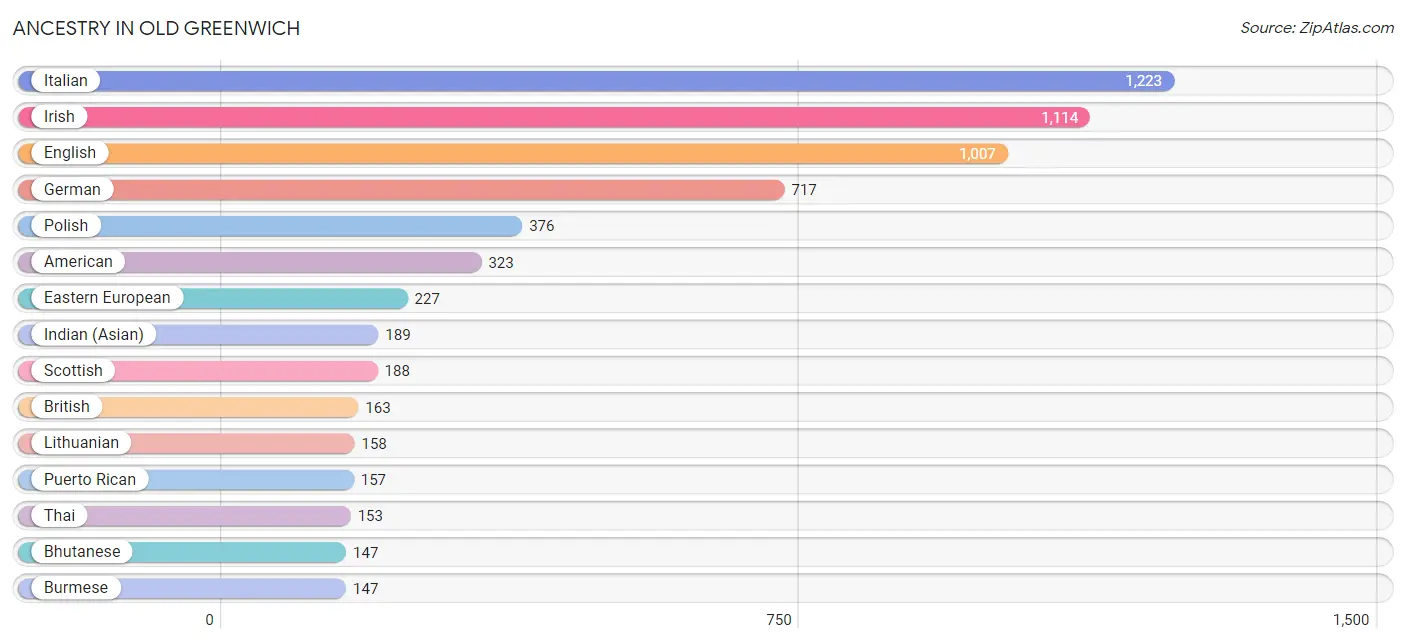
| Ancestry | # Population | % Population |
| American | 323 | 4.6% |
| Arab | 34 | 0.5% |
| Argentinean | 28 | 0.4% |
| Austrian | 77 | 1.1% |
| Bhutanese | 147 | 2.1% |
| British | 163 | 2.3% |
| Burmese | 147 | 2.1% |
| Central American | 43 | 0.6% |
| Colombian | 69 | 1.0% |
| Cypriot | 66 | 0.9% |
| Czech | 7 | 0.1% |
| Danish | 77 | 1.1% |
| Dutch | 36 | 0.5% |
| Eastern European | 227 | 3.2% |
| English | 1,007 | 14.3% |
| Estonian | 9 | 0.1% |
| European | 44 | 0.6% |
| Finnish | 10 | 0.1% |
| French | 86 | 1.2% |
| French Canadian | 41 | 0.6% |
| German | 717 | 10.2% |
| Greek | 93 | 1.3% |
| Guatemalan | 43 | 0.6% |
| Haitian | 54 | 0.8% |
| Hungarian | 147 | 2.1% |
| Indian (Asian) | 189 | 2.7% |
| Irish | 1,114 | 15.8% |
| Italian | 1,223 | 17.3% |
| Lebanese | 9 | 0.1% |
| Lithuanian | 158 | 2.2% |
| Mexican | 20 | 0.3% |
| Northern European | 48 | 0.7% |
| Norwegian | 69 | 1.0% |
| Polish | 376 | 5.3% |
| Portuguese | 59 | 0.8% |
| Puerto Rican | 157 | 2.2% |
| Russian | 98 | 1.4% |
| Scotch-Irish | 88 | 1.3% |
| Scottish | 188 | 2.7% |
| South African | 125 | 1.8% |
| South American | 97 | 1.4% |
| Spaniard | 14 | 0.2% |
| Spanish | 45 | 0.6% |
| Subsaharan African | 125 | 1.8% |
| Swedish | 98 | 1.4% |
| Swiss | 18 | 0.3% |
| Syrian | 12 | 0.2% |
| Thai | 153 | 2.2% |
| Welsh | 11 | 0.2% |
| Yugoslavian | 7 | 0.1% | View All 50 Rows |
Immigrants in Old Greenwich
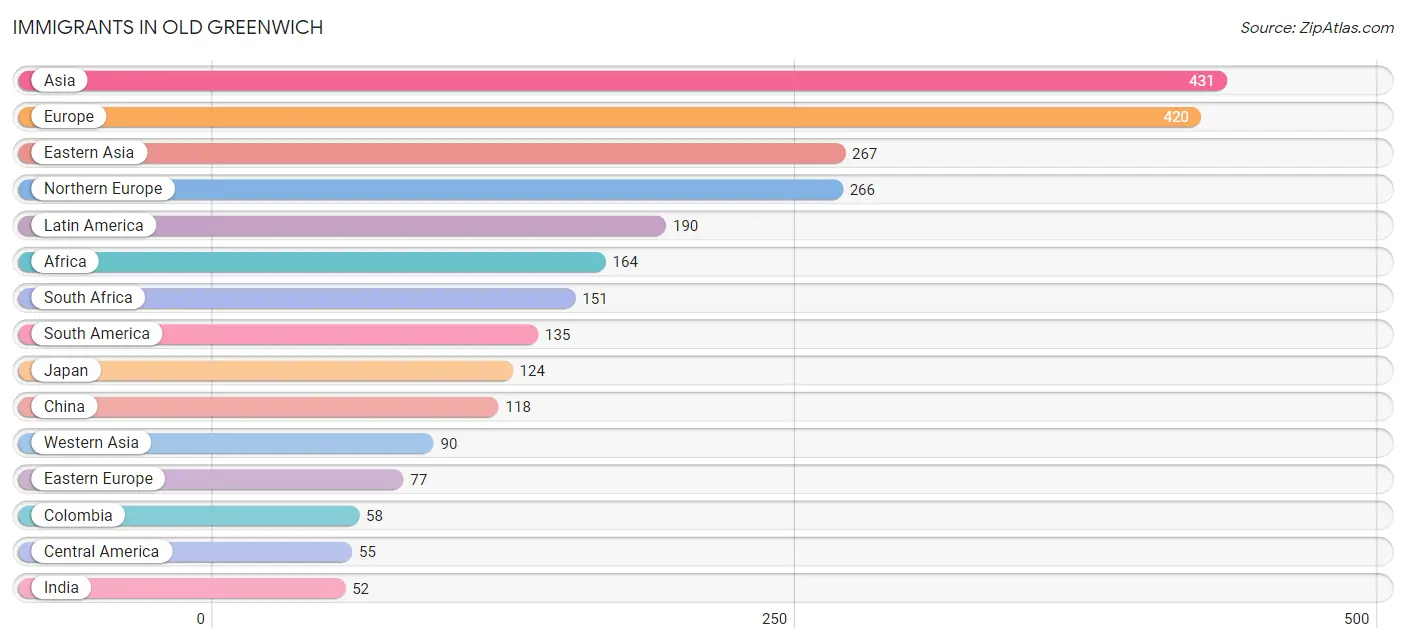
The most numerous immigrant groups reported in Old Greenwich came from Asia (431 | 6.1%), Europe (420 | 5.9%), Eastern Asia (267 | 3.8%), Northern Europe (266 | 3.8%), and Latin America (190 | 2.7%), together accounting for 22.3% of all Old Greenwich residents.
| Immigration Origin | # Population | % Population |
| Africa | 164 | 2.3% |
| Argentina | 35 | 0.5% |
| Asia | 431 | 6.1% |
| Australia | 37 | 0.5% |
| Bosnia and Herzegovina | 10 | 0.1% |
| Brazil | 17 | 0.2% |
| Canada | 9 | 0.1% |
| Central America | 55 | 0.8% |
| China | 118 | 1.7% |
| Colombia | 58 | 0.8% |
| Denmark | 44 | 0.6% |
| Eastern Africa | 13 | 0.2% |
| Eastern Asia | 267 | 3.8% |
| Eastern Europe | 77 | 1.1% |
| Ecuador | 11 | 0.2% |
| Europe | 420 | 5.9% |
| Germany | 40 | 0.6% |
| Greece | 7 | 0.1% |
| Guatemala | 43 | 0.6% |
| Hong Kong | 6 | 0.1% |
| Hungary | 30 | 0.4% |
| India | 52 | 0.7% |
| Ireland | 23 | 0.3% |
| Israel | 11 | 0.2% |
| Japan | 124 | 1.8% |
| Kenya | 13 | 0.2% |
| Korea | 25 | 0.4% |
| Latin America | 190 | 2.7% |
| Mexico | 12 | 0.2% |
| Northern Europe | 266 | 3.8% |
| Norway | 7 | 0.1% |
| Oceania | 46 | 0.6% |
| Poland | 28 | 0.4% |
| Scotland | 18 | 0.3% |
| South Africa | 151 | 2.1% |
| South America | 135 | 1.9% |
| South Central Asia | 52 | 0.7% |
| South Eastern Asia | 22 | 0.3% |
| Southern Europe | 28 | 0.4% |
| Spain | 21 | 0.3% |
| Sweden | 20 | 0.3% |
| Switzerland | 9 | 0.1% |
| Syria | 13 | 0.2% |
| Taiwan | 10 | 0.1% |
| Thailand | 22 | 0.3% |
| Venezuela | 14 | 0.2% |
| Western Asia | 90 | 1.3% |
| Western Europe | 49 | 0.7% | View All 48 Rows |
Sex and Age in Old Greenwich
Sex and Age in Old Greenwich
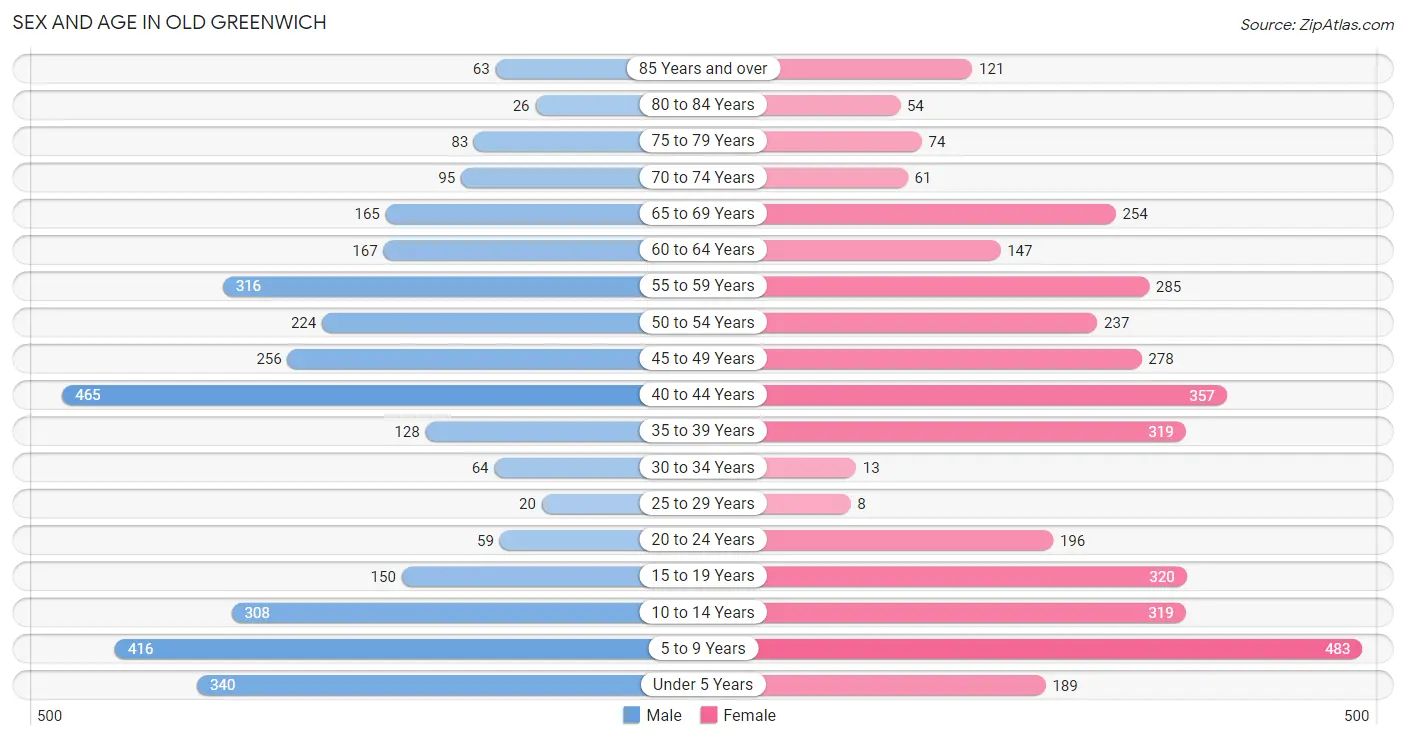
The most populous age groups in Old Greenwich are 40 to 44 Years (465 | 13.9%) for men and 5 to 9 Years (483 | 13.0%) for women.
| Age Bracket | Male | Female |
| Under 5 Years | 340 (10.2%) | 189 (5.1%) |
| 5 to 9 Years | 416 (12.4%) | 483 (13.0%) |
| 10 to 14 Years | 308 (9.2%) | 319 (8.6%) |
| 15 to 19 Years | 150 (4.5%) | 320 (8.6%) |
| 20 to 24 Years | 59 (1.8%) | 196 (5.3%) |
| 25 to 29 Years | 20 (0.6%) | 8 (0.2%) |
| 30 to 34 Years | 64 (1.9%) | 13 (0.4%) |
| 35 to 39 Years | 128 (3.8%) | 319 (8.6%) |
| 40 to 44 Years | 465 (13.9%) | 357 (9.6%) |
| 45 to 49 Years | 256 (7.6%) | 278 (7.5%) |
| 50 to 54 Years | 224 (6.7%) | 237 (6.4%) |
| 55 to 59 Years | 316 (9.5%) | 285 (7.7%) |
| 60 to 64 Years | 167 (5.0%) | 147 (4.0%) |
| 65 to 69 Years | 165 (4.9%) | 254 (6.8%) |
| 70 to 74 Years | 95 (2.8%) | 61 (1.6%) |
| 75 to 79 Years | 83 (2.5%) | 74 (2.0%) |
| 80 to 84 Years | 26 (0.8%) | 54 (1.5%) |
| 85 Years and over | 63 (1.9%) | 121 (3.3%) |
| Total | 3,345 (100.0%) | 3,715 (100.0%) |
Families and Households in Old Greenwich
Median Family Size in Old Greenwich
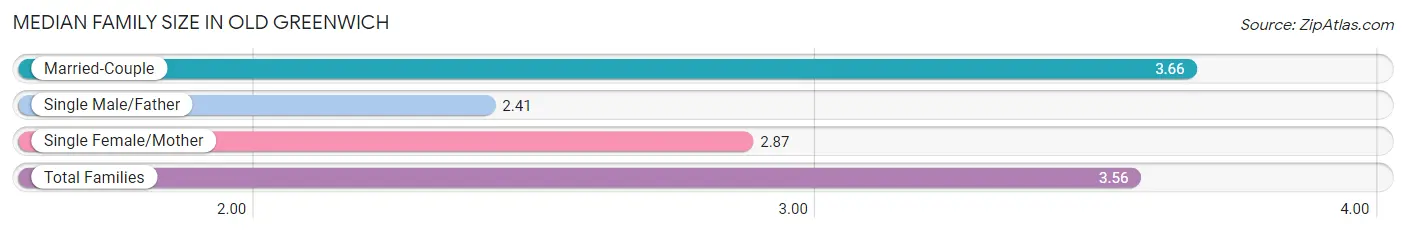
The median family size in Old Greenwich is 3.56 persons per family, with married-couple families (1,594 | 88.7%) accounting for the largest median family size of 3.66 persons per family. On the other hand, single male/father families (39 | 2.2%) represent the smallest median family size with 2.41 persons per family.
| Family Type | # Families | Family Size |
| Married-Couple | 1,594 (88.7%) | 3.66 |
| Single Male/Father | 39 (2.2%) | 2.41 |
| Single Female/Mother | 163 (9.1%) | 2.87 |
| Total Families | 1,796 (100.0%) | 3.56 |
Median Household Size in Old Greenwich
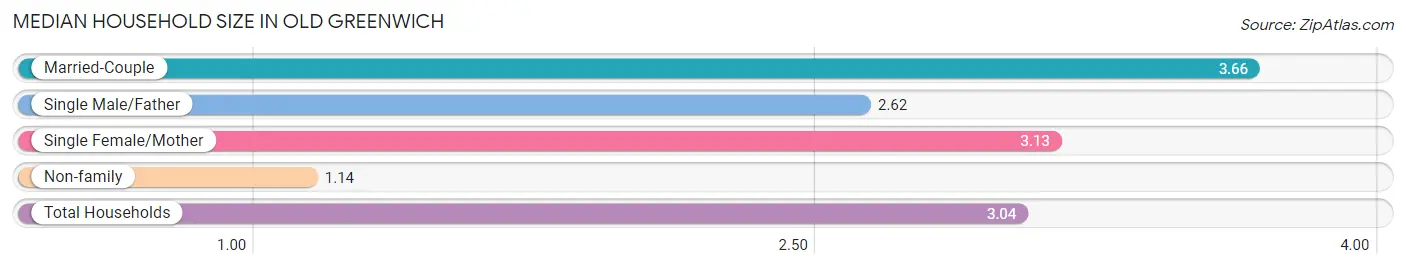
The median household size in Old Greenwich is 3.04 persons per household, with married-couple households (1,594 | 68.7%) accounting for the largest median household size of 3.66 persons per household. non-family households (525 | 22.6%) represent the smallest median household size with 1.14 persons per household.
| Household Type | # Households | Household Size |
| Married-Couple | 1,594 (68.7%) | 3.66 |
| Single Male/Father | 39 (1.7%) | 2.62 |
| Single Female/Mother | 163 (7.0%) | 3.13 |
| Non-family | 525 (22.6%) | 1.14 |
| Total Households | 2,321 (100.0%) | 3.04 |
Household Size by Marriage Status in Old Greenwich
Out of a total of 2,321 households in Old Greenwich, 1,796 (77.4%) are family households, while 525 (22.6%) are nonfamily households. The most numerous type of family households are 4-person households, comprising 616, and the most common type of nonfamily households are 1-person households, comprising 474.
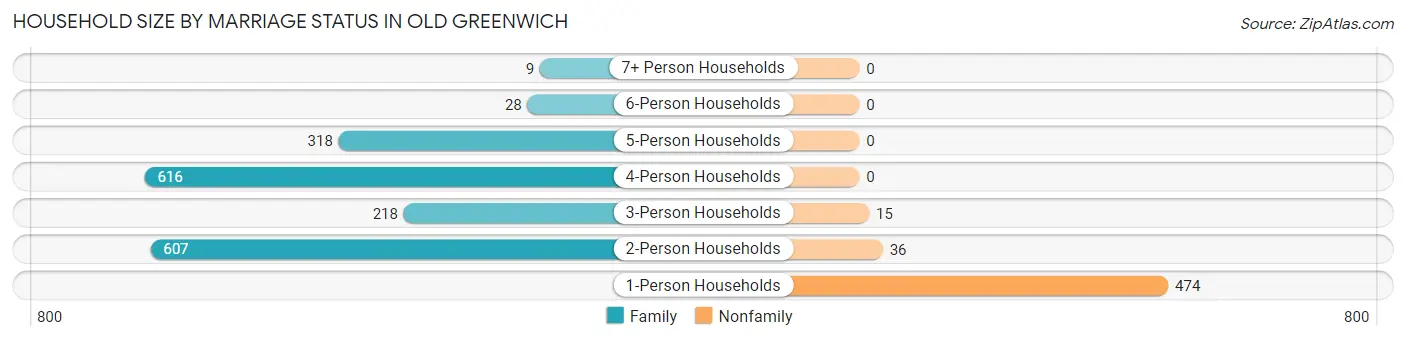
| Household Size | Family Households | Nonfamily Households |
| 1-Person Households | - | 474 (20.4%) |
| 2-Person Households | 607 (26.2%) | 36 (1.5%) |
| 3-Person Households | 218 (9.4%) | 15 (0.6%) |
| 4-Person Households | 616 (26.5%) | 0 (0.0%) |
| 5-Person Households | 318 (13.7%) | 0 (0.0%) |
| 6-Person Households | 28 (1.2%) | 0 (0.0%) |
| 7+ Person Households | 9 (0.4%) | 0 (0.0%) |
| Total | 1,796 (77.4%) | 525 (22.6%) |
Female Fertility in Old Greenwich
Fertility by Age in Old Greenwich
Average fertility rate in Old Greenwich is 92.0 births per 1,000 women. Women in the age bracket of 35 to 50 years have the highest fertility rate with 139.0 births per 1,000 women. Women in the age bracket of 35 to 50 years acount for 100.0% of all women with births.
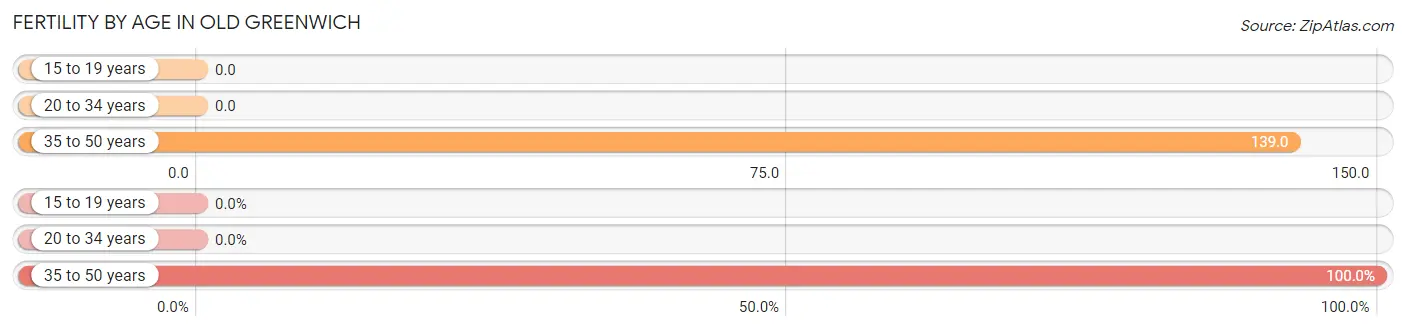
| Age Bracket | Women with Births | Births / 1,000 Women |
| 15 to 19 years | 0 (0.0%) | 0.0 |
| 20 to 34 years | 0 (0.0%) | 0.0 |
| 35 to 50 years | 147 (100.0%) | 139.0 |
| Total | 147 (100.0%) | 92.0 |
Fertility by Age by Marriage Status in Old Greenwich
78.2% of women with births (147) in Old Greenwich are married. The highest percentage of unmarried women with births falls into 35 to 50 years age bracket with 21.8% of them unmarried at the time of birth, while the lowest percentage of unmarried women with births belong to 35 to 50 years age bracket with 21.8% of them unmarried.
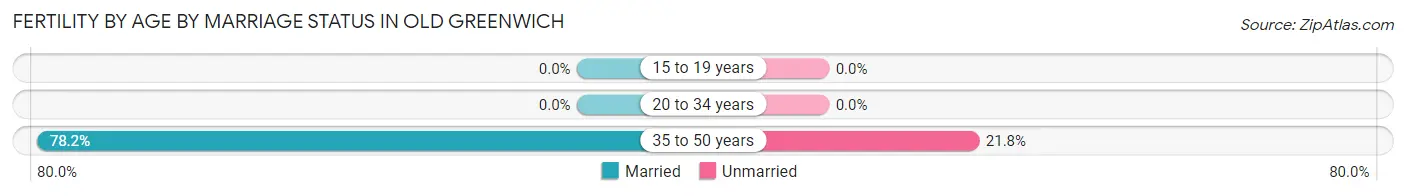
| Age Bracket | Married | Unmarried |
| 15 to 19 years | 0 (0.0%) | 0 (0.0%) |
| 20 to 34 years | 0 (0.0%) | 0 (0.0%) |
| 35 to 50 years | 115 (78.2%) | 32 (21.8%) |
| Total | 115 (78.2%) | 32 (21.8%) |
Fertility by Education in Old Greenwich
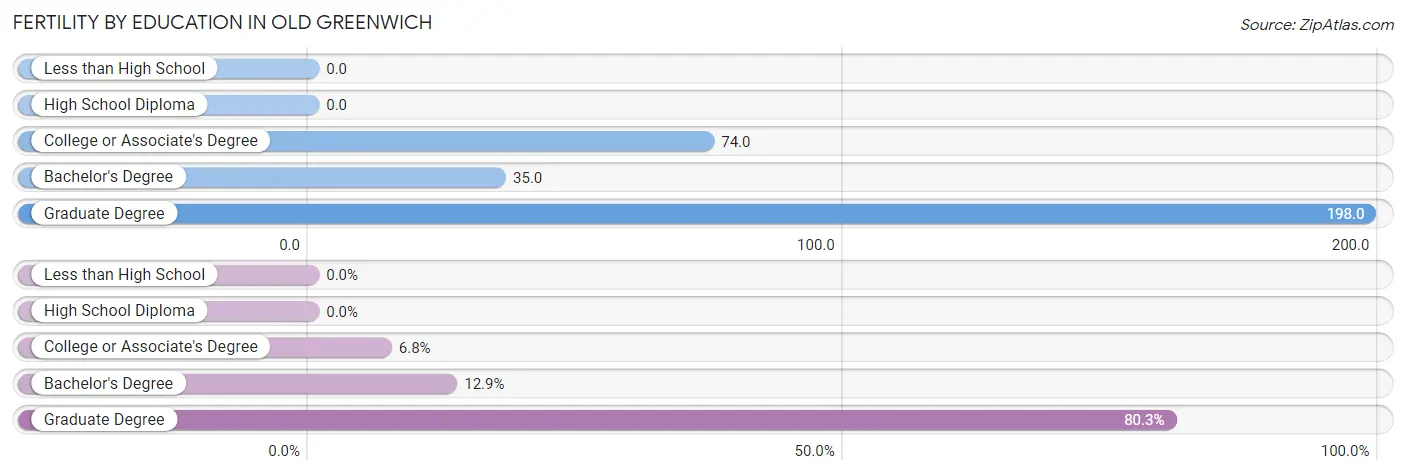
| Educational Attainment | Women with Births | Births / 1,000 Women |
| Less than High School | 0 (0.0%) | 0.0 |
| High School Diploma | 0 (0.0%) | 0.0 |
| College or Associate's Degree | 10 (6.8%) | 74.0 |
| Bachelor's Degree | 19 (12.9%) | 35.0 |
| Graduate Degree | 118 (80.3%) | 198.0 |
| Total | 147 (100.0%) | 92.0 |
Fertility by Education by Marriage Status in Old Greenwich
21.8% of women with births in Old Greenwich are unmarried. Women with the educational attainment of college or associate's degree are most likely to be married with 100.0% of them married at childbirth, while women with the educational attainment of graduate degree are least likely to be married with 27.1% of them unmarried at childbirth.
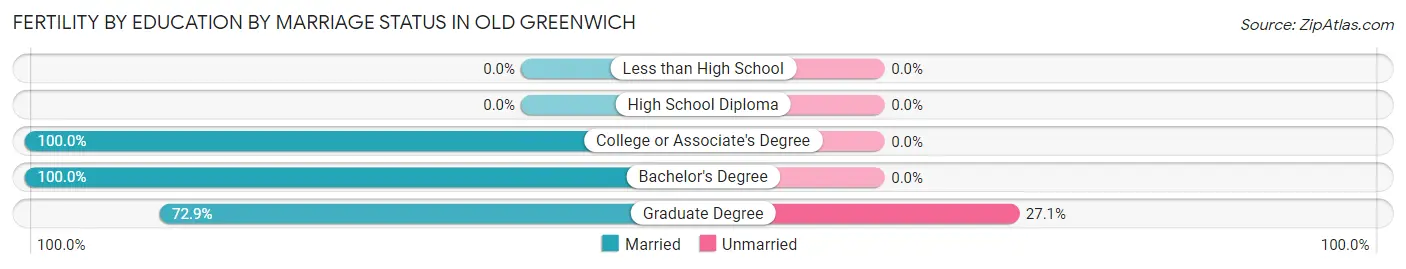
| Educational Attainment | Married | Unmarried |
| Less than High School | 0 (0.0%) | 0 (0.0%) |
| High School Diploma | 0 (0.0%) | 0 (0.0%) |
| College or Associate's Degree | 10 (100.0%) | 0 (0.0%) |
| Bachelor's Degree | 19 (100.0%) | 0 (0.0%) |
| Graduate Degree | 86 (72.9%) | 32 (27.1%) |
| Total | 115 (78.2%) | 32 (21.8%) |
Employment Characteristics in Old Greenwich
Employment by Class of Employer in Old Greenwich
Among the 2,848 employed individuals in Old Greenwich, private company employees (2,019 | 70.9%), self-employed (not incorporated) (315 | 11.1%), and self-employed (incorporated) (217 | 7.6%) make up the most common classes of employment.
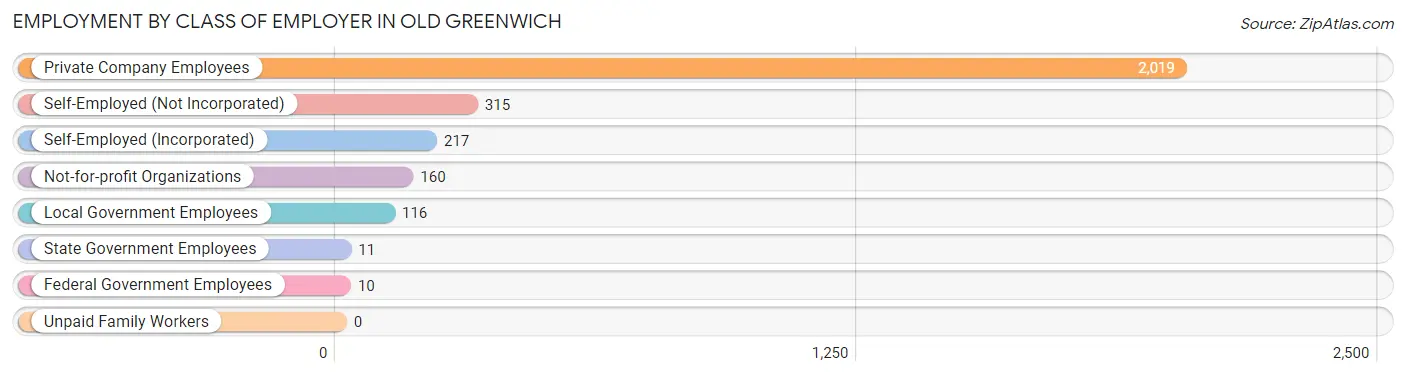
| Employer Class | # Employees | % Employees |
| Private Company Employees | 2,019 | 70.9% |
| Self-Employed (Incorporated) | 217 | 7.6% |
| Self-Employed (Not Incorporated) | 315 | 11.1% |
| Not-for-profit Organizations | 160 | 5.6% |
| Local Government Employees | 116 | 4.1% |
| State Government Employees | 11 | 0.4% |
| Federal Government Employees | 10 | 0.4% |
| Unpaid Family Workers | 0 | 0.0% |
| Total | 2,848 | 100.0% |
Employment Status by Age in Old Greenwich
According to the labor force statistics for Old Greenwich, out of the total population over 16 years of age (4,877), 63.2% or 3,082 individuals are in the labor force, with 4.5% or 139 of them unemployed. The age group with the highest labor force participation rate is 20 to 24 years, with 88.2% or 225 individuals in the labor force. Within the labor force, the 25 to 29 years age range has the highest percentage of unemployed individuals, with 50.0% or 8 of them being unemployed.
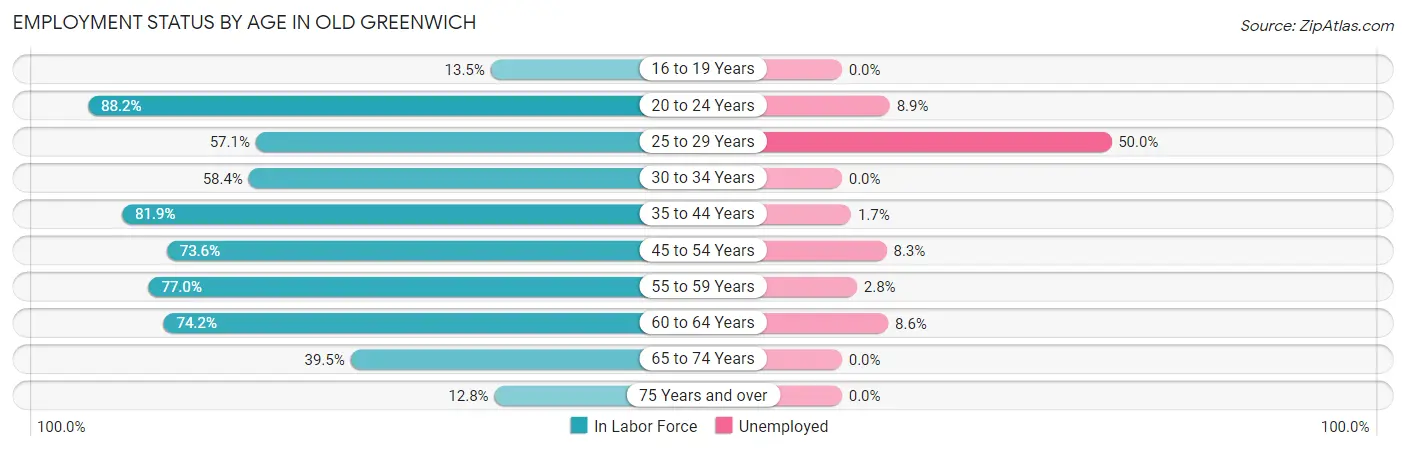
| Age Bracket | In Labor Force | Unemployed |
| 16 to 19 Years | 46 (13.5%) | 0 (0.0%) |
| 20 to 24 Years | 225 (88.2%) | 20 (8.9%) |
| 25 to 29 Years | 16 (57.1%) | 8 (50.0%) |
| 30 to 34 Years | 45 (58.4%) | 0 (0.0%) |
| 35 to 44 Years | 1,039 (81.9%) | 18 (1.7%) |
| 45 to 54 Years | 732 (73.6%) | 61 (8.3%) |
| 55 to 59 Years | 463 (77.0%) | 13 (2.8%) |
| 60 to 64 Years | 233 (74.2%) | 20 (8.6%) |
| 65 to 74 Years | 227 (39.5%) | 0 (0.0%) |
| 75 Years and over | 54 (12.8%) | 0 (0.0%) |
| Total | 3,082 (63.2%) | 139 (4.5%) |
Employment Status by Educational Attainment in Old Greenwich
According to labor force statistics for Old Greenwich, 77.0% of individuals (2,529) out of the total population between 25 and 64 years of age (3,284) are in the labor force, with 4.7% or 119 of them being unemployed. The group with the highest labor force participation rate are those with the educational attainment of less than high school, with 88.6% or 39 individuals in the labor force. Within the labor force, individuals with college / associate degree education have the highest percentage of unemployment, with 8.5% or 10 of them being unemployed.
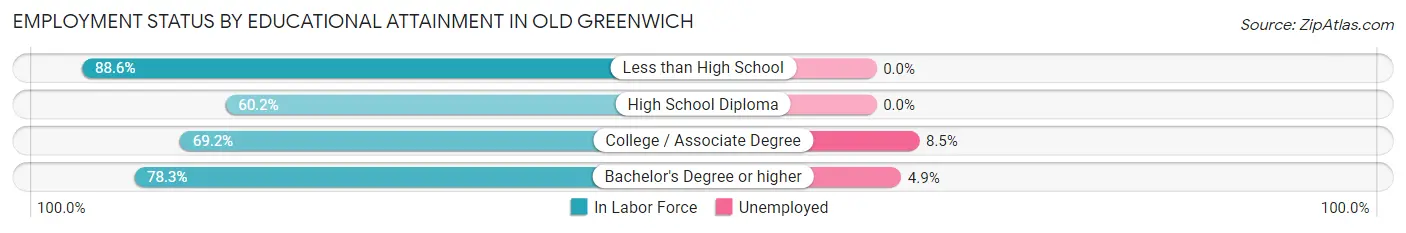
| Educational Attainment | In Labor Force | Unemployed |
| Less than High School | 39 (88.6%) | 0 (0.0%) |
| High School Diploma | 112 (60.2%) | 0 (0.0%) |
| College / Associate Degree | 117 (69.2%) | 14 (8.5%) |
| Bachelor's Degree or higher | 2,259 (78.3%) | 141 (4.9%) |
| Total | 2,529 (77.0%) | 154 (4.7%) |
Employment Occupations by Sex in Old Greenwich
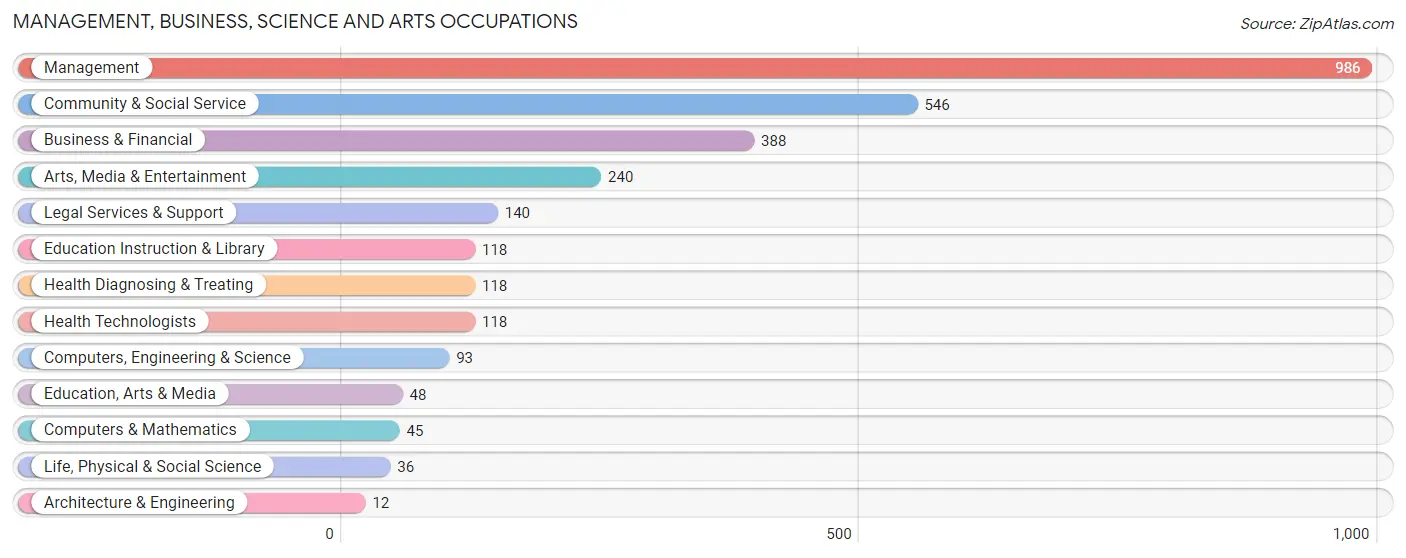
Management, Business, Science and Arts Occupations
The most common Management, Business, Science and Arts occupations in Old Greenwich are Management (986 | 33.5%), Community & Social Service (546 | 18.6%), Business & Financial (388 | 13.2%), Arts, Media & Entertainment (240 | 8.2%), and Legal Services & Support (140 | 4.8%).
Management, Business, Science and Arts Occupations by Sex
Within the Management, Business, Science and Arts occupations in Old Greenwich, the most male-oriented occupations are Computers & Mathematics (100.0%), Life, Physical & Social Science (83.3%), and Computers, Engineering & Science (80.6%), while the most female-oriented occupations are Architecture & Engineering (100.0%), Education, Arts & Media (100.0%), and Education Instruction & Library (94.9%).
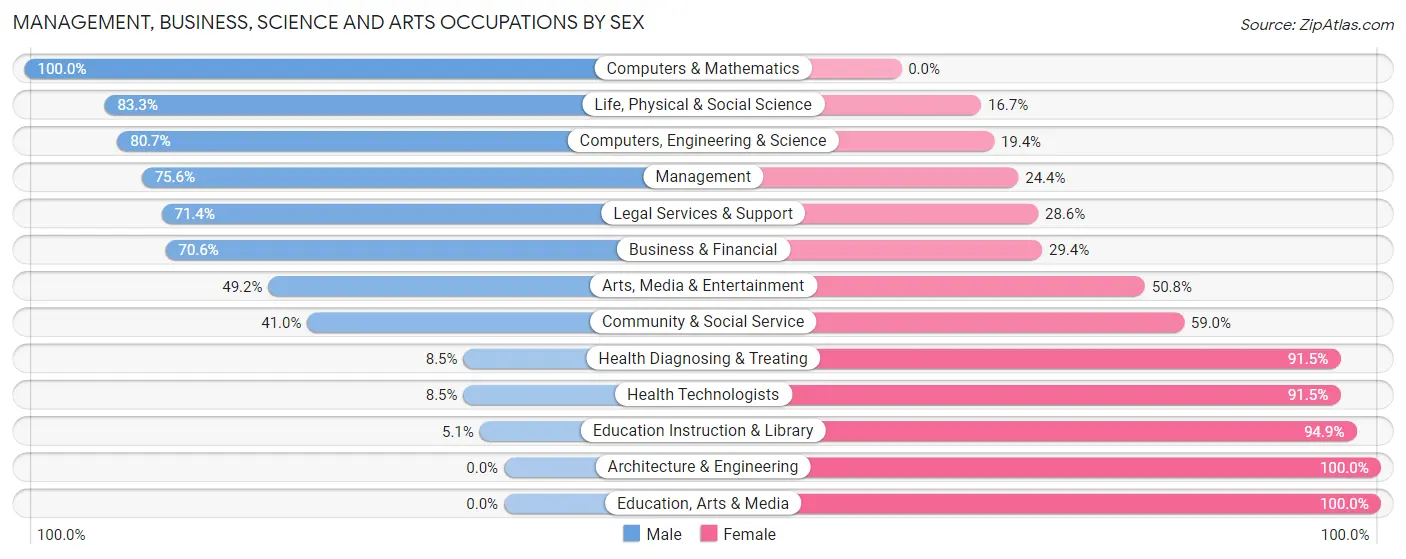
| Occupation | Male | Female |
| Management | 745 (75.6%) | 241 (24.4%) |
| Business & Financial | 274 (70.6%) | 114 (29.4%) |
| Computers, Engineering & Science | 75 (80.6%) | 18 (19.4%) |
| Computers & Mathematics | 45 (100.0%) | 0 (0.0%) |
| Architecture & Engineering | 0 (0.0%) | 12 (100.0%) |
| Life, Physical & Social Science | 30 (83.3%) | 6 (16.7%) |
| Community & Social Service | 224 (41.0%) | 322 (59.0%) |
| Education, Arts & Media | 0 (0.0%) | 48 (100.0%) |
| Legal Services & Support | 100 (71.4%) | 40 (28.6%) |
| Education Instruction & Library | 6 (5.1%) | 112 (94.9%) |
| Arts, Media & Entertainment | 118 (49.2%) | 122 (50.8%) |
| Health Diagnosing & Treating | 10 (8.5%) | 108 (91.5%) |
| Health Technologists | 10 (8.5%) | 108 (91.5%) |
| Total (Category) | 1,328 (62.3%) | 803 (37.7%) |
| Total (Overall) | 1,692 (57.6%) | 1,248 (42.4%) |
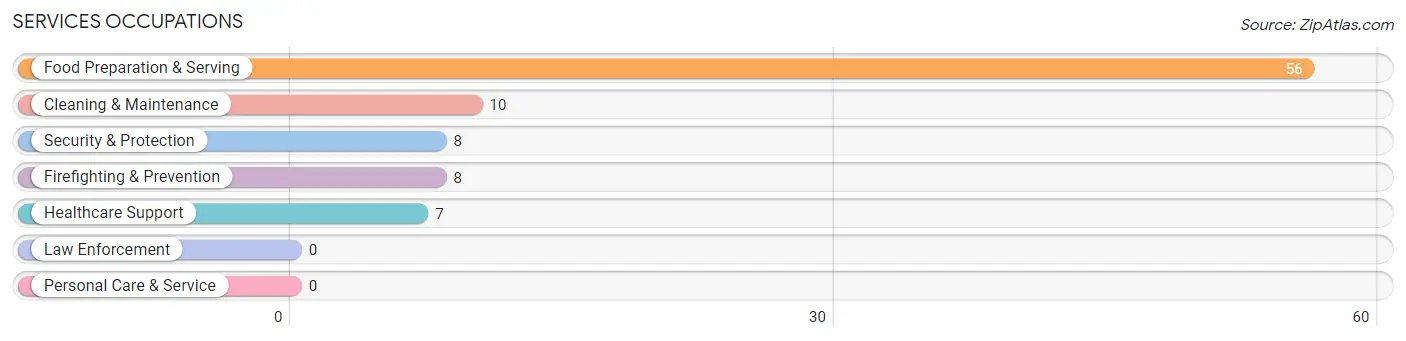
Services Occupations
The most common Services occupations in Old Greenwich are Food Preparation & Serving (56 | 1.9%), Cleaning & Maintenance (10 | 0.3%), Security & Protection (8 | 0.3%), Firefighting & Prevention (8 | 0.3%), and Healthcare Support (7 | 0.2%).
Services Occupations by Sex
Within the Services occupations in Old Greenwich, the most male-oriented occupations are Healthcare Support (100.0%), Security & Protection (100.0%), and Firefighting & Prevention (100.0%), while the most female-oriented occupations are Food Preparation & Serving (100.0%), and Cleaning & Maintenance (80.0%).
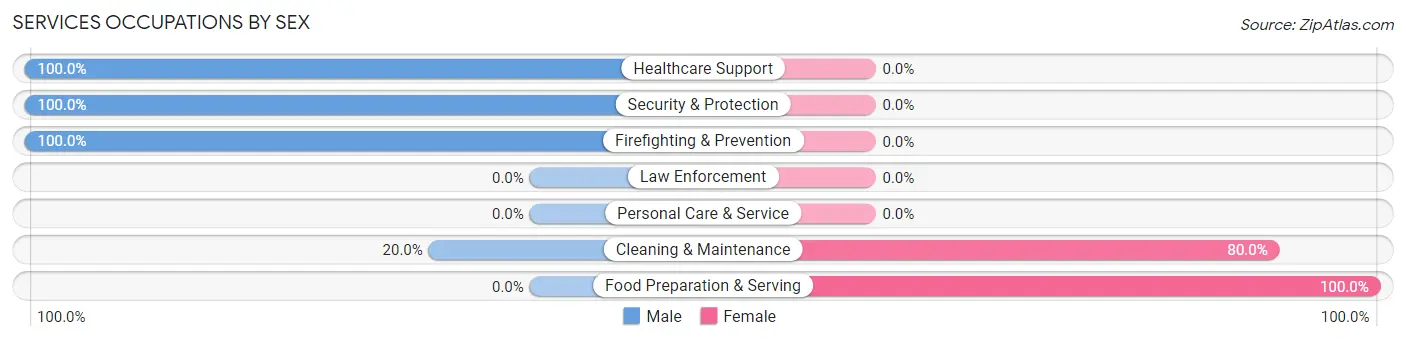
| Occupation | Male | Female |
| Healthcare Support | 7 (100.0%) | 0 (0.0%) |
| Security & Protection | 8 (100.0%) | 0 (0.0%) |
| Firefighting & Prevention | 8 (100.0%) | 0 (0.0%) |
| Law Enforcement | 0 (0.0%) | 0 (0.0%) |
| Food Preparation & Serving | 0 (0.0%) | 56 (100.0%) |
| Cleaning & Maintenance | 2 (20.0%) | 8 (80.0%) |
| Personal Care & Service | 0 (0.0%) | 0 (0.0%) |
| Total (Category) | 17 (21.0%) | 64 (79.0%) |
| Total (Overall) | 1,692 (57.6%) | 1,248 (42.4%) |
Sales and Office Occupations
The most common Sales and Office occupations in Old Greenwich are Sales & Related (483 | 16.4%), and Office & Administration (126 | 4.3%).
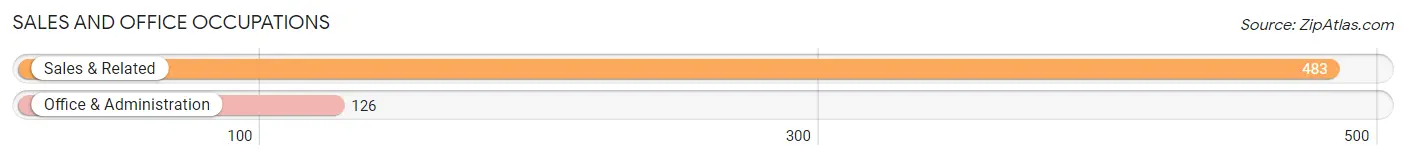
Sales and Office Occupations by Sex
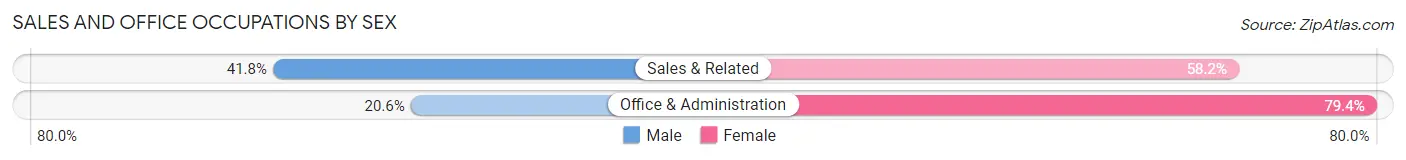
| Occupation | Male | Female |
| Sales & Related | 202 (41.8%) | 281 (58.2%) |
| Office & Administration | 26 (20.6%) | 100 (79.4%) |
| Total (Category) | 228 (37.4%) | 381 (62.6%) |
| Total (Overall) | 1,692 (57.6%) | 1,248 (42.4%) |
Natural Resources, Construction and Maintenance Occupations
The most common Natural Resources, Construction and Maintenance occupations in Old Greenwich are , and Construction & Extraction (63 | 2.1%).
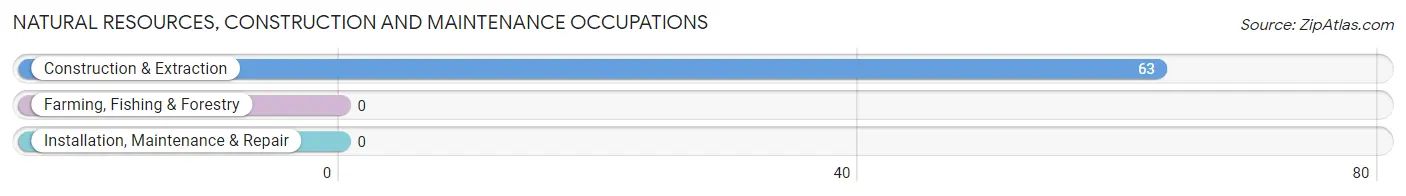
Natural Resources, Construction and Maintenance Occupations by Sex
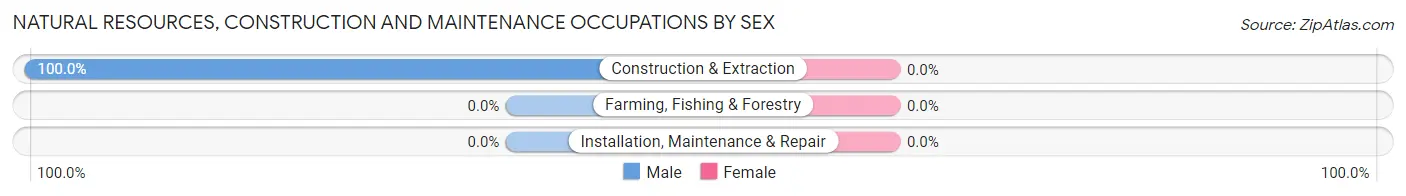
| Occupation | Male | Female |
| Farming, Fishing & Forestry | 0 (0.0%) | 0 (0.0%) |
| Construction & Extraction | 63 (100.0%) | 0 (0.0%) |
| Installation, Maintenance & Repair | 0 (0.0%) | 0 (0.0%) |
| Total (Category) | 63 (100.0%) | 0 (0.0%) |
| Total (Overall) | 1,692 (57.6%) | 1,248 (42.4%) |
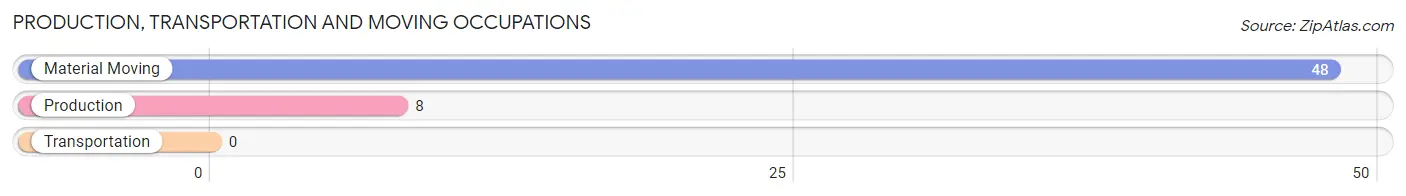
Production, Transportation and Moving Occupations
The most common Production, Transportation and Moving occupations in Old Greenwich are Material Moving (48 | 1.6%), and Production (8 | 0.3%).
Production, Transportation and Moving Occupations by Sex
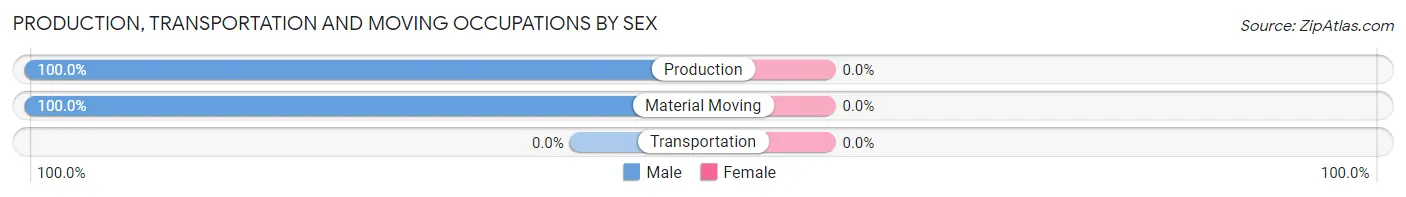
| Occupation | Male | Female |
| Production | 8 (100.0%) | 0 (0.0%) |
| Transportation | 0 (0.0%) | 0 (0.0%) |
| Material Moving | 48 (100.0%) | 0 (0.0%) |
| Total (Category) | 56 (100.0%) | 0 (0.0%) |
| Total (Overall) | 1,692 (57.6%) | 1,248 (42.4%) |
Employment Industries by Sex in Old Greenwich
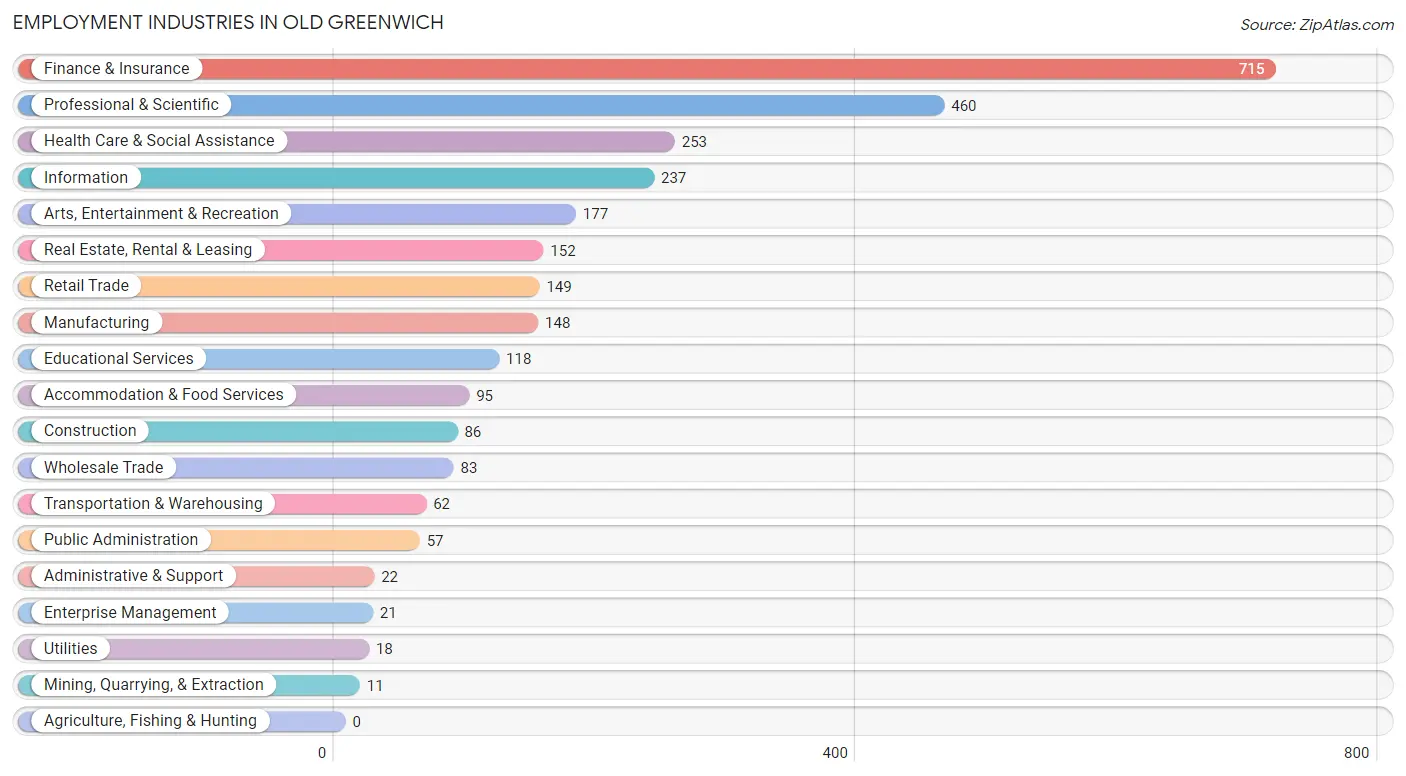
Employment Industries in Old Greenwich
The major employment industries in Old Greenwich include Finance & Insurance (715 | 24.3%), Professional & Scientific (460 | 15.7%), Health Care & Social Assistance (253 | 8.6%), Information (237 | 8.1%), and Arts, Entertainment & Recreation (177 | 6.0%).
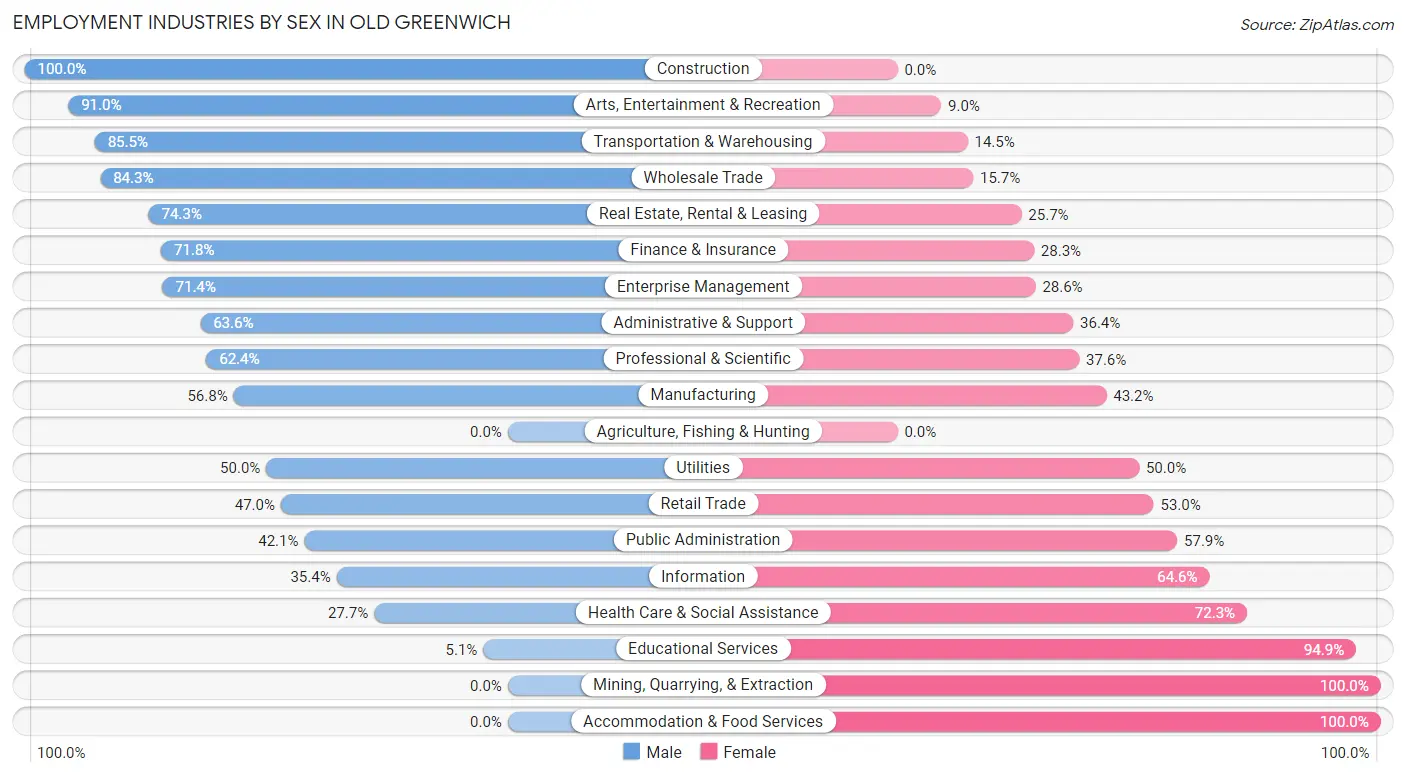
Employment Industries by Sex in Old Greenwich
The Old Greenwich industries that see more men than women are Construction (100.0%), Arts, Entertainment & Recreation (91.0%), and Transportation & Warehousing (85.5%), whereas the industries that tend to have a higher number of women are Mining, Quarrying, & Extraction (100.0%), Accommodation & Food Services (100.0%), and Educational Services (94.9%).
| Industry | Male | Female |
| Agriculture, Fishing & Hunting | 0 (0.0%) | 0 (0.0%) |
| Mining, Quarrying, & Extraction | 0 (0.0%) | 11 (100.0%) |
| Construction | 86 (100.0%) | 0 (0.0%) |
| Manufacturing | 84 (56.8%) | 64 (43.2%) |
| Wholesale Trade | 70 (84.3%) | 13 (15.7%) |
| Retail Trade | 70 (47.0%) | 79 (53.0%) |
| Transportation & Warehousing | 53 (85.5%) | 9 (14.5%) |
| Utilities | 9 (50.0%) | 9 (50.0%) |
| Information | 84 (35.4%) | 153 (64.6%) |
| Finance & Insurance | 513 (71.8%) | 202 (28.2%) |
| Real Estate, Rental & Leasing | 113 (74.3%) | 39 (25.7%) |
| Professional & Scientific | 287 (62.4%) | 173 (37.6%) |
| Enterprise Management | 15 (71.4%) | 6 (28.6%) |
| Administrative & Support | 14 (63.6%) | 8 (36.4%) |
| Educational Services | 6 (5.1%) | 112 (94.9%) |
| Health Care & Social Assistance | 70 (27.7%) | 183 (72.3%) |
| Arts, Entertainment & Recreation | 161 (91.0%) | 16 (9.0%) |
| Accommodation & Food Services | 0 (0.0%) | 95 (100.0%) |
| Public Administration | 24 (42.1%) | 33 (57.9%) |
| Total | 1,692 (57.6%) | 1,248 (42.4%) |
Education in Old Greenwich
School Enrollment in Old Greenwich
The most common levels of schooling among the 2,365 students in Old Greenwich are elementary school (685 | 29.0%), middle school (508 | 21.5%), and high school (468 | 19.8%).
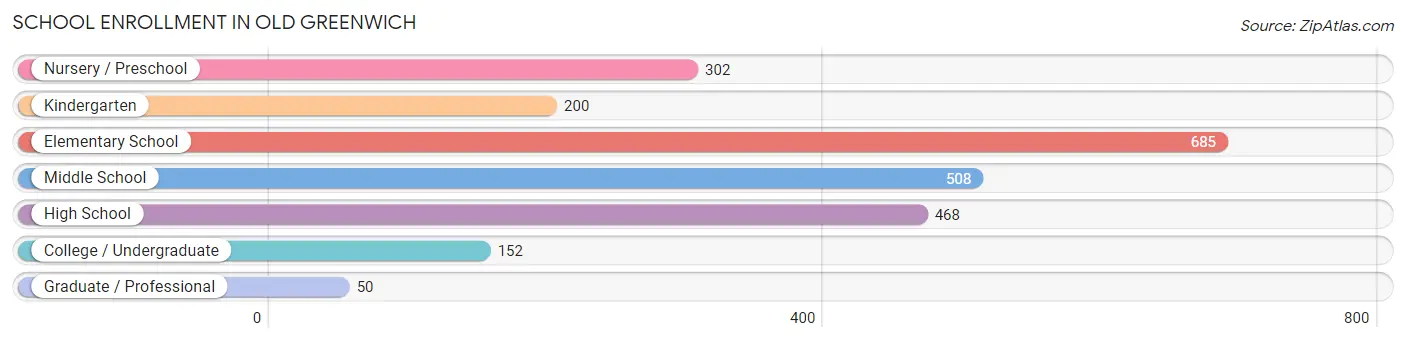
| School Level | # Students | % Students |
| Nursery / Preschool | 302 | 12.8% |
| Kindergarten | 200 | 8.5% |
| Elementary School | 685 | 29.0% |
| Middle School | 508 | 21.5% |
| High School | 468 | 19.8% |
| College / Undergraduate | 152 | 6.4% |
| Graduate / Professional | 50 | 2.1% |
| Total | 2,365 | 100.0% |
School Enrollment by Age by Funding Source in Old Greenwich
Out of a total of 2,365 students who are enrolled in schools in Old Greenwich, 686 (29.0%) attend a private institution, while the remaining 1,679 (71.0%) are enrolled in public schools. The age group of 18 to 19 year olds has the highest likelihood of being enrolled in private schools, with 162 (100.0% in the age bracket) enrolled. Conversely, the age group of 15 to 17 year olds has the lowest likelihood of being enrolled in a private school, with 284 (92.2% in the age bracket) attending a public institution.
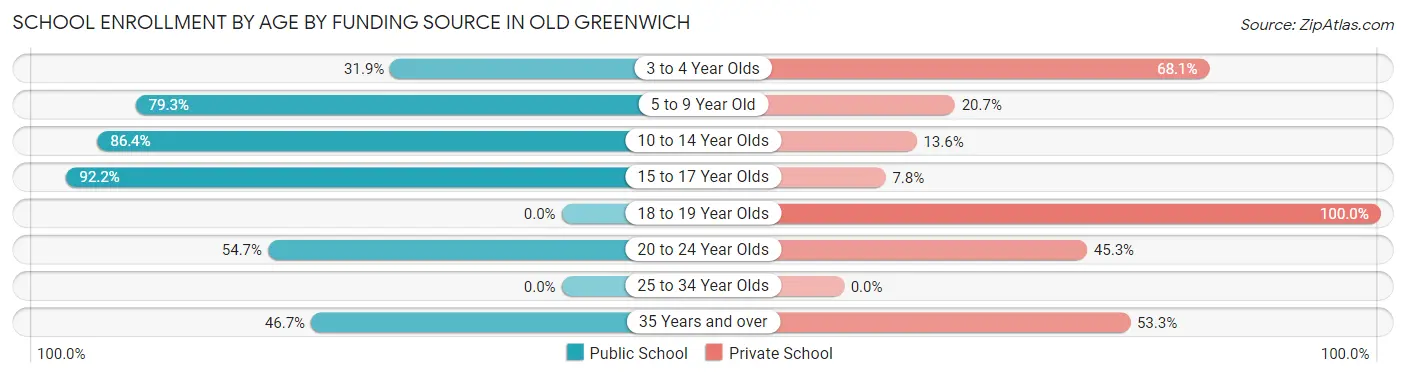
| Age Bracket | Public School | Private School |
| 3 to 4 Year Olds | 75 (31.9%) | 160 (68.1%) |
| 5 to 9 Year Old | 709 (79.3%) | 185 (20.7%) |
| 10 to 14 Year Olds | 542 (86.4%) | 85 (13.6%) |
| 15 to 17 Year Olds | 284 (92.2%) | 24 (7.8%) |
| 18 to 19 Year Olds | 0 (0.0%) | 162 (100.0%) |
| 20 to 24 Year Olds | 35 (54.7%) | 29 (45.3%) |
| 25 to 34 Year Olds | 0 (0.0%) | 0 (0.0%) |
| 35 Years and over | 35 (46.7%) | 40 (53.3%) |
| Total | 1,679 (71.0%) | 686 (29.0%) |
Educational Attainment by Field of Study in Old Greenwich
Business (903 | 21.9%), social sciences (888 | 21.5%), communications (367 | 8.9%), literature & languages (317 | 7.7%), and science & technology (233 | 5.7%) are the most common fields of study among 4,122 individuals in Old Greenwich who have obtained a bachelor's degree or higher.
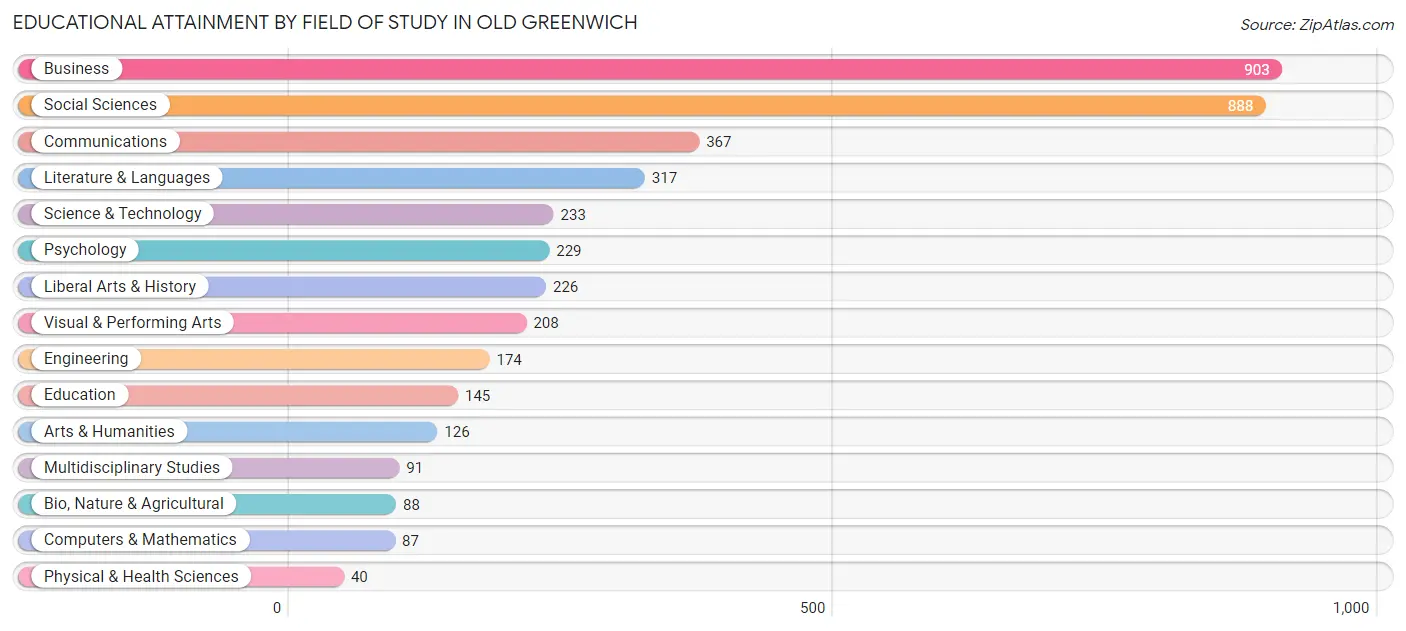
| Field of Study | # Graduates | % Graduates |
| Computers & Mathematics | 87 | 2.1% |
| Bio, Nature & Agricultural | 88 | 2.1% |
| Physical & Health Sciences | 40 | 1.0% |
| Psychology | 229 | 5.6% |
| Social Sciences | 888 | 21.5% |
| Engineering | 174 | 4.2% |
| Multidisciplinary Studies | 91 | 2.2% |
| Science & Technology | 233 | 5.7% |
| Business | 903 | 21.9% |
| Education | 145 | 3.5% |
| Literature & Languages | 317 | 7.7% |
| Liberal Arts & History | 226 | 5.5% |
| Visual & Performing Arts | 208 | 5.1% |
| Communications | 367 | 8.9% |
| Arts & Humanities | 126 | 3.1% |
| Total | 4,122 | 100.0% |
Transportation & Commute in Old Greenwich
Vehicle Availability by Sex in Old Greenwich
The most prevalent vehicle ownership categories in Old Greenwich are males with 2 vehicles (943, accounting for 57.1%) and females with 2 vehicles (596, making up 78.9%).
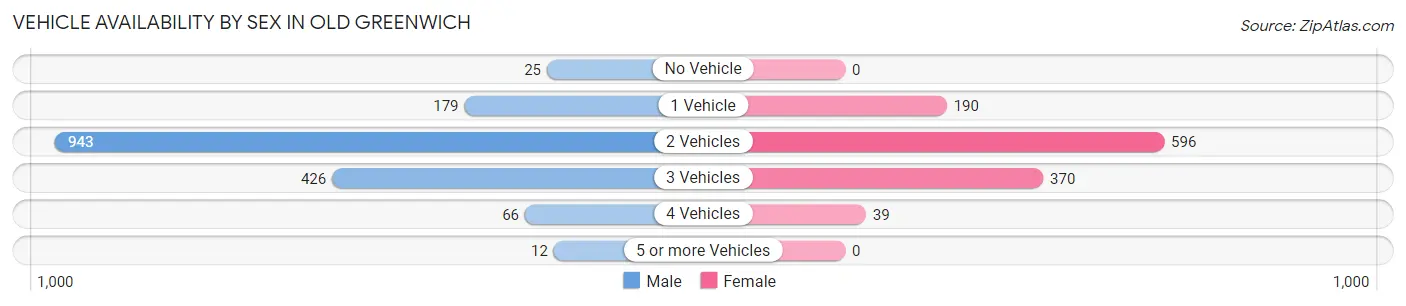
| Vehicles Available | Male | Female |
| No Vehicle | 25 (1.5%) | 0 (0.0%) |
| 1 Vehicle | 179 (10.8%) | 190 (15.9%) |
| 2 Vehicles | 943 (57.1%) | 596 (49.9%) |
| 3 Vehicles | 426 (25.8%) | 370 (31.0%) |
| 4 Vehicles | 66 (4.0%) | 39 (3.3%) |
| 5 or more Vehicles | 12 (0.7%) | 0 (0.0%) |
| Total | 1,651 (100.0%) | 1,195 (100.0%) |
Commute Time in Old Greenwich
The most frequently occuring commute durations in Old Greenwich are 60 to 89 minutes (418 commuters, 21.9%), 10 to 14 minutes (305 commuters, 16.0%), and 15 to 19 minutes (262 commuters, 13.7%).
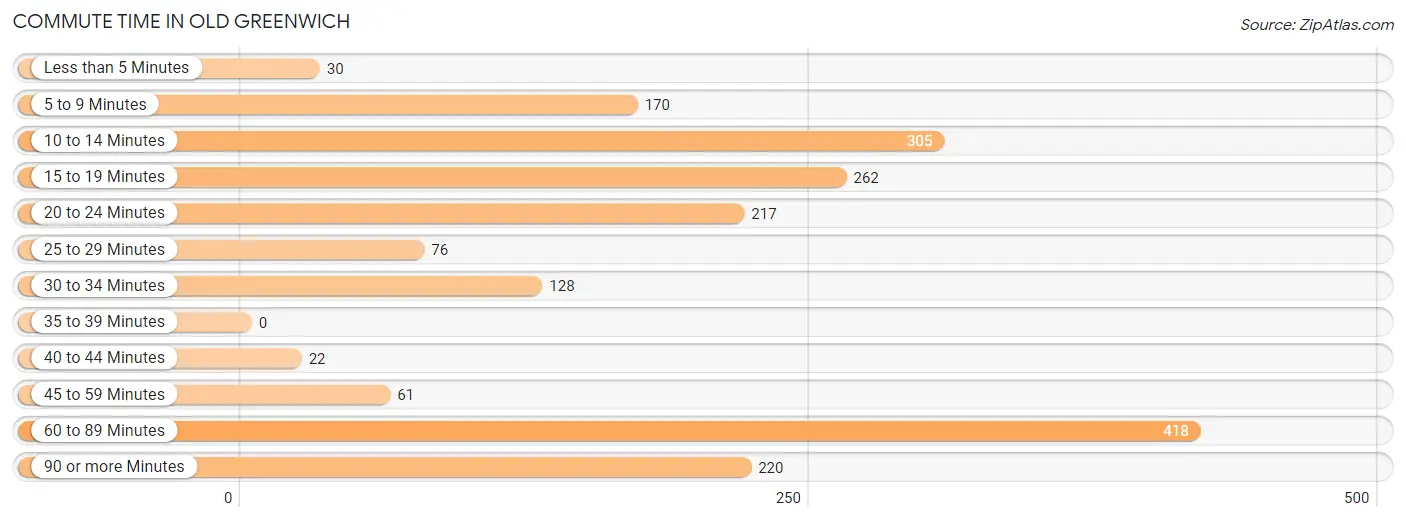
| Commute Time | # Commuters | % Commuters |
| Less than 5 Minutes | 30 | 1.6% |
| 5 to 9 Minutes | 170 | 8.9% |
| 10 to 14 Minutes | 305 | 16.0% |
| 15 to 19 Minutes | 262 | 13.7% |
| 20 to 24 Minutes | 217 | 11.4% |
| 25 to 29 Minutes | 76 | 4.0% |
| 30 to 34 Minutes | 128 | 6.7% |
| 35 to 39 Minutes | 0 | 0.0% |
| 40 to 44 Minutes | 22 | 1.1% |
| 45 to 59 Minutes | 61 | 3.2% |
| 60 to 89 Minutes | 418 | 21.9% |
| 90 or more Minutes | 220 | 11.5% |
Commute Time by Sex in Old Greenwich
The most common commute times in Old Greenwich are 60 to 89 minutes (324 commuters, 26.3%) for males and 5 to 9 minutes (127 commuters, 18.8%) for females.
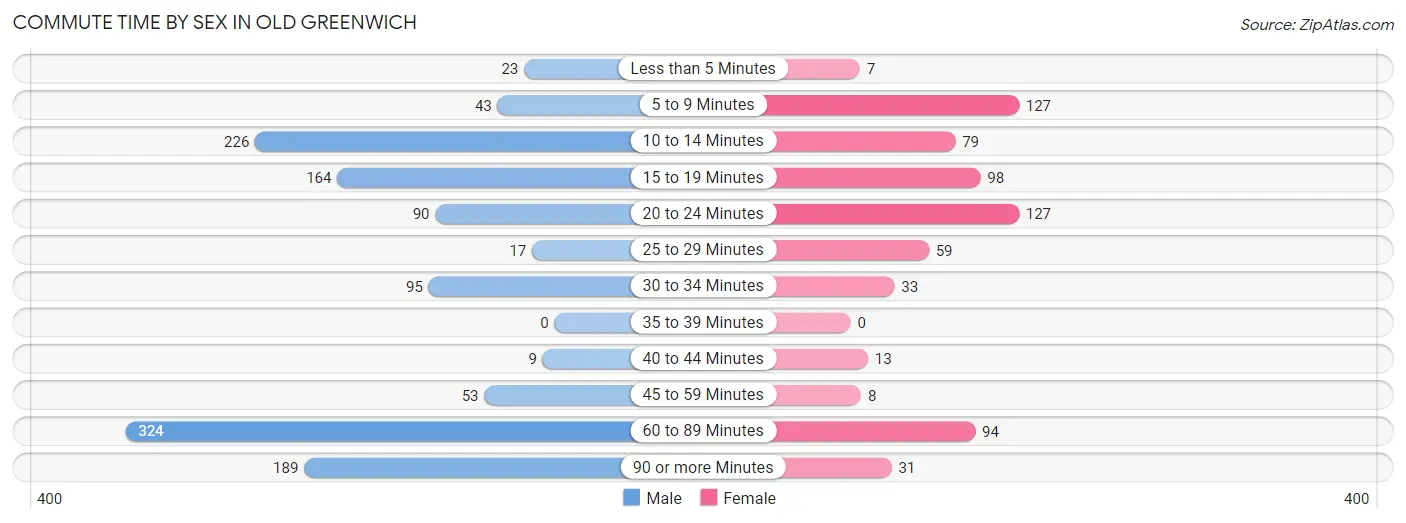
| Commute Time | Male | Female |
| Less than 5 Minutes | 23 (1.9%) | 7 (1.0%) |
| 5 to 9 Minutes | 43 (3.5%) | 127 (18.8%) |
| 10 to 14 Minutes | 226 (18.3%) | 79 (11.7%) |
| 15 to 19 Minutes | 164 (13.3%) | 98 (14.5%) |
| 20 to 24 Minutes | 90 (7.3%) | 127 (18.8%) |
| 25 to 29 Minutes | 17 (1.4%) | 59 (8.7%) |
| 30 to 34 Minutes | 95 (7.7%) | 33 (4.9%) |
| 35 to 39 Minutes | 0 (0.0%) | 0 (0.0%) |
| 40 to 44 Minutes | 9 (0.7%) | 13 (1.9%) |
| 45 to 59 Minutes | 53 (4.3%) | 8 (1.2%) |
| 60 to 89 Minutes | 324 (26.3%) | 94 (13.9%) |
| 90 or more Minutes | 189 (15.3%) | 31 (4.6%) |
Time of Departure to Work by Sex in Old Greenwich
The most frequent times of departure to work in Old Greenwich are 7:30 AM to 7:59 AM (305, 24.7%) for males and 7:30 AM to 7:59 AM (129, 19.1%) for females.
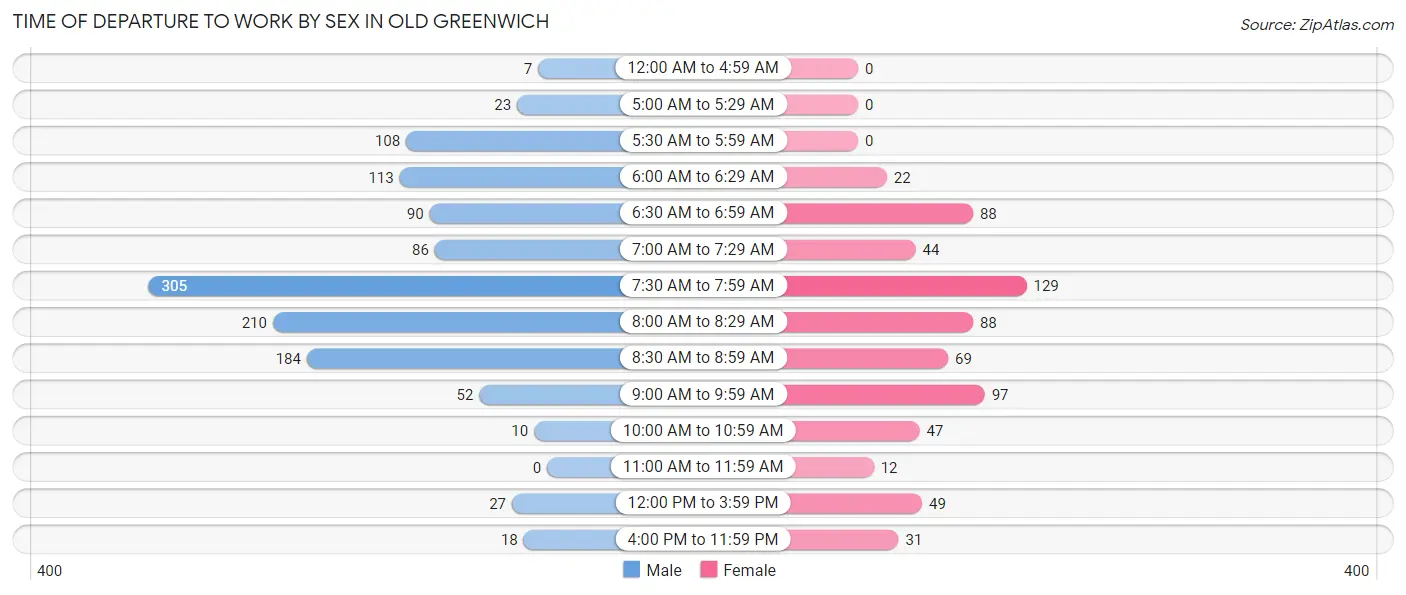
| Time of Departure | Male | Female |
| 12:00 AM to 4:59 AM | 7 (0.6%) | 0 (0.0%) |
| 5:00 AM to 5:29 AM | 23 (1.9%) | 0 (0.0%) |
| 5:30 AM to 5:59 AM | 108 (8.8%) | 0 (0.0%) |
| 6:00 AM to 6:29 AM | 113 (9.2%) | 22 (3.3%) |
| 6:30 AM to 6:59 AM | 90 (7.3%) | 88 (13.0%) |
| 7:00 AM to 7:29 AM | 86 (7.0%) | 44 (6.5%) |
| 7:30 AM to 7:59 AM | 305 (24.7%) | 129 (19.1%) |
| 8:00 AM to 8:29 AM | 210 (17.0%) | 88 (13.0%) |
| 8:30 AM to 8:59 AM | 184 (14.9%) | 69 (10.2%) |
| 9:00 AM to 9:59 AM | 52 (4.2%) | 97 (14.3%) |
| 10:00 AM to 10:59 AM | 10 (0.8%) | 47 (7.0%) |
| 11:00 AM to 11:59 AM | 0 (0.0%) | 12 (1.8%) |
| 12:00 PM to 3:59 PM | 27 (2.2%) | 49 (7.2%) |
| 4:00 PM to 11:59 PM | 18 (1.5%) | 31 (4.6%) |
| Total | 1,233 (100.0%) | 676 (100.0%) |
Housing Occupancy in Old Greenwich
Occupancy by Ownership in Old Greenwich
Of the total 2,321 dwellings in Old Greenwich, owner-occupied units account for 1,935 (83.4%), while renter-occupied units make up 386 (16.6%).
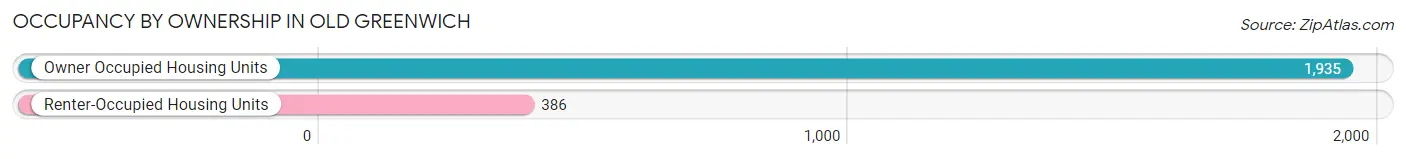
| Occupancy | # Housing Units | % Housing Units |
| Owner Occupied Housing Units | 1,935 | 83.4% |
| Renter-Occupied Housing Units | 386 | 16.6% |
| Total Occupied Housing Units | 2,321 | 100.0% |
Occupancy by Household Size in Old Greenwich
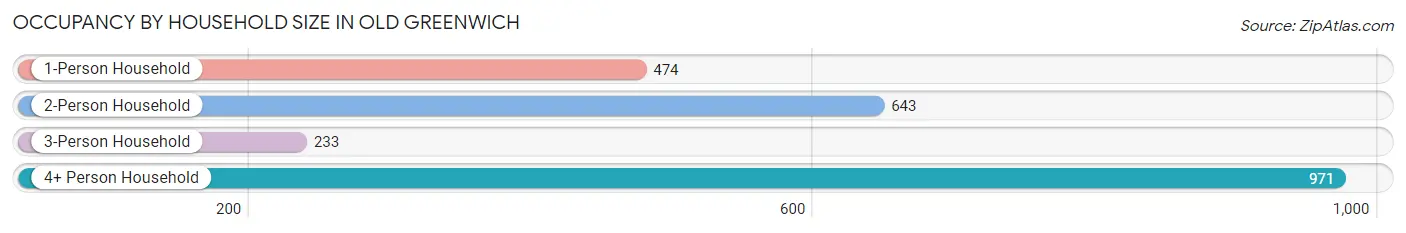
| Household Size | # Housing Units | % Housing Units |
| 1-Person Household | 474 | 20.4% |
| 2-Person Household | 643 | 27.7% |
| 3-Person Household | 233 | 10.0% |
| 4+ Person Household | 971 | 41.8% |
| Total Housing Units | 2,321 | 100.0% |
Occupancy by Ownership by Household Size in Old Greenwich
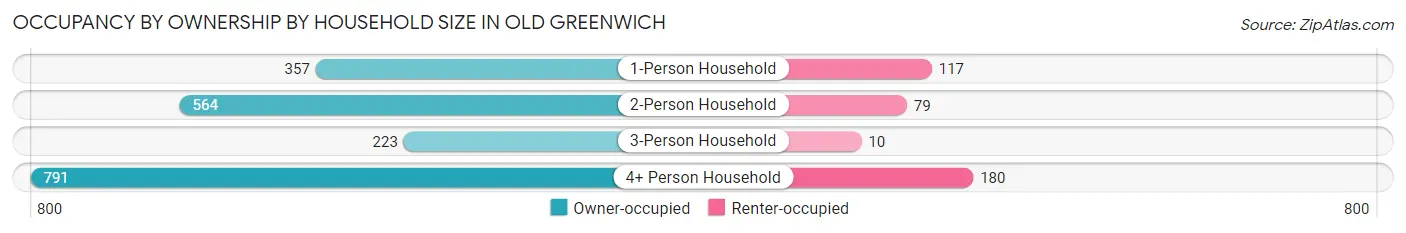
| Household Size | Owner-occupied | Renter-occupied |
| 1-Person Household | 357 (75.3%) | 117 (24.7%) |
| 2-Person Household | 564 (87.7%) | 79 (12.3%) |
| 3-Person Household | 223 (95.7%) | 10 (4.3%) |
| 4+ Person Household | 791 (81.5%) | 180 (18.5%) |
| Total Housing Units | 1,935 (83.4%) | 386 (16.6%) |
Occupancy by Educational Attainment in Old Greenwich
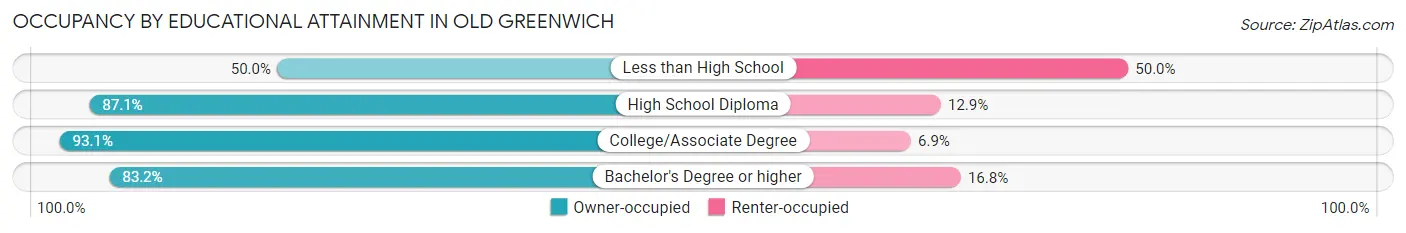
| Household Size | Owner-occupied | Renter-occupied |
| Less than High School | 17 (50.0%) | 17 (50.0%) |
| High School Diploma | 122 (87.1%) | 18 (12.9%) |
| College/Associate Degree | 94 (93.1%) | 7 (6.9%) |
| Bachelor's Degree or higher | 1,702 (83.2%) | 344 (16.8%) |
Occupancy by Age of Householder in Old Greenwich
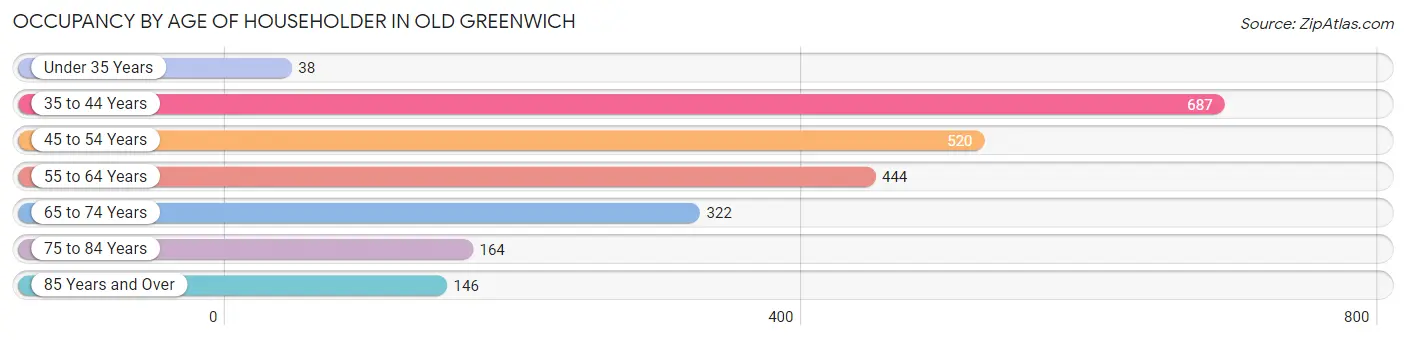
| Age Bracket | # Households | % Households |
| Under 35 Years | 38 | 1.6% |
| 35 to 44 Years | 687 | 29.6% |
| 45 to 54 Years | 520 | 22.4% |
| 55 to 64 Years | 444 | 19.1% |
| 65 to 74 Years | 322 | 13.9% |
| 75 to 84 Years | 164 | 7.1% |
| 85 Years and Over | 146 | 6.3% |
| Total | 2,321 | 100.0% |
Housing Finances in Old Greenwich
Median Income by Occupancy in Old Greenwich
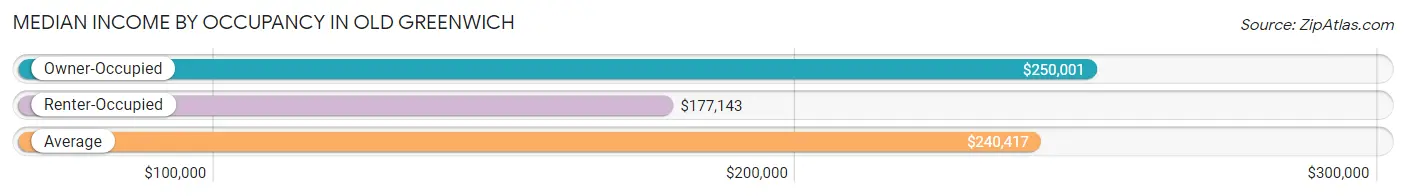
| Occupancy Type | # Households | Median Income |
| Owner-Occupied | 1,935 (83.4%) | $250,001 |
| Renter-Occupied | 386 (16.6%) | $177,143 |
| Average | 2,321 (100.0%) | $240,417 |
Occupancy by Householder Income Bracket in Old Greenwich
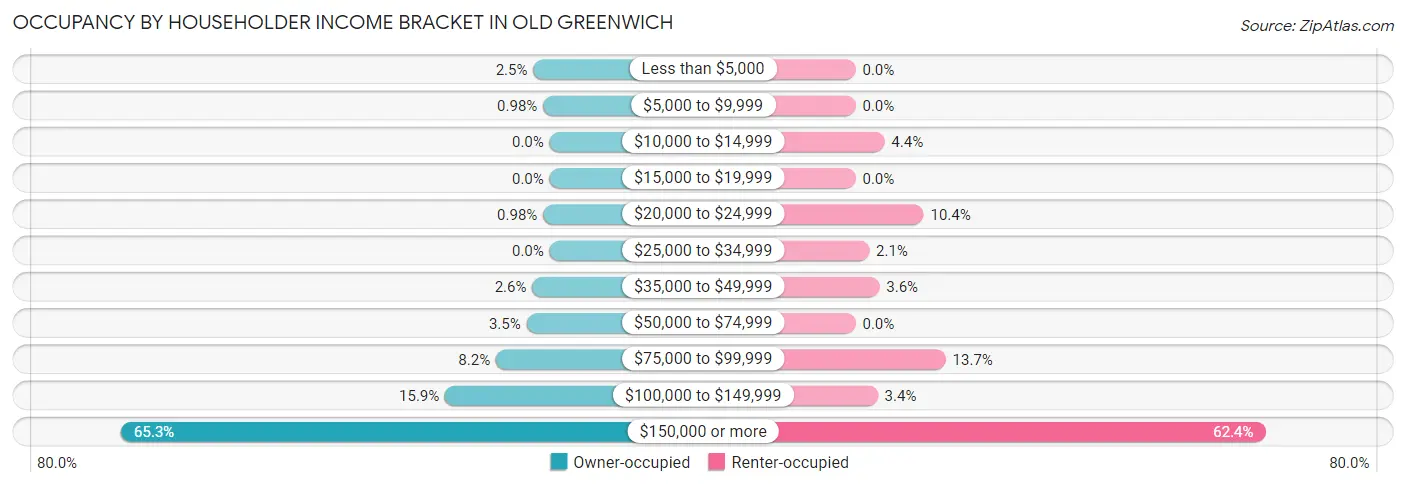
| Income Bracket | Owner-occupied | Renter-occupied |
| Less than $5,000 | 48 (2.5%) | 0 (0.0%) |
| $5,000 to $9,999 | 19 (1.0%) | 0 (0.0%) |
| $10,000 to $14,999 | 0 (0.0%) | 17 (4.4%) |
| $15,000 to $19,999 | 0 (0.0%) | 0 (0.0%) |
| $20,000 to $24,999 | 19 (1.0%) | 40 (10.4%) |
| $25,000 to $34,999 | 0 (0.0%) | 8 (2.1%) |
| $35,000 to $49,999 | 51 (2.6%) | 14 (3.6%) |
| $50,000 to $74,999 | 68 (3.5%) | 0 (0.0%) |
| $75,000 to $99,999 | 158 (8.2%) | 53 (13.7%) |
| $100,000 to $149,999 | 308 (15.9%) | 13 (3.4%) |
| $150,000 or more | 1,264 (65.3%) | 241 (62.4%) |
| Total | 1,935 (100.0%) | 386 (100.0%) |
Monthly Housing Cost Tiers in Old Greenwich
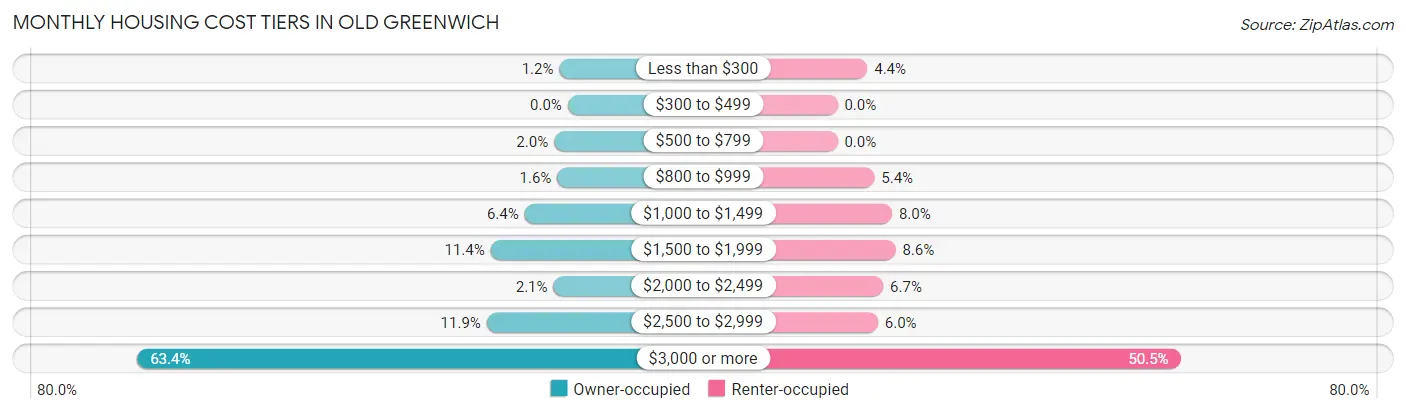
| Monthly Cost | Owner-occupied | Renter-occupied |
| Less than $300 | 24 (1.2%) | 17 (4.4%) |
| $300 to $499 | 0 (0.0%) | 0 (0.0%) |
| $500 to $799 | 39 (2.0%) | 0 (0.0%) |
| $800 to $999 | 30 (1.5%) | 21 (5.4%) |
| $1,000 to $1,499 | 123 (6.4%) | 31 (8.0%) |
| $1,500 to $1,999 | 220 (11.4%) | 33 (8.6%) |
| $2,000 to $2,499 | 41 (2.1%) | 26 (6.7%) |
| $2,500 to $2,999 | 231 (11.9%) | 23 (6.0%) |
| $3,000 or more | 1,227 (63.4%) | 195 (50.5%) |
| Total | 1,935 (100.0%) | 386 (100.0%) |
Physical Housing Characteristics in Old Greenwich
Housing Structures in Old Greenwich
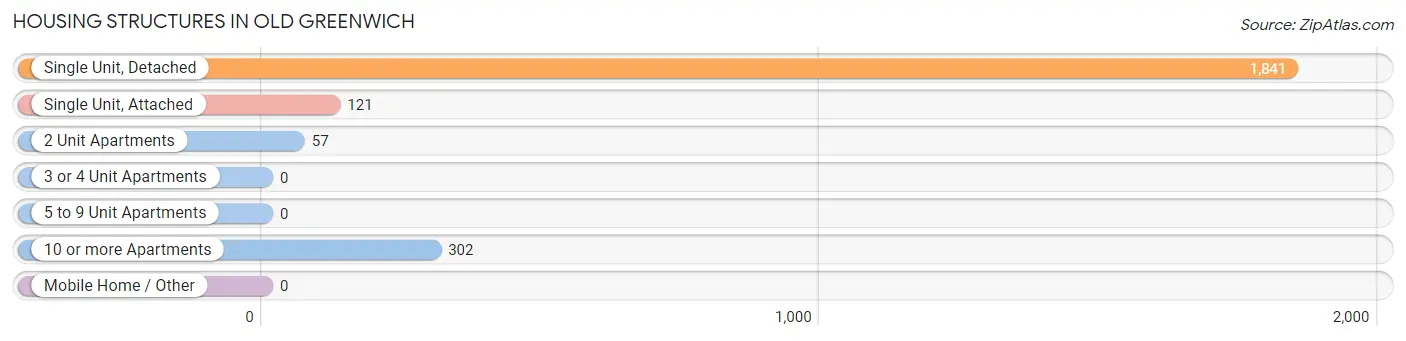
| Structure Type | # Housing Units | % Housing Units |
| Single Unit, Detached | 1,841 | 79.3% |
| Single Unit, Attached | 121 | 5.2% |
| 2 Unit Apartments | 57 | 2.5% |
| 3 or 4 Unit Apartments | 0 | 0.0% |
| 5 to 9 Unit Apartments | 0 | 0.0% |
| 10 or more Apartments | 302 | 13.0% |
| Mobile Home / Other | 0 | 0.0% |
| Total | 2,321 | 100.0% |
Housing Structures by Occupancy in Old Greenwich
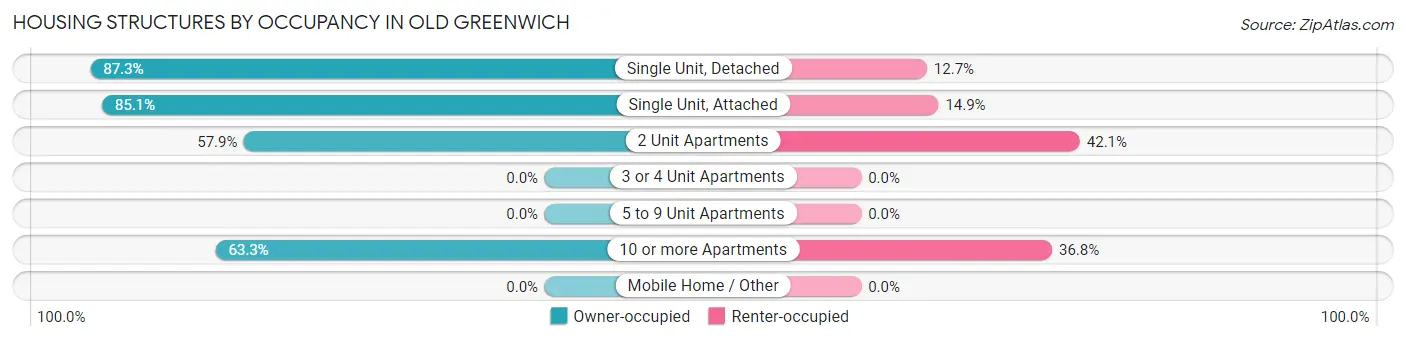
| Structure Type | Owner-occupied | Renter-occupied |
| Single Unit, Detached | 1,608 (87.3%) | 233 (12.7%) |
| Single Unit, Attached | 103 (85.1%) | 18 (14.9%) |
| 2 Unit Apartments | 33 (57.9%) | 24 (42.1%) |
| 3 or 4 Unit Apartments | 0 (0.0%) | 0 (0.0%) |
| 5 to 9 Unit Apartments | 0 (0.0%) | 0 (0.0%) |
| 10 or more Apartments | 191 (63.2%) | 111 (36.7%) |
| Mobile Home / Other | 0 (0.0%) | 0 (0.0%) |
| Total | 1,935 (83.4%) | 386 (16.6%) |
Housing Structures by Number of Rooms in Old Greenwich
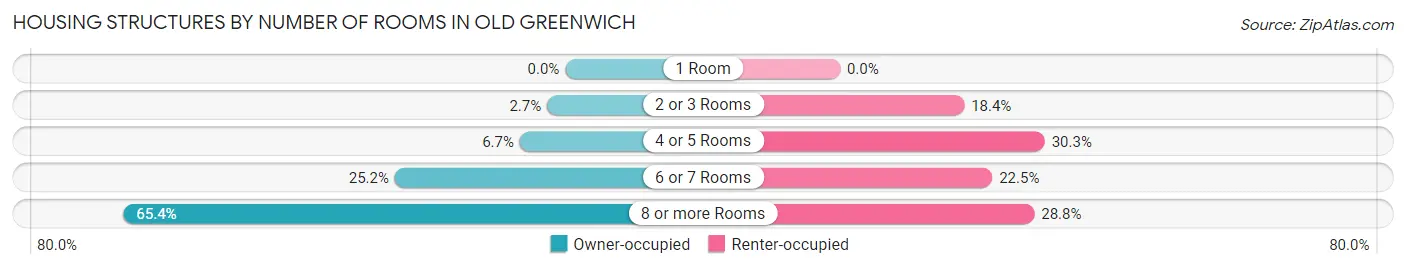
| Number of Rooms | Owner-occupied | Renter-occupied |
| 1 Room | 0 (0.0%) | 0 (0.0%) |
| 2 or 3 Rooms | 52 (2.7%) | 71 (18.4%) |
| 4 or 5 Rooms | 130 (6.7%) | 117 (30.3%) |
| 6 or 7 Rooms | 488 (25.2%) | 87 (22.5%) |
| 8 or more Rooms | 1,265 (65.4%) | 111 (28.8%) |
| Total | 1,935 (100.0%) | 386 (100.0%) |
Housing Structure by Heating Type in Old Greenwich
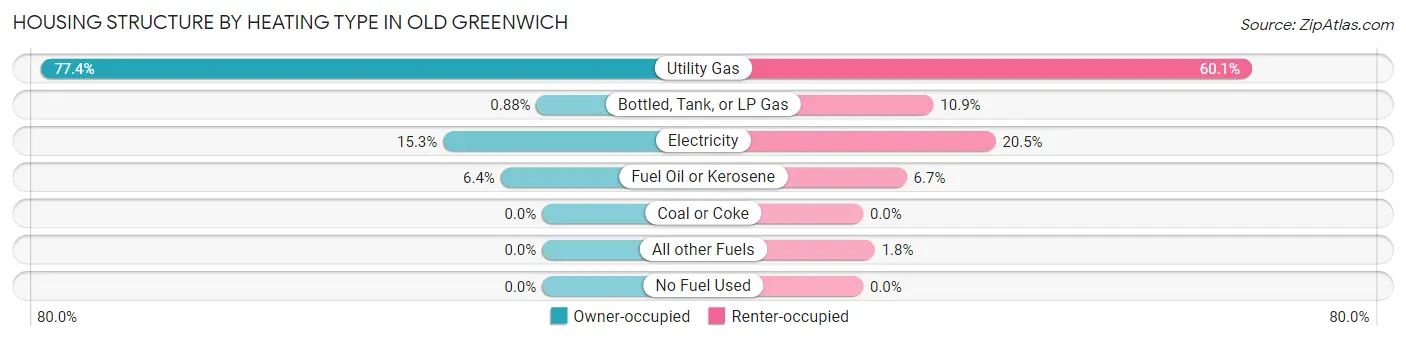
| Heating Type | Owner-occupied | Renter-occupied |
| Utility Gas | 1,498 (77.4%) | 232 (60.1%) |
| Bottled, Tank, or LP Gas | 17 (0.9%) | 42 (10.9%) |
| Electricity | 296 (15.3%) | 79 (20.5%) |
| Fuel Oil or Kerosene | 124 (6.4%) | 26 (6.7%) |
| Coal or Coke | 0 (0.0%) | 0 (0.0%) |
| All other Fuels | 0 (0.0%) | 7 (1.8%) |
| No Fuel Used | 0 (0.0%) | 0 (0.0%) |
| Total | 1,935 (100.0%) | 386 (100.0%) |
Household Vehicle Usage in Old Greenwich
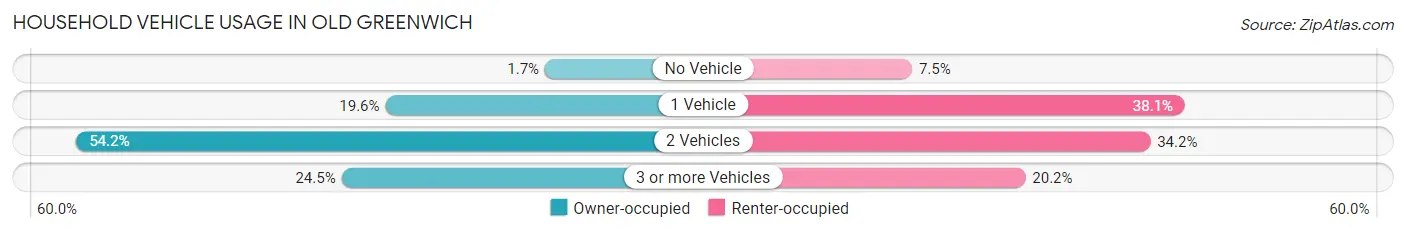
| Vehicles per Household | Owner-occupied | Renter-occupied |
| No Vehicle | 33 (1.7%) | 29 (7.5%) |
| 1 Vehicle | 379 (19.6%) | 147 (38.1%) |
| 2 Vehicles | 1,049 (54.2%) | 132 (34.2%) |
| 3 or more Vehicles | 474 (24.5%) | 78 (20.2%) |
| Total | 1,935 (100.0%) | 386 (100.0%) |
Real Estate & Mortgages in Old Greenwich
Real Estate and Mortgage Overview in Old Greenwich
| Characteristic | Without Mortgage | With Mortgage |
| Housing Units | 562 | 1,373 |
| Median Property Value | $1,642,900 | $1,627,500 |
| Median Household Income | $233,125 | $980 |
| Monthly Housing Costs | $1,501 | $1,108 |
| Real Estate Taxes | $10,001 | $0 |
Property Value by Mortgage Status in Old Greenwich
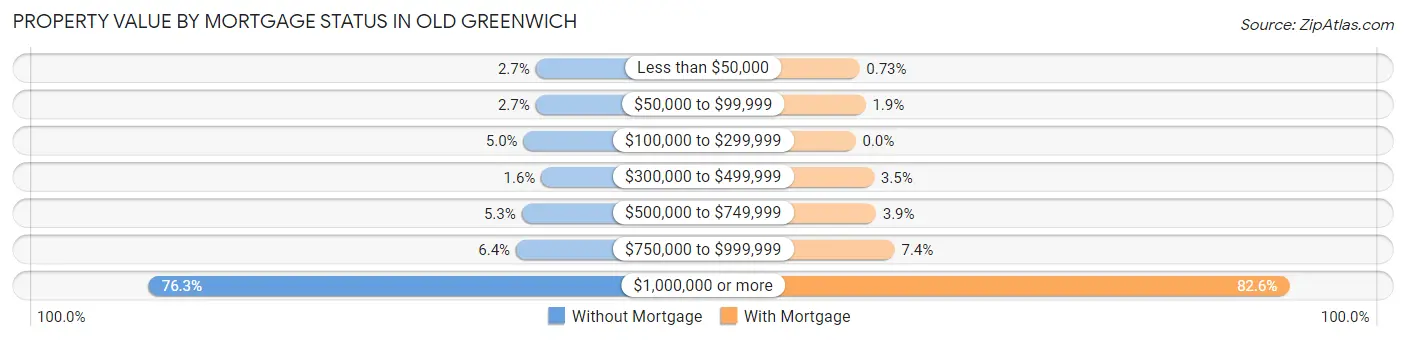
| Property Value | Without Mortgage | With Mortgage |
| Less than $50,000 | 15 (2.7%) | 10 (0.7%) |
| $50,000 to $99,999 | 15 (2.7%) | 26 (1.9%) |
| $100,000 to $299,999 | 28 (5.0%) | 0 (0.0%) |
| $300,000 to $499,999 | 9 (1.6%) | 48 (3.5%) |
| $500,000 to $749,999 | 30 (5.3%) | 53 (3.9%) |
| $750,000 to $999,999 | 36 (6.4%) | 102 (7.4%) |
| $1,000,000 or more | 429 (76.3%) | 1,134 (82.6%) |
| Total | 562 (100.0%) | 1,373 (100.0%) |
Household Income by Mortgage Status in Old Greenwich
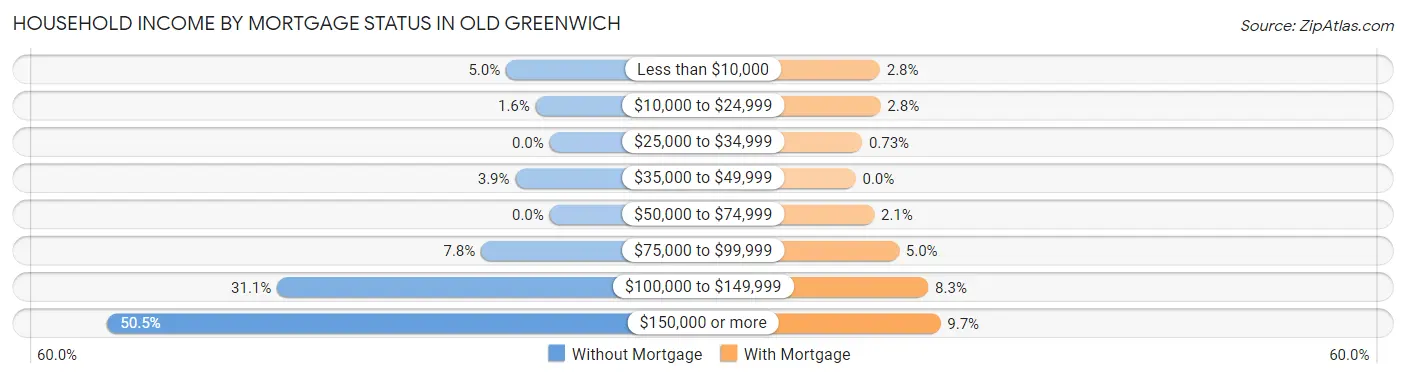
| Household Income | Without Mortgage | With Mortgage |
| Less than $10,000 | 28 (5.0%) | 38 (2.8%) |
| $10,000 to $24,999 | 9 (1.6%) | 39 (2.8%) |
| $25,000 to $34,999 | 0 (0.0%) | 10 (0.7%) |
| $35,000 to $49,999 | 22 (3.9%) | 0 (0.0%) |
| $50,000 to $74,999 | 0 (0.0%) | 29 (2.1%) |
| $75,000 to $99,999 | 44 (7.8%) | 68 (5.0%) |
| $100,000 to $149,999 | 175 (31.1%) | 114 (8.3%) |
| $150,000 or more | 284 (50.5%) | 133 (9.7%) |
| Total | 562 (100.0%) | 1,373 (100.0%) |
Property Value to Household Income Ratio in Old Greenwich
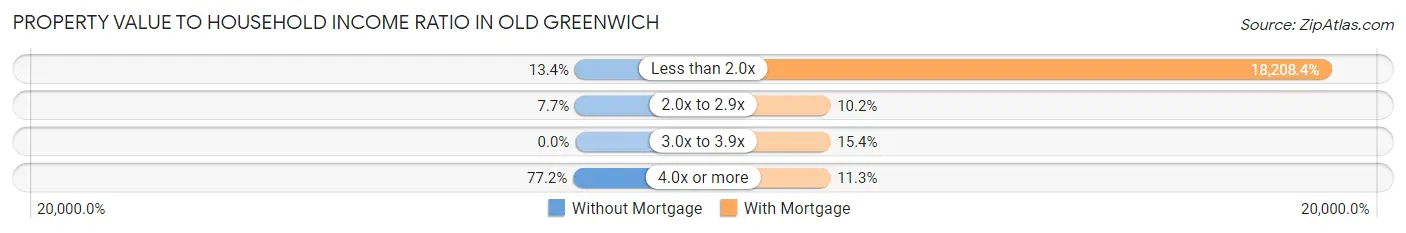
| Value-to-Income Ratio | Without Mortgage | With Mortgage |
| Less than 2.0x | 75 (13.4%) | 250,001 (18,208.4%) |
| 2.0x to 2.9x | 43 (7.6%) | 140 (10.2%) |
| 3.0x to 3.9x | 0 (0.0%) | 211 (15.4%) |
| 4.0x or more | 434 (77.2%) | 155 (11.3%) |
| Total | 562 (100.0%) | 1,373 (100.0%) |
Real Estate Taxes by Mortgage Status in Old Greenwich
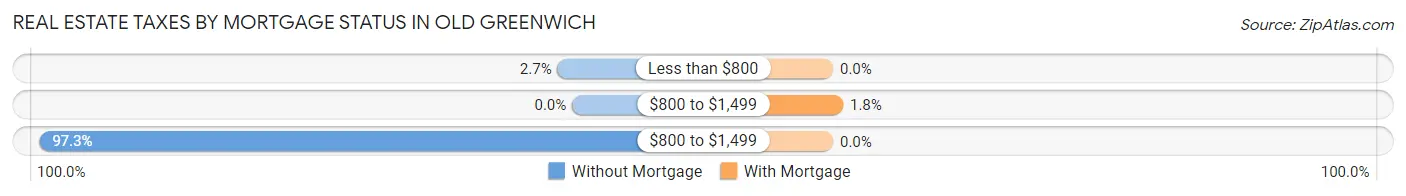
| Property Taxes | Without Mortgage | With Mortgage |
| Less than $800 | 15 (2.7%) | 0 (0.0%) |
| $800 to $1,499 | 0 (0.0%) | 25 (1.8%) |
| $800 to $1,499 | 547 (97.3%) | 0 (0.0%) |
| Total | 562 (100.0%) | 1,373 (100.0%) |
Health & Disability in Old Greenwich
Health Insurance Coverage by Age in Old Greenwich
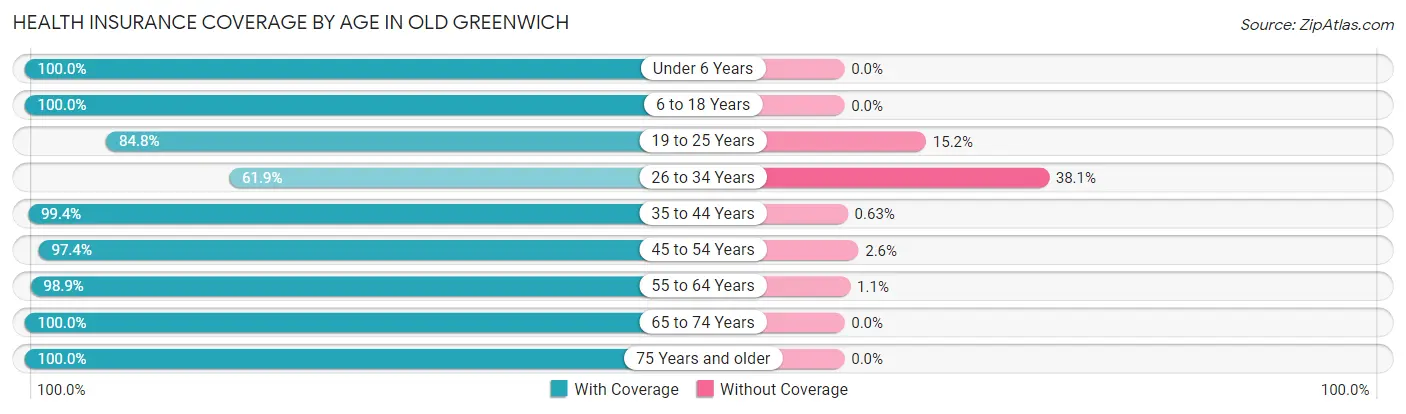
| Age Bracket | With Coverage | Without Coverage |
| Under 6 Years | 767 (100.0%) | 0 (0.0%) |
| 6 to 18 Years | 1,758 (100.0%) | 0 (0.0%) |
| 19 to 25 Years | 223 (84.8%) | 40 (15.2%) |
| 26 to 34 Years | 60 (61.9%) | 37 (38.1%) |
| 35 to 44 Years | 1,261 (99.4%) | 8 (0.6%) |
| 45 to 54 Years | 969 (97.4%) | 26 (2.6%) |
| 55 to 64 Years | 905 (98.9%) | 10 (1.1%) |
| 65 to 74 Years | 575 (100.0%) | 0 (0.0%) |
| 75 Years and older | 421 (100.0%) | 0 (0.0%) |
| Total | 6,939 (98.3%) | 121 (1.7%) |
Health Insurance Coverage by Citizenship Status in Old Greenwich
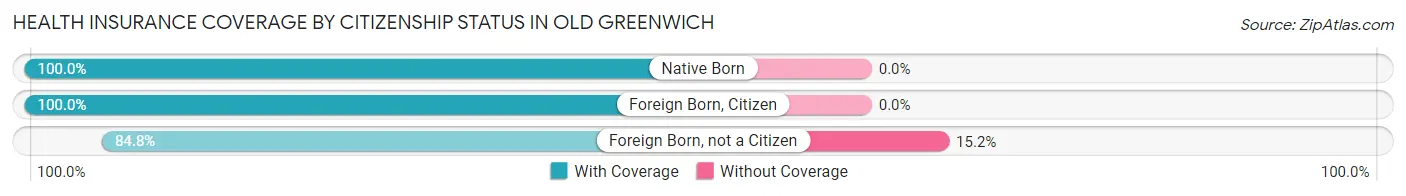
| Citizenship Status | With Coverage | Without Coverage |
| Native Born | 767 (100.0%) | 0 (0.0%) |
| Foreign Born, Citizen | 1,758 (100.0%) | 0 (0.0%) |
| Foreign Born, not a Citizen | 223 (84.8%) | 40 (15.2%) |
Health Insurance Coverage by Household Income in Old Greenwich
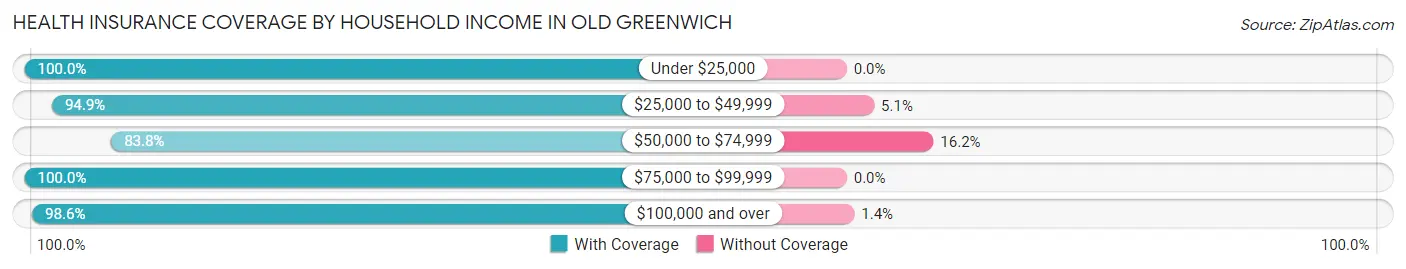
| Household Income | With Coverage | Without Coverage |
| Under $25,000 | 256 (100.0%) | 0 (0.0%) |
| $25,000 to $49,999 | 148 (94.9%) | 8 (5.1%) |
| $50,000 to $74,999 | 129 (83.8%) | 25 (16.2%) |
| $75,000 to $99,999 | 290 (100.0%) | 0 (0.0%) |
| $100,000 and over | 6,101 (98.6%) | 88 (1.4%) |
Public vs Private Health Insurance Coverage by Age in Old Greenwich
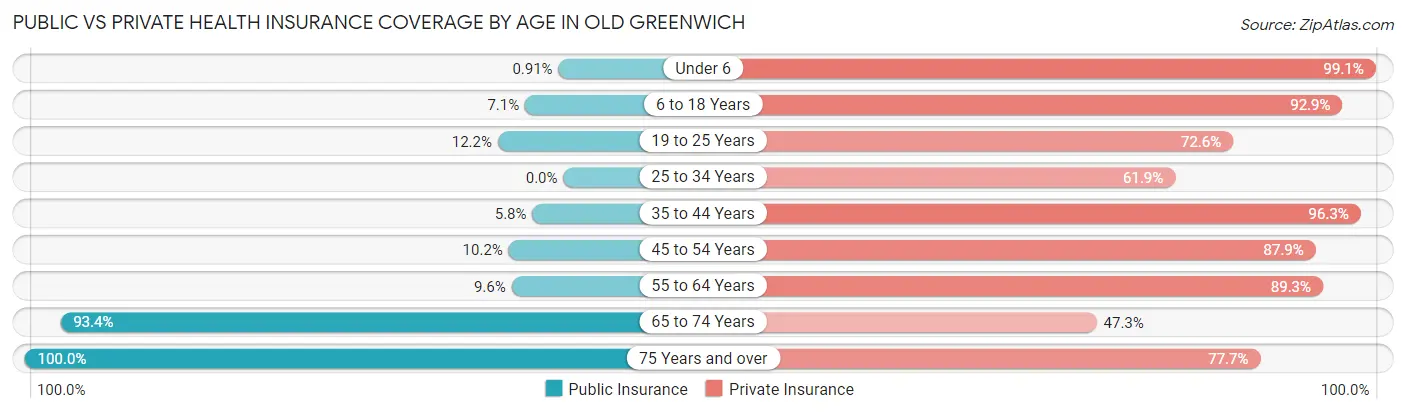
| Age Bracket | Public Insurance | Private Insurance |
| Under 6 | 7 (0.9%) | 760 (99.1%) |
| 6 to 18 Years | 125 (7.1%) | 1,633 (92.9%) |
| 19 to 25 Years | 32 (12.2%) | 191 (72.6%) |
| 25 to 34 Years | 0 (0.0%) | 60 (61.9%) |
| 35 to 44 Years | 73 (5.8%) | 1,222 (96.3%) |
| 45 to 54 Years | 101 (10.2%) | 875 (87.9%) |
| 55 to 64 Years | 88 (9.6%) | 817 (89.3%) |
| 65 to 74 Years | 537 (93.4%) | 272 (47.3%) |
| 75 Years and over | 421 (100.0%) | 327 (77.7%) |
| Total | 1,384 (19.6%) | 6,157 (87.2%) |
Disability Status by Sex by Age in Old Greenwich
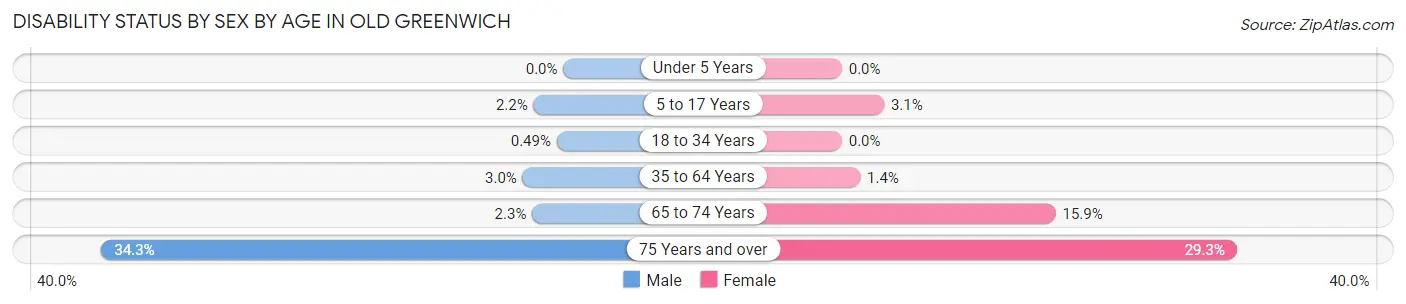
| Age Bracket | Male | Female |
| Under 5 Years | 0 (0.0%) | 0 (0.0%) |
| 5 to 17 Years | 18 (2.2%) | 32 (3.1%) |
| 18 to 34 Years | 1 (0.5%) | 0 (0.0%) |
| 35 to 64 Years | 47 (3.0%) | 22 (1.4%) |
| 65 to 74 Years | 6 (2.3%) | 50 (15.9%) |
| 75 Years and over | 59 (34.3%) | 73 (29.3%) |
Disability Class by Sex by Age in Old Greenwich
Disability Class: Hearing Difficulty
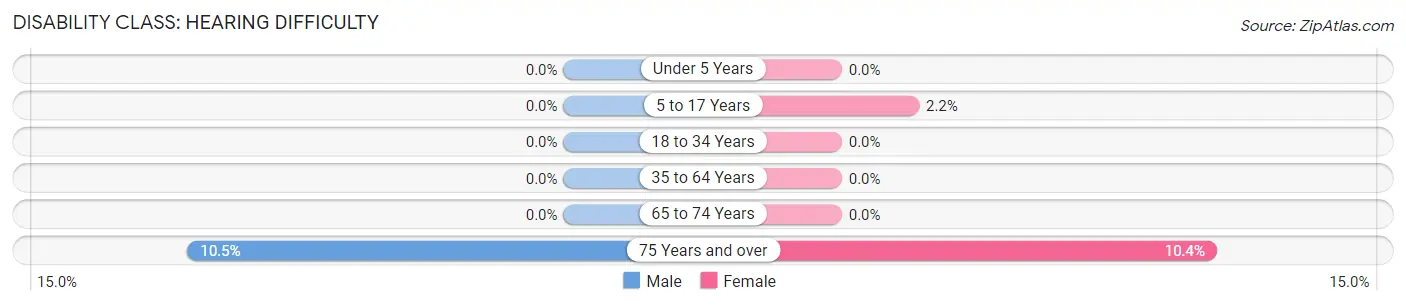
| Age Bracket | Male | Female |
| Under 5 Years | 0 (0.0%) | 0 (0.0%) |
| 5 to 17 Years | 0 (0.0%) | 22 (2.1%) |
| 18 to 34 Years | 0 (0.0%) | 0 (0.0%) |
| 35 to 64 Years | 0 (0.0%) | 0 (0.0%) |
| 65 to 74 Years | 0 (0.0%) | 0 (0.0%) |
| 75 Years and over | 18 (10.5%) | 26 (10.4%) |
Disability Class: Vision Difficulty
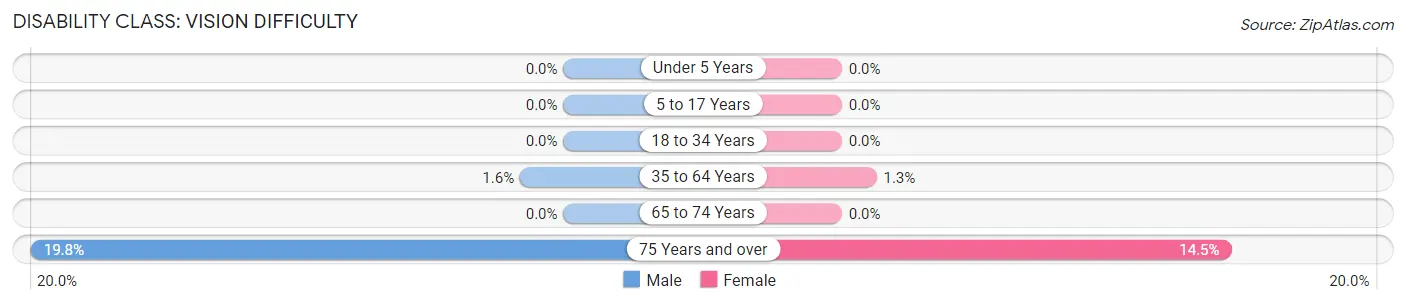
| Age Bracket | Male | Female |
| Under 5 Years | 0 (0.0%) | 0 (0.0%) |
| 5 to 17 Years | 0 (0.0%) | 0 (0.0%) |
| 18 to 34 Years | 0 (0.0%) | 0 (0.0%) |
| 35 to 64 Years | 25 (1.6%) | 21 (1.3%) |
| 65 to 74 Years | 0 (0.0%) | 0 (0.0%) |
| 75 Years and over | 34 (19.8%) | 36 (14.5%) |
Disability Class: Cognitive Difficulty
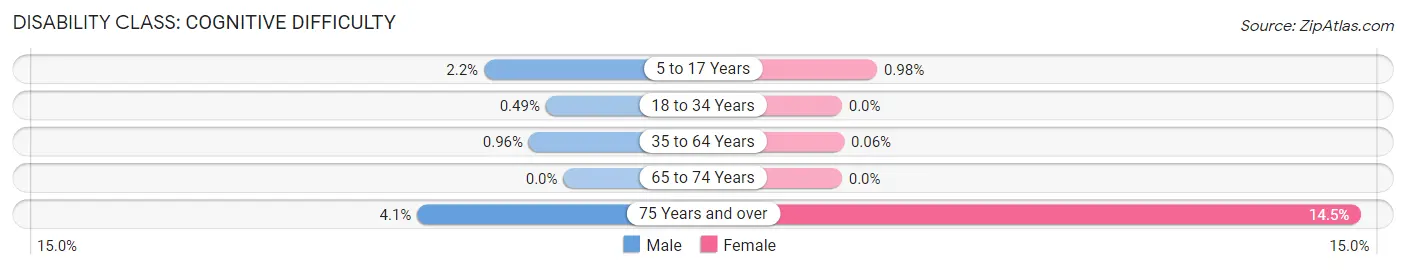
| Age Bracket | Male | Female |
| 5 to 17 Years | 18 (2.2%) | 10 (1.0%) |
| 18 to 34 Years | 1 (0.5%) | 0 (0.0%) |
| 35 to 64 Years | 15 (1.0%) | 1 (0.1%) |
| 65 to 74 Years | 0 (0.0%) | 0 (0.0%) |
| 75 Years and over | 7 (4.1%) | 36 (14.5%) |
Disability Class: Ambulatory Difficulty
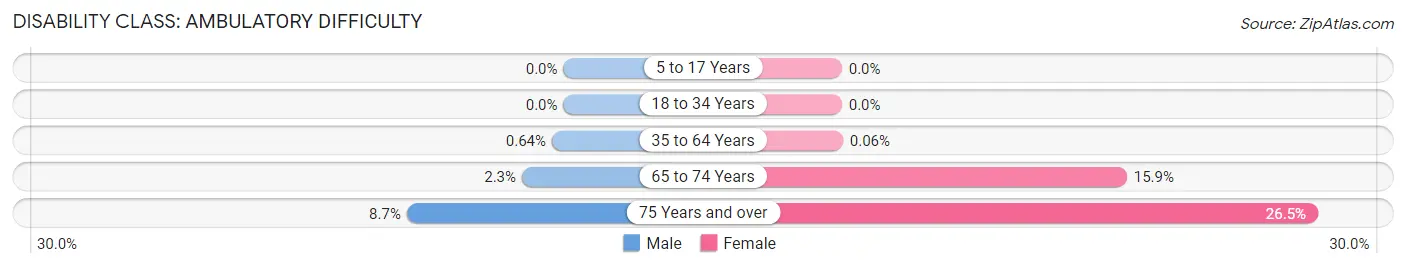
| Age Bracket | Male | Female |
| 5 to 17 Years | 0 (0.0%) | 0 (0.0%) |
| 18 to 34 Years | 0 (0.0%) | 0 (0.0%) |
| 35 to 64 Years | 10 (0.6%) | 1 (0.1%) |
| 65 to 74 Years | 6 (2.3%) | 50 (15.9%) |
| 75 Years and over | 15 (8.7%) | 66 (26.5%) |
Disability Class: Self-Care Difficulty
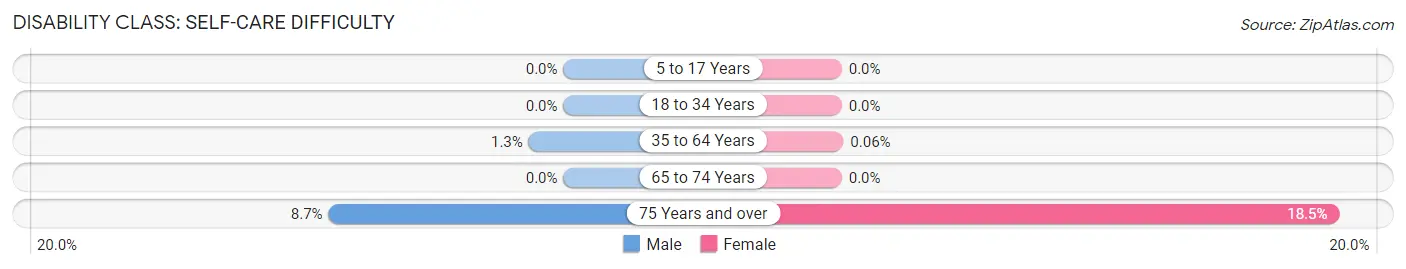
| Age Bracket | Male | Female |
| 5 to 17 Years | 0 (0.0%) | 0 (0.0%) |
| 18 to 34 Years | 0 (0.0%) | 0 (0.0%) |
| 35 to 64 Years | 20 (1.3%) | 1 (0.1%) |
| 65 to 74 Years | 0 (0.0%) | 0 (0.0%) |
| 75 Years and over | 15 (8.7%) | 46 (18.5%) |
Technology Access in Old Greenwich
Computing Device Access in Old Greenwich
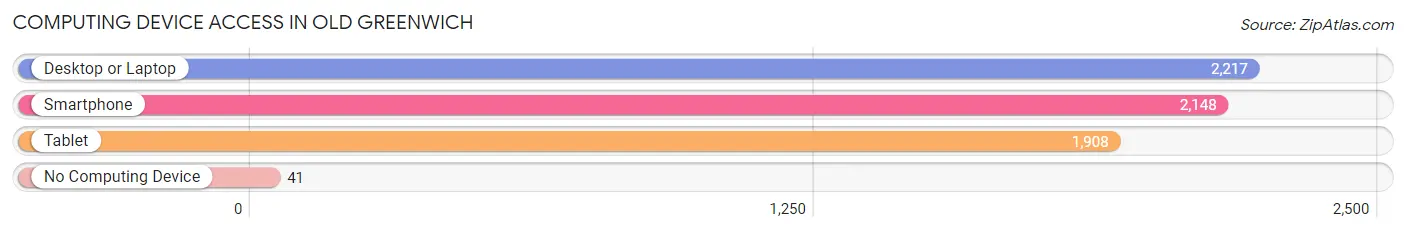
| Device Type | # Households | % Households |
| Desktop or Laptop | 2,217 | 95.5% |
| Smartphone | 2,148 | 92.5% |
| Tablet | 1,908 | 82.2% |
| No Computing Device | 41 | 1.8% |
| Total | 2,321 | 100.0% |
Internet Access in Old Greenwich
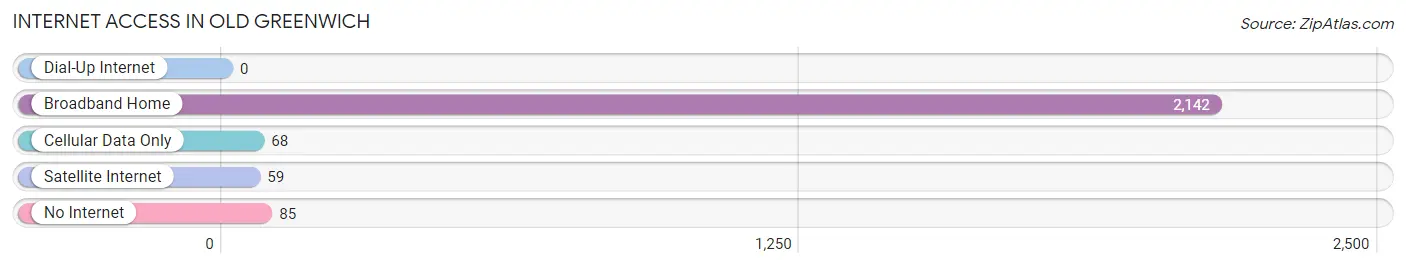
| Internet Type | # Households | % Households |
| Dial-Up Internet | 0 | 0.0% |
| Broadband Home | 2,142 | 92.3% |
| Cellular Data Only | 68 | 2.9% |
| Satellite Internet | 59 | 2.5% |
| No Internet | 85 | 3.7% |
| Total | 2,321 | 100.0% |
Old Greenwich Summary
History
Old Greenwich is a neighborhood located in the town of Greenwich, Connecticut. It is located on the Long Island Sound and is bordered by the Byram River to the west and the Mianus River to the east. The area was first settled in 1640 by English settlers and was originally known as Sound Beach. The area was renamed Old Greenwich in 1864 when the town of Greenwich was incorporated.
Old Greenwich has a long and rich history. During the Revolutionary War, the area was a strategic location for the Continental Army. The area was also home to a number of prominent figures in American history, including the first president of the United States, George Washington, who visited the area in 1781.
In the 19th century, Old Greenwich became a popular summer destination for wealthy New Yorkers. The area was home to a number of grand estates, including the Bush-Holley House, which is now a museum.
Geography
Old Greenwich is located in the town of Greenwich, Connecticut, on the Long Island Sound. It is bordered by the Byram River to the west and the Mianus River to the east. The area is approximately 4.5 square miles in size and is home to a population of approximately 12,000 people.
The area is mostly residential, with a few commercial areas. The main commercial area is located along Sound Beach Avenue, which is home to a variety of shops and restaurants. The area is also home to a number of parks, including Binney Park, which is located on the waterfront.
Economy
Old Greenwich is a wealthy area and is home to a number of affluent residents. The area is home to a number of financial services firms, including hedge funds and private equity firms. The area is also home to a number of corporate headquarters, including the headquarters of the hedge fund Bridgewater Associates.
The area is also home to a number of retail stores, restaurants, and other businesses. The area is home to a number of luxury retailers, including Tiffany & Co. and Saks Fifth Avenue.
Demographics
As of the 2010 census, the population of Old Greenwich was 12,000. The population is predominantly white (90.2%), with a small percentage of African Americans (3.2%), Asians (2.7%), and Hispanics (2.3%). The median household income is $170,000, and the median home value is $1.3 million.
Conclusion
Old Greenwich is a wealthy neighborhood located in the town of Greenwich, Connecticut. It is located on the Long Island Sound and is bordered by the Byram River to the west and the Mianus River to the east. The area has a long and rich history and was a popular summer destination for wealthy New Yorkers in the 19th century. The area is mostly residential, with a few commercial areas, and is home to a population of approximately 12,000 people. The area is home to a number of financial services firms, corporate headquarters, and luxury retailers. The population is predominantly white, with a small percentage of African Americans, Asians, and Hispanics. The median household income is $170,000, and the median home value is $1.3 million.
Common Questions
What is Per Capita Income in Old Greenwich?
Per Capita income in Old Greenwich is $120,032.
What is the Median Family Income in Old Greenwich?
Median Family Income in Old Greenwich is $250,001.
What is the Median Household income in Old Greenwich?
Median Household Income in Old Greenwich is $240,417.
What is Income or Wage Gap in Old Greenwich?
Income or Wage Gap in Old Greenwich is 59.0%.
Women in Old Greenwich earn 41.0 cents for every dollar earned by a man.
What is Inequality or Gini Index in Old Greenwich?
Inequality or Gini Index in Old Greenwich is 0.50.
What is the Total Population of Old Greenwich?
Total Population of Old Greenwich is 7,060.
What is the Total Male Population of Old Greenwich?
Total Male Population of Old Greenwich is 3,345.
What is the Total Female Population of Old Greenwich?
Total Female Population of Old Greenwich is 3,715.
What is the Ratio of Males per 100 Females in Old Greenwich?
There are 90.04 Males per 100 Females in Old Greenwich.
What is the Ratio of Females per 100 Males in Old Greenwich?
There are 111.06 Females per 100 Males in Old Greenwich.
What is the Median Population Age in Old Greenwich?
Median Population Age in Old Greenwich is 41.0 Years.
What is the Average Family Size in Old Greenwich
Average Family Size in Old Greenwich is 3.6 People.
What is the Average Household Size in Old Greenwich
Average Household Size in Old Greenwich is 3.0 People.
How Large is the Labor Force in Old Greenwich?
There are 3,082 People in the Labor Forcein in Old Greenwich.
What is the Percentage of People in the Labor Force in Old Greenwich?
63.2% of People are in the Labor Force in Old Greenwich.
What is the Unemployment Rate in Old Greenwich?
Unemployment Rate in Old Greenwich is 4.5%.