Zip Codes with the Highest Percentage of Families with Income Below $10,000 in Connecticut
RELATED REPORTS & OPTIONS
Family Income | $0-10k
Connecticut
Compare Zip Codes
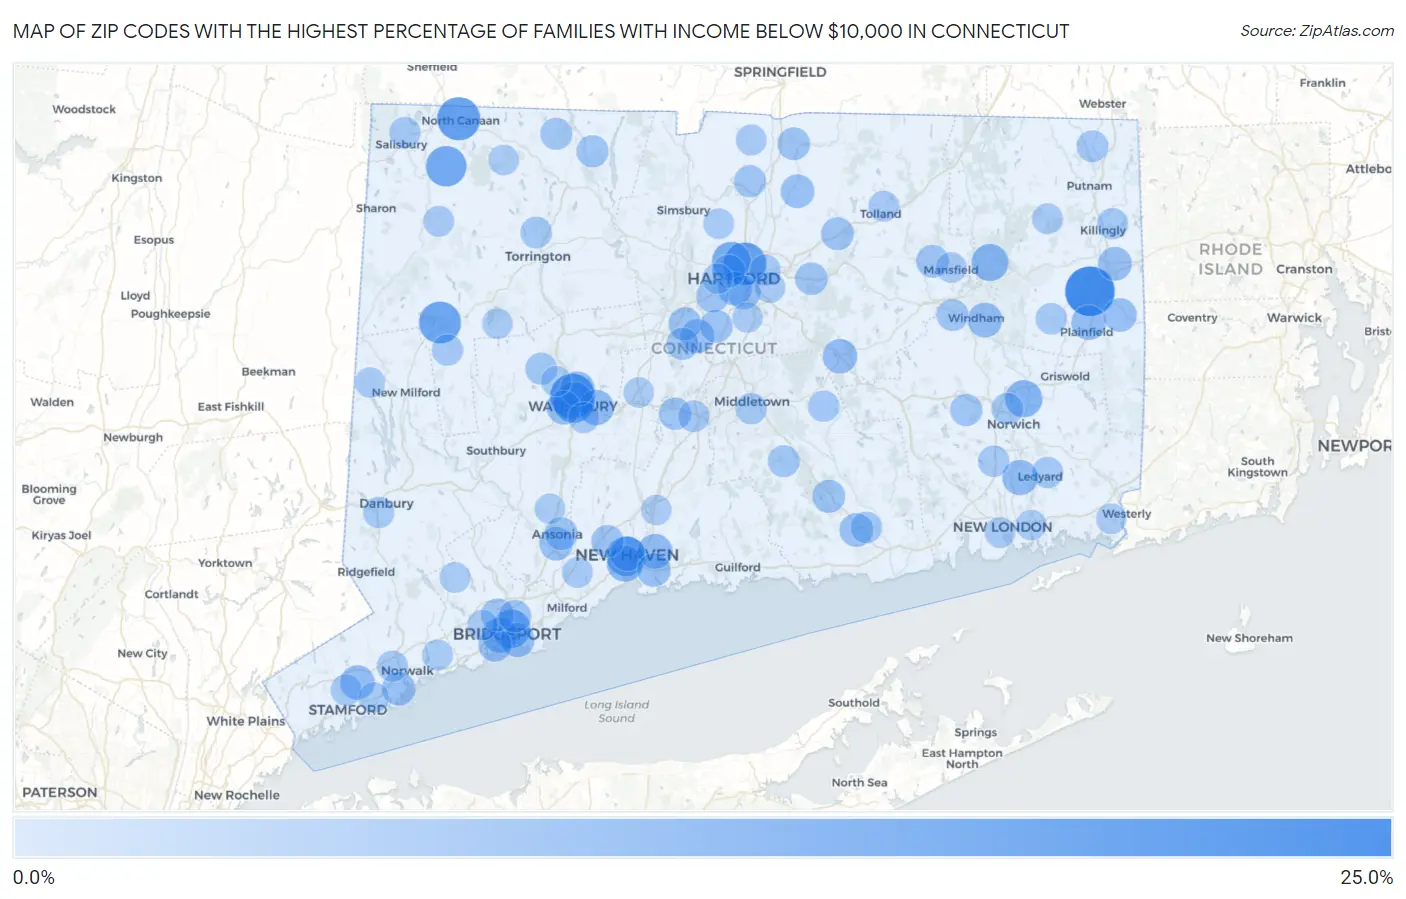
Map of Zip Codes with the Highest Percentage of Families with Income Below $10,000 in Connecticut
0.0%
25.0%
Zip Codes with the Highest Percentage of Families with Income Below $10,000 in Connecticut
| Zip Code | Families with Income < $10k | vs State | vs National | |
| 1. | 06387 | 22.8% | 2.4%(+20.4)#1 | 3.1%(+19.7)#378 |
| 2. | 06710 | 17.6% | 2.4%(+15.2)#2 | 3.1%(+14.5)#608 |
| 3. | 06018 | 15.7% | 2.4%(+13.3)#3 | 3.1%(+12.6)#777 |
| 4. | 06120 | 15.2% | 2.4%(+12.8)#4 | 3.1%(+12.1)#837 |
| 5. | 06777 | 14.4% | 2.4%(+12.0)#5 | 3.1%(+11.3)#923 |
| 6. | 06702 | 13.1% | 2.4%(+10.7)#6 | 3.1%(+10.00)#1,105 |
| 7. | 06031 | 12.8% | 2.4%(+10.4)#7 | 3.1%(+9.70)#1,166 |
| 8. | 06510 | 11.7% | 2.4%(+9.30)#8 | 3.1%(+8.60)#1,397 |
| 9. | 06112 | 10.9% | 2.4%(+8.50)#9 | 3.1%(+7.80)#1,612 |
| 10. | 06608 | 10.7% | 2.4%(+8.30)#10 | 3.1%(+7.60)#1,680 |
| 11. | 06380 | 9.2% | 2.4%(+6.80)#11 | 3.1%(+6.10)#2,269 |
| 12. | 06235 | 9.0% | 2.4%(+6.60)#12 | 3.1%(+5.90)#2,379 |
| 13. | 06519 | 7.9% | 2.4%(+5.50)#13 | 3.1%(+4.80)#3,030 |
| 14. | 06604 | 7.2% | 2.4%(+4.80)#14 | 3.1%(+4.10)#3,471 |
| 15. | 06705 | 7.2% | 2.4%(+4.80)#15 | 3.1%(+4.10)#3,477 |
| 16. | 06335 | 7.1% | 2.4%(+4.70)#16 | 3.1%(+4.00)#3,569 |
| 17. | 06374 | 6.7% | 2.4%(+4.30)#17 | 3.1%(+3.60)#3,918 |
| 18. | 06513 | 6.6% | 2.4%(+4.20)#18 | 3.1%(+3.50)#3,994 |
| 19. | 06511 | 6.5% | 2.4%(+4.10)#19 | 3.1%(+3.40)#4,091 |
| 20. | 06280 | 6.4% | 2.4%(+4.00)#20 | 3.1%(+3.30)#4,255 |
| 21. | 06907 | 6.3% | 2.4%(+3.90)#21 | 3.1%(+3.20)#4,331 |
| 22. | 06447 | 6.3% | 2.4%(+3.90)#22 | 3.1%(+3.20)#4,337 |
| 23. | 06704 | 6.2% | 2.4%(+3.80)#23 | 3.1%(+3.10)#4,427 |
| 24. | 06607 | 6.1% | 2.4%(+3.70)#24 | 3.1%(+3.00)#4,572 |
| 25. | 06708 | 5.9% | 2.4%(+3.50)#25 | 3.1%(+2.80)#4,778 |
| 26. | 06106 | 5.6% | 2.4%(+3.20)#26 | 3.1%(+2.50)#5,147 |
| 27. | 06051 | 5.6% | 2.4%(+3.20)#27 | 3.1%(+2.50)#5,153 |
| 28. | 06239 | 5.5% | 2.4%(+3.10)#28 | 3.1%(+2.40)#5,343 |
| 29. | 06512 | 5.4% | 2.4%(+3.00)#29 | 3.1%(+2.30)#5,451 |
| 30. | 06418 | 5.4% | 2.4%(+3.00)#30 | 3.1%(+2.30)#5,482 |
| 31. | 06016 | 5.4% | 2.4%(+3.00)#31 | 3.1%(+2.30)#5,503 |
| 32. | 06854 | 5.3% | 2.4%(+2.90)#32 | 3.1%(+2.20)#5,605 |
| 33. | 06114 | 5.3% | 2.4%(+2.90)#33 | 3.1%(+2.20)#5,616 |
| 34. | 06354 | 5.3% | 2.4%(+2.90)#34 | 3.1%(+2.20)#5,661 |
| 35. | 06409 | 5.3% | 2.4%(+2.90)#35 | 3.1%(+2.20)#5,711 |
| 36. | 06605 | 5.1% | 2.4%(+2.70)#36 | 3.1%(+2.00)#5,946 |
| 37. | 06105 | 4.9% | 2.4%(+2.50)#37 | 3.1%(+1.80)#6,291 |
| 38. | 06412 | 4.7% | 2.4%(+2.30)#38 | 3.1%(+1.60)#6,714 |
| 39. | 06606 | 4.6% | 2.4%(+2.20)#39 | 3.1%(+1.50)#6,796 |
| 40. | 06053 | 4.6% | 2.4%(+2.20)#40 | 3.1%(+1.50)#6,812 |
| 41. | 06401 | 4.6% | 2.4%(+2.20)#41 | 3.1%(+1.50)#6,837 |
| 42. | 06111 | 4.5% | 2.4%(+2.10)#42 | 3.1%(+1.40)#7,004 |
| 43. | 06066 | 4.5% | 2.4%(+2.10)#43 | 3.1%(+1.40)#7,006 |
| 44. | 06268 | 4.5% | 2.4%(+2.10)#44 | 3.1%(+1.40)#7,039 |
| 45. | 06082 | 4.4% | 2.4%(+2.00)#45 | 3.1%(+1.30)#7,213 |
| 46. | 06110 | 4.4% | 2.4%(+2.00)#46 | 3.1%(+1.30)#7,263 |
| 47. | 06610 | 4.3% | 2.4%(+1.90)#47 | 3.1%(+1.20)#7,443 |
| 48. | 06040 | 4.2% | 2.4%(+1.80)#48 | 3.1%(+1.10)#7,646 |
| 49. | 06515 | 4.2% | 2.4%(+1.80)#49 | 3.1%(+1.10)#7,691 |
| 50. | 06451 | 4.0% | 2.4%(+1.60)#50 | 3.1%(+0.900)#8,174 |
| 51. | 06052 | 3.9% | 2.4%(+1.50)#51 | 3.1%(+0.800)#8,502 |
| 52. | 06334 | 3.9% | 2.4%(+1.50)#52 | 3.1%(+0.800)#8,569 |
| 53. | 06096 | 3.8% | 2.4%(+1.40)#53 | 3.1%(+0.700)#8,730 |
| 54. | 06065 | 3.8% | 2.4%(+1.40)#54 | 3.1%(+0.700)#8,876 |
| 55. | 06226 | 3.6% | 2.4%(+1.20)#55 | 3.1%(+0.500)#9,277 |
| 56. | 06795 | 3.6% | 2.4%(+1.20)#56 | 3.1%(+0.500)#9,295 |
| 57. | 06021 | 3.6% | 2.4%(+1.20)#57 | 3.1%(+0.500)#9,404 |
| 58. | 06360 | 3.5% | 2.4%(+1.10)#58 | 3.1%(+0.400)#9,495 |
| 59. | 06441 | 3.5% | 2.4%(+1.10)#59 | 3.1%(+0.400)#9,640 |
| 60. | 06255 | 3.3% | 2.4%(+0.900)#60 | 3.1%(+0.200)#10,283 |
| 61. | 06450 | 3.2% | 2.4%(+0.800)#61 | 3.1%(+0.100)#10,434 |
| 62. | 06790 | 3.2% | 2.4%(+0.800)#62 | 3.1%(+0.100)#10,436 |
| 63. | 06426 | 3.2% | 2.4%(+0.800)#63 | 3.1%(+0.100)#10,627 |
| 64. | 06424 | 3.0% | 2.4%(+0.600)#64 | 3.1%(-0.100)#11,205 |
| 65. | 06457 | 2.9% | 2.4%(+0.500)#65 | 3.1%(-0.200)#11,439 |
| 66. | 06382 | 2.9% | 2.4%(+0.500)#66 | 3.1%(-0.200)#11,570 |
| 67. | 06339 | 2.9% | 2.4%(+0.500)#67 | 3.1%(-0.200)#11,581 |
| 68. | 06331 | 2.9% | 2.4%(+0.500)#68 | 3.1%(-0.200)#11,614 |
| 69. | 06794 | 2.9% | 2.4%(+0.500)#69 | 3.1%(-0.200)#11,748 |
| 70. | 06241 | 2.8% | 2.4%(+0.400)#70 | 3.1%(-0.300)#11,993 |
| 71. | 06810 | 2.7% | 2.4%(+0.300)#71 | 3.1%(-0.400)#12,200 |
| 72. | 06108 | 2.7% | 2.4%(+0.300)#72 | 3.1%(-0.400)#12,309 |
| 73. | 06905 | 2.7% | 2.4%(+0.300)#73 | 3.1%(-0.400)#12,327 |
| 74. | 06850 | 2.7% | 2.4%(+0.300)#74 | 3.1%(-0.400)#12,335 |
| 75. | 06068 | 2.7% | 2.4%(+0.300)#75 | 3.1%(-0.400)#12,495 |
| 76. | 06706 | 2.6% | 2.4%(+0.200)#76 | 3.1%(-0.500)#12,752 |
| 77. | 06880 | 2.4% | 2.4%(=0.000)#77 | 3.1%(-0.700)#13,510 |
| 78. | 06078 | 2.4% | 2.4%(=0.000)#78 | 3.1%(-0.700)#13,596 |
| 79. | 06320 | 2.3% | 2.4%(-0.100)#79 | 3.1%(-0.800)#13,956 |
| 80. | 06118 | 2.3% | 2.4%(-0.100)#80 | 3.1%(-0.800)#13,960 |
| 81. | 06084 | 2.3% | 2.4%(-0.100)#81 | 3.1%(-0.800)#14,035 |
| 82. | 06259 | 2.3% | 2.4%(-0.100)#82 | 3.1%(-0.800)#14,137 |
| 83. | 06002 | 2.2% | 2.4%(-0.200)#83 | 3.1%(-0.900)#14,422 |
| 84. | 06477 | 2.2% | 2.4%(-0.200)#84 | 3.1%(-0.900)#14,466 |
| 85. | 06250 | 2.2% | 2.4%(-0.200)#85 | 3.1%(-0.900)#14,536 |
| 86. | 06796 | 2.2% | 2.4%(-0.200)#86 | 3.1%(-0.900)#14,706 |
| 87. | 06820 | 2.1% | 2.4%(-0.300)#87 | 3.1%(-1.000)#14,901 |
| 88. | 06119 | 2.1% | 2.4%(-0.300)#88 | 3.1%(-1.000)#14,944 |
| 89. | 06779 | 2.1% | 2.4%(-0.300)#89 | 3.1%(-1.000)#14,996 |
| 90. | 06612 | 2.1% | 2.4%(-0.300)#90 | 3.1%(-1.000)#15,002 |
| 91. | 06058 | 2.1% | 2.4%(-0.300)#91 | 3.1%(-1.000)#15,120 |
| 92. | 06340 | 2.0% | 2.4%(-0.400)#92 | 3.1%(-1.10)#15,321 |
| 93. | 06109 | 2.0% | 2.4%(-0.400)#93 | 3.1%(-1.10)#15,341 |
| 94. | 06483 | 2.0% | 2.4%(-0.400)#94 | 3.1%(-1.10)#15,396 |
| 95. | 06479 | 2.0% | 2.4%(-0.400)#95 | 3.1%(-1.10)#15,452 |
| 96. | 06763 | 2.0% | 2.4%(-0.400)#96 | 3.1%(-1.10)#15,608 |
| 97. | 06473 | 1.9% | 2.4%(-0.500)#97 | 3.1%(-1.20)#15,830 |
| 98. | 06825 | 1.9% | 2.4%(-0.500)#98 | 3.1%(-1.20)#15,852 |
| 99. | 06379 | 1.9% | 2.4%(-0.500)#99 | 3.1%(-1.20)#15,919 |
| 100. | 06784 | 1.9% | 2.4%(-0.500)#100 | 3.1%(-1.20)#16,020 |
Common Questions
What are the Top 10 Zip Codes with the Highest Percentage of Families with Income Below $10,000 in Connecticut?
Top 10 Zip Codes with the Highest Percentage of Families with Income Below $10,000 in Connecticut are:
What zip code has the Highest Percentage of Families with Income Below $10,000 in Connecticut?
06387 has the Highest Percentage of Families with Income Below $10,000 in Connecticut with 22.8%.
What is the Percentage of Families with Income Below $10,000 in the State of Connecticut?
Percentage of Families with Income Below $10,000 in Connecticut is 2.4%.
What is the Percentage of Families with Income Below $10,000 in the United States?
Percentage of Families with Income Below $10,000 in the United States is 3.1%.