Heritage Village, CT Map & Demographics
Heritage Village Map
Heritage Village Overview
$53,567
PER CAPITA INCOME
$80,446
AVG FAMILY INCOME
$46,663
AVG HOUSEHOLD INCOME
8.5%
WAGE / INCOME GAP [ % ]
91.5¢/ $1
WAGE / INCOME GAP [ $ ]
0.52
INEQUALITY / GINI INDEX
4,411
TOTAL POPULATION
1,532
MALE POPULATION
2,879
FEMALE POPULATION
53.21
MALES / 100 FEMALES
187.92
FEMALES / 100 MALES
74.2
MEDIAN AGE
2.2
AVG FAMILY SIZE
1.5
AVG HOUSEHOLD SIZE
1,159
LABOR FORCE [ PEOPLE ]
26.5%
PERCENT IN LABOR FORCE
3.4%
UNEMPLOYMENT RATE
Income in Heritage Village
Income Overview in Heritage Village
Per Capita Income in Heritage Village is $53,567, while median incomes of families and households are $80,446 and $46,663 respectively.
| Characteristic | Number | Measure |
| Per Capita Income | 4,411 | $53,567 |
| Median Family Income | 1,042 | $80,446 |
| Mean Family Income | 1,042 | $110,083 |
| Median Household Income | 2,847 | $46,663 |
| Mean Household Income | 2,847 | $78,910 |
| Income Deficit | 1,042 | $0 |
| Wage / Income Gap (%) | 4,411 | 8.47% |
| Wage / Income Gap ($) | 4,411 | 91.53¢ per $1 |
| Gini / Inequality Index | 4,411 | 0.52 |
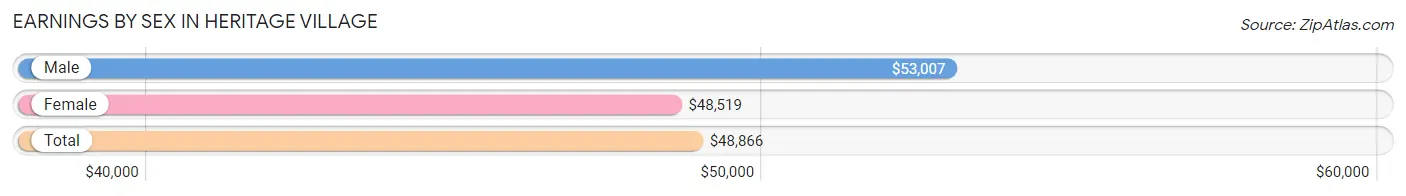
Earnings by Sex in Heritage Village
Average Earnings in Heritage Village are $48,866, $53,007 for men and $48,519 for women, a difference of 8.5%.
| Sex | Number | Average Earnings |
| Male | 445 (36.0%) | $53,007 |
| Female | 792 (64.0%) | $48,519 |
| Total | 1,237 (100.0%) | $48,866 |
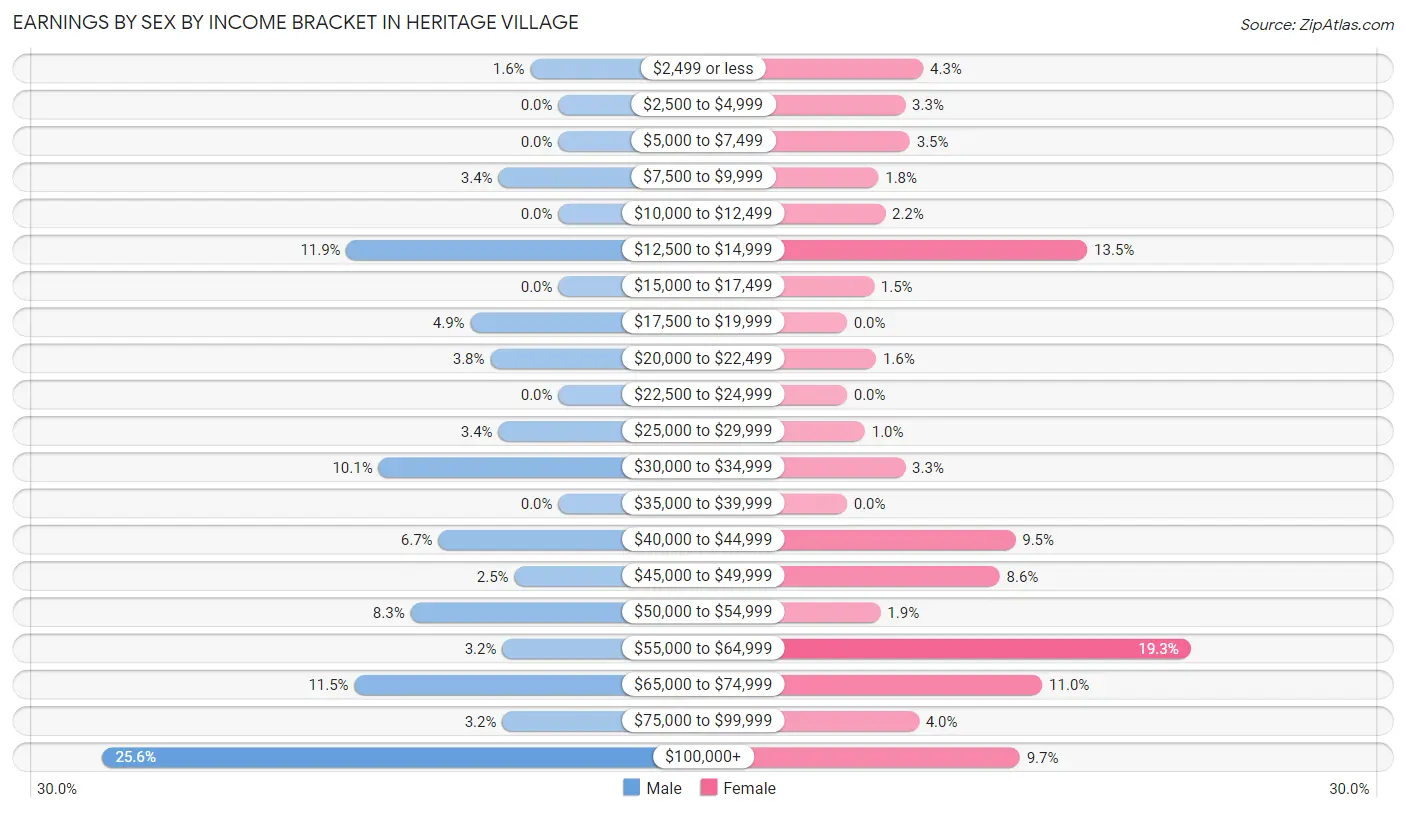
Earnings by Sex by Income Bracket in Heritage Village
The most common earnings brackets in Heritage Village are $100,000+ for men (114 | 25.6%) and $55,000 to $64,999 for women (153 | 19.3%).
| Income | Male | Female |
| $2,499 or less | 7 (1.6%) | 34 (4.3%) |
| $2,500 to $4,999 | 0 (0.0%) | 26 (3.3%) |
| $5,000 to $7,499 | 0 (0.0%) | 28 (3.5%) |
| $7,500 to $9,999 | 15 (3.4%) | 14 (1.8%) |
| $10,000 to $12,499 | 0 (0.0%) | 17 (2.1%) |
| $12,500 to $14,999 | 53 (11.9%) | 107 (13.5%) |
| $15,000 to $17,499 | 0 (0.0%) | 12 (1.5%) |
| $17,500 to $19,999 | 22 (4.9%) | 0 (0.0%) |
| $20,000 to $22,499 | 17 (3.8%) | 13 (1.6%) |
| $22,500 to $24,999 | 0 (0.0%) | 0 (0.0%) |
| $25,000 to $29,999 | 15 (3.4%) | 8 (1.0%) |
| $30,000 to $34,999 | 45 (10.1%) | 26 (3.3%) |
| $35,000 to $39,999 | 0 (0.0%) | 0 (0.0%) |
| $40,000 to $44,999 | 30 (6.7%) | 75 (9.5%) |
| $45,000 to $49,999 | 11 (2.5%) | 68 (8.6%) |
| $50,000 to $54,999 | 37 (8.3%) | 15 (1.9%) |
| $55,000 to $64,999 | 14 (3.2%) | 153 (19.3%) |
| $65,000 to $74,999 | 51 (11.5%) | 87 (11.0%) |
| $75,000 to $99,999 | 14 (3.2%) | 32 (4.0%) |
| $100,000+ | 114 (25.6%) | 77 (9.7%) |
| Total | 445 (100.0%) | 792 (100.0%) |
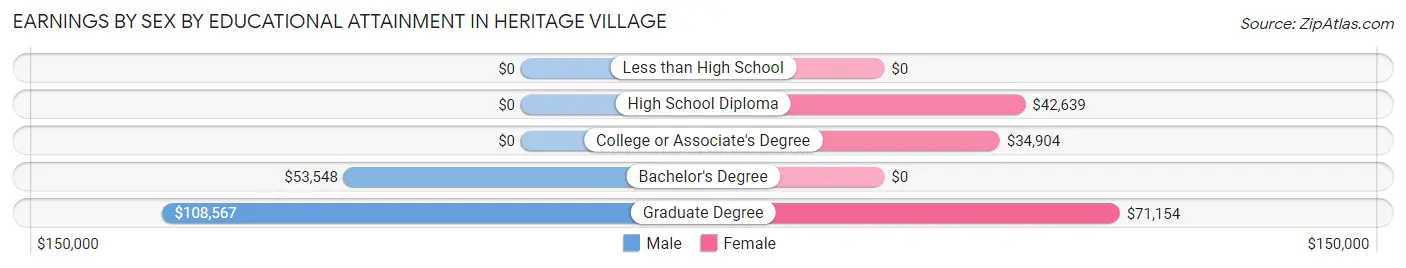
Earnings by Sex by Educational Attainment in Heritage Village
Average earnings in Heritage Village are $54,426 for men and $49,329 for women, a difference of 9.4%. Men with an educational attainment of graduate degree enjoy the highest average annual earnings of $108,567, while those with bachelor's degree education earn the least with $53,548. Women with an educational attainment of graduate degree earn the most with the average annual earnings of $71,154, while those with college or associate's degree education have the smallest earnings of $34,904.
| Educational Attainment | Male Income | Female Income |
| Less than High School | - | - |
| High School Diploma | - | - |
| College or Associate's Degree | - | - |
| Bachelor's Degree | $53,548 | $0 |
| Graduate Degree | $108,567 | $71,154 |
| Total | $54,426 | $49,329 |
Family Income in Heritage Village
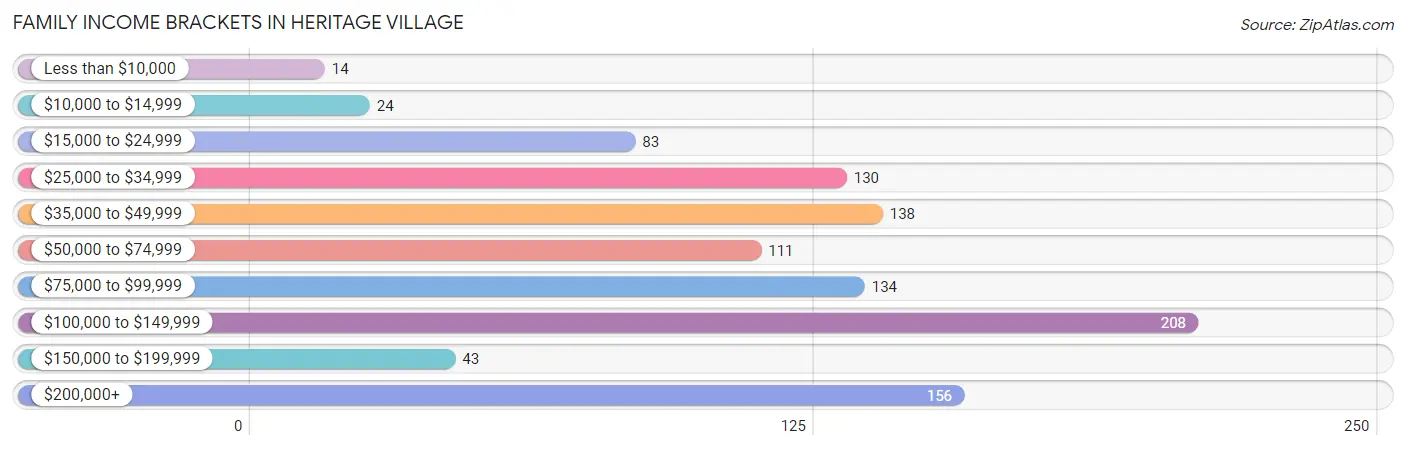
Family Income Brackets in Heritage Village
According to the Heritage Village family income data, there are 208 families falling into the $100,000 to $149,999 income range, which is the most common income bracket and makes up 20.0% of all families. Conversely, the less than $10,000 income bracket is the least frequent group with only 14 families (1.3%) belonging to this category.
| Income Bracket | # Families | % Families |
| Less than $10,000 | 14 | 1.3% |
| $10,000 to $14,999 | 24 | 2.3% |
| $15,000 to $24,999 | 83 | 8.0% |
| $25,000 to $34,999 | 130 | 12.5% |
| $35,000 to $49,999 | 138 | 13.2% |
| $50,000 to $74,999 | 111 | 10.7% |
| $75,000 to $99,999 | 134 | 12.9% |
| $100,000 to $149,999 | 208 | 20.0% |
| $150,000 to $199,999 | 43 | 4.1% |
| $200,000+ | 156 | 15.0% |
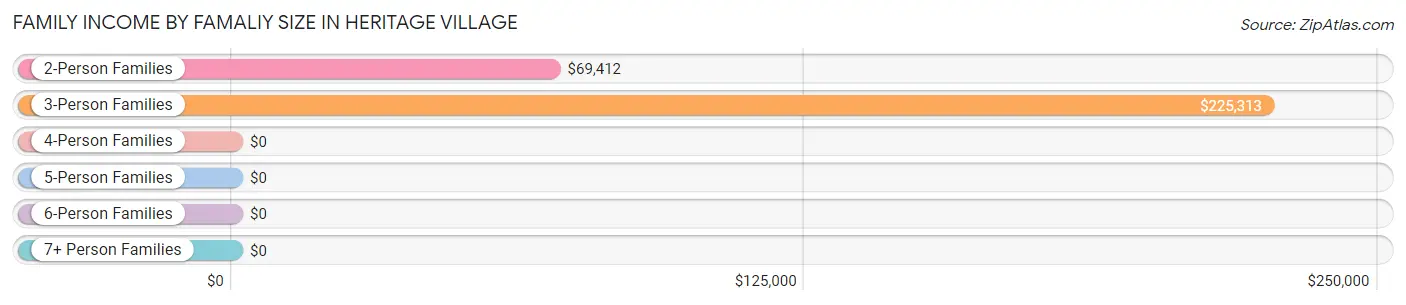
Family Income by Famaliy Size in Heritage Village
3-person families (98 | 9.4%) account for the highest median family income in Heritage Village with $225,313 per family, while 3-person families (98 | 9.4%) have the highest median income of $75,104 per family member.
| Income Bracket | # Families | Median Income |
| 2-Person Families | 938 (90.0%) | $69,412 |
| 3-Person Families | 98 (9.4%) | $225,313 |
| 4-Person Families | 0 (0.0%) | $0 |
| 5-Person Families | 6 (0.6%) | $0 |
| 6-Person Families | 0 (0.0%) | $0 |
| 7+ Person Families | 0 (0.0%) | $0 |
| Total | 1,042 (100.0%) | $80,446 |
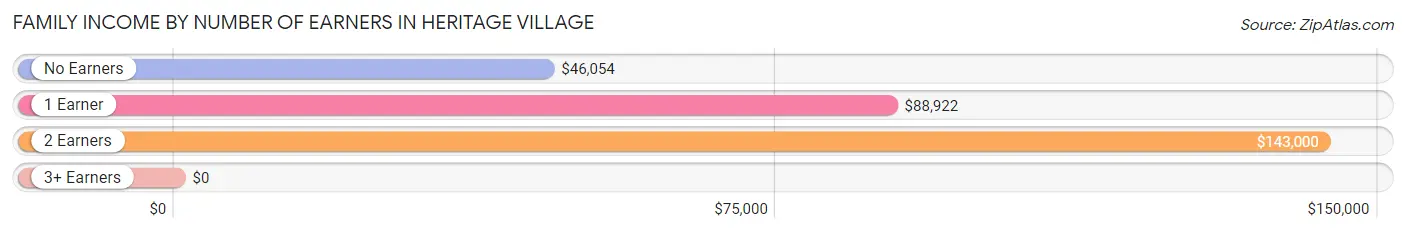
Family Income by Number of Earners in Heritage Village
| Number of Earners | # Families | Median Income |
| No Earners | 591 (56.7%) | $46,054 |
| 1 Earner | 241 (23.1%) | $88,922 |
| 2 Earners | 202 (19.4%) | $143,000 |
| 3+ Earners | 8 (0.8%) | $0 |
| Total | 1,042 (100.0%) | $80,446 |
Household Income in Heritage Village
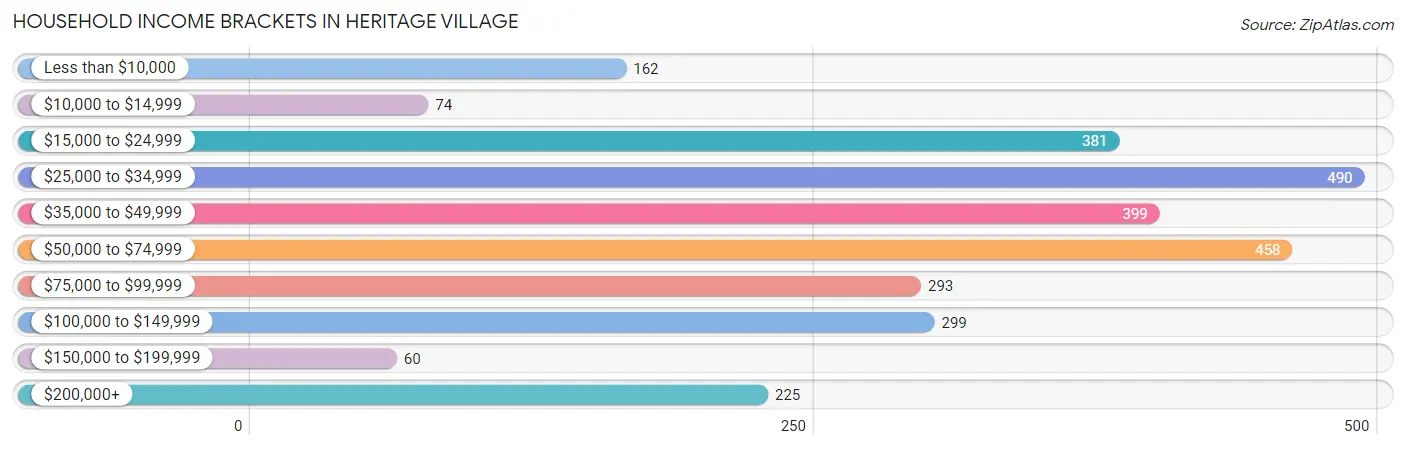
Household Income Brackets in Heritage Village
With 490 households falling in the category, the $25,000 to $34,999 income range is the most frequent in Heritage Village, accounting for 17.2% of all households. In contrast, only 60 households (2.1%) fall into the $150,000 to $199,999 income bracket, making it the least populous group.
| Income Bracket | # Households | % Households |
| Less than $10,000 | 162 | 5.7% |
| $10,000 to $14,999 | 74 | 2.6% |
| $15,000 to $24,999 | 381 | 13.4% |
| $25,000 to $34,999 | 490 | 17.2% |
| $35,000 to $49,999 | 399 | 14.0% |
| $50,000 to $74,999 | 458 | 16.1% |
| $75,000 to $99,999 | 293 | 10.3% |
| $100,000 to $149,999 | 299 | 10.5% |
| $150,000 to $199,999 | 60 | 2.1% |
| $200,000+ | 225 | 7.9% |
Household Income by Householder Age in Heritage Village
The median household income in Heritage Village is $46,663, with the highest median household income of $58,654 found in the 45 to 64 years age bracket for the primary householder. A total of 438 households (15.4%) fall into this category.
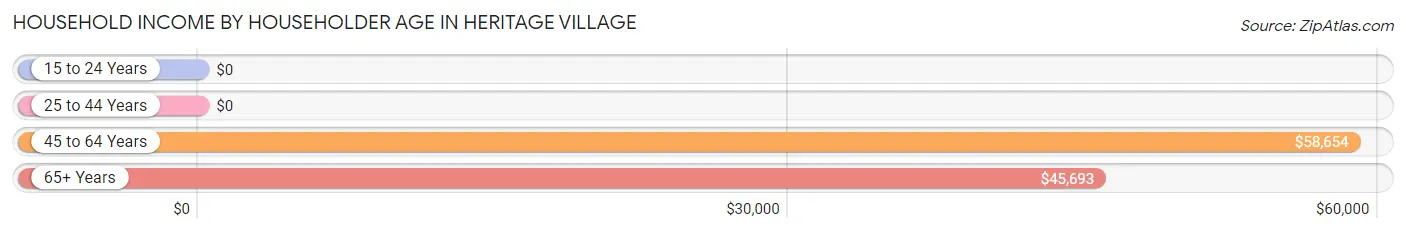
| Income Bracket | # Households | Median Income |
| 15 to 24 Years | 0 (0.0%) | $0 |
| 25 to 44 Years | 37 (1.3%) | $0 |
| 45 to 64 Years | 438 (15.4%) | $58,654 |
| 65+ Years | 2,372 (83.3%) | $45,693 |
| Total | 2,847 (100.0%) | $46,663 |
Poverty in Heritage Village
Income Below Poverty by Sex and Age in Heritage Village
With 3.6% poverty level for males and 8.3% for females among the residents of Heritage Village, 65 to 74 year old males and 45 to 54 year old females are the most vulnerable to poverty, with 36 males (8.4%) and 17 females (28.8%) in their respective age groups living below the poverty level.
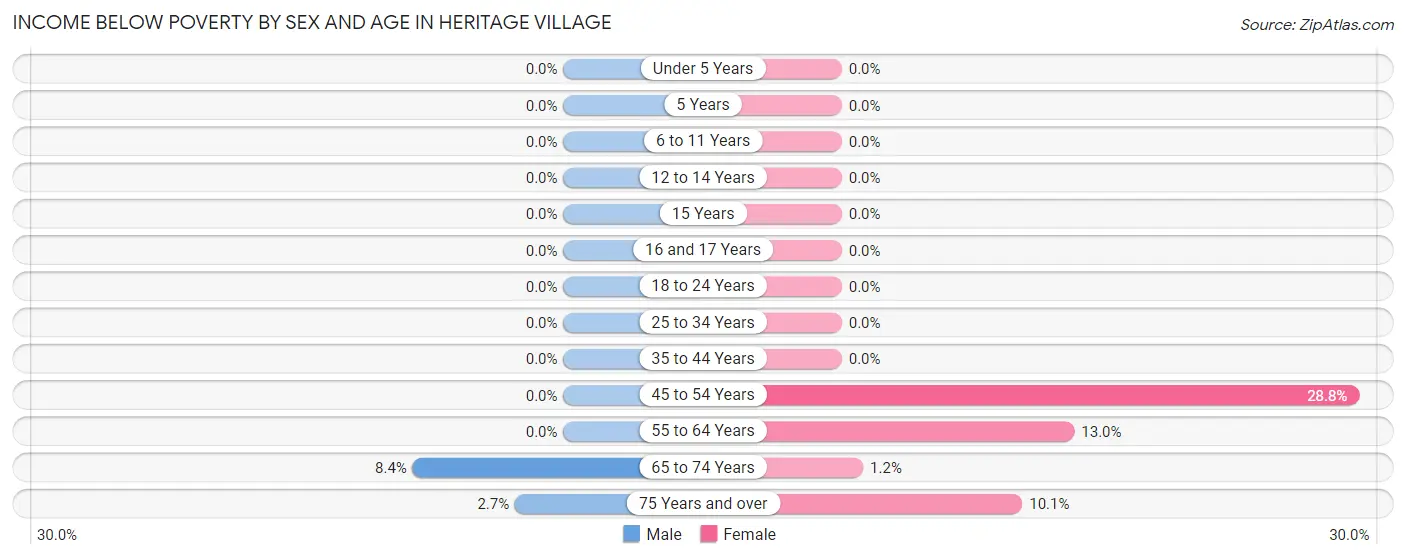
| Age Bracket | Male | Female |
| Under 5 Years | 0 (0.0%) | 0 (0.0%) |
| 5 Years | 0 (0.0%) | 0 (0.0%) |
| 6 to 11 Years | 0 (0.0%) | 0 (0.0%) |
| 12 to 14 Years | 0 (0.0%) | 0 (0.0%) |
| 15 Years | 0 (0.0%) | 0 (0.0%) |
| 16 and 17 Years | 0 (0.0%) | 0 (0.0%) |
| 18 to 24 Years | 0 (0.0%) | 0 (0.0%) |
| 25 to 34 Years | 0 (0.0%) | 0 (0.0%) |
| 35 to 44 Years | 0 (0.0%) | 0 (0.0%) |
| 45 to 54 Years | 0 (0.0%) | 17 (28.8%) |
| 55 to 64 Years | 0 (0.0%) | 69 (13.0%) |
| 65 to 74 Years | 36 (8.4%) | 8 (1.2%) |
| 75 Years and over | 18 (2.7%) | 141 (10.1%) |
| Total | 54 (3.6%) | 235 (8.3%) |
Income Above Poverty by Sex and Age in Heritage Village
According to the poverty statistics in Heritage Village, males aged 6 to 11 years and females aged under 5 years are the age groups that are most secure financially, with 100.0% of males and 100.0% of females in these age groups living above the poverty line.
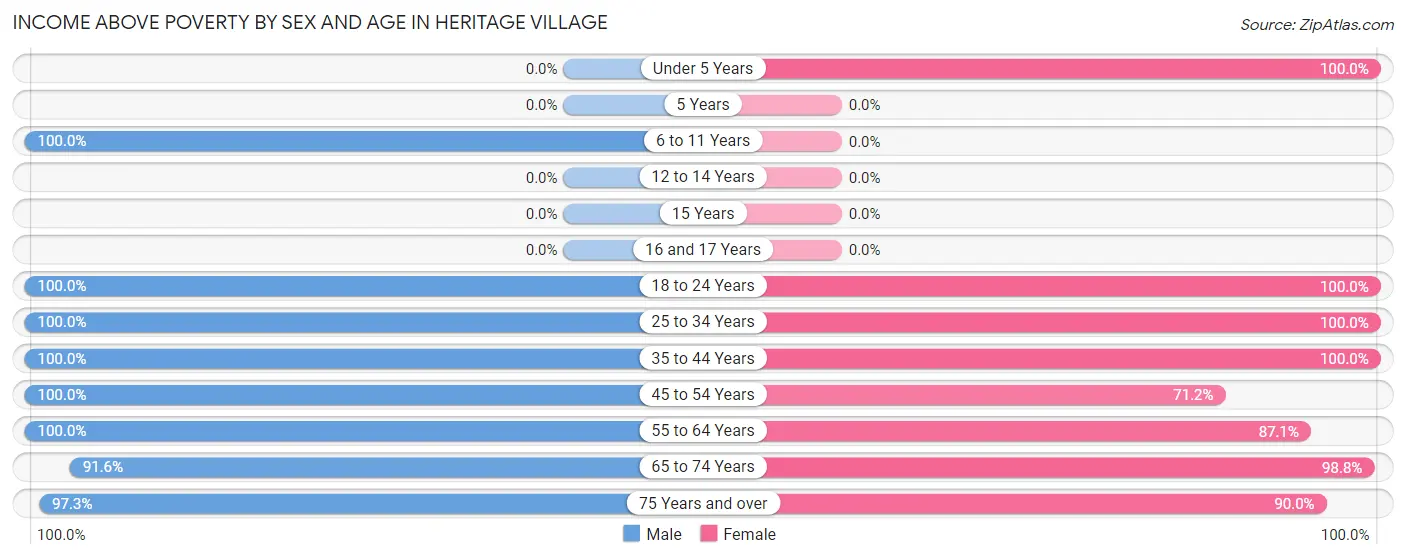
| Age Bracket | Male | Female |
| Under 5 Years | 0 (0.0%) | 7 (100.0%) |
| 5 Years | 0 (0.0%) | 0 (0.0%) |
| 6 to 11 Years | 30 (100.0%) | 0 (0.0%) |
| 12 to 14 Years | 0 (0.0%) | 0 (0.0%) |
| 15 Years | 0 (0.0%) | 0 (0.0%) |
| 16 and 17 Years | 0 (0.0%) | 0 (0.0%) |
| 18 to 24 Years | 42 (100.0%) | 85 (100.0%) |
| 25 to 34 Years | 53 (100.0%) | 61 (100.0%) |
| 35 to 44 Years | 14 (100.0%) | 6 (100.0%) |
| 45 to 54 Years | 29 (100.0%) | 42 (71.2%) |
| 55 to 64 Years | 236 (100.0%) | 464 (87.1%) |
| 65 to 74 Years | 393 (91.6%) | 663 (98.8%) |
| 75 Years and over | 652 (97.3%) | 1,262 (89.9%) |
| Total | 1,449 (96.4%) | 2,590 (91.7%) |
Income Below Poverty Among Married-Couple Families in Heritage Village
The poverty statistics for married-couple families in Heritage Village show that 4.1% or 33 of the total 811 families live below the poverty line. Families with no children have the highest poverty rate of 4.2%, comprising of 33 families. On the other hand, families with 1 or 2 children have the lowest poverty rate of 0.0%, which includes 0 families.
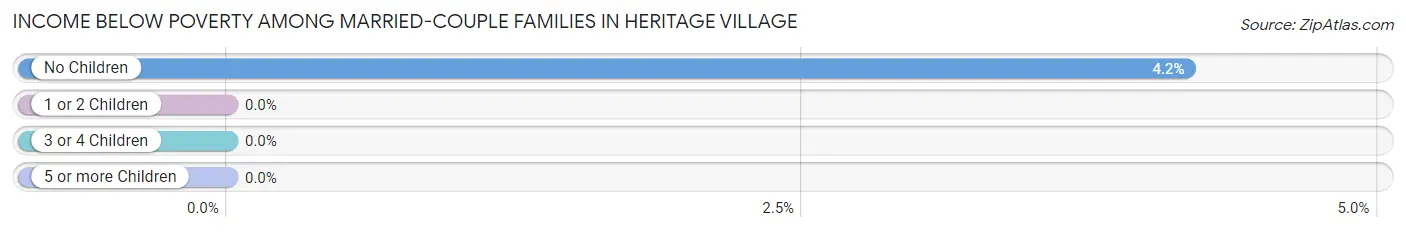
| Children | Above Poverty | Below Poverty |
| No Children | 758 (95.8%) | 33 (4.2%) |
| 1 or 2 Children | 14 (100.0%) | 0 (0.0%) |
| 3 or 4 Children | 6 (100.0%) | 0 (0.0%) |
| 5 or more Children | 0 (0.0%) | 0 (0.0%) |
| Total | 778 (95.9%) | 33 (4.1%) |
Income Below Poverty Among Single-Parent Households in Heritage Village
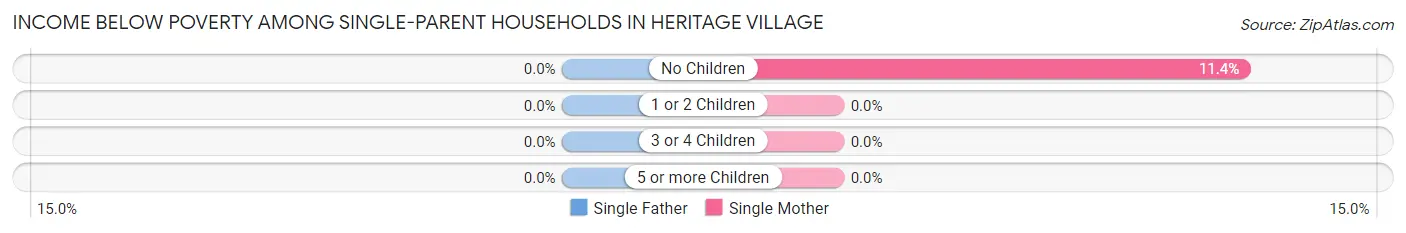
| Children | Single Father | Single Mother |
| No Children | 0 (0.0%) | 14 (11.4%) |
| 1 or 2 Children | 0 (0.0%) | 0 (0.0%) |
| 3 or 4 Children | 0 (0.0%) | 0 (0.0%) |
| 5 or more Children | 0 (0.0%) | 0 (0.0%) |
| Total | 0 (0.0%) | 14 (11.4%) |
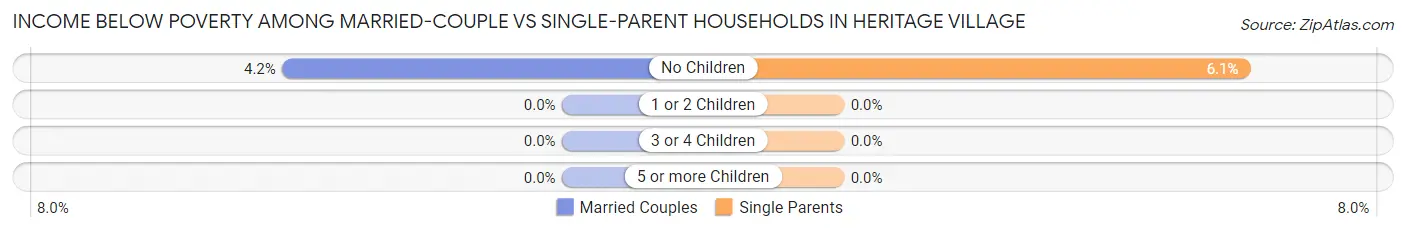
Income Below Poverty Among Married-Couple vs Single-Parent Households in Heritage Village
The poverty data for Heritage Village shows that 33 of the married-couple family households (4.1%) and 14 of the single-parent households (6.1%) are living below the poverty level. Within the married-couple family households, those with no children have the highest poverty rate, with 33 households (4.2%) falling below the poverty line. Among the single-parent households, those with no children have the highest poverty rate, with 14 household (6.1%) living below poverty.
| Children | Married-Couple Families | Single-Parent Households |
| No Children | 33 (4.2%) | 14 (6.1%) |
| 1 or 2 Children | 0 (0.0%) | 0 (0.0%) |
| 3 or 4 Children | 0 (0.0%) | 0 (0.0%) |
| 5 or more Children | 0 (0.0%) | 0 (0.0%) |
| Total | 33 (4.1%) | 14 (6.1%) |
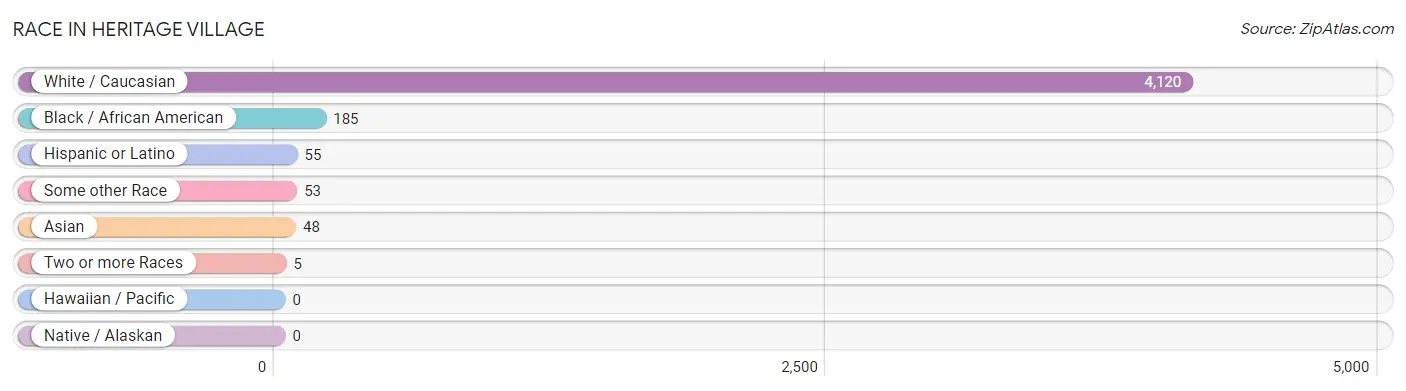
Race in Heritage Village
The most populous races in Heritage Village are White / Caucasian (4,120 | 93.4%), Black / African American (185 | 4.2%), and Hispanic or Latino (55 | 1.3%).
| Race | # Population | % Population |
| Asian | 48 | 1.1% |
| Black / African American | 185 | 4.2% |
| Hawaiian / Pacific | 0 | 0.0% |
| Hispanic or Latino | 55 | 1.3% |
| Native / Alaskan | 0 | 0.0% |
| White / Caucasian | 4,120 | 93.4% |
| Two or more Races | 5 | 0.1% |
| Some other Race | 53 | 1.2% |
| Total | 4,411 | 100.0% |
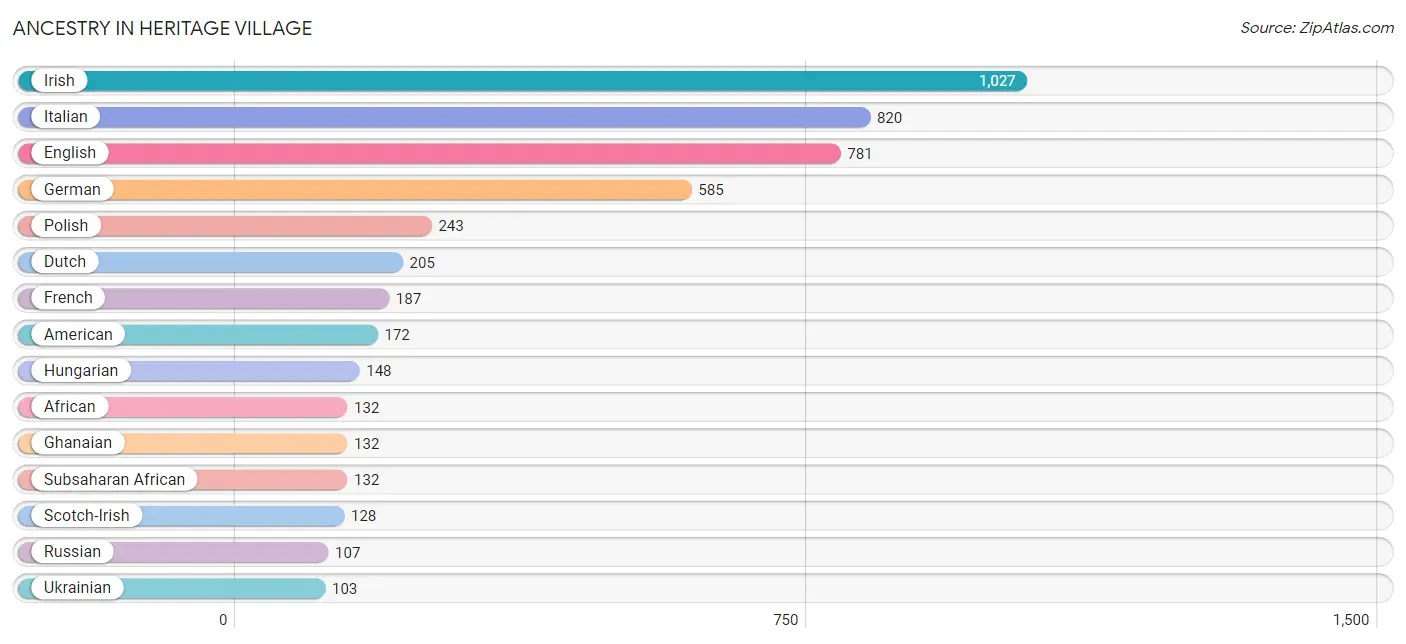
Ancestry in Heritage Village
The most populous ancestries reported in Heritage Village are Irish (1,027 | 23.3%), Italian (820 | 18.6%), English (781 | 17.7%), German (585 | 13.3%), and Polish (243 | 5.5%), together accounting for 78.3% of all Heritage Village residents.
| Ancestry | # Population | % Population |
| African | 132 | 3.0% |
| Alsatian | 25 | 0.6% |
| American | 172 | 3.9% |
| Arab | 96 | 2.2% |
| Austrian | 17 | 0.4% |
| British | 37 | 0.8% |
| Canadian | 21 | 0.5% |
| Croatian | 18 | 0.4% |
| Cuban | 18 | 0.4% |
| Czech | 43 | 1.0% |
| Danish | 33 | 0.7% |
| Dutch | 205 | 4.6% |
| Eastern European | 19 | 0.4% |
| English | 781 | 17.7% |
| French | 187 | 4.2% |
| French Canadian | 70 | 1.6% |
| German | 585 | 13.3% |
| Ghanaian | 132 | 3.0% |
| Greek | 27 | 0.6% |
| Hungarian | 148 | 3.4% |
| Irish | 1,027 | 23.3% |
| Israeli | 74 | 1.7% |
| Italian | 820 | 18.6% |
| Latvian | 14 | 0.3% |
| Lebanese | 12 | 0.3% |
| Lithuanian | 20 | 0.4% |
| Norwegian | 50 | 1.1% |
| Polish | 243 | 5.5% |
| Puerto Rican | 37 | 0.8% |
| Russian | 107 | 2.4% |
| Scotch-Irish | 128 | 2.9% |
| Scottish | 68 | 1.5% |
| Slovak | 48 | 1.1% |
| Subsaharan African | 132 | 3.0% |
| Swedish | 57 | 1.3% |
| Syrian | 10 | 0.2% |
| Thai | 48 | 1.1% |
| Ukrainian | 103 | 2.3% |
| Welsh | 23 | 0.5% | View All 39 Rows |
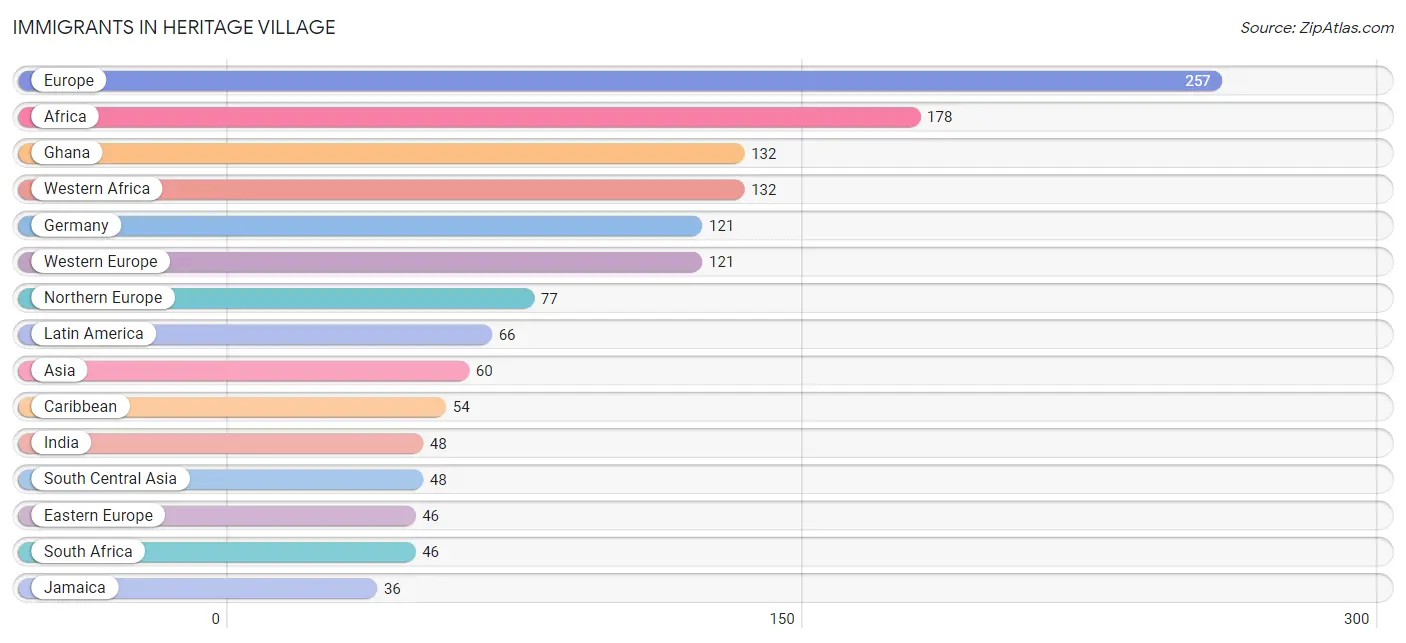
Immigrants in Heritage Village
The most numerous immigrant groups reported in Heritage Village came from Europe (257 | 5.8%), Africa (178 | 4.0%), Ghana (132 | 3.0%), Western Africa (132 | 3.0%), and Germany (121 | 2.7%), together accounting for 18.6% of all Heritage Village residents.
| Immigration Origin | # Population | % Population |
| Africa | 178 | 4.0% |
| Asia | 60 | 1.4% |
| Caribbean | 54 | 1.2% |
| Colombia | 12 | 0.3% |
| Croatia | 9 | 0.2% |
| Cuba | 18 | 0.4% |
| Eastern Europe | 46 | 1.0% |
| England | 27 | 0.6% |
| Europe | 257 | 5.8% |
| Germany | 121 | 2.7% |
| Ghana | 132 | 3.0% |
| Greece | 13 | 0.3% |
| India | 48 | 1.1% |
| Jamaica | 36 | 0.8% |
| Latin America | 66 | 1.5% |
| Lebanon | 12 | 0.3% |
| Northern Europe | 77 | 1.8% |
| Poland | 27 | 0.6% |
| South Africa | 46 | 1.0% |
| South America | 12 | 0.3% |
| South Central Asia | 48 | 1.1% |
| Southern Europe | 13 | 0.3% |
| Ukraine | 10 | 0.2% |
| Western Africa | 132 | 3.0% |
| Western Asia | 12 | 0.3% |
| Western Europe | 121 | 2.7% | View All 26 Rows |
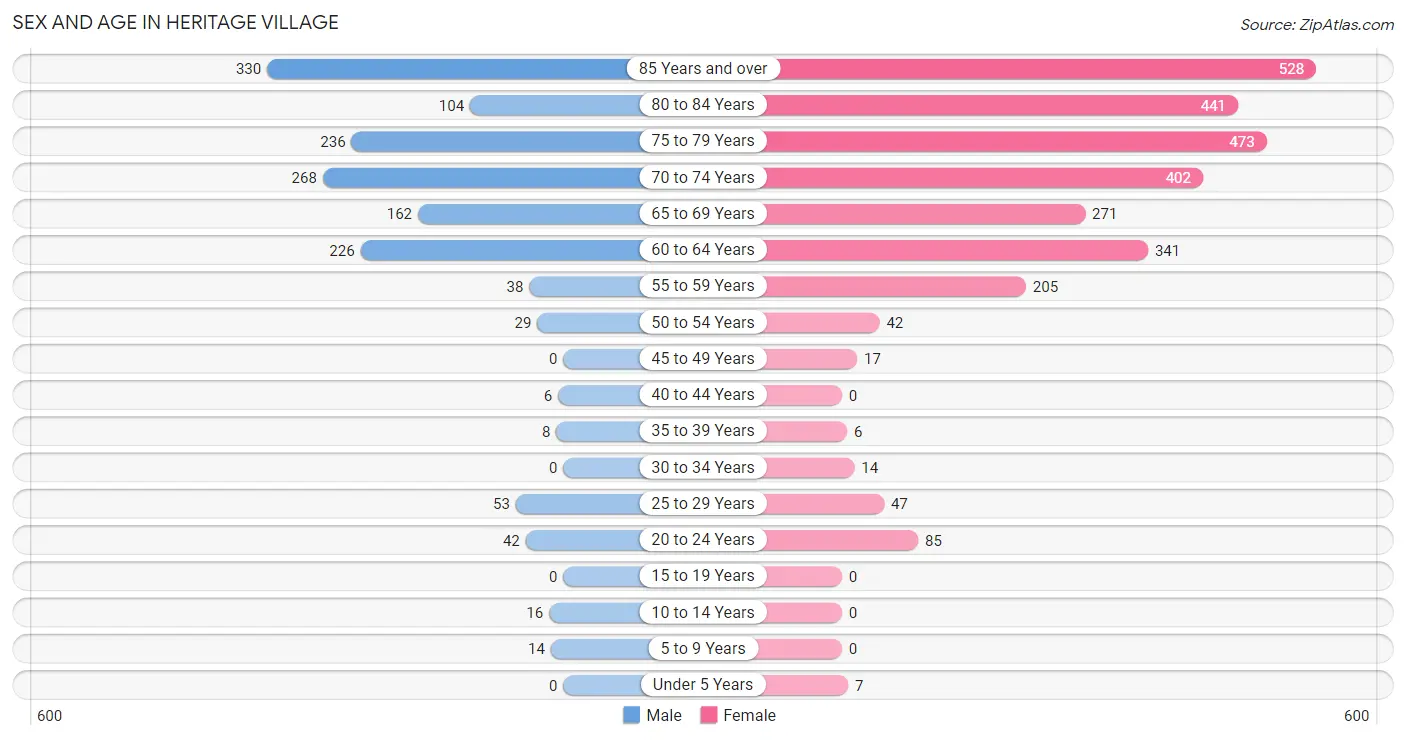
Sex and Age in Heritage Village
Sex and Age in Heritage Village
The most populous age groups in Heritage Village are 85 Years and over (330 | 21.5%) for men and 85 Years and over (528 | 18.3%) for women.
| Age Bracket | Male | Female |
| Under 5 Years | 0 (0.0%) | 7 (0.2%) |
| 5 to 9 Years | 14 (0.9%) | 0 (0.0%) |
| 10 to 14 Years | 16 (1.0%) | 0 (0.0%) |
| 15 to 19 Years | 0 (0.0%) | 0 (0.0%) |
| 20 to 24 Years | 42 (2.7%) | 85 (2.9%) |
| 25 to 29 Years | 53 (3.5%) | 47 (1.6%) |
| 30 to 34 Years | 0 (0.0%) | 14 (0.5%) |
| 35 to 39 Years | 8 (0.5%) | 6 (0.2%) |
| 40 to 44 Years | 6 (0.4%) | 0 (0.0%) |
| 45 to 49 Years | 0 (0.0%) | 17 (0.6%) |
| 50 to 54 Years | 29 (1.9%) | 42 (1.5%) |
| 55 to 59 Years | 38 (2.5%) | 205 (7.1%) |
| 60 to 64 Years | 226 (14.7%) | 341 (11.8%) |
| 65 to 69 Years | 162 (10.6%) | 271 (9.4%) |
| 70 to 74 Years | 268 (17.5%) | 402 (14.0%) |
| 75 to 79 Years | 236 (15.4%) | 473 (16.4%) |
| 80 to 84 Years | 104 (6.8%) | 441 (15.3%) |
| 85 Years and over | 330 (21.5%) | 528 (18.3%) |
| Total | 1,532 (100.0%) | 2,879 (100.0%) |
Families and Households in Heritage Village
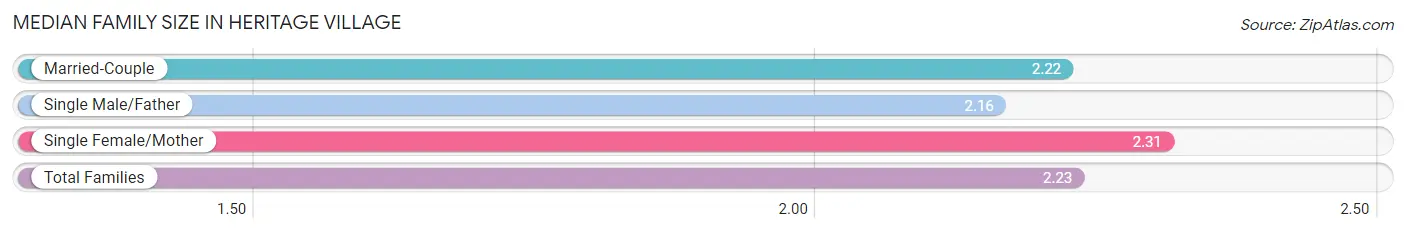
Median Family Size in Heritage Village
The median family size in Heritage Village is 2.23 persons per family, with single female/mother families (123 | 11.8%) accounting for the largest median family size of 2.31 persons per family. On the other hand, single male/father families (108 | 10.4%) represent the smallest median family size with 2.16 persons per family.
| Family Type | # Families | Family Size |
| Married-Couple | 811 (77.8%) | 2.22 |
| Single Male/Father | 108 (10.4%) | 2.16 |
| Single Female/Mother | 123 (11.8%) | 2.31 |
| Total Families | 1,042 (100.0%) | 2.23 |
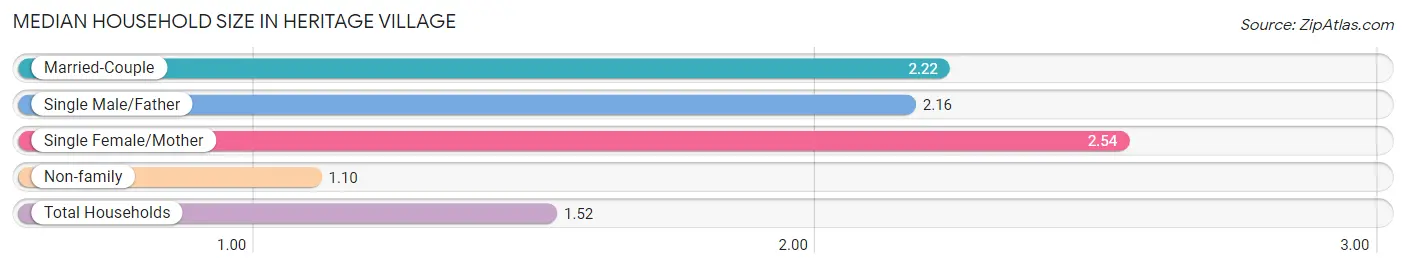
Median Household Size in Heritage Village
The median household size in Heritage Village is 1.52 persons per household, with single female/mother households (123 | 4.3%) accounting for the largest median household size of 2.54 persons per household. non-family households (1,805 | 63.4%) represent the smallest median household size with 1.10 persons per household.
| Household Type | # Households | Household Size |
| Married-Couple | 811 (28.5%) | 2.22 |
| Single Male/Father | 108 (3.8%) | 2.16 |
| Single Female/Mother | 123 (4.3%) | 2.54 |
| Non-family | 1,805 (63.4%) | 1.10 |
| Total Households | 2,847 (100.0%) | 1.52 |
Household Size by Marriage Status in Heritage Village
Out of a total of 2,847 households in Heritage Village, 1,042 (36.6%) are family households, while 1,805 (63.4%) are nonfamily households. The most numerous type of family households are 2-person households, comprising 912, and the most common type of nonfamily households are 1-person households, comprising 1,732.
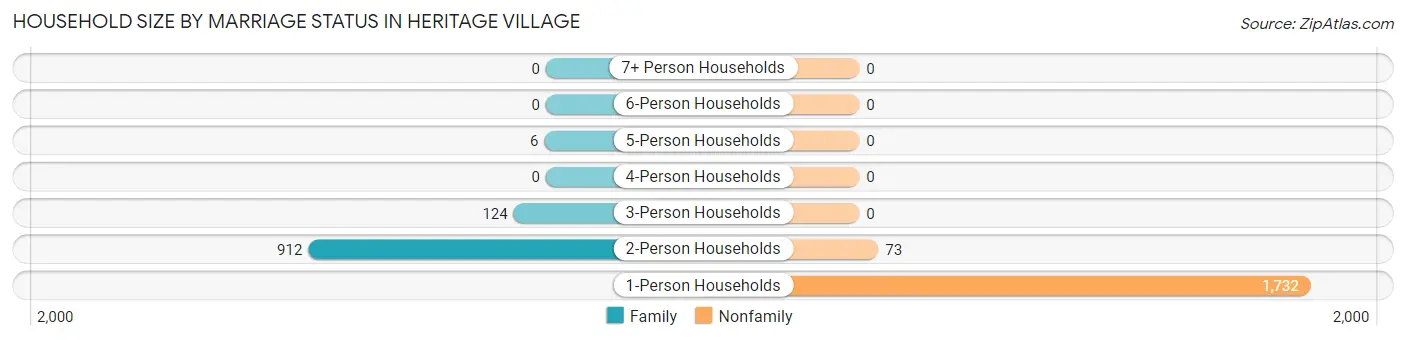
| Household Size | Family Households | Nonfamily Households |
| 1-Person Households | - | 1,732 (60.8%) |
| 2-Person Households | 912 (32.0%) | 73 (2.6%) |
| 3-Person Households | 124 (4.4%) | 0 (0.0%) |
| 4-Person Households | 0 (0.0%) | 0 (0.0%) |
| 5-Person Households | 6 (0.2%) | 0 (0.0%) |
| 6-Person Households | 0 (0.0%) | 0 (0.0%) |
| 7+ Person Households | 0 (0.0%) | 0 (0.0%) |
| Total | 1,042 (36.6%) | 1,805 (63.4%) |
Female Fertility in Heritage Village
Fertility by Age in Heritage Village
| Age Bracket | Women with Births | Births / 1,000 Women |
| 15 to 19 years | 0 (0.0%) | 0.0 |
| 20 to 34 years | 0 (0.0%) | 0.0 |
| 35 to 50 years | 0 (0.0%) | 0.0 |
| Total | 0 (0.0%) | 0.0 |
Fertility by Age by Marriage Status in Heritage Village
| Age Bracket | Married | Unmarried |
| 15 to 19 years | 0 (0.0%) | 0 (0.0%) |
| 20 to 34 years | 0 (0.0%) | 0 (0.0%) |
| 35 to 50 years | 0 (0.0%) | 0 (0.0%) |
| Total | 0 (0.0%) | 0 (0.0%) |
Fertility by Education in Heritage Village
| Educational Attainment | Women with Births | Births / 1,000 Women |
| Less than High School | 0 (0.0%) | 0.0 |
| High School Diploma | 0 (0.0%) | 0.0 |
| College or Associate's Degree | 0 (0.0%) | 0.0 |
| Bachelor's Degree | 0 (0.0%) | 0.0 |
| Graduate Degree | 0 (0.0%) | 0.0 |
| Total | 0 (0.0%) | 0.0 |
Fertility by Education by Marriage Status in Heritage Village
| Educational Attainment | Married | Unmarried |
| Less than High School | 0 (0.0%) | 0 (0.0%) |
| High School Diploma | 0 (0.0%) | 0 (0.0%) |
| College or Associate's Degree | 0 (0.0%) | 0 (0.0%) |
| Bachelor's Degree | 0 (0.0%) | 0 (0.0%) |
| Graduate Degree | 0 (0.0%) | 0 (0.0%) |
| Total | 0 (0.0%) | 0 (0.0%) |
Employment Characteristics in Heritage Village
Employment by Class of Employer in Heritage Village
Among the 1,119 employed individuals in Heritage Village, private company employees (514 | 45.9%), self-employed (not incorporated) (173 | 15.5%), and state government employees (149 | 13.3%) make up the most common classes of employment.
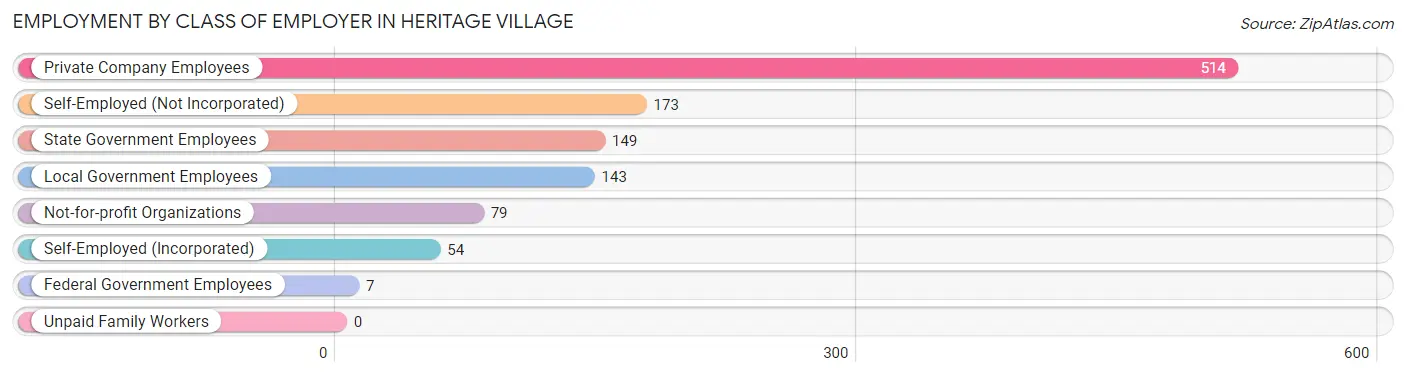
| Employer Class | # Employees | % Employees |
| Private Company Employees | 514 | 45.9% |
| Self-Employed (Incorporated) | 54 | 4.8% |
| Self-Employed (Not Incorporated) | 173 | 15.5% |
| Not-for-profit Organizations | 79 | 7.1% |
| Local Government Employees | 143 | 12.8% |
| State Government Employees | 149 | 13.3% |
| Federal Government Employees | 7 | 0.6% |
| Unpaid Family Workers | 0 | 0.0% |
| Total | 1,119 | 100.0% |
Employment Status by Age in Heritage Village
According to the labor force statistics for Heritage Village, out of the total population over 16 years of age (4,374), 26.5% or 1,159 individuals are in the labor force, with 3.4% or 39 of them unemployed. The age group with the highest labor force participation rate is 25 to 29 years, with 100.0% or 100 individuals in the labor force. Within the labor force, the 45 to 54 years age range has the highest percentage of unemployed individuals, with 47.5% or 29 of them being unemployed.
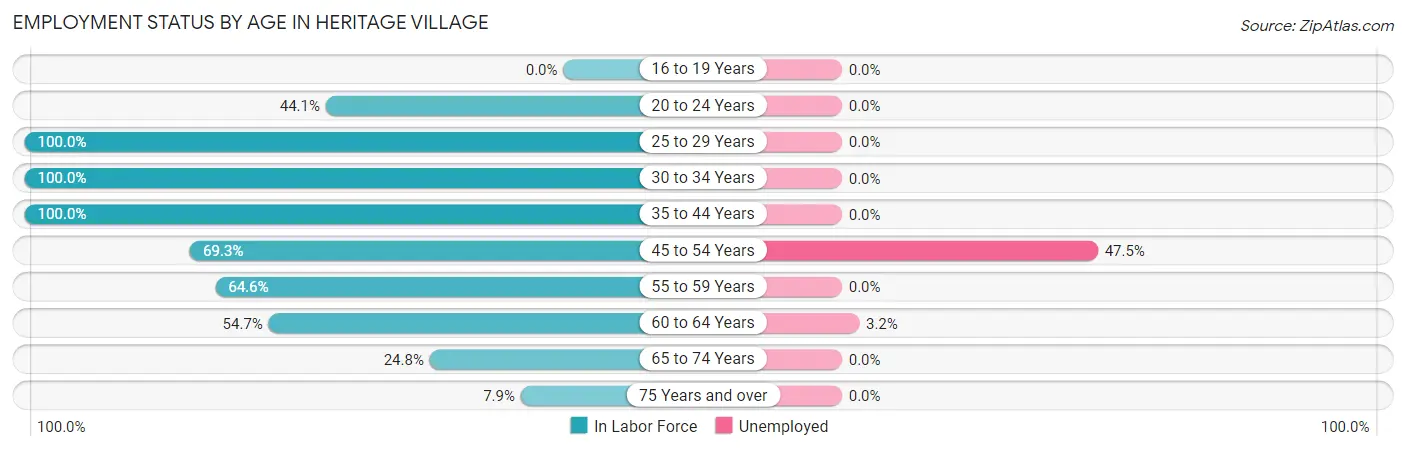
| Age Bracket | In Labor Force | Unemployed |
| 16 to 19 Years | 0 (0.0%) | 0 (0.0%) |
| 20 to 24 Years | 56 (44.1%) | 0 (0.0%) |
| 25 to 29 Years | 100 (100.0%) | 0 (0.0%) |
| 30 to 34 Years | 14 (100.0%) | 0 (0.0%) |
| 35 to 44 Years | 20 (100.0%) | 0 (0.0%) |
| 45 to 54 Years | 61 (69.3%) | 29 (47.5%) |
| 55 to 59 Years | 157 (64.6%) | 0 (0.0%) |
| 60 to 64 Years | 310 (54.7%) | 10 (3.2%) |
| 65 to 74 Years | 274 (24.8%) | 0 (0.0%) |
| 75 Years and over | 167 (7.9%) | 0 (0.0%) |
| Total | 1,159 (26.5%) | 39 (3.4%) |
Employment Status by Educational Attainment in Heritage Village
According to labor force statistics for Heritage Village, 64.1% of individuals (662) out of the total population between 25 and 64 years of age (1,032) are in the labor force, with 5.9% or 39 of them being unemployed. The group with the highest labor force participation rate are those with the educational attainment of less than high school, with 93.6% or 175 individuals in the labor force. Within the labor force, individuals with less than high school education have the highest percentage of unemployment, with 16.6% or 29 of them being unemployed.
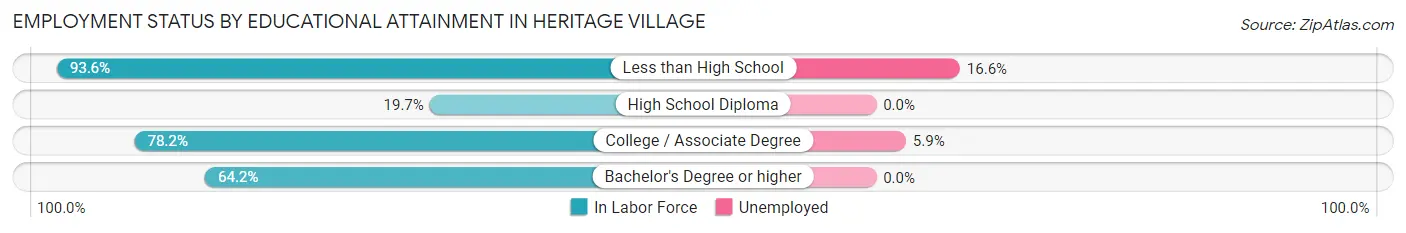
| Educational Attainment | In Labor Force | Unemployed |
| Less than High School | 175 (93.6%) | 31 (16.6%) |
| High School Diploma | 38 (19.7%) | 0 (0.0%) |
| College / Associate Degree | 169 (78.2%) | 13 (5.9%) |
| Bachelor's Degree or higher | 280 (64.2%) | 0 (0.0%) |
| Total | 662 (64.1%) | 61 (5.9%) |
Employment Occupations by Sex in Heritage Village
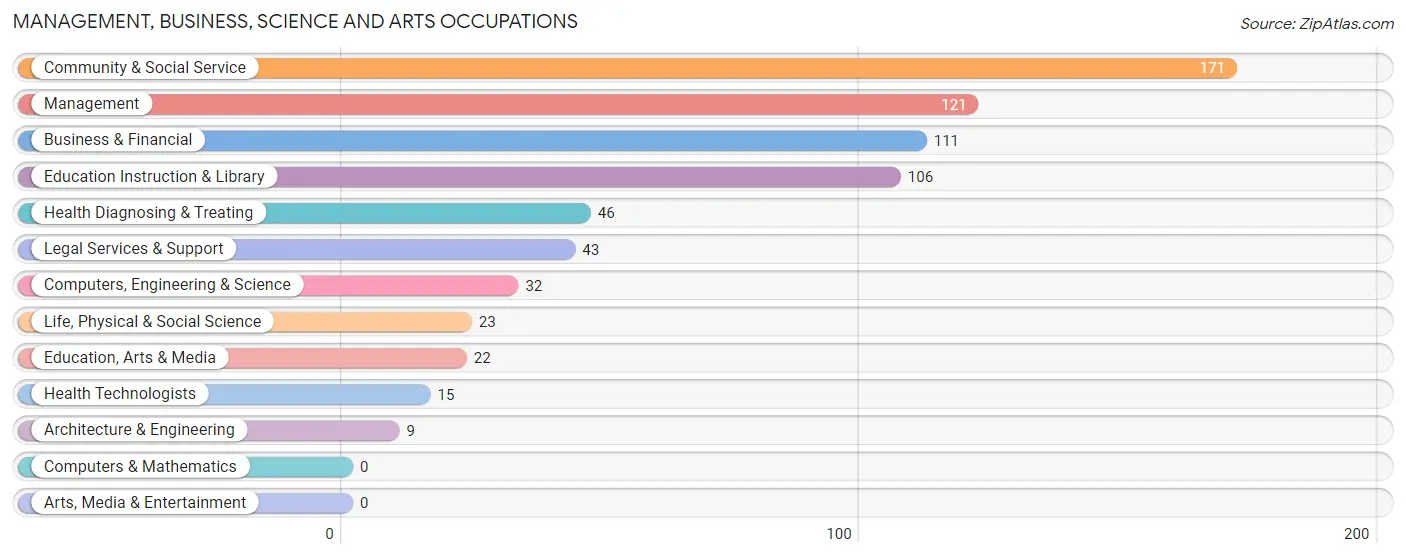
Management, Business, Science and Arts Occupations
The most common Management, Business, Science and Arts occupations in Heritage Village are Community & Social Service (171 | 15.3%), Management (121 | 10.8%), Business & Financial (111 | 9.9%), Education Instruction & Library (106 | 9.5%), and Health Diagnosing & Treating (46 | 4.1%).
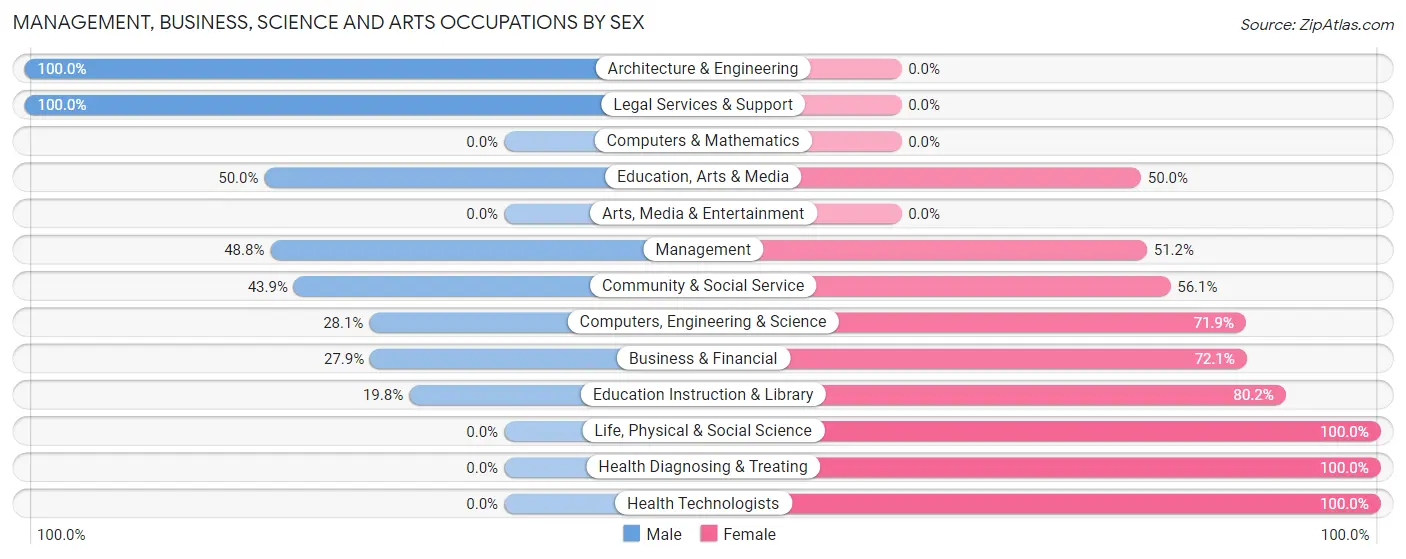
Management, Business, Science and Arts Occupations by Sex
Within the Management, Business, Science and Arts occupations in Heritage Village, the most male-oriented occupations are Architecture & Engineering (100.0%), Legal Services & Support (100.0%), and Education, Arts & Media (50.0%), while the most female-oriented occupations are Life, Physical & Social Science (100.0%), Health Diagnosing & Treating (100.0%), and Health Technologists (100.0%).
| Occupation | Male | Female |
| Management | 59 (48.8%) | 62 (51.2%) |
| Business & Financial | 31 (27.9%) | 80 (72.1%) |
| Computers, Engineering & Science | 9 (28.1%) | 23 (71.9%) |
| Computers & Mathematics | 0 (0.0%) | 0 (0.0%) |
| Architecture & Engineering | 9 (100.0%) | 0 (0.0%) |
| Life, Physical & Social Science | 0 (0.0%) | 23 (100.0%) |
| Community & Social Service | 75 (43.9%) | 96 (56.1%) |
| Education, Arts & Media | 11 (50.0%) | 11 (50.0%) |
| Legal Services & Support | 43 (100.0%) | 0 (0.0%) |
| Education Instruction & Library | 21 (19.8%) | 85 (80.2%) |
| Arts, Media & Entertainment | 0 (0.0%) | 0 (0.0%) |
| Health Diagnosing & Treating | 0 (0.0%) | 46 (100.0%) |
| Health Technologists | 0 (0.0%) | 15 (100.0%) |
| Total (Category) | 174 (36.2%) | 307 (63.8%) |
| Total (Overall) | 438 (39.1%) | 681 (60.9%) |
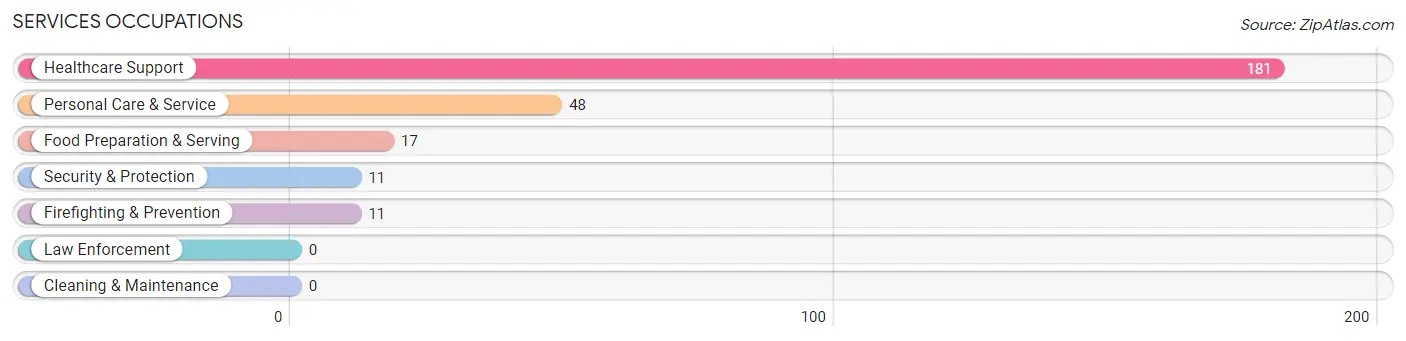
Services Occupations
The most common Services occupations in Heritage Village are Healthcare Support (181 | 16.2%), Personal Care & Service (48 | 4.3%), Food Preparation & Serving (17 | 1.5%), Security & Protection (11 | 1.0%), and Firefighting & Prevention (11 | 1.0%).
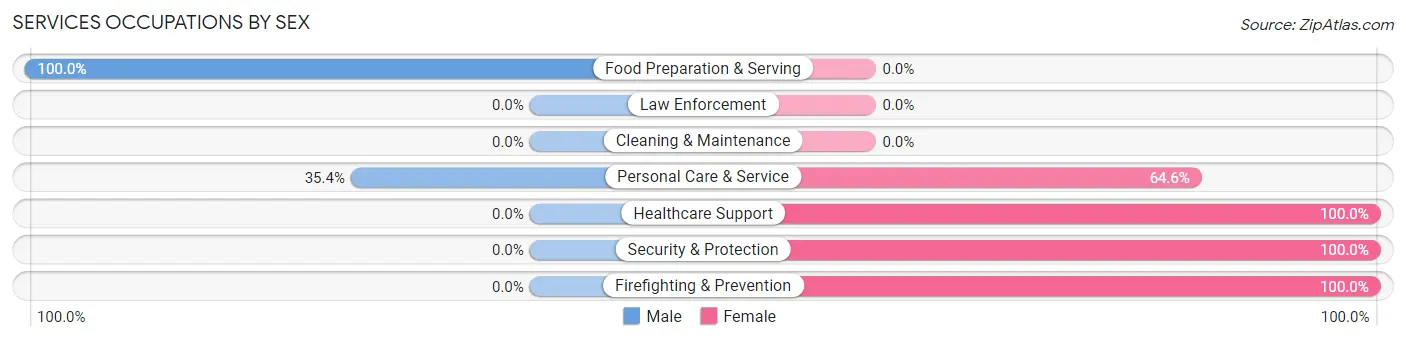
Services Occupations by Sex
Within the Services occupations in Heritage Village, the most male-oriented occupations are Food Preparation & Serving (100.0%), and Personal Care & Service (35.4%), while the most female-oriented occupations are Healthcare Support (100.0%), Security & Protection (100.0%), and Firefighting & Prevention (100.0%).
| Occupation | Male | Female |
| Healthcare Support | 0 (0.0%) | 181 (100.0%) |
| Security & Protection | 0 (0.0%) | 11 (100.0%) |
| Firefighting & Prevention | 0 (0.0%) | 11 (100.0%) |
| Law Enforcement | 0 (0.0%) | 0 (0.0%) |
| Food Preparation & Serving | 17 (100.0%) | 0 (0.0%) |
| Cleaning & Maintenance | 0 (0.0%) | 0 (0.0%) |
| Personal Care & Service | 17 (35.4%) | 31 (64.6%) |
| Total (Category) | 34 (13.2%) | 223 (86.8%) |
| Total (Overall) | 438 (39.1%) | 681 (60.9%) |
Sales and Office Occupations
The most common Sales and Office occupations in Heritage Village are Office & Administration (195 | 17.4%), and Sales & Related (123 | 11.0%).
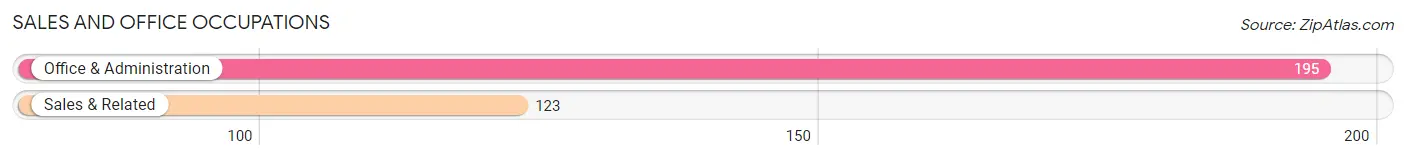
Sales and Office Occupations by Sex
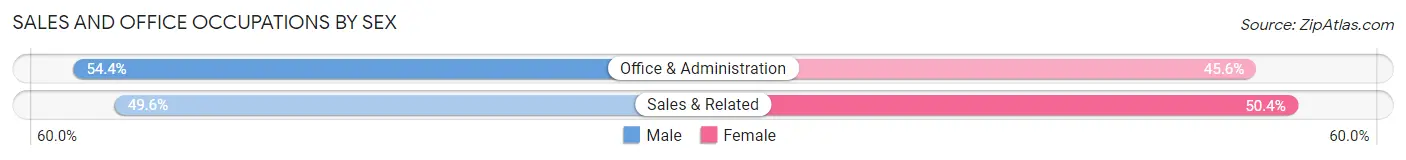
| Occupation | Male | Female |
| Sales & Related | 61 (49.6%) | 62 (50.4%) |
| Office & Administration | 106 (54.4%) | 89 (45.6%) |
| Total (Category) | 167 (52.5%) | 151 (47.5%) |
| Total (Overall) | 438 (39.1%) | 681 (60.9%) |
Natural Resources, Construction and Maintenance Occupations
The most common Natural Resources, Construction and Maintenance occupations in Heritage Village are Installation, Maintenance & Repair (21 | 1.9%), and Construction & Extraction (7 | 0.6%).
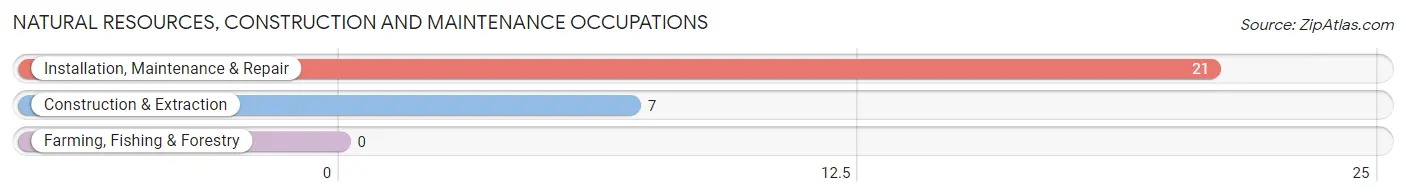
Natural Resources, Construction and Maintenance Occupations by Sex
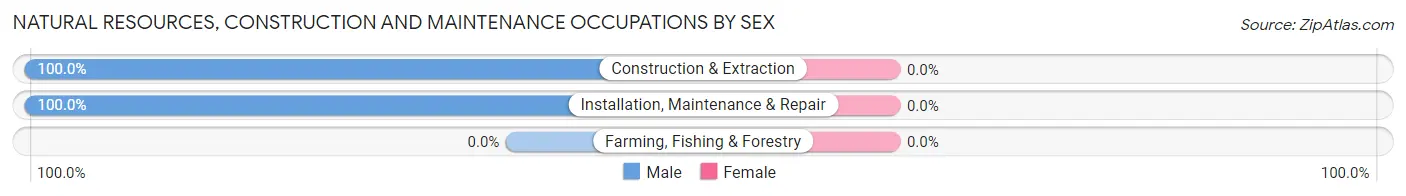
| Occupation | Male | Female |
| Farming, Fishing & Forestry | 0 (0.0%) | 0 (0.0%) |
| Construction & Extraction | 7 (100.0%) | 0 (0.0%) |
| Installation, Maintenance & Repair | 21 (100.0%) | 0 (0.0%) |
| Total (Category) | 28 (100.0%) | 0 (0.0%) |
| Total (Overall) | 438 (39.1%) | 681 (60.9%) |
Production, Transportation and Moving Occupations
The most common Production, Transportation and Moving occupations in Heritage Village are Production (21 | 1.9%), and Transportation (14 | 1.3%).
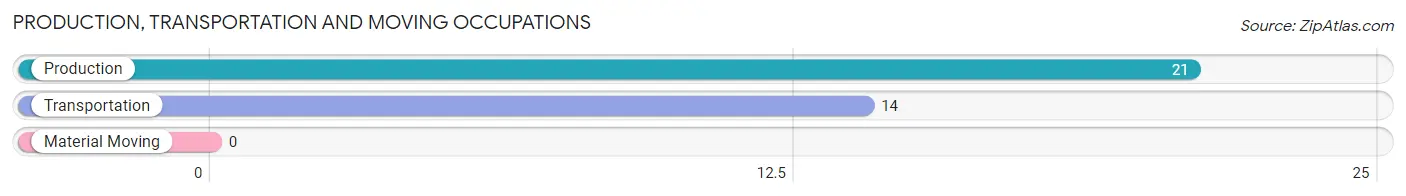
Production, Transportation and Moving Occupations by Sex
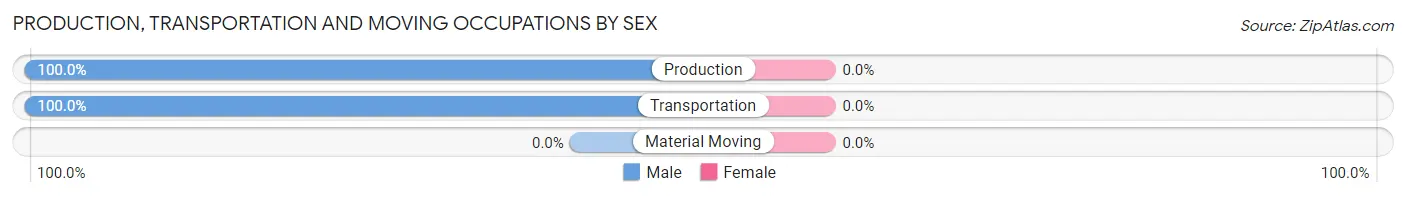
| Occupation | Male | Female |
| Production | 21 (100.0%) | 0 (0.0%) |
| Transportation | 14 (100.0%) | 0 (0.0%) |
| Material Moving | 0 (0.0%) | 0 (0.0%) |
| Total (Category) | 35 (100.0%) | 0 (0.0%) |
| Total (Overall) | 438 (39.1%) | 681 (60.9%) |
Employment Industries by Sex in Heritage Village
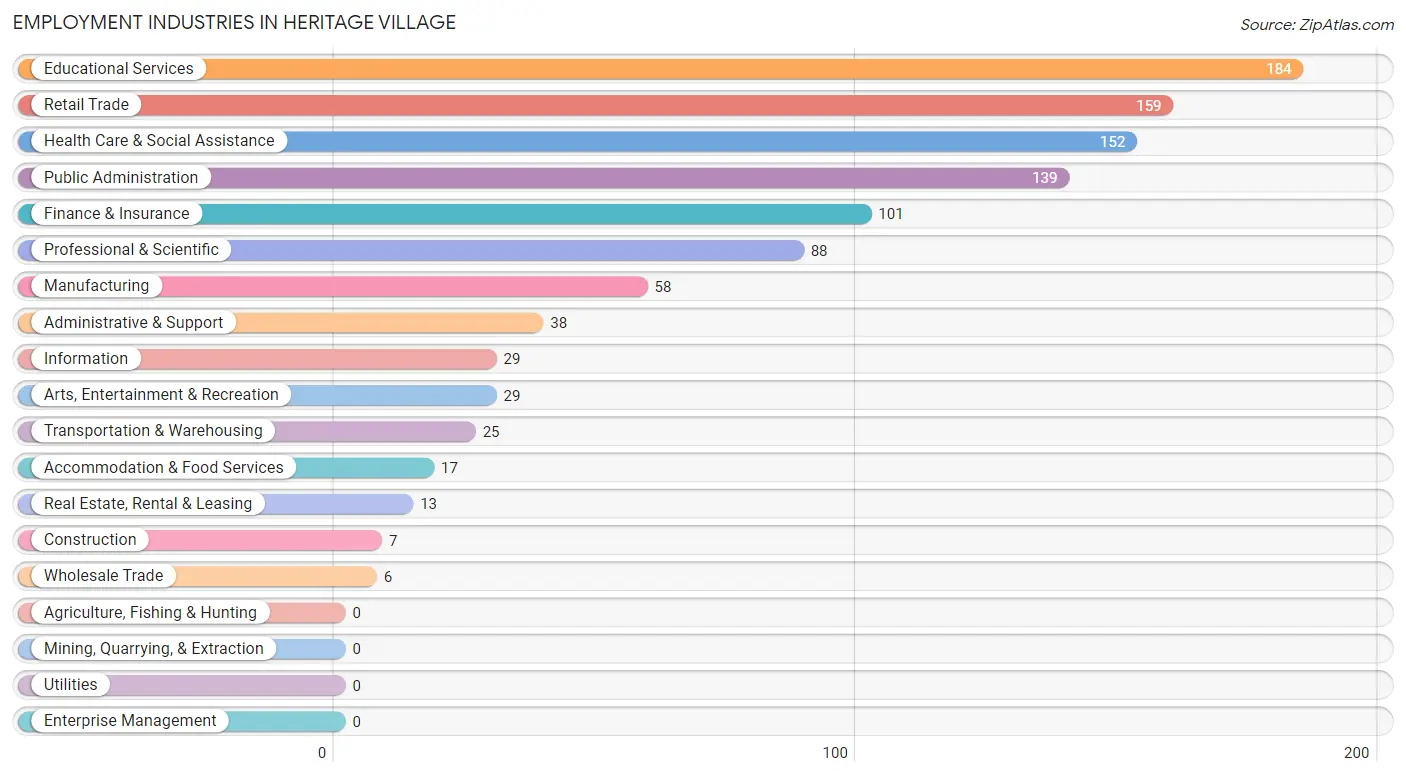
Employment Industries in Heritage Village
The major employment industries in Heritage Village include Educational Services (184 | 16.4%), Retail Trade (159 | 14.2%), Health Care & Social Assistance (152 | 13.6%), Public Administration (139 | 12.4%), and Finance & Insurance (101 | 9.0%).
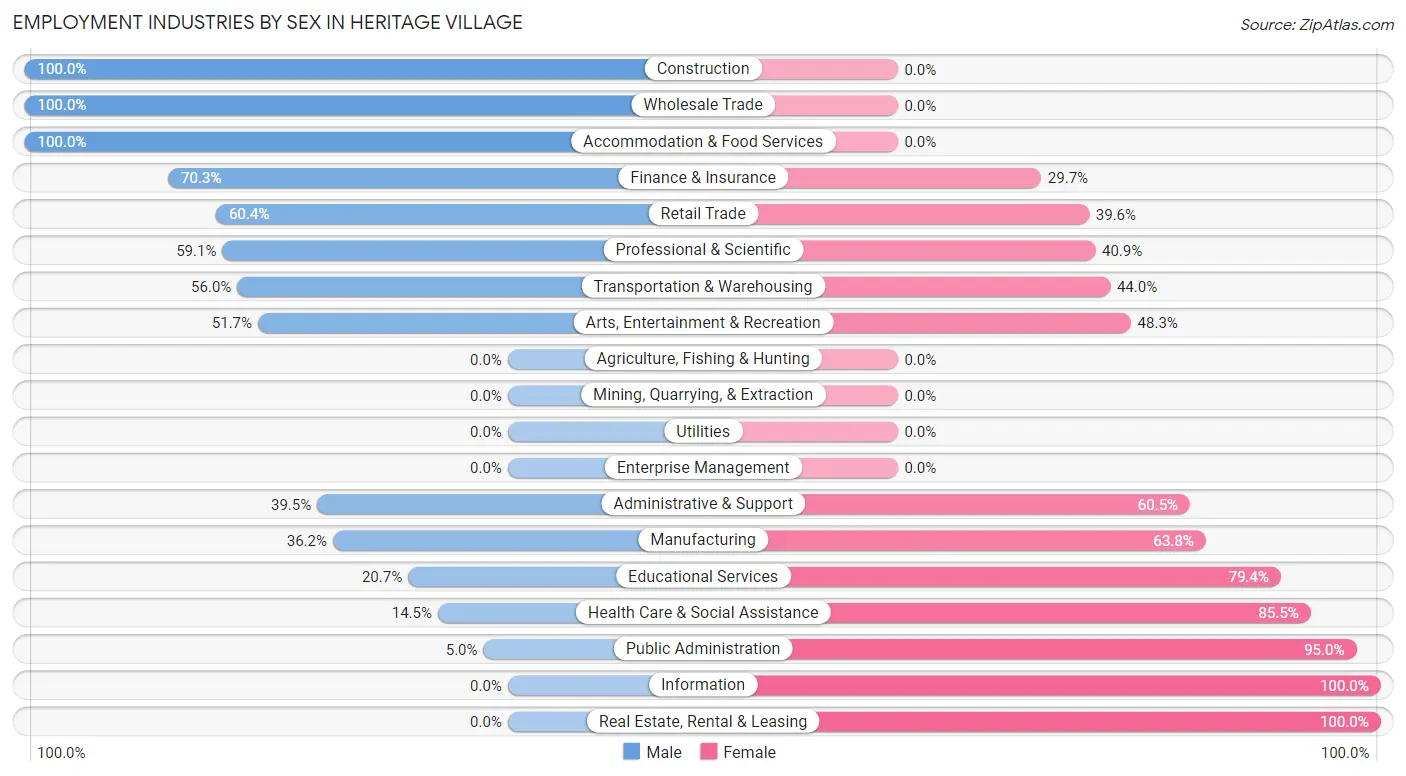
Employment Industries by Sex in Heritage Village
The Heritage Village industries that see more men than women are Construction (100.0%), Wholesale Trade (100.0%), and Accommodation & Food Services (100.0%), whereas the industries that tend to have a higher number of women are Information (100.0%), Real Estate, Rental & Leasing (100.0%), and Public Administration (95.0%).
| Industry | Male | Female |
| Agriculture, Fishing & Hunting | 0 (0.0%) | 0 (0.0%) |
| Mining, Quarrying, & Extraction | 0 (0.0%) | 0 (0.0%) |
| Construction | 7 (100.0%) | 0 (0.0%) |
| Manufacturing | 21 (36.2%) | 37 (63.8%) |
| Wholesale Trade | 6 (100.0%) | 0 (0.0%) |
| Retail Trade | 96 (60.4%) | 63 (39.6%) |
| Transportation & Warehousing | 14 (56.0%) | 11 (44.0%) |
| Utilities | 0 (0.0%) | 0 (0.0%) |
| Information | 0 (0.0%) | 29 (100.0%) |
| Finance & Insurance | 71 (70.3%) | 30 (29.7%) |
| Real Estate, Rental & Leasing | 0 (0.0%) | 13 (100.0%) |
| Professional & Scientific | 52 (59.1%) | 36 (40.9%) |
| Enterprise Management | 0 (0.0%) | 0 (0.0%) |
| Administrative & Support | 15 (39.5%) | 23 (60.5%) |
| Educational Services | 38 (20.6%) | 146 (79.3%) |
| Health Care & Social Assistance | 22 (14.5%) | 130 (85.5%) |
| Arts, Entertainment & Recreation | 15 (51.7%) | 14 (48.3%) |
| Accommodation & Food Services | 17 (100.0%) | 0 (0.0%) |
| Public Administration | 7 (5.0%) | 132 (95.0%) |
| Total | 438 (39.1%) | 681 (60.9%) |
Education in Heritage Village
School Enrollment in Heritage Village
The most common levels of schooling among the 149 students in Heritage Village are college / undergraduate (76 | 51.0%), graduate / professional (43 | 28.9%), and middle school (16 | 10.7%).
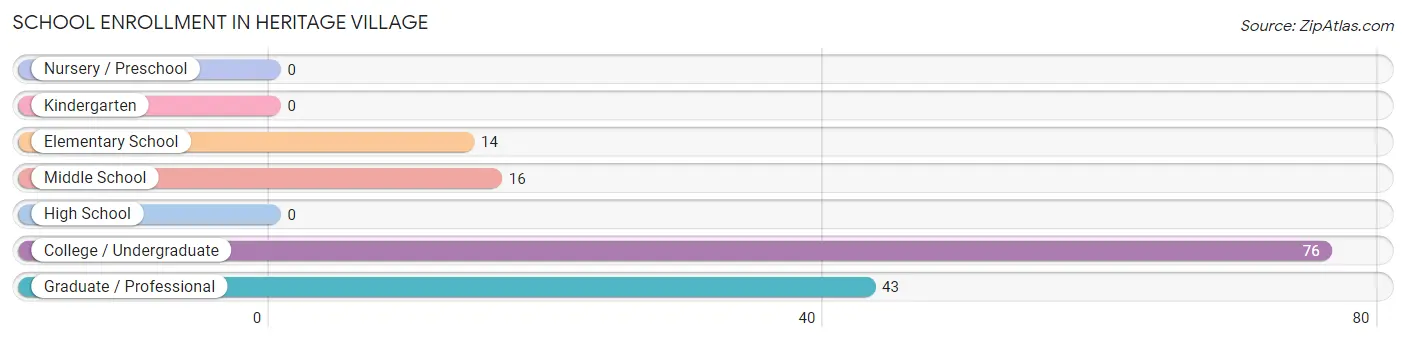
| School Level | # Students | % Students |
| Nursery / Preschool | 0 | 0.0% |
| Kindergarten | 0 | 0.0% |
| Elementary School | 14 | 9.4% |
| Middle School | 16 | 10.7% |
| High School | 0 | 0.0% |
| College / Undergraduate | 76 | 51.0% |
| Graduate / Professional | 43 | 28.9% |
| Total | 149 | 100.0% |
School Enrollment by Age by Funding Source in Heritage Village
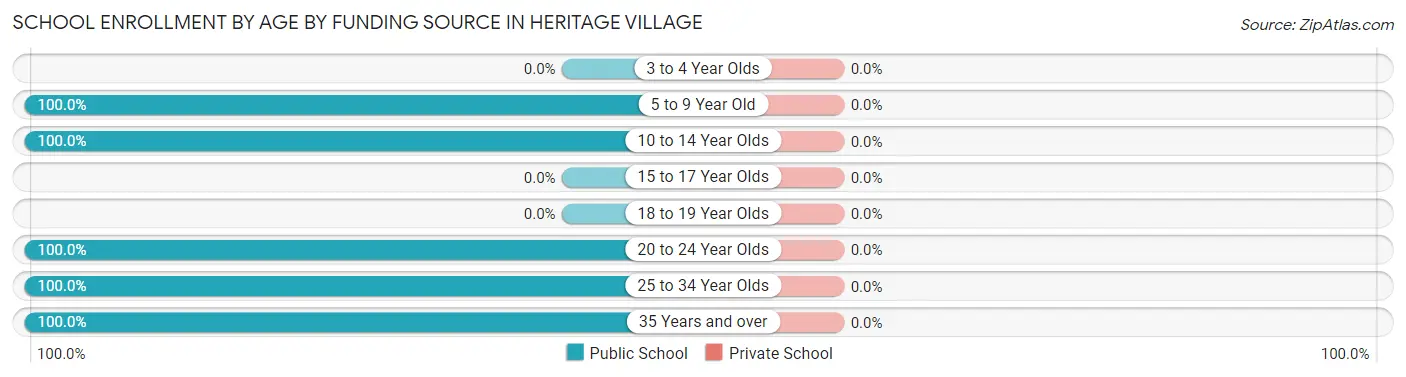
| Age Bracket | Public School | Private School |
| 3 to 4 Year Olds | 0 (0.0%) | 0 (0.0%) |
| 5 to 9 Year Old | 14 (100.0%) | 0 (0.0%) |
| 10 to 14 Year Olds | 16 (100.0%) | 0 (0.0%) |
| 15 to 17 Year Olds | 0 (0.0%) | 0 (0.0%) |
| 18 to 19 Year Olds | 0 (0.0%) | 0 (0.0%) |
| 20 to 24 Year Olds | 71 (100.0%) | 0 (0.0%) |
| 25 to 34 Year Olds | 36 (100.0%) | 0 (0.0%) |
| 35 Years and over | 12 (100.0%) | 0 (0.0%) |
| Total | 149 (100.0%) | 0 (0.0%) |
Educational Attainment by Field of Study in Heritage Village
Education (347 | 19.3%), business (268 | 14.9%), science & technology (204 | 11.4%), liberal arts & history (183 | 10.2%), and psychology (168 | 9.4%) are the most common fields of study among 1,794 individuals in Heritage Village who have obtained a bachelor's degree or higher.
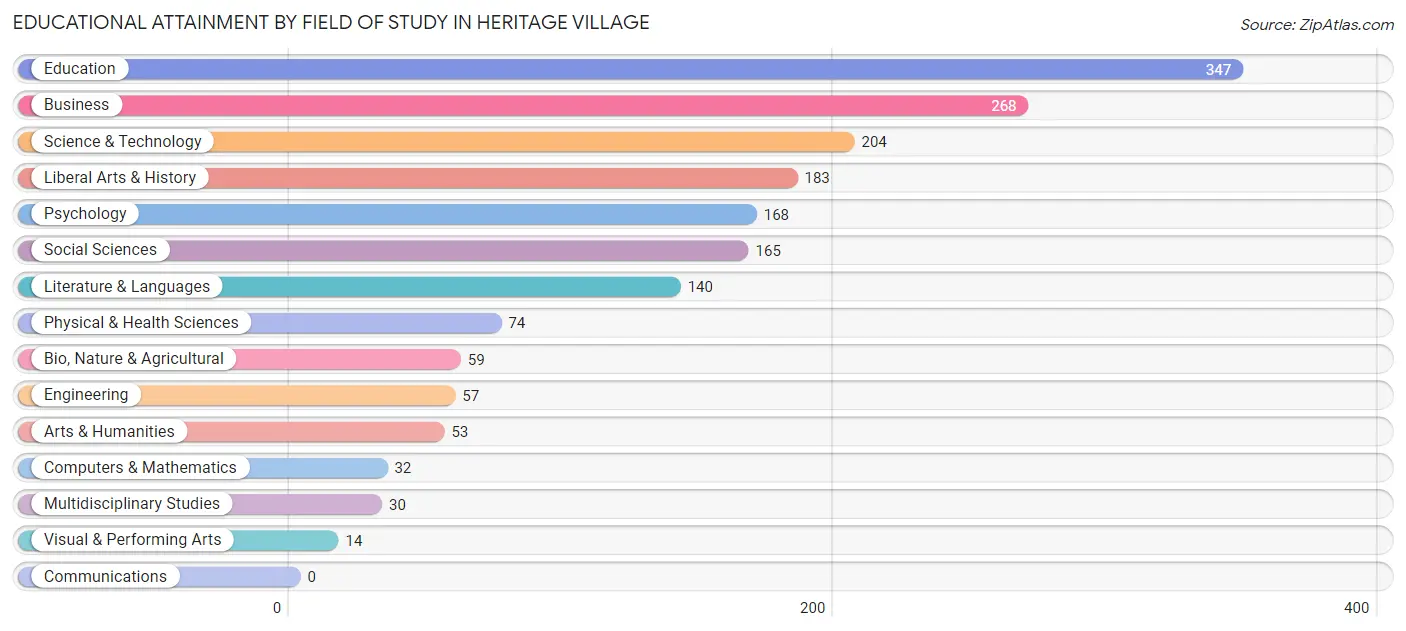
| Field of Study | # Graduates | % Graduates |
| Computers & Mathematics | 32 | 1.8% |
| Bio, Nature & Agricultural | 59 | 3.3% |
| Physical & Health Sciences | 74 | 4.1% |
| Psychology | 168 | 9.4% |
| Social Sciences | 165 | 9.2% |
| Engineering | 57 | 3.2% |
| Multidisciplinary Studies | 30 | 1.7% |
| Science & Technology | 204 | 11.4% |
| Business | 268 | 14.9% |
| Education | 347 | 19.3% |
| Literature & Languages | 140 | 7.8% |
| Liberal Arts & History | 183 | 10.2% |
| Visual & Performing Arts | 14 | 0.8% |
| Communications | 0 | 0.0% |
| Arts & Humanities | 53 | 2.9% |
| Total | 1,794 | 100.0% |
Transportation & Commute in Heritage Village
Vehicle Availability by Sex in Heritage Village
The most prevalent vehicle ownership categories in Heritage Village are males with 2 vehicles (254, accounting for 58.0%) and females with 2 vehicles (181, making up 37.3%).
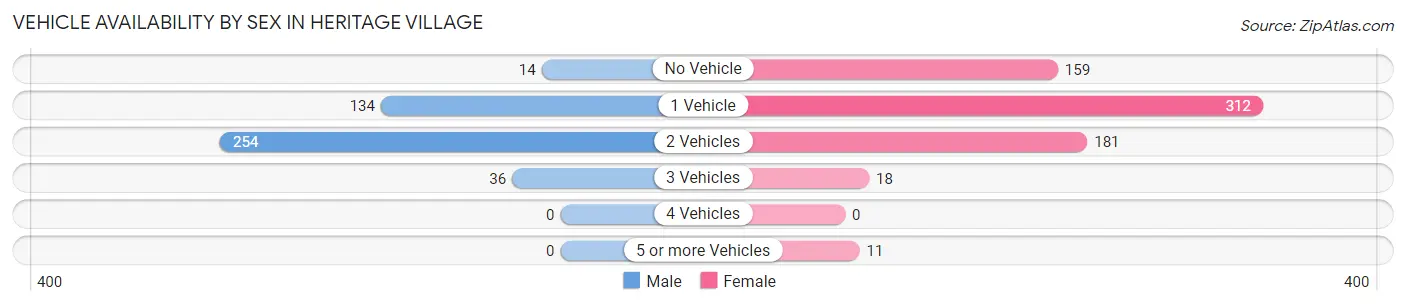
| Vehicles Available | Male | Female |
| No Vehicle | 14 (3.2%) | 159 (23.4%) |
| 1 Vehicle | 134 (30.6%) | 312 (45.8%) |
| 2 Vehicles | 254 (58.0%) | 181 (26.6%) |
| 3 Vehicles | 36 (8.2%) | 18 (2.6%) |
| 4 Vehicles | 0 (0.0%) | 0 (0.0%) |
| 5 or more Vehicles | 0 (0.0%) | 11 (1.6%) |
| Total | 438 (100.0%) | 681 (100.0%) |
Commute Time in Heritage Village
The most frequently occuring commute durations in Heritage Village are 30 to 34 minutes (148 commuters, 18.7%), 5 to 9 minutes (128 commuters, 16.1%), and 60 to 89 minutes (99 commuters, 12.5%).
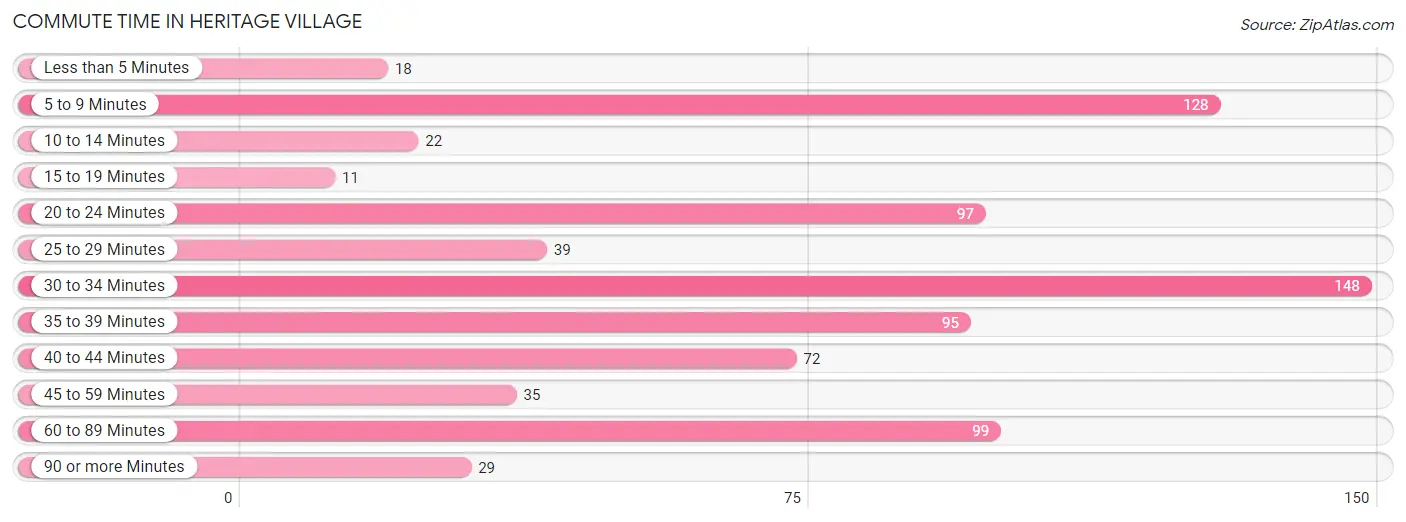
| Commute Time | # Commuters | % Commuters |
| Less than 5 Minutes | 18 | 2.3% |
| 5 to 9 Minutes | 128 | 16.1% |
| 10 to 14 Minutes | 22 | 2.8% |
| 15 to 19 Minutes | 11 | 1.4% |
| 20 to 24 Minutes | 97 | 12.2% |
| 25 to 29 Minutes | 39 | 4.9% |
| 30 to 34 Minutes | 148 | 18.7% |
| 35 to 39 Minutes | 95 | 12.0% |
| 40 to 44 Minutes | 72 | 9.1% |
| 45 to 59 Minutes | 35 | 4.4% |
| 60 to 89 Minutes | 99 | 12.5% |
| 90 or more Minutes | 29 | 3.7% |
Commute Time by Sex in Heritage Village
The most common commute times in Heritage Village are 5 to 9 minutes (77 commuters, 22.3%) for males and 30 to 34 minutes (93 commuters, 20.8%) for females.
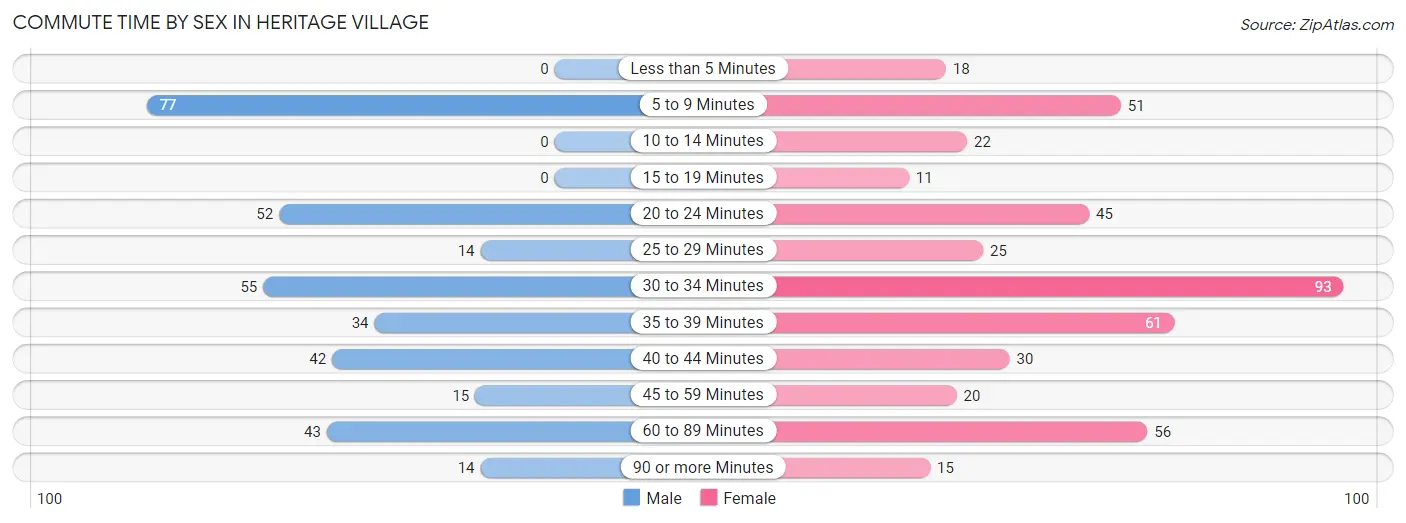
| Commute Time | Male | Female |
| Less than 5 Minutes | 0 (0.0%) | 18 (4.0%) |
| 5 to 9 Minutes | 77 (22.3%) | 51 (11.4%) |
| 10 to 14 Minutes | 0 (0.0%) | 22 (4.9%) |
| 15 to 19 Minutes | 0 (0.0%) | 11 (2.5%) |
| 20 to 24 Minutes | 52 (15.0%) | 45 (10.1%) |
| 25 to 29 Minutes | 14 (4.1%) | 25 (5.6%) |
| 30 to 34 Minutes | 55 (15.9%) | 93 (20.8%) |
| 35 to 39 Minutes | 34 (9.8%) | 61 (13.7%) |
| 40 to 44 Minutes | 42 (12.1%) | 30 (6.7%) |
| 45 to 59 Minutes | 15 (4.3%) | 20 (4.5%) |
| 60 to 89 Minutes | 43 (12.4%) | 56 (12.5%) |
| 90 or more Minutes | 14 (4.1%) | 15 (3.4%) |
Time of Departure to Work by Sex in Heritage Village
The most frequent times of departure to work in Heritage Village are 8:00 AM to 8:29 AM (102, 29.5%) for males and 7:00 AM to 7:29 AM (73, 16.3%) for females.
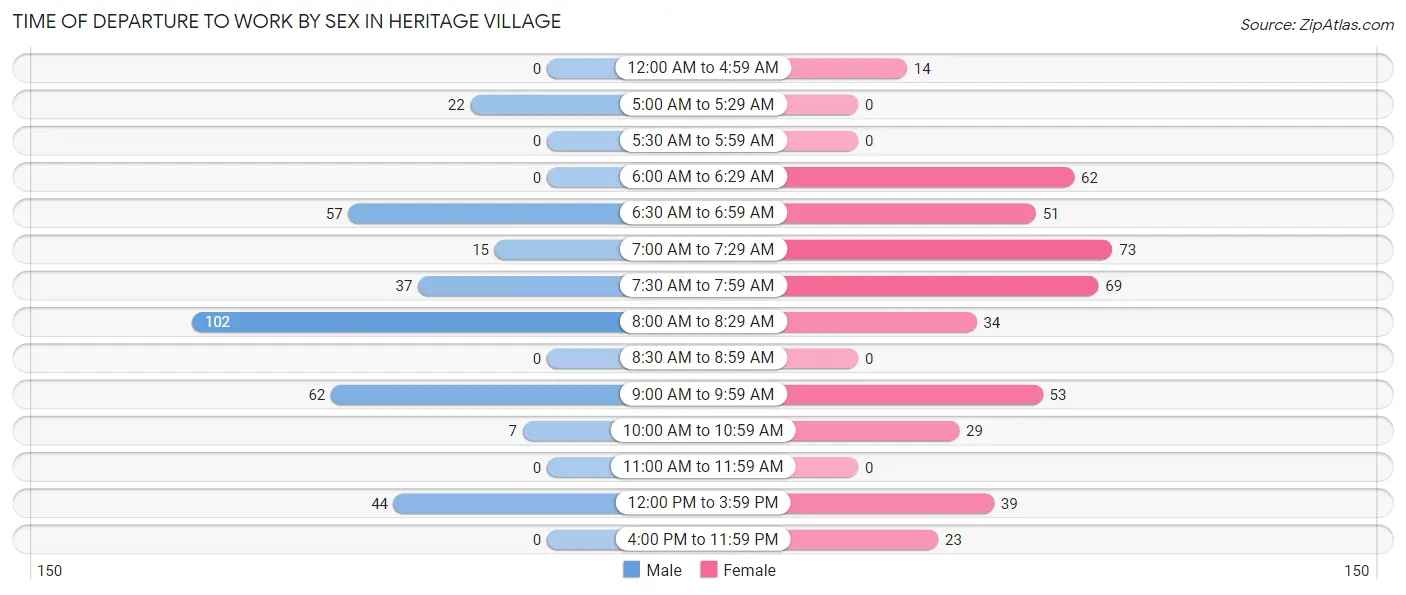
| Time of Departure | Male | Female |
| 12:00 AM to 4:59 AM | 0 (0.0%) | 14 (3.1%) |
| 5:00 AM to 5:29 AM | 22 (6.4%) | 0 (0.0%) |
| 5:30 AM to 5:59 AM | 0 (0.0%) | 0 (0.0%) |
| 6:00 AM to 6:29 AM | 0 (0.0%) | 62 (13.9%) |
| 6:30 AM to 6:59 AM | 57 (16.5%) | 51 (11.4%) |
| 7:00 AM to 7:29 AM | 15 (4.3%) | 73 (16.3%) |
| 7:30 AM to 7:59 AM | 37 (10.7%) | 69 (15.4%) |
| 8:00 AM to 8:29 AM | 102 (29.5%) | 34 (7.6%) |
| 8:30 AM to 8:59 AM | 0 (0.0%) | 0 (0.0%) |
| 9:00 AM to 9:59 AM | 62 (17.9%) | 53 (11.9%) |
| 10:00 AM to 10:59 AM | 7 (2.0%) | 29 (6.5%) |
| 11:00 AM to 11:59 AM | 0 (0.0%) | 0 (0.0%) |
| 12:00 PM to 3:59 PM | 44 (12.7%) | 39 (8.7%) |
| 4:00 PM to 11:59 PM | 0 (0.0%) | 23 (5.1%) |
| Total | 346 (100.0%) | 447 (100.0%) |
Housing Occupancy in Heritage Village
Occupancy by Ownership in Heritage Village
Of the total 2,847 dwellings in Heritage Village, owner-occupied units account for 2,147 (75.4%), while renter-occupied units make up 700 (24.6%).
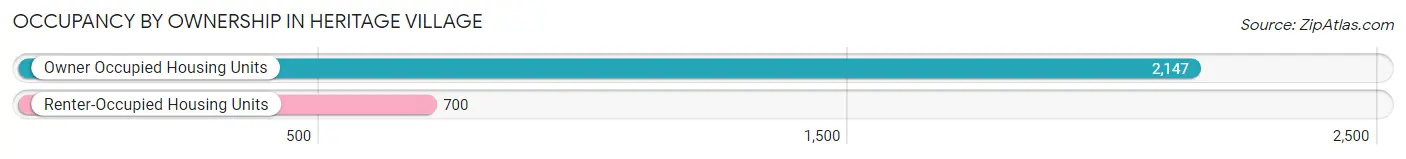
| Occupancy | # Housing Units | % Housing Units |
| Owner Occupied Housing Units | 2,147 | 75.4% |
| Renter-Occupied Housing Units | 700 | 24.6% |
| Total Occupied Housing Units | 2,847 | 100.0% |
Occupancy by Household Size in Heritage Village
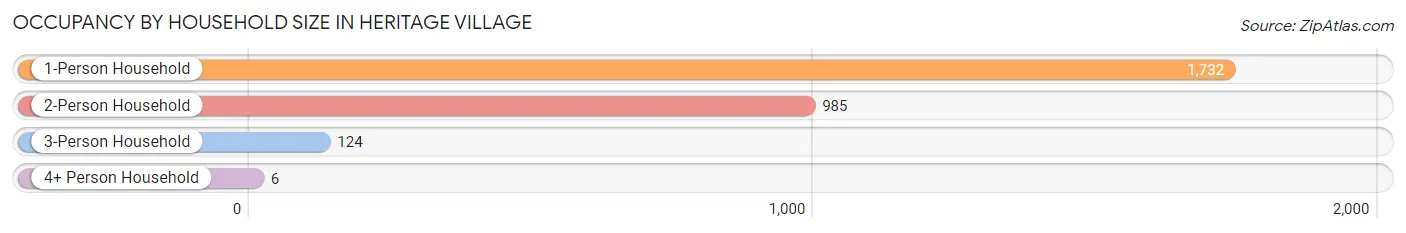
| Household Size | # Housing Units | % Housing Units |
| 1-Person Household | 1,732 | 60.8% |
| 2-Person Household | 985 | 34.6% |
| 3-Person Household | 124 | 4.4% |
| 4+ Person Household | 6 | 0.2% |
| Total Housing Units | 2,847 | 100.0% |
Occupancy by Ownership by Household Size in Heritage Village
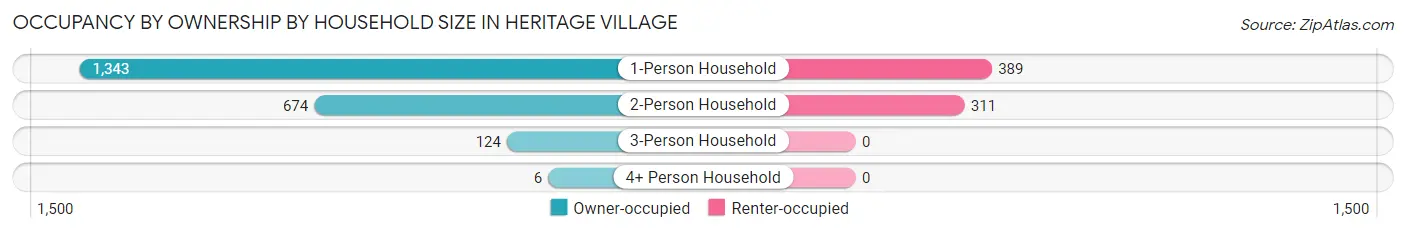
| Household Size | Owner-occupied | Renter-occupied |
| 1-Person Household | 1,343 (77.5%) | 389 (22.5%) |
| 2-Person Household | 674 (68.4%) | 311 (31.6%) |
| 3-Person Household | 124 (100.0%) | 0 (0.0%) |
| 4+ Person Household | 6 (100.0%) | 0 (0.0%) |
| Total Housing Units | 2,147 (75.4%) | 700 (24.6%) |
Occupancy by Educational Attainment in Heritage Village
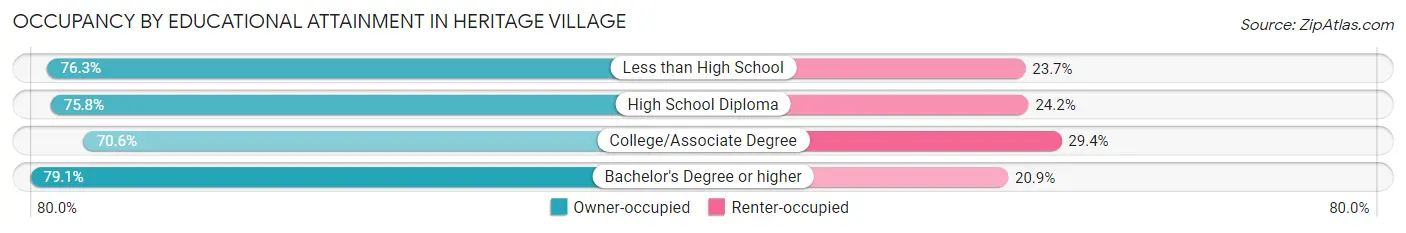
| Household Size | Owner-occupied | Renter-occupied |
| Less than High School | 71 (76.3%) | 22 (23.7%) |
| High School Diploma | 565 (75.8%) | 180 (24.2%) |
| College/Associate Degree | 649 (70.6%) | 270 (29.4%) |
| Bachelor's Degree or higher | 862 (79.1%) | 228 (20.9%) |
Occupancy by Age of Householder in Heritage Village
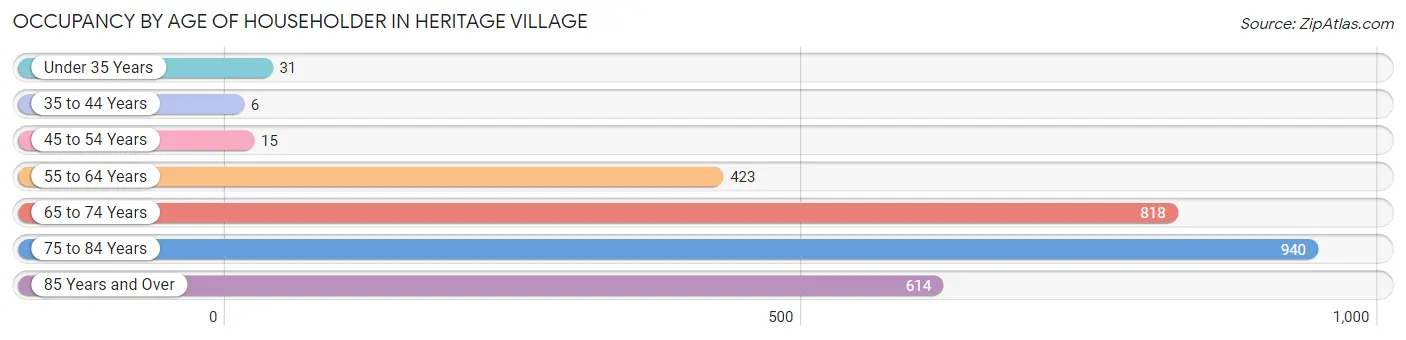
| Age Bracket | # Households | % Households |
| Under 35 Years | 31 | 1.1% |
| 35 to 44 Years | 6 | 0.2% |
| 45 to 54 Years | 15 | 0.5% |
| 55 to 64 Years | 423 | 14.9% |
| 65 to 74 Years | 818 | 28.7% |
| 75 to 84 Years | 940 | 33.0% |
| 85 Years and Over | 614 | 21.6% |
| Total | 2,847 | 100.0% |
Housing Finances in Heritage Village
Median Income by Occupancy in Heritage Village
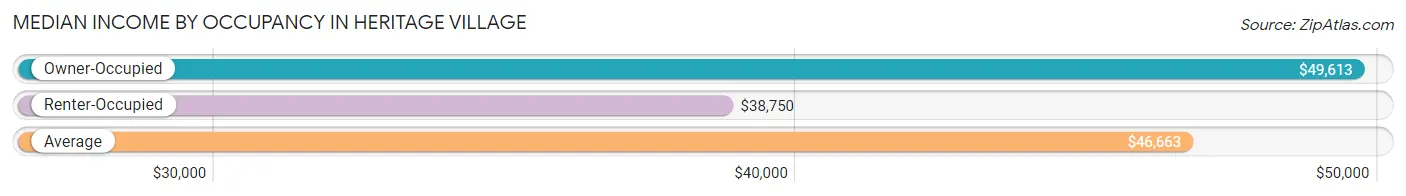
| Occupancy Type | # Households | Median Income |
| Owner-Occupied | 2,147 (75.4%) | $49,613 |
| Renter-Occupied | 700 (24.6%) | $38,750 |
| Average | 2,847 (100.0%) | $46,663 |
Occupancy by Householder Income Bracket in Heritage Village
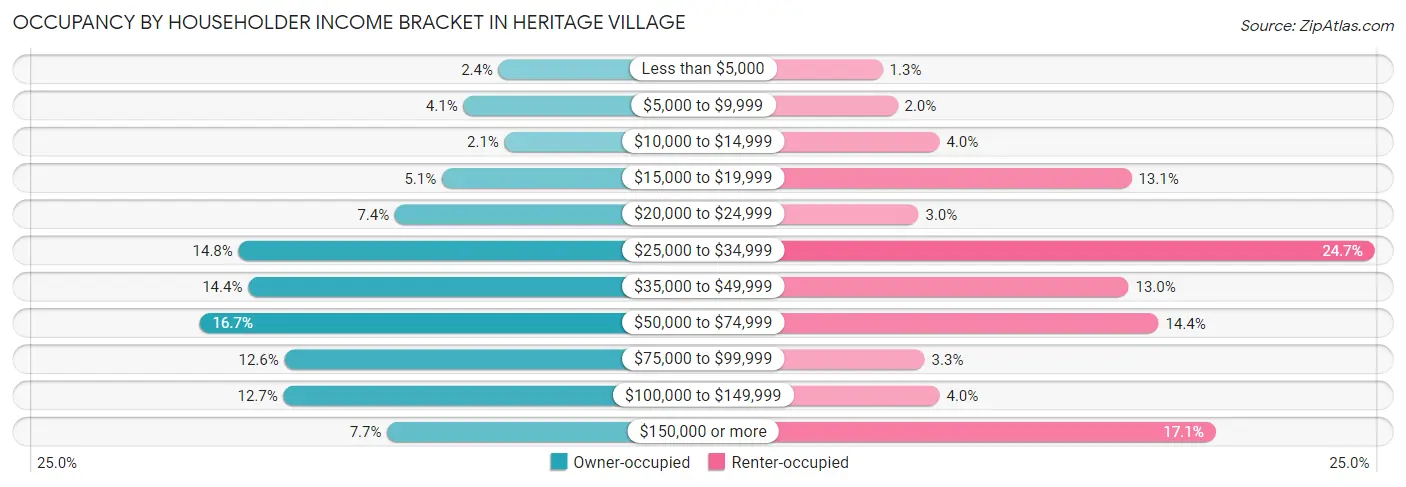
| Income Bracket | Owner-occupied | Renter-occupied |
| Less than $5,000 | 52 (2.4%) | 9 (1.3%) |
| $5,000 to $9,999 | 88 (4.1%) | 14 (2.0%) |
| $10,000 to $14,999 | 46 (2.1%) | 28 (4.0%) |
| $15,000 to $19,999 | 110 (5.1%) | 92 (13.1%) |
| $20,000 to $24,999 | 158 (7.4%) | 21 (3.0%) |
| $25,000 to $34,999 | 318 (14.8%) | 173 (24.7%) |
| $35,000 to $49,999 | 308 (14.3%) | 91 (13.0%) |
| $50,000 to $74,999 | 358 (16.7%) | 101 (14.4%) |
| $75,000 to $99,999 | 271 (12.6%) | 23 (3.3%) |
| $100,000 to $149,999 | 272 (12.7%) | 28 (4.0%) |
| $150,000 or more | 166 (7.7%) | 120 (17.1%) |
| Total | 2,147 (100.0%) | 700 (100.0%) |
Monthly Housing Cost Tiers in Heritage Village
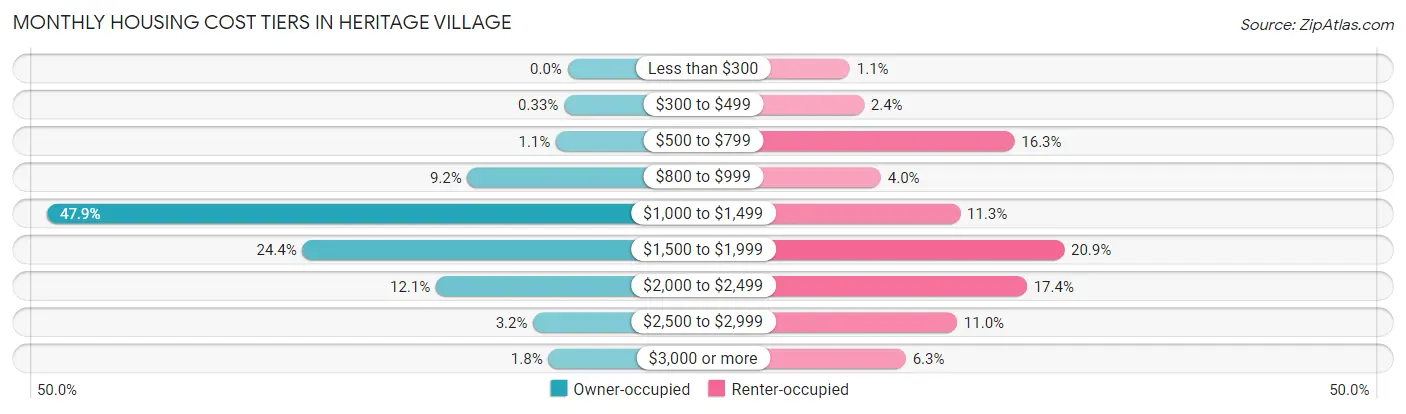
| Monthly Cost | Owner-occupied | Renter-occupied |
| Less than $300 | 0 (0.0%) | 8 (1.1%) |
| $300 to $499 | 7 (0.3%) | 17 (2.4%) |
| $500 to $799 | 23 (1.1%) | 114 (16.3%) |
| $800 to $999 | 198 (9.2%) | 28 (4.0%) |
| $1,000 to $1,499 | 1,029 (47.9%) | 79 (11.3%) |
| $1,500 to $1,999 | 524 (24.4%) | 146 (20.9%) |
| $2,000 to $2,499 | 260 (12.1%) | 122 (17.4%) |
| $2,500 to $2,999 | 68 (3.2%) | 77 (11.0%) |
| $3,000 or more | 38 (1.8%) | 44 (6.3%) |
| Total | 2,147 (100.0%) | 700 (100.0%) |
Physical Housing Characteristics in Heritage Village
Housing Structures in Heritage Village
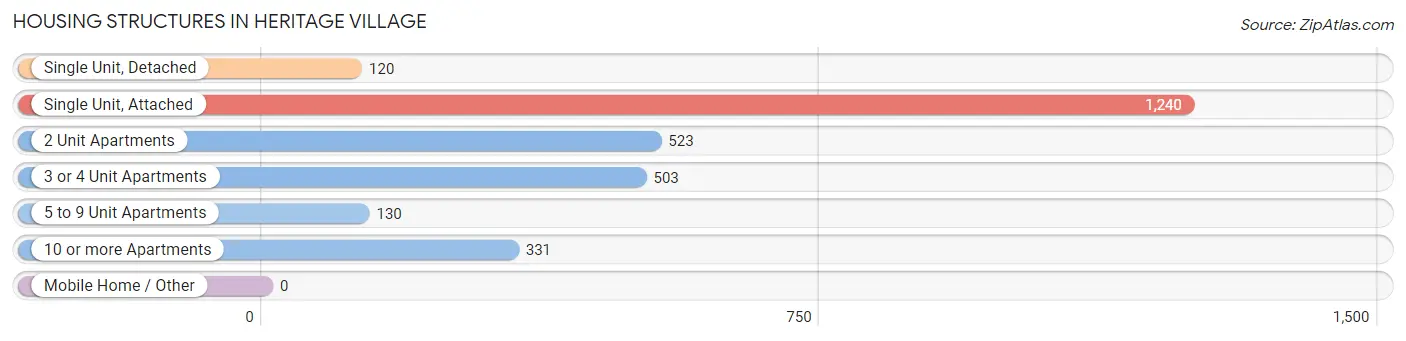
| Structure Type | # Housing Units | % Housing Units |
| Single Unit, Detached | 120 | 4.2% |
| Single Unit, Attached | 1,240 | 43.5% |
| 2 Unit Apartments | 523 | 18.4% |
| 3 or 4 Unit Apartments | 503 | 17.7% |
| 5 to 9 Unit Apartments | 130 | 4.6% |
| 10 or more Apartments | 331 | 11.6% |
| Mobile Home / Other | 0 | 0.0% |
| Total | 2,847 | 100.0% |
Housing Structures by Occupancy in Heritage Village
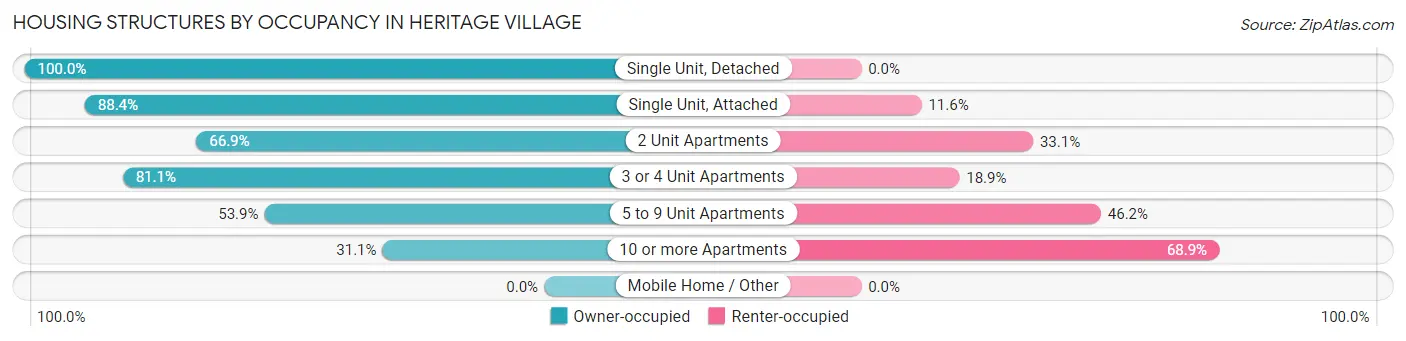
| Structure Type | Owner-occupied | Renter-occupied |
| Single Unit, Detached | 120 (100.0%) | 0 (0.0%) |
| Single Unit, Attached | 1,096 (88.4%) | 144 (11.6%) |
| 2 Unit Apartments | 350 (66.9%) | 173 (33.1%) |
| 3 or 4 Unit Apartments | 408 (81.1%) | 95 (18.9%) |
| 5 to 9 Unit Apartments | 70 (53.8%) | 60 (46.2%) |
| 10 or more Apartments | 103 (31.1%) | 228 (68.9%) |
| Mobile Home / Other | 0 (0.0%) | 0 (0.0%) |
| Total | 2,147 (75.4%) | 700 (24.6%) |
Housing Structures by Number of Rooms in Heritage Village
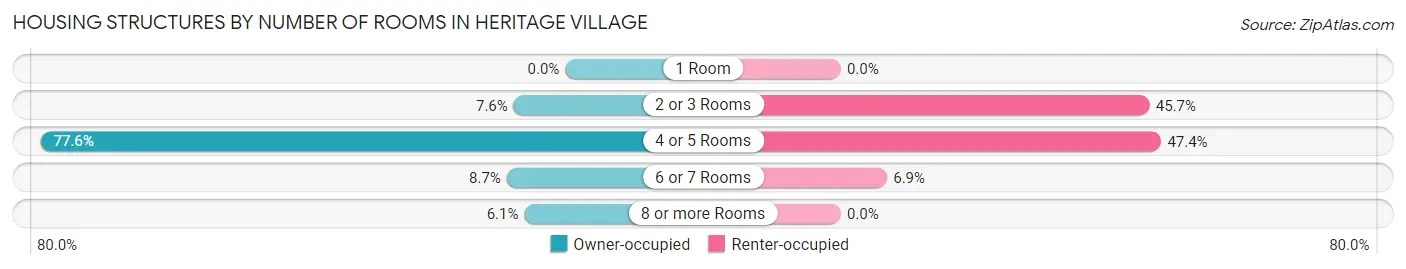
| Number of Rooms | Owner-occupied | Renter-occupied |
| 1 Room | 0 (0.0%) | 0 (0.0%) |
| 2 or 3 Rooms | 164 (7.6%) | 320 (45.7%) |
| 4 or 5 Rooms | 1,667 (77.6%) | 332 (47.4%) |
| 6 or 7 Rooms | 186 (8.7%) | 48 (6.9%) |
| 8 or more Rooms | 130 (6.0%) | 0 (0.0%) |
| Total | 2,147 (100.0%) | 700 (100.0%) |
Housing Structure by Heating Type in Heritage Village
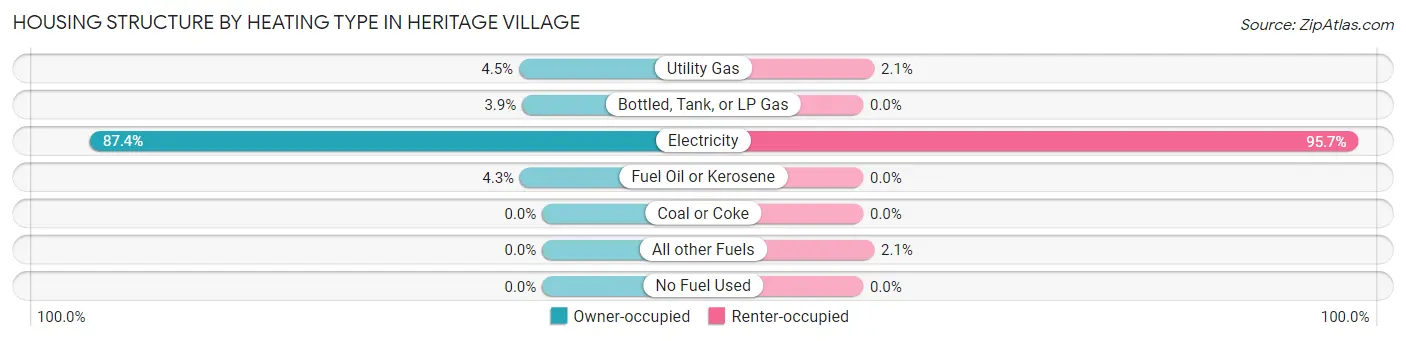
| Heating Type | Owner-occupied | Renter-occupied |
| Utility Gas | 96 (4.5%) | 15 (2.1%) |
| Bottled, Tank, or LP Gas | 83 (3.9%) | 0 (0.0%) |
| Electricity | 1,876 (87.4%) | 670 (95.7%) |
| Fuel Oil or Kerosene | 92 (4.3%) | 0 (0.0%) |
| Coal or Coke | 0 (0.0%) | 0 (0.0%) |
| All other Fuels | 0 (0.0%) | 15 (2.1%) |
| No Fuel Used | 0 (0.0%) | 0 (0.0%) |
| Total | 2,147 (100.0%) | 700 (100.0%) |
Household Vehicle Usage in Heritage Village
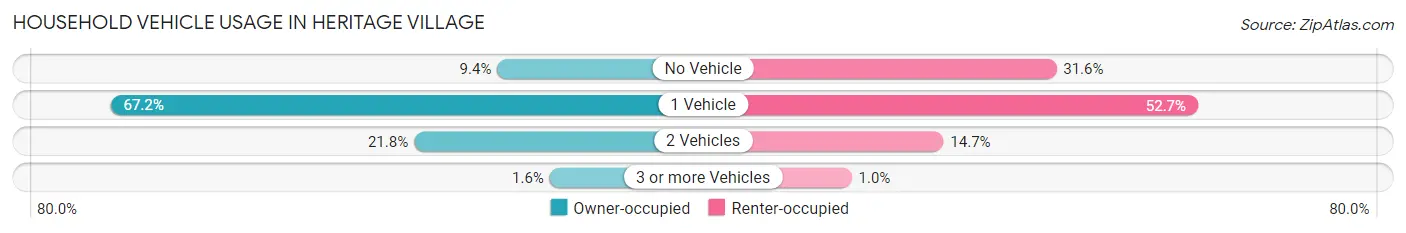
| Vehicles per Household | Owner-occupied | Renter-occupied |
| No Vehicle | 202 (9.4%) | 221 (31.6%) |
| 1 Vehicle | 1,442 (67.2%) | 369 (52.7%) |
| 2 Vehicles | 469 (21.8%) | 103 (14.7%) |
| 3 or more Vehicles | 34 (1.6%) | 7 (1.0%) |
| Total | 2,147 (100.0%) | 700 (100.0%) |
Real Estate & Mortgages in Heritage Village
Real Estate and Mortgage Overview in Heritage Village
| Characteristic | Without Mortgage | With Mortgage |
| Housing Units | 1,439 | 708 |
| Median Property Value | $181,300 | $181,400 |
| Median Household Income | $43,922 | $90 |
| Monthly Housing Costs | $1,283 | $23 |
| Real Estate Taxes | $2,725 | $0 |
Property Value by Mortgage Status in Heritage Village
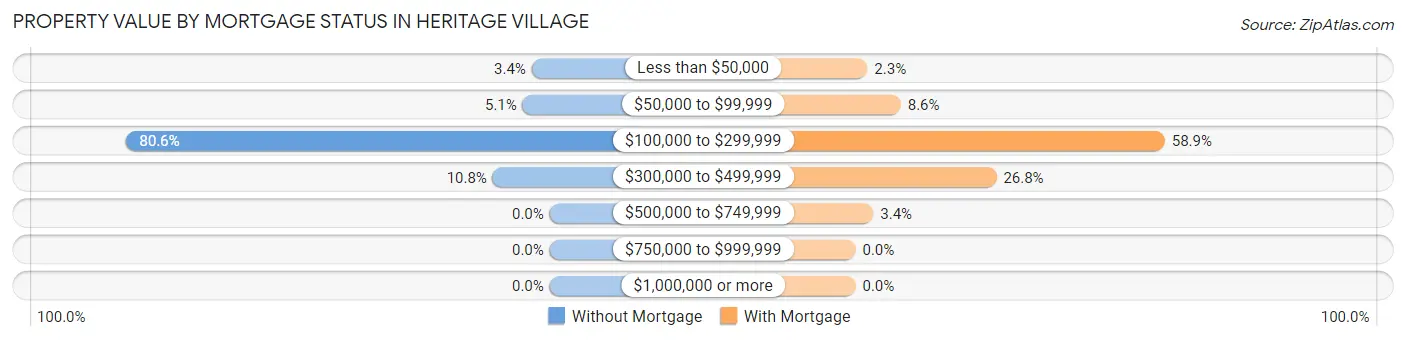
| Property Value | Without Mortgage | With Mortgage |
| Less than $50,000 | 49 (3.4%) | 16 (2.3%) |
| $50,000 to $99,999 | 74 (5.1%) | 61 (8.6%) |
| $100,000 to $299,999 | 1,160 (80.6%) | 417 (58.9%) |
| $300,000 to $499,999 | 156 (10.8%) | 190 (26.8%) |
| $500,000 to $749,999 | 0 (0.0%) | 24 (3.4%) |
| $750,000 to $999,999 | 0 (0.0%) | 0 (0.0%) |
| $1,000,000 or more | 0 (0.0%) | 0 (0.0%) |
| Total | 1,439 (100.0%) | 708 (100.0%) |
Household Income by Mortgage Status in Heritage Village
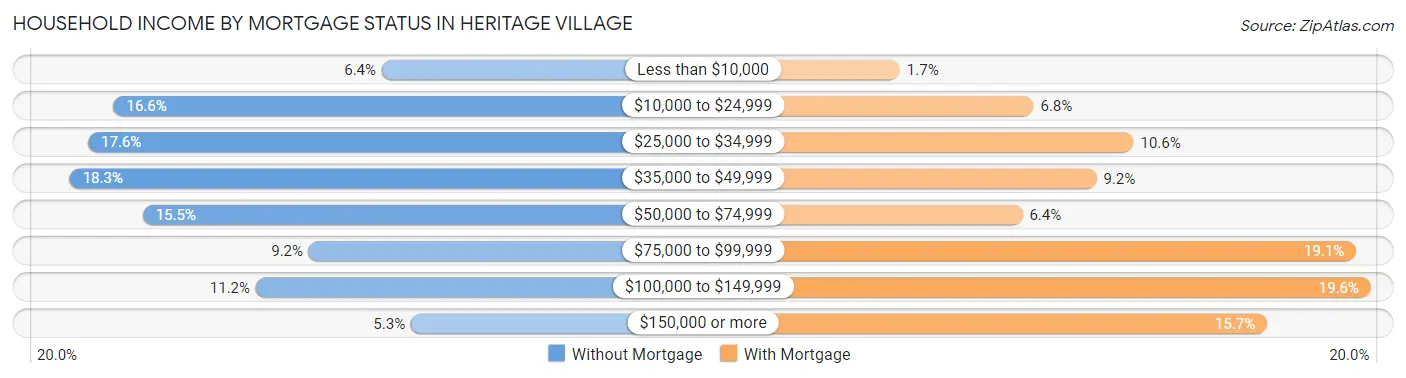
| Household Income | Without Mortgage | With Mortgage |
| Less than $10,000 | 92 (6.4%) | 12 (1.7%) |
| $10,000 to $24,999 | 239 (16.6%) | 48 (6.8%) |
| $25,000 to $34,999 | 253 (17.6%) | 75 (10.6%) |
| $35,000 to $49,999 | 263 (18.3%) | 65 (9.2%) |
| $50,000 to $74,999 | 223 (15.5%) | 45 (6.4%) |
| $75,000 to $99,999 | 132 (9.2%) | 135 (19.1%) |
| $100,000 to $149,999 | 161 (11.2%) | 139 (19.6%) |
| $150,000 or more | 76 (5.3%) | 111 (15.7%) |
| Total | 1,439 (100.0%) | 708 (100.0%) |
Property Value to Household Income Ratio in Heritage Village
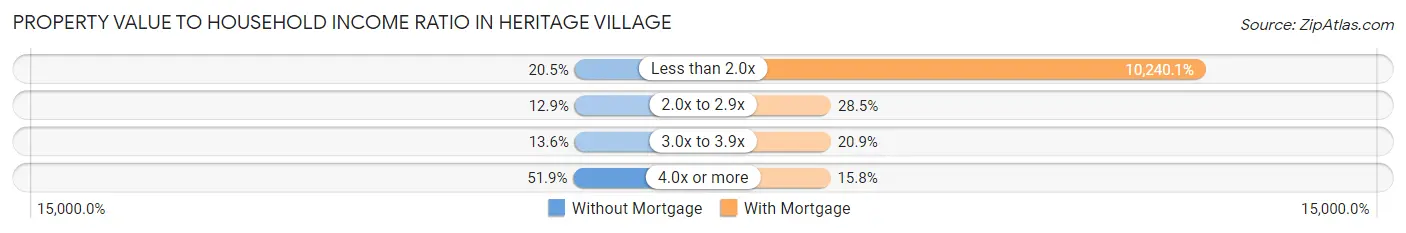
| Value-to-Income Ratio | Without Mortgage | With Mortgage |
| Less than 2.0x | 295 (20.5%) | 72,500 (10,240.1%) |
| 2.0x to 2.9x | 185 (12.9%) | 202 (28.5%) |
| 3.0x to 3.9x | 195 (13.6%) | 148 (20.9%) |
| 4.0x or more | 747 (51.9%) | 112 (15.8%) |
| Total | 1,439 (100.0%) | 708 (100.0%) |
Real Estate Taxes by Mortgage Status in Heritage Village
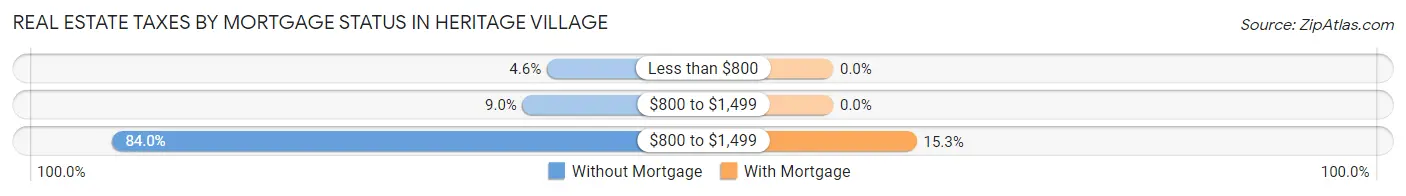
| Property Taxes | Without Mortgage | With Mortgage |
| Less than $800 | 66 (4.6%) | 0 (0.0%) |
| $800 to $1,499 | 130 (9.0%) | 0 (0.0%) |
| $800 to $1,499 | 1,208 (84.0%) | 108 (15.2%) |
| Total | 1,439 (100.0%) | 708 (100.0%) |
Health & Disability in Heritage Village
Health Insurance Coverage by Age in Heritage Village
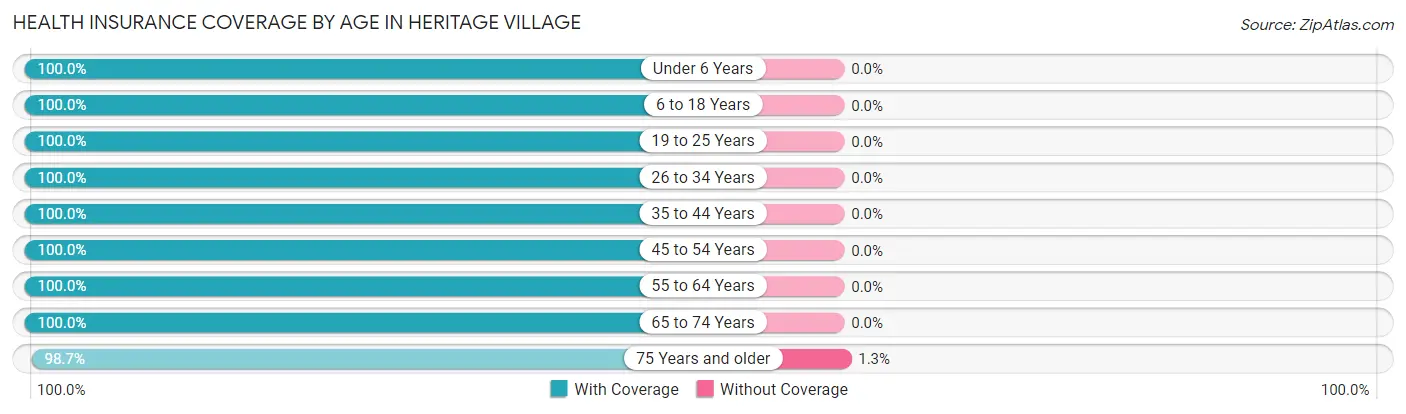
| Age Bracket | With Coverage | Without Coverage |
| Under 6 Years | 7 (100.0%) | 0 (0.0%) |
| 6 to 18 Years | 30 (100.0%) | 0 (0.0%) |
| 19 to 25 Years | 127 (100.0%) | 0 (0.0%) |
| 26 to 34 Years | 114 (100.0%) | 0 (0.0%) |
| 35 to 44 Years | 20 (100.0%) | 0 (0.0%) |
| 45 to 54 Years | 88 (100.0%) | 0 (0.0%) |
| 55 to 64 Years | 769 (100.0%) | 0 (0.0%) |
| 65 to 74 Years | 1,100 (100.0%) | 0 (0.0%) |
| 75 Years and older | 2,046 (98.7%) | 27 (1.3%) |
| Total | 4,301 (99.4%) | 27 (0.6%) |
Health Insurance Coverage by Citizenship Status in Heritage Village
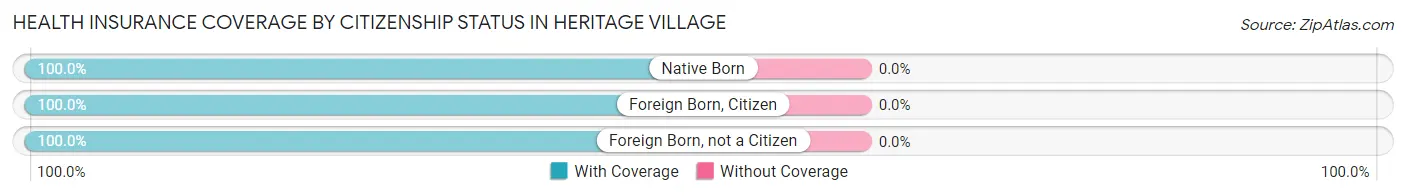
| Citizenship Status | With Coverage | Without Coverage |
| Native Born | 7 (100.0%) | 0 (0.0%) |
| Foreign Born, Citizen | 30 (100.0%) | 0 (0.0%) |
| Foreign Born, not a Citizen | 127 (100.0%) | 0 (0.0%) |
Health Insurance Coverage by Household Income in Heritage Village
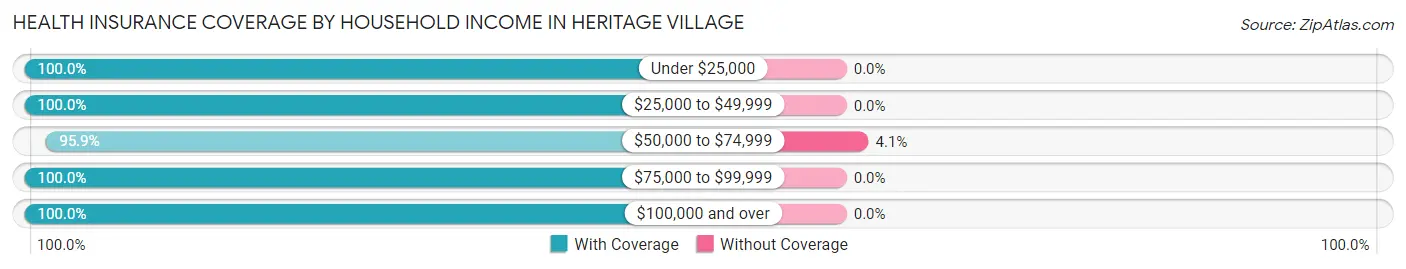
| Household Income | With Coverage | Without Coverage |
| Under $25,000 | 748 (100.0%) | 0 (0.0%) |
| $25,000 to $49,999 | 1,168 (100.0%) | 0 (0.0%) |
| $50,000 to $74,999 | 635 (95.9%) | 27 (4.1%) |
| $75,000 to $99,999 | 450 (100.0%) | 0 (0.0%) |
| $100,000 and over | 1,300 (100.0%) | 0 (0.0%) |
Public vs Private Health Insurance Coverage by Age in Heritage Village
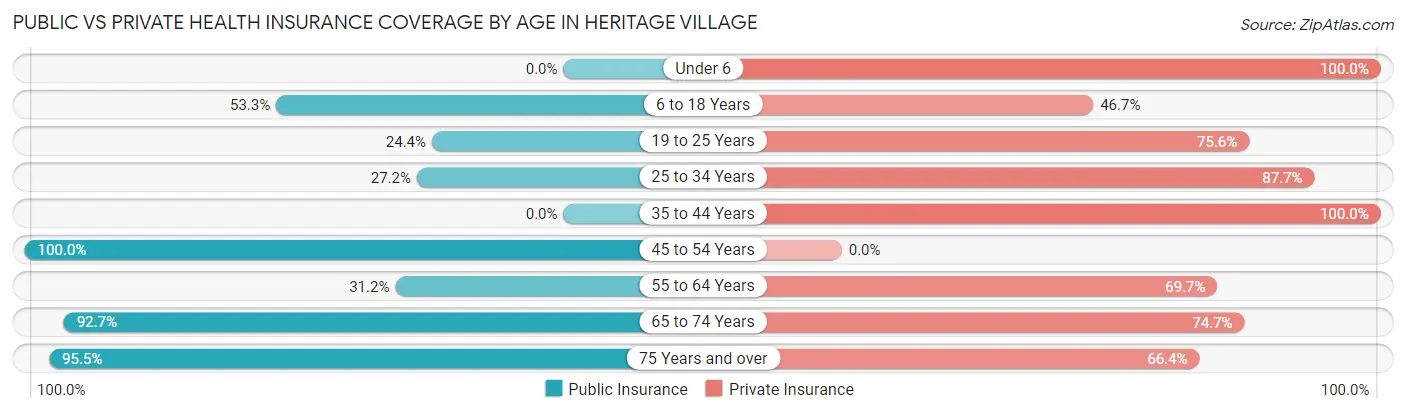
| Age Bracket | Public Insurance | Private Insurance |
| Under 6 | 0 (0.0%) | 7 (100.0%) |
| 6 to 18 Years | 16 (53.3%) | 14 (46.7%) |
| 19 to 25 Years | 31 (24.4%) | 96 (75.6%) |
| 25 to 34 Years | 31 (27.2%) | 100 (87.7%) |
| 35 to 44 Years | 0 (0.0%) | 20 (100.0%) |
| 45 to 54 Years | 88 (100.0%) | 0 (0.0%) |
| 55 to 64 Years | 240 (31.2%) | 536 (69.7%) |
| 65 to 74 Years | 1,020 (92.7%) | 822 (74.7%) |
| 75 Years and over | 1,979 (95.5%) | 1,376 (66.4%) |
| Total | 3,405 (78.7%) | 2,971 (68.6%) |
Disability Status by Sex by Age in Heritage Village
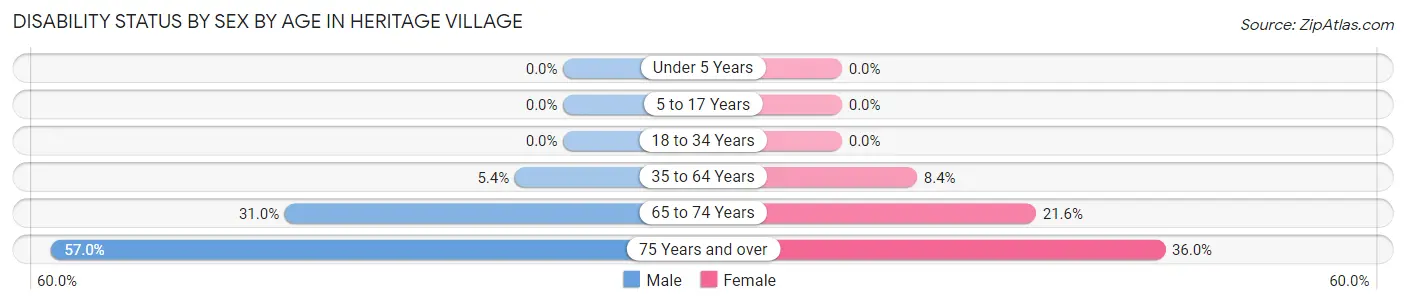
| Age Bracket | Male | Female |
| Under 5 Years | 0 (0.0%) | 0 (0.0%) |
| 5 to 17 Years | 0 (0.0%) | 0 (0.0%) |
| 18 to 34 Years | 0 (0.0%) | 0 (0.0%) |
| 35 to 64 Years | 15 (5.4%) | 50 (8.4%) |
| 65 to 74 Years | 133 (31.0%) | 145 (21.6%) |
| 75 Years and over | 382 (57.0%) | 505 (36.0%) |
Disability Class by Sex by Age in Heritage Village
Disability Class: Hearing Difficulty
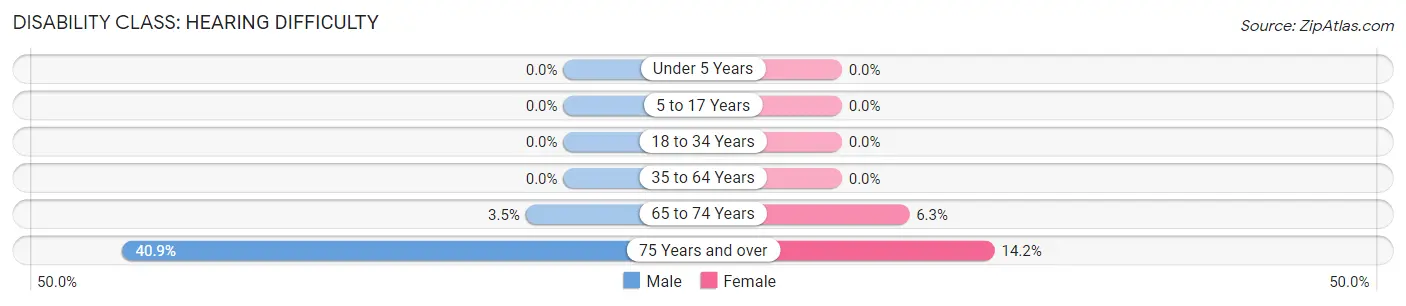
| Age Bracket | Male | Female |
| Under 5 Years | 0 (0.0%) | 0 (0.0%) |
| 5 to 17 Years | 0 (0.0%) | 0 (0.0%) |
| 18 to 34 Years | 0 (0.0%) | 0 (0.0%) |
| 35 to 64 Years | 0 (0.0%) | 0 (0.0%) |
| 65 to 74 Years | 15 (3.5%) | 42 (6.3%) |
| 75 Years and over | 274 (40.9%) | 199 (14.2%) |
Disability Class: Vision Difficulty
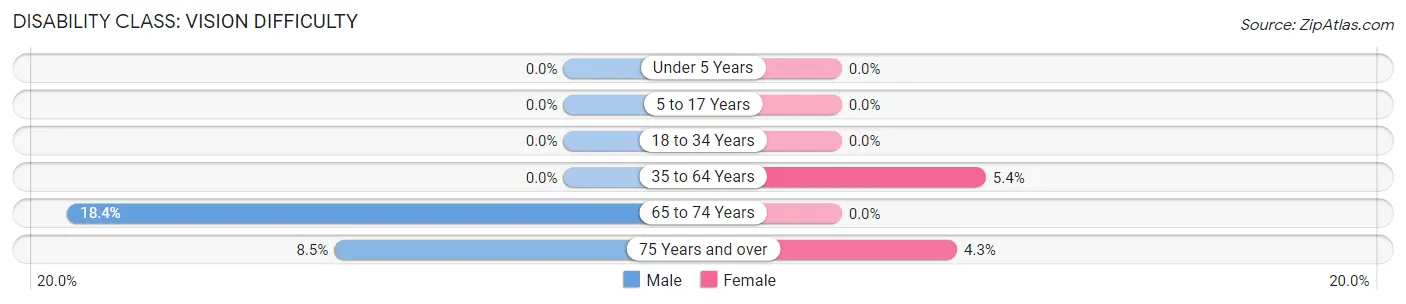
| Age Bracket | Male | Female |
| Under 5 Years | 0 (0.0%) | 0 (0.0%) |
| 5 to 17 Years | 0 (0.0%) | 0 (0.0%) |
| 18 to 34 Years | 0 (0.0%) | 0 (0.0%) |
| 35 to 64 Years | 0 (0.0%) | 32 (5.3%) |
| 65 to 74 Years | 79 (18.4%) | 0 (0.0%) |
| 75 Years and over | 57 (8.5%) | 60 (4.3%) |
Disability Class: Cognitive Difficulty
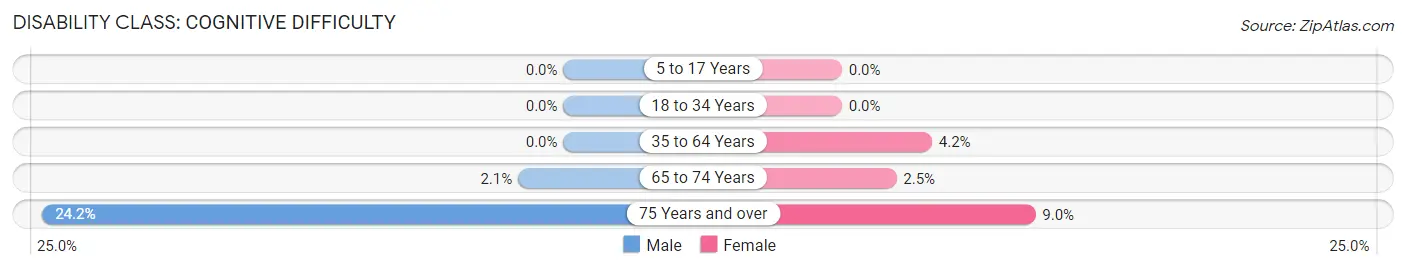
| Age Bracket | Male | Female |
| 5 to 17 Years | 0 (0.0%) | 0 (0.0%) |
| 18 to 34 Years | 0 (0.0%) | 0 (0.0%) |
| 35 to 64 Years | 0 (0.0%) | 25 (4.2%) |
| 65 to 74 Years | 9 (2.1%) | 17 (2.5%) |
| 75 Years and over | 162 (24.2%) | 126 (9.0%) |
Disability Class: Ambulatory Difficulty
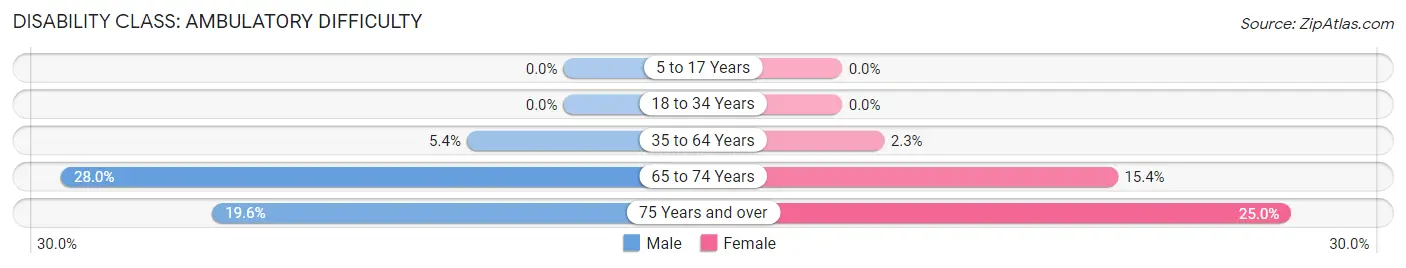
| Age Bracket | Male | Female |
| 5 to 17 Years | 0 (0.0%) | 0 (0.0%) |
| 18 to 34 Years | 0 (0.0%) | 0 (0.0%) |
| 35 to 64 Years | 15 (5.4%) | 14 (2.3%) |
| 65 to 74 Years | 120 (28.0%) | 103 (15.3%) |
| 75 Years and over | 131 (19.6%) | 351 (25.0%) |
Disability Class: Self-Care Difficulty
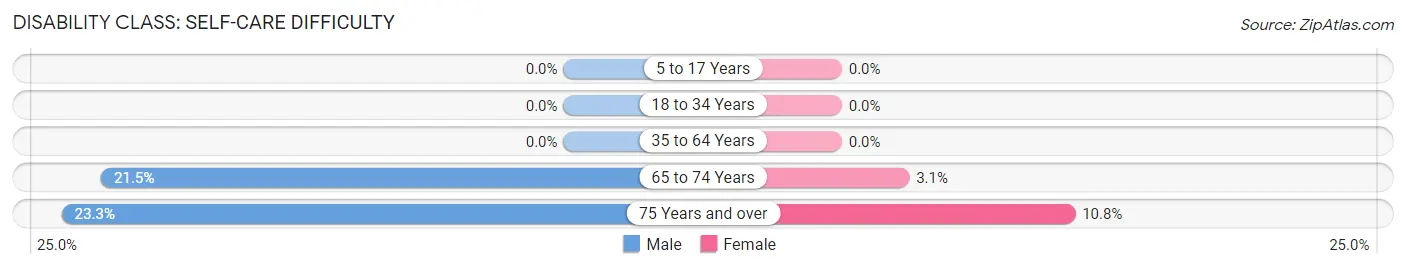
| Age Bracket | Male | Female |
| 5 to 17 Years | 0 (0.0%) | 0 (0.0%) |
| 18 to 34 Years | 0 (0.0%) | 0 (0.0%) |
| 35 to 64 Years | 0 (0.0%) | 0 (0.0%) |
| 65 to 74 Years | 92 (21.4%) | 21 (3.1%) |
| 75 Years and over | 156 (23.3%) | 152 (10.8%) |
Technology Access in Heritage Village
Computing Device Access in Heritage Village

| Device Type | # Households | % Households |
| Desktop or Laptop | 1,854 | 65.1% |
| Smartphone | 1,786 | 62.7% |
| Tablet | 1,408 | 49.5% |
| No Computing Device | 649 | 22.8% |
| Total | 2,847 | 100.0% |
Internet Access in Heritage Village
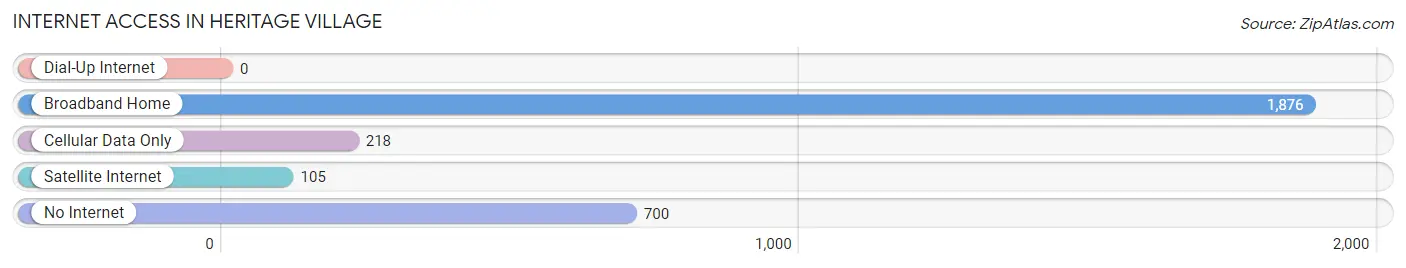
| Internet Type | # Households | % Households |
| Dial-Up Internet | 0 | 0.0% |
| Broadband Home | 1,876 | 65.9% |
| Cellular Data Only | 218 | 7.7% |
| Satellite Internet | 105 | 3.7% |
| No Internet | 700 | 24.6% |
| Total | 2,847 | 100.0% |
Heritage Village Summary
Heritage Village is a census-designated place (CDP) located in the town of Southbury, Connecticut in New Haven County. It is situated in the western part of the state, approximately 40 miles northeast of New York City. As of the 2010 census, the population of Heritage Village was 4,212.
Geography
Heritage Village is located at 41°25'25" North, 73°14'45" West (41.423750, -73.245833). It is situated in the western part of Connecticut, approximately 40 miles northeast of New York City. The CDP has a total area of 4.2 square miles, all of which is land.
Demographics
As of the 2010 census, there were 4,212 people, 1,717 households, and 1,323 families residing in the CDP. The population density was 1,000.7 people per square mile. There were 1,817 housing units at an average density of 433.3 per square mile. The racial makeup of the CDP was 95.2% White, 0.9% African American, 0.2% Native American, 1.7% Asian, 0.7% from other races, and 1.3% from two or more races. Hispanic or Latino of any race were 3.2% of the population.
There were 1,717 households, out of which 28.2% had children under the age of 18 living with them, 63.2% were married couples living together, 6.2% had a female householder with no husband present, and 28.2% were non-families. 22.7% of all households were made up of individuals, and 11.2% had someone living alone who was 65 years of age or older. The average household size was 2.45 and the average family size was 2.88.
In the CDP, the population was spread out, with 21.7% under the age of 18, 4.2% from 18 to 24, 22.2% from 25 to 44, 32.2% from 45 to 64, and 19.7% who were 65 years of age or older. The median age was 46 years. For every 100 females, there were 93.2 males. For every 100 females age 18 and over, there were 91.2 males.
The median income for a household in the CDP was $87,917, and the median income for a family was $102,917. Males had a median income of $71,250 versus $45,000 for females. The per capita income for the CDP was $45,917. About 1.2% of families and 1.7% of the population were below the poverty line, including 0.9% of those under age 18 and 2.2% of those age 65 or over.
Economy
Heritage Village is a residential community with no major industries or businesses. The majority of the population is employed in the nearby cities of Waterbury and Danbury. The median household income is higher than the state average, and the unemployment rate is lower than the state average.
The town of Southbury is home to several large employers, including the Southbury Training School, a state-run facility for people with intellectual disabilities, and the Southbury Plaza, a shopping center. The town also has a number of small businesses, including restaurants, retail stores, and professional services.
Conclusion
Heritage Village is a census-designated place located in the town of Southbury, Connecticut in New Haven County. As of the 2010 census, the population of Heritage Village was 4,212. The CDP has a total area of 4.2 square miles, all of which is land. The racial makeup of the CDP was 95.2% White, 0.9% African American, 0.2% Native American, 1.7% Asian, 0.7% from other races, and 1.3% from two or more races. The median household income is higher than the state average, and the unemployment rate is lower than the state average. The town of Southbury is home to several large employers, including the Southbury Training School and the Southbury Plaza. The town also has a number of small businesses, including restaurants, retail stores, and professional services.
Common Questions
What is Per Capita Income in Heritage Village?
Per Capita income in Heritage Village is $53,567.
What is the Median Family Income in Heritage Village?
Median Family Income in Heritage Village is $80,446.
What is the Median Household income in Heritage Village?
Median Household Income in Heritage Village is $46,663.
What is Income or Wage Gap in Heritage Village?
Income or Wage Gap in Heritage Village is 8.5%.
Women in Heritage Village earn 91.5 cents for every dollar earned by a man.
What is Inequality or Gini Index in Heritage Village?
Inequality or Gini Index in Heritage Village is 0.52.
What is the Total Population of Heritage Village?
Total Population of Heritage Village is 4,411.
What is the Total Male Population of Heritage Village?
Total Male Population of Heritage Village is 1,532.
What is the Total Female Population of Heritage Village?
Total Female Population of Heritage Village is 2,879.
What is the Ratio of Males per 100 Females in Heritage Village?
There are 53.21 Males per 100 Females in Heritage Village.
What is the Ratio of Females per 100 Males in Heritage Village?
There are 187.92 Females per 100 Males in Heritage Village.
What is the Median Population Age in Heritage Village?
Median Population Age in Heritage Village is 74.2 Years.
What is the Average Family Size in Heritage Village
Average Family Size in Heritage Village is 2.2 People.
What is the Average Household Size in Heritage Village
Average Household Size in Heritage Village is 1.5 People.
How Large is the Labor Force in Heritage Village?
There are 1,159 People in the Labor Forcein in Heritage Village.
What is the Percentage of People in the Labor Force in Heritage Village?
26.5% of People are in the Labor Force in Heritage Village.
What is the Unemployment Rate in Heritage Village?
Unemployment Rate in Heritage Village is 3.4%.