Southport, CT Map & Demographics
Southport Map
Southport Overview
$124,911
PER CAPITA INCOME
$206,205
AVG FAMILY INCOME
$156,406
AVG HOUSEHOLD INCOME
42.1%
WAGE / INCOME GAP [ % ]
57.9¢/ $1
WAGE / INCOME GAP [ $ ]
0.55
INEQUALITY / GINI INDEX
1,515
TOTAL POPULATION
638
MALE POPULATION
877
FEMALE POPULATION
72.75
MALES / 100 FEMALES
137.46
FEMALES / 100 MALES
56.2
MEDIAN AGE
2.6
AVG FAMILY SIZE
2.1
AVG HOUSEHOLD SIZE
872
LABOR FORCE [ PEOPLE ]
67.5%
PERCENT IN LABOR FORCE
5.3%
UNEMPLOYMENT RATE
Southport Zip Codes
Southport Area Codes
Income in Southport
Income Overview in Southport
Per Capita Income in Southport is $124,911, while median incomes of families and households are $206,205 and $156,406 respectively.
| Characteristic | Number | Measure |
| Per Capita Income | 1,515 | $124,911 |
| Median Family Income | 466 | $206,205 |
| Mean Family Income | 466 | $328,092 |
| Median Household Income | 719 | $156,406 |
| Mean Household Income | 719 | $251,788 |
| Income Deficit | 466 | $0 |
| Wage / Income Gap (%) | 1,515 | 42.14% |
| Wage / Income Gap ($) | 1,515 | 57.86¢ per $1 |
| Gini / Inequality Index | 1,515 | 0.55 |
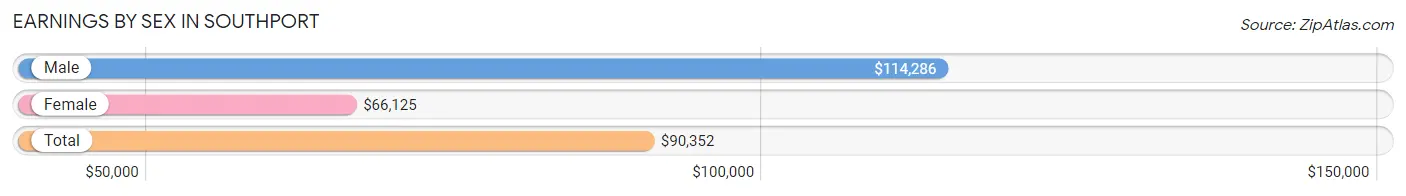
Earnings by Sex in Southport
Average Earnings in Southport are $90,352, $114,286 for men and $66,125 for women, a difference of 42.1%.
| Sex | Number | Average Earnings |
| Male | 452 (50.1%) | $114,286 |
| Female | 450 (49.9%) | $66,125 |
| Total | 902 (100.0%) | $90,352 |
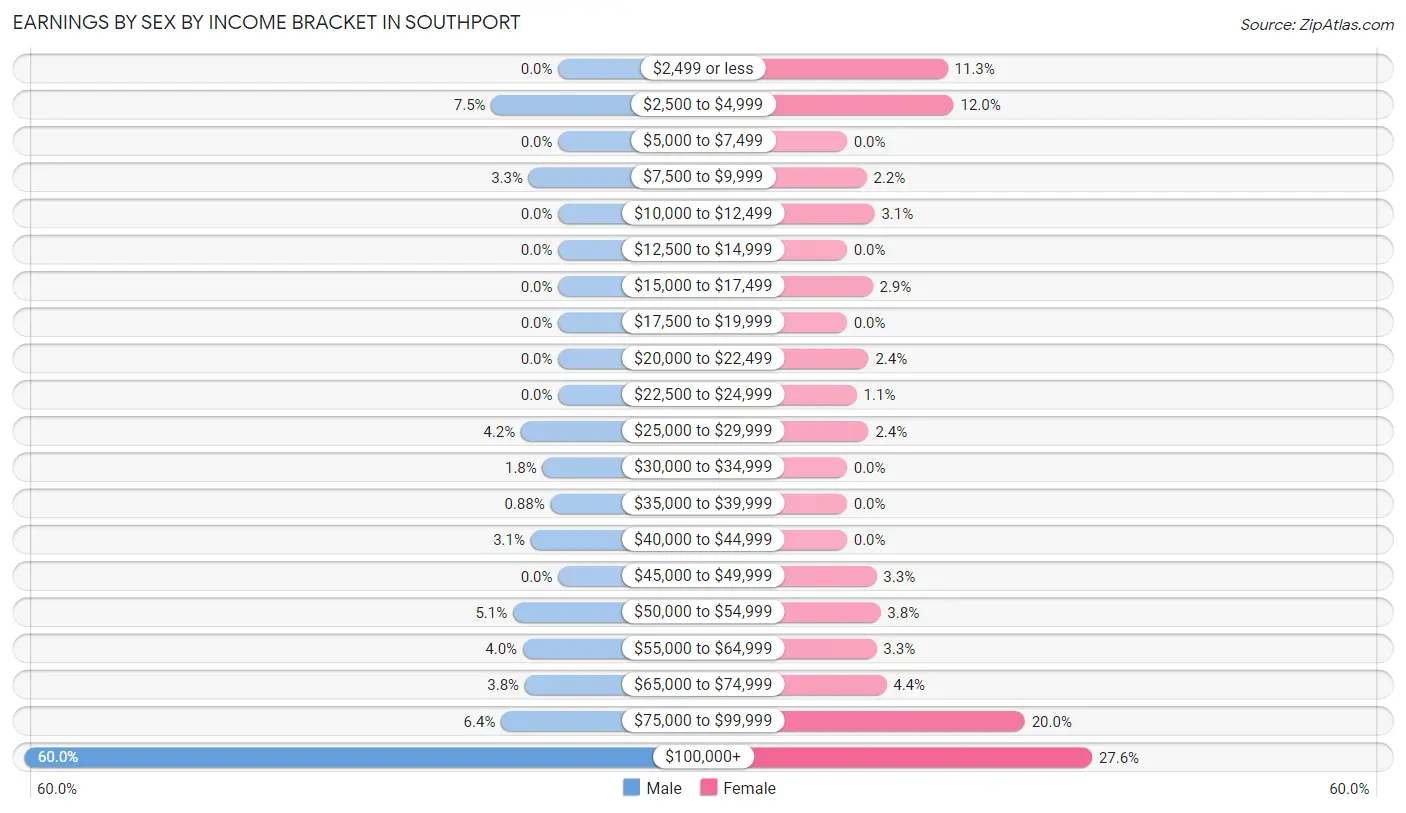
Earnings by Sex by Income Bracket in Southport
The most common earnings brackets in Southport are $100,000+ for men (271 | 60.0%) and $100,000+ for women (124 | 27.6%).
| Income | Male | Female |
| $2,499 or less | 0 (0.0%) | 51 (11.3%) |
| $2,500 to $4,999 | 34 (7.5%) | 54 (12.0%) |
| $5,000 to $7,499 | 0 (0.0%) | 0 (0.0%) |
| $7,500 to $9,999 | 15 (3.3%) | 10 (2.2%) |
| $10,000 to $12,499 | 0 (0.0%) | 14 (3.1%) |
| $12,500 to $14,999 | 0 (0.0%) | 0 (0.0%) |
| $15,000 to $17,499 | 0 (0.0%) | 13 (2.9%) |
| $17,500 to $19,999 | 0 (0.0%) | 0 (0.0%) |
| $20,000 to $22,499 | 0 (0.0%) | 11 (2.4%) |
| $22,500 to $24,999 | 0 (0.0%) | 5 (1.1%) |
| $25,000 to $29,999 | 19 (4.2%) | 11 (2.4%) |
| $30,000 to $34,999 | 8 (1.8%) | 0 (0.0%) |
| $35,000 to $39,999 | 4 (0.9%) | 0 (0.0%) |
| $40,000 to $44,999 | 14 (3.1%) | 0 (0.0%) |
| $45,000 to $49,999 | 0 (0.0%) | 15 (3.3%) |
| $50,000 to $54,999 | 23 (5.1%) | 17 (3.8%) |
| $55,000 to $64,999 | 18 (4.0%) | 15 (3.3%) |
| $65,000 to $74,999 | 17 (3.8%) | 20 (4.4%) |
| $75,000 to $99,999 | 29 (6.4%) | 90 (20.0%) |
| $100,000+ | 271 (60.0%) | 124 (27.6%) |
| Total | 452 (100.0%) | 450 (100.0%) |
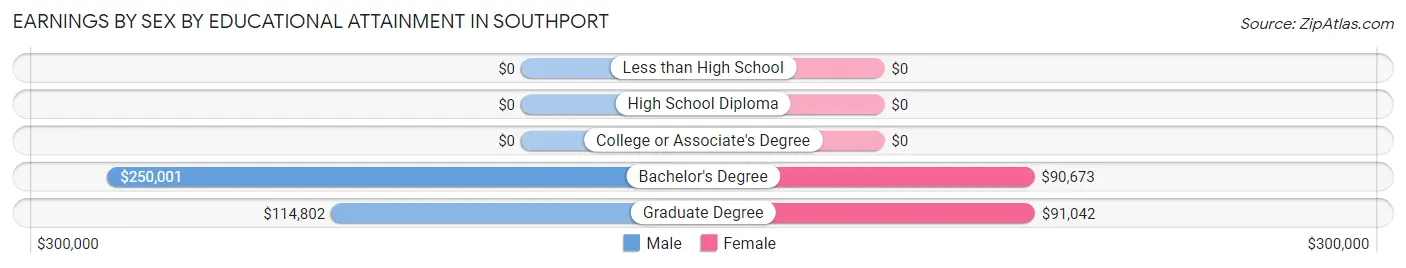
Earnings by Sex by Educational Attainment in Southport
Average earnings in Southport are $118,438 for men and $81,850 for women, a difference of 30.9%. Men with an educational attainment of bachelor's degree enjoy the highest average annual earnings of $250,001, while those with graduate degree education earn the least with $114,802. Women with an educational attainment of graduate degree earn the most with the average annual earnings of $91,042, while those with bachelor's degree education have the smallest earnings of $90,673.
| Educational Attainment | Male Income | Female Income |
| Less than High School | - | - |
| High School Diploma | - | - |
| College or Associate's Degree | - | - |
| Bachelor's Degree | $250,001 | $90,673 |
| Graduate Degree | $114,802 | $91,042 |
| Total | $118,438 | $81,850 |
Family Income in Southport
Family Income Brackets in Southport
According to the Southport family income data, there are 260 families falling into the $200,000+ income range, which is the most common income bracket and makes up 55.8% of all families.
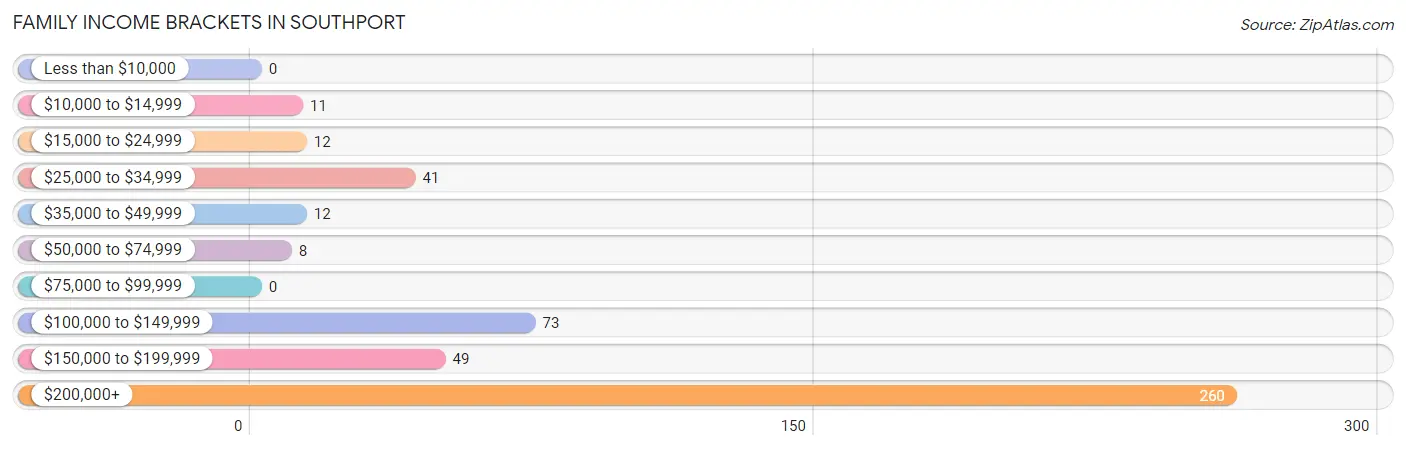
| Income Bracket | # Families | % Families |
| Less than $10,000 | 0 | 0.0% |
| $10,000 to $14,999 | 11 | 2.4% |
| $15,000 to $24,999 | 12 | 2.6% |
| $25,000 to $34,999 | 41 | 8.8% |
| $35,000 to $49,999 | 12 | 2.6% |
| $50,000 to $74,999 | 8 | 1.7% |
| $75,000 to $99,999 | 0 | 0.0% |
| $100,000 to $149,999 | 73 | 15.7% |
| $150,000 to $199,999 | 49 | 10.5% |
| $200,000+ | 260 | 55.8% |
Family Income by Famaliy Size in Southport
4-person families (28 | 6.0%) account for the highest median family income in Southport with $250,001 per family, while 2-person families (316 | 67.8%) have the highest median income of $103,170 per family member.
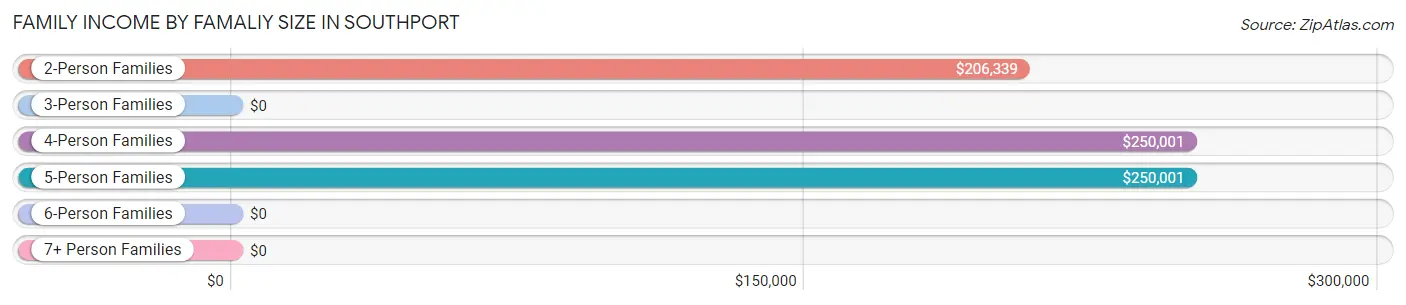
| Income Bracket | # Families | Median Income |
| 2-Person Families | 316 (67.8%) | $206,339 |
| 3-Person Families | 102 (21.9%) | $0 |
| 4-Person Families | 28 (6.0%) | $250,001 |
| 5-Person Families | 17 (3.6%) | $250,001 |
| 6-Person Families | 3 (0.6%) | $0 |
| 7+ Person Families | 0 (0.0%) | $0 |
| Total | 466 (100.0%) | $206,205 |
Family Income by Number of Earners in Southport
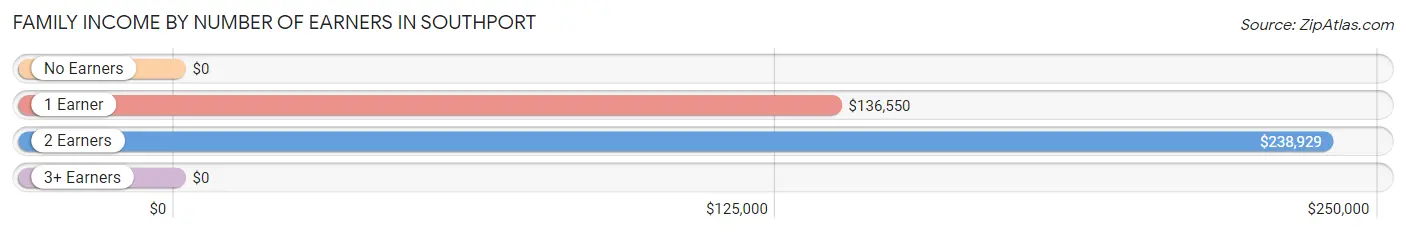
| Number of Earners | # Families | Median Income |
| No Earners | 31 (6.7%) | $0 |
| 1 Earner | 193 (41.4%) | $136,550 |
| 2 Earners | 226 (48.5%) | $238,929 |
| 3+ Earners | 16 (3.4%) | $0 |
| Total | 466 (100.0%) | $206,205 |
Household Income in Southport
Household Income Brackets in Southport
With 298 households falling in the category, the $200,000+ income range is the most frequent in Southport, accounting for 41.4% of all households. In contrast, only 12 households (1.7%) fall into the $15,000 to $24,999 income bracket, making it the least populous group.
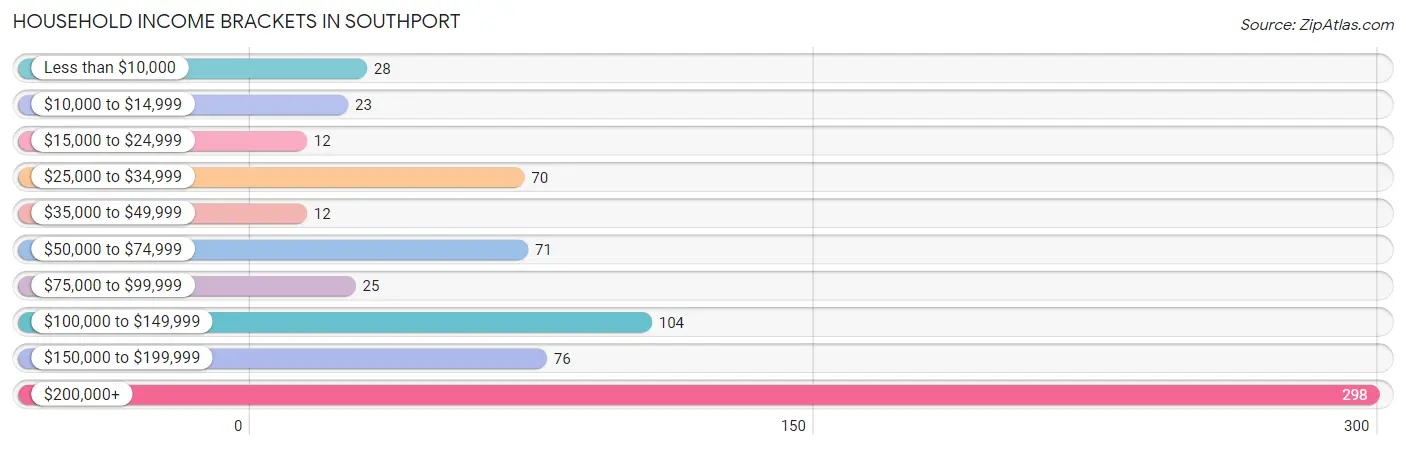
| Income Bracket | # Households | % Households |
| Less than $10,000 | 28 | 3.9% |
| $10,000 to $14,999 | 23 | 3.2% |
| $15,000 to $24,999 | 12 | 1.7% |
| $25,000 to $34,999 | 70 | 9.7% |
| $35,000 to $49,999 | 12 | 1.7% |
| $50,000 to $74,999 | 71 | 9.9% |
| $75,000 to $99,999 | 25 | 3.5% |
| $100,000 to $149,999 | 104 | 14.5% |
| $150,000 to $199,999 | 76 | 10.6% |
| $200,000+ | 298 | 41.4% |
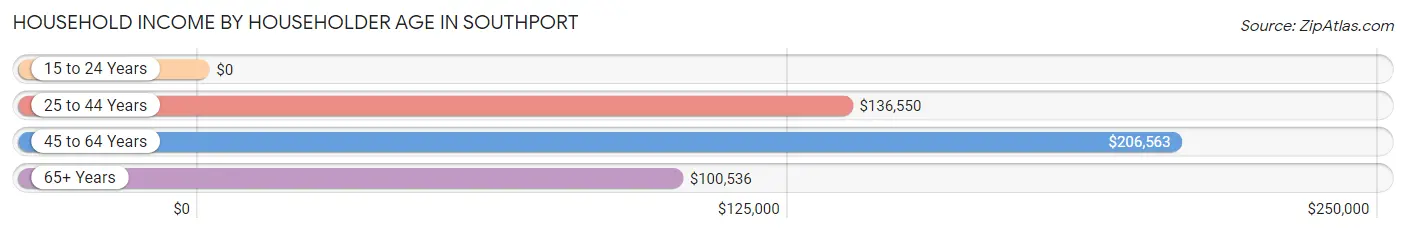
Household Income by Householder Age in Southport
The median household income in Southport is $156,406, with the highest median household income of $206,563 found in the 45 to 64 years age bracket for the primary householder. A total of 314 households (43.7%) fall into this category. Meanwhile, the 15 to 24 years age bracket for the primary householder has the lowest median household income of $0, with 28 households (3.9%) in this group.
| Income Bracket | # Households | Median Income |
| 15 to 24 Years | 28 (3.9%) | $0 |
| 25 to 44 Years | 149 (20.7%) | $136,550 |
| 45 to 64 Years | 314 (43.7%) | $206,563 |
| 65+ Years | 228 (31.7%) | $100,536 |
| Total | 719 (100.0%) | $156,406 |
Poverty in Southport
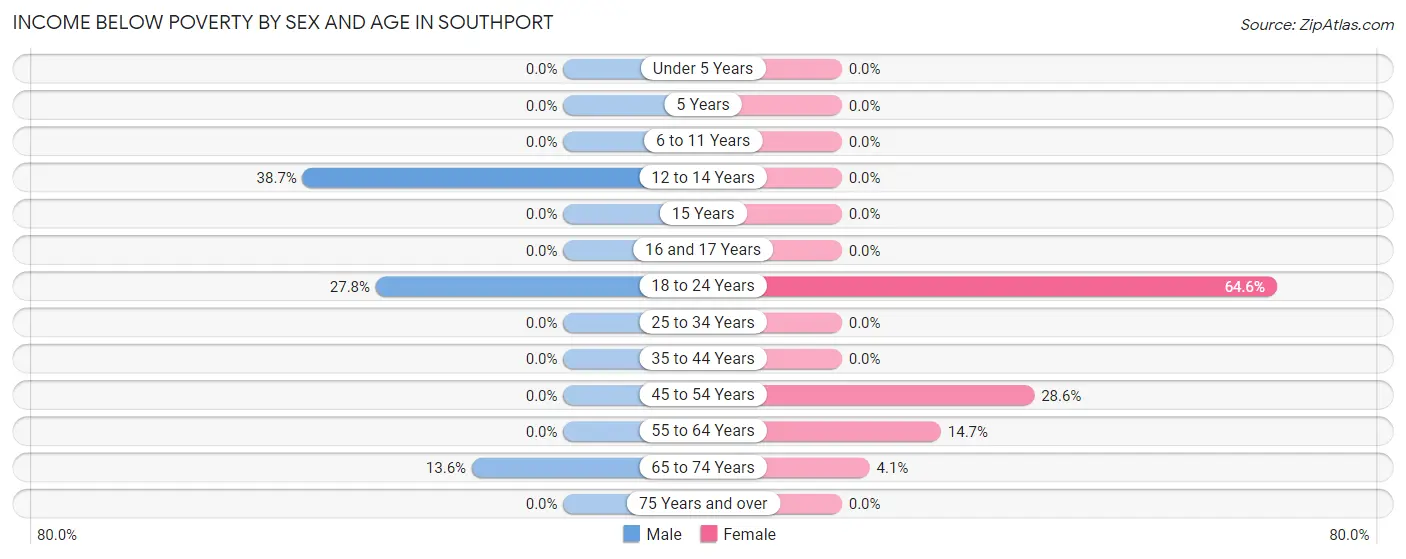
Income Below Poverty by Sex and Age in Southport
With 7.8% poverty level for males and 9.5% for females among the residents of Southport, 12 to 14 year old males and 18 to 24 year old females are the most vulnerable to poverty, with 12 males (38.7%) and 31 females (64.6%) in their respective age groups living below the poverty level.
| Age Bracket | Male | Female |
| Under 5 Years | 0 (0.0%) | 0 (0.0%) |
| 5 Years | 0 (0.0%) | 0 (0.0%) |
| 6 to 11 Years | 0 (0.0%) | 0 (0.0%) |
| 12 to 14 Years | 12 (38.7%) | 0 (0.0%) |
| 15 Years | 0 (0.0%) | 0 (0.0%) |
| 16 and 17 Years | 0 (0.0%) | 0 (0.0%) |
| 18 to 24 Years | 27 (27.8%) | 31 (64.6%) |
| 25 to 34 Years | 0 (0.0%) | 0 (0.0%) |
| 35 to 44 Years | 0 (0.0%) | 0 (0.0%) |
| 45 to 54 Years | 0 (0.0%) | 12 (28.6%) |
| 55 to 64 Years | 0 (0.0%) | 35 (14.7%) |
| 65 to 74 Years | 11 (13.6%) | 5 (4.1%) |
| 75 Years and over | 0 (0.0%) | 0 (0.0%) |
| Total | 50 (7.8%) | 83 (9.5%) |
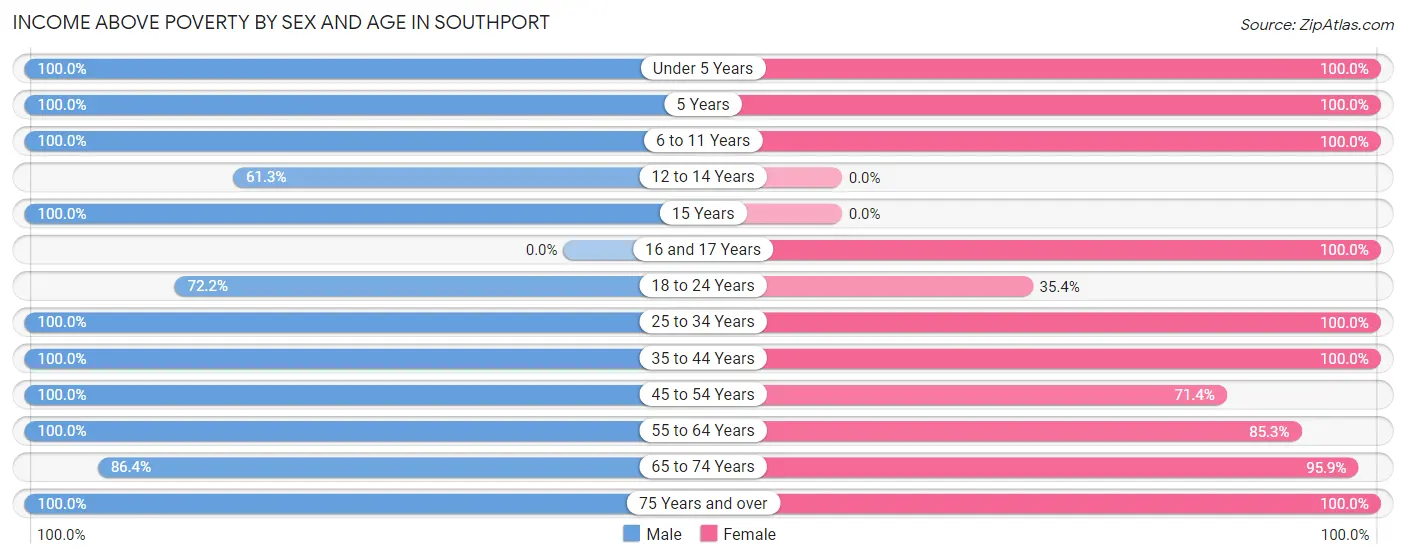
Income Above Poverty by Sex and Age in Southport
According to the poverty statistics in Southport, males aged under 5 years and females aged under 5 years are the age groups that are most secure financially, with 100.0% of males and 100.0% of females in these age groups living above the poverty line.
| Age Bracket | Male | Female |
| Under 5 Years | 6 (100.0%) | 25 (100.0%) |
| 5 Years | 1 (100.0%) | 9 (100.0%) |
| 6 to 11 Years | 29 (100.0%) | 108 (100.0%) |
| 12 to 14 Years | 19 (61.3%) | 0 (0.0%) |
| 15 Years | 14 (100.0%) | 0 (0.0%) |
| 16 and 17 Years | 0 (0.0%) | 31 (100.0%) |
| 18 to 24 Years | 70 (72.2%) | 17 (35.4%) |
| 25 to 34 Years | 18 (100.0%) | 40 (100.0%) |
| 35 to 44 Years | 81 (100.0%) | 120 (100.0%) |
| 45 to 54 Years | 43 (100.0%) | 30 (71.4%) |
| 55 to 64 Years | 203 (100.0%) | 203 (85.3%) |
| 65 to 74 Years | 70 (86.4%) | 116 (95.9%) |
| 75 Years and over | 34 (100.0%) | 95 (100.0%) |
| Total | 588 (92.2%) | 794 (90.5%) |
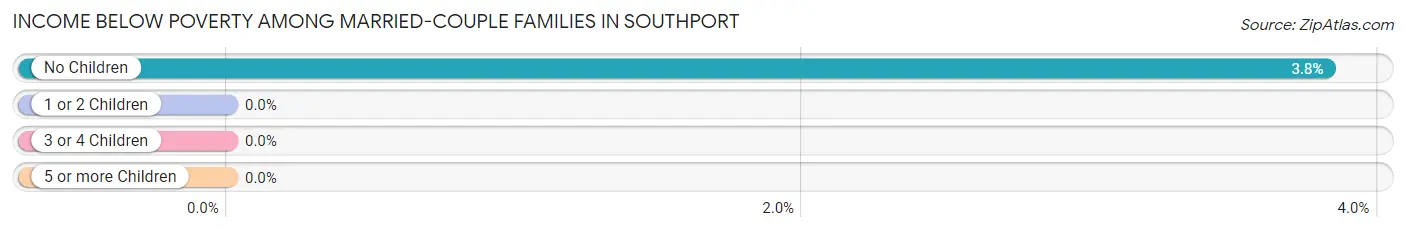
Income Below Poverty Among Married-Couple Families in Southport
The poverty statistics for married-couple families in Southport show that 3.1% or 11 of the total 360 families live below the poverty line. Families with no children have the highest poverty rate of 3.8%, comprising of 11 families. On the other hand, families with 1 or 2 children have the lowest poverty rate of 0.0%, which includes 0 families.
| Children | Above Poverty | Below Poverty |
| No Children | 277 (96.2%) | 11 (3.8%) |
| 1 or 2 Children | 52 (100.0%) | 0 (0.0%) |
| 3 or 4 Children | 20 (100.0%) | 0 (0.0%) |
| 5 or more Children | 0 (0.0%) | 0 (0.0%) |
| Total | 349 (96.9%) | 11 (3.1%) |
Income Below Poverty Among Single-Parent Households in Southport
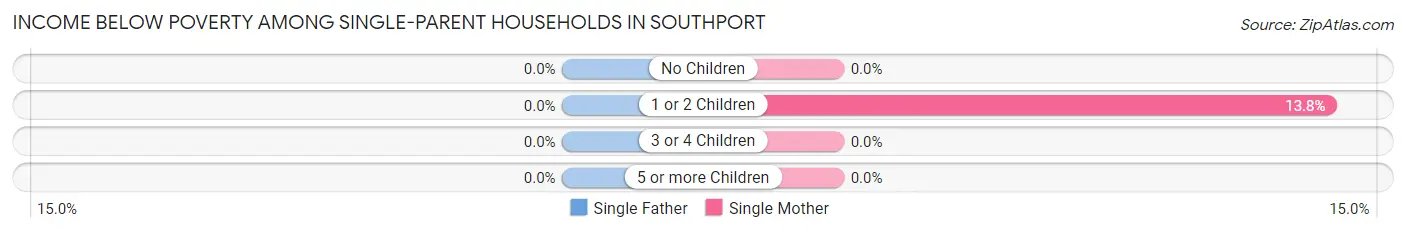
| Children | Single Father | Single Mother |
| No Children | 0 (0.0%) | 0 (0.0%) |
| 1 or 2 Children | 0 (0.0%) | 12 (13.8%) |
| 3 or 4 Children | 0 (0.0%) | 0 (0.0%) |
| 5 or more Children | 0 (0.0%) | 0 (0.0%) |
| Total | 0 (0.0%) | 12 (12.2%) |
Income Below Poverty Among Married-Couple vs Single-Parent Households in Southport
The poverty data for Southport shows that 11 of the married-couple family households (3.1%) and 12 of the single-parent households (11.3%) are living below the poverty level. Within the married-couple family households, those with no children have the highest poverty rate, with 11 households (3.8%) falling below the poverty line. Among the single-parent households, those with 1 or 2 children have the highest poverty rate, with 12 household (13.8%) living below poverty.
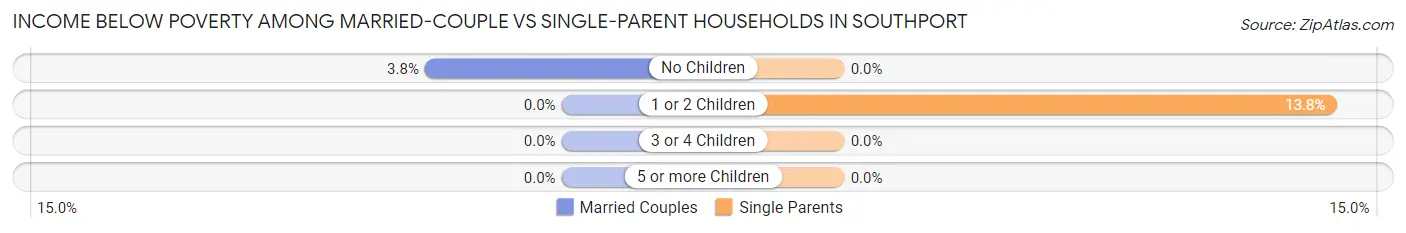
| Children | Married-Couple Families | Single-Parent Households |
| No Children | 11 (3.8%) | 0 (0.0%) |
| 1 or 2 Children | 0 (0.0%) | 12 (13.8%) |
| 3 or 4 Children | 0 (0.0%) | 0 (0.0%) |
| 5 or more Children | 0 (0.0%) | 0 (0.0%) |
| Total | 11 (3.1%) | 12 (11.3%) |
Race in Southport
The most populous races in Southport are White / Caucasian (1,425 | 94.1%), Two or more Races (43 | 2.8%), and Asian (35 | 2.3%).
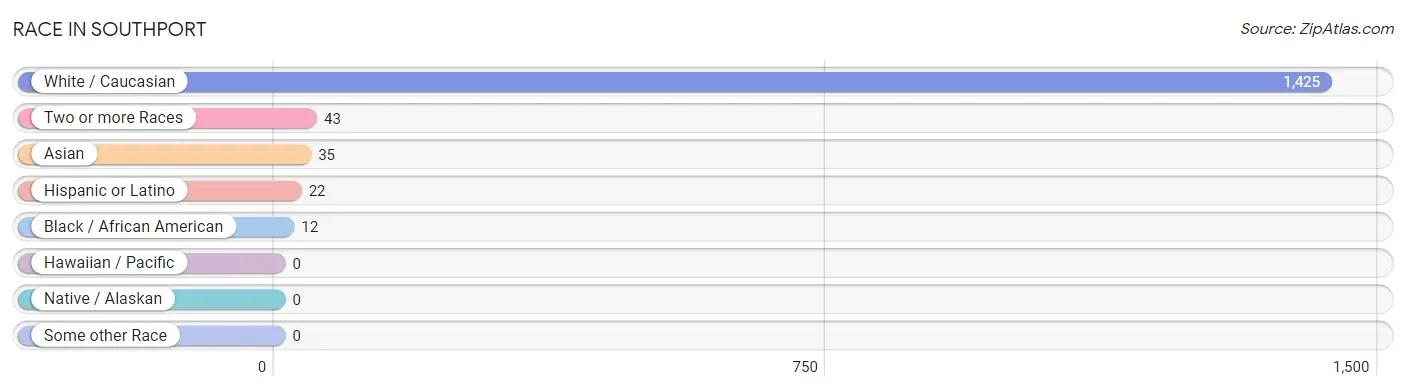
| Race | # Population | % Population |
| Asian | 35 | 2.3% |
| Black / African American | 12 | 0.8% |
| Hawaiian / Pacific | 0 | 0.0% |
| Hispanic or Latino | 22 | 1.5% |
| Native / Alaskan | 0 | 0.0% |
| White / Caucasian | 1,425 | 94.1% |
| Two or more Races | 43 | 2.8% |
| Some other Race | 0 | 0.0% |
| Total | 1,515 | 100.0% |
Ancestry in Southport
The most populous ancestries reported in Southport are Italian (378 | 24.9%), Irish (337 | 22.2%), German (225 | 14.8%), English (187 | 12.3%), and American (107 | 7.1%), together accounting for 81.4% of all Southport residents.
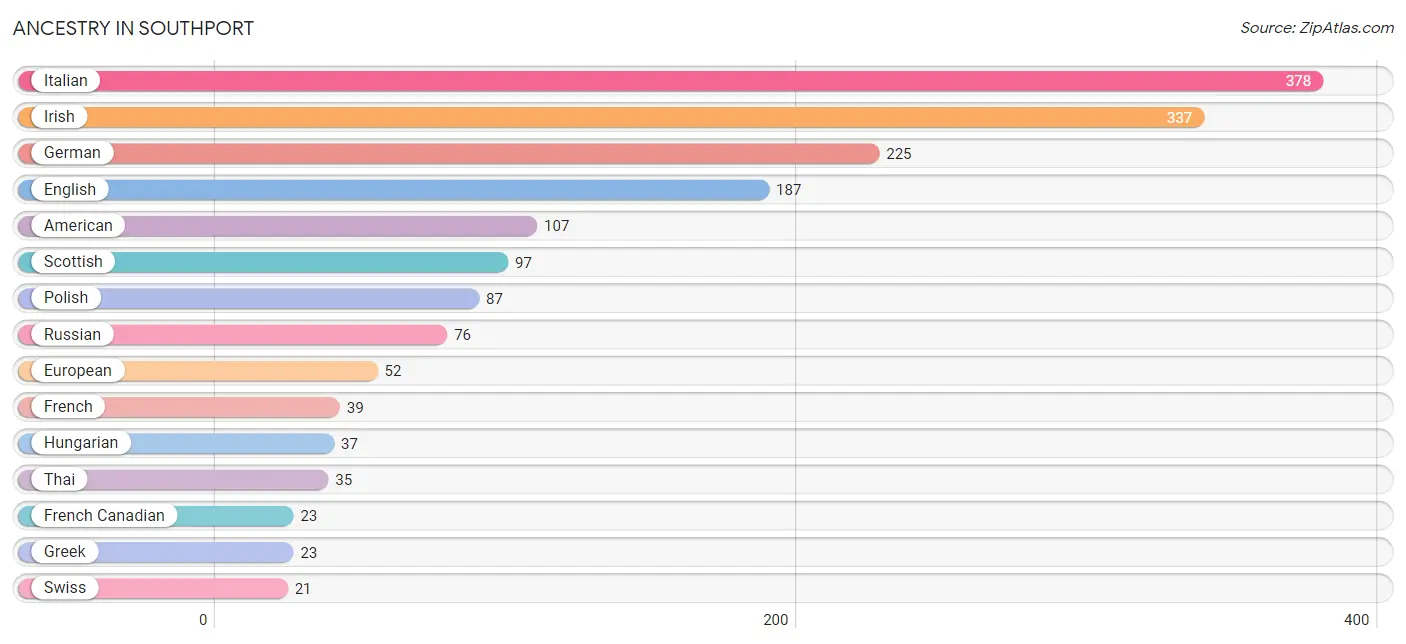
| Ancestry | # Population | % Population |
| American | 107 | 7.1% |
| Austrian | 7 | 0.5% |
| British | 5 | 0.3% |
| Czech | 11 | 0.7% |
| English | 187 | 12.3% |
| European | 52 | 3.4% |
| French | 39 | 2.6% |
| French Canadian | 23 | 1.5% |
| German | 225 | 14.8% |
| Greek | 23 | 1.5% |
| Hungarian | 37 | 2.4% |
| Irish | 337 | 22.2% |
| Italian | 378 | 24.9% |
| Norwegian | 10 | 0.7% |
| Paraguayan | 10 | 0.7% |
| Polish | 87 | 5.7% |
| Portuguese | 8 | 0.5% |
| Puerto Rican | 8 | 0.5% |
| Russian | 76 | 5.0% |
| Scottish | 97 | 6.4% |
| Slovene | 16 | 1.1% |
| South American | 10 | 0.7% |
| Spanish | 4 | 0.3% |
| Swedish | 10 | 0.7% |
| Swiss | 21 | 1.4% |
| Thai | 35 | 2.3% | View All 26 Rows |
Immigrants in Southport
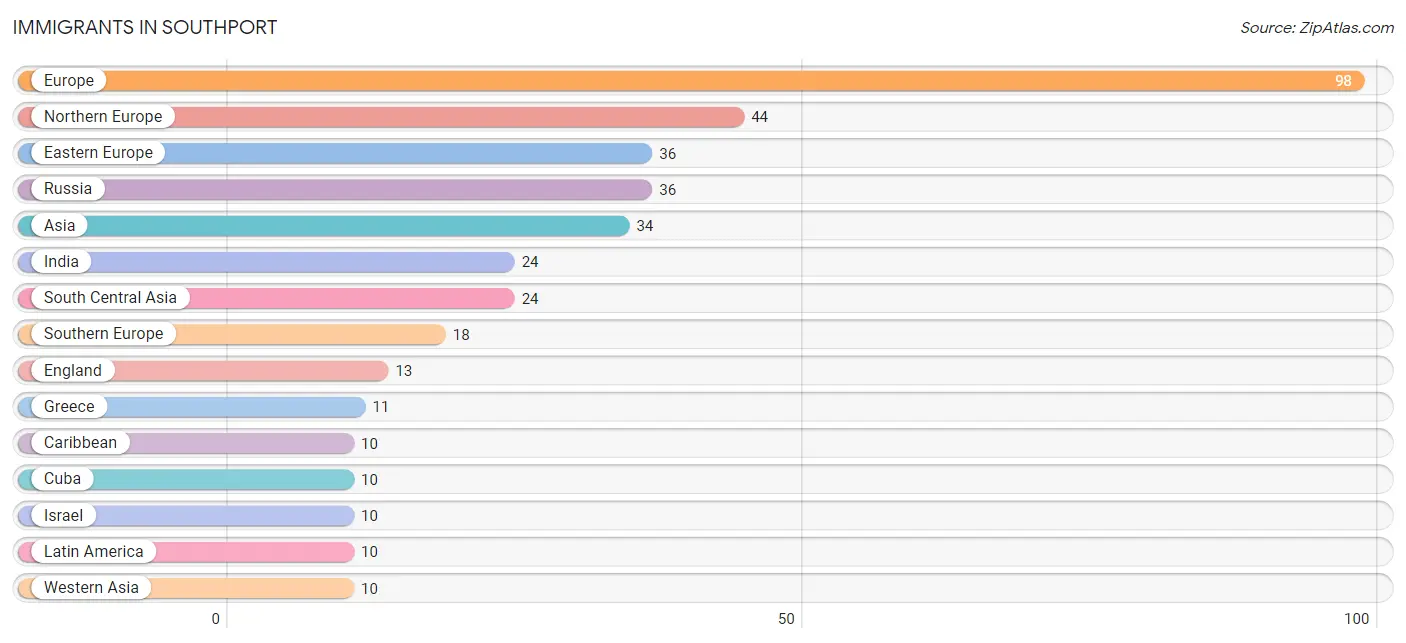
The most numerous immigrant groups reported in Southport came from Europe (98 | 6.5%), Northern Europe (44 | 2.9%), Eastern Europe (36 | 2.4%), Russia (36 | 2.4%), and Asia (34 | 2.2%), together accounting for 16.4% of all Southport residents.
| Immigration Origin | # Population | % Population |
| Asia | 34 | 2.2% |
| Canada | 9 | 0.6% |
| Caribbean | 10 | 0.7% |
| Cuba | 10 | 0.7% |
| Eastern Europe | 36 | 2.4% |
| England | 13 | 0.9% |
| Europe | 98 | 6.5% |
| Greece | 11 | 0.7% |
| India | 24 | 1.6% |
| Israel | 10 | 0.7% |
| Italy | 7 | 0.5% |
| Latin America | 10 | 0.7% |
| Northern Europe | 44 | 2.9% |
| Russia | 36 | 2.4% |
| South Central Asia | 24 | 1.6% |
| Southern Europe | 18 | 1.2% |
| Western Asia | 10 | 0.7% | View All 17 Rows |
Sex and Age in Southport
Sex and Age in Southport
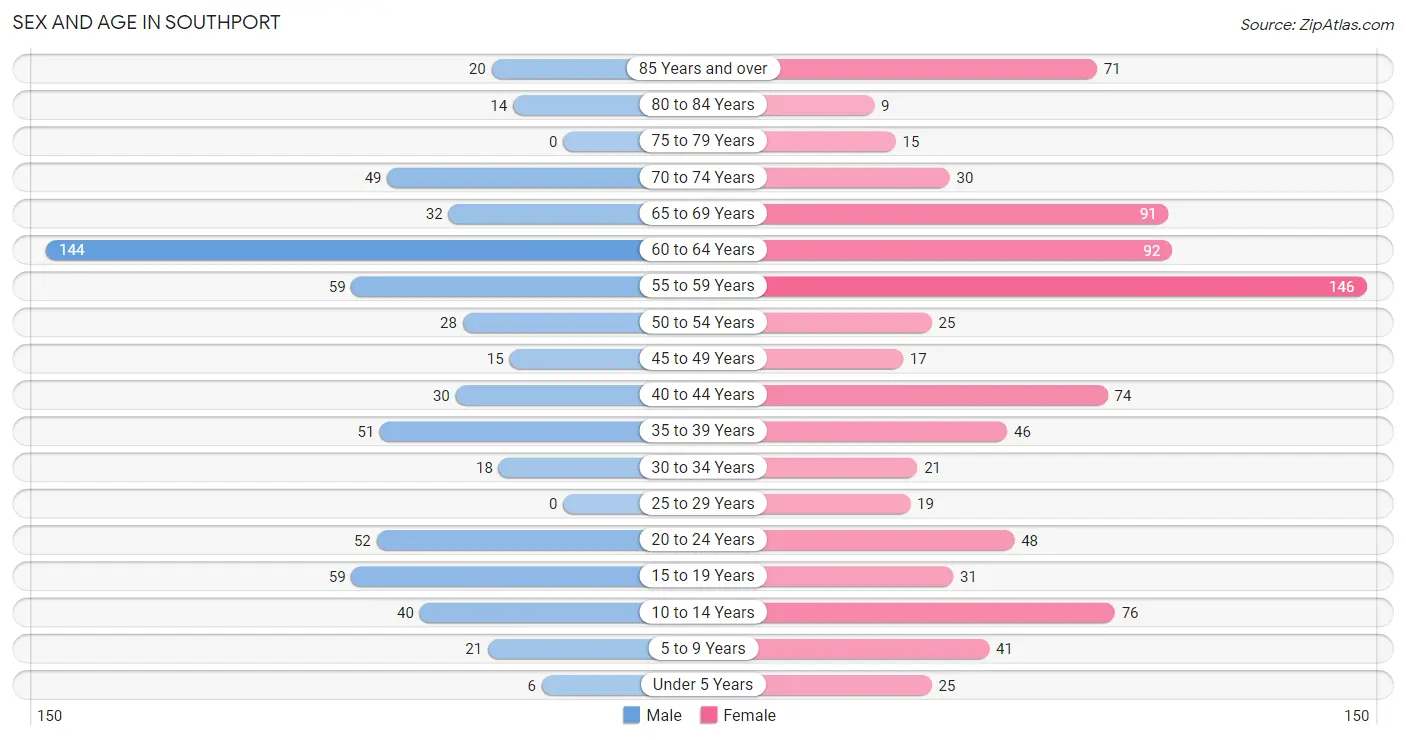
The most populous age groups in Southport are 60 to 64 Years (144 | 22.6%) for men and 55 to 59 Years (146 | 16.7%) for women.
| Age Bracket | Male | Female |
| Under 5 Years | 6 (0.9%) | 25 (2.9%) |
| 5 to 9 Years | 21 (3.3%) | 41 (4.7%) |
| 10 to 14 Years | 40 (6.3%) | 76 (8.7%) |
| 15 to 19 Years | 59 (9.2%) | 31 (3.5%) |
| 20 to 24 Years | 52 (8.2%) | 48 (5.5%) |
| 25 to 29 Years | 0 (0.0%) | 19 (2.2%) |
| 30 to 34 Years | 18 (2.8%) | 21 (2.4%) |
| 35 to 39 Years | 51 (8.0%) | 46 (5.2%) |
| 40 to 44 Years | 30 (4.7%) | 74 (8.4%) |
| 45 to 49 Years | 15 (2.4%) | 17 (1.9%) |
| 50 to 54 Years | 28 (4.4%) | 25 (2.9%) |
| 55 to 59 Years | 59 (9.2%) | 146 (16.7%) |
| 60 to 64 Years | 144 (22.6%) | 92 (10.5%) |
| 65 to 69 Years | 32 (5.0%) | 91 (10.4%) |
| 70 to 74 Years | 49 (7.7%) | 30 (3.4%) |
| 75 to 79 Years | 0 (0.0%) | 15 (1.7%) |
| 80 to 84 Years | 14 (2.2%) | 9 (1.0%) |
| 85 Years and over | 20 (3.1%) | 71 (8.1%) |
| Total | 638 (100.0%) | 877 (100.0%) |
Families and Households in Southport
Median Family Size in Southport
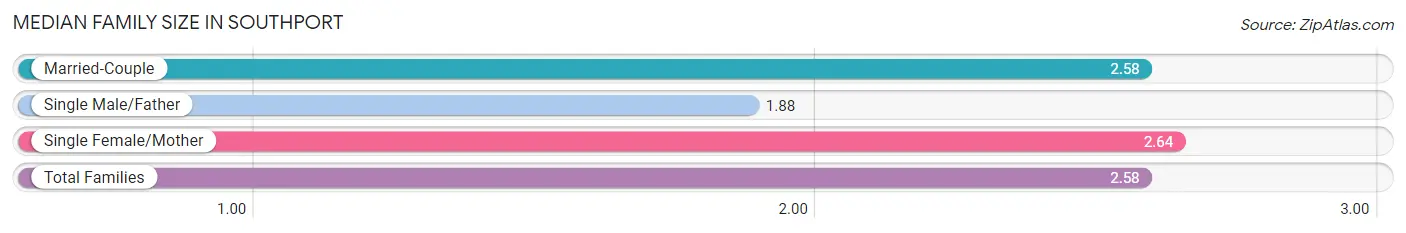
The median family size in Southport is 2.58 persons per family, with single female/mother families (98 | 21.0%) accounting for the largest median family size of 2.64 persons per family. On the other hand, single male/father families (8 | 1.7%) represent the smallest median family size with 1.88 persons per family.
| Family Type | # Families | Family Size |
| Married-Couple | 360 (77.2%) | 2.58 |
| Single Male/Father | 8 (1.7%) | 1.88 |
| Single Female/Mother | 98 (21.0%) | 2.64 |
| Total Families | 466 (100.0%) | 2.58 |
Median Household Size in Southport
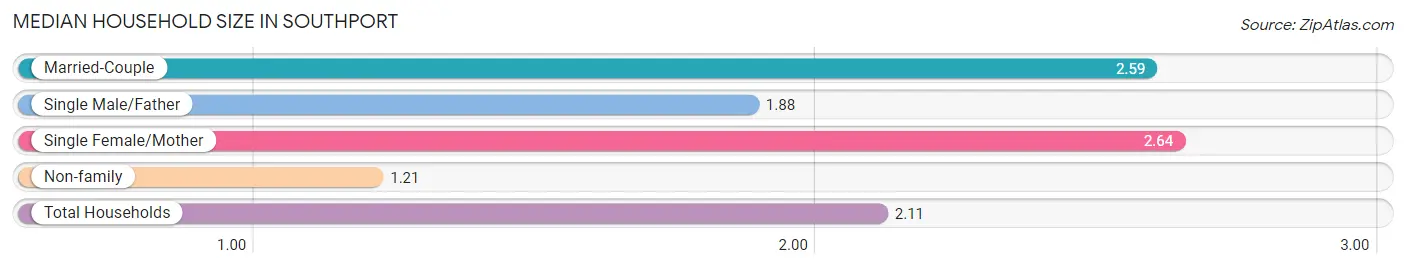
The median household size in Southport is 2.11 persons per household, with single female/mother households (98 | 13.6%) accounting for the largest median household size of 2.64 persons per household. non-family households (253 | 35.2%) represent the smallest median household size with 1.21 persons per household.
| Household Type | # Households | Household Size |
| Married-Couple | 360 (50.1%) | 2.59 |
| Single Male/Father | 8 (1.1%) | 1.88 |
| Single Female/Mother | 98 (13.6%) | 2.64 |
| Non-family | 253 (35.2%) | 1.21 |
| Total Households | 719 (100.0%) | 2.11 |
Household Size by Marriage Status in Southport
Out of a total of 719 households in Southport, 466 (64.8%) are family households, while 253 (35.2%) are nonfamily households. The most numerous type of family households are 2-person households, comprising 316, and the most common type of nonfamily households are 1-person households, comprising 208.
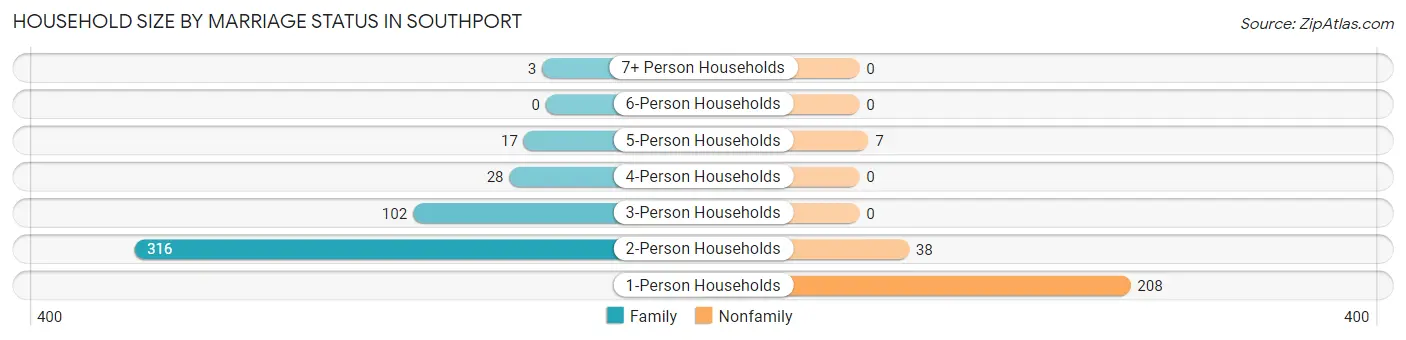
| Household Size | Family Households | Nonfamily Households |
| 1-Person Households | - | 208 (28.9%) |
| 2-Person Households | 316 (44.0%) | 38 (5.3%) |
| 3-Person Households | 102 (14.2%) | 0 (0.0%) |
| 4-Person Households | 28 (3.9%) | 0 (0.0%) |
| 5-Person Households | 17 (2.4%) | 7 (1.0%) |
| 6-Person Households | 0 (0.0%) | 0 (0.0%) |
| 7+ Person Households | 3 (0.4%) | 0 (0.0%) |
| Total | 466 (64.8%) | 253 (35.2%) |
Female Fertility in Southport
Fertility by Age in Southport
Average fertility rate in Southport is 19.0 births per 1,000 women. Women in the age bracket of 20 to 34 years have the highest fertility rate with 57.0 births per 1,000 women. Women in the age bracket of 20 to 34 years acount for 100.0% of all women with births.
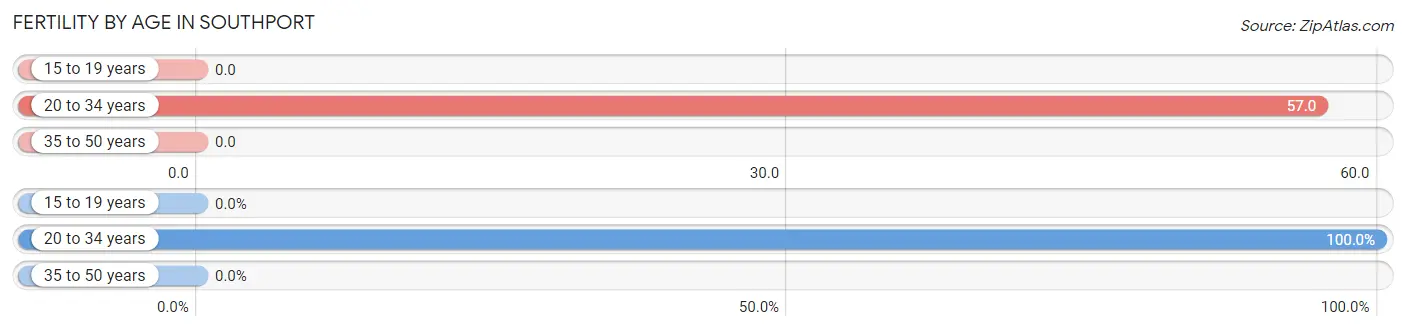
| Age Bracket | Women with Births | Births / 1,000 Women |
| 15 to 19 years | 0 (0.0%) | 0.0 |
| 20 to 34 years | 5 (100.0%) | 57.0 |
| 35 to 50 years | 0 (0.0%) | 0.0 |
| Total | 5 (100.0%) | 19.0 |
Fertility by Age by Marriage Status in Southport
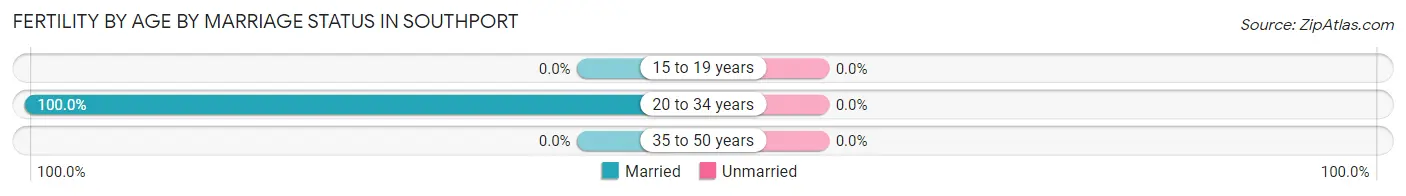
| Age Bracket | Married | Unmarried |
| 15 to 19 years | 0 (0.0%) | 0 (0.0%) |
| 20 to 34 years | 5 (100.0%) | 0 (0.0%) |
| 35 to 50 years | 0 (0.0%) | 0 (0.0%) |
| Total | 5 (100.0%) | 0 (0.0%) |
Fertility by Education in Southport
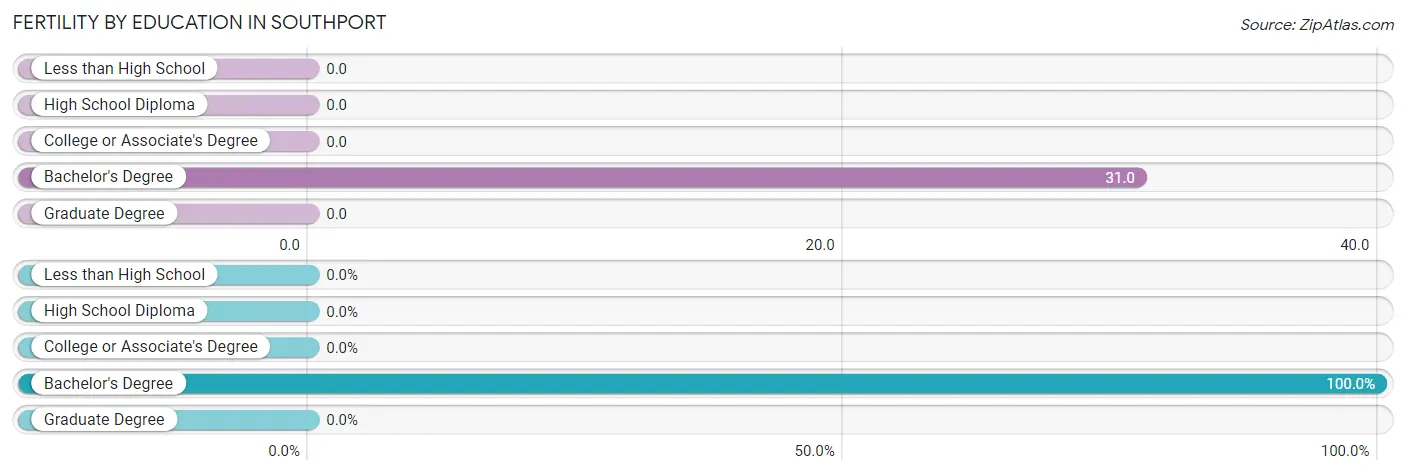
| Educational Attainment | Women with Births | Births / 1,000 Women |
| Less than High School | 0 (0.0%) | 0.0 |
| High School Diploma | 0 (0.0%) | 0.0 |
| College or Associate's Degree | 0 (0.0%) | 0.0 |
| Bachelor's Degree | 5 (100.0%) | 31.0 |
| Graduate Degree | 0 (0.0%) | 0.0 |
| Total | 5 (100.0%) | 19.0 |
Fertility by Education by Marriage Status in Southport
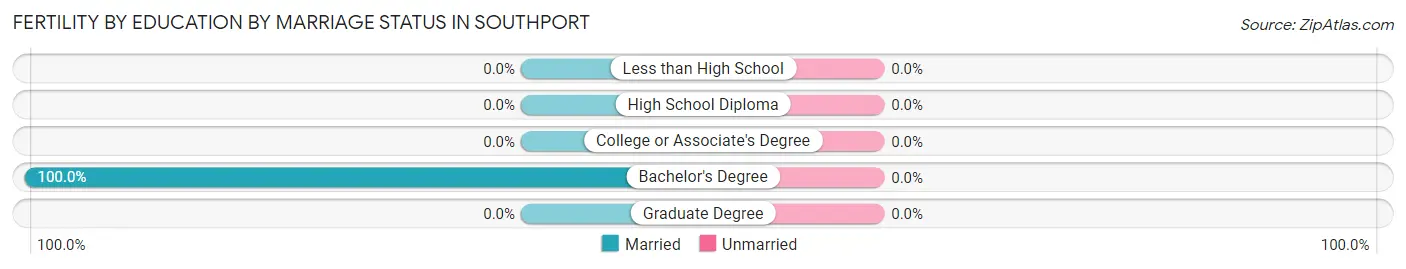
| Educational Attainment | Married | Unmarried |
| Less than High School | 0 (0.0%) | 0 (0.0%) |
| High School Diploma | 0 (0.0%) | 0 (0.0%) |
| College or Associate's Degree | 0 (0.0%) | 0 (0.0%) |
| Bachelor's Degree | 5 (100.0%) | 0 (0.0%) |
| Graduate Degree | 0 (0.0%) | 0 (0.0%) |
| Total | 5 (100.0%) | 0 (0.0%) |
Employment Characteristics in Southport
Employment by Class of Employer in Southport
Among the 815 employed individuals in Southport, private company employees (429 | 52.6%), self-employed (not incorporated) (204 | 25.0%), and local government employees (76 | 9.3%) make up the most common classes of employment.
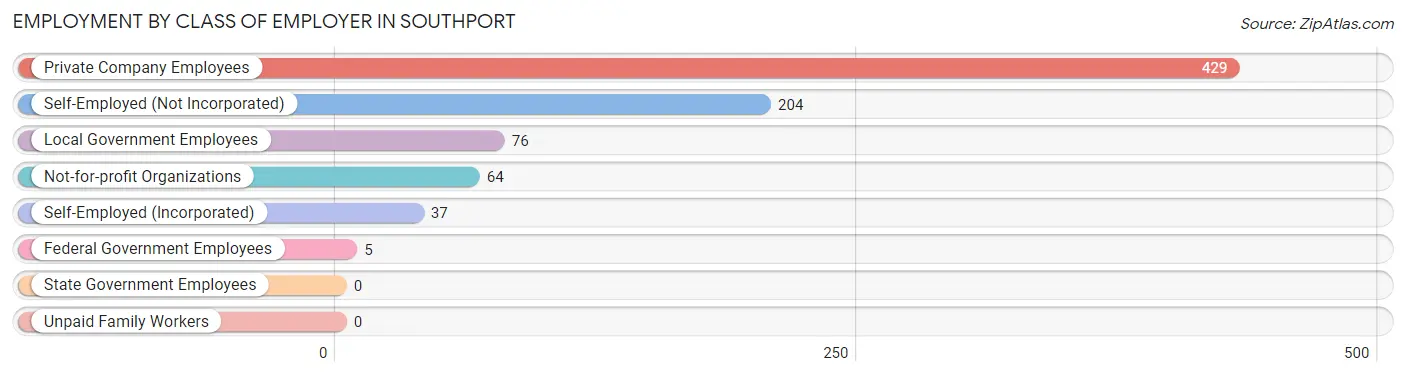
| Employer Class | # Employees | % Employees |
| Private Company Employees | 429 | 52.6% |
| Self-Employed (Incorporated) | 37 | 4.5% |
| Self-Employed (Not Incorporated) | 204 | 25.0% |
| Not-for-profit Organizations | 64 | 7.9% |
| Local Government Employees | 76 | 9.3% |
| State Government Employees | 0 | 0.0% |
| Federal Government Employees | 5 | 0.6% |
| Unpaid Family Workers | 0 | 0.0% |
| Total | 815 | 100.0% |
Employment Status by Age in Southport
According to the labor force statistics for Southport, out of the total population over 16 years of age (1,292), 67.5% or 872 individuals are in the labor force, with 5.3% or 46 of them unemployed. The age group with the highest labor force participation rate is 25 to 29 years, with 100.0% or 19 individuals in the labor force. Within the labor force, the 35 to 44 years age range has the highest percentage of unemployed individuals, with 21.7% or 36 of them being unemployed.
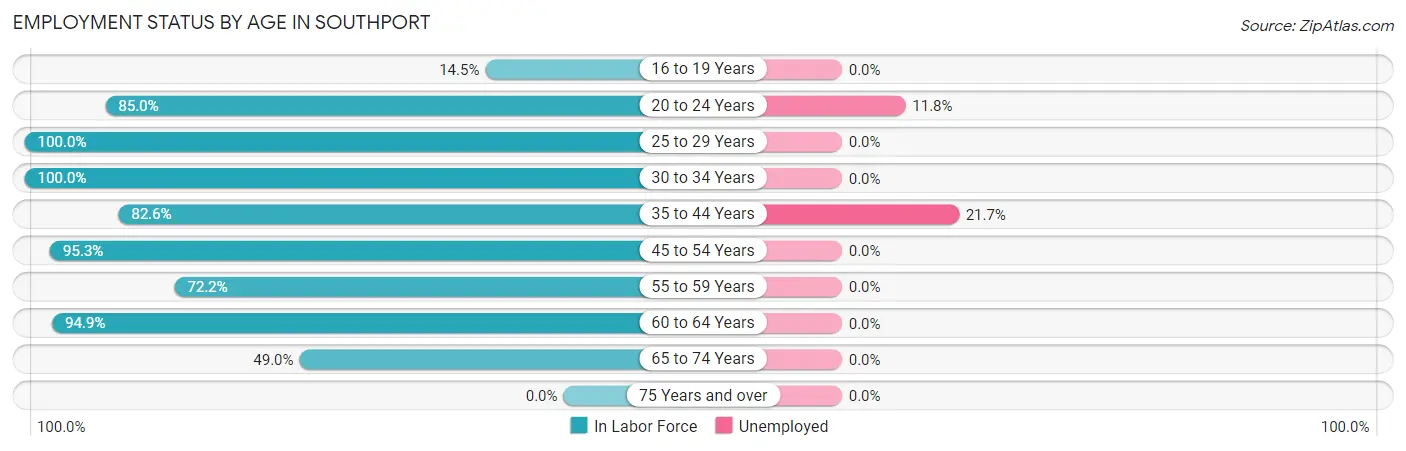
| Age Bracket | In Labor Force | Unemployed |
| 16 to 19 Years | 11 (14.5%) | 0 (0.0%) |
| 20 to 24 Years | 85 (85.0%) | 10 (11.8%) |
| 25 to 29 Years | 19 (100.0%) | 0 (0.0%) |
| 30 to 34 Years | 39 (100.0%) | 0 (0.0%) |
| 35 to 44 Years | 166 (82.6%) | 36 (21.7%) |
| 45 to 54 Years | 81 (95.3%) | 0 (0.0%) |
| 55 to 59 Years | 148 (72.2%) | 0 (0.0%) |
| 60 to 64 Years | 224 (94.9%) | 0 (0.0%) |
| 65 to 74 Years | 99 (49.0%) | 0 (0.0%) |
| 75 Years and over | 0 (0.0%) | 0 (0.0%) |
| Total | 872 (67.5%) | 46 (5.3%) |
Employment Status by Educational Attainment in Southport
According to labor force statistics for Southport, 86.2% of individuals (677) out of the total population between 25 and 64 years of age (785) are in the labor force, with 5.3% or 36 of them being unemployed. The group with the highest labor force participation rate are those with the educational attainment of less than high school, with 100.0% or 23 individuals in the labor force. Within the labor force, individuals with bachelor's degree or higher education have the highest percentage of unemployment, with 6.4% or 36 of them being unemployed.
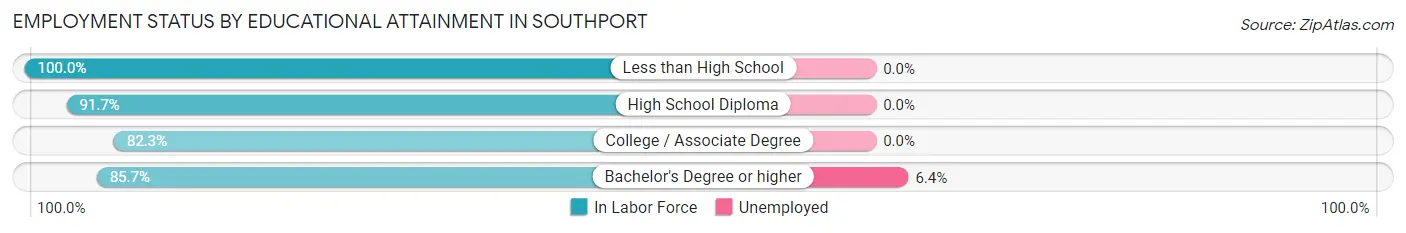
| Educational Attainment | In Labor Force | Unemployed |
| Less than High School | 23 (100.0%) | 0 (0.0%) |
| High School Diploma | 44 (91.7%) | 0 (0.0%) |
| College / Associate Degree | 51 (82.3%) | 0 (0.0%) |
| Bachelor's Degree or higher | 559 (85.7%) | 42 (6.4%) |
| Total | 677 (86.2%) | 42 (5.3%) |
Employment Occupations by Sex in Southport
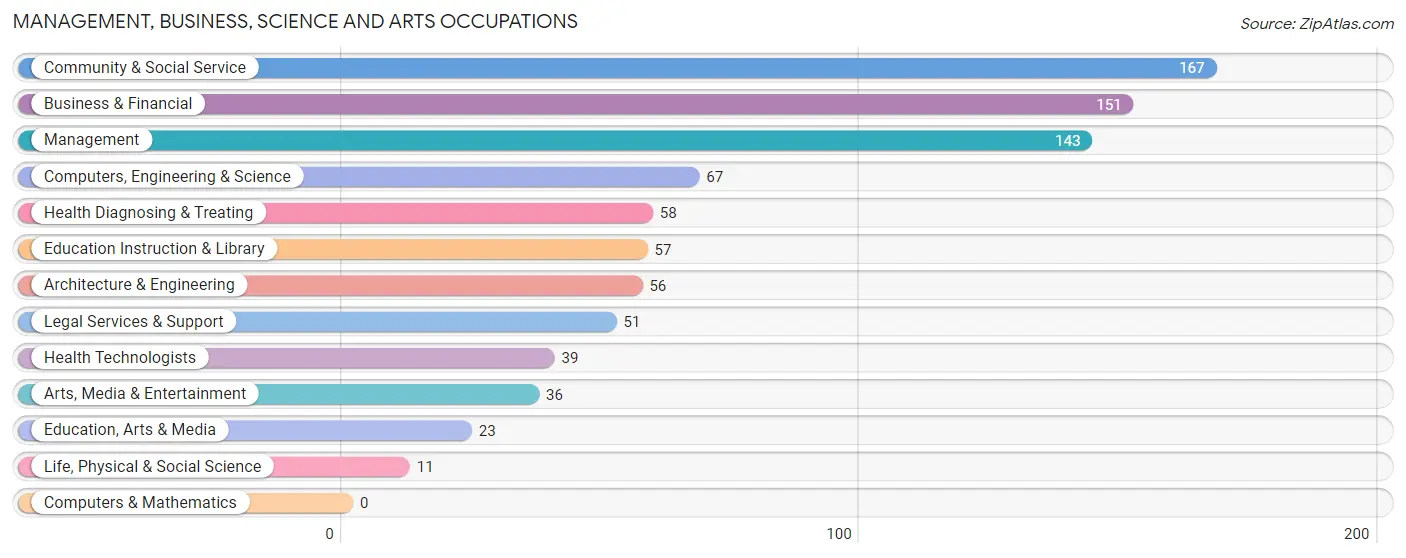
Management, Business, Science and Arts Occupations
The most common Management, Business, Science and Arts occupations in Southport are Community & Social Service (167 | 20.2%), Business & Financial (151 | 18.3%), Management (143 | 17.3%), Computers, Engineering & Science (67 | 8.1%), and Health Diagnosing & Treating (58 | 7.0%).
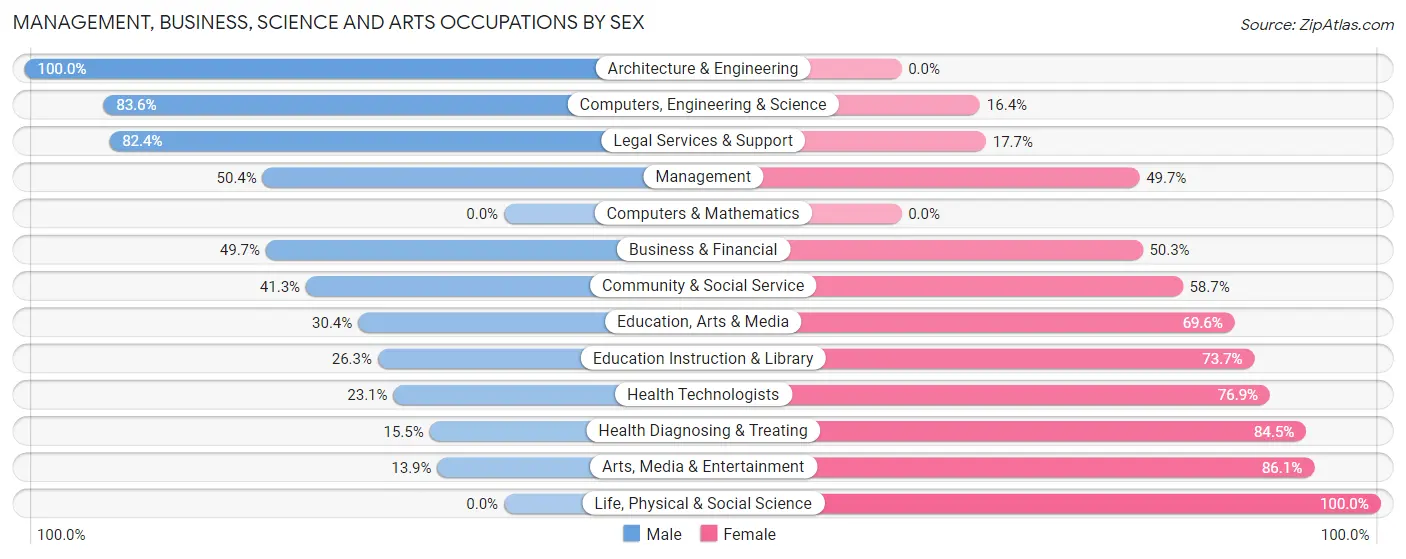
Management, Business, Science and Arts Occupations by Sex
Within the Management, Business, Science and Arts occupations in Southport, the most male-oriented occupations are Architecture & Engineering (100.0%), Computers, Engineering & Science (83.6%), and Legal Services & Support (82.4%), while the most female-oriented occupations are Life, Physical & Social Science (100.0%), Arts, Media & Entertainment (86.1%), and Health Diagnosing & Treating (84.5%).
| Occupation | Male | Female |
| Management | 72 (50.3%) | 71 (49.6%) |
| Business & Financial | 75 (49.7%) | 76 (50.3%) |
| Computers, Engineering & Science | 56 (83.6%) | 11 (16.4%) |
| Computers & Mathematics | 0 (0.0%) | 0 (0.0%) |
| Architecture & Engineering | 56 (100.0%) | 0 (0.0%) |
| Life, Physical & Social Science | 0 (0.0%) | 11 (100.0%) |
| Community & Social Service | 69 (41.3%) | 98 (58.7%) |
| Education, Arts & Media | 7 (30.4%) | 16 (69.6%) |
| Legal Services & Support | 42 (82.4%) | 9 (17.6%) |
| Education Instruction & Library | 15 (26.3%) | 42 (73.7%) |
| Arts, Media & Entertainment | 5 (13.9%) | 31 (86.1%) |
| Health Diagnosing & Treating | 9 (15.5%) | 49 (84.5%) |
| Health Technologists | 9 (23.1%) | 30 (76.9%) |
| Total (Category) | 281 (47.9%) | 305 (52.0%) |
| Total (Overall) | 433 (52.4%) | 393 (47.6%) |
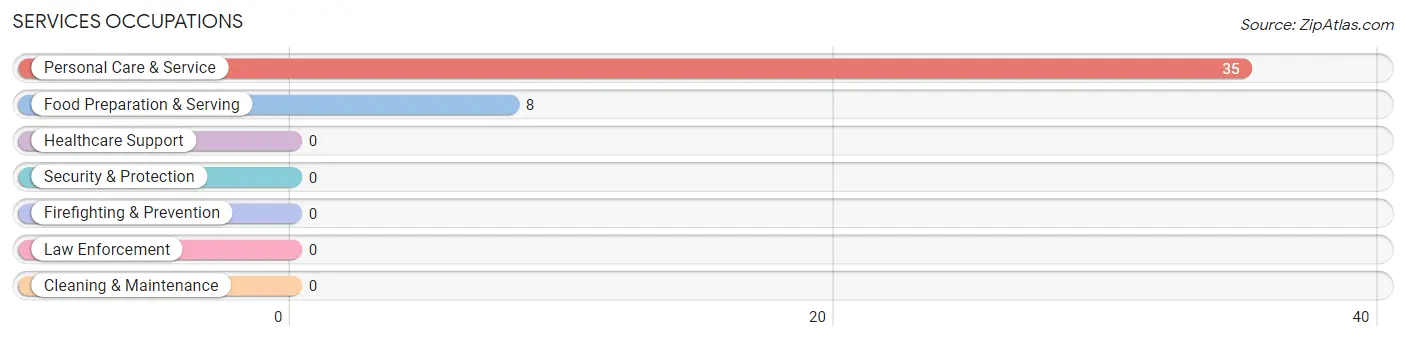
Services Occupations
The most common Services occupations in Southport are Personal Care & Service (35 | 4.2%), and Food Preparation & Serving (8 | 1.0%).
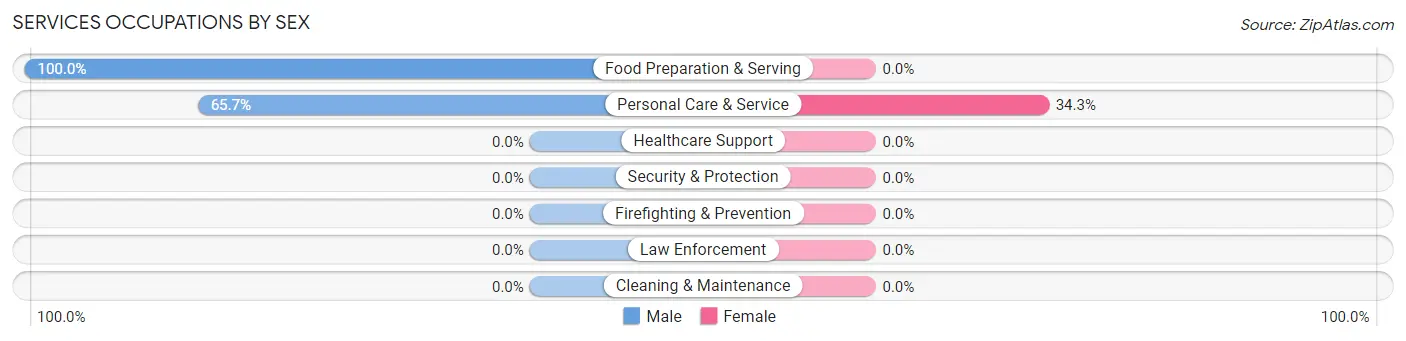
Services Occupations by Sex
| Occupation | Male | Female |
| Healthcare Support | 0 (0.0%) | 0 (0.0%) |
| Security & Protection | 0 (0.0%) | 0 (0.0%) |
| Firefighting & Prevention | 0 (0.0%) | 0 (0.0%) |
| Law Enforcement | 0 (0.0%) | 0 (0.0%) |
| Food Preparation & Serving | 8 (100.0%) | 0 (0.0%) |
| Cleaning & Maintenance | 0 (0.0%) | 0 (0.0%) |
| Personal Care & Service | 23 (65.7%) | 12 (34.3%) |
| Total (Category) | 31 (72.1%) | 12 (27.9%) |
| Total (Overall) | 433 (52.4%) | 393 (47.6%) |
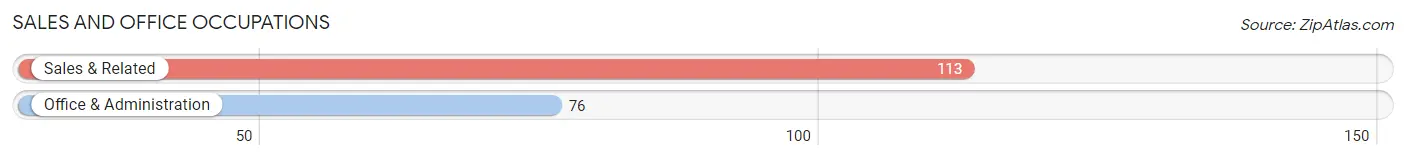
Sales and Office Occupations
The most common Sales and Office occupations in Southport are Sales & Related (113 | 13.7%), and Office & Administration (76 | 9.2%).
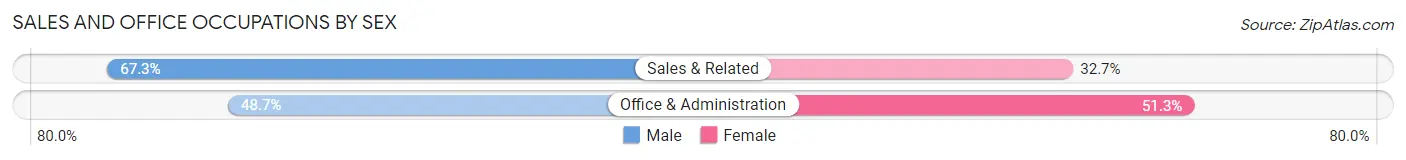
Sales and Office Occupations by Sex
| Occupation | Male | Female |
| Sales & Related | 76 (67.3%) | 37 (32.7%) |
| Office & Administration | 37 (48.7%) | 39 (51.3%) |
| Total (Category) | 113 (59.8%) | 76 (40.2%) |
| Total (Overall) | 433 (52.4%) | 393 (47.6%) |
Natural Resources, Construction and Maintenance Occupations
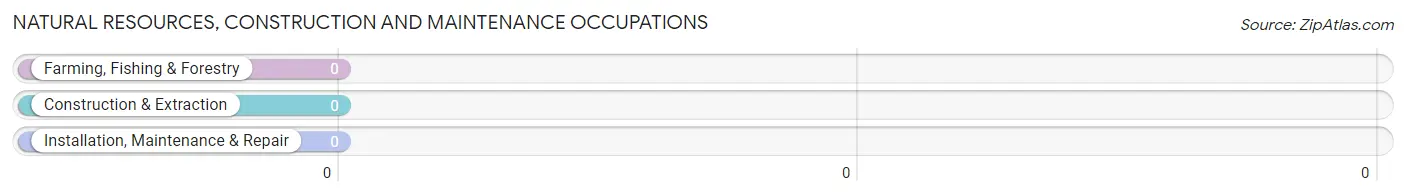
Natural Resources, Construction and Maintenance Occupations by Sex
| Occupation | Male | Female |
| Farming, Fishing & Forestry | 0 (0.0%) | 0 (0.0%) |
| Construction & Extraction | 0 (0.0%) | 0 (0.0%) |
| Installation, Maintenance & Repair | 0 (0.0%) | 0 (0.0%) |
| Total (Category) | 0 (0.0%) | 0 (0.0%) |
| Total (Overall) | 433 (52.4%) | 393 (47.6%) |
Production, Transportation and Moving Occupations
The most common Production, Transportation and Moving occupations in Southport are , and Production (8 | 1.0%).
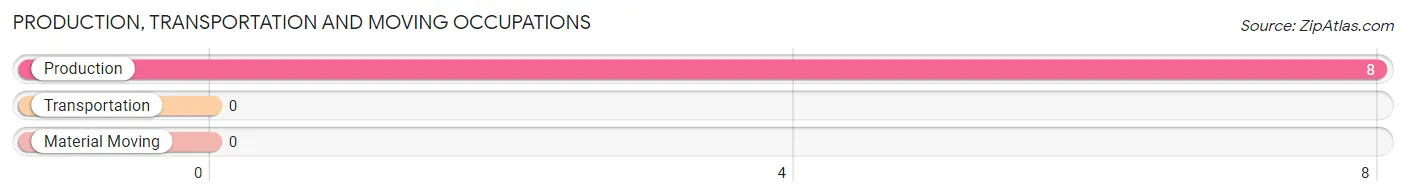
Production, Transportation and Moving Occupations by Sex
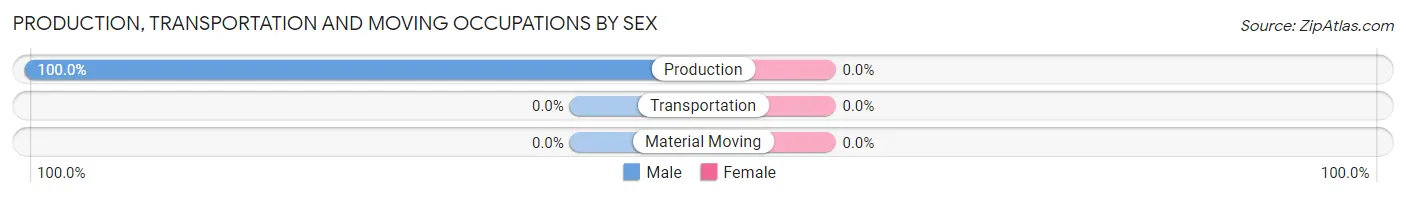
| Occupation | Male | Female |
| Production | 8 (100.0%) | 0 (0.0%) |
| Transportation | 0 (0.0%) | 0 (0.0%) |
| Material Moving | 0 (0.0%) | 0 (0.0%) |
| Total (Category) | 8 (100.0%) | 0 (0.0%) |
| Total (Overall) | 433 (52.4%) | 393 (47.6%) |
Employment Industries by Sex in Southport
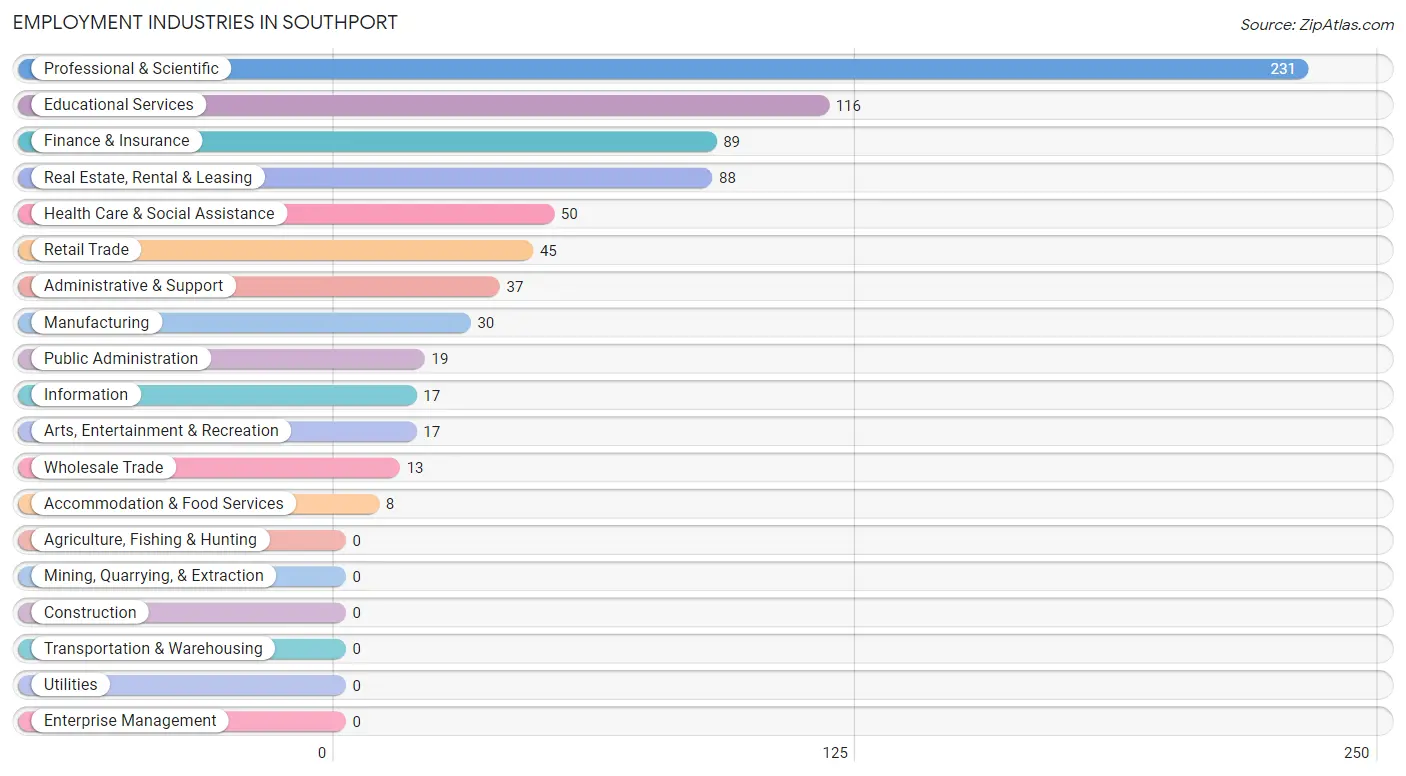
Employment Industries in Southport
The major employment industries in Southport include Professional & Scientific (231 | 28.0%), Educational Services (116 | 14.0%), Finance & Insurance (89 | 10.8%), Real Estate, Rental & Leasing (88 | 10.6%), and Health Care & Social Assistance (50 | 6.0%).
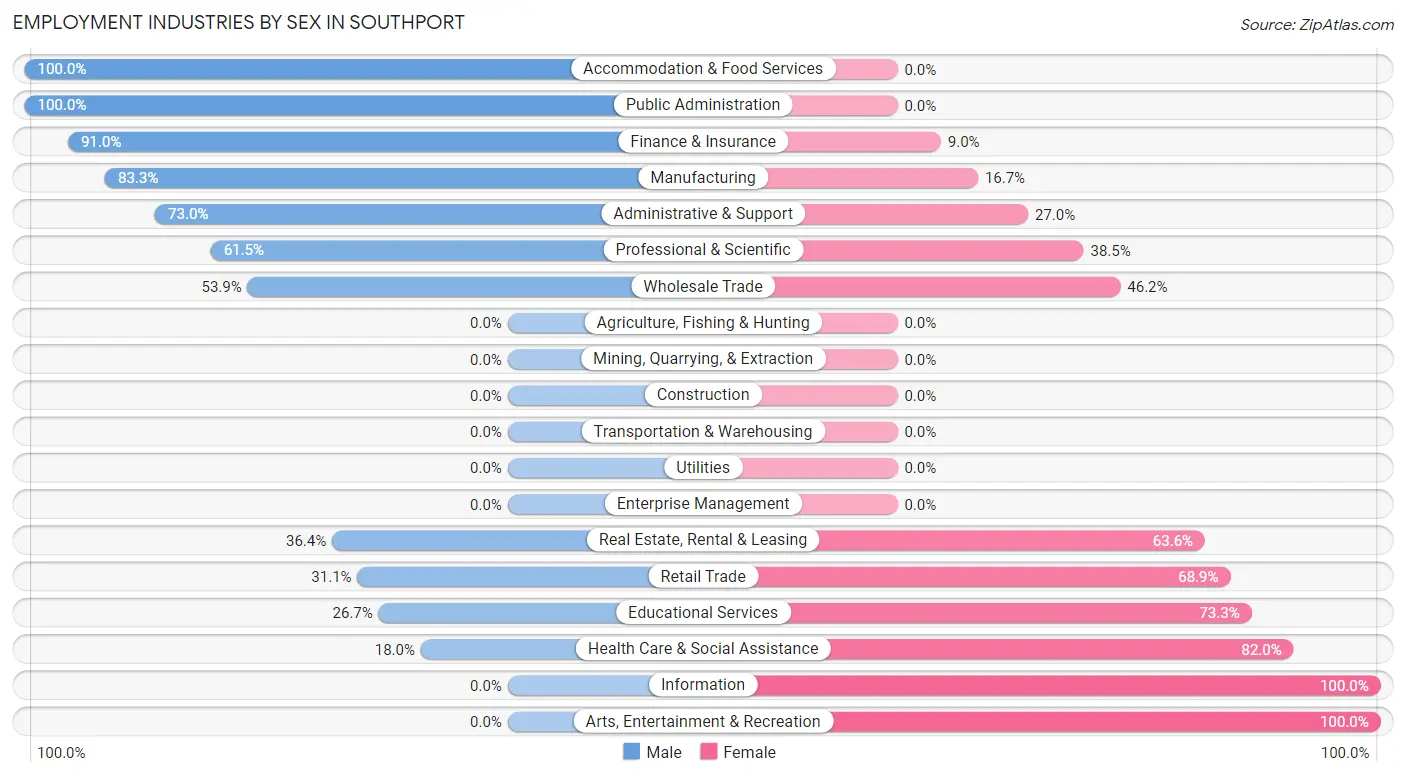
Employment Industries by Sex in Southport
The Southport industries that see more men than women are Accommodation & Food Services (100.0%), Public Administration (100.0%), and Finance & Insurance (91.0%), whereas the industries that tend to have a higher number of women are Information (100.0%), Arts, Entertainment & Recreation (100.0%), and Health Care & Social Assistance (82.0%).
| Industry | Male | Female |
| Agriculture, Fishing & Hunting | 0 (0.0%) | 0 (0.0%) |
| Mining, Quarrying, & Extraction | 0 (0.0%) | 0 (0.0%) |
| Construction | 0 (0.0%) | 0 (0.0%) |
| Manufacturing | 25 (83.3%) | 5 (16.7%) |
| Wholesale Trade | 7 (53.8%) | 6 (46.2%) |
| Retail Trade | 14 (31.1%) | 31 (68.9%) |
| Transportation & Warehousing | 0 (0.0%) | 0 (0.0%) |
| Utilities | 0 (0.0%) | 0 (0.0%) |
| Information | 0 (0.0%) | 17 (100.0%) |
| Finance & Insurance | 81 (91.0%) | 8 (9.0%) |
| Real Estate, Rental & Leasing | 32 (36.4%) | 56 (63.6%) |
| Professional & Scientific | 142 (61.5%) | 89 (38.5%) |
| Enterprise Management | 0 (0.0%) | 0 (0.0%) |
| Administrative & Support | 27 (73.0%) | 10 (27.0%) |
| Educational Services | 31 (26.7%) | 85 (73.3%) |
| Health Care & Social Assistance | 9 (18.0%) | 41 (82.0%) |
| Arts, Entertainment & Recreation | 0 (0.0%) | 17 (100.0%) |
| Accommodation & Food Services | 8 (100.0%) | 0 (0.0%) |
| Public Administration | 19 (100.0%) | 0 (0.0%) |
| Total | 433 (52.4%) | 393 (47.6%) |
Education in Southport
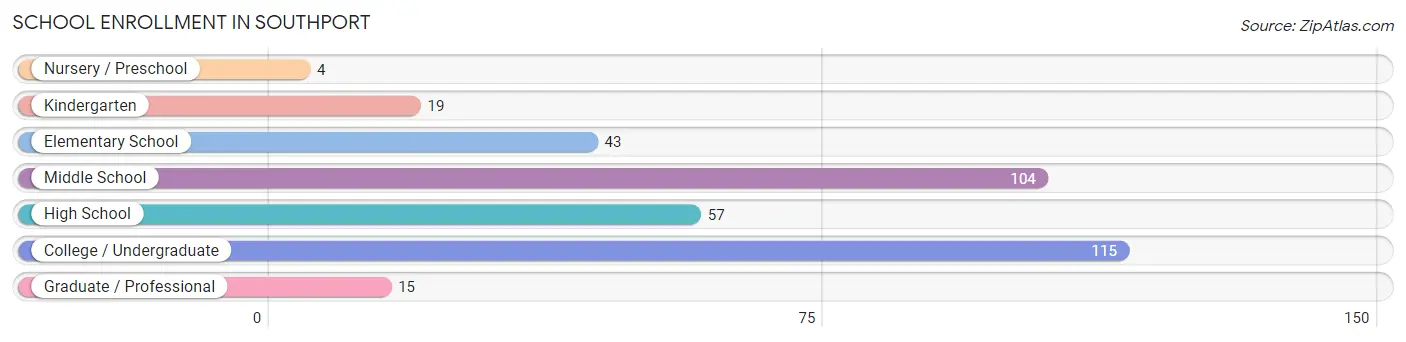
School Enrollment in Southport
The most common levels of schooling among the 357 students in Southport are college / undergraduate (115 | 32.2%), middle school (104 | 29.1%), and high school (57 | 16.0%).
| School Level | # Students | % Students |
| Nursery / Preschool | 4 | 1.1% |
| Kindergarten | 19 | 5.3% |
| Elementary School | 43 | 12.0% |
| Middle School | 104 | 29.1% |
| High School | 57 | 16.0% |
| College / Undergraduate | 115 | 32.2% |
| Graduate / Professional | 15 | 4.2% |
| Total | 357 | 100.0% |
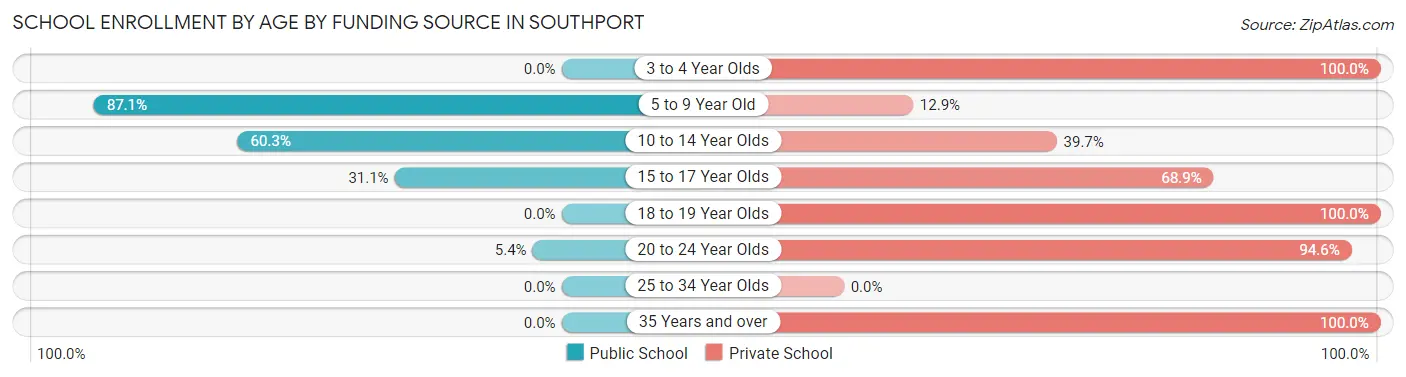
School Enrollment by Age by Funding Source in Southport
Out of a total of 357 students who are enrolled in schools in Southport, 215 (60.2%) attend a private institution, while the remaining 142 (39.8%) are enrolled in public schools. The age group of 3 to 4 year olds has the highest likelihood of being enrolled in private schools, with 4 (100.0% in the age bracket) enrolled. Conversely, the age group of 5 to 9 year old has the lowest likelihood of being enrolled in a private school, with 54 (87.1% in the age bracket) attending a public institution.
| Age Bracket | Public School | Private School |
| 3 to 4 Year Olds | 0 (0.0%) | 4 (100.0%) |
| 5 to 9 Year Old | 54 (87.1%) | 8 (12.9%) |
| 10 to 14 Year Olds | 70 (60.3%) | 46 (39.7%) |
| 15 to 17 Year Olds | 14 (31.1%) | 31 (68.9%) |
| 18 to 19 Year Olds | 0 (0.0%) | 45 (100.0%) |
| 20 to 24 Year Olds | 4 (5.4%) | 70 (94.6%) |
| 25 to 34 Year Olds | 0 (0.0%) | 0 (0.0%) |
| 35 Years and over | 0 (0.0%) | 11 (100.0%) |
| Total | 142 (39.8%) | 215 (60.2%) |
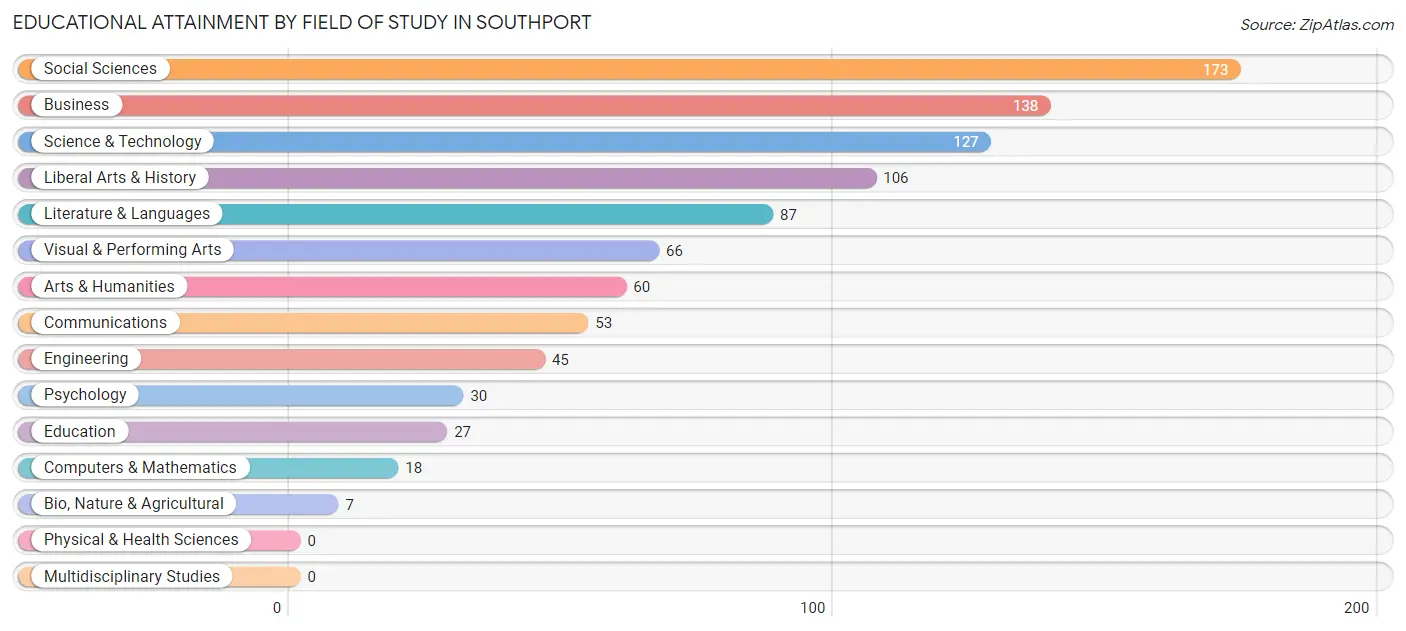
Educational Attainment by Field of Study in Southport
Social sciences (173 | 18.5%), business (138 | 14.7%), science & technology (127 | 13.6%), liberal arts & history (106 | 11.3%), and literature & languages (87 | 9.3%) are the most common fields of study among 937 individuals in Southport who have obtained a bachelor's degree or higher.
| Field of Study | # Graduates | % Graduates |
| Computers & Mathematics | 18 | 1.9% |
| Bio, Nature & Agricultural | 7 | 0.7% |
| Physical & Health Sciences | 0 | 0.0% |
| Psychology | 30 | 3.2% |
| Social Sciences | 173 | 18.5% |
| Engineering | 45 | 4.8% |
| Multidisciplinary Studies | 0 | 0.0% |
| Science & Technology | 127 | 13.6% |
| Business | 138 | 14.7% |
| Education | 27 | 2.9% |
| Literature & Languages | 87 | 9.3% |
| Liberal Arts & History | 106 | 11.3% |
| Visual & Performing Arts | 66 | 7.0% |
| Communications | 53 | 5.7% |
| Arts & Humanities | 60 | 6.4% |
| Total | 937 | 100.0% |
Transportation & Commute in Southport
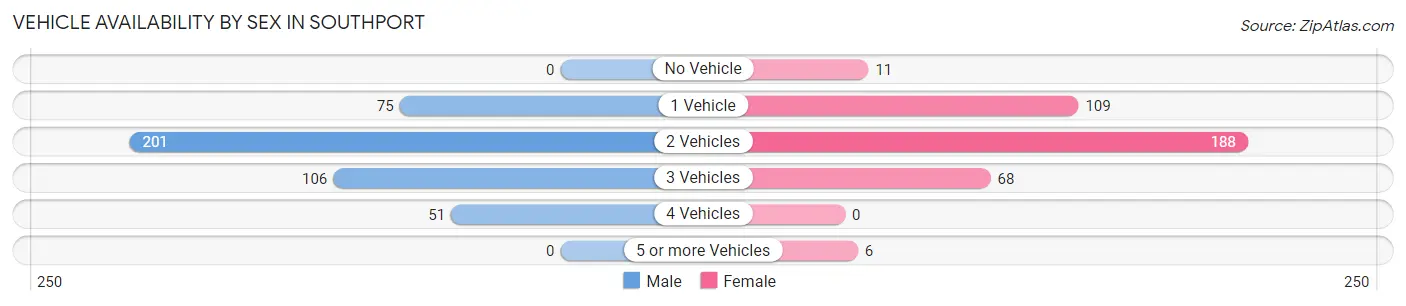
Vehicle Availability by Sex in Southport
The most prevalent vehicle ownership categories in Southport are males with 2 vehicles (201, accounting for 46.4%) and females with 2 vehicles (188, making up 52.6%).
| Vehicles Available | Male | Female |
| No Vehicle | 0 (0.0%) | 11 (2.9%) |
| 1 Vehicle | 75 (17.3%) | 109 (28.5%) |
| 2 Vehicles | 201 (46.4%) | 188 (49.2%) |
| 3 Vehicles | 106 (24.5%) | 68 (17.8%) |
| 4 Vehicles | 51 (11.8%) | 0 (0.0%) |
| 5 or more Vehicles | 0 (0.0%) | 6 (1.6%) |
| Total | 433 (100.0%) | 382 (100.0%) |
Commute Time in Southport
The most frequently occuring commute durations in Southport are 60 to 89 minutes (89 commuters, 17.0%), 90 or more minutes (78 commuters, 14.9%), and 45 to 59 minutes (70 commuters, 13.4%).
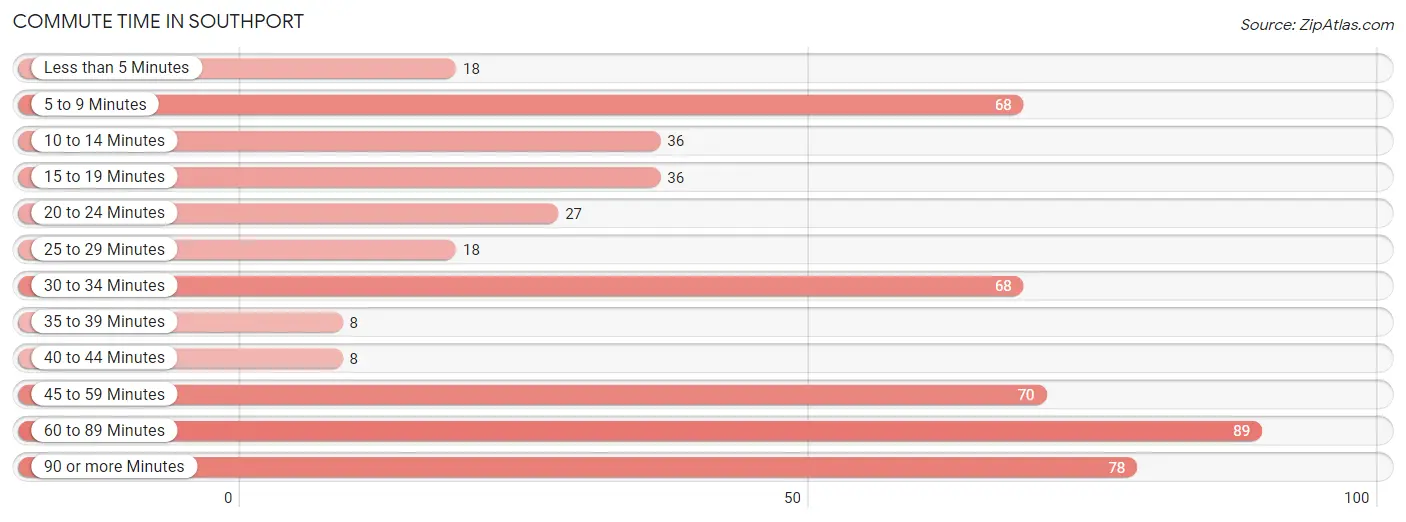
| Commute Time | # Commuters | % Commuters |
| Less than 5 Minutes | 18 | 3.4% |
| 5 to 9 Minutes | 68 | 13.0% |
| 10 to 14 Minutes | 36 | 6.9% |
| 15 to 19 Minutes | 36 | 6.9% |
| 20 to 24 Minutes | 27 | 5.1% |
| 25 to 29 Minutes | 18 | 3.4% |
| 30 to 34 Minutes | 68 | 13.0% |
| 35 to 39 Minutes | 8 | 1.5% |
| 40 to 44 Minutes | 8 | 1.5% |
| 45 to 59 Minutes | 70 | 13.4% |
| 60 to 89 Minutes | 89 | 17.0% |
| 90 or more Minutes | 78 | 14.9% |
Commute Time by Sex in Southport
The most common commute times in Southport are 60 to 89 minutes (74 commuters, 23.2%) for males and 5 to 9 minutes (47 commuters, 22.9%) for females.
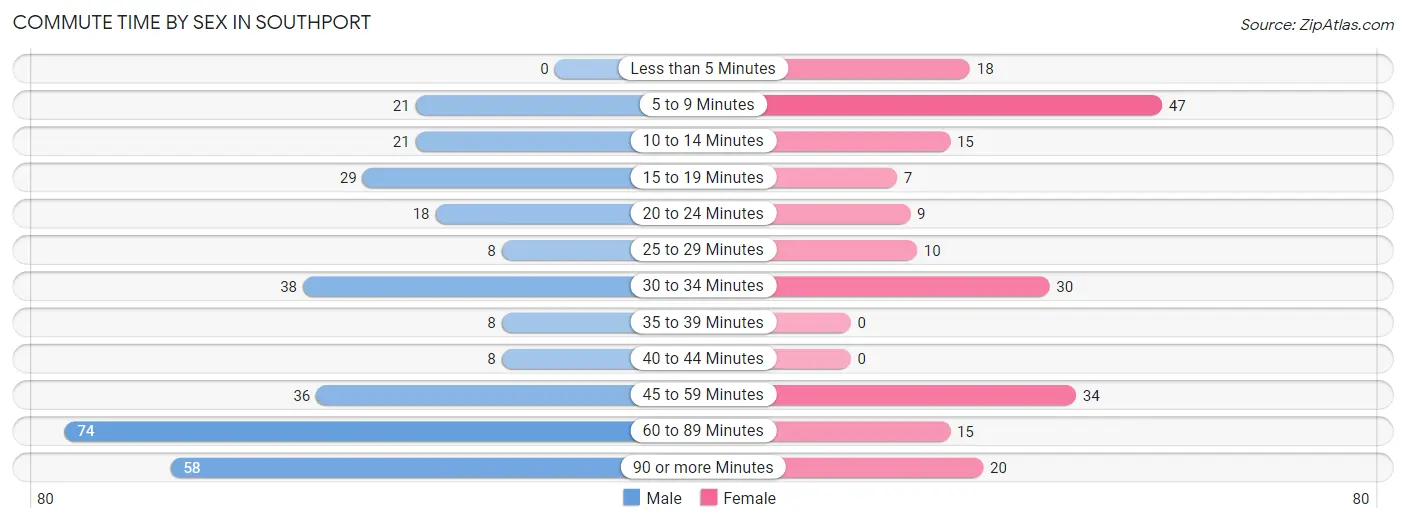
| Commute Time | Male | Female |
| Less than 5 Minutes | 0 (0.0%) | 18 (8.8%) |
| 5 to 9 Minutes | 21 (6.6%) | 47 (22.9%) |
| 10 to 14 Minutes | 21 (6.6%) | 15 (7.3%) |
| 15 to 19 Minutes | 29 (9.1%) | 7 (3.4%) |
| 20 to 24 Minutes | 18 (5.6%) | 9 (4.4%) |
| 25 to 29 Minutes | 8 (2.5%) | 10 (4.9%) |
| 30 to 34 Minutes | 38 (11.9%) | 30 (14.6%) |
| 35 to 39 Minutes | 8 (2.5%) | 0 (0.0%) |
| 40 to 44 Minutes | 8 (2.5%) | 0 (0.0%) |
| 45 to 59 Minutes | 36 (11.3%) | 34 (16.6%) |
| 60 to 89 Minutes | 74 (23.2%) | 15 (7.3%) |
| 90 or more Minutes | 58 (18.2%) | 20 (9.8%) |
Time of Departure to Work by Sex in Southport
The most frequent times of departure to work in Southport are 7:00 AM to 7:29 AM (71, 22.3%) for males and 6:30 AM to 6:59 AM (69, 33.7%) for females.
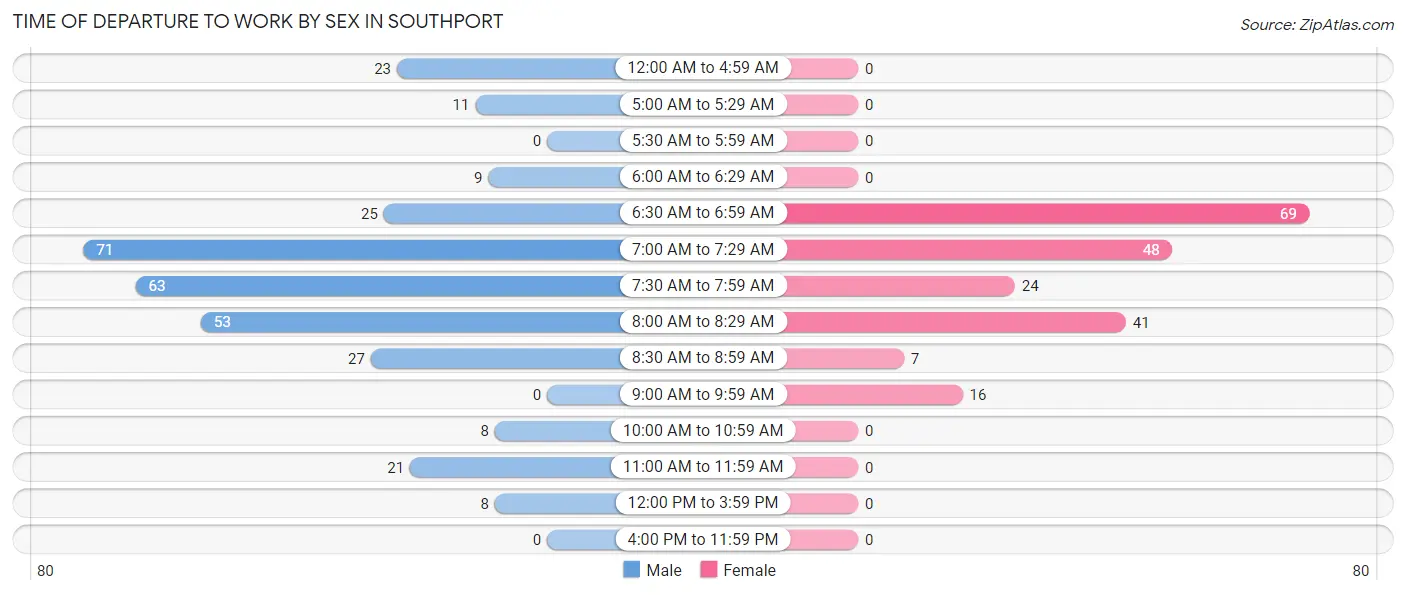
| Time of Departure | Male | Female |
| 12:00 AM to 4:59 AM | 23 (7.2%) | 0 (0.0%) |
| 5:00 AM to 5:29 AM | 11 (3.5%) | 0 (0.0%) |
| 5:30 AM to 5:59 AM | 0 (0.0%) | 0 (0.0%) |
| 6:00 AM to 6:29 AM | 9 (2.8%) | 0 (0.0%) |
| 6:30 AM to 6:59 AM | 25 (7.8%) | 69 (33.7%) |
| 7:00 AM to 7:29 AM | 71 (22.3%) | 48 (23.4%) |
| 7:30 AM to 7:59 AM | 63 (19.8%) | 24 (11.7%) |
| 8:00 AM to 8:29 AM | 53 (16.6%) | 41 (20.0%) |
| 8:30 AM to 8:59 AM | 27 (8.5%) | 7 (3.4%) |
| 9:00 AM to 9:59 AM | 0 (0.0%) | 16 (7.8%) |
| 10:00 AM to 10:59 AM | 8 (2.5%) | 0 (0.0%) |
| 11:00 AM to 11:59 AM | 21 (6.6%) | 0 (0.0%) |
| 12:00 PM to 3:59 PM | 8 (2.5%) | 0 (0.0%) |
| 4:00 PM to 11:59 PM | 0 (0.0%) | 0 (0.0%) |
| Total | 319 (100.0%) | 205 (100.0%) |
Housing Occupancy in Southport
Occupancy by Ownership in Southport
Of the total 719 dwellings in Southport, owner-occupied units account for 602 (83.7%), while renter-occupied units make up 117 (16.3%).
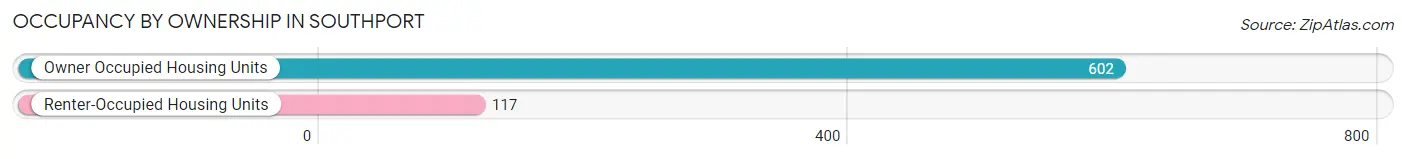
| Occupancy | # Housing Units | % Housing Units |
| Owner Occupied Housing Units | 602 | 83.7% |
| Renter-Occupied Housing Units | 117 | 16.3% |
| Total Occupied Housing Units | 719 | 100.0% |
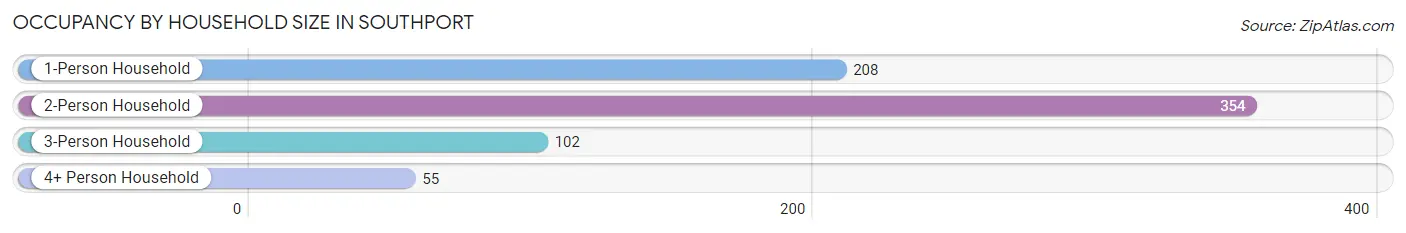
Occupancy by Household Size in Southport
| Household Size | # Housing Units | % Housing Units |
| 1-Person Household | 208 | 28.9% |
| 2-Person Household | 354 | 49.2% |
| 3-Person Household | 102 | 14.2% |
| 4+ Person Household | 55 | 7.6% |
| Total Housing Units | 719 | 100.0% |
Occupancy by Ownership by Household Size in Southport
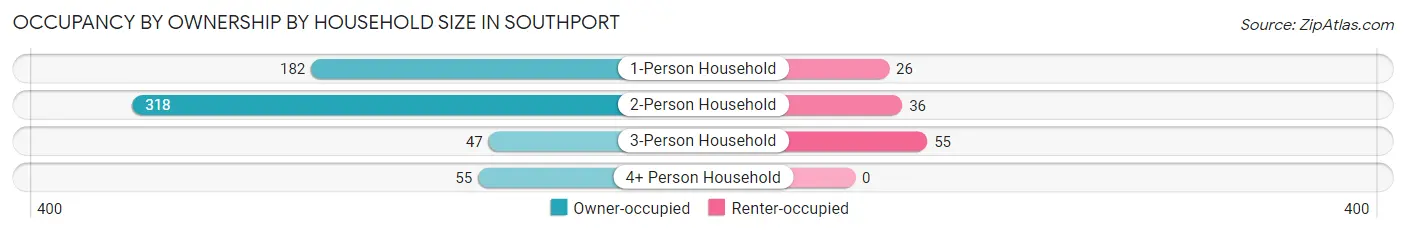
| Household Size | Owner-occupied | Renter-occupied |
| 1-Person Household | 182 (87.5%) | 26 (12.5%) |
| 2-Person Household | 318 (89.8%) | 36 (10.2%) |
| 3-Person Household | 47 (46.1%) | 55 (53.9%) |
| 4+ Person Household | 55 (100.0%) | 0 (0.0%) |
| Total Housing Units | 602 (83.7%) | 117 (16.3%) |
Occupancy by Educational Attainment in Southport
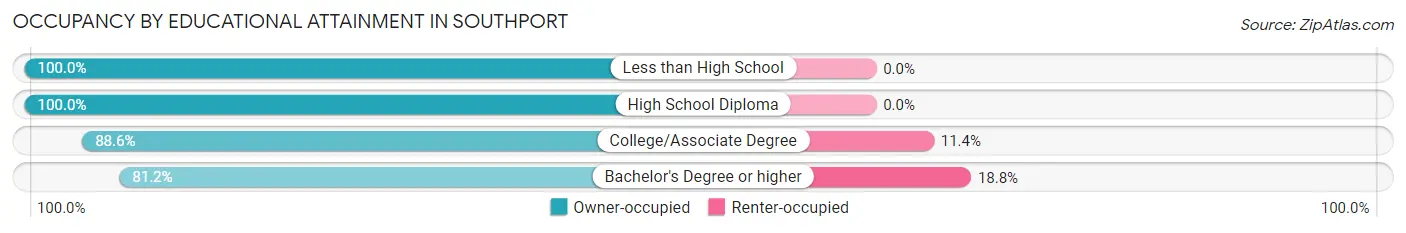
| Household Size | Owner-occupied | Renter-occupied |
| Less than High School | 23 (100.0%) | 0 (0.0%) |
| High School Diploma | 46 (100.0%) | 0 (0.0%) |
| College/Associate Degree | 62 (88.6%) | 8 (11.4%) |
| Bachelor's Degree or higher | 471 (81.2%) | 109 (18.8%) |
Occupancy by Age of Householder in Southport
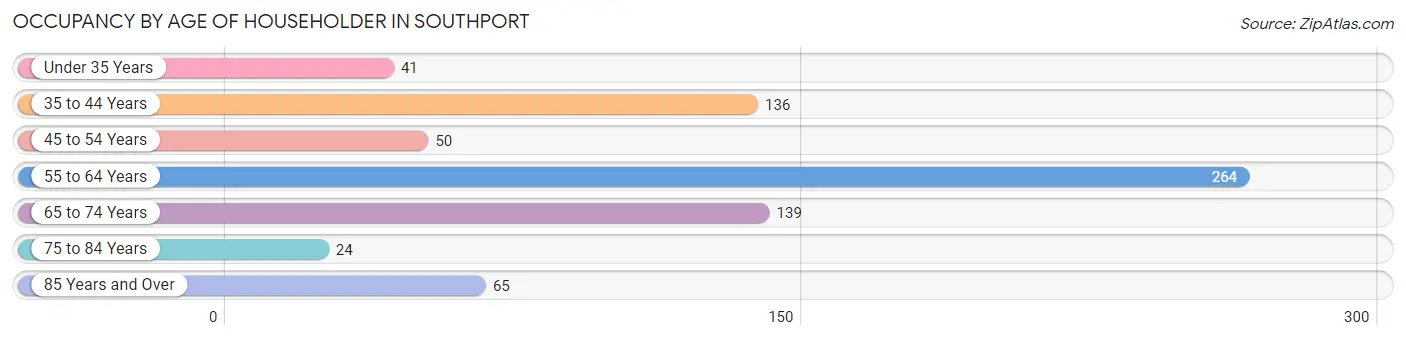
| Age Bracket | # Households | % Households |
| Under 35 Years | 41 | 5.7% |
| 35 to 44 Years | 136 | 18.9% |
| 45 to 54 Years | 50 | 7.0% |
| 55 to 64 Years | 264 | 36.7% |
| 65 to 74 Years | 139 | 19.3% |
| 75 to 84 Years | 24 | 3.3% |
| 85 Years and Over | 65 | 9.0% |
| Total | 719 | 100.0% |
Housing Finances in Southport
Median Income by Occupancy in Southport
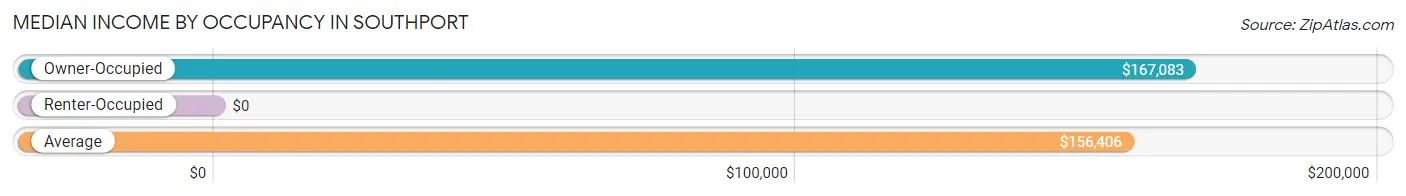
| Occupancy Type | # Households | Median Income |
| Owner-Occupied | 602 (83.7%) | $167,083 |
| Renter-Occupied | 117 (16.3%) | $0 |
| Average | 719 (100.0%) | $156,406 |
Occupancy by Householder Income Bracket in Southport
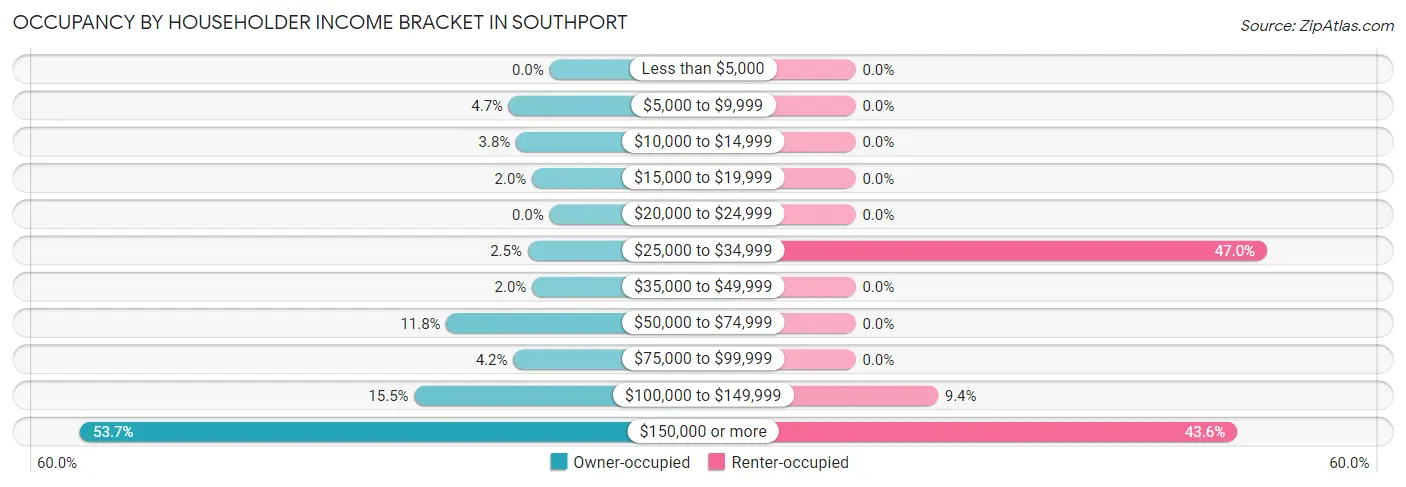
| Income Bracket | Owner-occupied | Renter-occupied |
| Less than $5,000 | 0 (0.0%) | 0 (0.0%) |
| $5,000 to $9,999 | 28 (4.6%) | 0 (0.0%) |
| $10,000 to $14,999 | 23 (3.8%) | 0 (0.0%) |
| $15,000 to $19,999 | 12 (2.0%) | 0 (0.0%) |
| $20,000 to $24,999 | 0 (0.0%) | 0 (0.0%) |
| $25,000 to $34,999 | 15 (2.5%) | 55 (47.0%) |
| $35,000 to $49,999 | 12 (2.0%) | 0 (0.0%) |
| $50,000 to $74,999 | 71 (11.8%) | 0 (0.0%) |
| $75,000 to $99,999 | 25 (4.2%) | 0 (0.0%) |
| $100,000 to $149,999 | 93 (15.4%) | 11 (9.4%) |
| $150,000 or more | 323 (53.6%) | 51 (43.6%) |
| Total | 602 (100.0%) | 117 (100.0%) |
Monthly Housing Cost Tiers in Southport
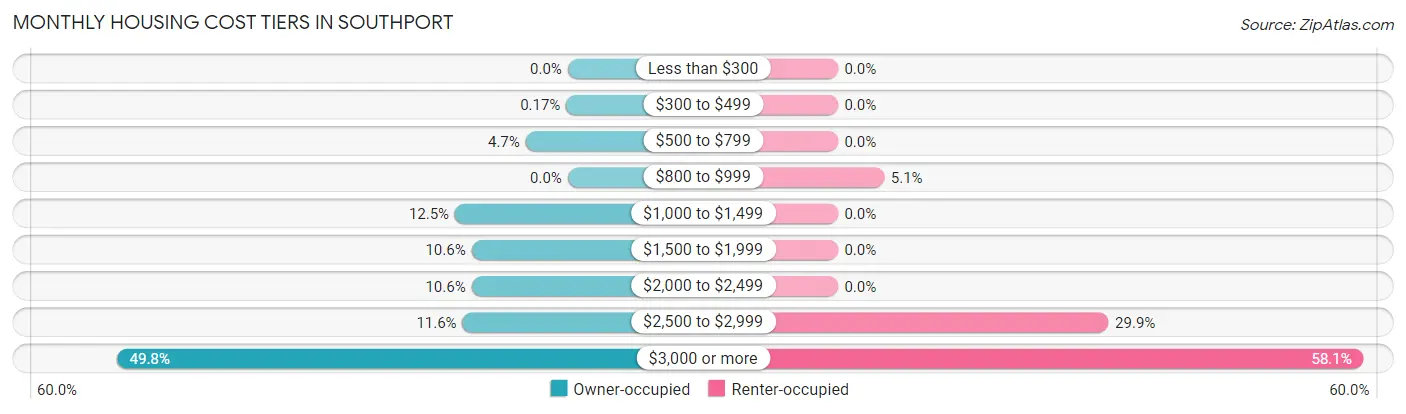
| Monthly Cost | Owner-occupied | Renter-occupied |
| Less than $300 | 0 (0.0%) | 0 (0.0%) |
| $300 to $499 | 1 (0.2%) | 0 (0.0%) |
| $500 to $799 | 28 (4.6%) | 0 (0.0%) |
| $800 to $999 | 0 (0.0%) | 6 (5.1%) |
| $1,000 to $1,499 | 75 (12.5%) | 0 (0.0%) |
| $1,500 to $1,999 | 64 (10.6%) | 0 (0.0%) |
| $2,000 to $2,499 | 64 (10.6%) | 0 (0.0%) |
| $2,500 to $2,999 | 70 (11.6%) | 35 (29.9%) |
| $3,000 or more | 300 (49.8%) | 68 (58.1%) |
| Total | 602 (100.0%) | 117 (100.0%) |
Physical Housing Characteristics in Southport
Housing Structures in Southport
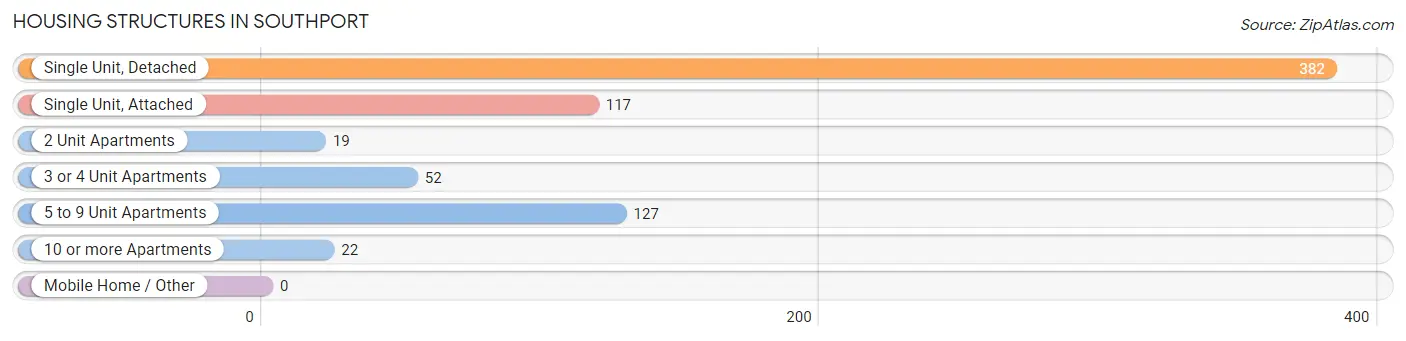
| Structure Type | # Housing Units | % Housing Units |
| Single Unit, Detached | 382 | 53.1% |
| Single Unit, Attached | 117 | 16.3% |
| 2 Unit Apartments | 19 | 2.6% |
| 3 or 4 Unit Apartments | 52 | 7.2% |
| 5 to 9 Unit Apartments | 127 | 17.7% |
| 10 or more Apartments | 22 | 3.1% |
| Mobile Home / Other | 0 | 0.0% |
| Total | 719 | 100.0% |
Housing Structures by Occupancy in Southport
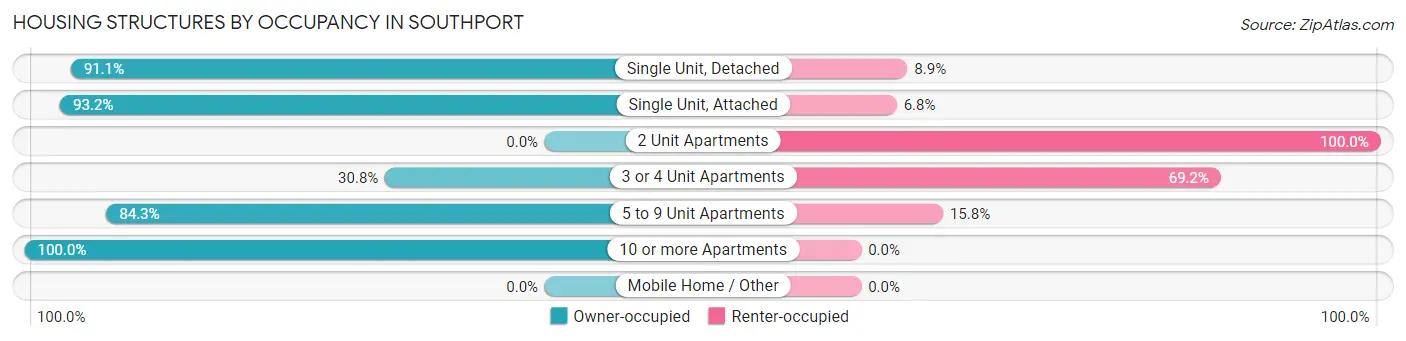
| Structure Type | Owner-occupied | Renter-occupied |
| Single Unit, Detached | 348 (91.1%) | 34 (8.9%) |
| Single Unit, Attached | 109 (93.2%) | 8 (6.8%) |
| 2 Unit Apartments | 0 (0.0%) | 19 (100.0%) |
| 3 or 4 Unit Apartments | 16 (30.8%) | 36 (69.2%) |
| 5 to 9 Unit Apartments | 107 (84.3%) | 20 (15.8%) |
| 10 or more Apartments | 22 (100.0%) | 0 (0.0%) |
| Mobile Home / Other | 0 (0.0%) | 0 (0.0%) |
| Total | 602 (83.7%) | 117 (16.3%) |
Housing Structures by Number of Rooms in Southport
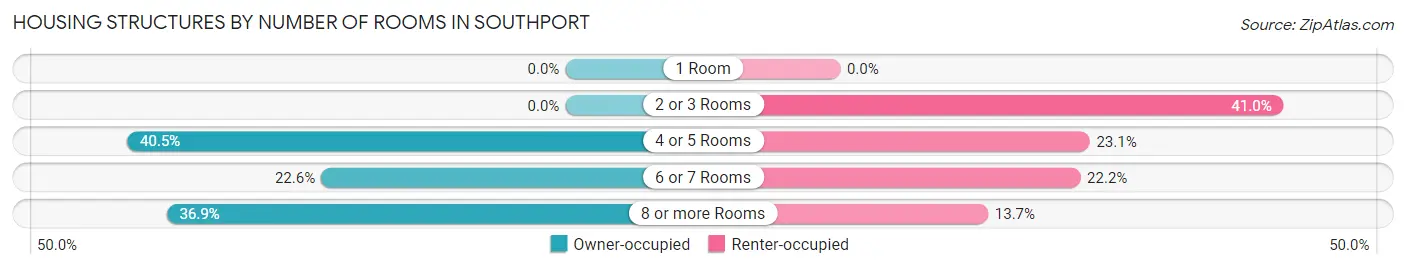
| Number of Rooms | Owner-occupied | Renter-occupied |
| 1 Room | 0 (0.0%) | 0 (0.0%) |
| 2 or 3 Rooms | 0 (0.0%) | 48 (41.0%) |
| 4 or 5 Rooms | 244 (40.5%) | 27 (23.1%) |
| 6 or 7 Rooms | 136 (22.6%) | 26 (22.2%) |
| 8 or more Rooms | 222 (36.9%) | 16 (13.7%) |
| Total | 602 (100.0%) | 117 (100.0%) |
Housing Structure by Heating Type in Southport
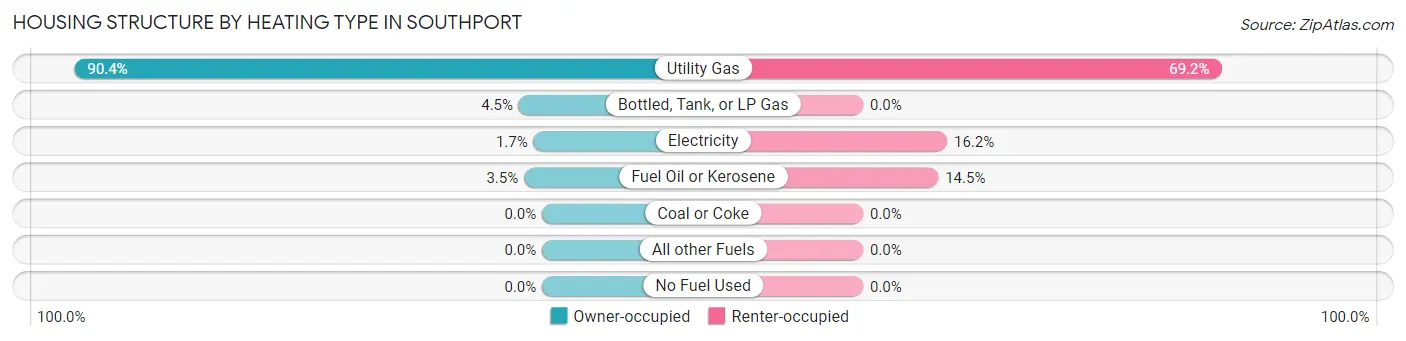
| Heating Type | Owner-occupied | Renter-occupied |
| Utility Gas | 544 (90.4%) | 81 (69.2%) |
| Bottled, Tank, or LP Gas | 27 (4.5%) | 0 (0.0%) |
| Electricity | 10 (1.7%) | 19 (16.2%) |
| Fuel Oil or Kerosene | 21 (3.5%) | 17 (14.5%) |
| Coal or Coke | 0 (0.0%) | 0 (0.0%) |
| All other Fuels | 0 (0.0%) | 0 (0.0%) |
| No Fuel Used | 0 (0.0%) | 0 (0.0%) |
| Total | 602 (100.0%) | 117 (100.0%) |
Household Vehicle Usage in Southport
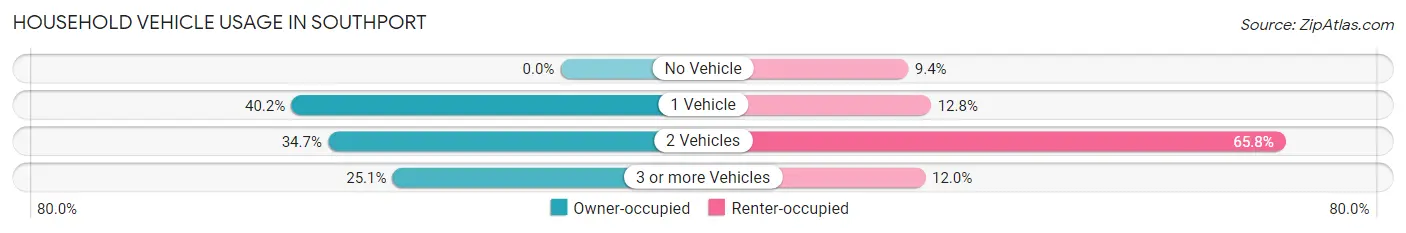
| Vehicles per Household | Owner-occupied | Renter-occupied |
| No Vehicle | 0 (0.0%) | 11 (9.4%) |
| 1 Vehicle | 242 (40.2%) | 15 (12.8%) |
| 2 Vehicles | 209 (34.7%) | 77 (65.8%) |
| 3 or more Vehicles | 151 (25.1%) | 14 (12.0%) |
| Total | 602 (100.0%) | 117 (100.0%) |
Real Estate & Mortgages in Southport
Real Estate and Mortgage Overview in Southport
| Characteristic | Without Mortgage | With Mortgage |
| Housing Units | 264 | 338 |
| Median Property Value | $578,100 | $1,037,900 |
| Median Household Income | $72,803 | $279 |
| Monthly Housing Costs | $1,501 | $256 |
| Real Estate Taxes | $10,001 | $0 |
Property Value by Mortgage Status in Southport
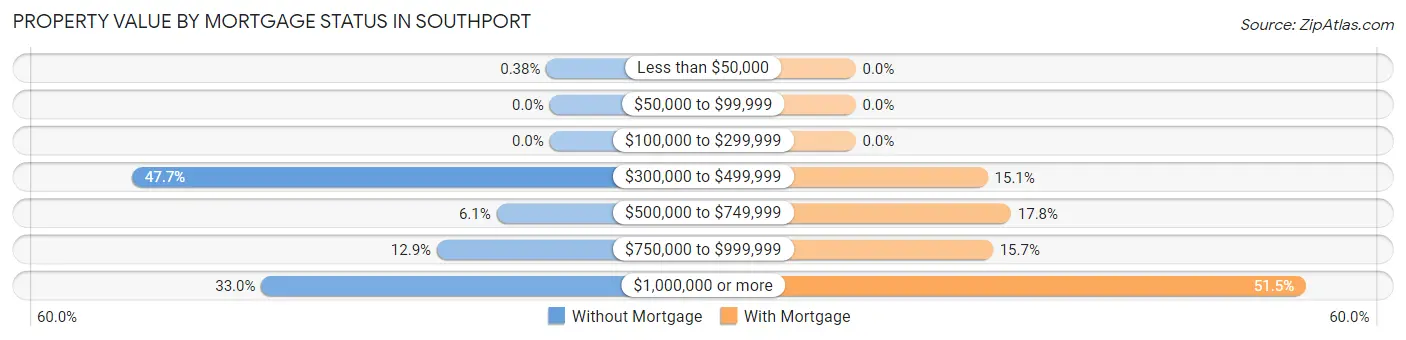
| Property Value | Without Mortgage | With Mortgage |
| Less than $50,000 | 1 (0.4%) | 0 (0.0%) |
| $50,000 to $99,999 | 0 (0.0%) | 0 (0.0%) |
| $100,000 to $299,999 | 0 (0.0%) | 0 (0.0%) |
| $300,000 to $499,999 | 126 (47.7%) | 51 (15.1%) |
| $500,000 to $749,999 | 16 (6.1%) | 60 (17.7%) |
| $750,000 to $999,999 | 34 (12.9%) | 53 (15.7%) |
| $1,000,000 or more | 87 (33.0%) | 174 (51.5%) |
| Total | 264 (100.0%) | 338 (100.0%) |
Household Income by Mortgage Status in Southport
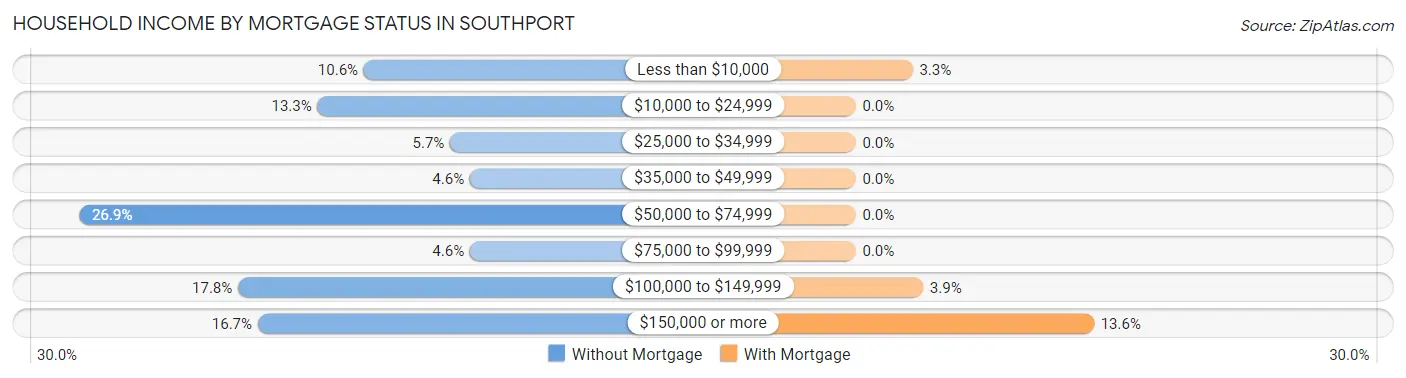
| Household Income | Without Mortgage | With Mortgage |
| Less than $10,000 | 28 (10.6%) | 11 (3.3%) |
| $10,000 to $24,999 | 35 (13.3%) | 0 (0.0%) |
| $25,000 to $34,999 | 15 (5.7%) | 0 (0.0%) |
| $35,000 to $49,999 | 12 (4.5%) | 0 (0.0%) |
| $50,000 to $74,999 | 71 (26.9%) | 0 (0.0%) |
| $75,000 to $99,999 | 12 (4.5%) | 0 (0.0%) |
| $100,000 to $149,999 | 47 (17.8%) | 13 (3.8%) |
| $150,000 or more | 44 (16.7%) | 46 (13.6%) |
| Total | 264 (100.0%) | 338 (100.0%) |
Property Value to Household Income Ratio in Southport
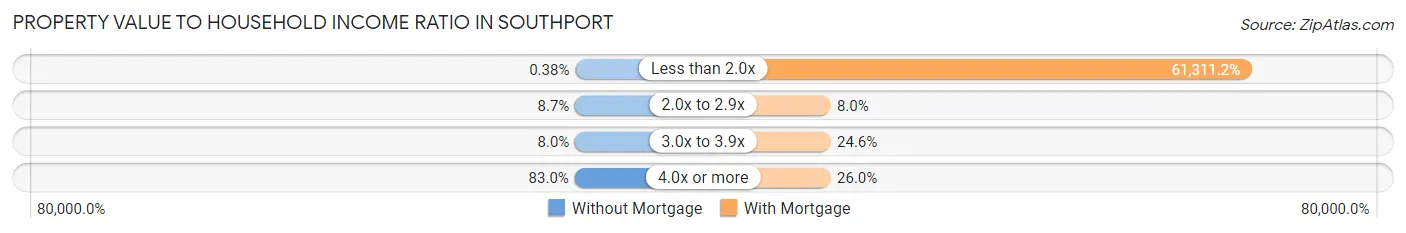
| Value-to-Income Ratio | Without Mortgage | With Mortgage |
| Less than 2.0x | 1 (0.4%) | 207,232 (61,311.2%) |
| 2.0x to 2.9x | 23 (8.7%) | 27 (8.0%) |
| 3.0x to 3.9x | 21 (8.0%) | 83 (24.6%) |
| 4.0x or more | 219 (83.0%) | 88 (26.0%) |
| Total | 264 (100.0%) | 338 (100.0%) |
Real Estate Taxes by Mortgage Status in Southport
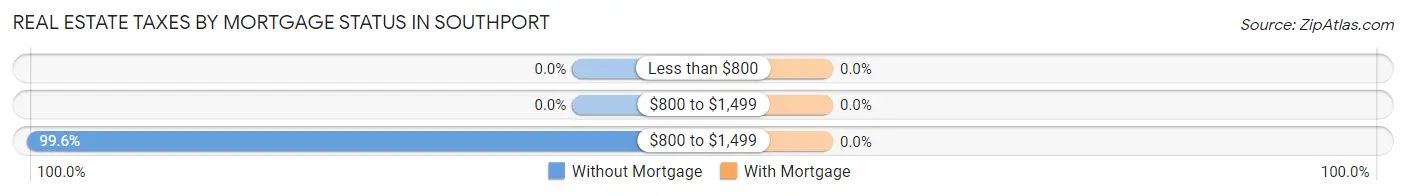
| Property Taxes | Without Mortgage | With Mortgage |
| Less than $800 | 0 (0.0%) | 0 (0.0%) |
| $800 to $1,499 | 0 (0.0%) | 0 (0.0%) |
| $800 to $1,499 | 263 (99.6%) | 0 (0.0%) |
| Total | 264 (100.0%) | 338 (100.0%) |
Health & Disability in Southport
Health Insurance Coverage by Age in Southport
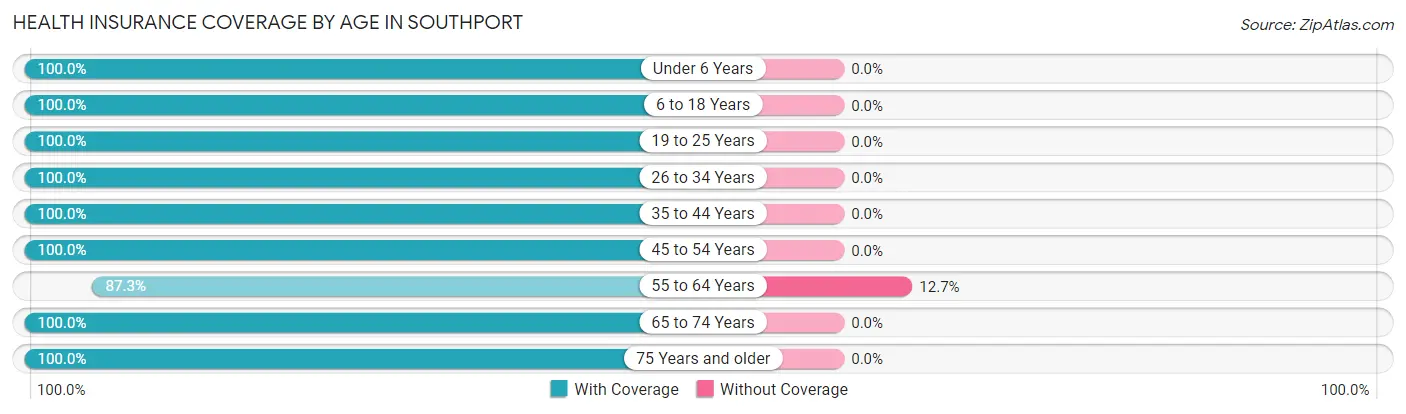
| Age Bracket | With Coverage | Without Coverage |
| Under 6 Years | 41 (100.0%) | 0 (0.0%) |
| 6 to 18 Years | 213 (100.0%) | 0 (0.0%) |
| 19 to 25 Years | 145 (100.0%) | 0 (0.0%) |
| 26 to 34 Years | 58 (100.0%) | 0 (0.0%) |
| 35 to 44 Years | 201 (100.0%) | 0 (0.0%) |
| 45 to 54 Years | 85 (100.0%) | 0 (0.0%) |
| 55 to 64 Years | 385 (87.3%) | 56 (12.7%) |
| 65 to 74 Years | 202 (100.0%) | 0 (0.0%) |
| 75 Years and older | 129 (100.0%) | 0 (0.0%) |
| Total | 1,459 (96.3%) | 56 (3.7%) |
Health Insurance Coverage by Citizenship Status in Southport
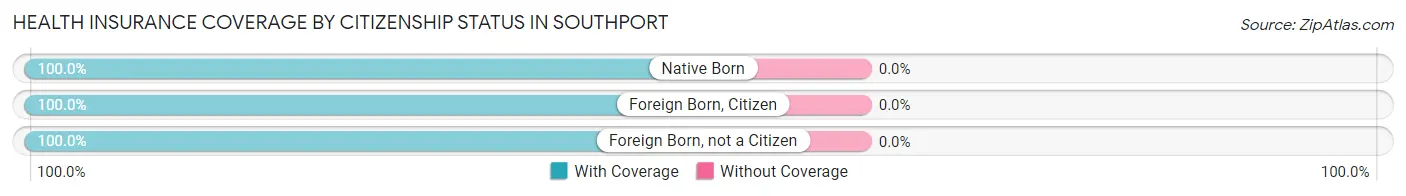
| Citizenship Status | With Coverage | Without Coverage |
| Native Born | 41 (100.0%) | 0 (0.0%) |
| Foreign Born, Citizen | 213 (100.0%) | 0 (0.0%) |
| Foreign Born, not a Citizen | 145 (100.0%) | 0 (0.0%) |
Health Insurance Coverage by Household Income in Southport
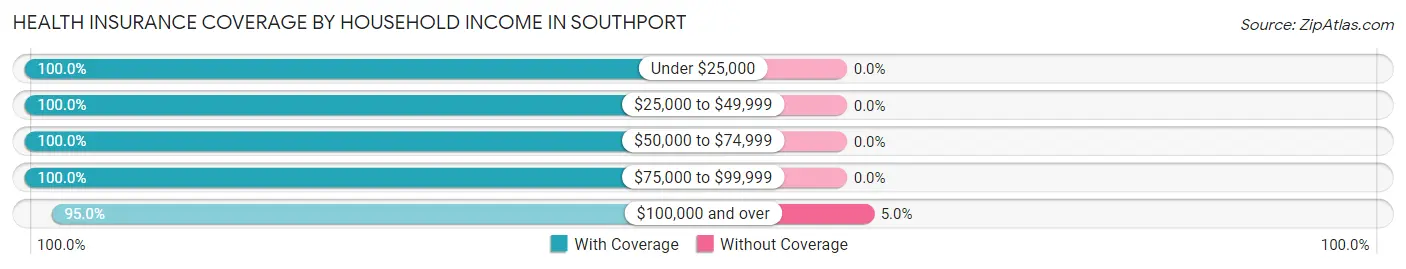
| Household Income | With Coverage | Without Coverage |
| Under $25,000 | 114 (100.0%) | 0 (0.0%) |
| $25,000 to $49,999 | 187 (100.0%) | 0 (0.0%) |
| $50,000 to $74,999 | 78 (100.0%) | 0 (0.0%) |
| $75,000 to $99,999 | 25 (100.0%) | 0 (0.0%) |
| $100,000 and over | 1,055 (95.0%) | 56 (5.0%) |
Public vs Private Health Insurance Coverage by Age in Southport
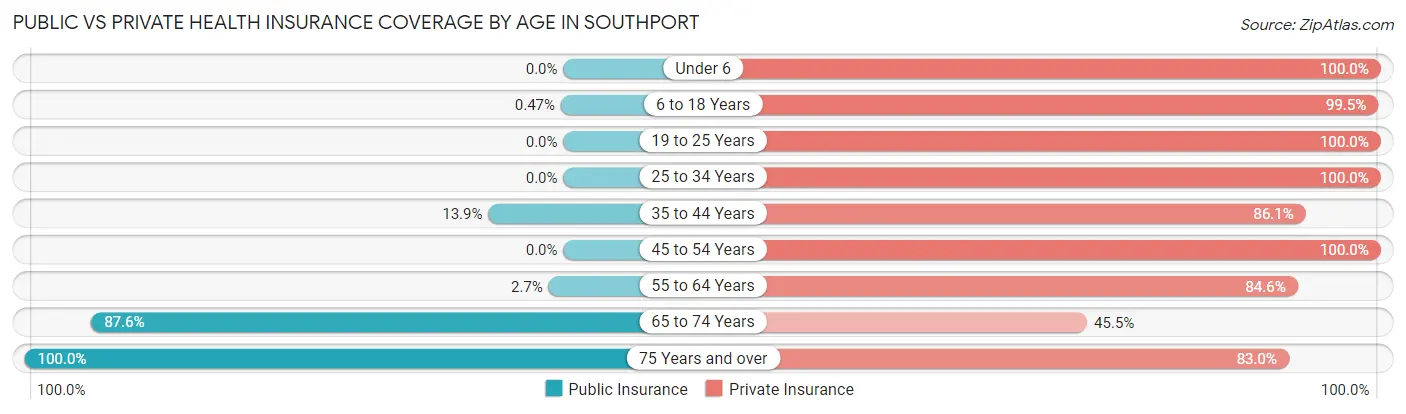
| Age Bracket | Public Insurance | Private Insurance |
| Under 6 | 0 (0.0%) | 41 (100.0%) |
| 6 to 18 Years | 1 (0.5%) | 212 (99.5%) |
| 19 to 25 Years | 0 (0.0%) | 145 (100.0%) |
| 25 to 34 Years | 0 (0.0%) | 58 (100.0%) |
| 35 to 44 Years | 28 (13.9%) | 173 (86.1%) |
| 45 to 54 Years | 0 (0.0%) | 85 (100.0%) |
| 55 to 64 Years | 12 (2.7%) | 373 (84.6%) |
| 65 to 74 Years | 177 (87.6%) | 92 (45.5%) |
| 75 Years and over | 129 (100.0%) | 107 (83.0%) |
| Total | 347 (22.9%) | 1,286 (84.9%) |
Disability Status by Sex by Age in Southport
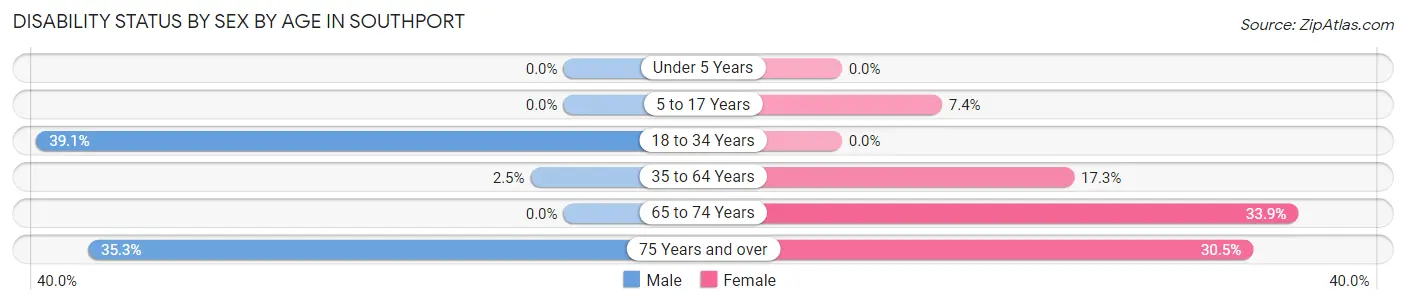
| Age Bracket | Male | Female |
| Under 5 Years | 0 (0.0%) | 0 (0.0%) |
| 5 to 17 Years | 0 (0.0%) | 11 (7.4%) |
| 18 to 34 Years | 45 (39.1%) | 0 (0.0%) |
| 35 to 64 Years | 8 (2.5%) | 69 (17.2%) |
| 65 to 74 Years | 0 (0.0%) | 41 (33.9%) |
| 75 Years and over | 12 (35.3%) | 29 (30.5%) |
Disability Class by Sex by Age in Southport
Disability Class: Hearing Difficulty
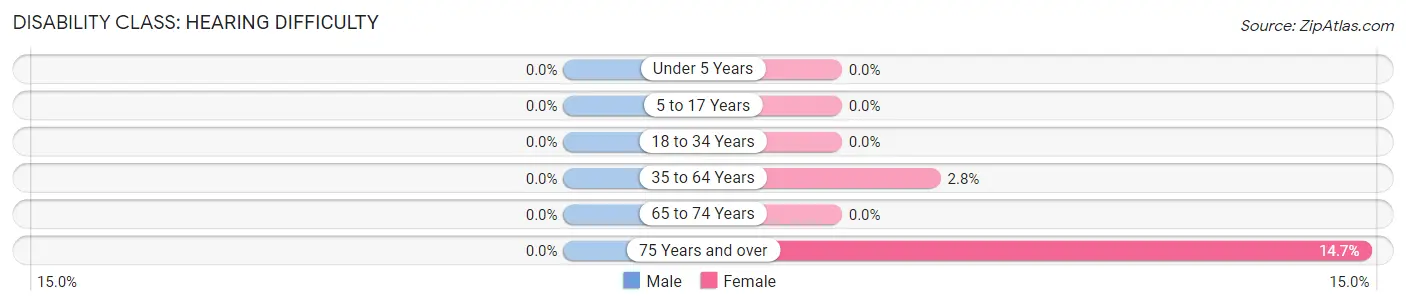
| Age Bracket | Male | Female |
| Under 5 Years | 0 (0.0%) | 0 (0.0%) |
| 5 to 17 Years | 0 (0.0%) | 0 (0.0%) |
| 18 to 34 Years | 0 (0.0%) | 0 (0.0%) |
| 35 to 64 Years | 0 (0.0%) | 11 (2.8%) |
| 65 to 74 Years | 0 (0.0%) | 0 (0.0%) |
| 75 Years and over | 0 (0.0%) | 14 (14.7%) |
Disability Class: Vision Difficulty
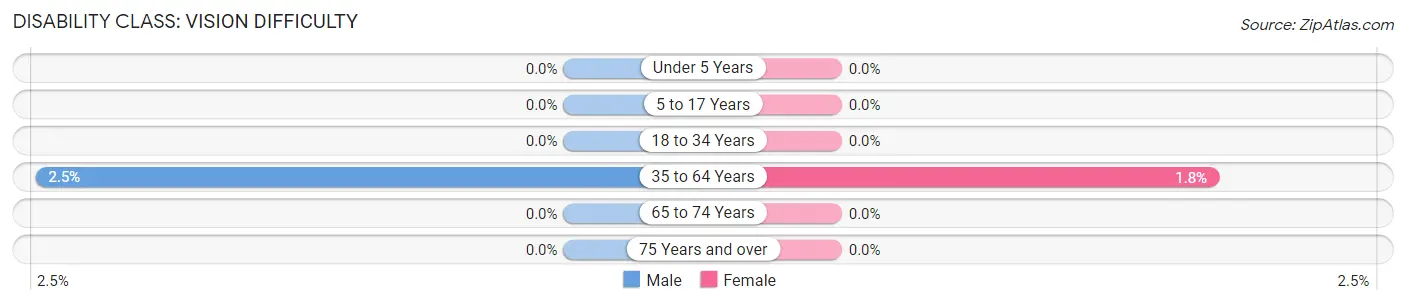
| Age Bracket | Male | Female |
| Under 5 Years | 0 (0.0%) | 0 (0.0%) |
| 5 to 17 Years | 0 (0.0%) | 0 (0.0%) |
| 18 to 34 Years | 0 (0.0%) | 0 (0.0%) |
| 35 to 64 Years | 8 (2.5%) | 7 (1.8%) |
| 65 to 74 Years | 0 (0.0%) | 0 (0.0%) |
| 75 Years and over | 0 (0.0%) | 0 (0.0%) |
Disability Class: Cognitive Difficulty
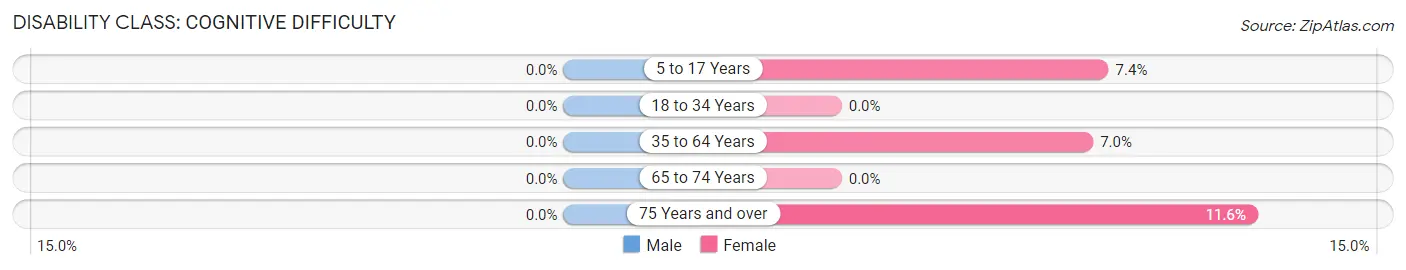
| Age Bracket | Male | Female |
| 5 to 17 Years | 0 (0.0%) | 11 (7.4%) |
| 18 to 34 Years | 0 (0.0%) | 0 (0.0%) |
| 35 to 64 Years | 0 (0.0%) | 28 (7.0%) |
| 65 to 74 Years | 0 (0.0%) | 0 (0.0%) |
| 75 Years and over | 0 (0.0%) | 11 (11.6%) |
Disability Class: Ambulatory Difficulty
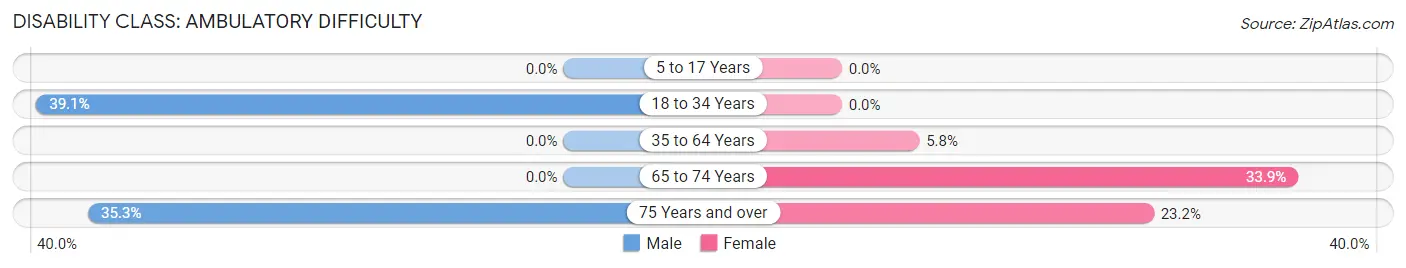
| Age Bracket | Male | Female |
| 5 to 17 Years | 0 (0.0%) | 0 (0.0%) |
| 18 to 34 Years | 45 (39.1%) | 0 (0.0%) |
| 35 to 64 Years | 0 (0.0%) | 23 (5.8%) |
| 65 to 74 Years | 0 (0.0%) | 41 (33.9%) |
| 75 Years and over | 12 (35.3%) | 22 (23.2%) |
Disability Class: Self-Care Difficulty
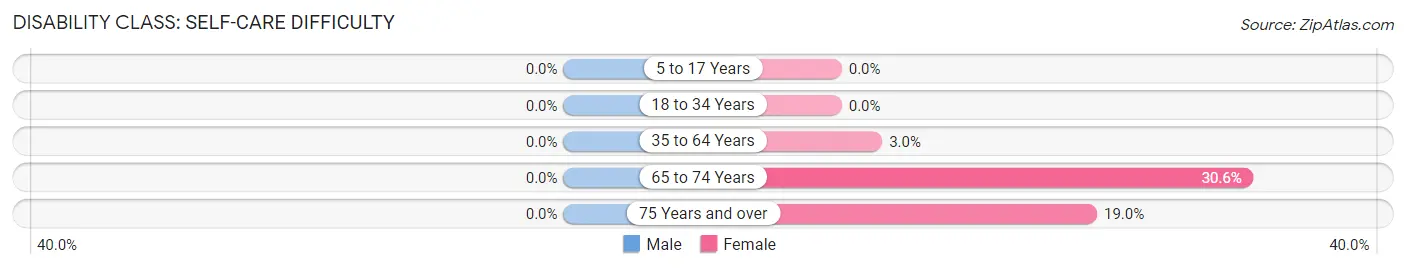
| Age Bracket | Male | Female |
| 5 to 17 Years | 0 (0.0%) | 0 (0.0%) |
| 18 to 34 Years | 0 (0.0%) | 0 (0.0%) |
| 35 to 64 Years | 0 (0.0%) | 12 (3.0%) |
| 65 to 74 Years | 0 (0.0%) | 37 (30.6%) |
| 75 Years and over | 0 (0.0%) | 18 (19.0%) |
Technology Access in Southport
Computing Device Access in Southport
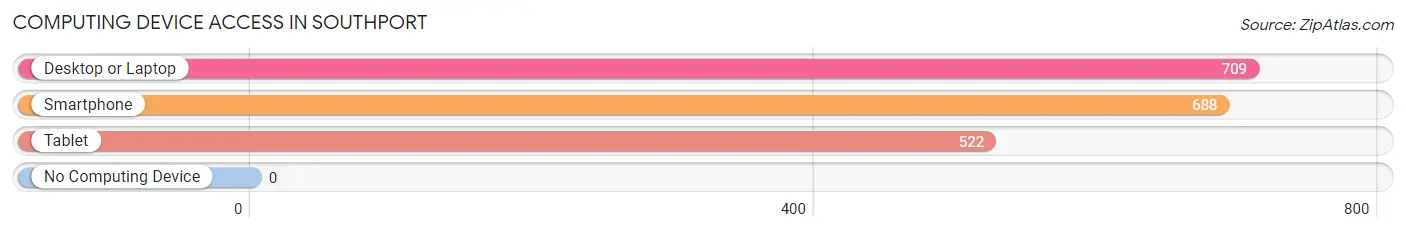
| Device Type | # Households | % Households |
| Desktop or Laptop | 709 | 98.6% |
| Smartphone | 688 | 95.7% |
| Tablet | 522 | 72.6% |
| No Computing Device | 0 | 0.0% |
| Total | 719 | 100.0% |
Internet Access in Southport
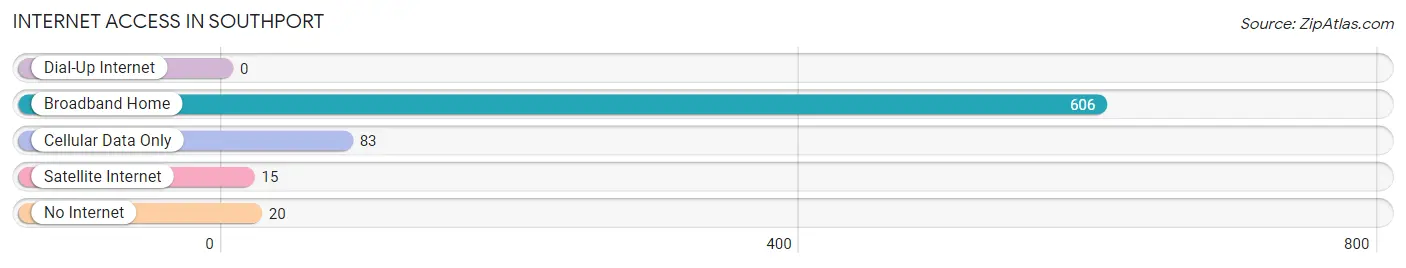
| Internet Type | # Households | % Households |
| Dial-Up Internet | 0 | 0.0% |
| Broadband Home | 606 | 84.3% |
| Cellular Data Only | 83 | 11.5% |
| Satellite Internet | 15 | 2.1% |
| No Internet | 20 | 2.8% |
| Total | 719 | 100.0% |
Southport Summary
Southport is a small town located in Fairfield County, Connecticut. It is situated on the Long Island Sound, and is part of the Bridgeport-Stamford-Norwalk Metropolitan Statistical Area. The town has a population of approximately 2,000 people, and is known for its quaint New England charm.
History
Southport was first settled in 1639 by a group of English settlers from Fairfield. The town was originally known as Sasqua, and was part of the town of Fairfield. In 1821, the town was officially incorporated as Southport. The town was named after the Southport Harbor, which was a major port of entry for ships coming from Europe.
In the 19th century, Southport was a popular summer resort destination for wealthy New Yorkers. The town was known for its beautiful beaches, and was home to several grand hotels. The town also had a thriving fishing industry, and was home to several shipbuilding companies.
Geography
Southport is located in Fairfield County, Connecticut. It is situated on the Long Island Sound, and is bordered by the towns of Fairfield, Westport, and Easton. The town has a total area of 2.2 square miles, and is home to several small islands, including Southport Island, Sasqua Island, and Pequot Island.
The town is located in a temperate climate, with hot, humid summers and cold, wet winters. The average temperature in the summer is around 75 degrees Fahrenheit, and the average temperature in the winter is around 35 degrees Fahrenheit.
Economy
Southport’s economy is largely based on tourism and retail. The town is home to several small businesses, including restaurants, shops, and galleries. The town also has a thriving fishing industry, and is home to several boatyards.
The town is also home to several large corporations, including the Southport Financial Group, which is a financial services company. The town is also home to several hedge funds, including the Southport Capital Management Group.
Demographics
As of the 2010 census, Southport had a population of 2,000 people. The racial makeup of the town was 94.2% White, 1.2% African American, 0.2% Native American, 1.2% Asian, 0.2% Pacific Islander, and 2.2% from other races. The median household income was $90,000, and the median family income was $105,000.
Southport is a small, close-knit community. The town is known for its friendly atmosphere, and is home to several churches, schools, and parks. The town is also home to several cultural events, including the Southport Summer Festival and the Southport Arts Festival.
Common Questions
What is Per Capita Income in Southport?
Per Capita income in Southport is $124,911.
What is the Median Family Income in Southport?
Median Family Income in Southport is $206,205.
What is the Median Household income in Southport?
Median Household Income in Southport is $156,406.
What is Income or Wage Gap in Southport?
Income or Wage Gap in Southport is 42.1%.
Women in Southport earn 57.9 cents for every dollar earned by a man.
What is Inequality or Gini Index in Southport?
Inequality or Gini Index in Southport is 0.55.
What is the Total Population of Southport?
Total Population of Southport is 1,515.
What is the Total Male Population of Southport?
Total Male Population of Southport is 638.
What is the Total Female Population of Southport?
Total Female Population of Southport is 877.
What is the Ratio of Males per 100 Females in Southport?
There are 72.75 Males per 100 Females in Southport.
What is the Ratio of Females per 100 Males in Southport?
There are 137.46 Females per 100 Males in Southport.
What is the Median Population Age in Southport?
Median Population Age in Southport is 56.2 Years.
What is the Average Family Size in Southport
Average Family Size in Southport is 2.6 People.
What is the Average Household Size in Southport
Average Household Size in Southport is 2.1 People.
How Large is the Labor Force in Southport?
There are 872 People in the Labor Forcein in Southport.
What is the Percentage of People in the Labor Force in Southport?
67.5% of People are in the Labor Force in Southport.
What is the Unemployment Rate in Southport?
Unemployment Rate in Southport is 5.3%.