Zip Codes with the Highest Percentage of Population Employed in Architecture & Engineering in Meriden, CT
RELATED REPORTS & OPTIONS
Architecture & Engineering
Meriden
Compare Zip Codes
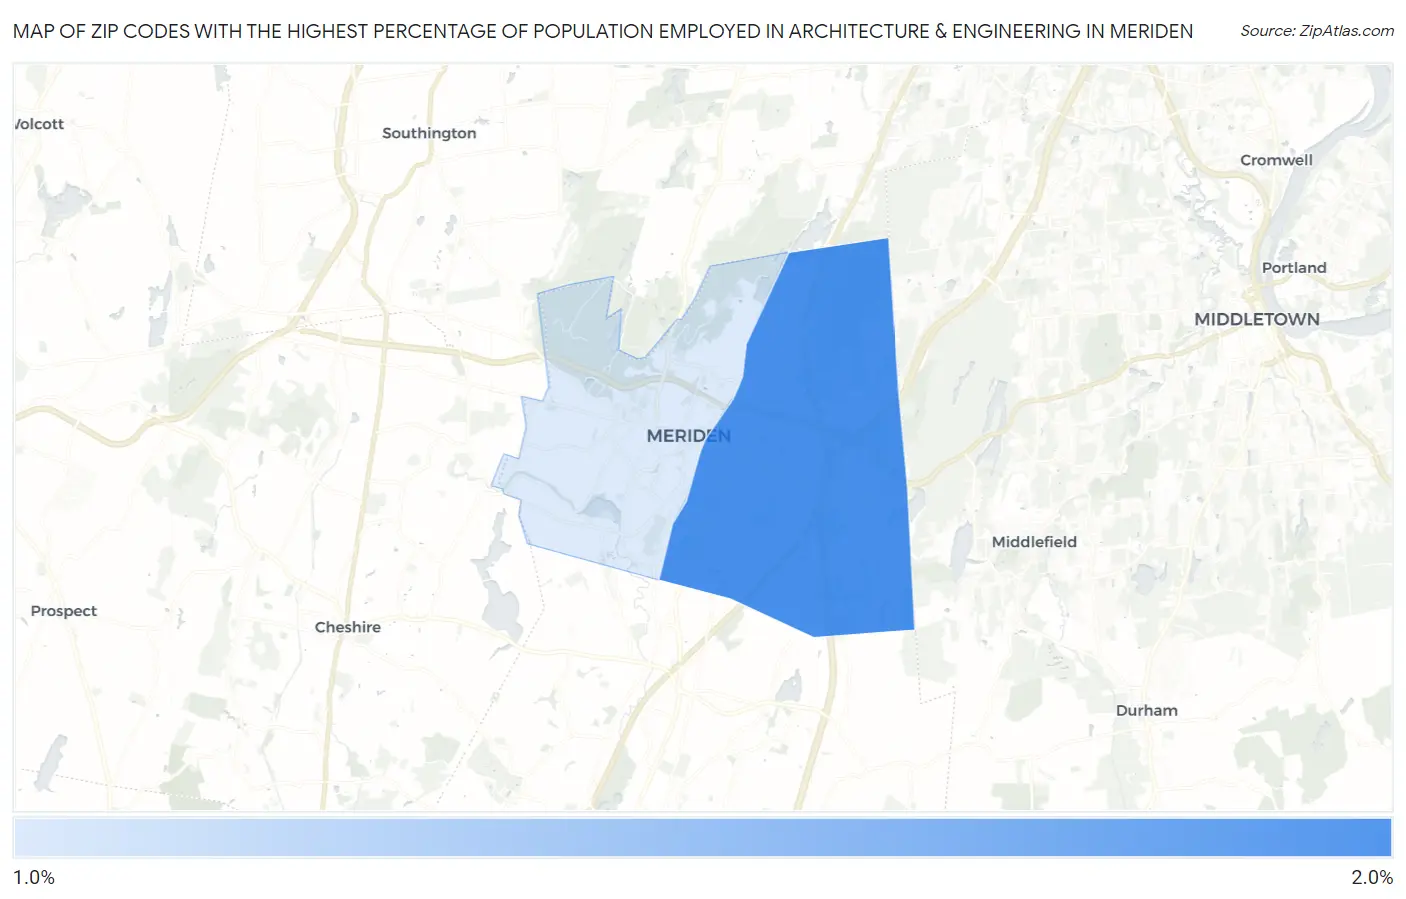
Map of Zip Codes with the Highest Percentage of Population Employed in Architecture & Engineering in Meriden
1.1%
1.5%
Zip Codes with the Highest Percentage of Population Employed in Architecture & Engineering in Meriden, CT
| Zip Code | % Employed | vs State | vs National | |
| 1. | 06450 | 1.5% | 2.6%(-1.05)#173 | 2.1%(-0.626)#12,709 |
| 2. | 06451 | 1.1% | 2.6%(-1.47)#205 | 2.1%(-1.04)#15,783 |
1
Common Questions
What are the Top Zip Codes with the Highest Percentage of Population Employed in Architecture & Engineering in Meriden, CT?
Top Zip Codes with the Highest Percentage of Population Employed in Architecture & Engineering in Meriden, CT are:
What zip code has the Highest Percentage of Population Employed in Architecture & Engineering in Meriden, CT?
06450 has the Highest Percentage of Population Employed in Architecture & Engineering in Meriden, CT with 1.5%.
What is the Percentage of Population Employed in Architecture & Engineering in Meriden, CT?
Percentage of Population Employed in Architecture & Engineering in Meriden is 1.4%.
What is the Percentage of Population Employed in Architecture & Engineering in Connecticut?
Percentage of Population Employed in Architecture & Engineering in Connecticut is 2.6%.
What is the Percentage of Population Employed in Architecture & Engineering in the United States?
Percentage of Population Employed in Architecture & Engineering in the United States is 2.1%.