Thomaston, CT Map & Demographics
Thomaston Map
Thomaston Overview
$39,700
PER CAPITA INCOME
$115,795
AVG FAMILY INCOME
$71,301
AVG HOUSEHOLD INCOME
28.9%
WAGE / INCOME GAP [ % ]
71.1¢/ $1
WAGE / INCOME GAP [ $ ]
0.38
INEQUALITY / GINI INDEX
2,087
TOTAL POPULATION
1,097
MALE POPULATION
990
FEMALE POPULATION
110.81
MALES / 100 FEMALES
90.25
FEMALES / 100 MALES
47.9
MEDIAN AGE
2.9
AVG FAMILY SIZE
2.0
AVG HOUSEHOLD SIZE
1,022
LABOR FORCE [ PEOPLE ]
60.6%
PERCENT IN LABOR FORCE
4.9%
UNEMPLOYMENT RATE
Thomaston Zip Codes
Thomaston Area Codes
Income in Thomaston
Income Overview in Thomaston
Per Capita Income in Thomaston is $39,700, while median incomes of families and households are $115,795 and $71,301 respectively.
| Characteristic | Number | Measure |
| Per Capita Income | 2,087 | $39,700 |
| Median Family Income | 465 | $115,795 |
| Mean Family Income | 465 | $107,821 |
| Median Household Income | 1,059 | $71,301 |
| Mean Household Income | 1,059 | $77,782 |
| Income Deficit | 465 | $0 |
| Wage / Income Gap (%) | 2,087 | 28.88% |
| Wage / Income Gap ($) | 2,087 | 71.12¢ per $1 |
| Gini / Inequality Index | 2,087 | 0.38 |
Earnings by Sex in Thomaston
Average Earnings in Thomaston are $58,229, $64,547 for men and $45,903 for women, a difference of 28.9%.
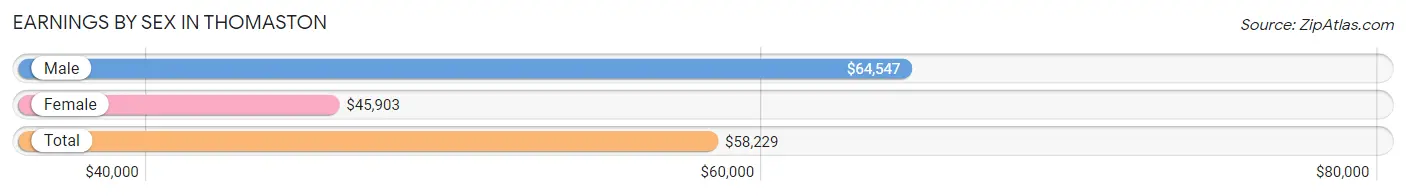
| Sex | Number | Average Earnings |
| Male | 567 (55.2%) | $64,547 |
| Female | 461 (44.8%) | $45,903 |
| Total | 1,028 (100.0%) | $58,229 |
Earnings by Sex by Income Bracket in Thomaston
The most common earnings brackets in Thomaston are $100,000+ for men (142 | 25.0%) and $65,000 to $74,999 for women (86 | 18.7%).
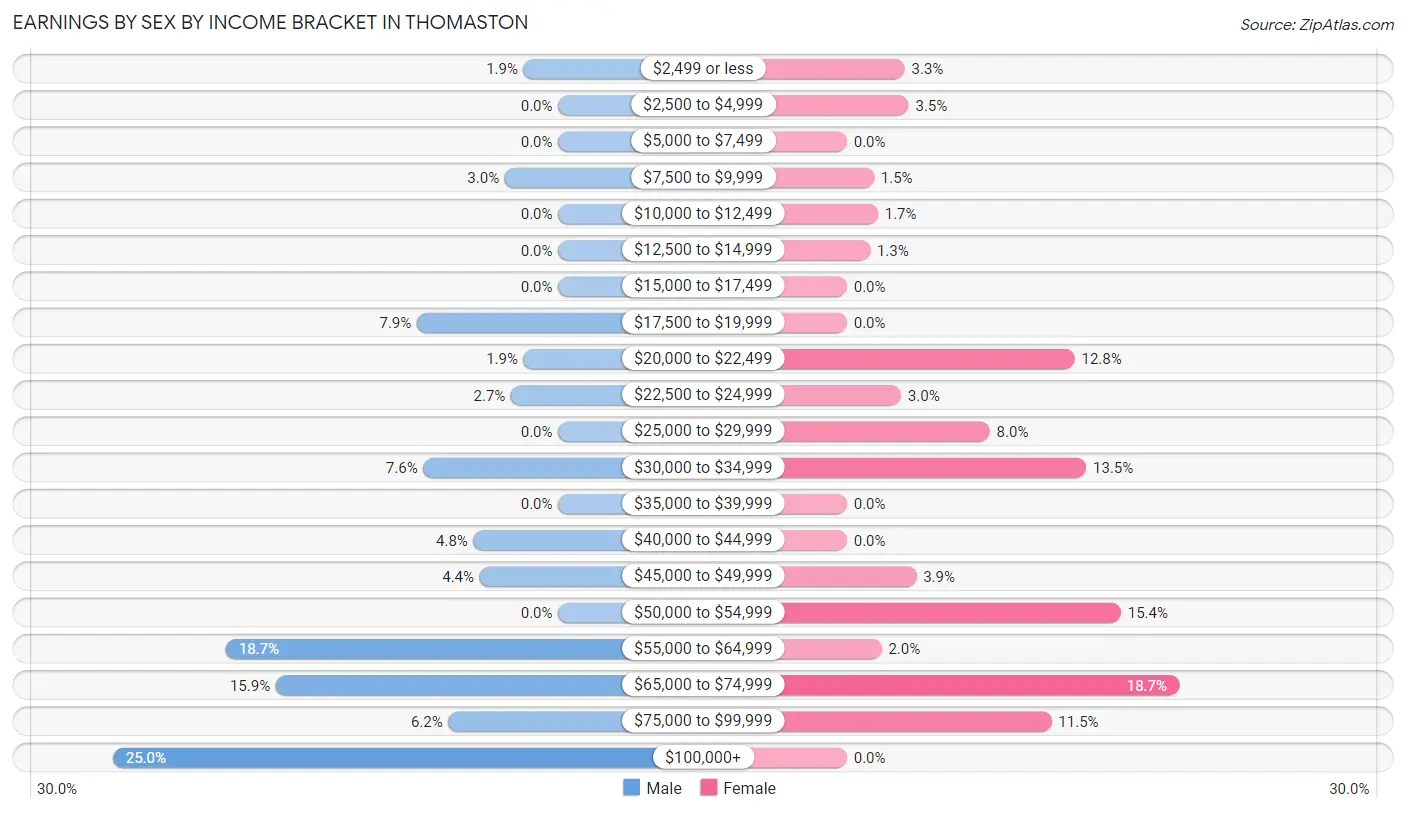
| Income | Male | Female |
| $2,499 or less | 11 (1.9%) | 15 (3.3%) |
| $2,500 to $4,999 | 0 (0.0%) | 16 (3.5%) |
| $5,000 to $7,499 | 0 (0.0%) | 0 (0.0%) |
| $7,500 to $9,999 | 17 (3.0%) | 7 (1.5%) |
| $10,000 to $12,499 | 0 (0.0%) | 8 (1.7%) |
| $12,500 to $14,999 | 0 (0.0%) | 6 (1.3%) |
| $15,000 to $17,499 | 0 (0.0%) | 0 (0.0%) |
| $17,500 to $19,999 | 45 (7.9%) | 0 (0.0%) |
| $20,000 to $22,499 | 11 (1.9%) | 59 (12.8%) |
| $22,500 to $24,999 | 15 (2.6%) | 14 (3.0%) |
| $25,000 to $29,999 | 0 (0.0%) | 37 (8.0%) |
| $30,000 to $34,999 | 43 (7.6%) | 62 (13.5%) |
| $35,000 to $39,999 | 0 (0.0%) | 0 (0.0%) |
| $40,000 to $44,999 | 27 (4.8%) | 0 (0.0%) |
| $45,000 to $49,999 | 25 (4.4%) | 18 (3.9%) |
| $50,000 to $54,999 | 0 (0.0%) | 71 (15.4%) |
| $55,000 to $64,999 | 106 (18.7%) | 9 (1.9%) |
| $65,000 to $74,999 | 90 (15.9%) | 86 (18.7%) |
| $75,000 to $99,999 | 35 (6.2%) | 53 (11.5%) |
| $100,000+ | 142 (25.0%) | 0 (0.0%) |
| Total | 567 (100.0%) | 461 (100.0%) |
Earnings by Sex by Educational Attainment in Thomaston
Average earnings in Thomaston are $67,083 for men and $54,773 for women, a difference of 18.3%. Men with an educational attainment of bachelor's degree enjoy the highest average annual earnings of $75,435, while those with high school diploma education earn the least with $42,130. Women with an educational attainment of graduate degree earn the most with the average annual earnings of $84,464, while those with college or associate's degree education have the smallest earnings of $50,132.
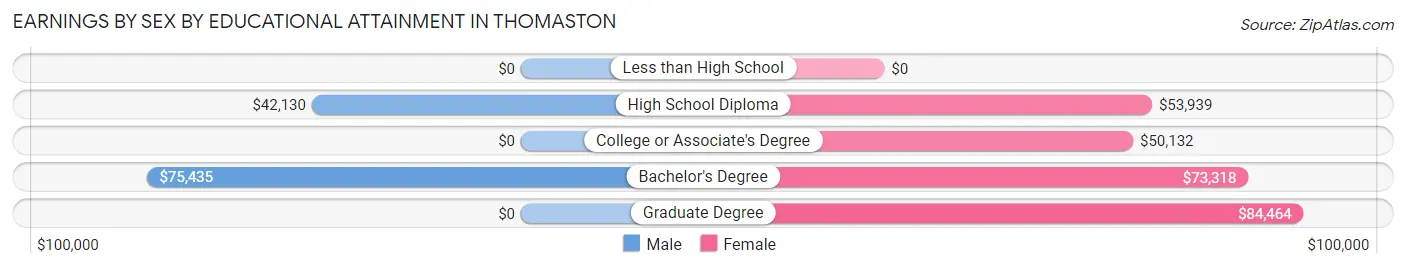
| Educational Attainment | Male Income | Female Income |
| Less than High School | - | - |
| High School Diploma | $42,130 | $53,939 |
| College or Associate's Degree | - | - |
| Bachelor's Degree | $75,435 | $73,318 |
| Graduate Degree | - | - |
| Total | $67,083 | $54,773 |
Family Income in Thomaston
Family Income Brackets in Thomaston
According to the Thomaston family income data, there are 209 families falling into the $100,000 to $149,999 income range, which is the most common income bracket and makes up 45.0% of all families.
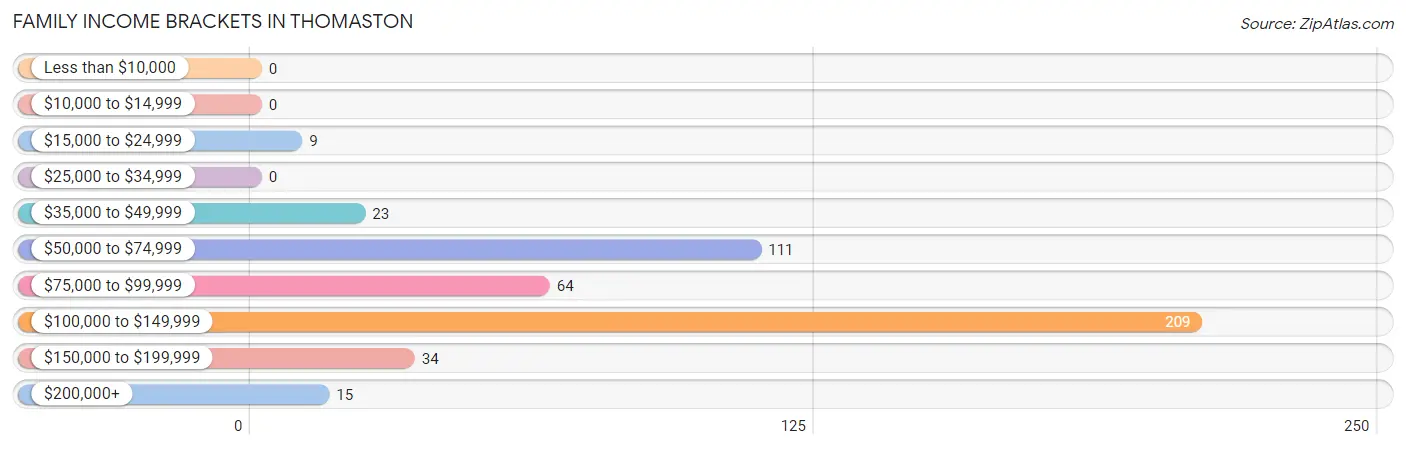
| Income Bracket | # Families | % Families |
| Less than $10,000 | 0 | 0.0% |
| $10,000 to $14,999 | 0 | 0.0% |
| $15,000 to $24,999 | 9 | 1.9% |
| $25,000 to $34,999 | 0 | 0.0% |
| $35,000 to $49,999 | 23 | 4.9% |
| $50,000 to $74,999 | 111 | 23.9% |
| $75,000 to $99,999 | 64 | 13.8% |
| $100,000 to $149,999 | 209 | 44.9% |
| $150,000 to $199,999 | 34 | 7.3% |
| $200,000+ | 15 | 3.2% |
Family Income by Famaliy Size in Thomaston
2-person families (304 | 65.4%) account for the highest median family income in Thomaston with $115,455 per family, while 2-person families (304 | 65.4%) have the highest median income of $57,728 per family member.
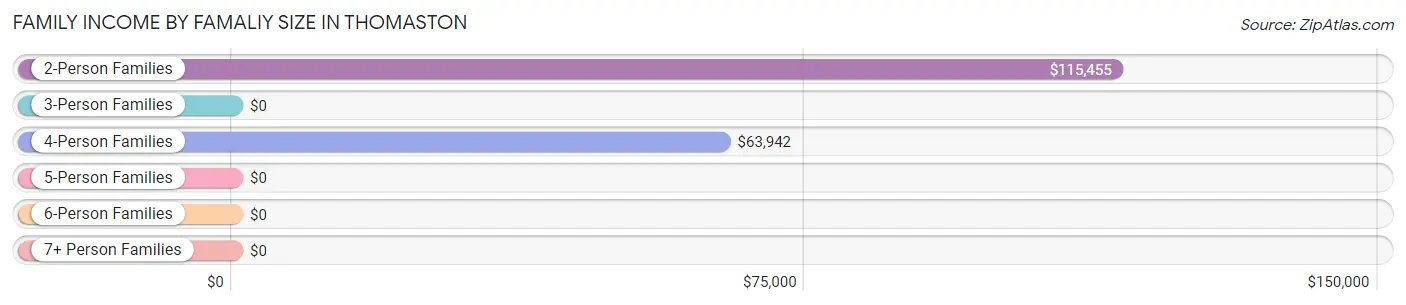
| Income Bracket | # Families | Median Income |
| 2-Person Families | 304 (65.4%) | $115,455 |
| 3-Person Families | 25 (5.4%) | $0 |
| 4-Person Families | 80 (17.2%) | $63,942 |
| 5-Person Families | 41 (8.8%) | $0 |
| 6-Person Families | 15 (3.2%) | $0 |
| 7+ Person Families | 0 (0.0%) | $0 |
| Total | 465 (100.0%) | $115,795 |
Family Income by Number of Earners in Thomaston
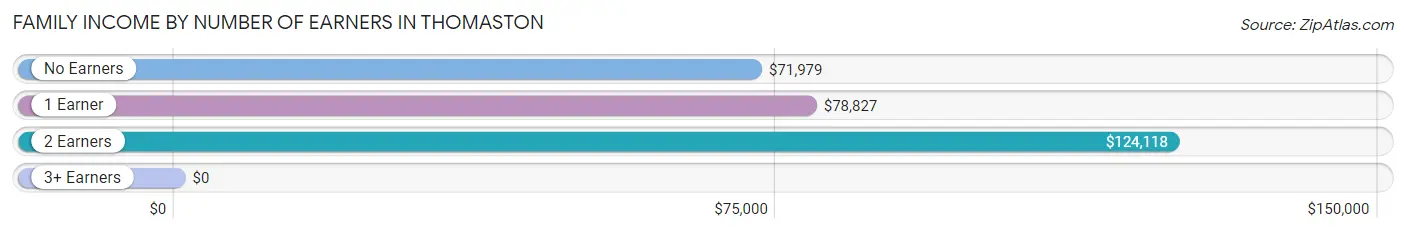
| Number of Earners | # Families | Median Income |
| No Earners | 37 (8.0%) | $71,979 |
| 1 Earner | 296 (63.7%) | $78,827 |
| 2 Earners | 94 (20.2%) | $124,118 |
| 3+ Earners | 38 (8.2%) | $0 |
| Total | 465 (100.0%) | $115,795 |
Household Income in Thomaston
Household Income Brackets in Thomaston
With 235 households falling in the category, the $100,000 to $149,999 income range is the most frequent in Thomaston, accounting for 22.2% of all households. In contrast, only 34 households (3.2%) fall into the $150,000 to $199,999 income bracket, making it the least populous group.
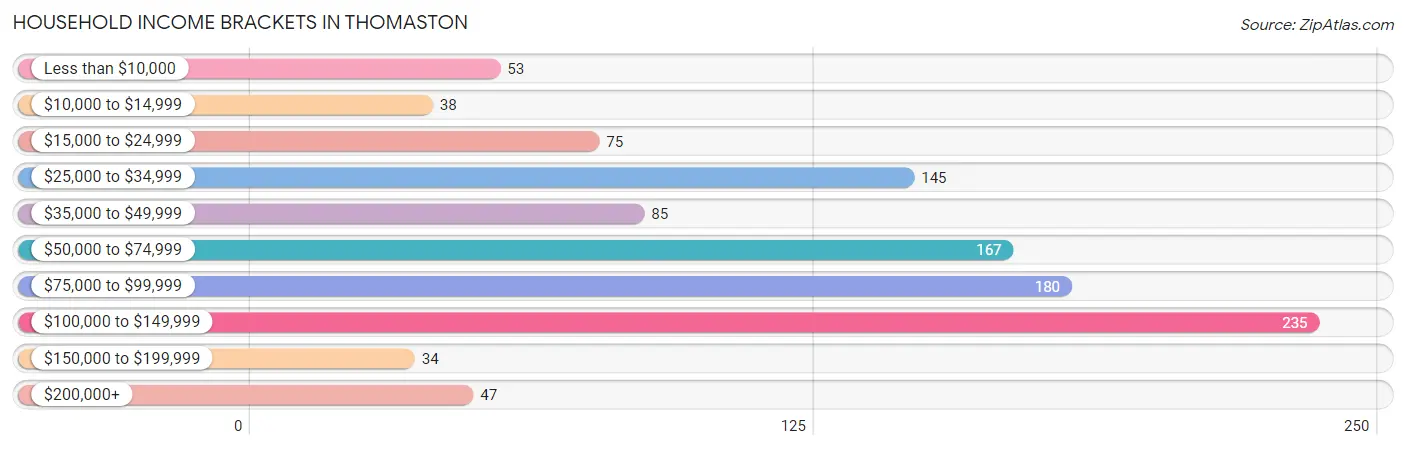
| Income Bracket | # Households | % Households |
| Less than $10,000 | 53 | 5.0% |
| $10,000 to $14,999 | 38 | 3.6% |
| $15,000 to $24,999 | 75 | 7.1% |
| $25,000 to $34,999 | 145 | 13.7% |
| $35,000 to $49,999 | 85 | 8.0% |
| $50,000 to $74,999 | 167 | 15.8% |
| $75,000 to $99,999 | 180 | 17.0% |
| $100,000 to $149,999 | 235 | 22.2% |
| $150,000 to $199,999 | 34 | 3.2% |
| $200,000+ | 47 | 4.4% |
Household Income by Householder Age in Thomaston
The median household income in Thomaston is $71,301, with the highest median household income of $116,818 found in the 45 to 64 years age bracket for the primary householder. A total of 440 households (41.5%) fall into this category. Meanwhile, the 65+ years age bracket for the primary householder has the lowest median household income of $36,518, with 357 households (33.7%) in this group.
| Income Bracket | # Households | Median Income |
| 15 to 24 Years | 128 (12.1%) | $59,138 |
| 25 to 44 Years | 134 (12.7%) | $88,510 |
| 45 to 64 Years | 440 (41.5%) | $116,818 |
| 65+ Years | 357 (33.7%) | $36,518 |
| Total | 1,059 (100.0%) | $71,301 |
Poverty in Thomaston
Income Below Poverty by Sex and Age in Thomaston
With 7.4% poverty level for males and 4.9% for females among the residents of Thomaston, 45 to 54 year old males and 25 to 34 year old females are the most vulnerable to poverty, with 38 males (19.3%) and 6 females (19.4%) in their respective age groups living below the poverty level.
| Age Bracket | Male | Female |
| Under 5 Years | 0 (0.0%) | 0 (0.0%) |
| 5 Years | 0 (0.0%) | 0 (0.0%) |
| 6 to 11 Years | 0 (0.0%) | 0 (0.0%) |
| 12 to 14 Years | 0 (0.0%) | 0 (0.0%) |
| 15 Years | 0 (0.0%) | 0 (0.0%) |
| 16 and 17 Years | 0 (0.0%) | 0 (0.0%) |
| 18 to 24 Years | 0 (0.0%) | 7 (5.5%) |
| 25 to 34 Years | 0 (0.0%) | 6 (19.4%) |
| 35 to 44 Years | 0 (0.0%) | 9 (7.1%) |
| 45 to 54 Years | 38 (19.3%) | 0 (0.0%) |
| 55 to 64 Years | 35 (17.2%) | 16 (11.2%) |
| 65 to 74 Years | 0 (0.0%) | 10 (7.3%) |
| 75 Years and over | 8 (13.1%) | 0 (0.0%) |
| Total | 81 (7.4%) | 48 (4.9%) |
Income Above Poverty by Sex and Age in Thomaston
According to the poverty statistics in Thomaston, males aged under 5 years and females aged under 5 years are the age groups that are most secure financially, with 100.0% of males and 100.0% of females in these age groups living above the poverty line.
| Age Bracket | Male | Female |
| Under 5 Years | 93 (100.0%) | 37 (100.0%) |
| 5 Years | 0 (0.0%) | 0 (0.0%) |
| 6 to 11 Years | 56 (100.0%) | 64 (100.0%) |
| 12 to 14 Years | 80 (100.0%) | 42 (100.0%) |
| 15 Years | 0 (0.0%) | 11 (100.0%) |
| 16 and 17 Years | 0 (0.0%) | 31 (100.0%) |
| 18 to 24 Years | 106 (100.0%) | 121 (94.5%) |
| 25 to 34 Years | 94 (100.0%) | 25 (80.6%) |
| 35 to 44 Years | 46 (100.0%) | 117 (92.9%) |
| 45 to 54 Years | 159 (80.7%) | 126 (100.0%) |
| 55 to 64 Years | 169 (82.8%) | 127 (88.8%) |
| 65 to 74 Years | 151 (100.0%) | 127 (92.7%) |
| 75 Years and over | 53 (86.9%) | 105 (100.0%) |
| Total | 1,007 (92.6%) | 933 (95.1%) |
Income Below Poverty Among Married-Couple Families in Thomaston
| Children | Above Poverty | Below Poverty |
| No Children | 286 (100.0%) | 0 (0.0%) |
| 1 or 2 Children | 51 (100.0%) | 0 (0.0%) |
| 3 or 4 Children | 33 (100.0%) | 0 (0.0%) |
| 5 or more Children | 0 (0.0%) | 0 (0.0%) |
| Total | 370 (100.0%) | 0 (0.0%) |
Income Below Poverty Among Single-Parent Households in Thomaston
| Children | Single Father | Single Mother |
| No Children | 0 (0.0%) | 0 (0.0%) |
| 1 or 2 Children | 0 (0.0%) | 0 (0.0%) |
| 3 or 4 Children | 0 (0.0%) | 0 (0.0%) |
| 5 or more Children | 0 (0.0%) | 0 (0.0%) |
| Total | 0 (0.0%) | 0 (0.0%) |
Income Below Poverty Among Married-Couple vs Single-Parent Households in Thomaston
| Children | Married-Couple Families | Single-Parent Households |
| No Children | 0 (0.0%) | 0 (0.0%) |
| 1 or 2 Children | 0 (0.0%) | 0 (0.0%) |
| 3 or 4 Children | 0 (0.0%) | 0 (0.0%) |
| 5 or more Children | 0 (0.0%) | 0 (0.0%) |
| Total | 0 (0.0%) | 0 (0.0%) |
Race in Thomaston
The most populous races in Thomaston are White / Caucasian (1,665 | 79.8%), Two or more Races (246 | 11.8%), and Hispanic or Latino (116 | 5.6%).
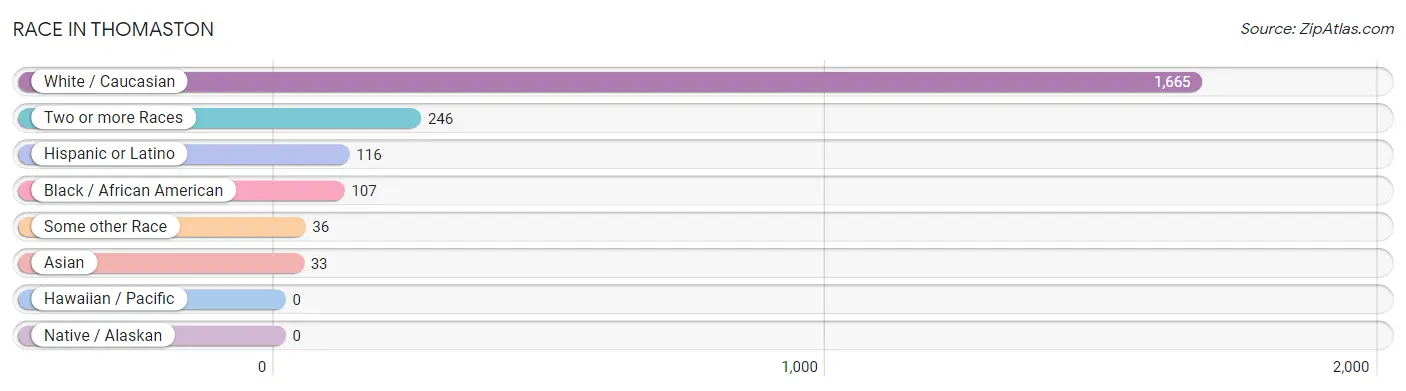
| Race | # Population | % Population |
| Asian | 33 | 1.6% |
| Black / African American | 107 | 5.1% |
| Hawaiian / Pacific | 0 | 0.0% |
| Hispanic or Latino | 116 | 5.6% |
| Native / Alaskan | 0 | 0.0% |
| White / Caucasian | 1,665 | 79.8% |
| Two or more Races | 246 | 11.8% |
| Some other Race | 36 | 1.7% |
| Total | 2,087 | 100.0% |
Ancestry in Thomaston
The most populous ancestries reported in Thomaston are Irish (316 | 15.1%), Italian (295 | 14.1%), English (277 | 13.3%), Jamaican (257 | 12.3%), and French Canadian (213 | 10.2%), together accounting for 65.1% of all Thomaston residents.
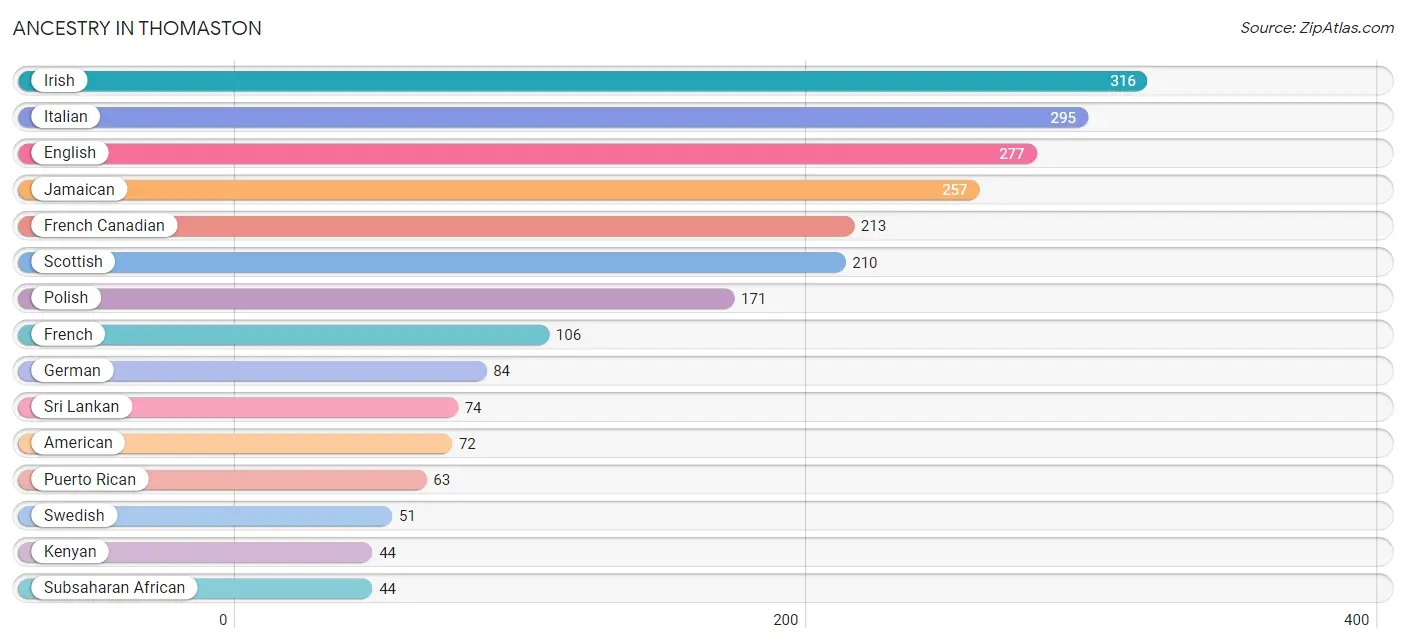
| Ancestry | # Population | % Population |
| American | 72 | 3.5% |
| Colombian | 7 | 0.3% |
| English | 277 | 13.3% |
| French | 106 | 5.1% |
| French Canadian | 213 | 10.2% |
| German | 84 | 4.0% |
| Indian (Asian) | 29 | 1.4% |
| Irish | 316 | 15.1% |
| Italian | 295 | 14.1% |
| Jamaican | 257 | 12.3% |
| Kenyan | 44 | 2.1% |
| Native Hawaiian | 29 | 1.4% |
| Polish | 171 | 8.2% |
| Portuguese | 28 | 1.3% |
| Puerto Rican | 63 | 3.0% |
| Scotch-Irish | 6 | 0.3% |
| Scottish | 210 | 10.1% |
| South American | 7 | 0.3% |
| Spaniard | 8 | 0.4% |
| Spanish | 38 | 1.8% |
| Sri Lankan | 74 | 3.5% |
| Subsaharan African | 44 | 2.1% |
| Swedish | 51 | 2.4% |
| Ukrainian | 8 | 0.4% | View All 24 Rows |
Immigrants in Thomaston
The most numerous immigrant groups reported in Thomaston came from Latin America (114 | 5.5%), Caribbean (107 | 5.1%), Jamaica (107 | 5.1%), Europe (28 | 1.3%), and Southern Europe (28 | 1.3%), together accounting for 18.4% of all Thomaston residents.
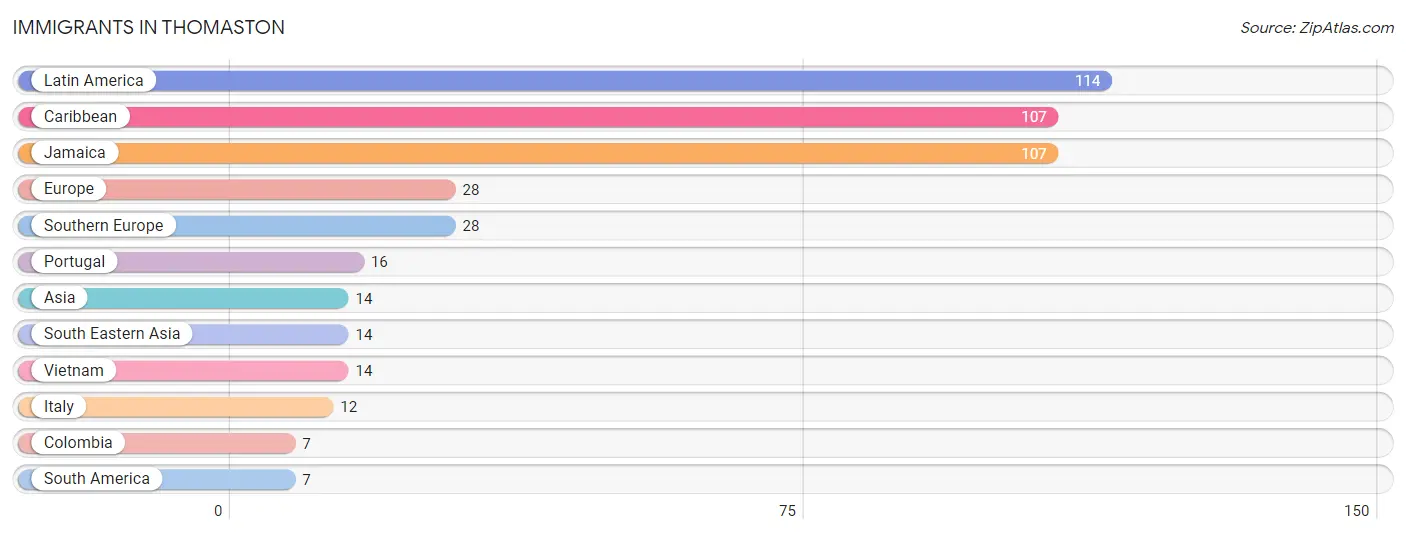
| Immigration Origin | # Population | % Population |
| Asia | 14 | 0.7% |
| Caribbean | 107 | 5.1% |
| Colombia | 7 | 0.3% |
| Europe | 28 | 1.3% |
| Italy | 12 | 0.6% |
| Jamaica | 107 | 5.1% |
| Latin America | 114 | 5.5% |
| Portugal | 16 | 0.8% |
| South America | 7 | 0.3% |
| South Eastern Asia | 14 | 0.7% |
| Southern Europe | 28 | 1.3% |
| Vietnam | 14 | 0.7% | View All 12 Rows |
Sex and Age in Thomaston
Sex and Age in Thomaston
The most populous age groups in Thomaston are 50 to 54 Years (190 | 17.3%) for men and 35 to 39 Years (107 | 10.8%) for women.
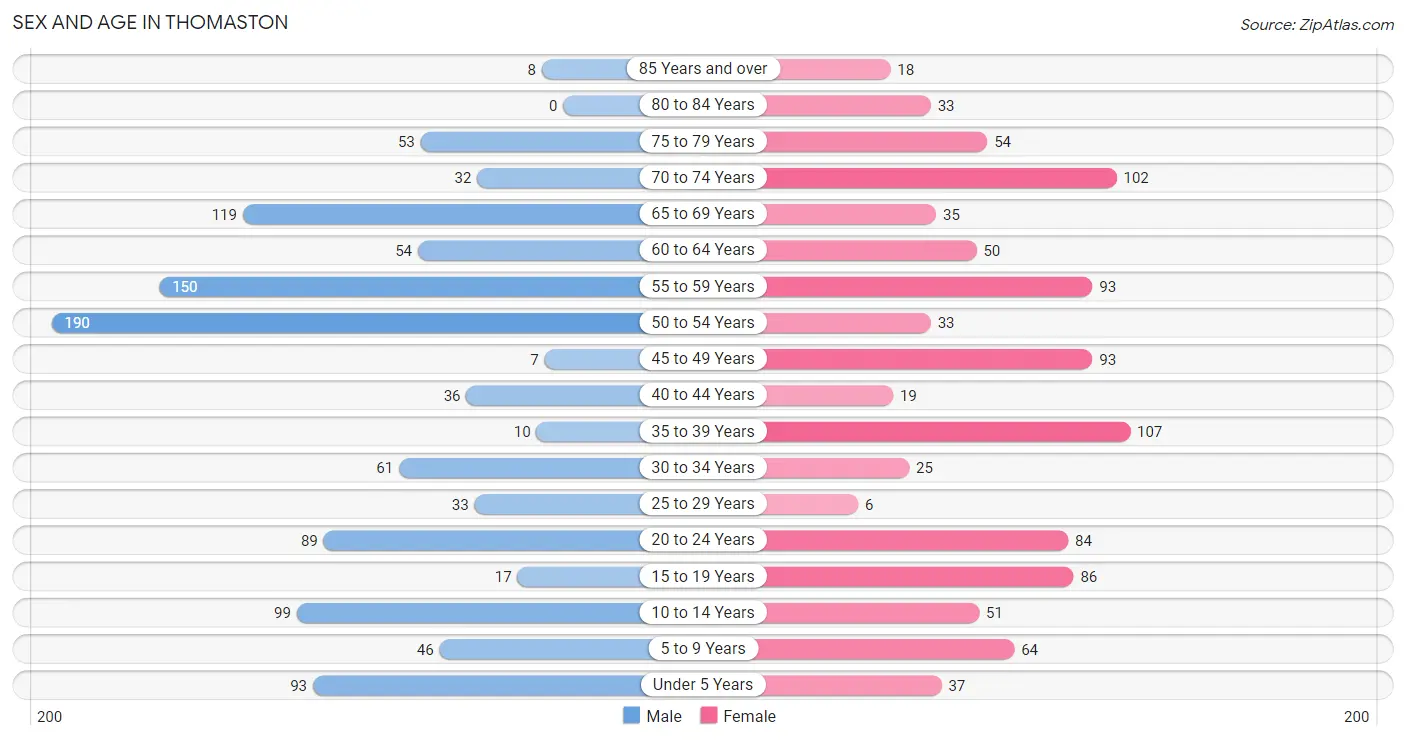
| Age Bracket | Male | Female |
| Under 5 Years | 93 (8.5%) | 37 (3.7%) |
| 5 to 9 Years | 46 (4.2%) | 64 (6.5%) |
| 10 to 14 Years | 99 (9.0%) | 51 (5.1%) |
| 15 to 19 Years | 17 (1.5%) | 86 (8.7%) |
| 20 to 24 Years | 89 (8.1%) | 84 (8.5%) |
| 25 to 29 Years | 33 (3.0%) | 6 (0.6%) |
| 30 to 34 Years | 61 (5.6%) | 25 (2.5%) |
| 35 to 39 Years | 10 (0.9%) | 107 (10.8%) |
| 40 to 44 Years | 36 (3.3%) | 19 (1.9%) |
| 45 to 49 Years | 7 (0.6%) | 93 (9.4%) |
| 50 to 54 Years | 190 (17.3%) | 33 (3.3%) |
| 55 to 59 Years | 150 (13.7%) | 93 (9.4%) |
| 60 to 64 Years | 54 (4.9%) | 50 (5.1%) |
| 65 to 69 Years | 119 (10.8%) | 35 (3.5%) |
| 70 to 74 Years | 32 (2.9%) | 102 (10.3%) |
| 75 to 79 Years | 53 (4.8%) | 54 (5.4%) |
| 80 to 84 Years | 0 (0.0%) | 33 (3.3%) |
| 85 Years and over | 8 (0.7%) | 18 (1.8%) |
| Total | 1,097 (100.0%) | 990 (100.0%) |
Families and Households in Thomaston
Median Family Size in Thomaston
The median family size in Thomaston is 2.93 persons per family, with married-couple families (370 | 79.6%) accounting for the largest median family size of 2.99 persons per family. On the other hand, single female/mother families (20 | 4.3%) represent the smallest median family size with 2.00 persons per family.
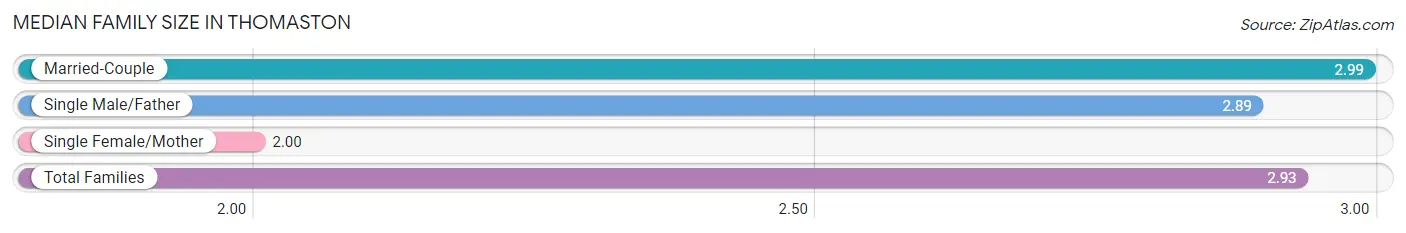
| Family Type | # Families | Family Size |
| Married-Couple | 370 (79.6%) | 2.99 |
| Single Male/Father | 75 (16.1%) | 2.89 |
| Single Female/Mother | 20 (4.3%) | 2.00 |
| Total Families | 465 (100.0%) | 2.93 |
Median Household Size in Thomaston
The median household size in Thomaston is 1.97 persons per household, with single male/father households (75 | 7.1%) accounting for the largest median household size of 3.52 persons per household. non-family households (594 | 56.1%) represent the smallest median household size with 1.13 persons per household.
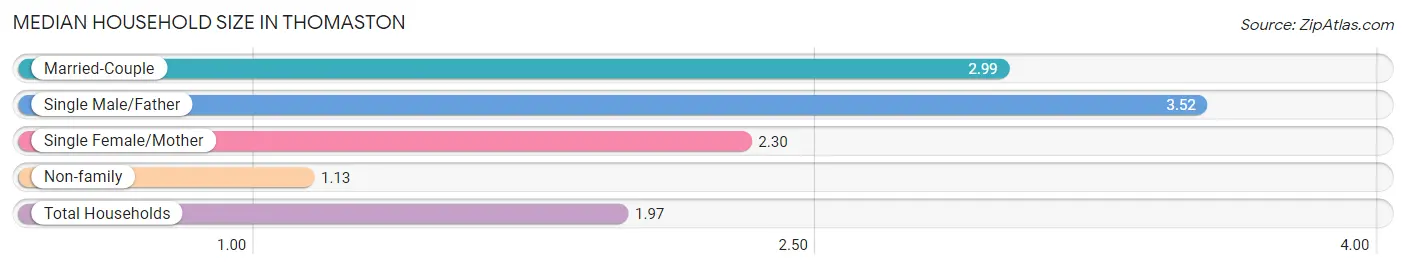
| Household Type | # Households | Household Size |
| Married-Couple | 370 (34.9%) | 2.99 |
| Single Male/Father | 75 (7.1%) | 3.52 |
| Single Female/Mother | 20 (1.9%) | 2.30 |
| Non-family | 594 (56.1%) | 1.13 |
| Total Households | 1,059 (100.0%) | 1.97 |
Household Size by Marriage Status in Thomaston
Out of a total of 1,059 households in Thomaston, 465 (43.9%) are family households, while 594 (56.1%) are nonfamily households. The most numerous type of family households are 2-person households, comprising 290, and the most common type of nonfamily households are 1-person households, comprising 496.
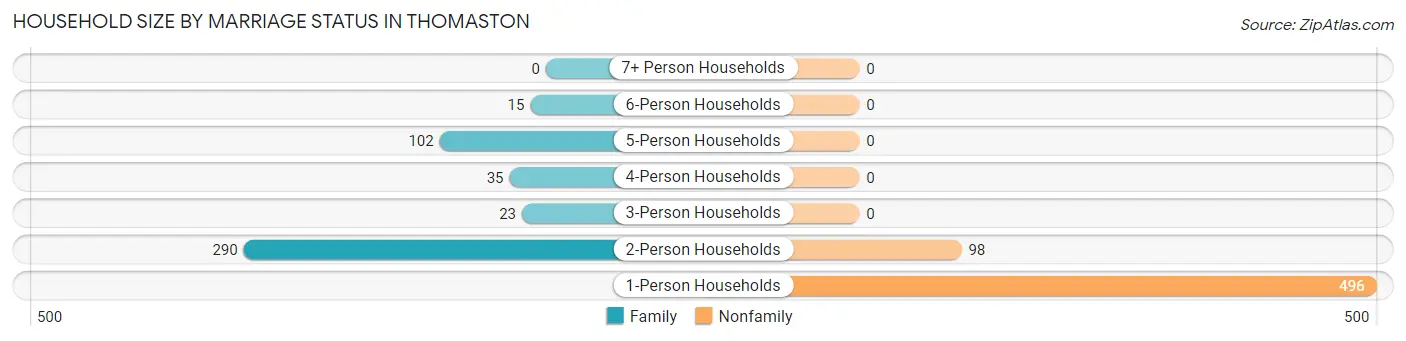
| Household Size | Family Households | Nonfamily Households |
| 1-Person Households | - | 496 (46.8%) |
| 2-Person Households | 290 (27.4%) | 98 (9.2%) |
| 3-Person Households | 23 (2.2%) | 0 (0.0%) |
| 4-Person Households | 35 (3.3%) | 0 (0.0%) |
| 5-Person Households | 102 (9.6%) | 0 (0.0%) |
| 6-Person Households | 15 (1.4%) | 0 (0.0%) |
| 7+ Person Households | 0 (0.0%) | 0 (0.0%) |
| Total | 465 (43.9%) | 594 (56.1%) |
Female Fertility in Thomaston
Fertility by Age in Thomaston
Average fertility rate in Thomaston is 21.0 births per 1,000 women. Women in the age bracket of 35 to 50 years have the highest fertility rate with 41.0 births per 1,000 women. Women in the age bracket of 35 to 50 years acount for 100.0% of all women with births.
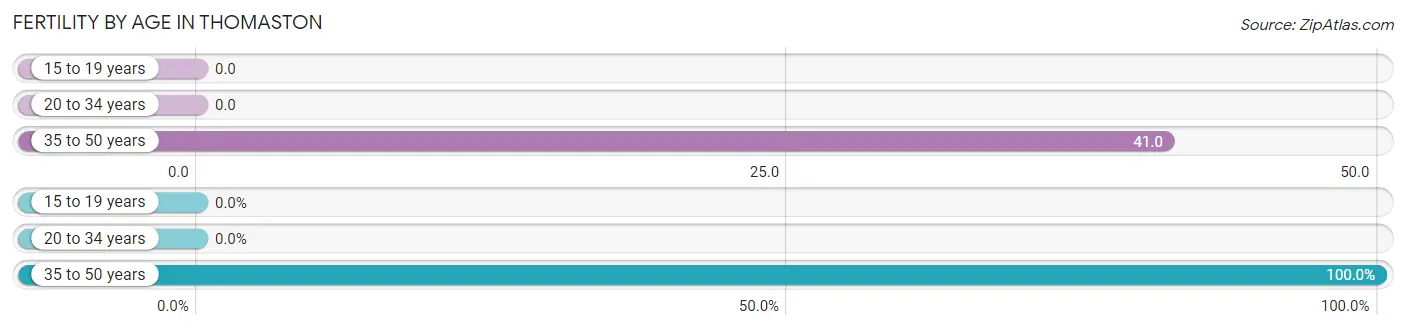
| Age Bracket | Women with Births | Births / 1,000 Women |
| 15 to 19 years | 0 (0.0%) | 0.0 |
| 20 to 34 years | 0 (0.0%) | 0.0 |
| 35 to 50 years | 9 (100.0%) | 41.0 |
| Total | 9 (100.0%) | 21.0 |
Fertility by Age by Marriage Status in Thomaston
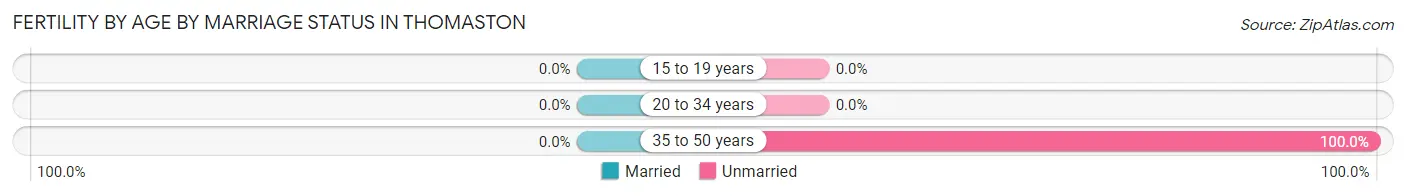
| Age Bracket | Married | Unmarried |
| 15 to 19 years | 0 (0.0%) | 0 (0.0%) |
| 20 to 34 years | 0 (0.0%) | 0 (0.0%) |
| 35 to 50 years | 0 (0.0%) | 9 (100.0%) |
| Total | 0 (0.0%) | 9 (100.0%) |
Fertility by Education in Thomaston
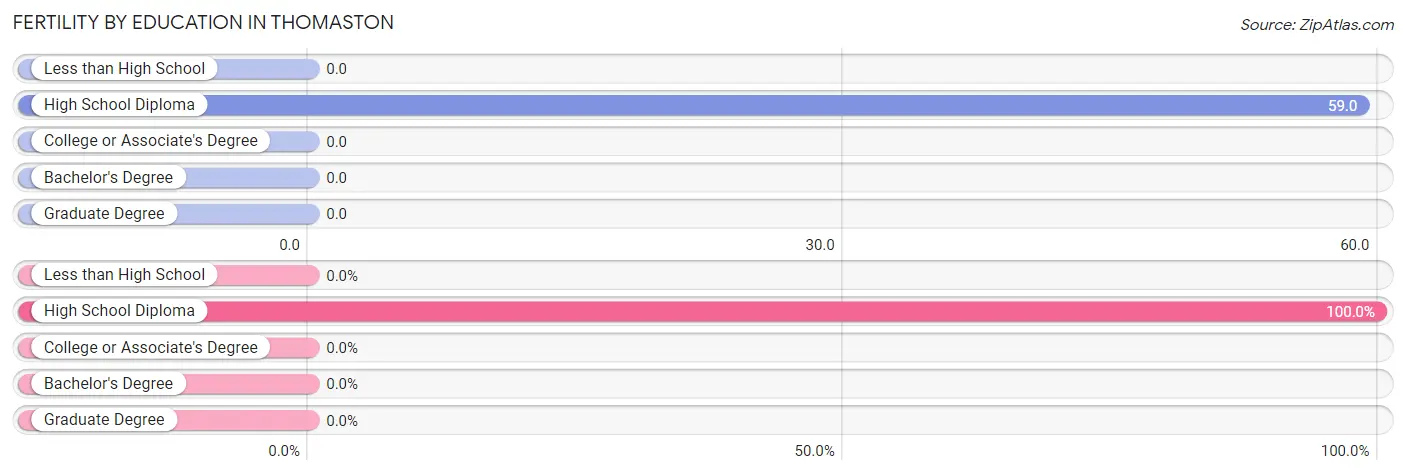
| Educational Attainment | Women with Births | Births / 1,000 Women |
| Less than High School | 0 (0.0%) | 0.0 |
| High School Diploma | 9 (100.0%) | 59.0 |
| College or Associate's Degree | 0 (0.0%) | 0.0 |
| Bachelor's Degree | 0 (0.0%) | 0.0 |
| Graduate Degree | 0 (0.0%) | 0.0 |
| Total | 9 (100.0%) | 21.0 |
Fertility by Education by Marriage Status in Thomaston
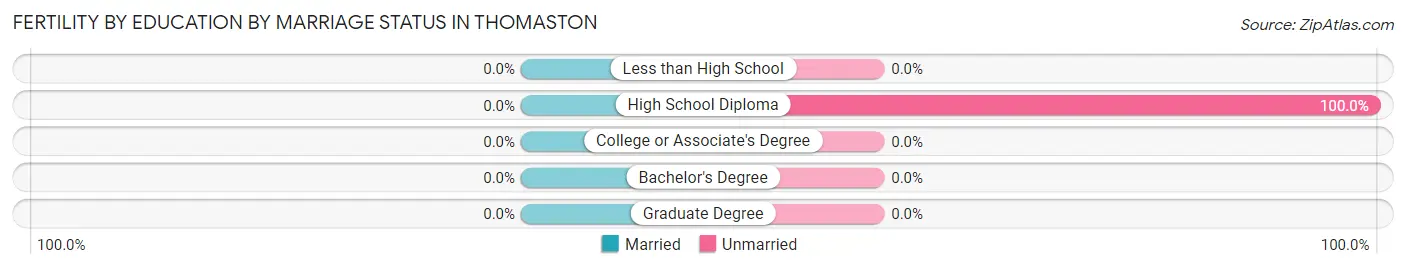
| Educational Attainment | Married | Unmarried |
| Less than High School | 0 (0.0%) | 0 (0.0%) |
| High School Diploma | 0 (0.0%) | 9 (100.0%) |
| College or Associate's Degree | 0 (0.0%) | 0 (0.0%) |
| Bachelor's Degree | 0 (0.0%) | 0 (0.0%) |
| Graduate Degree | 0 (0.0%) | 0 (0.0%) |
| Total | 0 (0.0%) | 9 (100.0%) |
Employment Characteristics in Thomaston
Employment by Class of Employer in Thomaston
Among the 953 employed individuals in Thomaston, private company employees (592 | 62.1%), state government employees (99 | 10.4%), and local government employees (82 | 8.6%) make up the most common classes of employment.
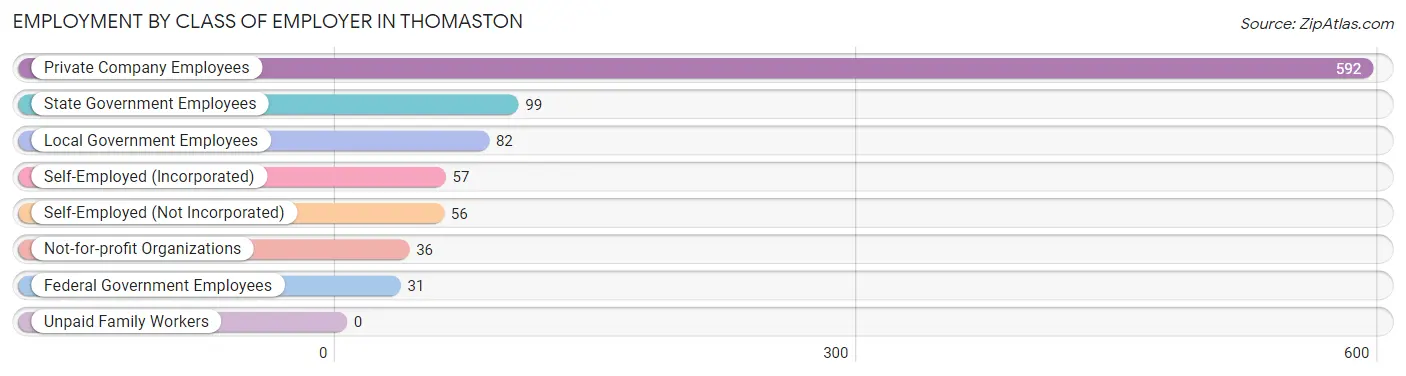
| Employer Class | # Employees | % Employees |
| Private Company Employees | 592 | 62.1% |
| Self-Employed (Incorporated) | 57 | 6.0% |
| Self-Employed (Not Incorporated) | 56 | 5.9% |
| Not-for-profit Organizations | 36 | 3.8% |
| Local Government Employees | 82 | 8.6% |
| State Government Employees | 99 | 10.4% |
| Federal Government Employees | 31 | 3.3% |
| Unpaid Family Workers | 0 | 0.0% |
| Total | 953 | 100.0% |
Employment Status by Age in Thomaston
According to the labor force statistics for Thomaston, out of the total population over 16 years of age (1,686), 60.6% or 1,022 individuals are in the labor force, with 4.9% or 50 of them unemployed. The age group with the highest labor force participation rate is 20 to 24 years, with 100.0% or 173 individuals in the labor force. Within the labor force, the 55 to 59 years age range has the highest percentage of unemployed individuals, with 26.7% or 36 of them being unemployed.
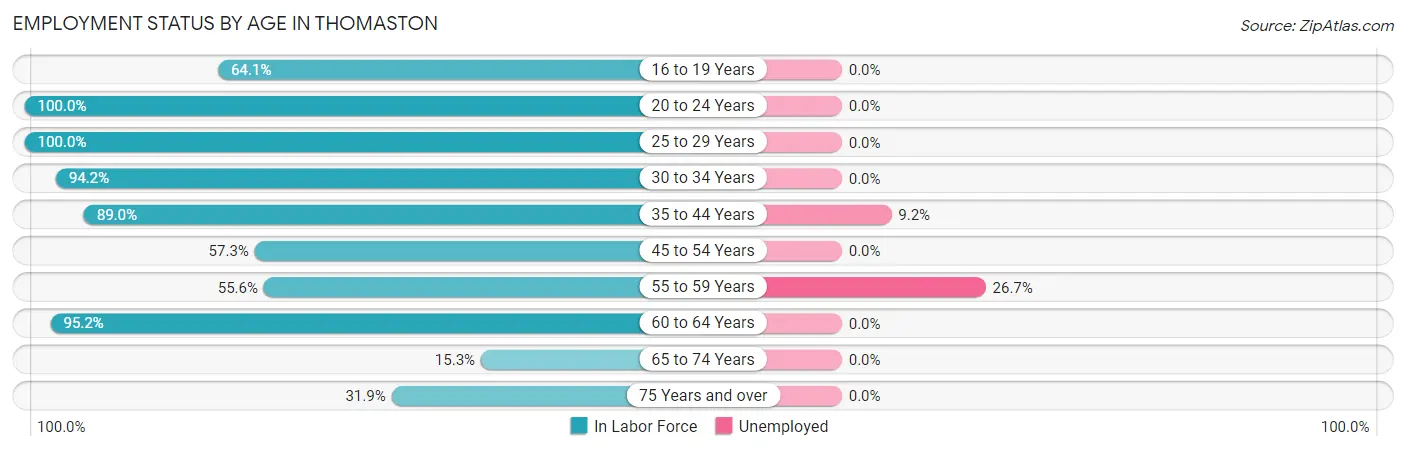
| Age Bracket | In Labor Force | Unemployed |
| 16 to 19 Years | 59 (64.1%) | 0 (0.0%) |
| 20 to 24 Years | 173 (100.0%) | 0 (0.0%) |
| 25 to 29 Years | 39 (100.0%) | 0 (0.0%) |
| 30 to 34 Years | 81 (94.2%) | 0 (0.0%) |
| 35 to 44 Years | 153 (89.0%) | 14 (9.2%) |
| 45 to 54 Years | 185 (57.3%) | 0 (0.0%) |
| 55 to 59 Years | 135 (55.6%) | 36 (26.7%) |
| 60 to 64 Years | 99 (95.2%) | 0 (0.0%) |
| 65 to 74 Years | 44 (15.3%) | 0 (0.0%) |
| 75 Years and over | 53 (31.9%) | 0 (0.0%) |
| Total | 1,022 (60.6%) | 50 (4.9%) |
Employment Status by Educational Attainment in Thomaston
According to labor force statistics for Thomaston, 71.6% of individuals (692) out of the total population between 25 and 64 years of age (967) are in the labor force, with 7.2% or 50 of them being unemployed. The group with the highest labor force participation rate are those with the educational attainment of less than high school, with 100.0% or 16 individuals in the labor force. Within the labor force, individuals with less than high school education have the highest percentage of unemployment, with 100.0% or 16 of them being unemployed.
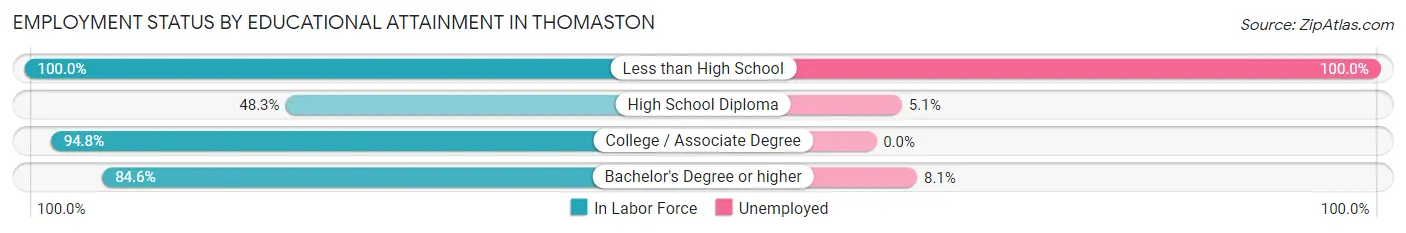
| Educational Attainment | In Labor Force | Unemployed |
| Less than High School | 16 (100.0%) | 16 (100.0%) |
| High School Diploma | 197 (48.3%) | 21 (5.1%) |
| College / Associate Degree | 182 (94.8%) | 0 (0.0%) |
| Bachelor's Degree or higher | 297 (84.6%) | 28 (8.1%) |
| Total | 692 (71.6%) | 70 (7.2%) |
Employment Occupations by Sex in Thomaston
Management, Business, Science and Arts Occupations
The most common Management, Business, Science and Arts occupations in Thomaston are Management (174 | 17.9%), Community & Social Service (110 | 11.3%), Education Instruction & Library (110 | 11.3%), Health Diagnosing & Treating (51 | 5.2%), and Computers, Engineering & Science (37 | 3.8%).
Management, Business, Science and Arts Occupations by Sex
Within the Management, Business, Science and Arts occupations in Thomaston, the most male-oriented occupations are Computers, Engineering & Science (100.0%), Computers & Mathematics (100.0%), and Architecture & Engineering (100.0%), while the most female-oriented occupations are Health Diagnosing & Treating (100.0%), Health Technologists (100.0%), and Community & Social Service (60.0%).
| Occupation | Male | Female |
| Management | 95 (54.6%) | 79 (45.4%) |
| Business & Financial | 17 (68.0%) | 8 (32.0%) |
| Computers, Engineering & Science | 37 (100.0%) | 0 (0.0%) |
| Computers & Mathematics | 18 (100.0%) | 0 (0.0%) |
| Architecture & Engineering | 19 (100.0%) | 0 (0.0%) |
| Life, Physical & Social Science | 0 (0.0%) | 0 (0.0%) |
| Community & Social Service | 44 (40.0%) | 66 (60.0%) |
| Education, Arts & Media | 0 (0.0%) | 0 (0.0%) |
| Legal Services & Support | 0 (0.0%) | 0 (0.0%) |
| Education Instruction & Library | 44 (40.0%) | 66 (60.0%) |
| Arts, Media & Entertainment | 0 (0.0%) | 0 (0.0%) |
| Health Diagnosing & Treating | 0 (0.0%) | 51 (100.0%) |
| Health Technologists | 0 (0.0%) | 20 (100.0%) |
| Total (Category) | 193 (48.6%) | 204 (51.4%) |
| Total (Overall) | 540 (55.6%) | 431 (44.4%) |
Services Occupations
The most common Services occupations in Thomaston are Food Preparation & Serving (28 | 2.9%), Cleaning & Maintenance (8 | 0.8%), and Personal Care & Service (6 | 0.6%).
Services Occupations by Sex
| Occupation | Male | Female |
| Healthcare Support | 0 (0.0%) | 0 (0.0%) |
| Security & Protection | 0 (0.0%) | 0 (0.0%) |
| Firefighting & Prevention | 0 (0.0%) | 0 (0.0%) |
| Law Enforcement | 0 (0.0%) | 0 (0.0%) |
| Food Preparation & Serving | 28 (100.0%) | 0 (0.0%) |
| Cleaning & Maintenance | 0 (0.0%) | 8 (100.0%) |
| Personal Care & Service | 0 (0.0%) | 6 (100.0%) |
| Total (Category) | 28 (66.7%) | 14 (33.3%) |
| Total (Overall) | 540 (55.6%) | 431 (44.4%) |
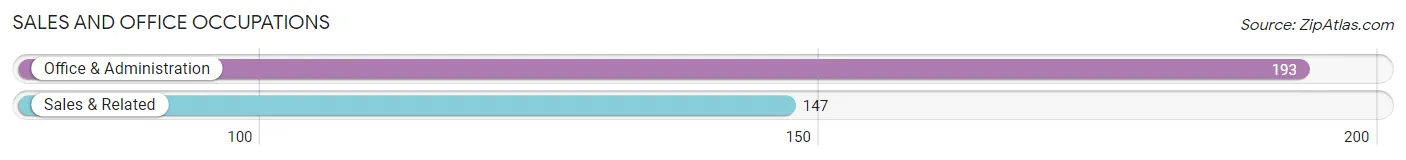
Sales and Office Occupations
The most common Sales and Office occupations in Thomaston are Office & Administration (193 | 19.9%), and Sales & Related (147 | 15.1%).
Sales and Office Occupations by Sex
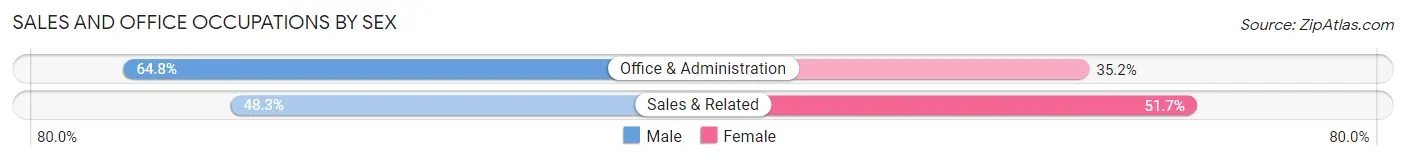
| Occupation | Male | Female |
| Sales & Related | 71 (48.3%) | 76 (51.7%) |
| Office & Administration | 125 (64.8%) | 68 (35.2%) |
| Total (Category) | 196 (57.7%) | 144 (42.3%) |
| Total (Overall) | 540 (55.6%) | 431 (44.4%) |
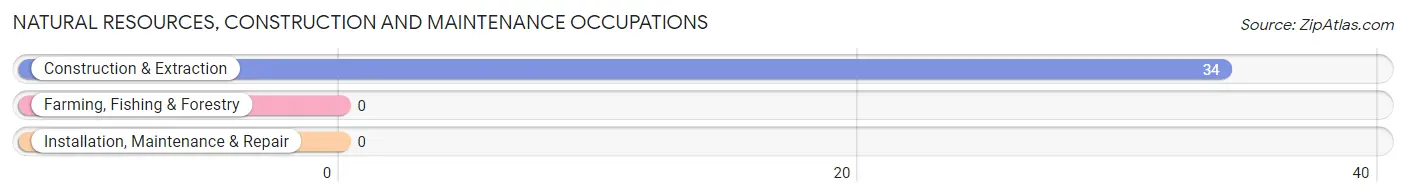
Natural Resources, Construction and Maintenance Occupations
The most common Natural Resources, Construction and Maintenance occupations in Thomaston are , and Construction & Extraction (34 | 3.5%).
Natural Resources, Construction and Maintenance Occupations by Sex
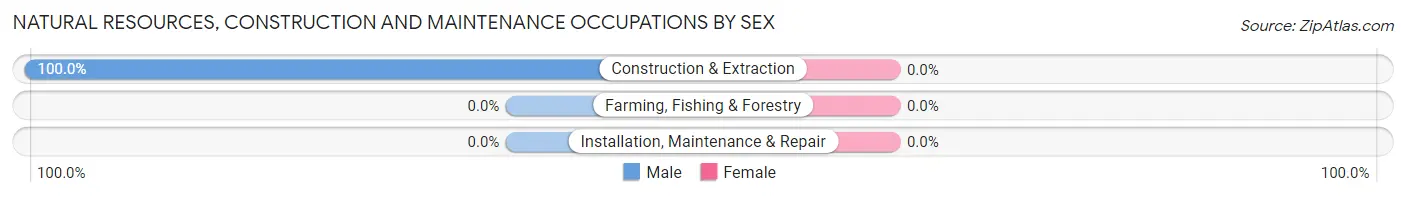
| Occupation | Male | Female |
| Farming, Fishing & Forestry | 0 (0.0%) | 0 (0.0%) |
| Construction & Extraction | 34 (100.0%) | 0 (0.0%) |
| Installation, Maintenance & Repair | 0 (0.0%) | 0 (0.0%) |
| Total (Category) | 34 (100.0%) | 0 (0.0%) |
| Total (Overall) | 540 (55.6%) | 431 (44.4%) |
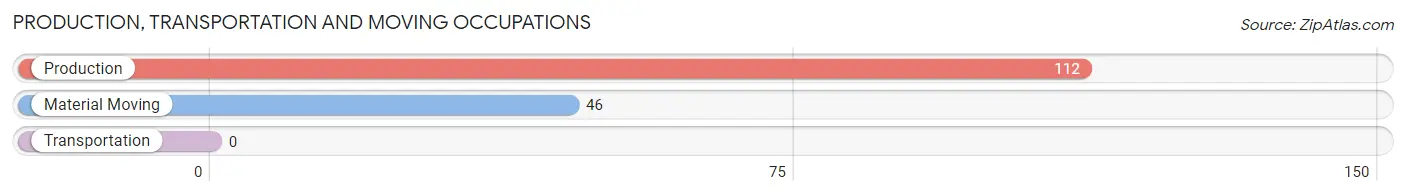
Production, Transportation and Moving Occupations
The most common Production, Transportation and Moving occupations in Thomaston are Production (112 | 11.5%), and Material Moving (46 | 4.7%).
Production, Transportation and Moving Occupations by Sex
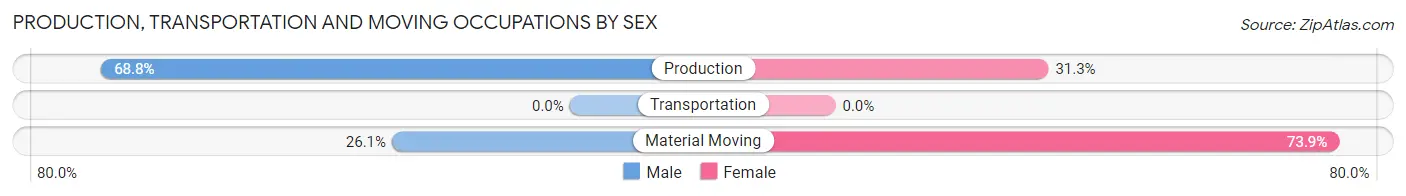
| Occupation | Male | Female |
| Production | 77 (68.8%) | 35 (31.2%) |
| Transportation | 0 (0.0%) | 0 (0.0%) |
| Material Moving | 12 (26.1%) | 34 (73.9%) |
| Total (Category) | 89 (56.3%) | 69 (43.7%) |
| Total (Overall) | 540 (55.6%) | 431 (44.4%) |
Employment Industries by Sex in Thomaston
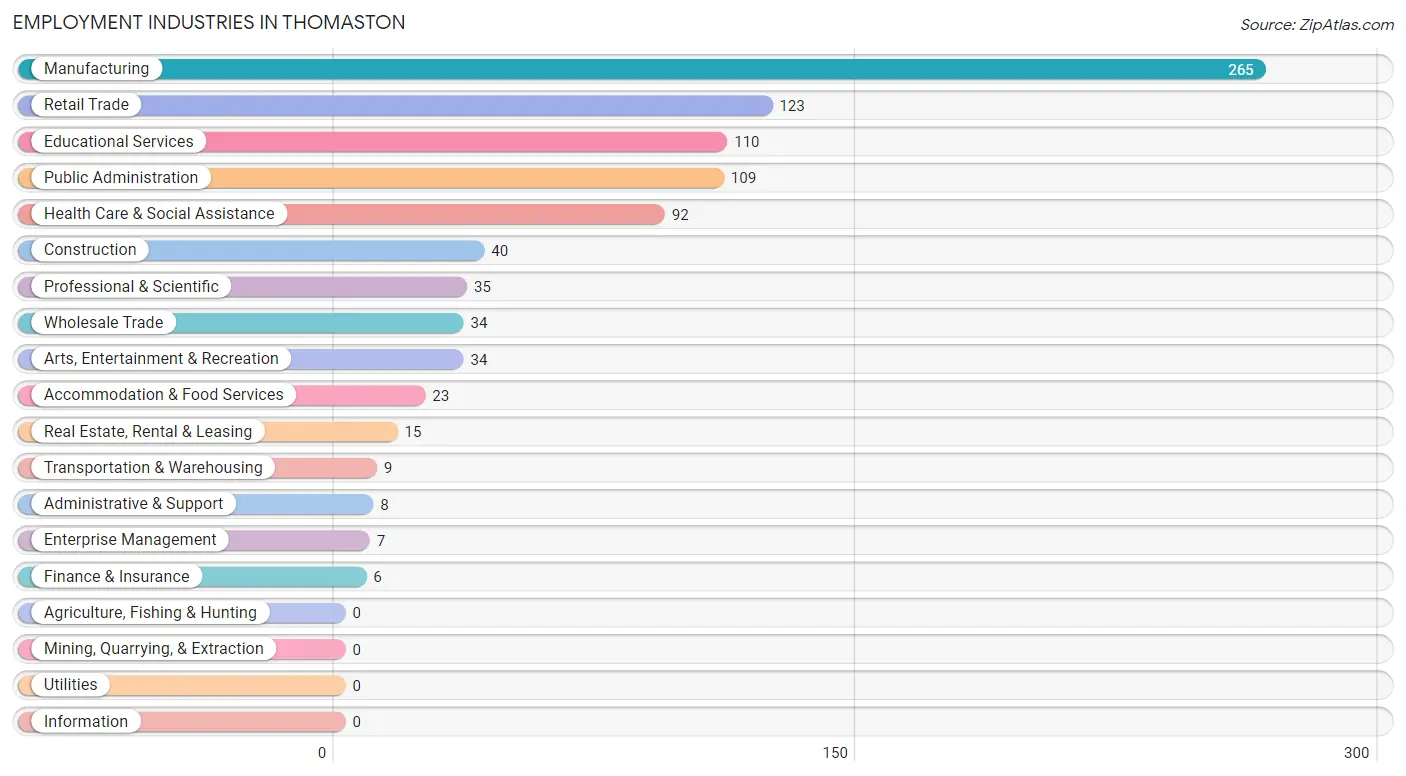
Employment Industries in Thomaston
The major employment industries in Thomaston include Manufacturing (265 | 27.3%), Retail Trade (123 | 12.7%), Educational Services (110 | 11.3%), Public Administration (109 | 11.2%), and Health Care & Social Assistance (92 | 9.5%).
Employment Industries by Sex in Thomaston
The Thomaston industries that see more men than women are Construction (100.0%), Transportation & Warehousing (100.0%), and Real Estate, Rental & Leasing (100.0%), whereas the industries that tend to have a higher number of women are Wholesale Trade (100.0%), Finance & Insurance (100.0%), and Health Care & Social Assistance (100.0%).
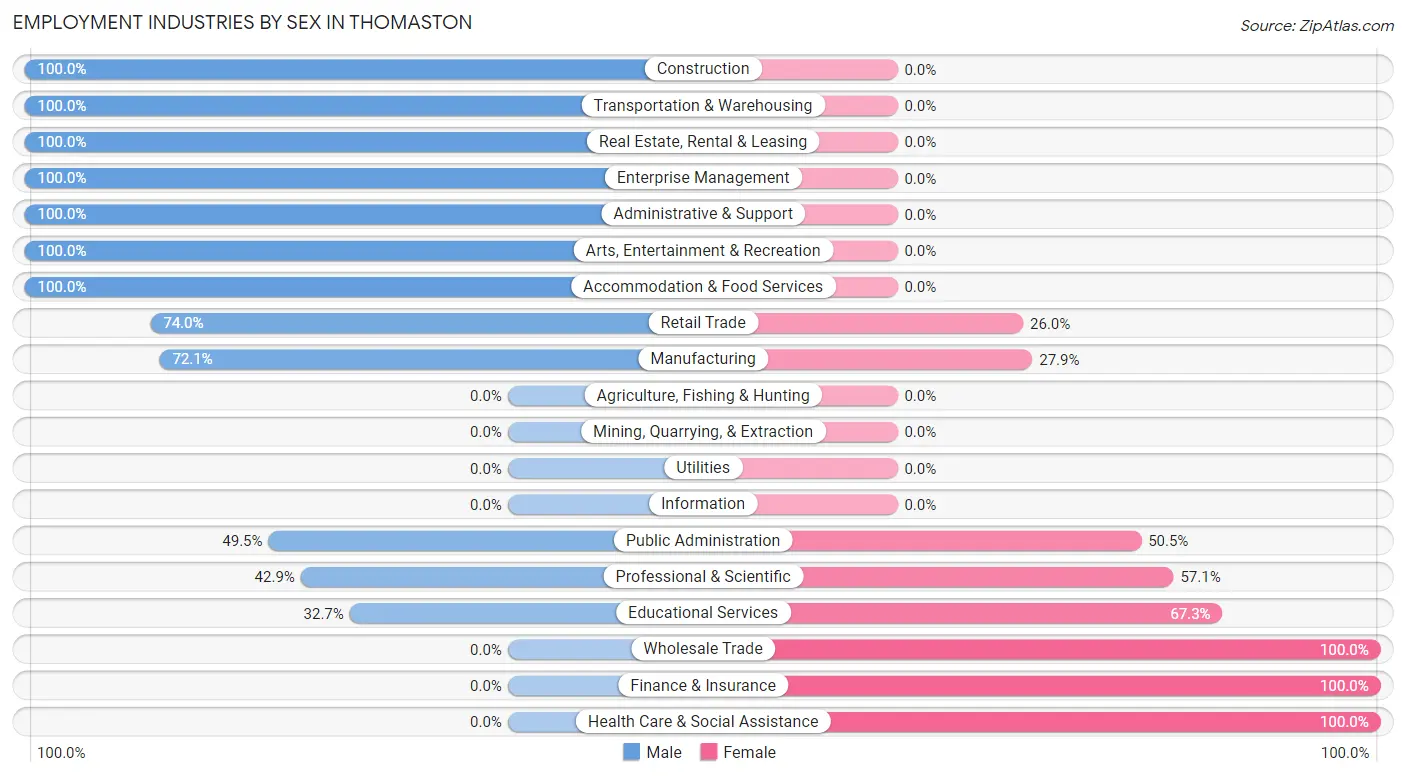
| Industry | Male | Female |
| Agriculture, Fishing & Hunting | 0 (0.0%) | 0 (0.0%) |
| Mining, Quarrying, & Extraction | 0 (0.0%) | 0 (0.0%) |
| Construction | 40 (100.0%) | 0 (0.0%) |
| Manufacturing | 191 (72.1%) | 74 (27.9%) |
| Wholesale Trade | 0 (0.0%) | 34 (100.0%) |
| Retail Trade | 91 (74.0%) | 32 (26.0%) |
| Transportation & Warehousing | 9 (100.0%) | 0 (0.0%) |
| Utilities | 0 (0.0%) | 0 (0.0%) |
| Information | 0 (0.0%) | 0 (0.0%) |
| Finance & Insurance | 0 (0.0%) | 6 (100.0%) |
| Real Estate, Rental & Leasing | 15 (100.0%) | 0 (0.0%) |
| Professional & Scientific | 15 (42.9%) | 20 (57.1%) |
| Enterprise Management | 7 (100.0%) | 0 (0.0%) |
| Administrative & Support | 8 (100.0%) | 0 (0.0%) |
| Educational Services | 36 (32.7%) | 74 (67.3%) |
| Health Care & Social Assistance | 0 (0.0%) | 92 (100.0%) |
| Arts, Entertainment & Recreation | 34 (100.0%) | 0 (0.0%) |
| Accommodation & Food Services | 23 (100.0%) | 0 (0.0%) |
| Public Administration | 54 (49.5%) | 55 (50.5%) |
| Total | 540 (55.6%) | 431 (44.4%) |
Education in Thomaston
School Enrollment in Thomaston
The most common levels of schooling among the 436 students in Thomaston are elementary school (120 | 27.5%), middle school (100 | 22.9%), and high school (73 | 16.7%).
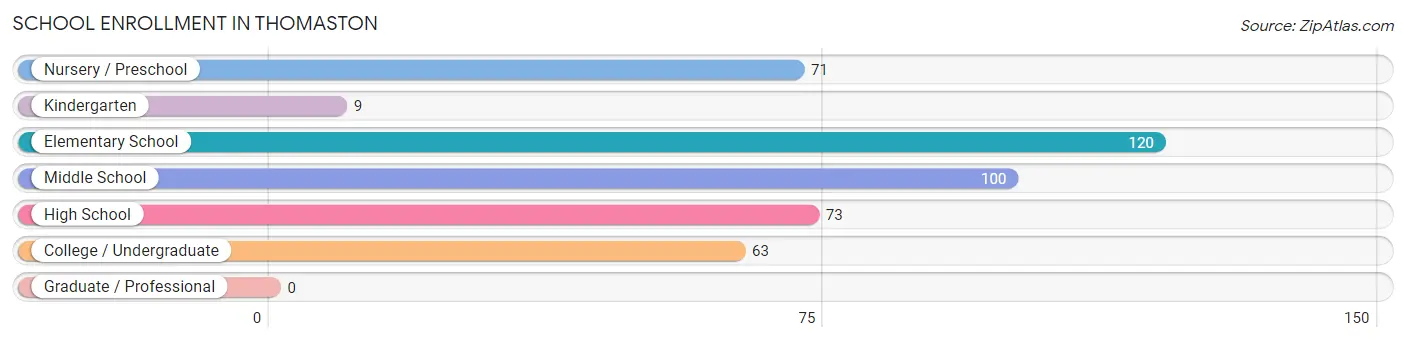
| School Level | # Students | % Students |
| Nursery / Preschool | 71 | 16.3% |
| Kindergarten | 9 | 2.1% |
| Elementary School | 120 | 27.5% |
| Middle School | 100 | 22.9% |
| High School | 73 | 16.7% |
| College / Undergraduate | 63 | 14.4% |
| Graduate / Professional | 0 | 0.0% |
| Total | 436 | 100.0% |
School Enrollment by Age by Funding Source in Thomaston
Out of a total of 436 students who are enrolled in schools in Thomaston, 91 (20.9%) attend a private institution, while the remaining 345 (79.1%) are enrolled in public schools. The age group of 15 to 17 year olds has the highest likelihood of being enrolled in private schools, with 31 (73.8% in the age bracket) enrolled. Conversely, the age group of 5 to 9 year old has the lowest likelihood of being enrolled in a private school, with 110 (100.0% in the age bracket) attending a public institution.
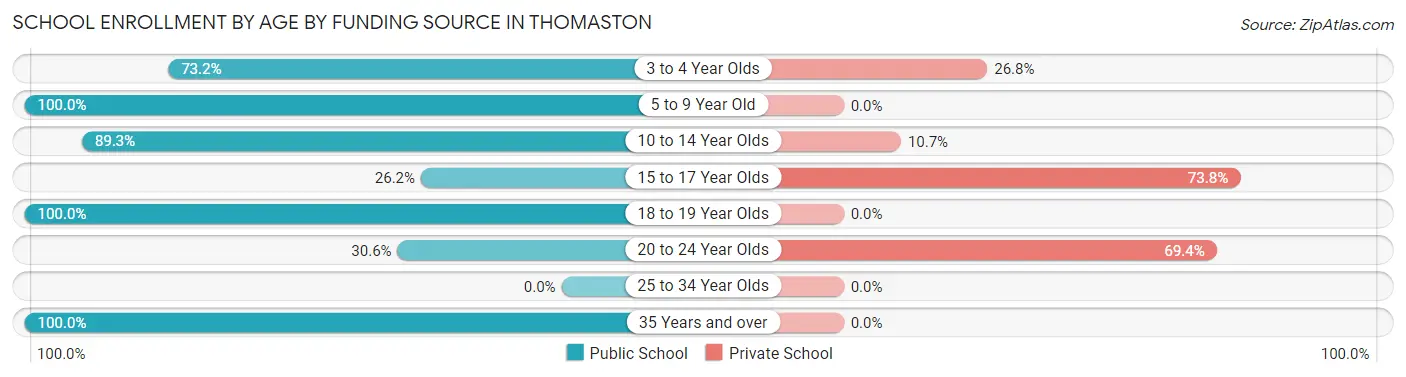
| Age Bracket | Public School | Private School |
| 3 to 4 Year Olds | 52 (73.2%) | 19 (26.8%) |
| 5 to 9 Year Old | 110 (100.0%) | 0 (0.0%) |
| 10 to 14 Year Olds | 134 (89.3%) | 16 (10.7%) |
| 15 to 17 Year Olds | 11 (26.2%) | 31 (73.8%) |
| 18 to 19 Year Olds | 17 (100.0%) | 0 (0.0%) |
| 20 to 24 Year Olds | 11 (30.6%) | 25 (69.4%) |
| 25 to 34 Year Olds | 0 (0.0%) | 0 (0.0%) |
| 35 Years and over | 10 (100.0%) | 0 (0.0%) |
| Total | 345 (79.1%) | 91 (20.9%) |
Educational Attainment by Field of Study in Thomaston
Business (120 | 27.9%), education (68 | 15.8%), science & technology (62 | 14.4%), bio, nature & agricultural (44 | 10.2%), and liberal arts & history (40 | 9.3%) are the most common fields of study among 430 individuals in Thomaston who have obtained a bachelor's degree or higher.
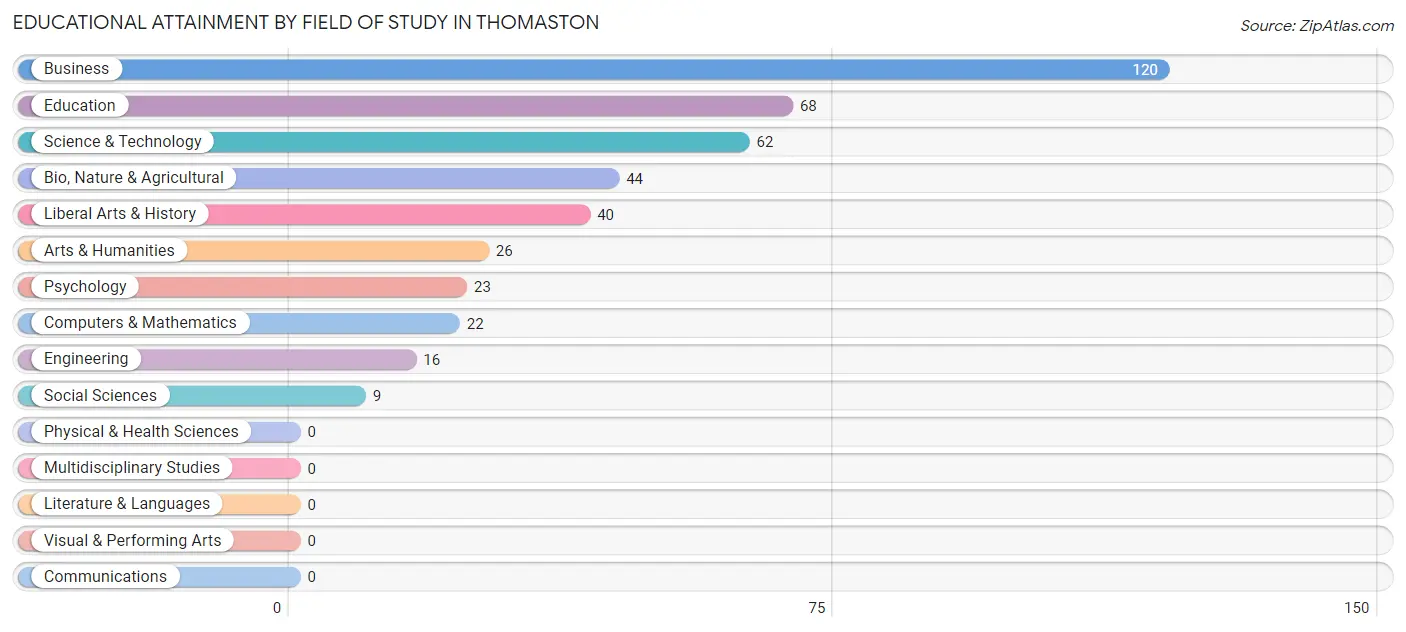
| Field of Study | # Graduates | % Graduates |
| Computers & Mathematics | 22 | 5.1% |
| Bio, Nature & Agricultural | 44 | 10.2% |
| Physical & Health Sciences | 0 | 0.0% |
| Psychology | 23 | 5.3% |
| Social Sciences | 9 | 2.1% |
| Engineering | 16 | 3.7% |
| Multidisciplinary Studies | 0 | 0.0% |
| Science & Technology | 62 | 14.4% |
| Business | 120 | 27.9% |
| Education | 68 | 15.8% |
| Literature & Languages | 0 | 0.0% |
| Liberal Arts & History | 40 | 9.3% |
| Visual & Performing Arts | 0 | 0.0% |
| Communications | 0 | 0.0% |
| Arts & Humanities | 26 | 6.0% |
| Total | 430 | 100.0% |
Transportation & Commute in Thomaston
Vehicle Availability by Sex in Thomaston
The most prevalent vehicle ownership categories in Thomaston are males with 2 vehicles (340, accounting for 65.1%) and females with 2 vehicles (215, making up 78.9%).
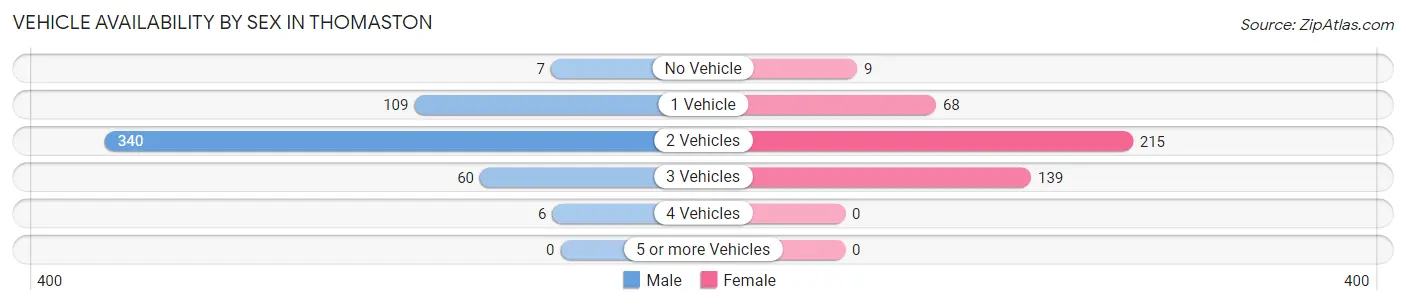
| Vehicles Available | Male | Female |
| No Vehicle | 7 (1.3%) | 9 (2.1%) |
| 1 Vehicle | 109 (20.9%) | 68 (15.8%) |
| 2 Vehicles | 340 (65.1%) | 215 (49.9%) |
| 3 Vehicles | 60 (11.5%) | 139 (32.3%) |
| 4 Vehicles | 6 (1.1%) | 0 (0.0%) |
| 5 or more Vehicles | 0 (0.0%) | 0 (0.0%) |
| Total | 522 (100.0%) | 431 (100.0%) |
Commute Time in Thomaston
The most frequently occuring commute durations in Thomaston are 15 to 19 minutes (212 commuters, 24.0%), 20 to 24 minutes (182 commuters, 20.6%), and 10 to 14 minutes (128 commuters, 14.5%).
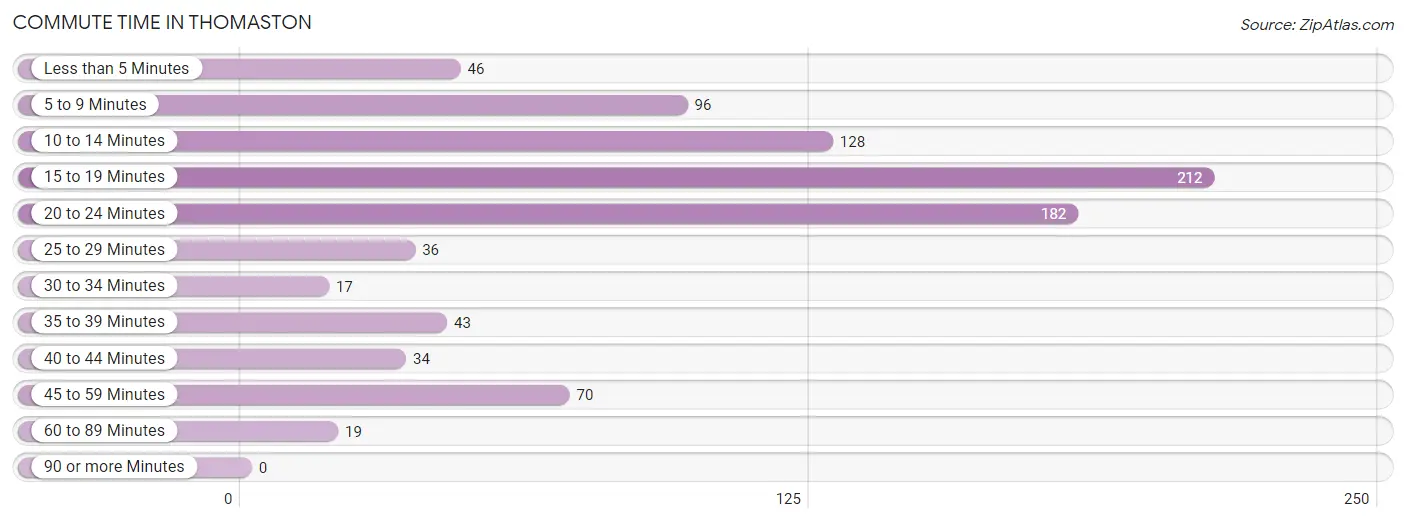
| Commute Time | # Commuters | % Commuters |
| Less than 5 Minutes | 46 | 5.2% |
| 5 to 9 Minutes | 96 | 10.9% |
| 10 to 14 Minutes | 128 | 14.5% |
| 15 to 19 Minutes | 212 | 24.0% |
| 20 to 24 Minutes | 182 | 20.6% |
| 25 to 29 Minutes | 36 | 4.1% |
| 30 to 34 Minutes | 17 | 1.9% |
| 35 to 39 Minutes | 43 | 4.9% |
| 40 to 44 Minutes | 34 | 3.8% |
| 45 to 59 Minutes | 70 | 7.9% |
| 60 to 89 Minutes | 19 | 2.1% |
| 90 or more Minutes | 0 | 0.0% |
Commute Time by Sex in Thomaston
The most common commute times in Thomaston are 15 to 19 minutes (118 commuters, 25.1%) for males and 20 to 24 minutes (100 commuters, 24.2%) for females.
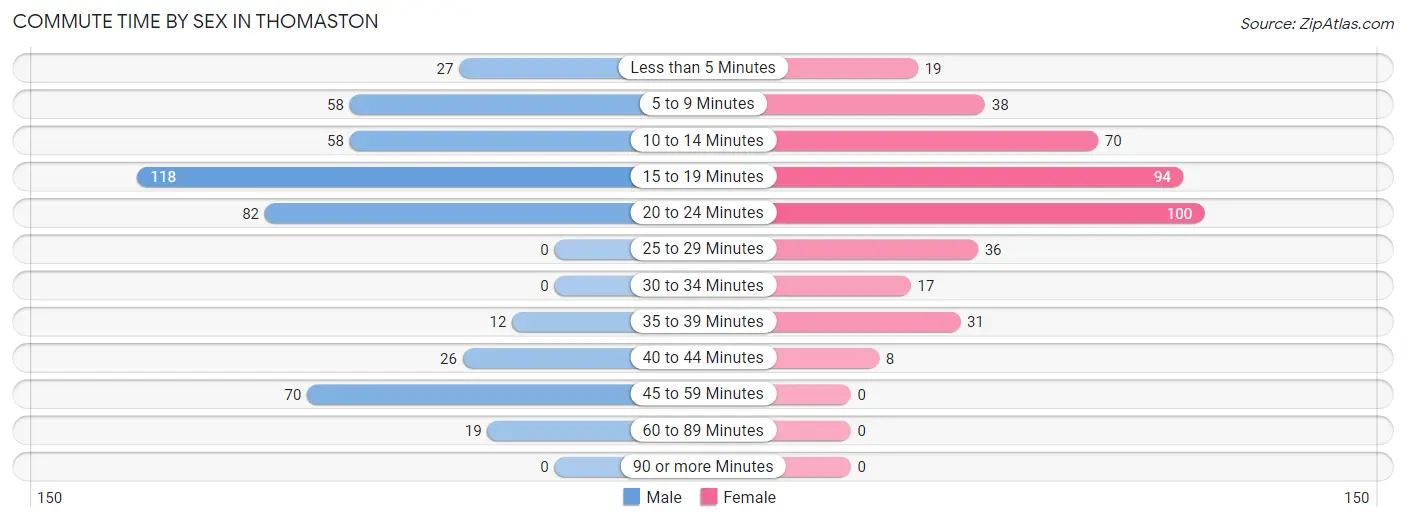
| Commute Time | Male | Female |
| Less than 5 Minutes | 27 (5.7%) | 19 (4.6%) |
| 5 to 9 Minutes | 58 (12.3%) | 38 (9.2%) |
| 10 to 14 Minutes | 58 (12.3%) | 70 (17.0%) |
| 15 to 19 Minutes | 118 (25.1%) | 94 (22.8%) |
| 20 to 24 Minutes | 82 (17.4%) | 100 (24.2%) |
| 25 to 29 Minutes | 0 (0.0%) | 36 (8.7%) |
| 30 to 34 Minutes | 0 (0.0%) | 17 (4.1%) |
| 35 to 39 Minutes | 12 (2.5%) | 31 (7.5%) |
| 40 to 44 Minutes | 26 (5.5%) | 8 (1.9%) |
| 45 to 59 Minutes | 70 (14.9%) | 0 (0.0%) |
| 60 to 89 Minutes | 19 (4.0%) | 0 (0.0%) |
| 90 or more Minutes | 0 (0.0%) | 0 (0.0%) |
Time of Departure to Work by Sex in Thomaston
The most frequent times of departure to work in Thomaston are 7:30 AM to 7:59 AM (118, 25.1%) for males and 7:30 AM to 7:59 AM (200, 48.4%) for females.
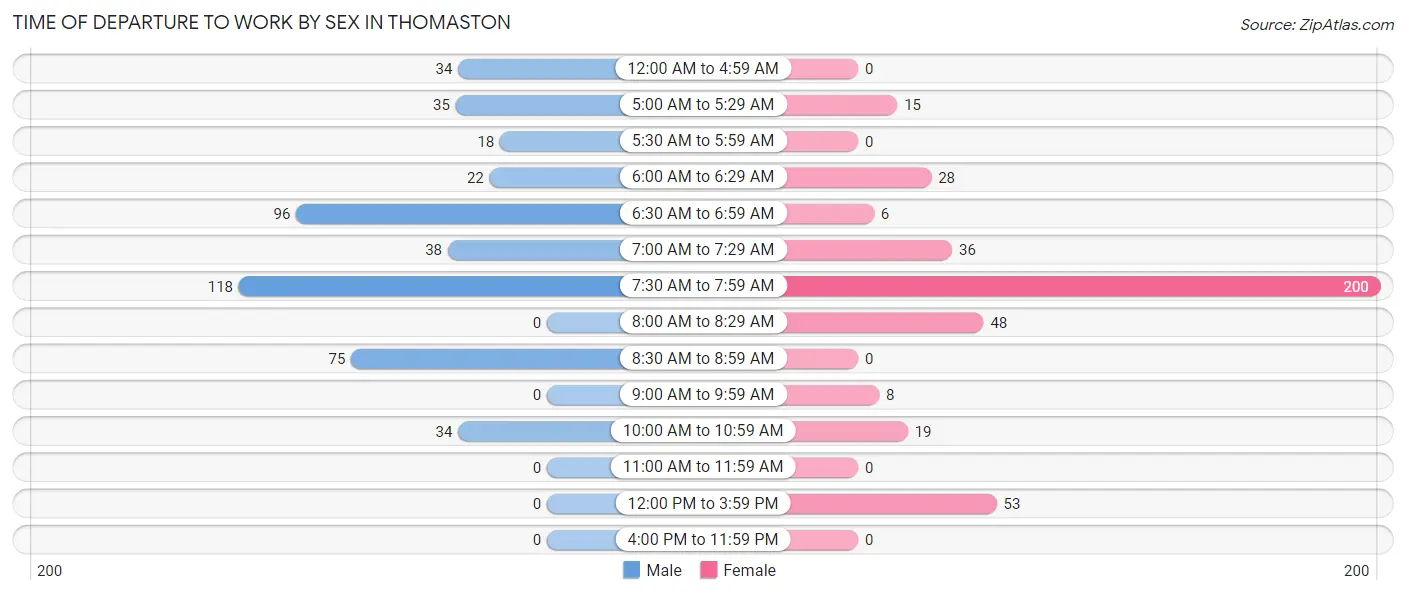
| Time of Departure | Male | Female |
| 12:00 AM to 4:59 AM | 34 (7.2%) | 0 (0.0%) |
| 5:00 AM to 5:29 AM | 35 (7.4%) | 15 (3.6%) |
| 5:30 AM to 5:59 AM | 18 (3.8%) | 0 (0.0%) |
| 6:00 AM to 6:29 AM | 22 (4.7%) | 28 (6.8%) |
| 6:30 AM to 6:59 AM | 96 (20.4%) | 6 (1.5%) |
| 7:00 AM to 7:29 AM | 38 (8.1%) | 36 (8.7%) |
| 7:30 AM to 7:59 AM | 118 (25.1%) | 200 (48.4%) |
| 8:00 AM to 8:29 AM | 0 (0.0%) | 48 (11.6%) |
| 8:30 AM to 8:59 AM | 75 (16.0%) | 0 (0.0%) |
| 9:00 AM to 9:59 AM | 0 (0.0%) | 8 (1.9%) |
| 10:00 AM to 10:59 AM | 34 (7.2%) | 19 (4.6%) |
| 11:00 AM to 11:59 AM | 0 (0.0%) | 0 (0.0%) |
| 12:00 PM to 3:59 PM | 0 (0.0%) | 53 (12.8%) |
| 4:00 PM to 11:59 PM | 0 (0.0%) | 0 (0.0%) |
| Total | 470 (100.0%) | 413 (100.0%) |
Housing Occupancy in Thomaston
Occupancy by Ownership in Thomaston
Of the total 1,059 dwellings in Thomaston, owner-occupied units account for 598 (56.5%), while renter-occupied units make up 461 (43.5%).
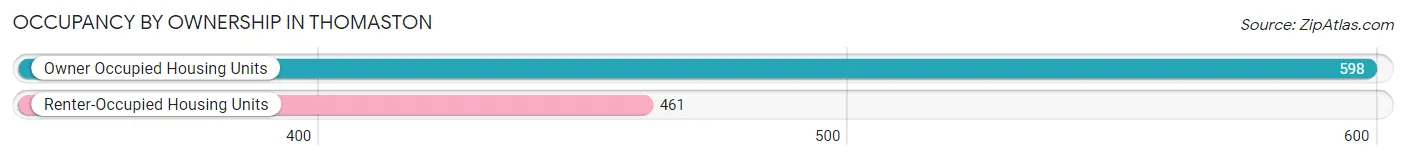
| Occupancy | # Housing Units | % Housing Units |
| Owner Occupied Housing Units | 598 | 56.5% |
| Renter-Occupied Housing Units | 461 | 43.5% |
| Total Occupied Housing Units | 1,059 | 100.0% |
Occupancy by Household Size in Thomaston
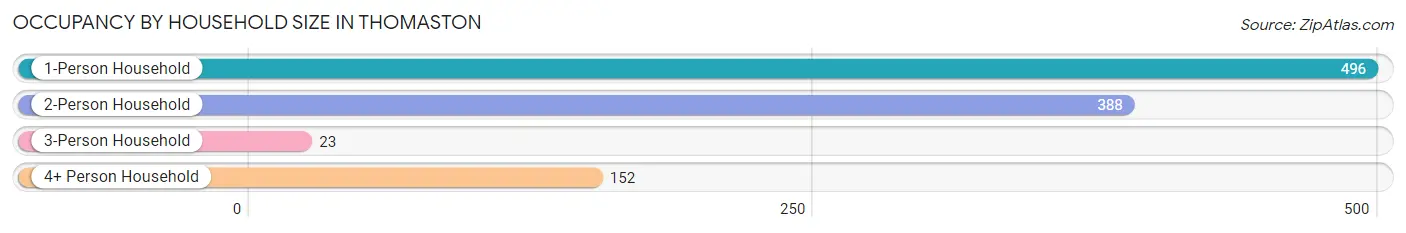
| Household Size | # Housing Units | % Housing Units |
| 1-Person Household | 496 | 46.8% |
| 2-Person Household | 388 | 36.6% |
| 3-Person Household | 23 | 2.2% |
| 4+ Person Household | 152 | 14.3% |
| Total Housing Units | 1,059 | 100.0% |
Occupancy by Ownership by Household Size in Thomaston
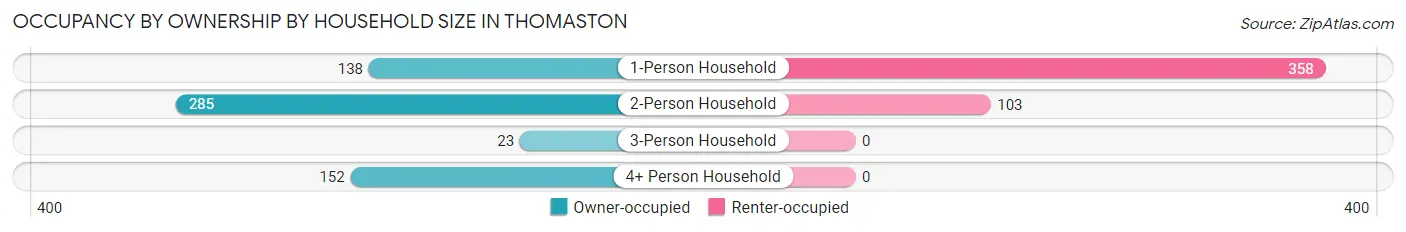
| Household Size | Owner-occupied | Renter-occupied |
| 1-Person Household | 138 (27.8%) | 358 (72.2%) |
| 2-Person Household | 285 (73.5%) | 103 (26.6%) |
| 3-Person Household | 23 (100.0%) | 0 (0.0%) |
| 4+ Person Household | 152 (100.0%) | 0 (0.0%) |
| Total Housing Units | 598 (56.5%) | 461 (43.5%) |
Occupancy by Educational Attainment in Thomaston
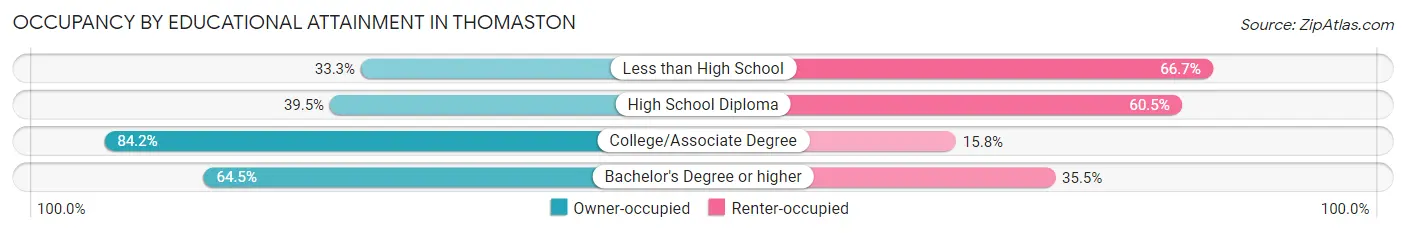
| Household Size | Owner-occupied | Renter-occupied |
| Less than High School | 12 (33.3%) | 24 (66.7%) |
| High School Diploma | 189 (39.5%) | 290 (60.5%) |
| College/Associate Degree | 197 (84.2%) | 37 (15.8%) |
| Bachelor's Degree or higher | 200 (64.5%) | 110 (35.5%) |
Occupancy by Age of Householder in Thomaston
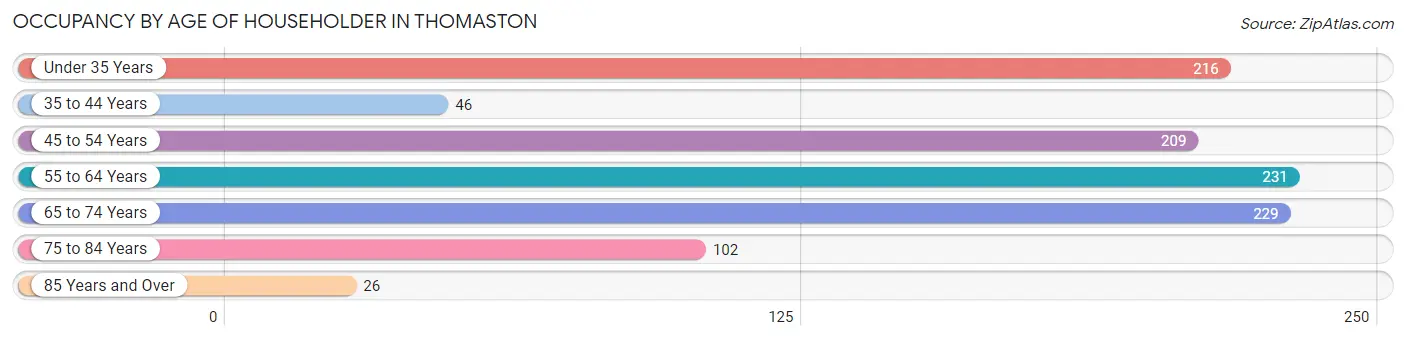
| Age Bracket | # Households | % Households |
| Under 35 Years | 216 | 20.4% |
| 35 to 44 Years | 46 | 4.3% |
| 45 to 54 Years | 209 | 19.7% |
| 55 to 64 Years | 231 | 21.8% |
| 65 to 74 Years | 229 | 21.6% |
| 75 to 84 Years | 102 | 9.6% |
| 85 Years and Over | 26 | 2.5% |
| Total | 1,059 | 100.0% |
Housing Finances in Thomaston
Median Income by Occupancy in Thomaston
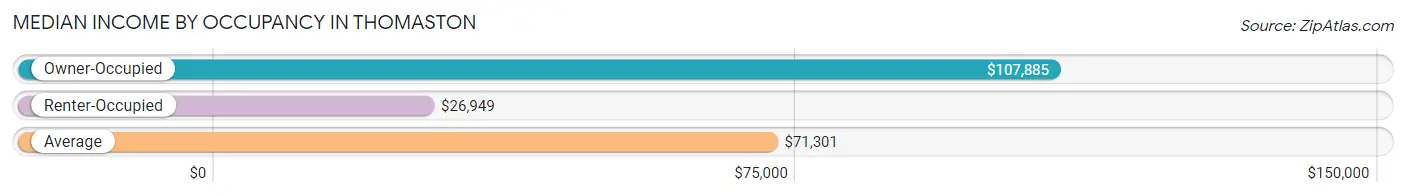
| Occupancy Type | # Households | Median Income |
| Owner-Occupied | 598 (56.5%) | $107,885 |
| Renter-Occupied | 461 (43.5%) | $26,949 |
| Average | 1,059 (100.0%) | $71,301 |
Occupancy by Householder Income Bracket in Thomaston
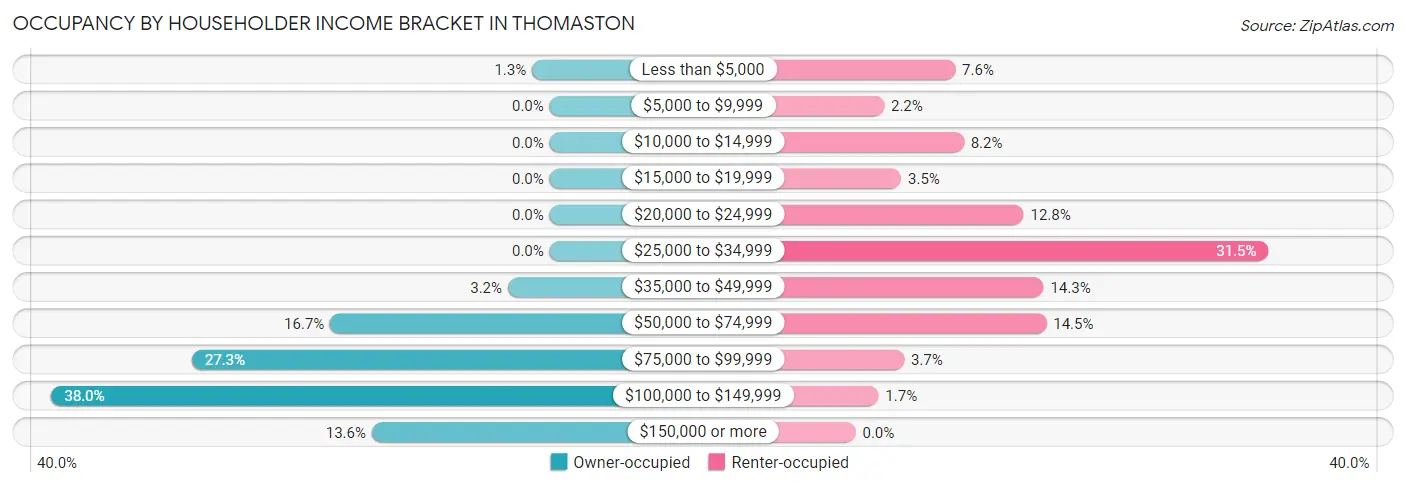
| Income Bracket | Owner-occupied | Renter-occupied |
| Less than $5,000 | 8 (1.3%) | 35 (7.6%) |
| $5,000 to $9,999 | 0 (0.0%) | 10 (2.2%) |
| $10,000 to $14,999 | 0 (0.0%) | 38 (8.2%) |
| $15,000 to $19,999 | 0 (0.0%) | 16 (3.5%) |
| $20,000 to $24,999 | 0 (0.0%) | 59 (12.8%) |
| $25,000 to $34,999 | 0 (0.0%) | 145 (31.5%) |
| $35,000 to $49,999 | 19 (3.2%) | 66 (14.3%) |
| $50,000 to $74,999 | 100 (16.7%) | 67 (14.5%) |
| $75,000 to $99,999 | 163 (27.3%) | 17 (3.7%) |
| $100,000 to $149,999 | 227 (38.0%) | 8 (1.7%) |
| $150,000 or more | 81 (13.6%) | 0 (0.0%) |
| Total | 598 (100.0%) | 461 (100.0%) |
Monthly Housing Cost Tiers in Thomaston
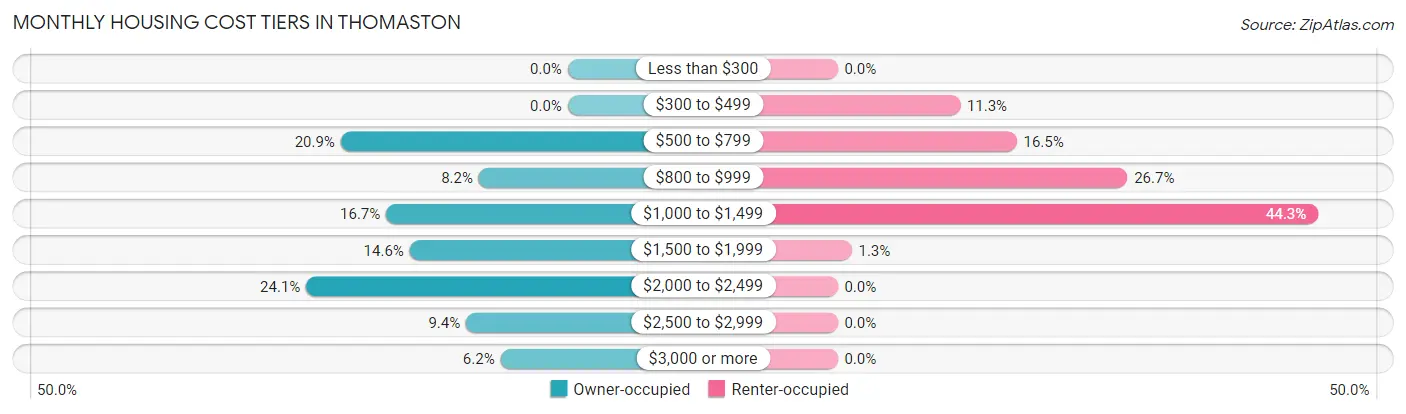
| Monthly Cost | Owner-occupied | Renter-occupied |
| Less than $300 | 0 (0.0%) | 0 (0.0%) |
| $300 to $499 | 0 (0.0%) | 52 (11.3%) |
| $500 to $799 | 125 (20.9%) | 76 (16.5%) |
| $800 to $999 | 49 (8.2%) | 123 (26.7%) |
| $1,000 to $1,499 | 100 (16.7%) | 204 (44.3%) |
| $1,500 to $1,999 | 87 (14.5%) | 6 (1.3%) |
| $2,000 to $2,499 | 144 (24.1%) | 0 (0.0%) |
| $2,500 to $2,999 | 56 (9.4%) | 0 (0.0%) |
| $3,000 or more | 37 (6.2%) | 0 (0.0%) |
| Total | 598 (100.0%) | 461 (100.0%) |
Physical Housing Characteristics in Thomaston
Housing Structures in Thomaston
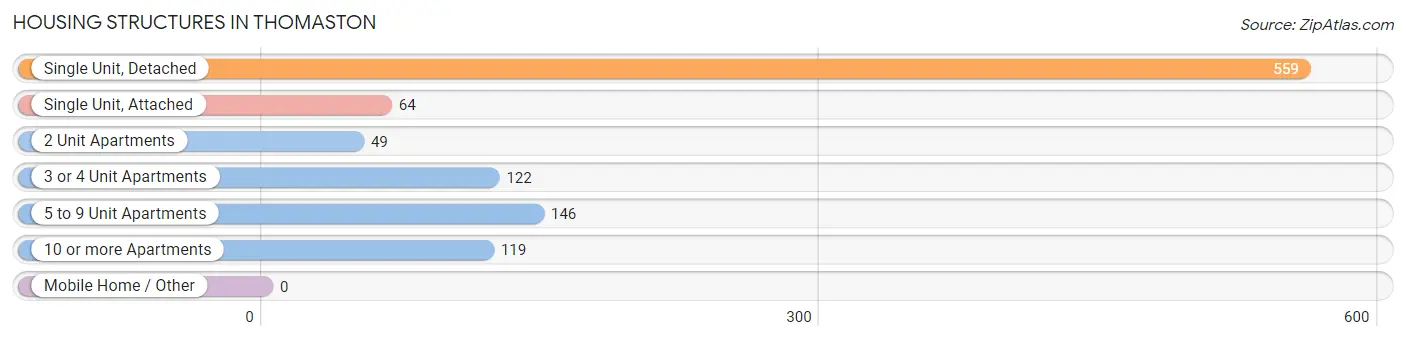
| Structure Type | # Housing Units | % Housing Units |
| Single Unit, Detached | 559 | 52.8% |
| Single Unit, Attached | 64 | 6.0% |
| 2 Unit Apartments | 49 | 4.6% |
| 3 or 4 Unit Apartments | 122 | 11.5% |
| 5 to 9 Unit Apartments | 146 | 13.8% |
| 10 or more Apartments | 119 | 11.2% |
| Mobile Home / Other | 0 | 0.0% |
| Total | 1,059 | 100.0% |
Housing Structures by Occupancy in Thomaston
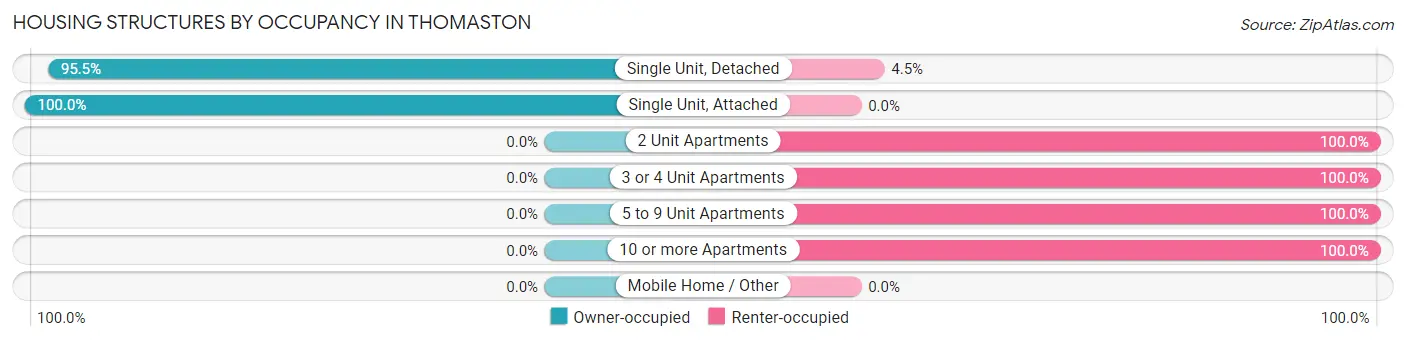
| Structure Type | Owner-occupied | Renter-occupied |
| Single Unit, Detached | 534 (95.5%) | 25 (4.5%) |
| Single Unit, Attached | 64 (100.0%) | 0 (0.0%) |
| 2 Unit Apartments | 0 (0.0%) | 49 (100.0%) |
| 3 or 4 Unit Apartments | 0 (0.0%) | 122 (100.0%) |
| 5 to 9 Unit Apartments | 0 (0.0%) | 146 (100.0%) |
| 10 or more Apartments | 0 (0.0%) | 119 (100.0%) |
| Mobile Home / Other | 0 (0.0%) | 0 (0.0%) |
| Total | 598 (56.5%) | 461 (43.5%) |
Housing Structures by Number of Rooms in Thomaston
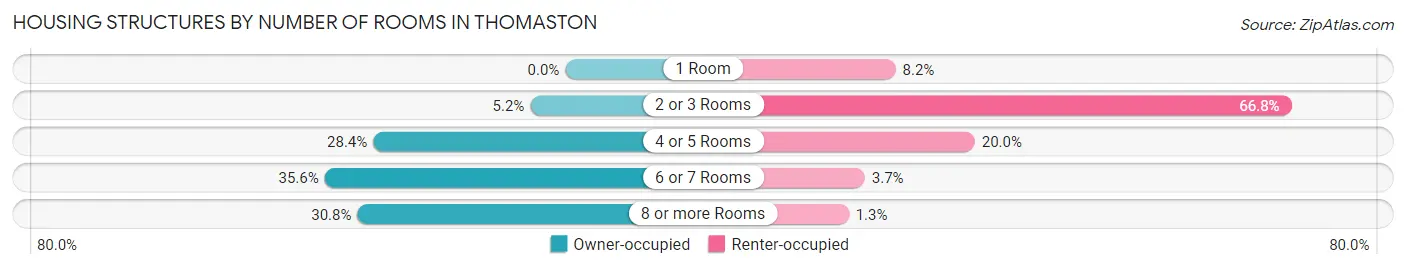
| Number of Rooms | Owner-occupied | Renter-occupied |
| 1 Room | 0 (0.0%) | 38 (8.2%) |
| 2 or 3 Rooms | 31 (5.2%) | 308 (66.8%) |
| 4 or 5 Rooms | 170 (28.4%) | 92 (20.0%) |
| 6 or 7 Rooms | 213 (35.6%) | 17 (3.7%) |
| 8 or more Rooms | 184 (30.8%) | 6 (1.3%) |
| Total | 598 (100.0%) | 461 (100.0%) |
Housing Structure by Heating Type in Thomaston
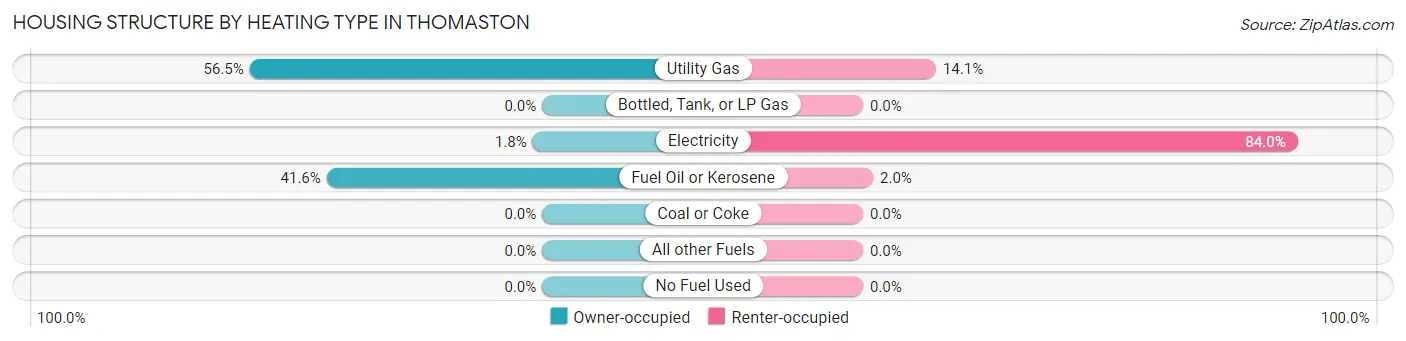
| Heating Type | Owner-occupied | Renter-occupied |
| Utility Gas | 338 (56.5%) | 65 (14.1%) |
| Bottled, Tank, or LP Gas | 0 (0.0%) | 0 (0.0%) |
| Electricity | 11 (1.8%) | 387 (84.0%) |
| Fuel Oil or Kerosene | 249 (41.6%) | 9 (1.9%) |
| Coal or Coke | 0 (0.0%) | 0 (0.0%) |
| All other Fuels | 0 (0.0%) | 0 (0.0%) |
| No Fuel Used | 0 (0.0%) | 0 (0.0%) |
| Total | 598 (100.0%) | 461 (100.0%) |
Household Vehicle Usage in Thomaston
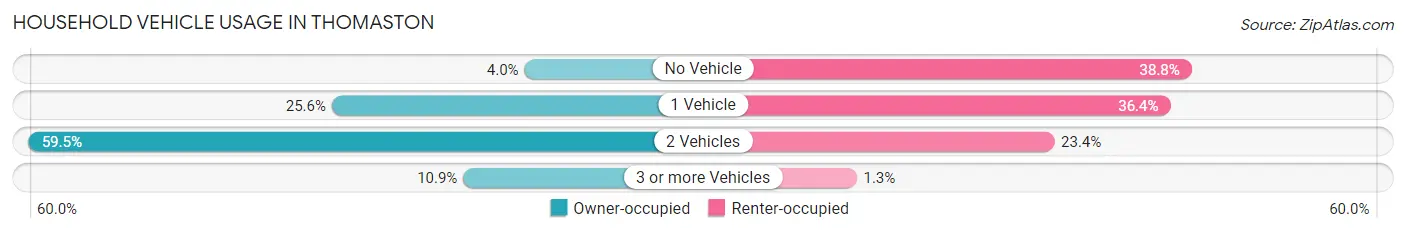
| Vehicles per Household | Owner-occupied | Renter-occupied |
| No Vehicle | 24 (4.0%) | 179 (38.8%) |
| 1 Vehicle | 153 (25.6%) | 168 (36.4%) |
| 2 Vehicles | 356 (59.5%) | 108 (23.4%) |
| 3 or more Vehicles | 65 (10.9%) | 6 (1.3%) |
| Total | 598 (100.0%) | 461 (100.0%) |
Real Estate & Mortgages in Thomaston
Real Estate and Mortgage Overview in Thomaston
| Characteristic | Without Mortgage | With Mortgage |
| Housing Units | 209 | 389 |
| Median Property Value | $189,300 | $256,500 |
| Median Household Income | $111,094 | $58 |
| Monthly Housing Costs | $736 | $37 |
| Real Estate Taxes | $4,491 | $0 |
Property Value by Mortgage Status in Thomaston
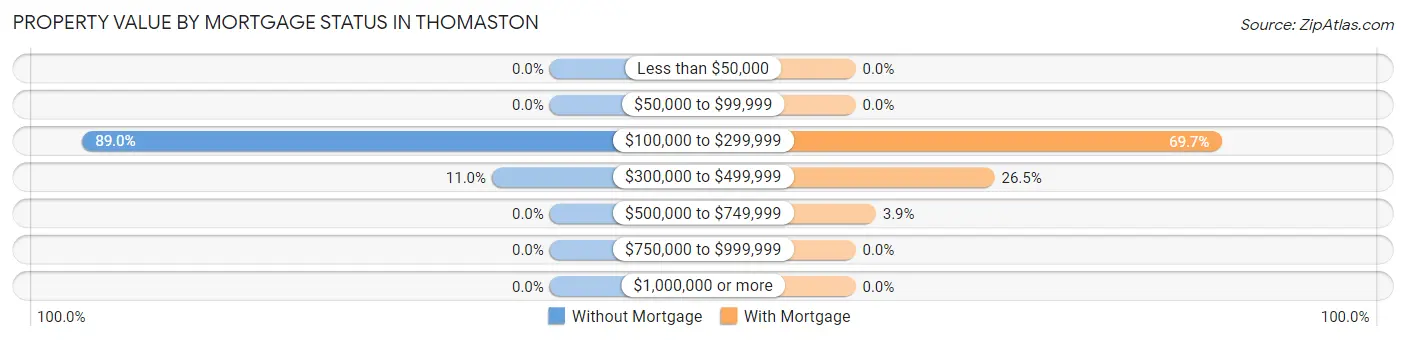
| Property Value | Without Mortgage | With Mortgage |
| Less than $50,000 | 0 (0.0%) | 0 (0.0%) |
| $50,000 to $99,999 | 0 (0.0%) | 0 (0.0%) |
| $100,000 to $299,999 | 186 (89.0%) | 271 (69.7%) |
| $300,000 to $499,999 | 23 (11.0%) | 103 (26.5%) |
| $500,000 to $749,999 | 0 (0.0%) | 15 (3.9%) |
| $750,000 to $999,999 | 0 (0.0%) | 0 (0.0%) |
| $1,000,000 or more | 0 (0.0%) | 0 (0.0%) |
| Total | 209 (100.0%) | 389 (100.0%) |
Household Income by Mortgage Status in Thomaston
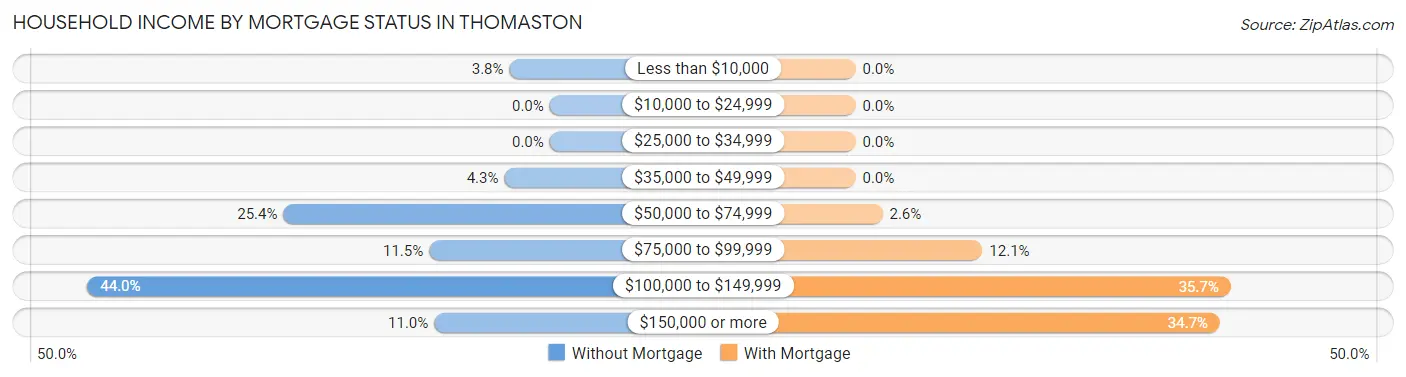
| Household Income | Without Mortgage | With Mortgage |
| Less than $10,000 | 8 (3.8%) | 0 (0.0%) |
| $10,000 to $24,999 | 0 (0.0%) | 0 (0.0%) |
| $25,000 to $34,999 | 0 (0.0%) | 0 (0.0%) |
| $35,000 to $49,999 | 9 (4.3%) | 0 (0.0%) |
| $50,000 to $74,999 | 53 (25.4%) | 10 (2.6%) |
| $75,000 to $99,999 | 24 (11.5%) | 47 (12.1%) |
| $100,000 to $149,999 | 92 (44.0%) | 139 (35.7%) |
| $150,000 or more | 23 (11.0%) | 135 (34.7%) |
| Total | 209 (100.0%) | 389 (100.0%) |
Property Value to Household Income Ratio in Thomaston
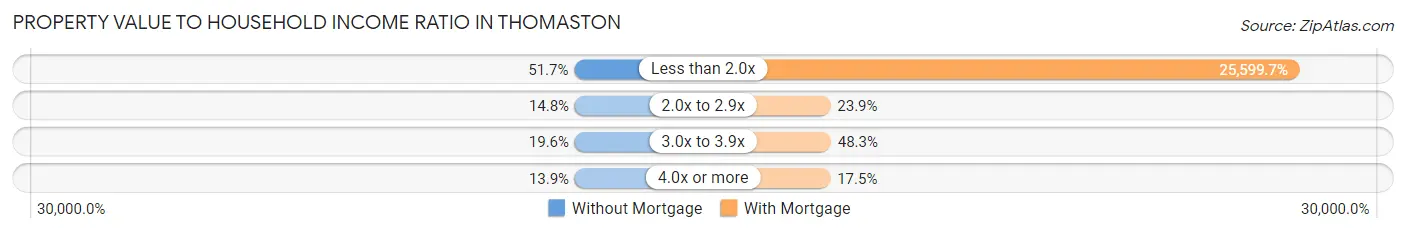
| Value-to-Income Ratio | Without Mortgage | With Mortgage |
| Less than 2.0x | 108 (51.7%) | 99,583 (25,599.7%) |
| 2.0x to 2.9x | 31 (14.8%) | 93 (23.9%) |
| 3.0x to 3.9x | 41 (19.6%) | 188 (48.3%) |
| 4.0x or more | 29 (13.9%) | 68 (17.5%) |
| Total | 209 (100.0%) | 389 (100.0%) |
Real Estate Taxes by Mortgage Status in Thomaston
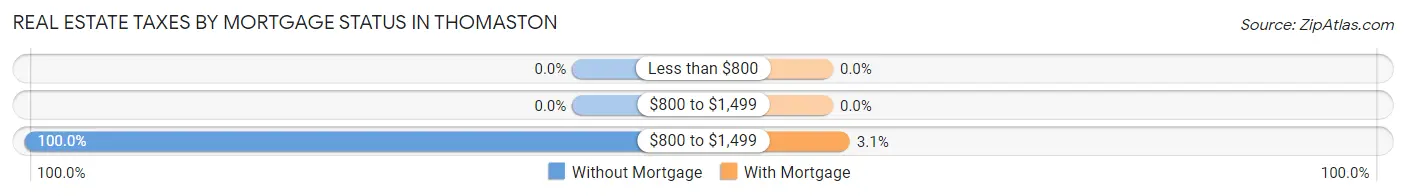
| Property Taxes | Without Mortgage | With Mortgage |
| Less than $800 | 0 (0.0%) | 0 (0.0%) |
| $800 to $1,499 | 0 (0.0%) | 0 (0.0%) |
| $800 to $1,499 | 209 (100.0%) | 12 (3.1%) |
| Total | 209 (100.0%) | 389 (100.0%) |
Health & Disability in Thomaston
Health Insurance Coverage by Age in Thomaston
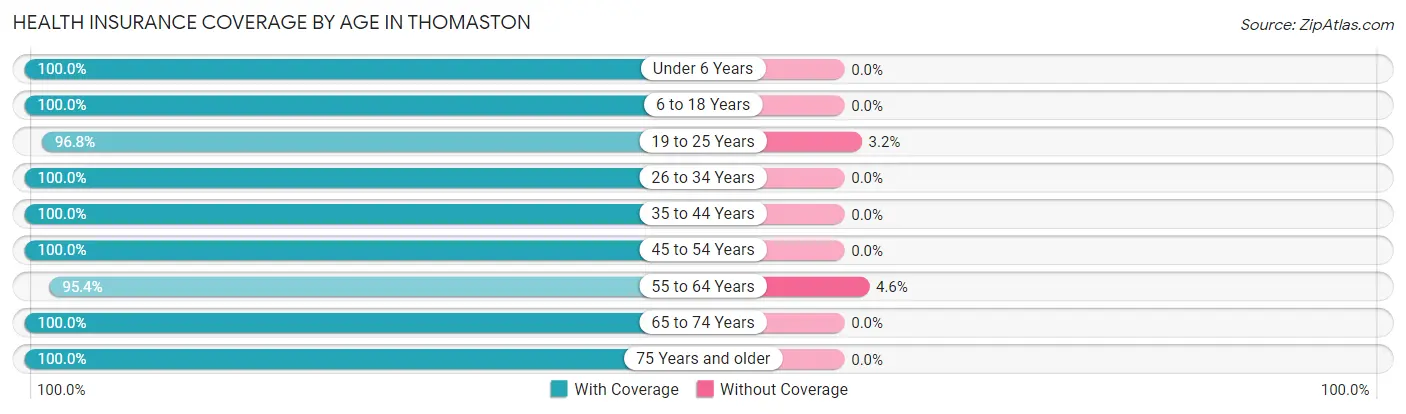
| Age Bracket | With Coverage | Without Coverage |
| Under 6 Years | 139 (100.0%) | 0 (0.0%) |
| 6 to 18 Years | 310 (100.0%) | 0 (0.0%) |
| 19 to 25 Years | 210 (96.8%) | 7 (3.2%) |
| 26 to 34 Years | 125 (100.0%) | 0 (0.0%) |
| 35 to 44 Years | 172 (100.0%) | 0 (0.0%) |
| 45 to 54 Years | 323 (100.0%) | 0 (0.0%) |
| 55 to 64 Years | 331 (95.4%) | 16 (4.6%) |
| 65 to 74 Years | 288 (100.0%) | 0 (0.0%) |
| 75 Years and older | 166 (100.0%) | 0 (0.0%) |
| Total | 2,064 (98.9%) | 23 (1.1%) |
Health Insurance Coverage by Citizenship Status in Thomaston
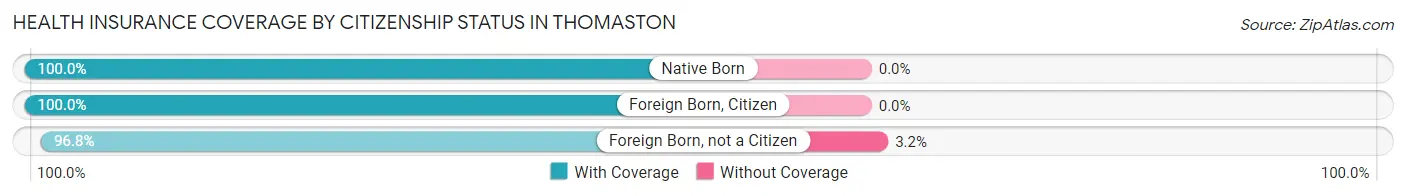
| Citizenship Status | With Coverage | Without Coverage |
| Native Born | 139 (100.0%) | 0 (0.0%) |
| Foreign Born, Citizen | 310 (100.0%) | 0 (0.0%) |
| Foreign Born, not a Citizen | 210 (96.8%) | 7 (3.2%) |
Health Insurance Coverage by Household Income in Thomaston
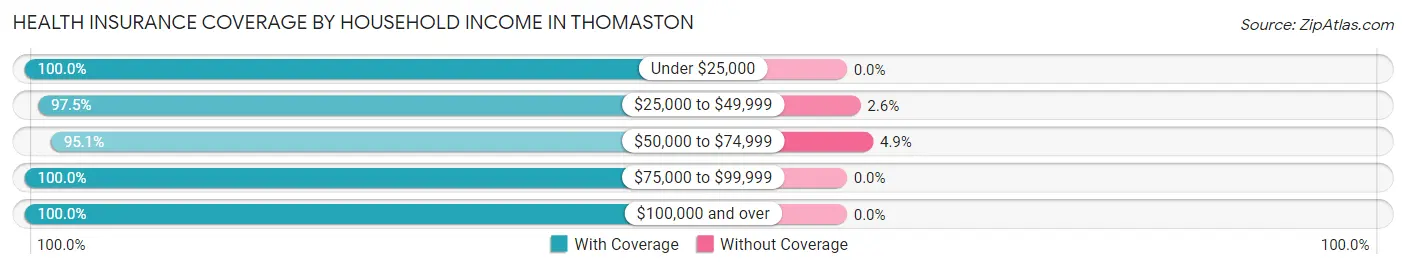
| Household Income | With Coverage | Without Coverage |
| Under $25,000 | 176 (100.0%) | 0 (0.0%) |
| $25,000 to $49,999 | 268 (97.5%) | 7 (2.5%) |
| $50,000 to $74,999 | 309 (95.1%) | 16 (4.9%) |
| $75,000 to $99,999 | 369 (100.0%) | 0 (0.0%) |
| $100,000 and over | 942 (100.0%) | 0 (0.0%) |
Public vs Private Health Insurance Coverage by Age in Thomaston
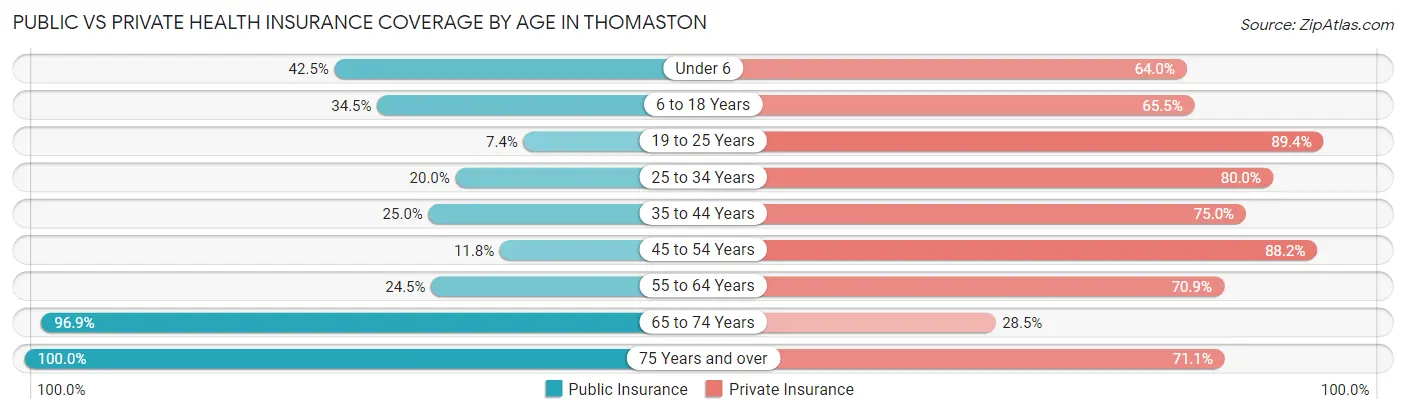
| Age Bracket | Public Insurance | Private Insurance |
| Under 6 | 59 (42.4%) | 89 (64.0%) |
| 6 to 18 Years | 107 (34.5%) | 203 (65.5%) |
| 19 to 25 Years | 16 (7.4%) | 194 (89.4%) |
| 25 to 34 Years | 25 (20.0%) | 100 (80.0%) |
| 35 to 44 Years | 43 (25.0%) | 129 (75.0%) |
| 45 to 54 Years | 38 (11.8%) | 285 (88.2%) |
| 55 to 64 Years | 85 (24.5%) | 246 (70.9%) |
| 65 to 74 Years | 279 (96.9%) | 82 (28.5%) |
| 75 Years and over | 166 (100.0%) | 118 (71.1%) |
| Total | 818 (39.2%) | 1,446 (69.3%) |
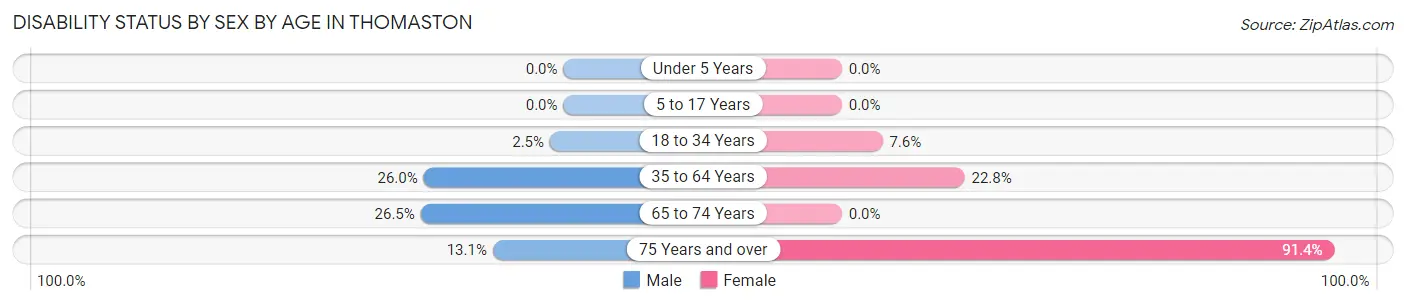
Disability Status by Sex by Age in Thomaston
| Age Bracket | Male | Female |
| Under 5 Years | 0 (0.0%) | 0 (0.0%) |
| 5 to 17 Years | 0 (0.0%) | 0 (0.0%) |
| 18 to 34 Years | 5 (2.5%) | 12 (7.5%) |
| 35 to 64 Years | 116 (26.0%) | 90 (22.8%) |
| 65 to 74 Years | 40 (26.5%) | 0 (0.0%) |
| 75 Years and over | 8 (13.1%) | 96 (91.4%) |
Disability Class by Sex by Age in Thomaston
Disability Class: Hearing Difficulty
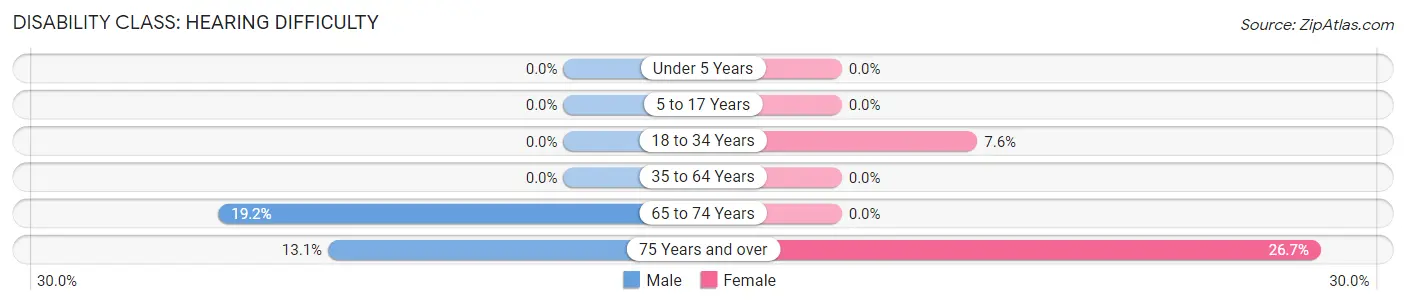
| Age Bracket | Male | Female |
| Under 5 Years | 0 (0.0%) | 0 (0.0%) |
| 5 to 17 Years | 0 (0.0%) | 0 (0.0%) |
| 18 to 34 Years | 0 (0.0%) | 12 (7.5%) |
| 35 to 64 Years | 0 (0.0%) | 0 (0.0%) |
| 65 to 74 Years | 29 (19.2%) | 0 (0.0%) |
| 75 Years and over | 8 (13.1%) | 28 (26.7%) |
Disability Class: Vision Difficulty
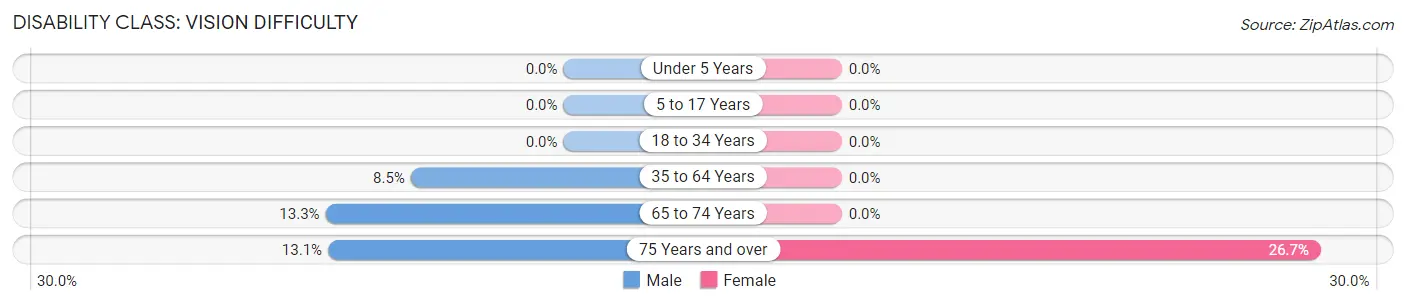
| Age Bracket | Male | Female |
| Under 5 Years | 0 (0.0%) | 0 (0.0%) |
| 5 to 17 Years | 0 (0.0%) | 0 (0.0%) |
| 18 to 34 Years | 0 (0.0%) | 0 (0.0%) |
| 35 to 64 Years | 38 (8.5%) | 0 (0.0%) |
| 65 to 74 Years | 20 (13.3%) | 0 (0.0%) |
| 75 Years and over | 8 (13.1%) | 28 (26.7%) |
Disability Class: Cognitive Difficulty
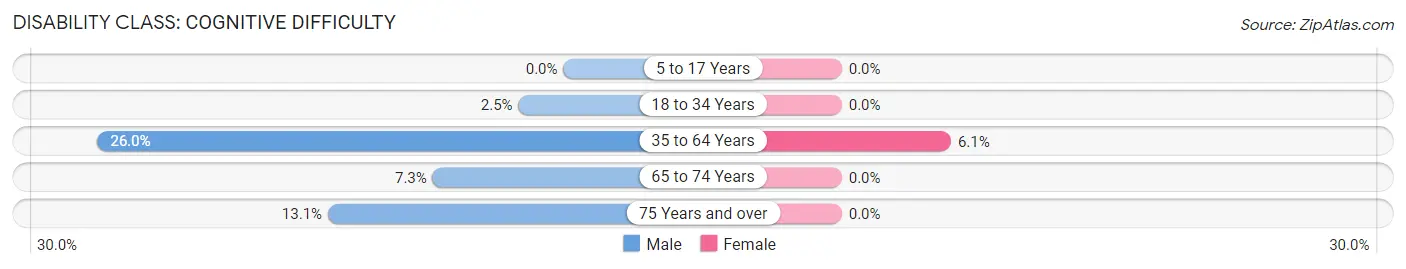
| Age Bracket | Male | Female |
| 5 to 17 Years | 0 (0.0%) | 0 (0.0%) |
| 18 to 34 Years | 5 (2.5%) | 0 (0.0%) |
| 35 to 64 Years | 116 (26.0%) | 24 (6.1%) |
| 65 to 74 Years | 11 (7.3%) | 0 (0.0%) |
| 75 Years and over | 8 (13.1%) | 0 (0.0%) |
Disability Class: Ambulatory Difficulty
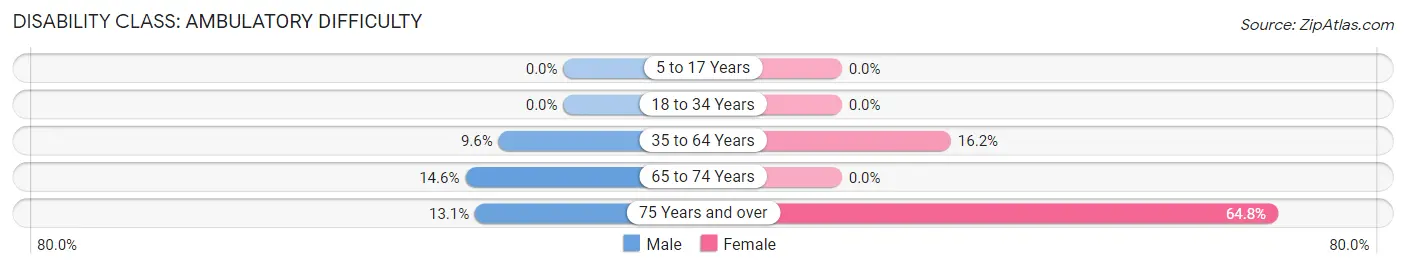
| Age Bracket | Male | Female |
| 5 to 17 Years | 0 (0.0%) | 0 (0.0%) |
| 18 to 34 Years | 0 (0.0%) | 0 (0.0%) |
| 35 to 64 Years | 43 (9.6%) | 64 (16.2%) |
| 65 to 74 Years | 22 (14.6%) | 0 (0.0%) |
| 75 Years and over | 8 (13.1%) | 68 (64.8%) |
Disability Class: Self-Care Difficulty
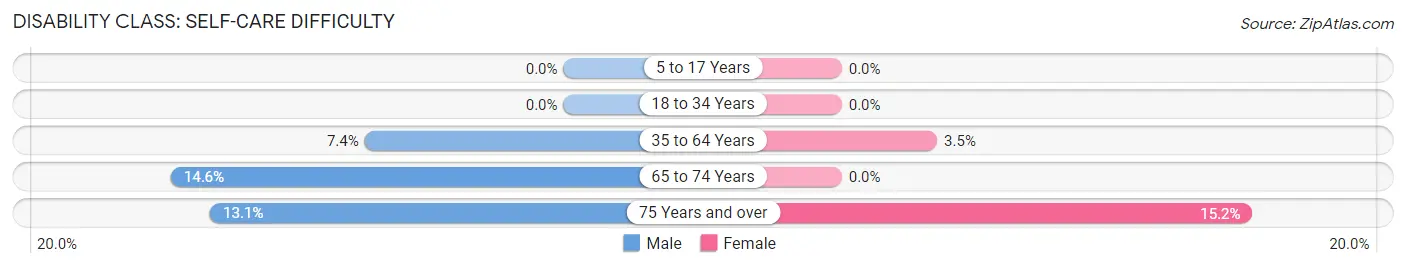
| Age Bracket | Male | Female |
| 5 to 17 Years | 0 (0.0%) | 0 (0.0%) |
| 18 to 34 Years | 0 (0.0%) | 0 (0.0%) |
| 35 to 64 Years | 33 (7.4%) | 14 (3.5%) |
| 65 to 74 Years | 22 (14.6%) | 0 (0.0%) |
| 75 Years and over | 8 (13.1%) | 16 (15.2%) |
Technology Access in Thomaston
Computing Device Access in Thomaston
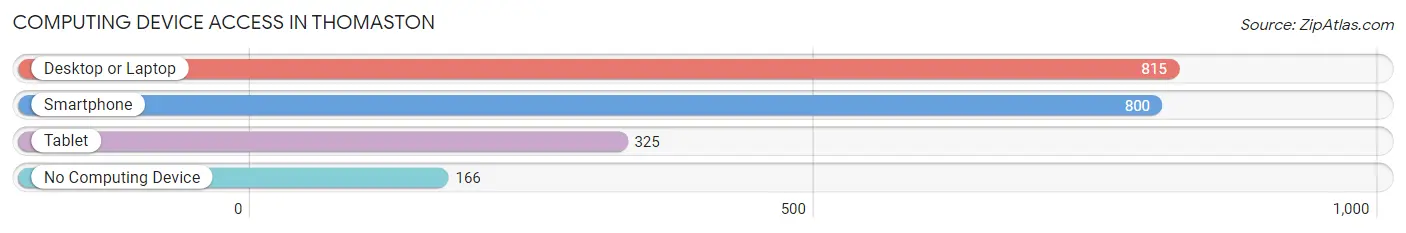
| Device Type | # Households | % Households |
| Desktop or Laptop | 815 | 77.0% |
| Smartphone | 800 | 75.5% |
| Tablet | 325 | 30.7% |
| No Computing Device | 166 | 15.7% |
| Total | 1,059 | 100.0% |
Internet Access in Thomaston
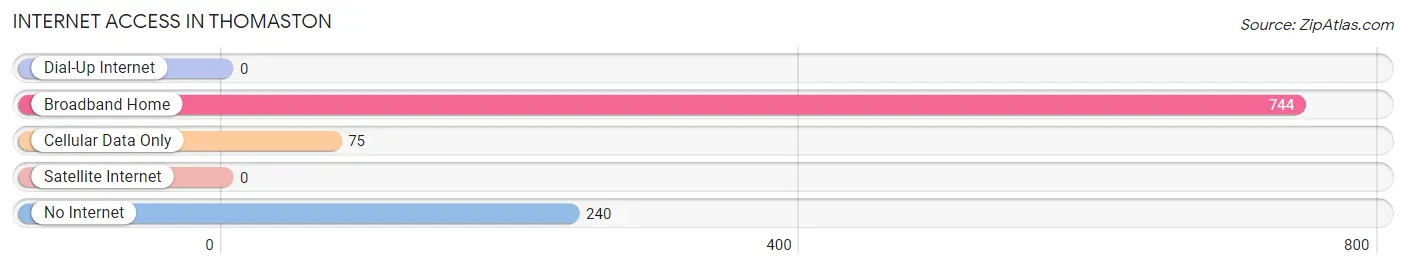
| Internet Type | # Households | % Households |
| Dial-Up Internet | 0 | 0.0% |
| Broadband Home | 744 | 70.3% |
| Cellular Data Only | 75 | 7.1% |
| Satellite Internet | 0 | 0.0% |
| No Internet | 240 | 22.7% |
| Total | 1,059 | 100.0% |
Thomaston Summary
Thomaston, Connecticut is a small town located in Litchfield County, in the northwest corner of the state. It is bordered by the towns of Plymouth, Harwinton, Litchfield, and Watertown. The town has a population of 7,503 as of the 2010 census, and is part of the Waterbury metropolitan area.
History
Thomaston was first settled in 1737 by a group of settlers from Farmington, Connecticut. The town was named after Colonel William Thompson, who was a prominent landowner in the area. The town was incorporated in 1785, and was the site of a major Revolutionary War battle in 1777.
Geography
Thomaston is located in the northwest corner of Connecticut, in Litchfield County. It is bordered by the towns of Plymouth, Harwinton, Litchfield, and Watertown. The town has a total area of 16.3 square miles, of which 16.2 square miles is land and 0.1 square miles is water. The town is located in the Naugatuck River Valley, and is home to several small lakes and ponds.
Economy
Thomaston is home to several small businesses, including a number of restaurants, retail stores, and professional services. The town is also home to several manufacturing companies, including the Thomaston Mills, which produces textiles, and the Thomaston Machine Company, which produces machine parts. The town is also home to the Thomaston Opera House, which hosts a variety of musical and theatrical performances.
Demographics
As of the 2010 census, there were 7,503 people, 2,945 households, and 1,945 families residing in the town. The population density was 463.2 people per square mile. The racial makeup of the town was 94.2% White, 1.7% African American, 0.3% Native American, 0.9% Asian, 0.1% Pacific Islander, 1.2% from other races, and 1.6% from two or more races. Hispanic or Latino of any race were 3.3% of the population.
The median income for a household in the town was $60,938, and the median income for a family was $71,944. The per capita income for the town was $27,945. About 4.2% of families and 5.7% of the population were below the poverty line, including 6.3% of those under age 18 and 5.2% of those age 65 or over.
Common Questions
What is Per Capita Income in Thomaston?
Per Capita income in Thomaston is $39,700.
What is the Median Family Income in Thomaston?
Median Family Income in Thomaston is $115,795.
What is the Median Household income in Thomaston?
Median Household Income in Thomaston is $71,301.
What is Income or Wage Gap in Thomaston?
Income or Wage Gap in Thomaston is 28.9%.
Women in Thomaston earn 71.1 cents for every dollar earned by a man.
What is Inequality or Gini Index in Thomaston?
Inequality or Gini Index in Thomaston is 0.38.
What is the Total Population of Thomaston?
Total Population of Thomaston is 2,087.
What is the Total Male Population of Thomaston?
Total Male Population of Thomaston is 1,097.
What is the Total Female Population of Thomaston?
Total Female Population of Thomaston is 990.
What is the Ratio of Males per 100 Females in Thomaston?
There are 110.81 Males per 100 Females in Thomaston.
What is the Ratio of Females per 100 Males in Thomaston?
There are 90.25 Females per 100 Males in Thomaston.
What is the Median Population Age in Thomaston?
Median Population Age in Thomaston is 47.9 Years.
What is the Average Family Size in Thomaston
Average Family Size in Thomaston is 2.9 People.
What is the Average Household Size in Thomaston
Average Household Size in Thomaston is 2.0 People.
How Large is the Labor Force in Thomaston?
There are 1,022 People in the Labor Forcein in Thomaston.
What is the Percentage of People in the Labor Force in Thomaston?
60.6% of People are in the Labor Force in Thomaston.
What is the Unemployment Rate in Thomaston?
Unemployment Rate in Thomaston is 4.9%.