Zip Codes with the Highest Percentage of Population Employed in Architecture & Engineering in Greenwich, CT
RELATED REPORTS & OPTIONS
Architecture & Engineering
Greenwich
Compare Zip Codes
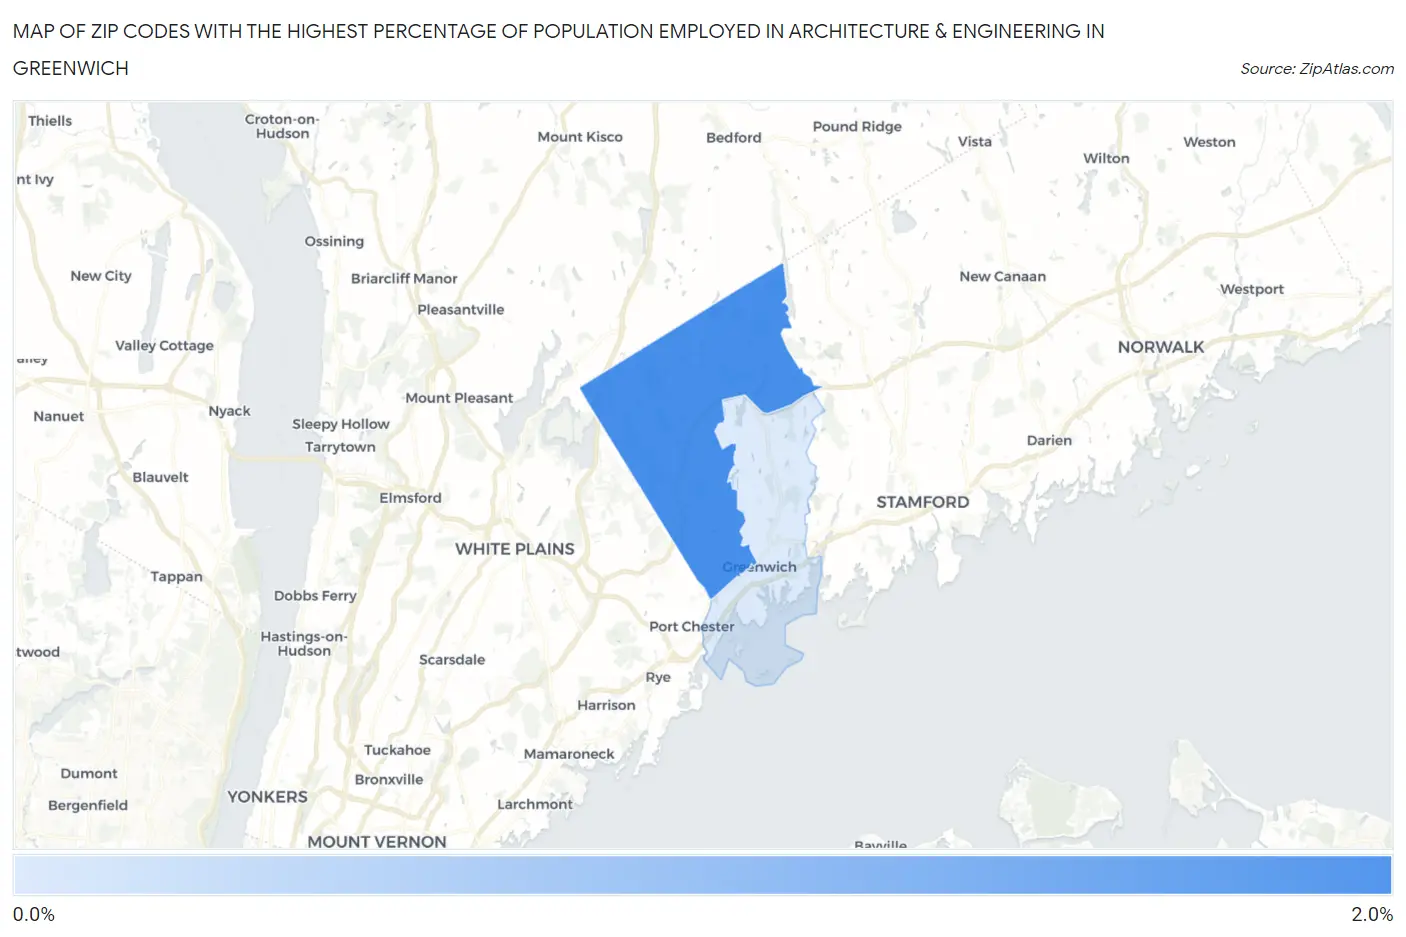
Map of Zip Codes with the Highest Percentage of Population Employed in Architecture & Engineering in Greenwich
0.96%
1.9%
Zip Codes with the Highest Percentage of Population Employed in Architecture & Engineering in Greenwich, CT
| Zip Code | % Employed | vs State | vs National | |
| 1. | 06831 | 1.9% | 2.6%(-0.714)#155 | 2.1%(-0.288)#10,472 |
| 2. | 06830 | 0.96% | 2.6%(-1.61)#214 | 2.1%(-1.19)#16,891 |
1
Common Questions
What are the Top Zip Codes with the Highest Percentage of Population Employed in Architecture & Engineering in Greenwich, CT?
Top Zip Codes with the Highest Percentage of Population Employed in Architecture & Engineering in Greenwich, CT are:
What zip code has the Highest Percentage of Population Employed in Architecture & Engineering in Greenwich, CT?
06831 has the Highest Percentage of Population Employed in Architecture & Engineering in Greenwich, CT with 1.9%.
What is the Percentage of Population Employed in Architecture & Engineering in Greenwich, CT?
Percentage of Population Employed in Architecture & Engineering in Greenwich is 1.9%.
What is the Percentage of Population Employed in Architecture & Engineering in Connecticut?
Percentage of Population Employed in Architecture & Engineering in Connecticut is 2.6%.
What is the Percentage of Population Employed in Architecture & Engineering in the United States?
Percentage of Population Employed in Architecture & Engineering in the United States is 2.1%.