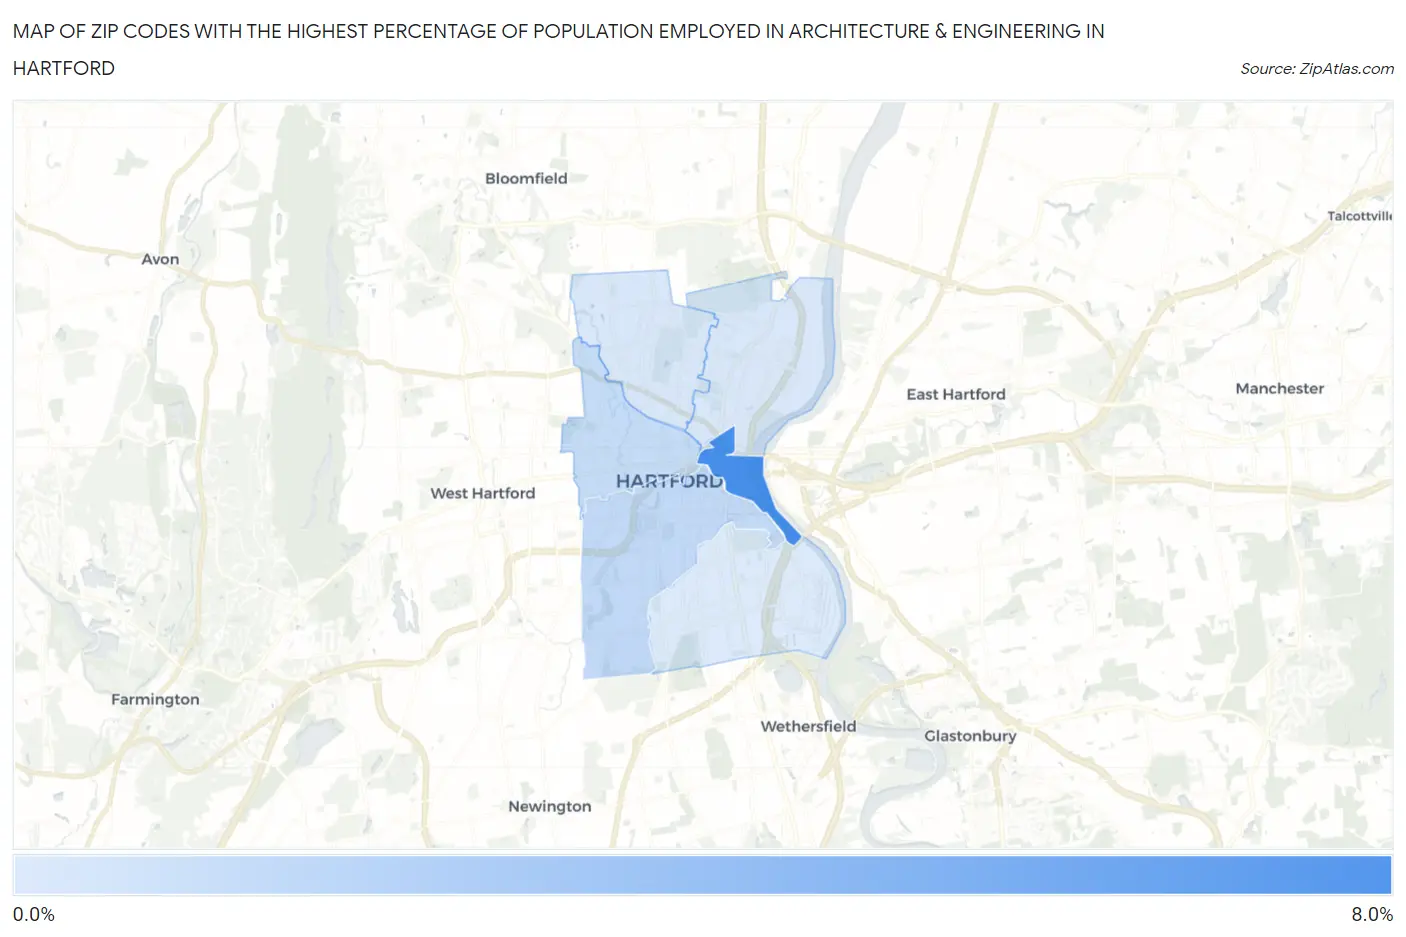
Zip Codes with the Highest Percentage of Population Employed in Architecture & Engineering in Hartford, CT
RELATED REPORTS & OPTIONS
Architecture & Engineering
Hartford
Compare Zip Codes
Map of Zip Codes with the Highest Percentage of Population Employed in Architecture & Engineering in Hartford
0.094%
7.3%
Zip Codes with the Highest Percentage of Population Employed in Architecture & Engineering in Hartford, CT
| Zip Code | % Employed | vs State | vs National | |
| 1. | 06103 | 7.3% | 2.6%(+4.68)#7 | 2.1%(+5.11)#700 |
| 2. | 06106 | 1.4% | 2.6%(-1.15)#182 | 2.1%(-0.728)#13,422 |
| 3. | 06105 | 1.1% | 2.6%(-1.43)#202 | 2.1%(-1.00)#15,493 |
| 4. | 06120 | 0.31% | 2.6%(-2.27)#235 | 2.1%(-1.84)#21,521 |
| 5. | 06112 | 0.26% | 2.6%(-2.32)#237 | 2.1%(-1.89)#21,795 |
| 6. | 06114 | 0.094% | 2.6%(-2.48)#241 | 2.1%(-2.06)#22,395 |
1
Common Questions
What are the Top 5 Zip Codes with the Highest Percentage of Population Employed in Architecture & Engineering in Hartford, CT?
Top 5 Zip Codes with the Highest Percentage of Population Employed in Architecture & Engineering in Hartford, CT are:
What zip code has the Highest Percentage of Population Employed in Architecture & Engineering in Hartford, CT?
06103 has the Highest Percentage of Population Employed in Architecture & Engineering in Hartford, CT with 7.3%.
What is the Percentage of Population Employed in Architecture & Engineering in Hartford, CT?
Percentage of Population Employed in Architecture & Engineering in Hartford is 0.94%.
What is the Percentage of Population Employed in Architecture & Engineering in Connecticut?
Percentage of Population Employed in Architecture & Engineering in Connecticut is 2.6%.
What is the Percentage of Population Employed in Architecture & Engineering in the United States?
Percentage of Population Employed in Architecture & Engineering in the United States is 2.1%.