Zip Codes with the Highest Percentage of Population Employed in Architecture & Engineering in Bridgeport, CT
RELATED REPORTS & OPTIONS
Architecture & Engineering
Bridgeport
Compare Zip Codes
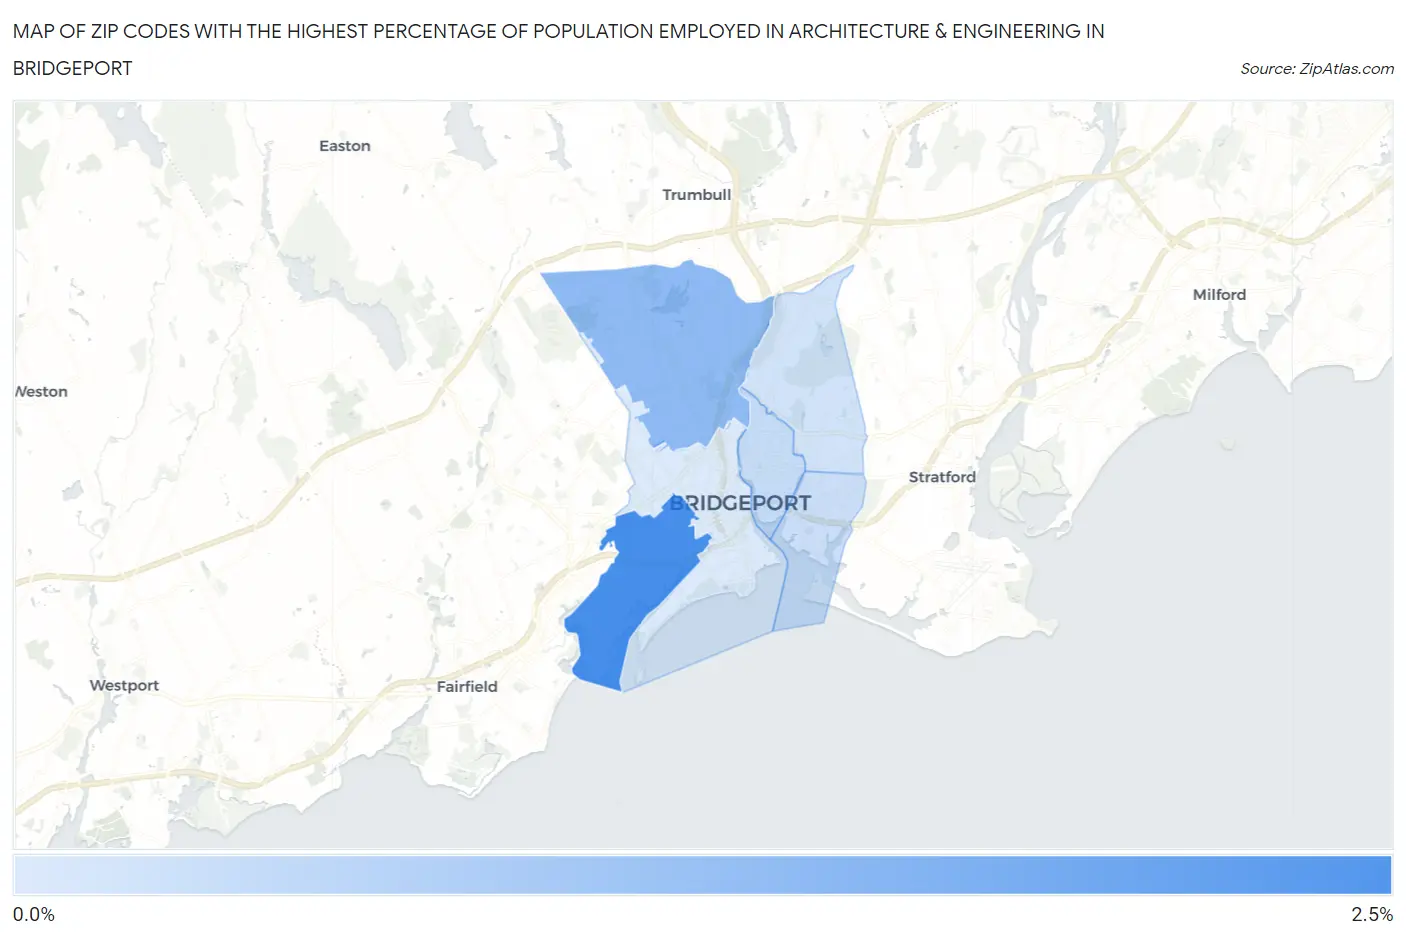
Map of Zip Codes with the Highest Percentage of Population Employed in Architecture & Engineering in Bridgeport
0.41%
2.1%
Zip Codes with the Highest Percentage of Population Employed in Architecture & Engineering in Bridgeport, CT
| Zip Code | % Employed | vs State | vs National | |
| 1. | 06605 | 2.1% | 2.6%(-0.484)#139 | 2.1%(-0.057)#9,095 |
| 2. | 06606 | 1.3% | 2.6%(-1.30)#191 | 2.1%(-0.870)#14,456 |
| 3. | 06608 | 0.67% | 2.6%(-1.91)#222 | 2.1%(-1.48)#19,103 |
| 4. | 06607 | 0.62% | 2.6%(-1.95)#225 | 2.1%(-1.53)#19,456 |
| 5. | 06610 | 0.53% | 2.6%(-2.04)#227 | 2.1%(-1.62)#20,066 |
| 6. | 06604 | 0.41% | 2.6%(-2.17)#231 | 2.1%(-1.74)#20,892 |
1
Common Questions
What are the Top 5 Zip Codes with the Highest Percentage of Population Employed in Architecture & Engineering in Bridgeport, CT?
Top 5 Zip Codes with the Highest Percentage of Population Employed in Architecture & Engineering in Bridgeport, CT are:
What zip code has the Highest Percentage of Population Employed in Architecture & Engineering in Bridgeport, CT?
06605 has the Highest Percentage of Population Employed in Architecture & Engineering in Bridgeport, CT with 2.1%.
What is the Percentage of Population Employed in Architecture & Engineering in Bridgeport, CT?
Percentage of Population Employed in Architecture & Engineering in Bridgeport is 1.1%.
What is the Percentage of Population Employed in Architecture & Engineering in Connecticut?
Percentage of Population Employed in Architecture & Engineering in Connecticut is 2.6%.
What is the Percentage of Population Employed in Architecture & Engineering in the United States?
Percentage of Population Employed in Architecture & Engineering in the United States is 2.1%.