Zip Codes with the Highest Percentage of Population Employed in Architecture & Engineering in New Haven, CT
RELATED REPORTS & OPTIONS
Architecture & Engineering
New Haven
Compare Zip Codes
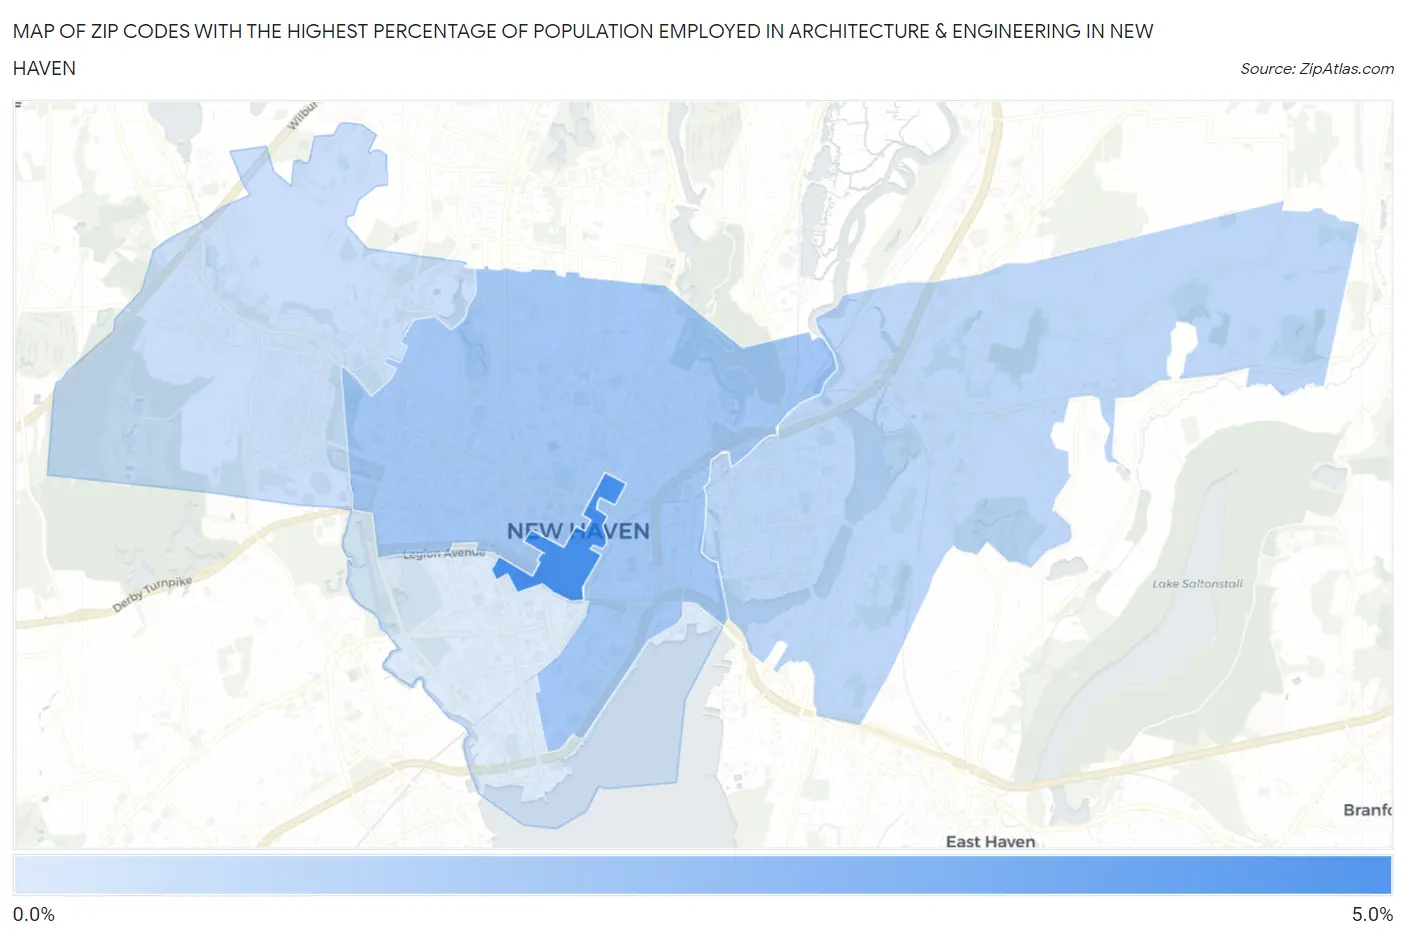
Map of Zip Codes with the Highest Percentage of Population Employed in Architecture & Engineering in New Haven
0.22%
4.7%
Zip Codes with the Highest Percentage of Population Employed in Architecture & Engineering in New Haven, CT
| Zip Code | % Employed | vs State | vs National | |
| 1. | 06510 | 4.7% | 2.6%(+2.14)#40 | 2.1%(+2.56)#1,920 |
| 2. | 06511 | 2.0% | 2.6%(-0.621)#149 | 2.1%(-0.194)#9,876 |
| 3. | 06513 | 1.2% | 2.6%(-1.37)#197 | 2.1%(-0.945)#15,037 |
| 4. | 06515 | 0.75% | 2.6%(-1.83)#221 | 2.1%(-1.40)#18,536 |
| 5. | 06519 | 0.22% | 2.6%(-2.35)#239 | 2.1%(-1.93)#21,940 |
1
Common Questions
What are the Top 3 Zip Codes with the Highest Percentage of Population Employed in Architecture & Engineering in New Haven, CT?
Top 3 Zip Codes with the Highest Percentage of Population Employed in Architecture & Engineering in New Haven, CT are:
What zip code has the Highest Percentage of Population Employed in Architecture & Engineering in New Haven, CT?
06510 has the Highest Percentage of Population Employed in Architecture & Engineering in New Haven, CT with 4.7%.
What is the Percentage of Population Employed in Architecture & Engineering in New Haven, CT?
Percentage of Population Employed in Architecture & Engineering in New Haven is 1.7%.
What is the Percentage of Population Employed in Architecture & Engineering in Connecticut?
Percentage of Population Employed in Architecture & Engineering in Connecticut is 2.6%.
What is the Percentage of Population Employed in Architecture & Engineering in the United States?
Percentage of Population Employed in Architecture & Engineering in the United States is 2.1%.