Wilton Center, CT Map & Demographics
Wilton Center Map
Wilton Center Overview
$111,988
PER CAPITA INCOME
$204,250
AVG FAMILY INCOME
$130,543
AVG HOUSEHOLD INCOME
68.6%
WAGE / INCOME GAP [ % ]
31.4¢/ $1
WAGE / INCOME GAP [ $ ]
0.56
INEQUALITY / GINI INDEX
1,642
TOTAL POPULATION
713
MALE POPULATION
929
FEMALE POPULATION
76.75
MALES / 100 FEMALES
130.29
FEMALES / 100 MALES
50.8
MEDIAN AGE
2.8
AVG FAMILY SIZE
2.0
AVG HOUSEHOLD SIZE
874
LABOR FORCE [ PEOPLE ]
61.4%
PERCENT IN LABOR FORCE
2.4%
UNEMPLOYMENT RATE
Income in Wilton Center
Income Overview in Wilton Center
Per Capita Income in Wilton Center is $111,988, while median incomes of families and households are $204,250 and $130,543 respectively.
| Characteristic | Number | Measure |
| Per Capita Income | 1,642 | $111,988 |
| Median Family Income | 427 | $204,250 |
| Mean Family Income | 427 | $312,314 |
| Median Household Income | 812 | $130,543 |
| Mean Household Income | 812 | $221,886 |
| Income Deficit | 427 | $0 |
| Wage / Income Gap (%) | 1,642 | 68.62% |
| Wage / Income Gap ($) | 1,642 | 31.38¢ per $1 |
| Gini / Inequality Index | 1,642 | 0.56 |
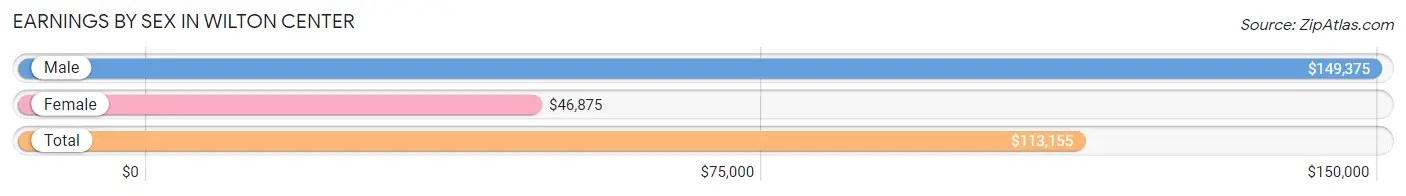
Earnings by Sex in Wilton Center
Average Earnings in Wilton Center are $113,155, $149,375 for men and $46,875 for women, a difference of 68.6%.
| Sex | Number | Average Earnings |
| Male | 434 (46.8%) | $149,375 |
| Female | 493 (53.2%) | $46,875 |
| Total | 927 (100.0%) | $113,155 |
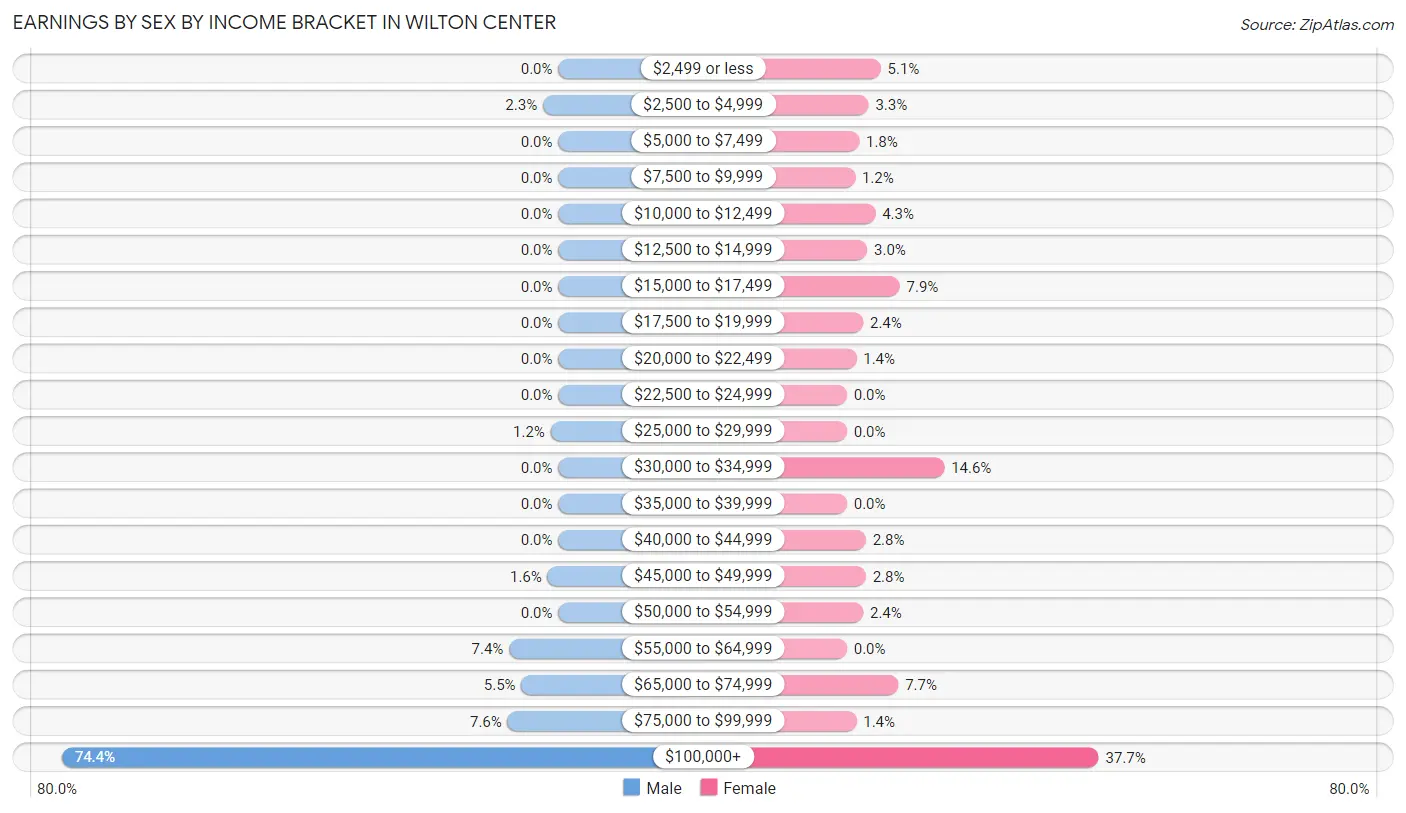
Earnings by Sex by Income Bracket in Wilton Center
The most common earnings brackets in Wilton Center are $100,000+ for men (323 | 74.4%) and $100,000+ for women (186 | 37.7%).
| Income | Male | Female |
| $2,499 or less | 0 (0.0%) | 25 (5.1%) |
| $2,500 to $4,999 | 10 (2.3%) | 16 (3.3%) |
| $5,000 to $7,499 | 0 (0.0%) | 9 (1.8%) |
| $7,500 to $9,999 | 0 (0.0%) | 6 (1.2%) |
| $10,000 to $12,499 | 0 (0.0%) | 21 (4.3%) |
| $12,500 to $14,999 | 0 (0.0%) | 15 (3.0%) |
| $15,000 to $17,499 | 0 (0.0%) | 39 (7.9%) |
| $17,500 to $19,999 | 0 (0.0%) | 12 (2.4%) |
| $20,000 to $22,499 | 0 (0.0%) | 7 (1.4%) |
| $22,500 to $24,999 | 0 (0.0%) | 0 (0.0%) |
| $25,000 to $29,999 | 5 (1.1%) | 0 (0.0%) |
| $30,000 to $34,999 | 0 (0.0%) | 72 (14.6%) |
| $35,000 to $39,999 | 0 (0.0%) | 0 (0.0%) |
| $40,000 to $44,999 | 0 (0.0%) | 14 (2.8%) |
| $45,000 to $49,999 | 7 (1.6%) | 14 (2.8%) |
| $50,000 to $54,999 | 0 (0.0%) | 12 (2.4%) |
| $55,000 to $64,999 | 32 (7.4%) | 0 (0.0%) |
| $65,000 to $74,999 | 24 (5.5%) | 38 (7.7%) |
| $75,000 to $99,999 | 33 (7.6%) | 7 (1.4%) |
| $100,000+ | 323 (74.4%) | 186 (37.7%) |
| Total | 434 (100.0%) | 493 (100.0%) |
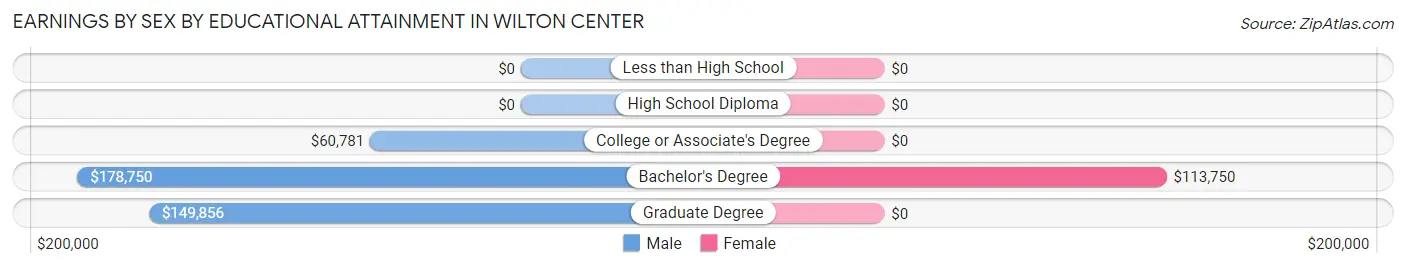
Earnings by Sex by Educational Attainment in Wilton Center
Average earnings in Wilton Center are $149,615 for men and $88,036 for women, a difference of 41.2%. Men with an educational attainment of bachelor's degree enjoy the highest average annual earnings of $178,750, while those with college or associate's degree education earn the least with $60,781. Women with an educational attainment of bachelor's degree earn the most with the average annual earnings of $113,750, while those with bachelor's degree education have the smallest earnings of $113,750.
| Educational Attainment | Male Income | Female Income |
| Less than High School | - | - |
| High School Diploma | - | - |
| College or Associate's Degree | $60,781 | $0 |
| Bachelor's Degree | $178,750 | $113,750 |
| Graduate Degree | $149,856 | $0 |
| Total | $149,615 | $88,036 |
Family Income in Wilton Center
Family Income Brackets in Wilton Center
According to the Wilton Center family income data, there are 224 families falling into the $200,000+ income range, which is the most common income bracket and makes up 52.5% of all families.
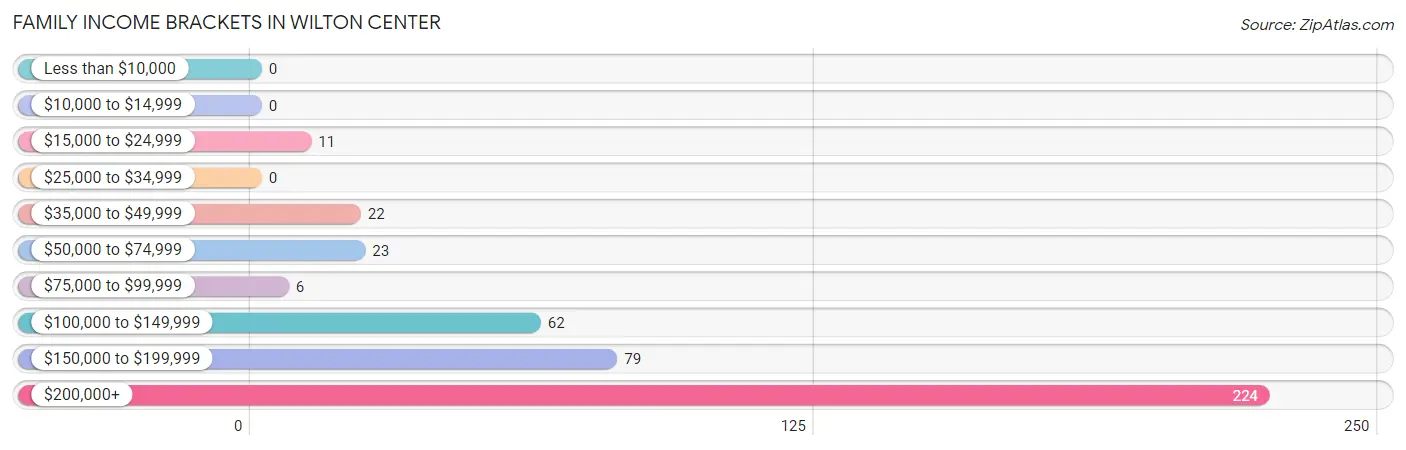
| Income Bracket | # Families | % Families |
| Less than $10,000 | 0 | 0.0% |
| $10,000 to $14,999 | 0 | 0.0% |
| $15,000 to $24,999 | 11 | 2.6% |
| $25,000 to $34,999 | 0 | 0.0% |
| $35,000 to $49,999 | 22 | 5.2% |
| $50,000 to $74,999 | 23 | 5.4% |
| $75,000 to $99,999 | 6 | 1.4% |
| $100,000 to $149,999 | 62 | 14.5% |
| $150,000 to $199,999 | 79 | 18.5% |
| $200,000+ | 224 | 52.5% |
Family Income by Famaliy Size in Wilton Center
2-person families (197 | 46.1%) account for the highest median family income in Wilton Center with $250,001 per family, while 2-person families (197 | 46.1%) have the highest median income of $125,000 per family member.
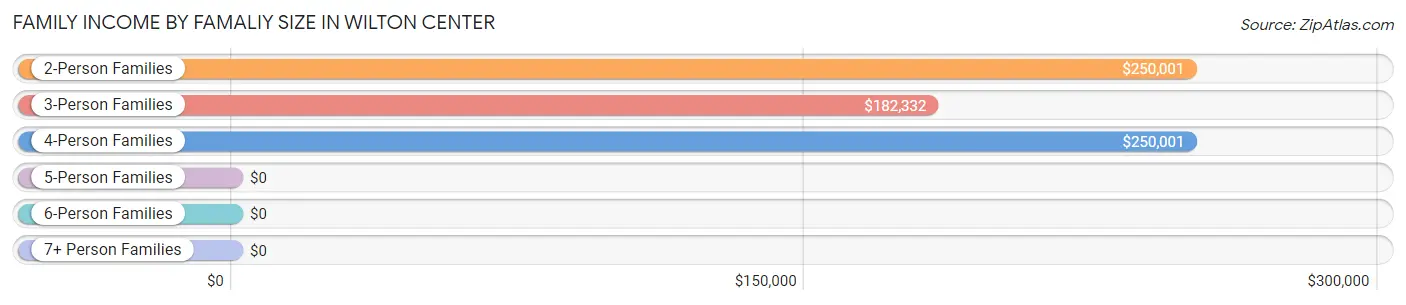
| Income Bracket | # Families | Median Income |
| 2-Person Families | 197 (46.1%) | $250,001 |
| 3-Person Families | 127 (29.7%) | $182,332 |
| 4-Person Families | 103 (24.1%) | $250,001 |
| 5-Person Families | 0 (0.0%) | $0 |
| 6-Person Families | 0 (0.0%) | $0 |
| 7+ Person Families | 0 (0.0%) | $0 |
| Total | 427 (100.0%) | $204,250 |
Family Income by Number of Earners in Wilton Center
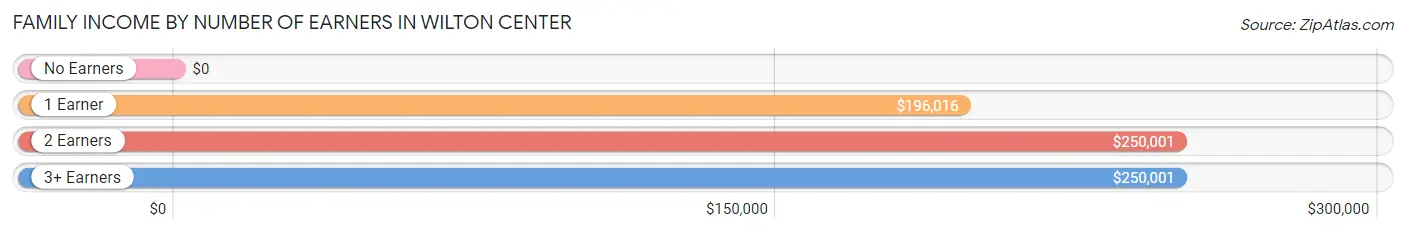
| Number of Earners | # Families | Median Income |
| No Earners | 52 (12.2%) | $0 |
| 1 Earner | 105 (24.6%) | $196,016 |
| 2 Earners | 242 (56.7%) | $250,001 |
| 3+ Earners | 28 (6.6%) | $250,001 |
| Total | 427 (100.0%) | $204,250 |
Household Income in Wilton Center
Household Income Brackets in Wilton Center
With 270 households falling in the category, the $200,000+ income range is the most frequent in Wilton Center, accounting for 33.3% of all households.
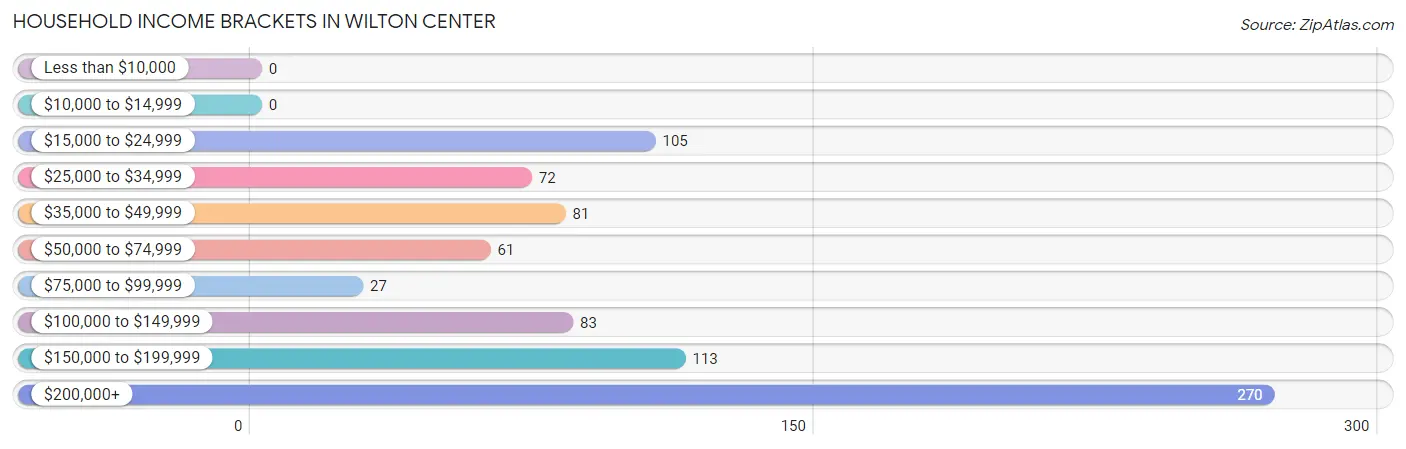
| Income Bracket | # Households | % Households |
| Less than $10,000 | 0 | 0.0% |
| $10,000 to $14,999 | 0 | 0.0% |
| $15,000 to $24,999 | 105 | 12.9% |
| $25,000 to $34,999 | 72 | 8.9% |
| $35,000 to $49,999 | 81 | 10.0% |
| $50,000 to $74,999 | 61 | 7.5% |
| $75,000 to $99,999 | 27 | 3.3% |
| $100,000 to $149,999 | 83 | 10.2% |
| $150,000 to $199,999 | 113 | 13.9% |
| $200,000+ | 270 | 33.3% |
Household Income by Householder Age in Wilton Center
The median household income in Wilton Center is $130,543, with the highest median household income of $222,000 found in the 45 to 64 years age bracket for the primary householder. A total of 308 households (37.9%) fall into this category. Meanwhile, the 15 to 24 years age bracket for the primary householder has the lowest median household income of $0, with 28 households (3.5%) in this group.
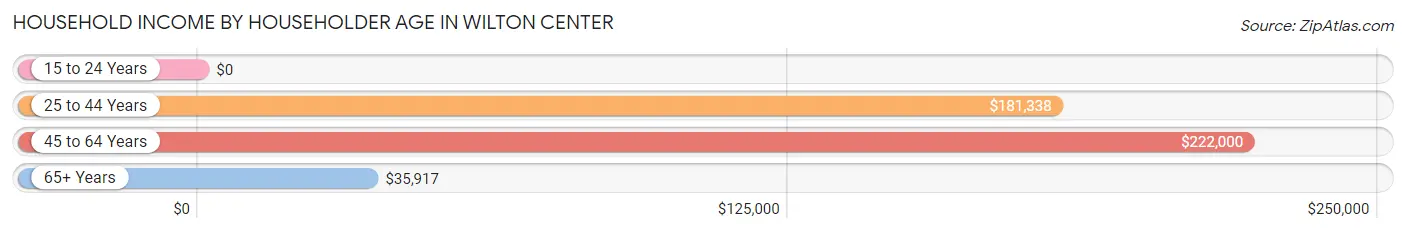
| Income Bracket | # Households | Median Income |
| 15 to 24 Years | 28 (3.5%) | $0 |
| 25 to 44 Years | 167 (20.6%) | $181,338 |
| 45 to 64 Years | 308 (37.9%) | $222,000 |
| 65+ Years | 309 (38.1%) | $35,917 |
| Total | 812 (100.0%) | $130,543 |
Poverty in Wilton Center
Income Below Poverty by Sex and Age in Wilton Center
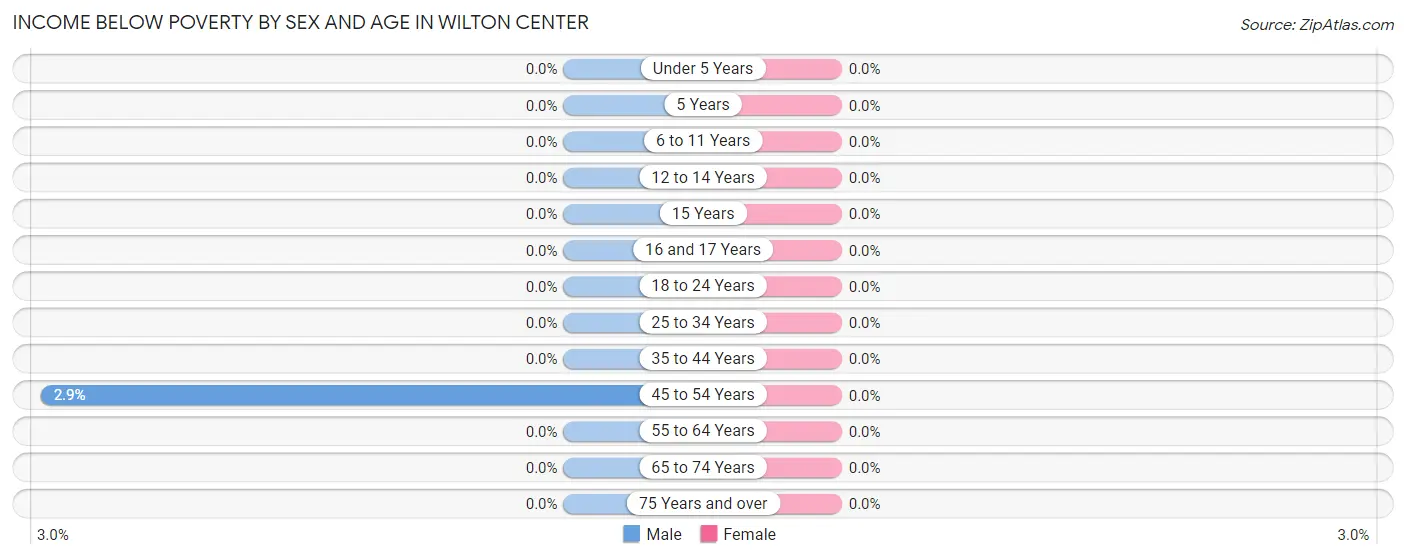
| Age Bracket | Male | Female |
| Under 5 Years | 0 (0.0%) | 0 (0.0%) |
| 5 Years | 0 (0.0%) | 0 (0.0%) |
| 6 to 11 Years | 0 (0.0%) | 0 (0.0%) |
| 12 to 14 Years | 0 (0.0%) | 0 (0.0%) |
| 15 Years | 0 (0.0%) | 0 (0.0%) |
| 16 and 17 Years | 0 (0.0%) | 0 (0.0%) |
| 18 to 24 Years | 0 (0.0%) | 0 (0.0%) |
| 25 to 34 Years | 0 (0.0%) | 0 (0.0%) |
| 35 to 44 Years | 0 (0.0%) | 0 (0.0%) |
| 45 to 54 Years | 3 (2.9%) | 0 (0.0%) |
| 55 to 64 Years | 0 (0.0%) | 0 (0.0%) |
| 65 to 74 Years | 0 (0.0%) | 0 (0.0%) |
| 75 Years and over | 0 (0.0%) | 0 (0.0%) |
| Total | 3 (0.4%) | 0 (0.0%) |
Income Above Poverty by Sex and Age in Wilton Center
According to the poverty statistics in Wilton Center, males aged under 5 years and females aged under 5 years are the age groups that are most secure financially, with 100.0% of males and 100.0% of females in these age groups living above the poverty line.
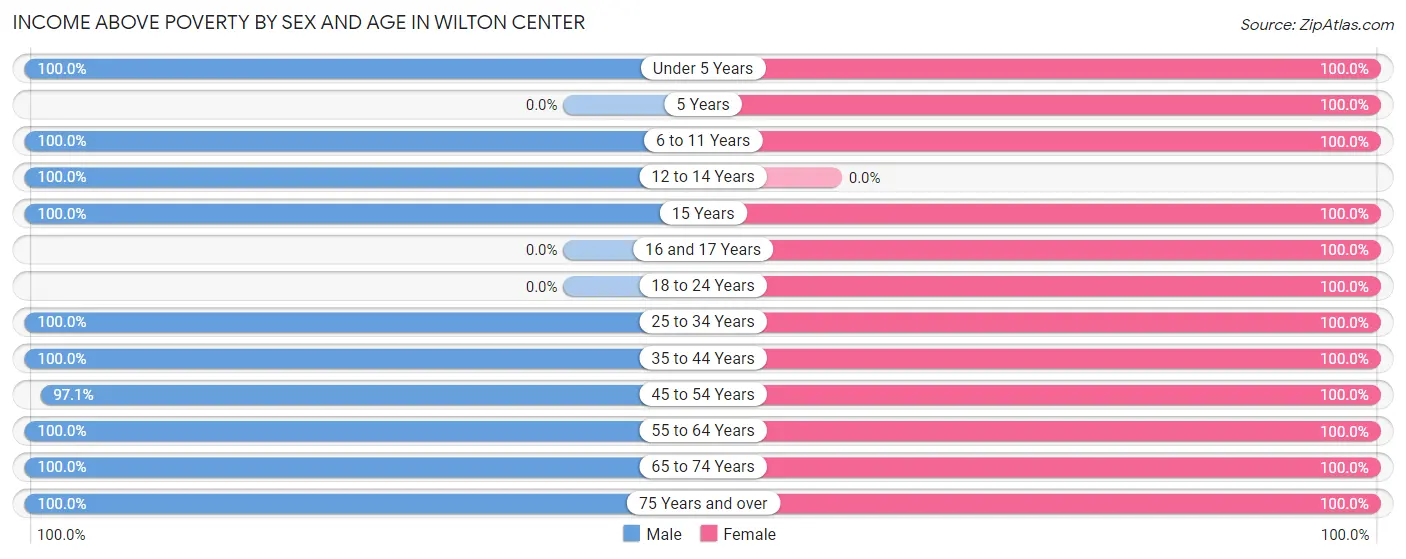
| Age Bracket | Male | Female |
| Under 5 Years | 13 (100.0%) | 21 (100.0%) |
| 5 Years | 0 (0.0%) | 1 (100.0%) |
| 6 to 11 Years | 56 (100.0%) | 22 (100.0%) |
| 12 to 14 Years | 33 (100.0%) | 0 (0.0%) |
| 15 Years | 68 (100.0%) | 4 (100.0%) |
| 16 and 17 Years | 0 (0.0%) | 63 (100.0%) |
| 18 to 24 Years | 0 (0.0%) | 87 (100.0%) |
| 25 to 34 Years | 34 (100.0%) | 83 (100.0%) |
| 35 to 44 Years | 112 (100.0%) | 55 (100.0%) |
| 45 to 54 Years | 100 (97.1%) | 144 (100.0%) |
| 55 to 64 Years | 152 (100.0%) | 189 (100.0%) |
| 65 to 74 Years | 72 (100.0%) | 125 (100.0%) |
| 75 Years and over | 52 (100.0%) | 130 (100.0%) |
| Total | 692 (99.6%) | 924 (100.0%) |
Income Below Poverty Among Married-Couple Families in Wilton Center
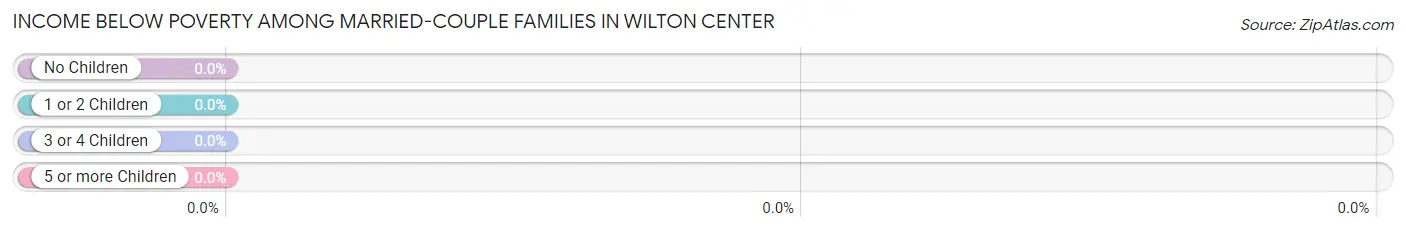
| Children | Above Poverty | Below Poverty |
| No Children | 196 (100.0%) | 0 (0.0%) |
| 1 or 2 Children | 213 (100.0%) | 0 (0.0%) |
| 3 or 4 Children | 0 (0.0%) | 0 (0.0%) |
| 5 or more Children | 0 (0.0%) | 0 (0.0%) |
| Total | 409 (100.0%) | 0 (0.0%) |
Income Below Poverty Among Single-Parent Households in Wilton Center
| Children | Single Father | Single Mother |
| No Children | 0 (0.0%) | 0 (0.0%) |
| 1 or 2 Children | 0 (0.0%) | 0 (0.0%) |
| 3 or 4 Children | 0 (0.0%) | 0 (0.0%) |
| 5 or more Children | 0 (0.0%) | 0 (0.0%) |
| Total | 0 (0.0%) | 0 (0.0%) |
Income Below Poverty Among Married-Couple vs Single-Parent Households in Wilton Center
| Children | Married-Couple Families | Single-Parent Households |
| No Children | 0 (0.0%) | 0 (0.0%) |
| 1 or 2 Children | 0 (0.0%) | 0 (0.0%) |
| 3 or 4 Children | 0 (0.0%) | 0 (0.0%) |
| 5 or more Children | 0 (0.0%) | 0 (0.0%) |
| Total | 0 (0.0%) | 0 (0.0%) |
Race in Wilton Center
The most populous races in Wilton Center are White / Caucasian (1,233 | 75.1%), Hispanic or Latino (247 | 15.0%), and Asian (200 | 12.2%).
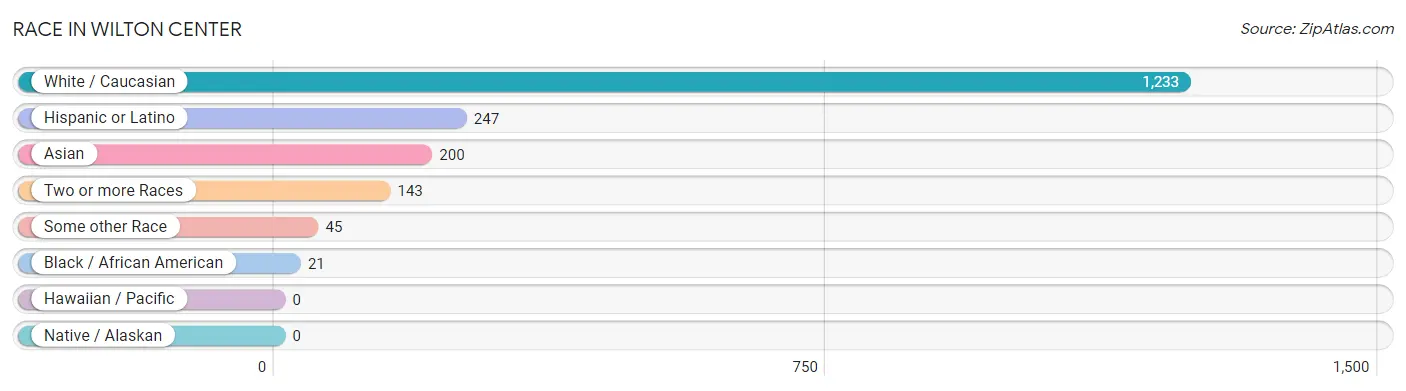
| Race | # Population | % Population |
| Asian | 200 | 12.2% |
| Black / African American | 21 | 1.3% |
| Hawaiian / Pacific | 0 | 0.0% |
| Hispanic or Latino | 247 | 15.0% |
| Native / Alaskan | 0 | 0.0% |
| White / Caucasian | 1,233 | 75.1% |
| Two or more Races | 143 | 8.7% |
| Some other Race | 45 | 2.7% |
| Total | 1,642 | 100.0% |
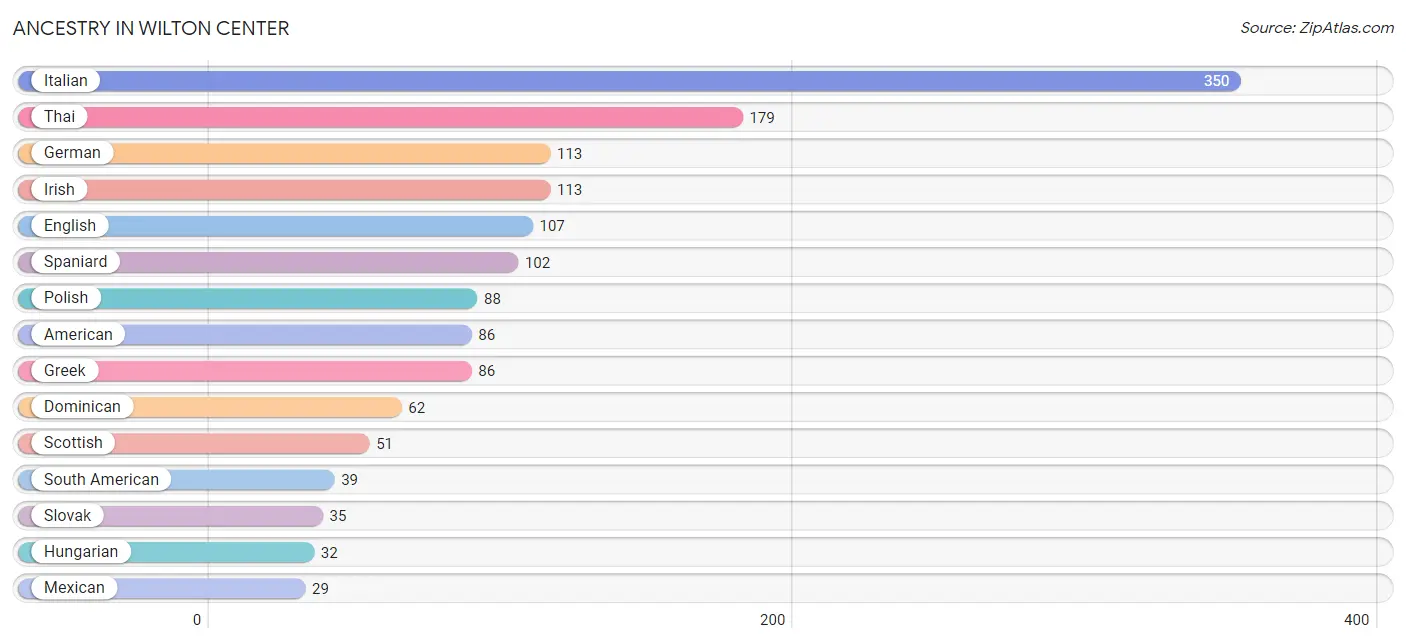
Ancestry in Wilton Center
The most populous ancestries reported in Wilton Center are Italian (350 | 21.3%), Thai (179 | 10.9%), German (113 | 6.9%), Irish (113 | 6.9%), and English (107 | 6.5%), together accounting for 52.5% of all Wilton Center residents.
| Ancestry | # Population | % Population |
| American | 86 | 5.2% |
| Arab | 14 | 0.9% |
| Austrian | 9 | 0.5% |
| British | 9 | 0.5% |
| Burmese | 23 | 1.4% |
| Colombian | 17 | 1.0% |
| Dominican | 62 | 3.8% |
| Eastern European | 4 | 0.2% |
| Egyptian | 14 | 0.9% |
| English | 107 | 6.5% |
| Filipino | 12 | 0.7% |
| Finnish | 6 | 0.4% |
| French Canadian | 13 | 0.8% |
| German | 113 | 6.9% |
| Greek | 86 | 5.2% |
| Hungarian | 32 | 1.9% |
| Indian (Asian) | 5 | 0.3% |
| Irish | 113 | 6.9% |
| Italian | 350 | 21.3% |
| Mexican | 29 | 1.8% |
| Peruvian | 12 | 0.7% |
| Polish | 88 | 5.4% |
| Puerto Rican | 15 | 0.9% |
| Scandinavian | 4 | 0.2% |
| Scotch-Irish | 7 | 0.4% |
| Scottish | 51 | 3.1% |
| Slovak | 35 | 2.1% |
| South American | 39 | 2.4% |
| Spaniard | 102 | 6.2% |
| Sri Lankan | 7 | 0.4% |
| Thai | 179 | 10.9% |
| Venezuelan | 10 | 0.6% |
| Welsh | 15 | 0.9% | View All 33 Rows |
Immigrants in Wilton Center
The most numerous immigrant groups reported in Wilton Center came from Asia (192 | 11.7%), India (161 | 9.8%), South Central Asia (161 | 9.8%), Latin America (78 | 4.8%), and Europe (72 | 4.4%), together accounting for 40.4% of all Wilton Center residents.
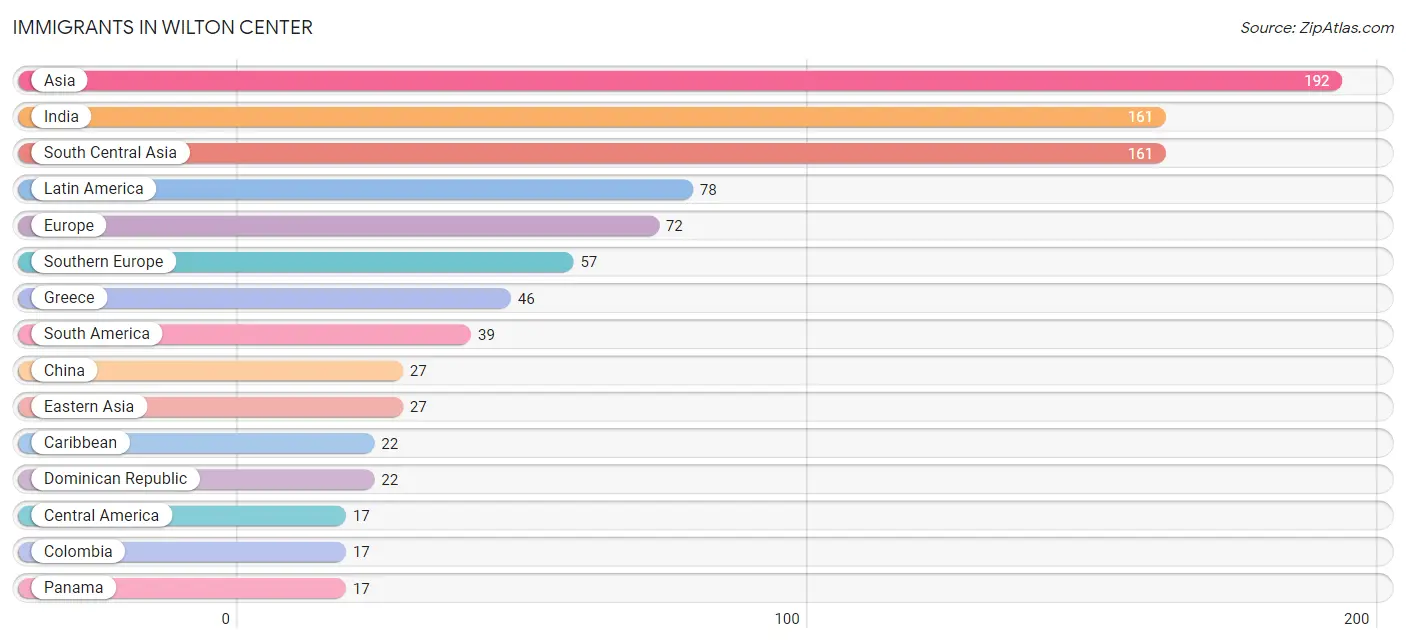
| Immigration Origin | # Population | % Population |
| Asia | 192 | 11.7% |
| Caribbean | 22 | 1.3% |
| Central America | 17 | 1.0% |
| China | 27 | 1.6% |
| Colombia | 17 | 1.0% |
| Dominican Republic | 22 | 1.3% |
| Eastern Asia | 27 | 1.6% |
| Europe | 72 | 4.4% |
| Greece | 46 | 2.8% |
| Hong Kong | 12 | 0.7% |
| India | 161 | 9.8% |
| Italy | 11 | 0.7% |
| Latin America | 78 | 4.8% |
| Northern Europe | 15 | 0.9% |
| Panama | 17 | 1.0% |
| Peru | 12 | 0.7% |
| South America | 39 | 2.4% |
| South Central Asia | 161 | 9.8% |
| South Eastern Asia | 4 | 0.2% |
| Southern Europe | 57 | 3.5% |
| Taiwan | 12 | 0.7% |
| Venezuela | 10 | 0.6% |
| Vietnam | 4 | 0.2% | View All 23 Rows |
Sex and Age in Wilton Center
Sex and Age in Wilton Center
The most populous age groups in Wilton Center are 35 to 39 Years (91 | 12.8%) for men and 60 to 64 Years (112 | 12.1%) for women.
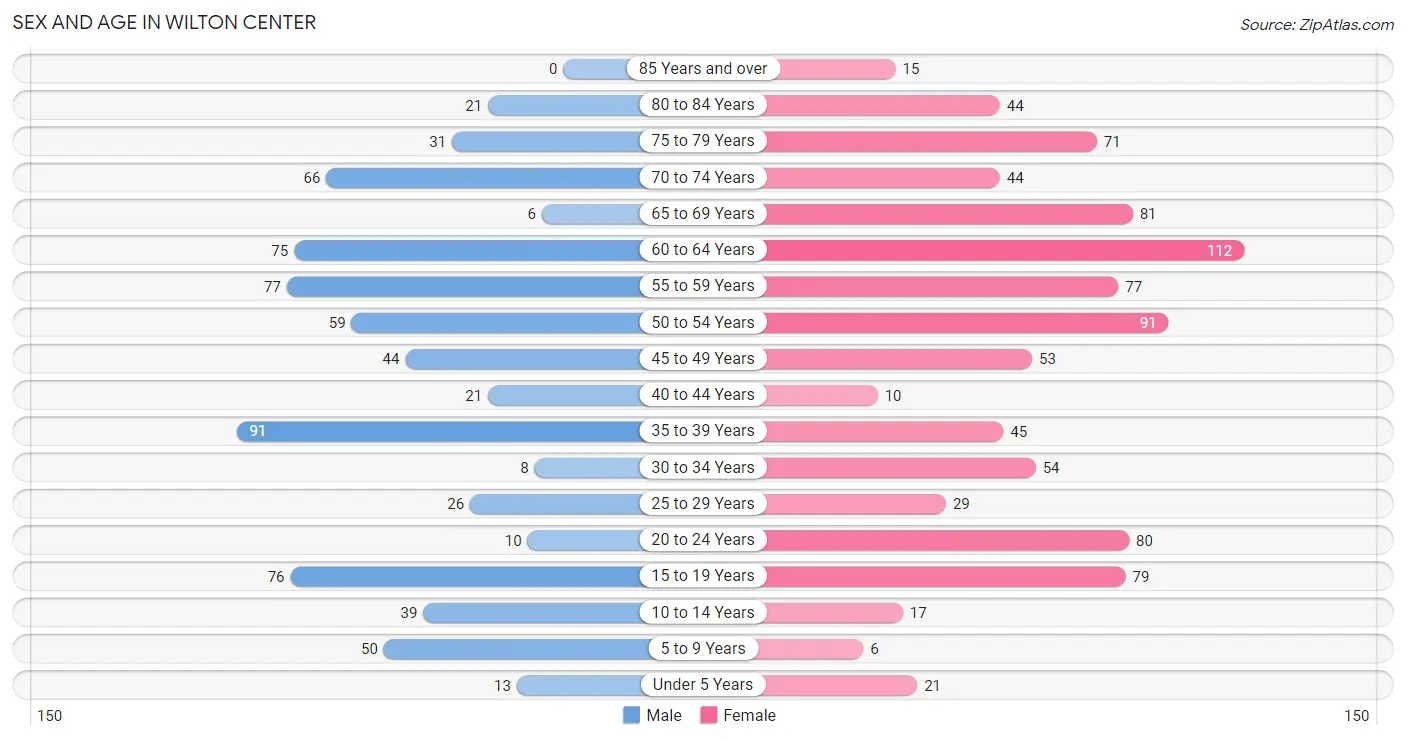
| Age Bracket | Male | Female |
| Under 5 Years | 13 (1.8%) | 21 (2.3%) |
| 5 to 9 Years | 50 (7.0%) | 6 (0.6%) |
| 10 to 14 Years | 39 (5.5%) | 17 (1.8%) |
| 15 to 19 Years | 76 (10.7%) | 79 (8.5%) |
| 20 to 24 Years | 10 (1.4%) | 80 (8.6%) |
| 25 to 29 Years | 26 (3.6%) | 29 (3.1%) |
| 30 to 34 Years | 8 (1.1%) | 54 (5.8%) |
| 35 to 39 Years | 91 (12.8%) | 45 (4.8%) |
| 40 to 44 Years | 21 (2.9%) | 10 (1.1%) |
| 45 to 49 Years | 44 (6.2%) | 53 (5.7%) |
| 50 to 54 Years | 59 (8.3%) | 91 (9.8%) |
| 55 to 59 Years | 77 (10.8%) | 77 (8.3%) |
| 60 to 64 Years | 75 (10.5%) | 112 (12.1%) |
| 65 to 69 Years | 6 (0.8%) | 81 (8.7%) |
| 70 to 74 Years | 66 (9.3%) | 44 (4.7%) |
| 75 to 79 Years | 31 (4.3%) | 71 (7.6%) |
| 80 to 84 Years | 21 (2.9%) | 44 (4.7%) |
| 85 Years and over | 0 (0.0%) | 15 (1.6%) |
| Total | 713 (100.0%) | 929 (100.0%) |
Families and Households in Wilton Center
Median Family Size in Wilton Center
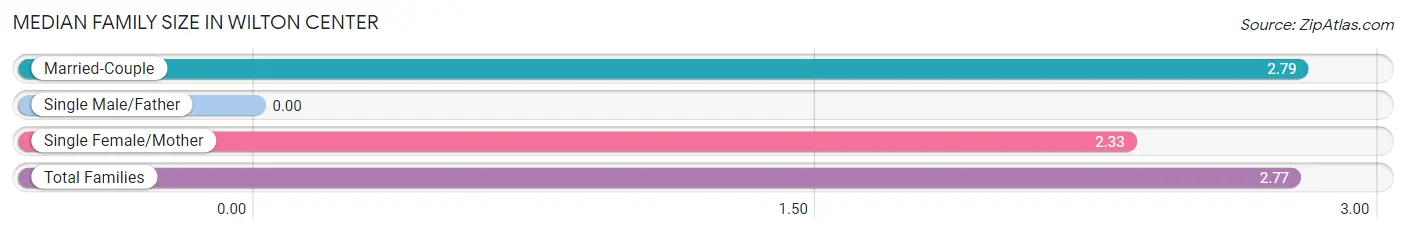
| Family Type | # Families | Family Size |
| Married-Couple | 409 (95.8%) | 2.79 |
| Single Male/Father | 0 (0.0%) | - |
| Single Female/Mother | 18 (4.2%) | 2.33 |
| Total Families | 427 (100.0%) | 2.77 |
Median Household Size in Wilton Center
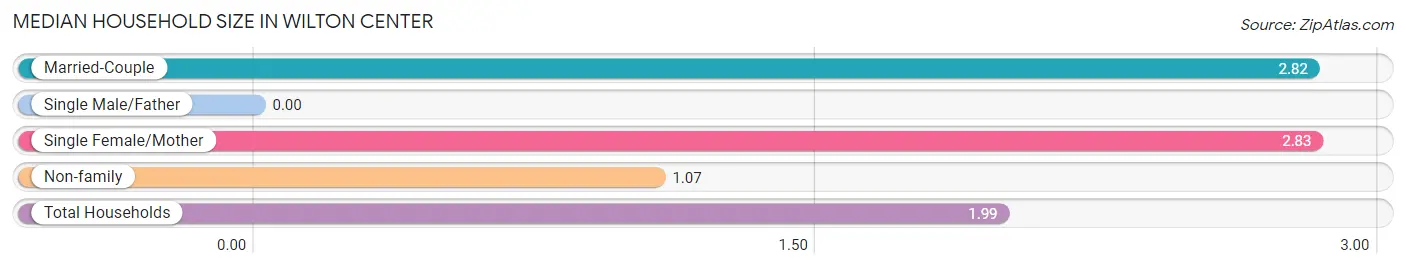
| Household Type | # Households | Household Size |
| Married-Couple | 409 (50.4%) | 2.82 |
| Single Male/Father | 0 (0.0%) | - |
| Single Female/Mother | 18 (2.2%) | 2.83 |
| Non-family | 385 (47.4%) | 1.07 |
| Total Households | 812 (100.0%) | 1.99 |
Household Size by Marriage Status in Wilton Center
Out of a total of 812 households in Wilton Center, 427 (52.6%) are family households, while 385 (47.4%) are nonfamily households. The most numerous type of family households are 2-person households, comprising 186, and the most common type of nonfamily households are 1-person households, comprising 362.
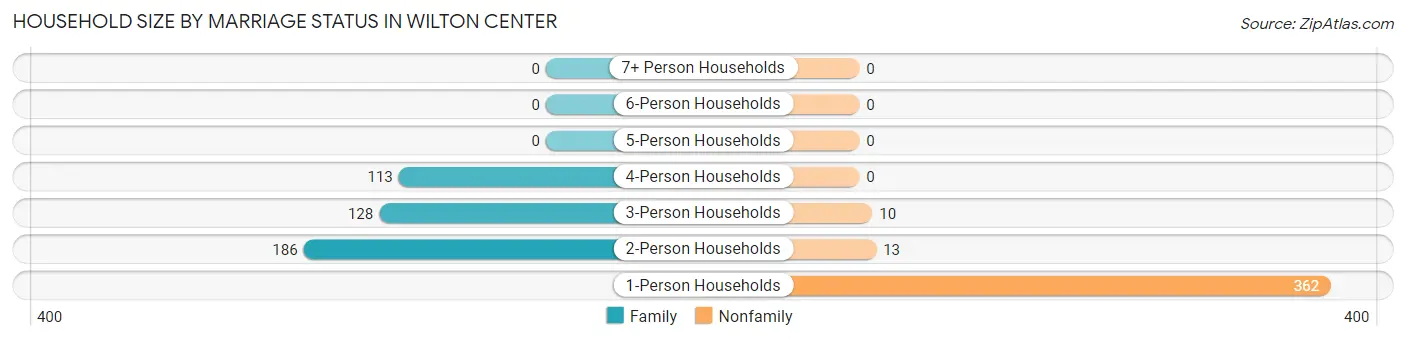
| Household Size | Family Households | Nonfamily Households |
| 1-Person Households | - | 362 (44.6%) |
| 2-Person Households | 186 (22.9%) | 13 (1.6%) |
| 3-Person Households | 128 (15.8%) | 10 (1.2%) |
| 4-Person Households | 113 (13.9%) | 0 (0.0%) |
| 5-Person Households | 0 (0.0%) | 0 (0.0%) |
| 6-Person Households | 0 (0.0%) | 0 (0.0%) |
| 7+ Person Households | 0 (0.0%) | 0 (0.0%) |
| Total | 427 (52.6%) | 385 (47.4%) |
Female Fertility in Wilton Center
Fertility by Age in Wilton Center
| Age Bracket | Women with Births | Births / 1,000 Women |
| 15 to 19 years | 0 (0.0%) | 0.0 |
| 20 to 34 years | 0 (0.0%) | 0.0 |
| 35 to 50 years | 0 (0.0%) | 0.0 |
| Total | 0 (0.0%) | 0.0 |
Fertility by Age by Marriage Status in Wilton Center
| Age Bracket | Married | Unmarried |
| 15 to 19 years | 0 (0.0%) | 0 (0.0%) |
| 20 to 34 years | 0 (0.0%) | 0 (0.0%) |
| 35 to 50 years | 0 (0.0%) | 0 (0.0%) |
| Total | 0 (0.0%) | 0 (0.0%) |
Fertility by Education in Wilton Center
| Educational Attainment | Women with Births | Births / 1,000 Women |
| Less than High School | 0 (0.0%) | 0.0 |
| High School Diploma | 0 (0.0%) | 0.0 |
| College or Associate's Degree | 0 (0.0%) | 0.0 |
| Bachelor's Degree | 0 (0.0%) | 0.0 |
| Graduate Degree | 0 (0.0%) | 0.0 |
| Total | 0 (0.0%) | 0.0 |
Fertility by Education by Marriage Status in Wilton Center
| Educational Attainment | Married | Unmarried |
| Less than High School | 0 (0.0%) | 0 (0.0%) |
| High School Diploma | 0 (0.0%) | 0 (0.0%) |
| College or Associate's Degree | 0 (0.0%) | 0 (0.0%) |
| Bachelor's Degree | 0 (0.0%) | 0 (0.0%) |
| Graduate Degree | 0 (0.0%) | 0 (0.0%) |
| Total | 0 (0.0%) | 0 (0.0%) |
Employment Characteristics in Wilton Center
Employment by Class of Employer in Wilton Center
Among the 842 employed individuals in Wilton Center, private company employees (542 | 64.4%), self-employed (not incorporated) (100 | 11.9%), and not-for-profit organizations (85 | 10.1%) make up the most common classes of employment.
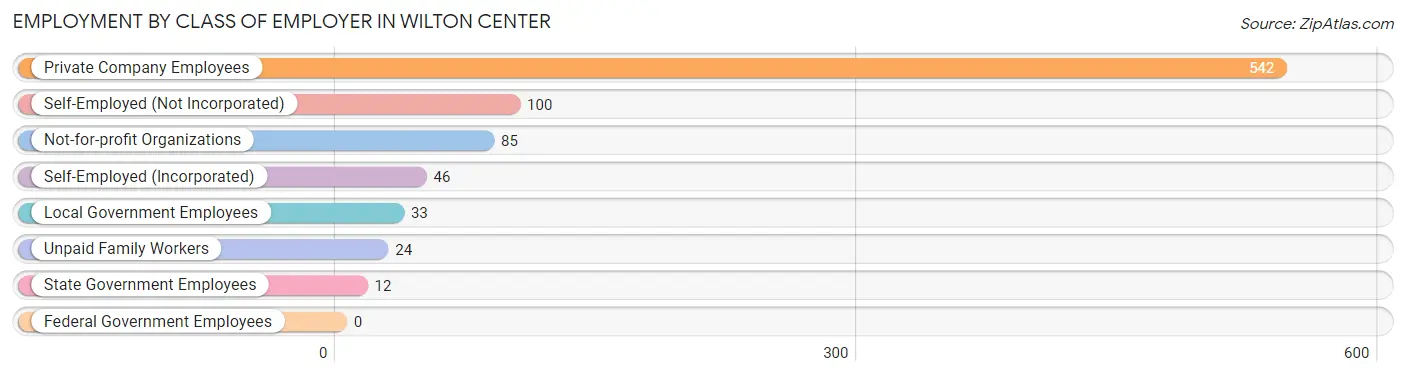
| Employer Class | # Employees | % Employees |
| Private Company Employees | 542 | 64.4% |
| Self-Employed (Incorporated) | 46 | 5.5% |
| Self-Employed (Not Incorporated) | 100 | 11.9% |
| Not-for-profit Organizations | 85 | 10.1% |
| Local Government Employees | 33 | 3.9% |
| State Government Employees | 12 | 1.4% |
| Federal Government Employees | 0 | 0.0% |
| Unpaid Family Workers | 24 | 2.9% |
| Total | 842 | 100.0% |
Employment Status by Age in Wilton Center
According to the labor force statistics for Wilton Center, out of the total population over 16 years of age (1,424), 61.4% or 874 individuals are in the labor force, with 2.4% or 21 of them unemployed. The age group with the highest labor force participation rate is 25 to 29 years, with 100.0% or 55 individuals in the labor force. Within the labor force, the 65 to 74 years age range has the highest percentage of unemployed individuals, with 22.1% or 21 of them being unemployed.
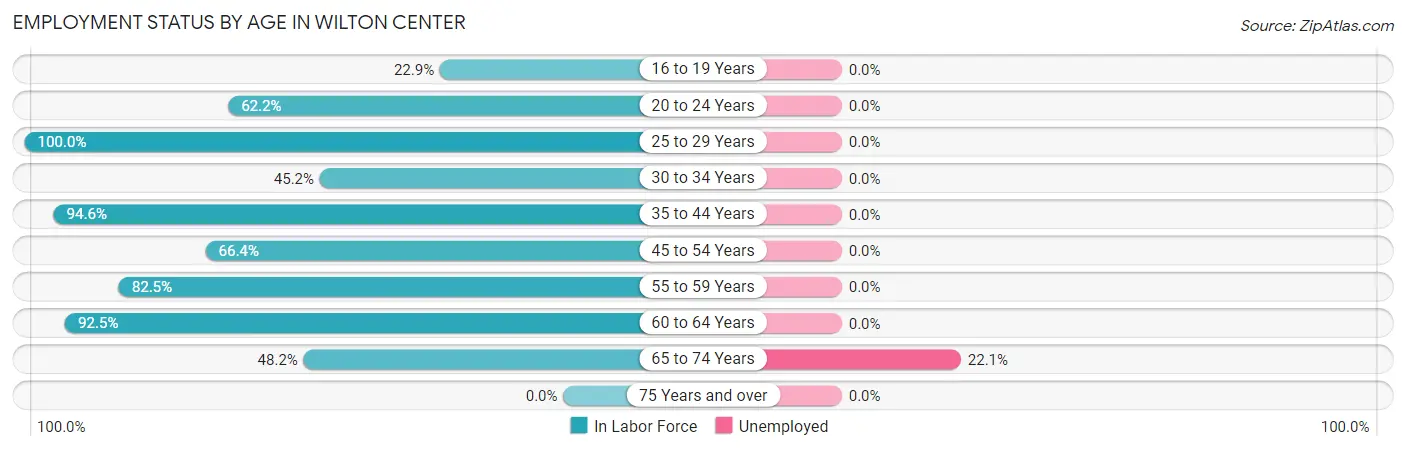
| Age Bracket | In Labor Force | Unemployed |
| 16 to 19 Years | 19 (22.9%) | 0 (0.0%) |
| 20 to 24 Years | 56 (62.2%) | 0 (0.0%) |
| 25 to 29 Years | 55 (100.0%) | 0 (0.0%) |
| 30 to 34 Years | 28 (45.2%) | 0 (0.0%) |
| 35 to 44 Years | 158 (94.6%) | 0 (0.0%) |
| 45 to 54 Years | 164 (66.4%) | 0 (0.0%) |
| 55 to 59 Years | 127 (82.5%) | 0 (0.0%) |
| 60 to 64 Years | 173 (92.5%) | 0 (0.0%) |
| 65 to 74 Years | 95 (48.2%) | 21 (22.1%) |
| 75 Years and over | 0 (0.0%) | 0 (0.0%) |
| Total | 874 (61.4%) | 21 (2.4%) |
Employment Status by Educational Attainment in Wilton Center
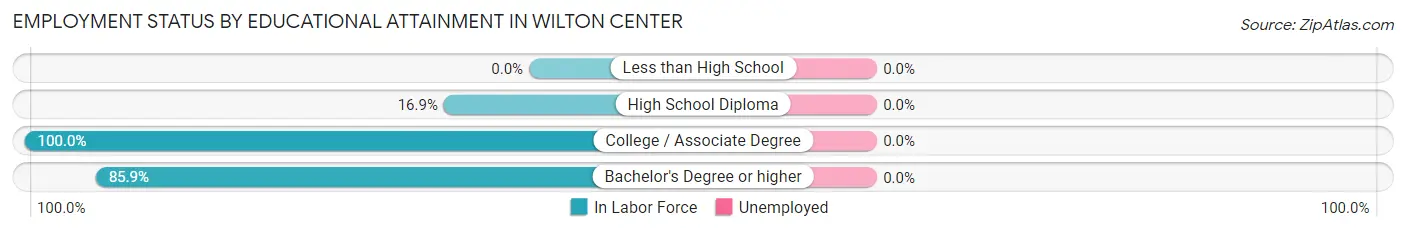
| Educational Attainment | In Labor Force | Unemployed |
| Less than High School | 0 (0.0%) | 0 (0.0%) |
| High School Diploma | 11 (16.9%) | 0 (0.0%) |
| College / Associate Degree | 80 (100.0%) | 0 (0.0%) |
| Bachelor's Degree or higher | 614 (85.9%) | 0 (0.0%) |
| Total | 705 (80.8%) | 0 (0.0%) |
Employment Occupations by Sex in Wilton Center
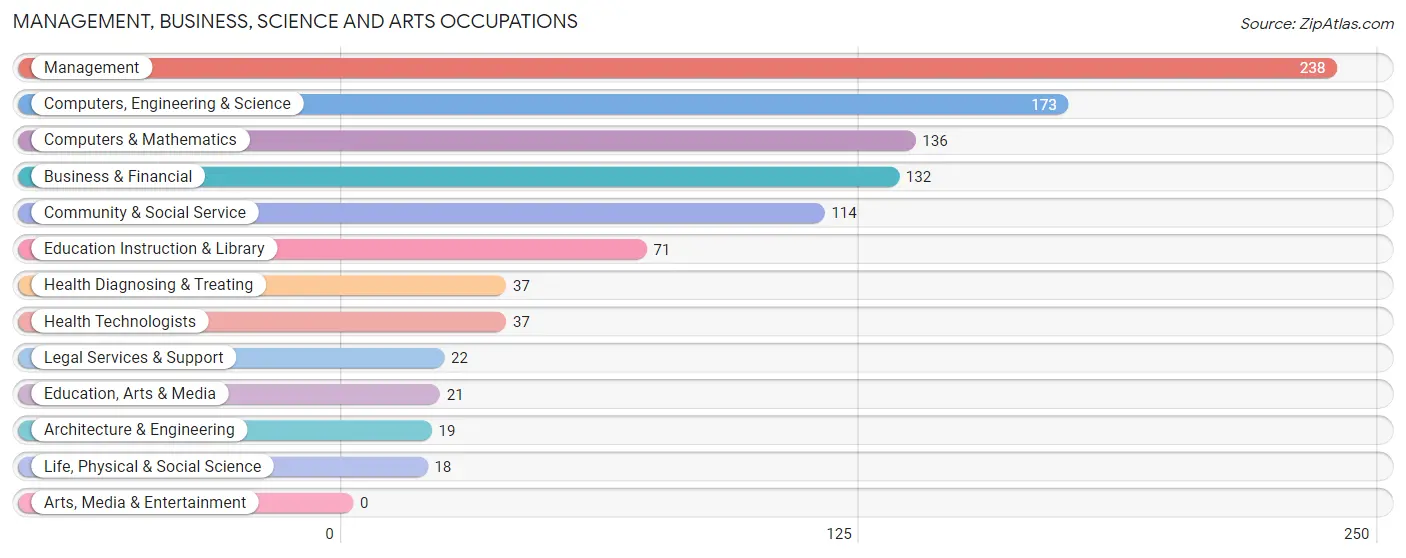
Management, Business, Science and Arts Occupations
The most common Management, Business, Science and Arts occupations in Wilton Center are Management (238 | 27.9%), Computers, Engineering & Science (173 | 20.3%), Computers & Mathematics (136 | 15.9%), Business & Financial (132 | 15.5%), and Community & Social Service (114 | 13.4%).
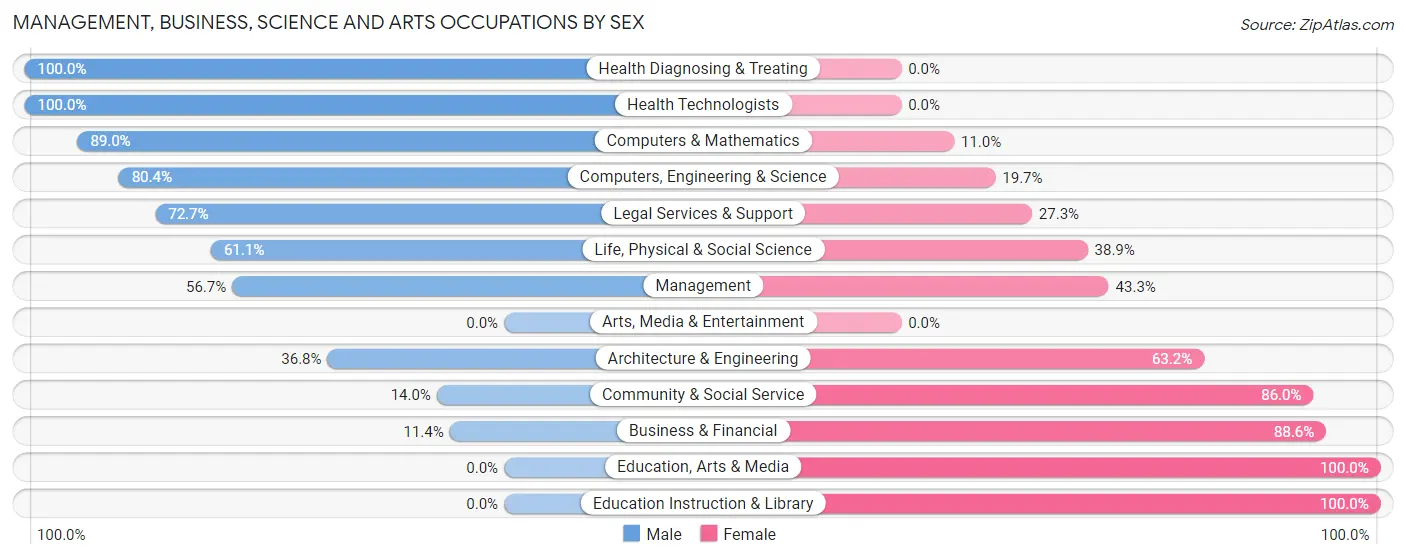
Management, Business, Science and Arts Occupations by Sex
Within the Management, Business, Science and Arts occupations in Wilton Center, the most male-oriented occupations are Health Diagnosing & Treating (100.0%), Health Technologists (100.0%), and Computers & Mathematics (89.0%), while the most female-oriented occupations are Education, Arts & Media (100.0%), Education Instruction & Library (100.0%), and Business & Financial (88.6%).
| Occupation | Male | Female |
| Management | 135 (56.7%) | 103 (43.3%) |
| Business & Financial | 15 (11.4%) | 117 (88.6%) |
| Computers, Engineering & Science | 139 (80.3%) | 34 (19.7%) |
| Computers & Mathematics | 121 (89.0%) | 15 (11.0%) |
| Architecture & Engineering | 7 (36.8%) | 12 (63.2%) |
| Life, Physical & Social Science | 11 (61.1%) | 7 (38.9%) |
| Community & Social Service | 16 (14.0%) | 98 (86.0%) |
| Education, Arts & Media | 0 (0.0%) | 21 (100.0%) |
| Legal Services & Support | 16 (72.7%) | 6 (27.3%) |
| Education Instruction & Library | 0 (0.0%) | 71 (100.0%) |
| Arts, Media & Entertainment | 0 (0.0%) | 0 (0.0%) |
| Health Diagnosing & Treating | 37 (100.0%) | 0 (0.0%) |
| Health Technologists | 37 (100.0%) | 0 (0.0%) |
| Total (Category) | 342 (49.3%) | 352 (50.7%) |
| Total (Overall) | 420 (49.2%) | 434 (50.8%) |
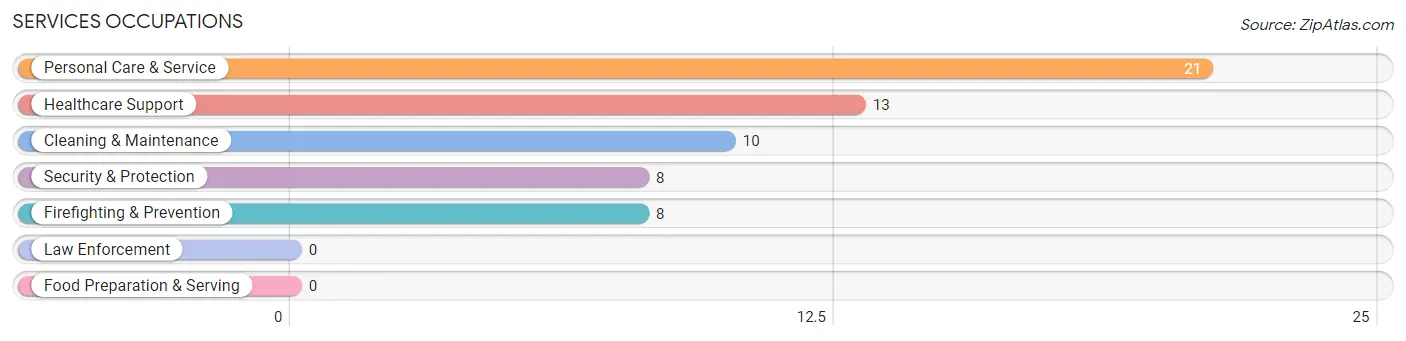
Services Occupations
The most common Services occupations in Wilton Center are Personal Care & Service (21 | 2.5%), Healthcare Support (13 | 1.5%), Cleaning & Maintenance (10 | 1.2%), Security & Protection (8 | 0.9%), and Firefighting & Prevention (8 | 0.9%).
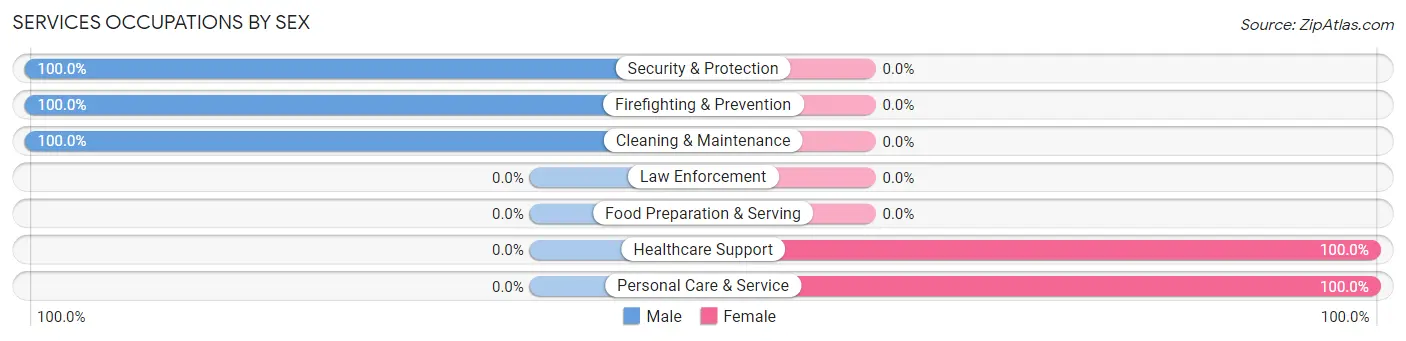
Services Occupations by Sex
Within the Services occupations in Wilton Center, the most male-oriented occupations are Security & Protection (100.0%), Firefighting & Prevention (100.0%), and Cleaning & Maintenance (100.0%), while the most female-oriented occupations are Healthcare Support (100.0%), and Personal Care & Service (100.0%).
| Occupation | Male | Female |
| Healthcare Support | 0 (0.0%) | 13 (100.0%) |
| Security & Protection | 8 (100.0%) | 0 (0.0%) |
| Firefighting & Prevention | 8 (100.0%) | 0 (0.0%) |
| Law Enforcement | 0 (0.0%) | 0 (0.0%) |
| Food Preparation & Serving | 0 (0.0%) | 0 (0.0%) |
| Cleaning & Maintenance | 10 (100.0%) | 0 (0.0%) |
| Personal Care & Service | 0 (0.0%) | 21 (100.0%) |
| Total (Category) | 18 (34.6%) | 34 (65.4%) |
| Total (Overall) | 420 (49.2%) | 434 (50.8%) |
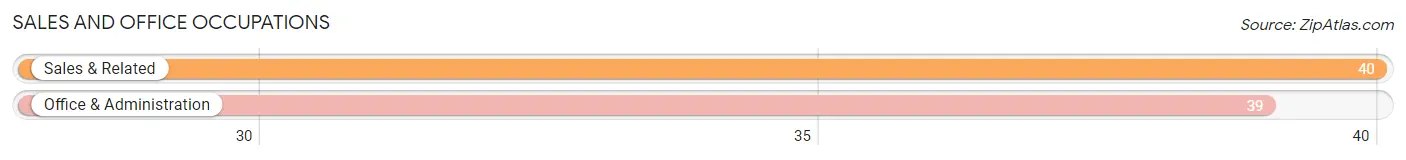
Sales and Office Occupations
The most common Sales and Office occupations in Wilton Center are Sales & Related (40 | 4.7%), and Office & Administration (39 | 4.6%).
Sales and Office Occupations by Sex
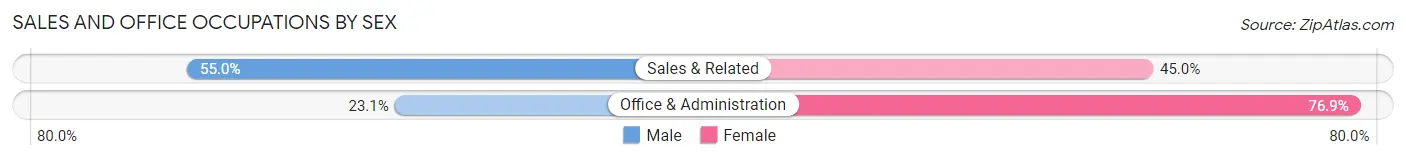
| Occupation | Male | Female |
| Sales & Related | 22 (55.0%) | 18 (45.0%) |
| Office & Administration | 9 (23.1%) | 30 (76.9%) |
| Total (Category) | 31 (39.2%) | 48 (60.8%) |
| Total (Overall) | 420 (49.2%) | 434 (50.8%) |
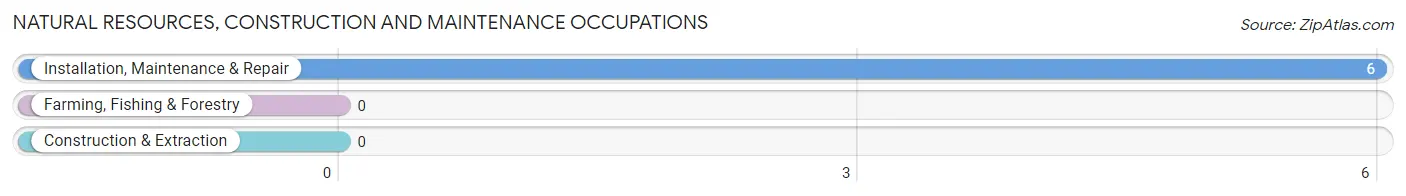
Natural Resources, Construction and Maintenance Occupations
The most common Natural Resources, Construction and Maintenance occupations in Wilton Center are , and Installation, Maintenance & Repair (6 | 0.7%).
Natural Resources, Construction and Maintenance Occupations by Sex
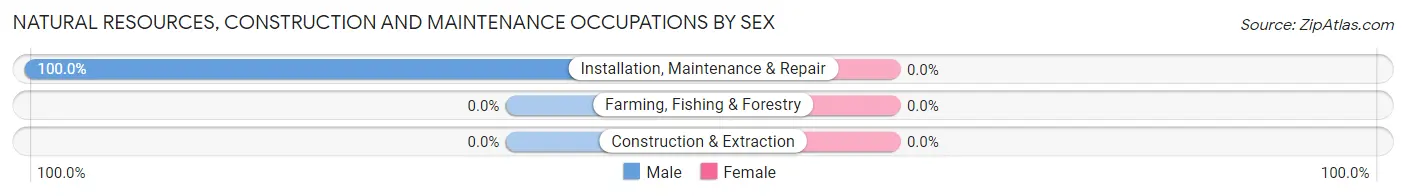
| Occupation | Male | Female |
| Farming, Fishing & Forestry | 0 (0.0%) | 0 (0.0%) |
| Construction & Extraction | 0 (0.0%) | 0 (0.0%) |
| Installation, Maintenance & Repair | 6 (100.0%) | 0 (0.0%) |
| Total (Category) | 6 (100.0%) | 0 (0.0%) |
| Total (Overall) | 420 (49.2%) | 434 (50.8%) |
Production, Transportation and Moving Occupations
The most common Production, Transportation and Moving occupations in Wilton Center are Production (15 | 1.8%), and Transportation (8 | 0.9%).
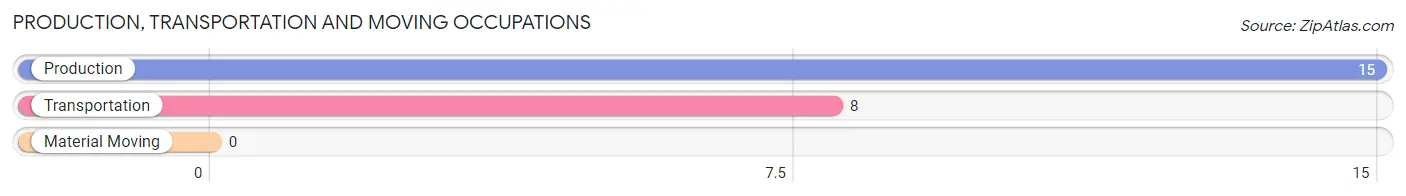
Production, Transportation and Moving Occupations by Sex
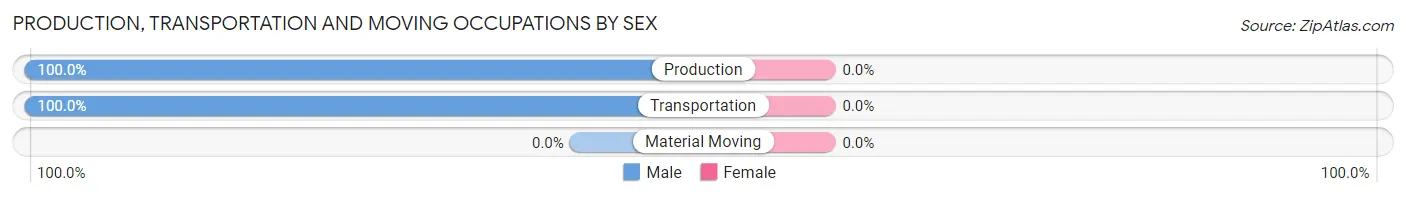
| Occupation | Male | Female |
| Production | 15 (100.0%) | 0 (0.0%) |
| Transportation | 8 (100.0%) | 0 (0.0%) |
| Material Moving | 0 (0.0%) | 0 (0.0%) |
| Total (Category) | 23 (100.0%) | 0 (0.0%) |
| Total (Overall) | 420 (49.2%) | 434 (50.8%) |
Employment Industries by Sex in Wilton Center
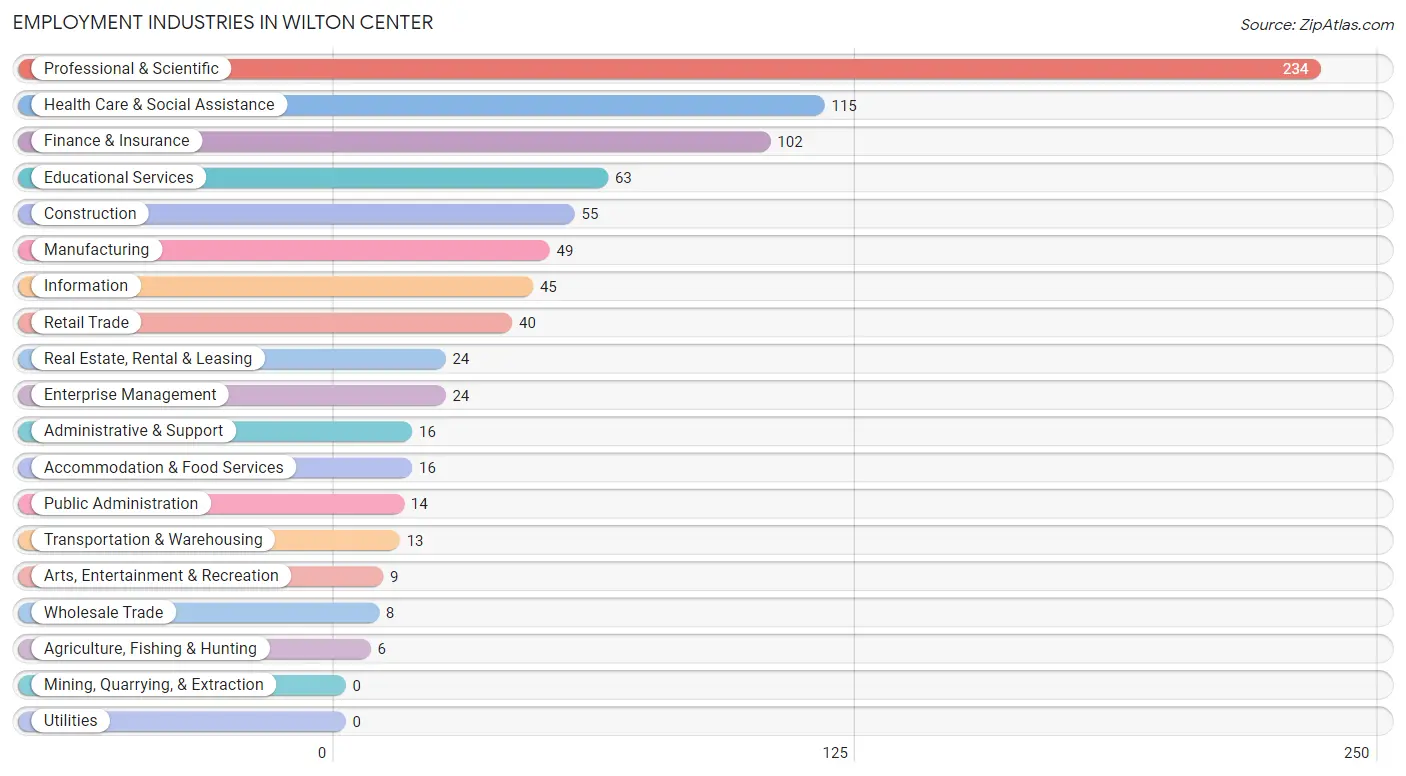
Employment Industries in Wilton Center
The major employment industries in Wilton Center include Professional & Scientific (234 | 27.4%), Health Care & Social Assistance (115 | 13.5%), Finance & Insurance (102 | 11.9%), Educational Services (63 | 7.4%), and Construction (55 | 6.4%).
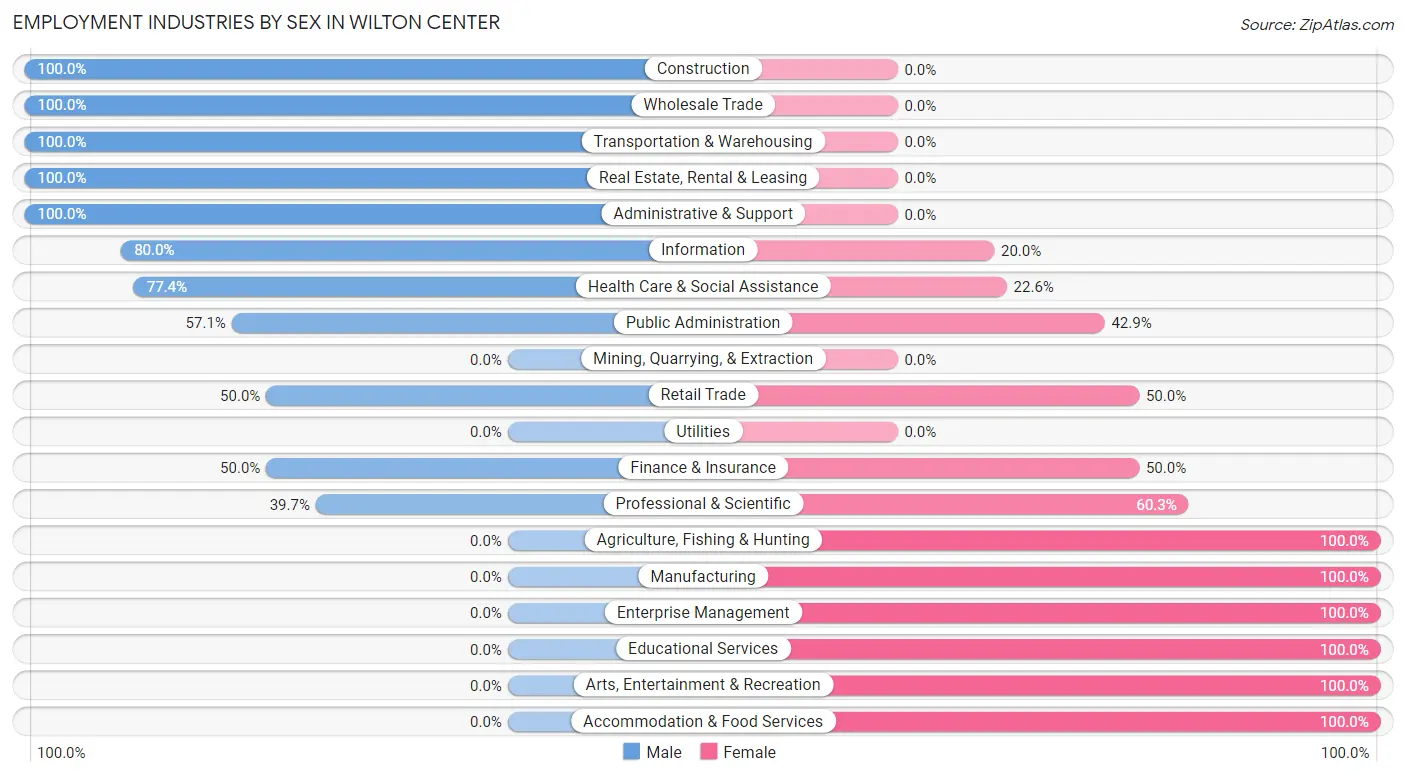
Employment Industries by Sex in Wilton Center
The Wilton Center industries that see more men than women are Construction (100.0%), Wholesale Trade (100.0%), and Transportation & Warehousing (100.0%), whereas the industries that tend to have a higher number of women are Agriculture, Fishing & Hunting (100.0%), Manufacturing (100.0%), and Enterprise Management (100.0%).
| Industry | Male | Female |
| Agriculture, Fishing & Hunting | 0 (0.0%) | 6 (100.0%) |
| Mining, Quarrying, & Extraction | 0 (0.0%) | 0 (0.0%) |
| Construction | 55 (100.0%) | 0 (0.0%) |
| Manufacturing | 0 (0.0%) | 49 (100.0%) |
| Wholesale Trade | 8 (100.0%) | 0 (0.0%) |
| Retail Trade | 20 (50.0%) | 20 (50.0%) |
| Transportation & Warehousing | 13 (100.0%) | 0 (0.0%) |
| Utilities | 0 (0.0%) | 0 (0.0%) |
| Information | 36 (80.0%) | 9 (20.0%) |
| Finance & Insurance | 51 (50.0%) | 51 (50.0%) |
| Real Estate, Rental & Leasing | 24 (100.0%) | 0 (0.0%) |
| Professional & Scientific | 93 (39.7%) | 141 (60.3%) |
| Enterprise Management | 0 (0.0%) | 24 (100.0%) |
| Administrative & Support | 16 (100.0%) | 0 (0.0%) |
| Educational Services | 0 (0.0%) | 63 (100.0%) |
| Health Care & Social Assistance | 89 (77.4%) | 26 (22.6%) |
| Arts, Entertainment & Recreation | 0 (0.0%) | 9 (100.0%) |
| Accommodation & Food Services | 0 (0.0%) | 16 (100.0%) |
| Public Administration | 8 (57.1%) | 6 (42.9%) |
| Total | 420 (49.2%) | 434 (50.8%) |
Education in Wilton Center
School Enrollment in Wilton Center
The most common levels of schooling among the 315 students in Wilton Center are high school (152 | 48.2%), college / undergraduate (57 | 18.1%), and middle school (46 | 14.6%).
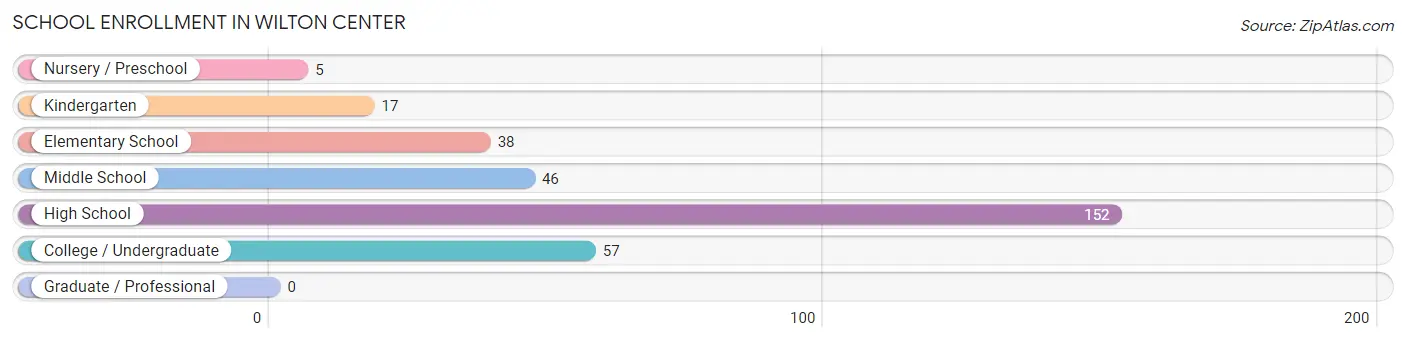
| School Level | # Students | % Students |
| Nursery / Preschool | 5 | 1.6% |
| Kindergarten | 17 | 5.4% |
| Elementary School | 38 | 12.1% |
| Middle School | 46 | 14.6% |
| High School | 152 | 48.2% |
| College / Undergraduate | 57 | 18.1% |
| Graduate / Professional | 0 | 0.0% |
| Total | 315 | 100.0% |
School Enrollment by Age by Funding Source in Wilton Center
Out of a total of 315 students who are enrolled in schools in Wilton Center, 73 (23.2%) attend a private institution, while the remaining 242 (76.8%) are enrolled in public schools. The age group of 3 to 4 year olds has the highest likelihood of being enrolled in private schools, with 4 (100.0% in the age bracket) enrolled. Conversely, the age group of 20 to 24 year olds has the lowest likelihood of being enrolled in a private school, with 38 (100.0% in the age bracket) attending a public institution.
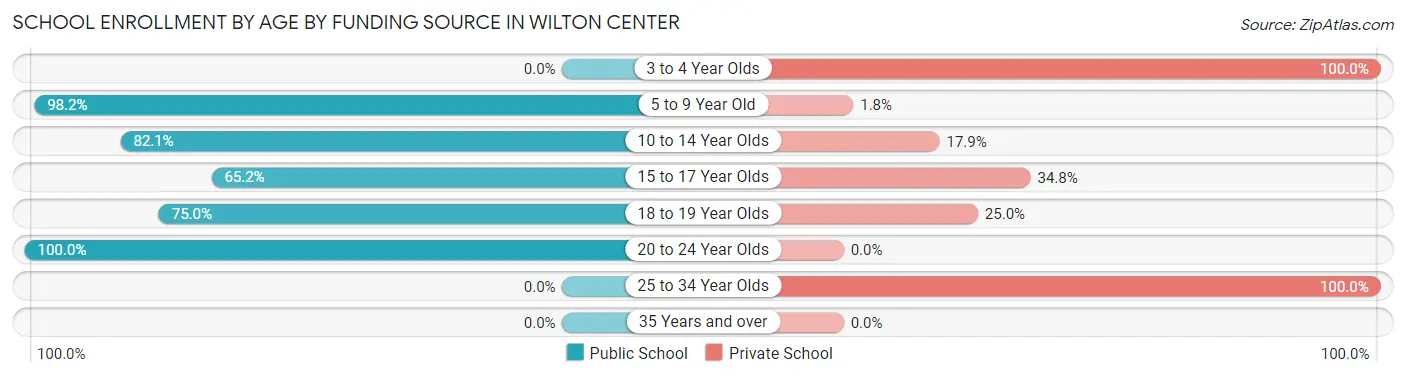
| Age Bracket | Public School | Private School |
| 3 to 4 Year Olds | 0 (0.0%) | 4 (100.0%) |
| 5 to 9 Year Old | 55 (98.2%) | 1 (1.8%) |
| 10 to 14 Year Olds | 46 (82.1%) | 10 (17.9%) |
| 15 to 17 Year Olds | 88 (65.2%) | 47 (34.8%) |
| 18 to 19 Year Olds | 15 (75.0%) | 5 (25.0%) |
| 20 to 24 Year Olds | 38 (100.0%) | 0 (0.0%) |
| 25 to 34 Year Olds | 0 (0.0%) | 6 (100.0%) |
| 35 Years and over | 0 (0.0%) | 0 (0.0%) |
| Total | 242 (76.8%) | 73 (23.2%) |
Educational Attainment by Field of Study in Wilton Center
Business (275 | 28.3%), social sciences (136 | 14.0%), computers & mathematics (108 | 11.1%), engineering (103 | 10.6%), and liberal arts & history (61 | 6.3%) are the most common fields of study among 971 individuals in Wilton Center who have obtained a bachelor's degree or higher.
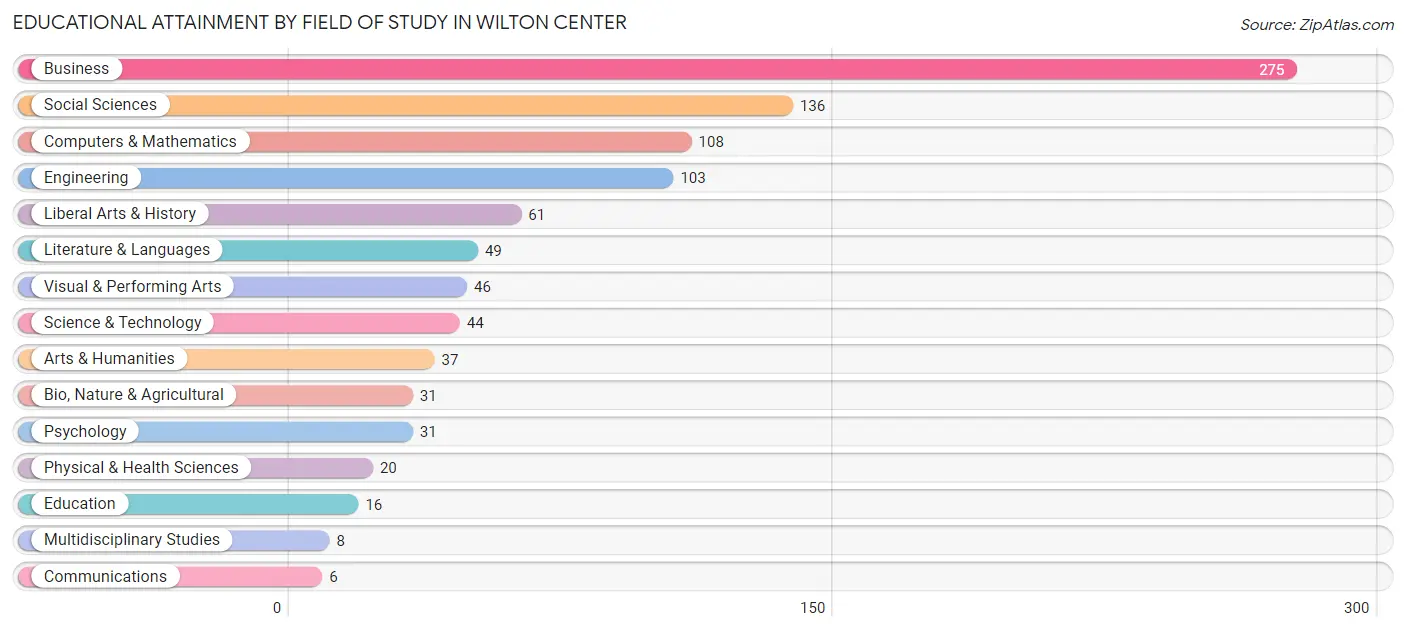
| Field of Study | # Graduates | % Graduates |
| Computers & Mathematics | 108 | 11.1% |
| Bio, Nature & Agricultural | 31 | 3.2% |
| Physical & Health Sciences | 20 | 2.1% |
| Psychology | 31 | 3.2% |
| Social Sciences | 136 | 14.0% |
| Engineering | 103 | 10.6% |
| Multidisciplinary Studies | 8 | 0.8% |
| Science & Technology | 44 | 4.5% |
| Business | 275 | 28.3% |
| Education | 16 | 1.7% |
| Literature & Languages | 49 | 5.1% |
| Liberal Arts & History | 61 | 6.3% |
| Visual & Performing Arts | 46 | 4.7% |
| Communications | 6 | 0.6% |
| Arts & Humanities | 37 | 3.8% |
| Total | 971 | 100.0% |
Transportation & Commute in Wilton Center
Vehicle Availability by Sex in Wilton Center
The most prevalent vehicle ownership categories in Wilton Center are males with 2 vehicles (288, accounting for 68.6%) and females with 2 vehicles (202, making up 68.2%).
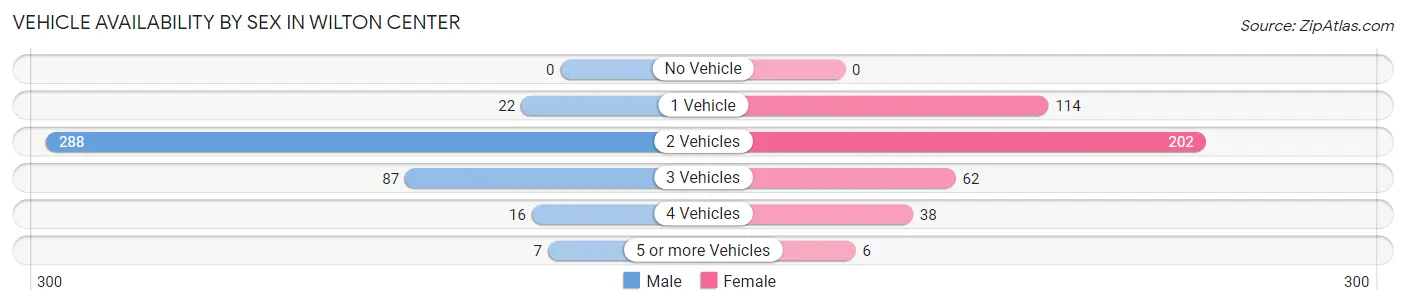
| Vehicles Available | Male | Female |
| No Vehicle | 0 (0.0%) | 0 (0.0%) |
| 1 Vehicle | 22 (5.2%) | 114 (27.0%) |
| 2 Vehicles | 288 (68.6%) | 202 (47.9%) |
| 3 Vehicles | 87 (20.7%) | 62 (14.7%) |
| 4 Vehicles | 16 (3.8%) | 38 (9.0%) |
| 5 or more Vehicles | 7 (1.7%) | 6 (1.4%) |
| Total | 420 (100.0%) | 422 (100.0%) |
Commute Time in Wilton Center
The most frequently occuring commute durations in Wilton Center are 60 to 89 minutes (101 commuters, 18.8%), 20 to 24 minutes (67 commuters, 12.5%), and 10 to 14 minutes (60 commuters, 11.2%).
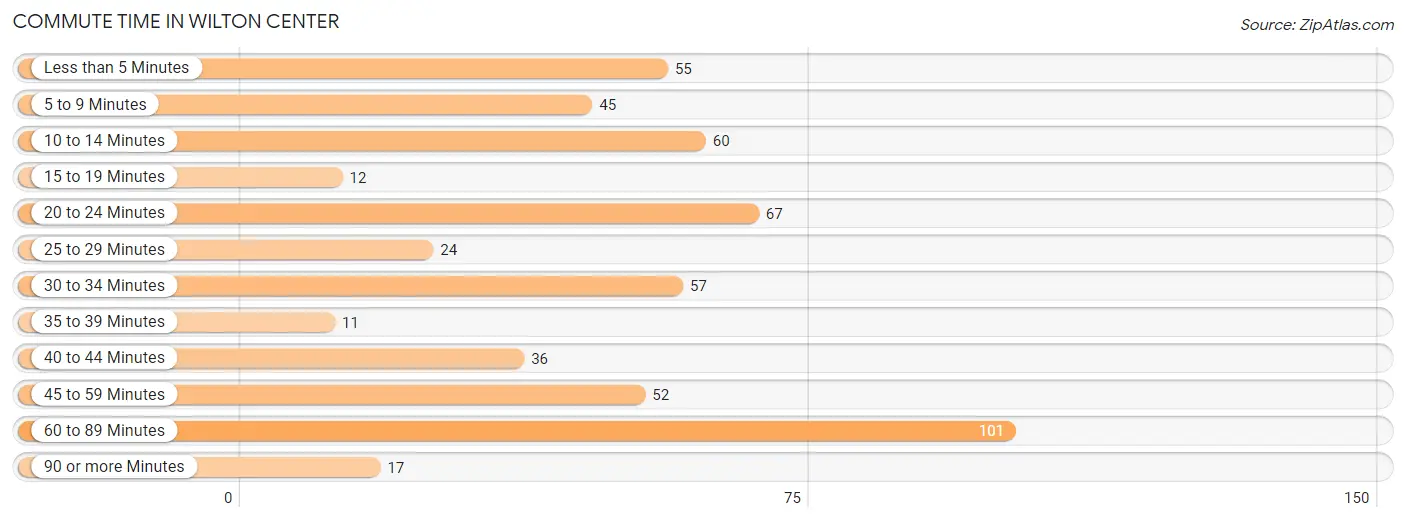
| Commute Time | # Commuters | % Commuters |
| Less than 5 Minutes | 55 | 10.2% |
| 5 to 9 Minutes | 45 | 8.4% |
| 10 to 14 Minutes | 60 | 11.2% |
| 15 to 19 Minutes | 12 | 2.2% |
| 20 to 24 Minutes | 67 | 12.5% |
| 25 to 29 Minutes | 24 | 4.5% |
| 30 to 34 Minutes | 57 | 10.6% |
| 35 to 39 Minutes | 11 | 2.1% |
| 40 to 44 Minutes | 36 | 6.7% |
| 45 to 59 Minutes | 52 | 9.7% |
| 60 to 89 Minutes | 101 | 18.8% |
| 90 or more Minutes | 17 | 3.2% |
Commute Time by Sex in Wilton Center
The most common commute times in Wilton Center are 60 to 89 minutes (74 commuters, 26.2%) for males and 10 to 14 minutes (50 commuters, 19.6%) for females.
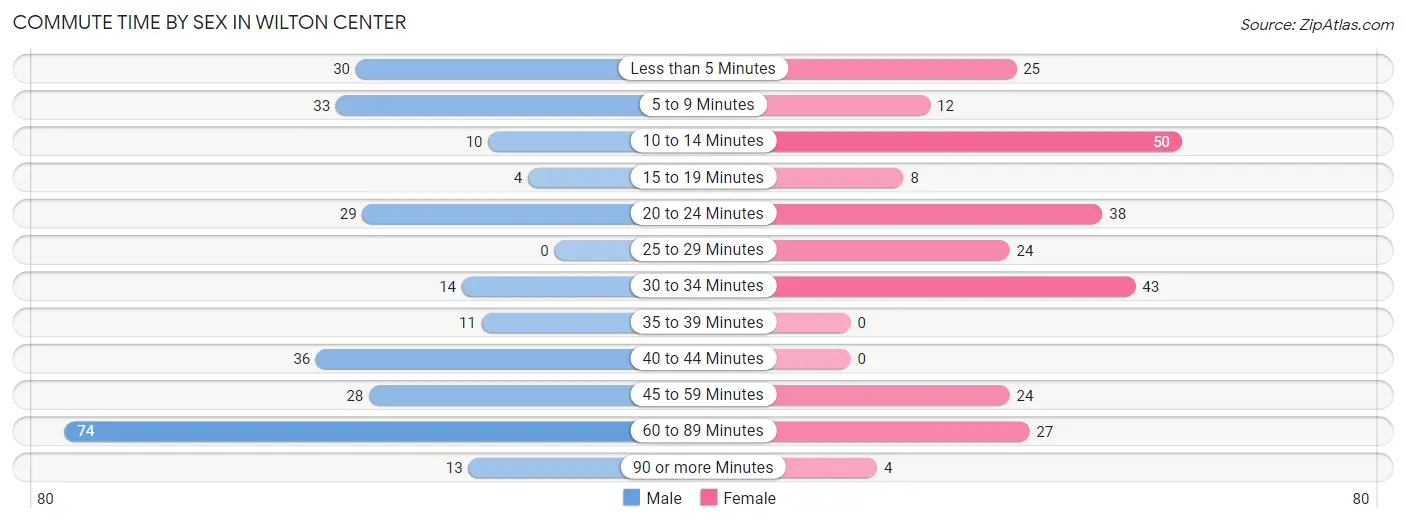
| Commute Time | Male | Female |
| Less than 5 Minutes | 30 (10.6%) | 25 (9.8%) |
| 5 to 9 Minutes | 33 (11.7%) | 12 (4.7%) |
| 10 to 14 Minutes | 10 (3.5%) | 50 (19.6%) |
| 15 to 19 Minutes | 4 (1.4%) | 8 (3.1%) |
| 20 to 24 Minutes | 29 (10.3%) | 38 (14.9%) |
| 25 to 29 Minutes | 0 (0.0%) | 24 (9.4%) |
| 30 to 34 Minutes | 14 (5.0%) | 43 (16.9%) |
| 35 to 39 Minutes | 11 (3.9%) | 0 (0.0%) |
| 40 to 44 Minutes | 36 (12.8%) | 0 (0.0%) |
| 45 to 59 Minutes | 28 (9.9%) | 24 (9.4%) |
| 60 to 89 Minutes | 74 (26.2%) | 27 (10.6%) |
| 90 or more Minutes | 13 (4.6%) | 4 (1.6%) |
Time of Departure to Work by Sex in Wilton Center
The most frequent times of departure to work in Wilton Center are 5:30 AM to 5:59 AM (65, 23.1%) for males and 8:30 AM to 8:59 AM (48, 18.8%) for females.
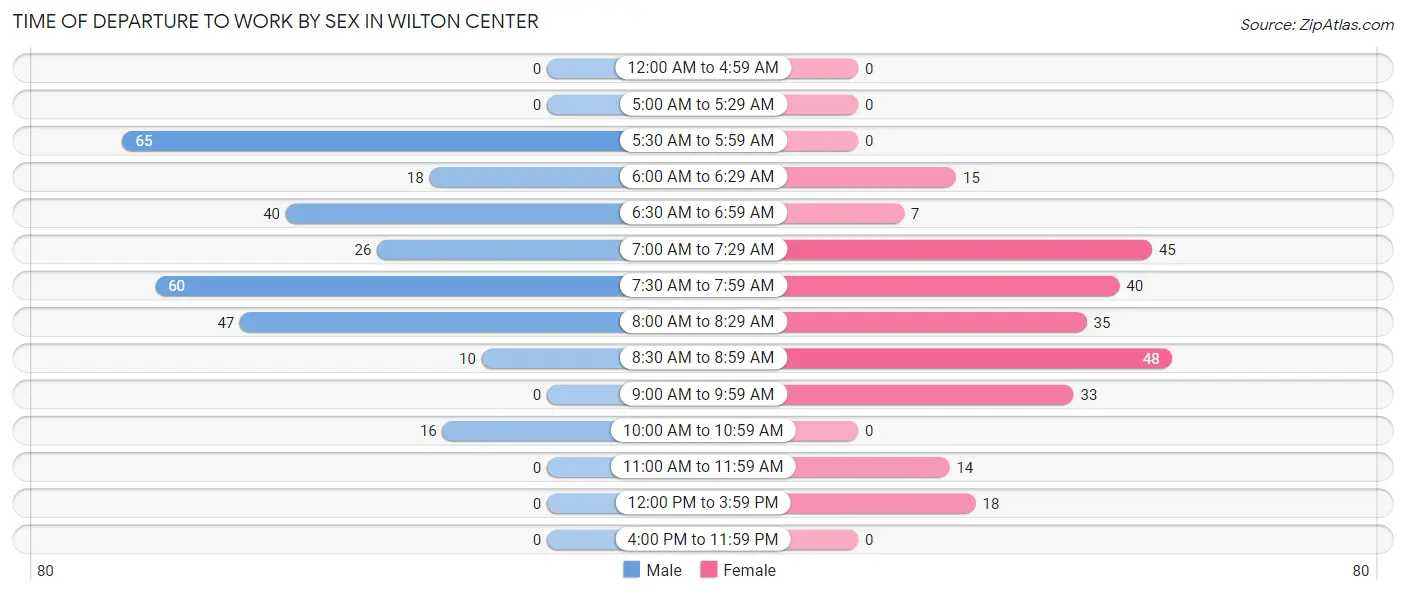
| Time of Departure | Male | Female |
| 12:00 AM to 4:59 AM | 0 (0.0%) | 0 (0.0%) |
| 5:00 AM to 5:29 AM | 0 (0.0%) | 0 (0.0%) |
| 5:30 AM to 5:59 AM | 65 (23.1%) | 0 (0.0%) |
| 6:00 AM to 6:29 AM | 18 (6.4%) | 15 (5.9%) |
| 6:30 AM to 6:59 AM | 40 (14.2%) | 7 (2.8%) |
| 7:00 AM to 7:29 AM | 26 (9.2%) | 45 (17.6%) |
| 7:30 AM to 7:59 AM | 60 (21.3%) | 40 (15.7%) |
| 8:00 AM to 8:29 AM | 47 (16.7%) | 35 (13.7%) |
| 8:30 AM to 8:59 AM | 10 (3.5%) | 48 (18.8%) |
| 9:00 AM to 9:59 AM | 0 (0.0%) | 33 (12.9%) |
| 10:00 AM to 10:59 AM | 16 (5.7%) | 0 (0.0%) |
| 11:00 AM to 11:59 AM | 0 (0.0%) | 14 (5.5%) |
| 12:00 PM to 3:59 PM | 0 (0.0%) | 18 (7.1%) |
| 4:00 PM to 11:59 PM | 0 (0.0%) | 0 (0.0%) |
| Total | 282 (100.0%) | 255 (100.0%) |
Housing Occupancy in Wilton Center
Occupancy by Ownership in Wilton Center
Of the total 812 dwellings in Wilton Center, owner-occupied units account for 480 (59.1%), while renter-occupied units make up 332 (40.9%).
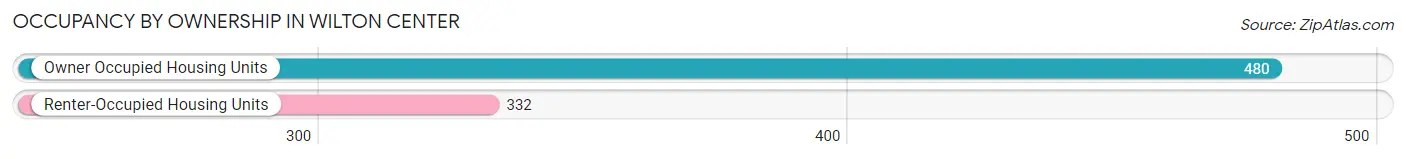
| Occupancy | # Housing Units | % Housing Units |
| Owner Occupied Housing Units | 480 | 59.1% |
| Renter-Occupied Housing Units | 332 | 40.9% |
| Total Occupied Housing Units | 812 | 100.0% |
Occupancy by Household Size in Wilton Center
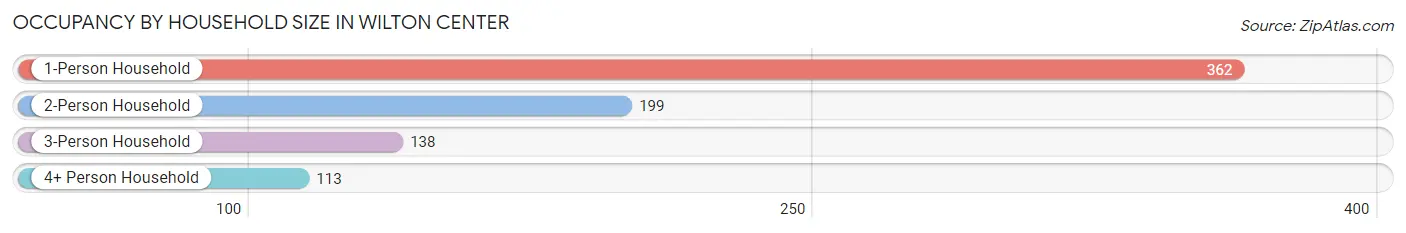
| Household Size | # Housing Units | % Housing Units |
| 1-Person Household | 362 | 44.6% |
| 2-Person Household | 199 | 24.5% |
| 3-Person Household | 138 | 17.0% |
| 4+ Person Household | 113 | 13.9% |
| Total Housing Units | 812 | 100.0% |
Occupancy by Ownership by Household Size in Wilton Center
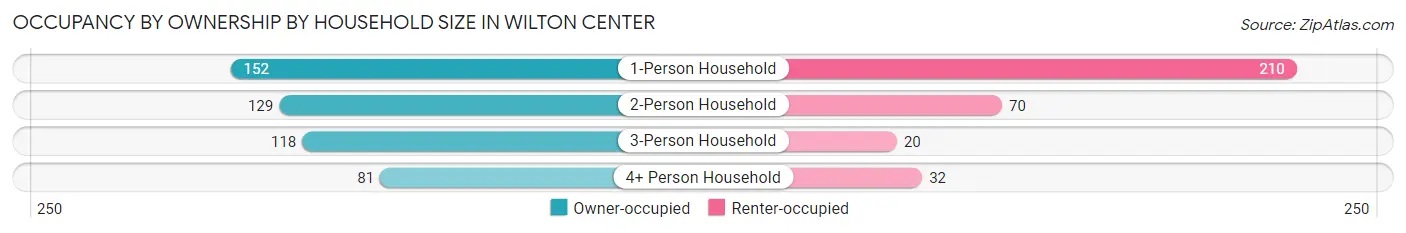
| Household Size | Owner-occupied | Renter-occupied |
| 1-Person Household | 152 (42.0%) | 210 (58.0%) |
| 2-Person Household | 129 (64.8%) | 70 (35.2%) |
| 3-Person Household | 118 (85.5%) | 20 (14.5%) |
| 4+ Person Household | 81 (71.7%) | 32 (28.3%) |
| Total Housing Units | 480 (59.1%) | 332 (40.9%) |
Occupancy by Educational Attainment in Wilton Center
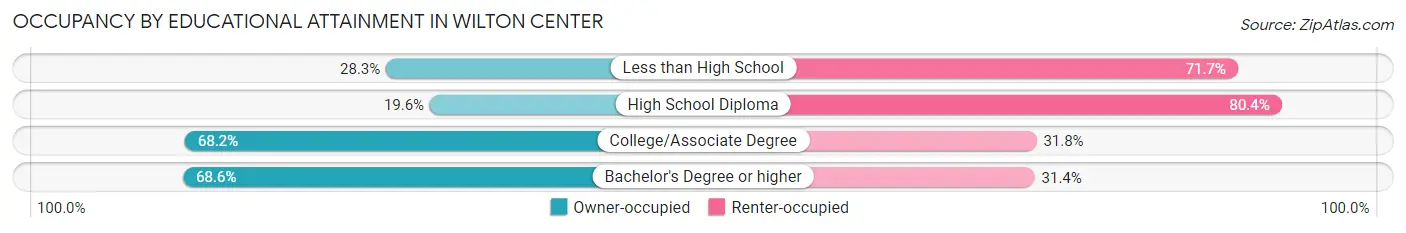
| Household Size | Owner-occupied | Renter-occupied |
| Less than High School | 17 (28.3%) | 43 (71.7%) |
| High School Diploma | 21 (19.6%) | 86 (80.4%) |
| College/Associate Degree | 73 (68.2%) | 34 (31.8%) |
| Bachelor's Degree or higher | 369 (68.6%) | 169 (31.4%) |
Occupancy by Age of Householder in Wilton Center
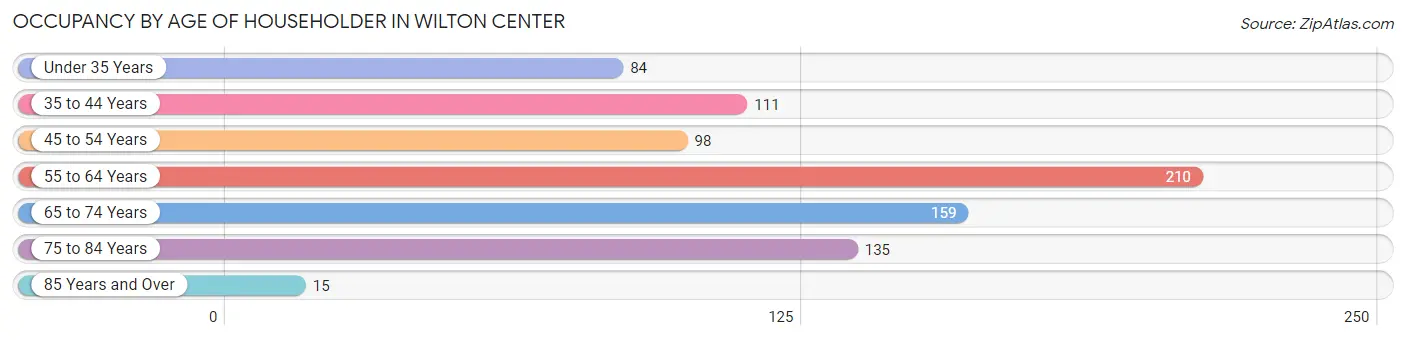
| Age Bracket | # Households | % Households |
| Under 35 Years | 84 | 10.3% |
| 35 to 44 Years | 111 | 13.7% |
| 45 to 54 Years | 98 | 12.1% |
| 55 to 64 Years | 210 | 25.9% |
| 65 to 74 Years | 159 | 19.6% |
| 75 to 84 Years | 135 | 16.6% |
| 85 Years and Over | 15 | 1.8% |
| Total | 812 | 100.0% |
Housing Finances in Wilton Center
Median Income by Occupancy in Wilton Center
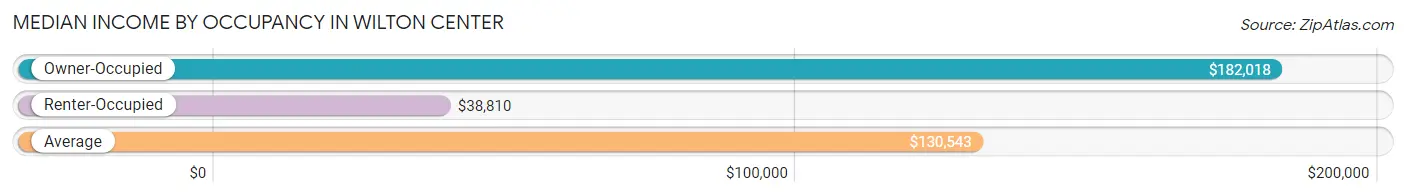
| Occupancy Type | # Households | Median Income |
| Owner-Occupied | 480 (59.1%) | $182,018 |
| Renter-Occupied | 332 (40.9%) | $38,810 |
| Average | 812 (100.0%) | $130,543 |
Occupancy by Householder Income Bracket in Wilton Center
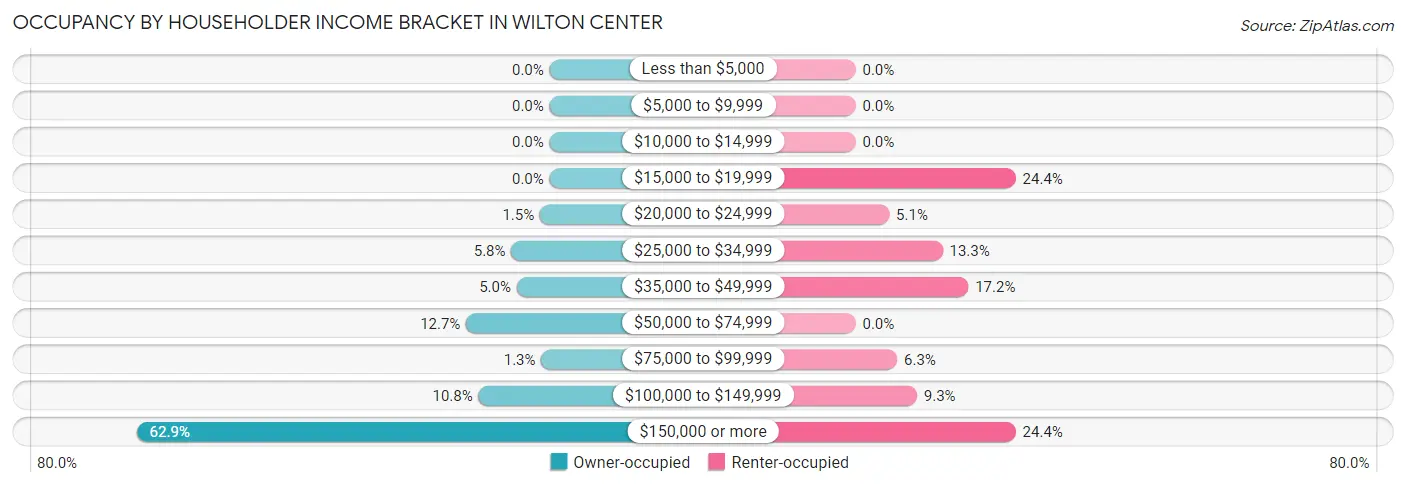
| Income Bracket | Owner-occupied | Renter-occupied |
| Less than $5,000 | 0 (0.0%) | 0 (0.0%) |
| $5,000 to $9,999 | 0 (0.0%) | 0 (0.0%) |
| $10,000 to $14,999 | 0 (0.0%) | 0 (0.0%) |
| $15,000 to $19,999 | 0 (0.0%) | 81 (24.4%) |
| $20,000 to $24,999 | 7 (1.5%) | 17 (5.1%) |
| $25,000 to $34,999 | 28 (5.8%) | 44 (13.3%) |
| $35,000 to $49,999 | 24 (5.0%) | 57 (17.2%) |
| $50,000 to $74,999 | 61 (12.7%) | 0 (0.0%) |
| $75,000 to $99,999 | 6 (1.3%) | 21 (6.3%) |
| $100,000 to $149,999 | 52 (10.8%) | 31 (9.3%) |
| $150,000 or more | 302 (62.9%) | 81 (24.4%) |
| Total | 480 (100.0%) | 332 (100.0%) |
Monthly Housing Cost Tiers in Wilton Center
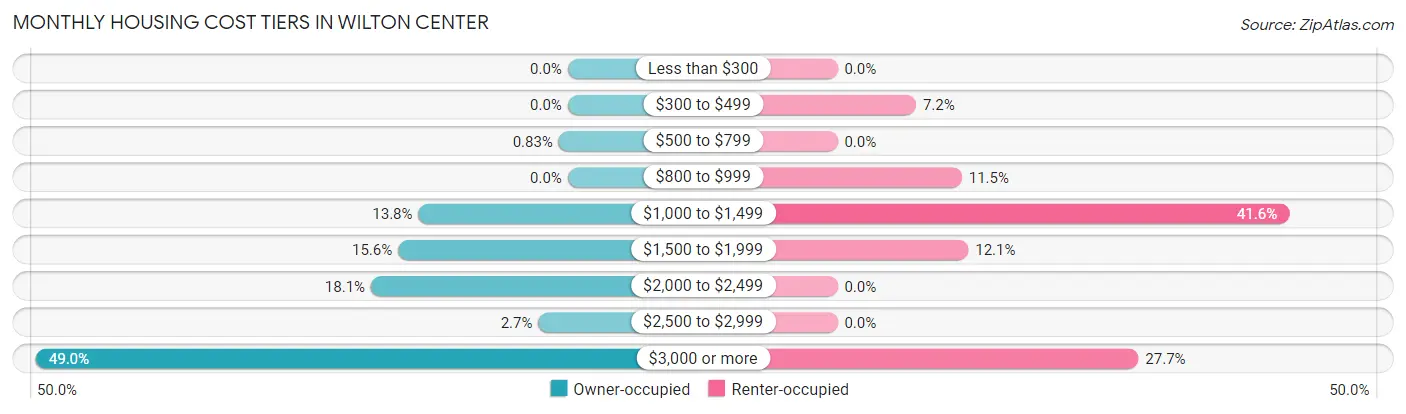
| Monthly Cost | Owner-occupied | Renter-occupied |
| Less than $300 | 0 (0.0%) | 0 (0.0%) |
| $300 to $499 | 0 (0.0%) | 24 (7.2%) |
| $500 to $799 | 4 (0.8%) | 0 (0.0%) |
| $800 to $999 | 0 (0.0%) | 38 (11.5%) |
| $1,000 to $1,499 | 66 (13.8%) | 138 (41.6%) |
| $1,500 to $1,999 | 75 (15.6%) | 40 (12.0%) |
| $2,000 to $2,499 | 87 (18.1%) | 0 (0.0%) |
| $2,500 to $2,999 | 13 (2.7%) | 0 (0.0%) |
| $3,000 or more | 235 (49.0%) | 92 (27.7%) |
| Total | 480 (100.0%) | 332 (100.0%) |
Physical Housing Characteristics in Wilton Center
Housing Structures in Wilton Center
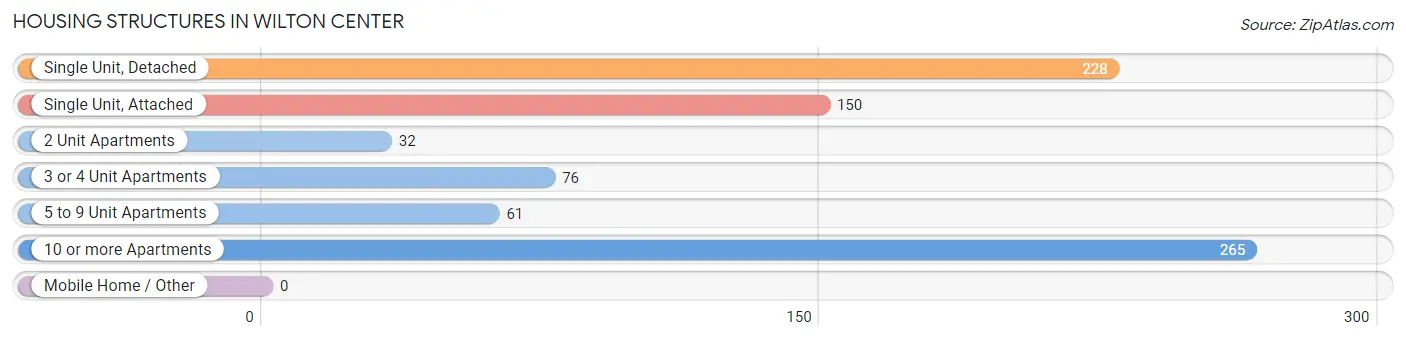
| Structure Type | # Housing Units | % Housing Units |
| Single Unit, Detached | 228 | 28.1% |
| Single Unit, Attached | 150 | 18.5% |
| 2 Unit Apartments | 32 | 3.9% |
| 3 or 4 Unit Apartments | 76 | 9.4% |
| 5 to 9 Unit Apartments | 61 | 7.5% |
| 10 or more Apartments | 265 | 32.6% |
| Mobile Home / Other | 0 | 0.0% |
| Total | 812 | 100.0% |
Housing Structures by Occupancy in Wilton Center
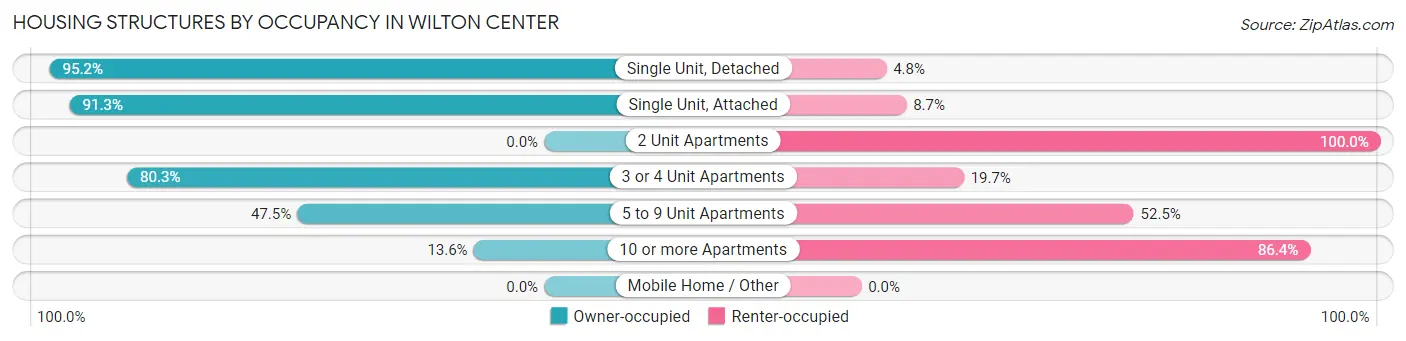
| Structure Type | Owner-occupied | Renter-occupied |
| Single Unit, Detached | 217 (95.2%) | 11 (4.8%) |
| Single Unit, Attached | 137 (91.3%) | 13 (8.7%) |
| 2 Unit Apartments | 0 (0.0%) | 32 (100.0%) |
| 3 or 4 Unit Apartments | 61 (80.3%) | 15 (19.7%) |
| 5 to 9 Unit Apartments | 29 (47.5%) | 32 (52.5%) |
| 10 or more Apartments | 36 (13.6%) | 229 (86.4%) |
| Mobile Home / Other | 0 (0.0%) | 0 (0.0%) |
| Total | 480 (59.1%) | 332 (40.9%) |
Housing Structures by Number of Rooms in Wilton Center
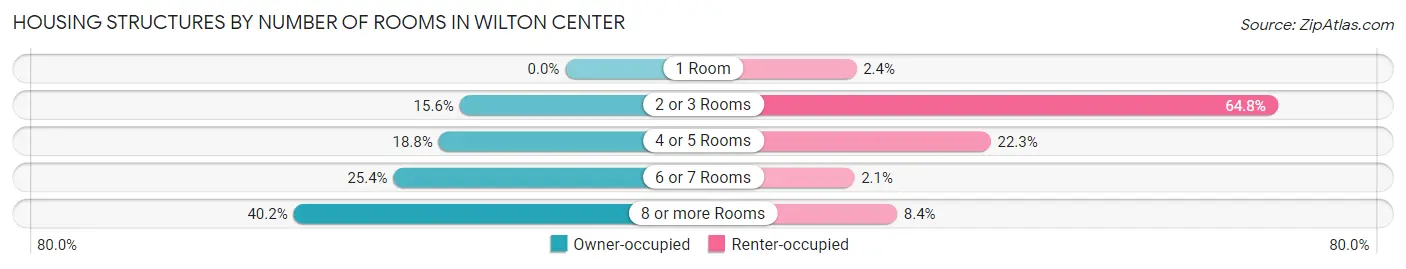
| Number of Rooms | Owner-occupied | Renter-occupied |
| 1 Room | 0 (0.0%) | 8 (2.4%) |
| 2 or 3 Rooms | 75 (15.6%) | 215 (64.8%) |
| 4 or 5 Rooms | 90 (18.8%) | 74 (22.3%) |
| 6 or 7 Rooms | 122 (25.4%) | 7 (2.1%) |
| 8 or more Rooms | 193 (40.2%) | 28 (8.4%) |
| Total | 480 (100.0%) | 332 (100.0%) |
Housing Structure by Heating Type in Wilton Center
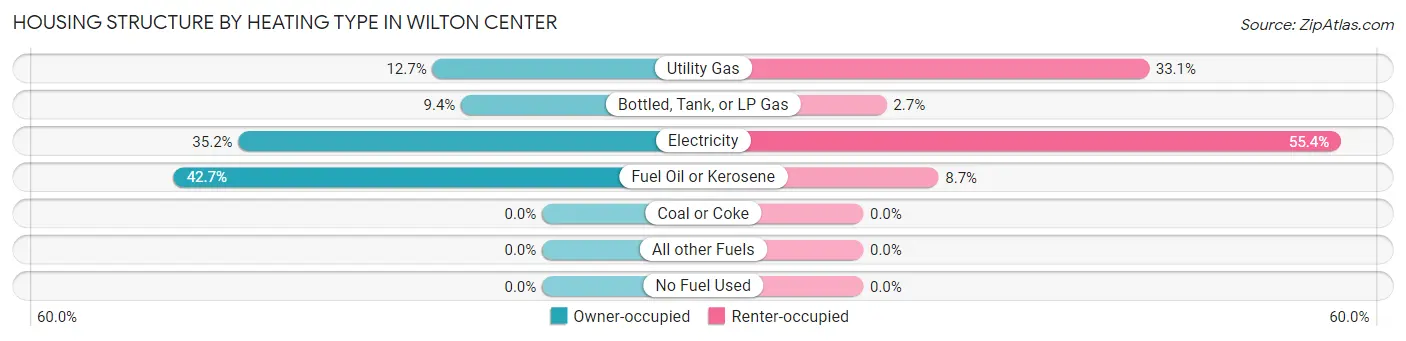
| Heating Type | Owner-occupied | Renter-occupied |
| Utility Gas | 61 (12.7%) | 110 (33.1%) |
| Bottled, Tank, or LP Gas | 45 (9.4%) | 9 (2.7%) |
| Electricity | 169 (35.2%) | 184 (55.4%) |
| Fuel Oil or Kerosene | 205 (42.7%) | 29 (8.7%) |
| Coal or Coke | 0 (0.0%) | 0 (0.0%) |
| All other Fuels | 0 (0.0%) | 0 (0.0%) |
| No Fuel Used | 0 (0.0%) | 0 (0.0%) |
| Total | 480 (100.0%) | 332 (100.0%) |
Household Vehicle Usage in Wilton Center
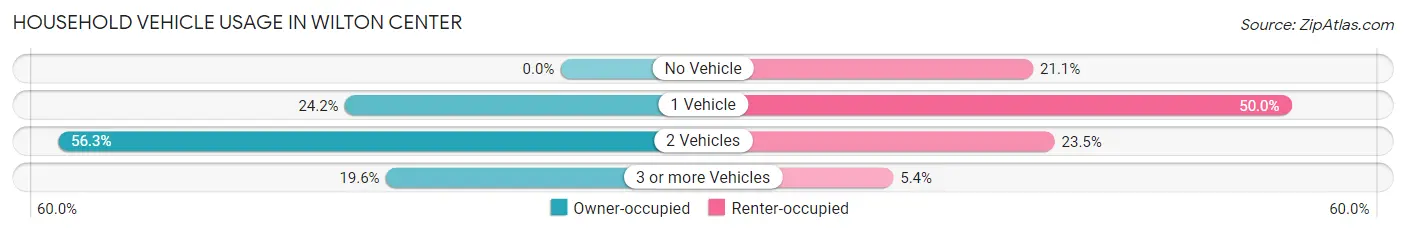
| Vehicles per Household | Owner-occupied | Renter-occupied |
| No Vehicle | 0 (0.0%) | 70 (21.1%) |
| 1 Vehicle | 116 (24.2%) | 166 (50.0%) |
| 2 Vehicles | 270 (56.2%) | 78 (23.5%) |
| 3 or more Vehicles | 94 (19.6%) | 18 (5.4%) |
| Total | 480 (100.0%) | 332 (100.0%) |
Real Estate & Mortgages in Wilton Center
Real Estate and Mortgage Overview in Wilton Center
| Characteristic | Without Mortgage | With Mortgage |
| Housing Units | 155 | 325 |
| Median Property Value | $466,500 | $556,700 |
| Median Household Income | $181,178 | $190 |
| Monthly Housing Costs | $1,501 | $221 |
| Real Estate Taxes | $8,586 | $0 |
Property Value by Mortgage Status in Wilton Center
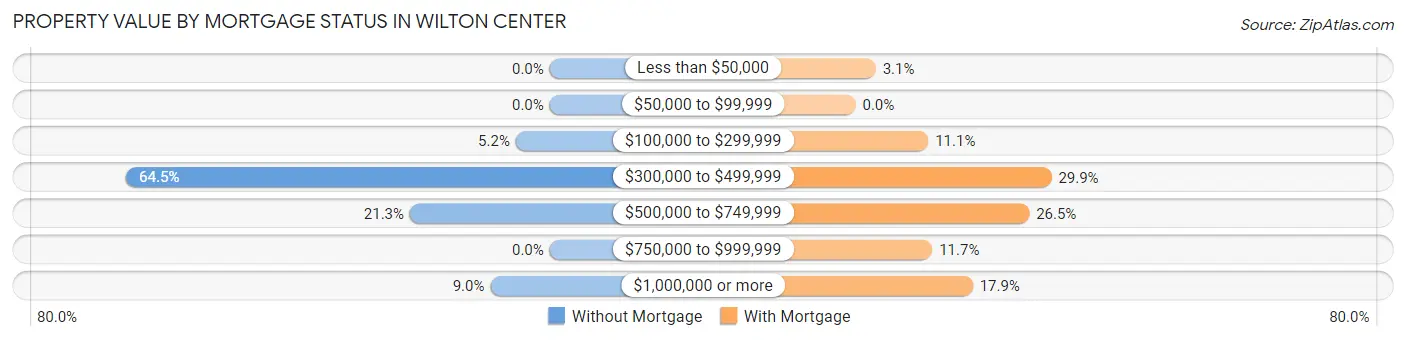
| Property Value | Without Mortgage | With Mortgage |
| Less than $50,000 | 0 (0.0%) | 10 (3.1%) |
| $50,000 to $99,999 | 0 (0.0%) | 0 (0.0%) |
| $100,000 to $299,999 | 8 (5.2%) | 36 (11.1%) |
| $300,000 to $499,999 | 100 (64.5%) | 97 (29.8%) |
| $500,000 to $749,999 | 33 (21.3%) | 86 (26.5%) |
| $750,000 to $999,999 | 0 (0.0%) | 38 (11.7%) |
| $1,000,000 or more | 14 (9.0%) | 58 (17.8%) |
| Total | 155 (100.0%) | 325 (100.0%) |
Household Income by Mortgage Status in Wilton Center
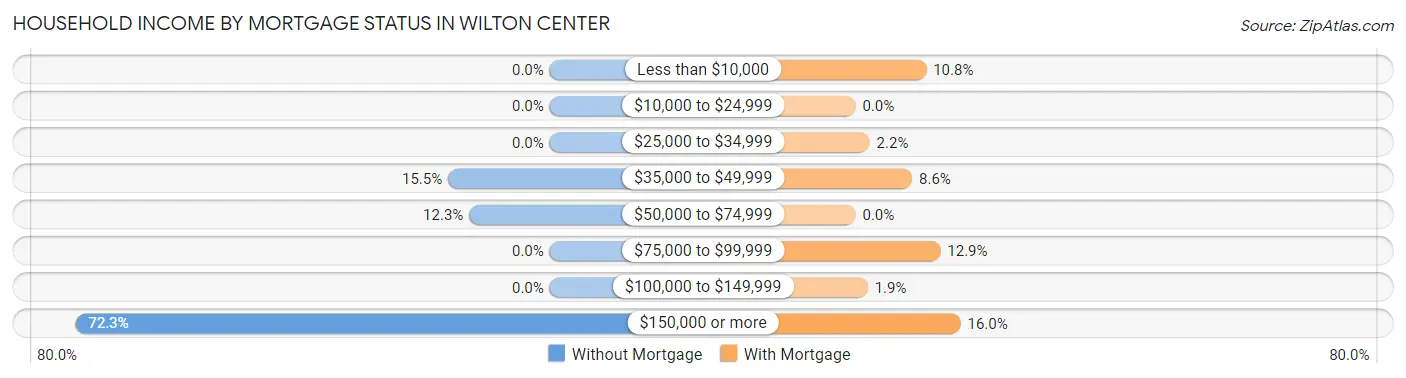
| Household Income | Without Mortgage | With Mortgage |
| Less than $10,000 | 0 (0.0%) | 35 (10.8%) |
| $10,000 to $24,999 | 0 (0.0%) | 0 (0.0%) |
| $25,000 to $34,999 | 0 (0.0%) | 7 (2.1%) |
| $35,000 to $49,999 | 24 (15.5%) | 28 (8.6%) |
| $50,000 to $74,999 | 19 (12.3%) | 0 (0.0%) |
| $75,000 to $99,999 | 0 (0.0%) | 42 (12.9%) |
| $100,000 to $149,999 | 0 (0.0%) | 6 (1.8%) |
| $150,000 or more | 112 (72.3%) | 52 (16.0%) |
| Total | 155 (100.0%) | 325 (100.0%) |
Property Value to Household Income Ratio in Wilton Center
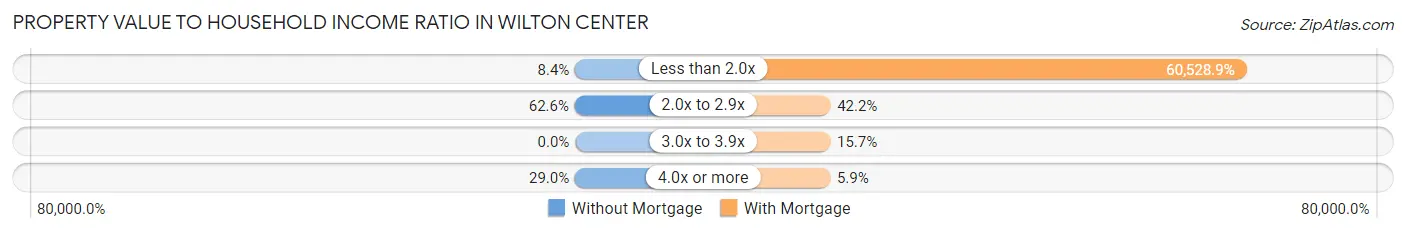
| Value-to-Income Ratio | Without Mortgage | With Mortgage |
| Less than 2.0x | 13 (8.4%) | 196,719 (60,528.9%) |
| 2.0x to 2.9x | 97 (62.6%) | 137 (42.1%) |
| 3.0x to 3.9x | 0 (0.0%) | 51 (15.7%) |
| 4.0x or more | 45 (29.0%) | 19 (5.9%) |
| Total | 155 (100.0%) | 325 (100.0%) |
Real Estate Taxes by Mortgage Status in Wilton Center
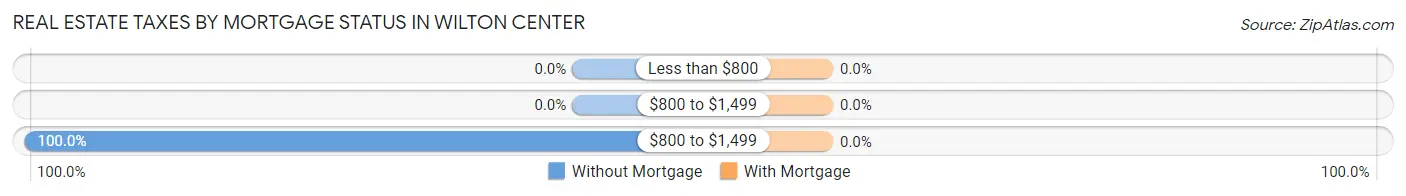
| Property Taxes | Without Mortgage | With Mortgage |
| Less than $800 | 0 (0.0%) | 0 (0.0%) |
| $800 to $1,499 | 0 (0.0%) | 0 (0.0%) |
| $800 to $1,499 | 155 (100.0%) | 0 (0.0%) |
| Total | 155 (100.0%) | 325 (100.0%) |
Health & Disability in Wilton Center
Health Insurance Coverage by Age in Wilton Center
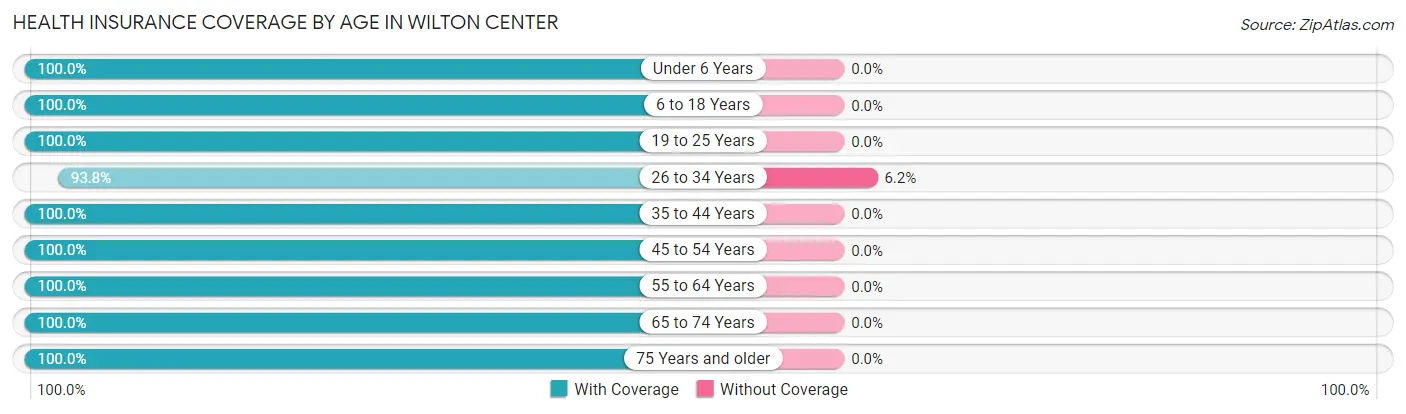
| Age Bracket | With Coverage | Without Coverage |
| Under 6 Years | 35 (100.0%) | 0 (0.0%) |
| 6 to 18 Years | 258 (100.0%) | 0 (0.0%) |
| 19 to 25 Years | 102 (100.0%) | 0 (0.0%) |
| 26 to 34 Years | 106 (93.8%) | 7 (6.2%) |
| 35 to 44 Years | 167 (100.0%) | 0 (0.0%) |
| 45 to 54 Years | 247 (100.0%) | 0 (0.0%) |
| 55 to 64 Years | 341 (100.0%) | 0 (0.0%) |
| 65 to 74 Years | 197 (100.0%) | 0 (0.0%) |
| 75 Years and older | 182 (100.0%) | 0 (0.0%) |
| Total | 1,635 (99.6%) | 7 (0.4%) |
Health Insurance Coverage by Citizenship Status in Wilton Center
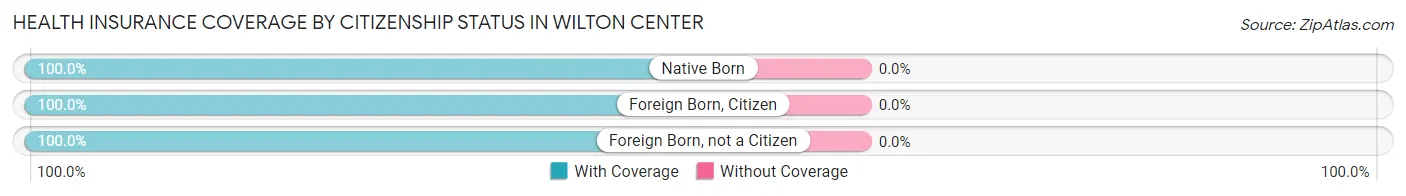
| Citizenship Status | With Coverage | Without Coverage |
| Native Born | 35 (100.0%) | 0 (0.0%) |
| Foreign Born, Citizen | 258 (100.0%) | 0 (0.0%) |
| Foreign Born, not a Citizen | 102 (100.0%) | 0 (0.0%) |
Health Insurance Coverage by Household Income in Wilton Center
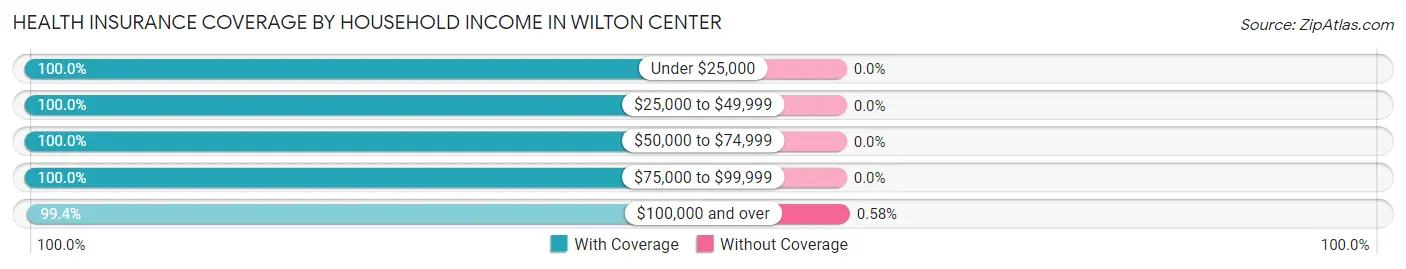
| Household Income | With Coverage | Without Coverage |
| Under $25,000 | 117 (100.0%) | 0 (0.0%) |
| $25,000 to $49,999 | 180 (100.0%) | 0 (0.0%) |
| $50,000 to $74,999 | 88 (100.0%) | 0 (0.0%) |
| $75,000 to $99,999 | 33 (100.0%) | 0 (0.0%) |
| $100,000 and over | 1,191 (99.4%) | 7 (0.6%) |
Public vs Private Health Insurance Coverage by Age in Wilton Center
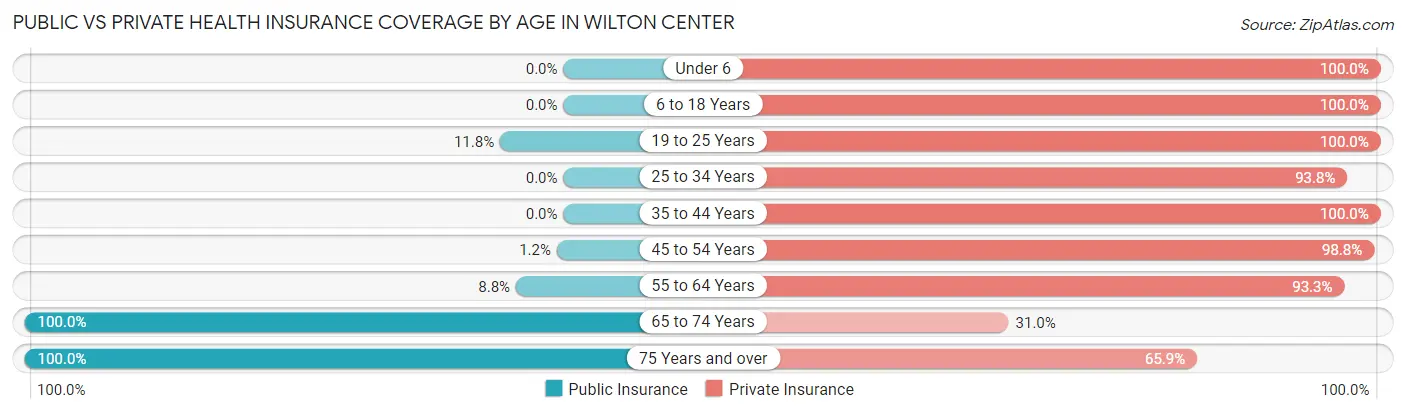
| Age Bracket | Public Insurance | Private Insurance |
| Under 6 | 0 (0.0%) | 35 (100.0%) |
| 6 to 18 Years | 0 (0.0%) | 258 (100.0%) |
| 19 to 25 Years | 12 (11.8%) | 102 (100.0%) |
| 25 to 34 Years | 0 (0.0%) | 106 (93.8%) |
| 35 to 44 Years | 0 (0.0%) | 167 (100.0%) |
| 45 to 54 Years | 3 (1.2%) | 244 (98.8%) |
| 55 to 64 Years | 30 (8.8%) | 318 (93.3%) |
| 65 to 74 Years | 197 (100.0%) | 61 (31.0%) |
| 75 Years and over | 182 (100.0%) | 120 (65.9%) |
| Total | 424 (25.8%) | 1,411 (85.9%) |
Disability Status by Sex by Age in Wilton Center
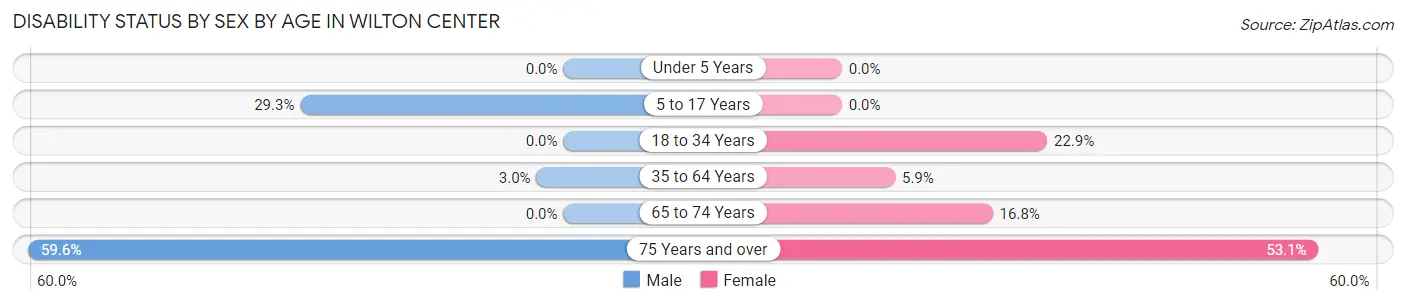
| Age Bracket | Male | Female |
| Under 5 Years | 0 (0.0%) | 0 (0.0%) |
| 5 to 17 Years | 46 (29.3%) | 0 (0.0%) |
| 18 to 34 Years | 0 (0.0%) | 40 (22.9%) |
| 35 to 64 Years | 11 (3.0%) | 23 (5.9%) |
| 65 to 74 Years | 0 (0.0%) | 21 (16.8%) |
| 75 Years and over | 31 (59.6%) | 69 (53.1%) |
Disability Class by Sex by Age in Wilton Center
Disability Class: Hearing Difficulty
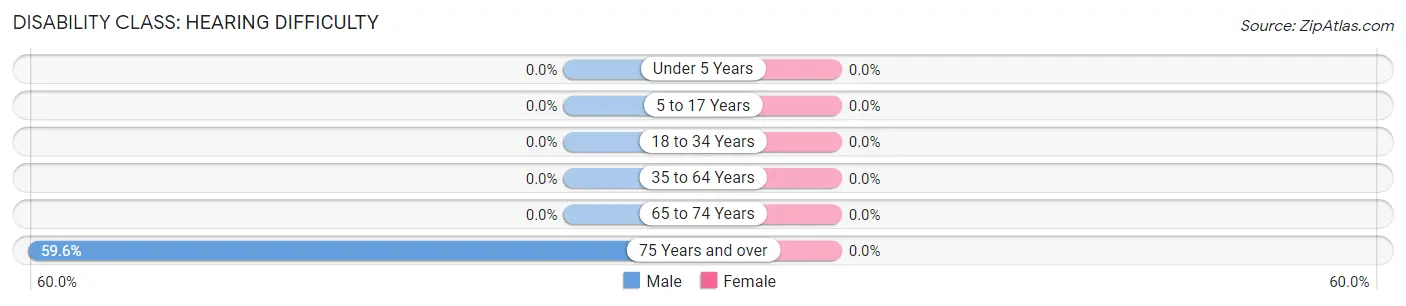
| Age Bracket | Male | Female |
| Under 5 Years | 0 (0.0%) | 0 (0.0%) |
| 5 to 17 Years | 0 (0.0%) | 0 (0.0%) |
| 18 to 34 Years | 0 (0.0%) | 0 (0.0%) |
| 35 to 64 Years | 0 (0.0%) | 0 (0.0%) |
| 65 to 74 Years | 0 (0.0%) | 0 (0.0%) |
| 75 Years and over | 31 (59.6%) | 0 (0.0%) |
Disability Class: Vision Difficulty
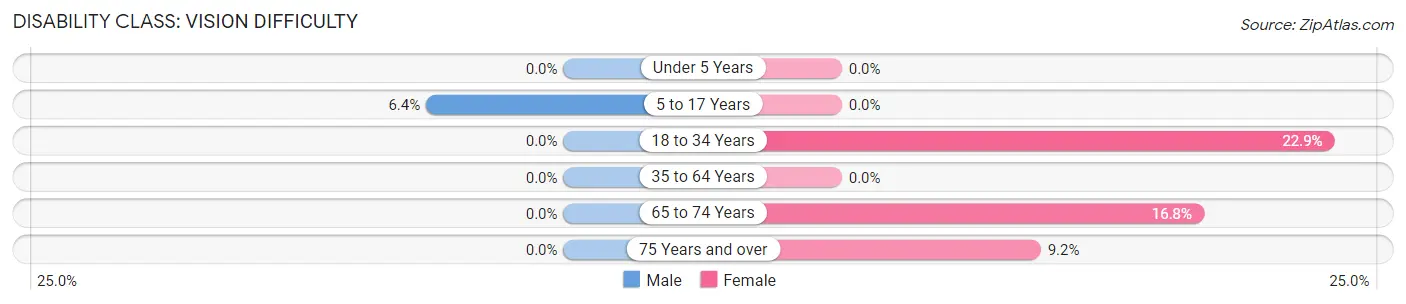
| Age Bracket | Male | Female |
| Under 5 Years | 0 (0.0%) | 0 (0.0%) |
| 5 to 17 Years | 10 (6.4%) | 0 (0.0%) |
| 18 to 34 Years | 0 (0.0%) | 40 (22.9%) |
| 35 to 64 Years | 0 (0.0%) | 0 (0.0%) |
| 65 to 74 Years | 0 (0.0%) | 21 (16.8%) |
| 75 Years and over | 0 (0.0%) | 12 (9.2%) |
Disability Class: Cognitive Difficulty
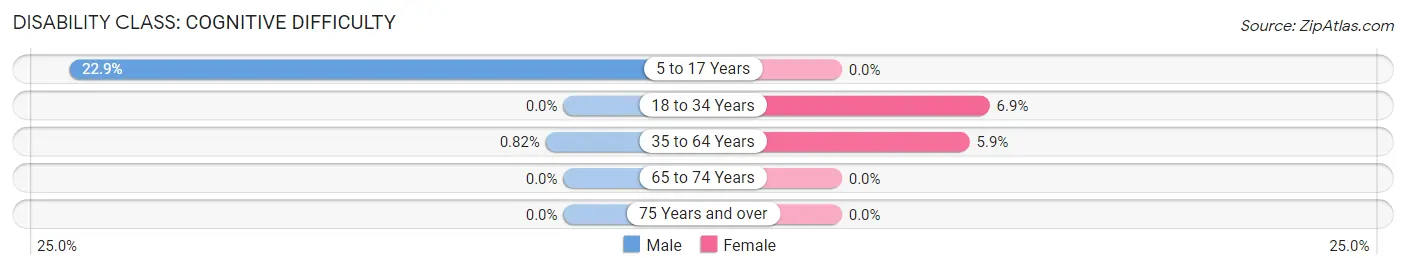
| Age Bracket | Male | Female |
| 5 to 17 Years | 36 (22.9%) | 0 (0.0%) |
| 18 to 34 Years | 0 (0.0%) | 12 (6.9%) |
| 35 to 64 Years | 3 (0.8%) | 23 (5.9%) |
| 65 to 74 Years | 0 (0.0%) | 0 (0.0%) |
| 75 Years and over | 0 (0.0%) | 0 (0.0%) |
Disability Class: Ambulatory Difficulty
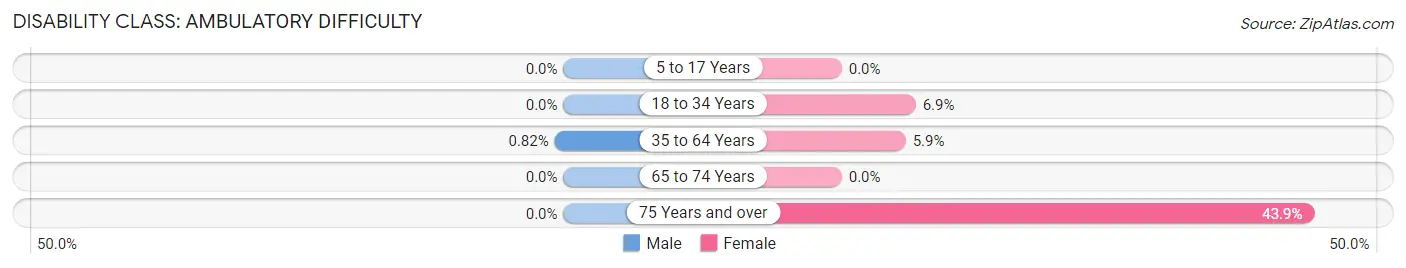
| Age Bracket | Male | Female |
| 5 to 17 Years | 0 (0.0%) | 0 (0.0%) |
| 18 to 34 Years | 0 (0.0%) | 12 (6.9%) |
| 35 to 64 Years | 3 (0.8%) | 23 (5.9%) |
| 65 to 74 Years | 0 (0.0%) | 0 (0.0%) |
| 75 Years and over | 0 (0.0%) | 57 (43.9%) |
Disability Class: Self-Care Difficulty
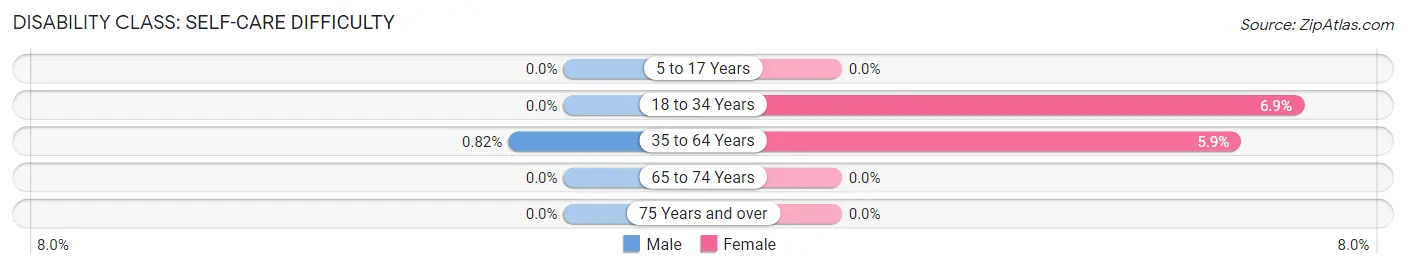
| Age Bracket | Male | Female |
| 5 to 17 Years | 0 (0.0%) | 0 (0.0%) |
| 18 to 34 Years | 0 (0.0%) | 12 (6.9%) |
| 35 to 64 Years | 3 (0.8%) | 23 (5.9%) |
| 65 to 74 Years | 0 (0.0%) | 0 (0.0%) |
| 75 Years and over | 0 (0.0%) | 0 (0.0%) |
Technology Access in Wilton Center
Computing Device Access in Wilton Center
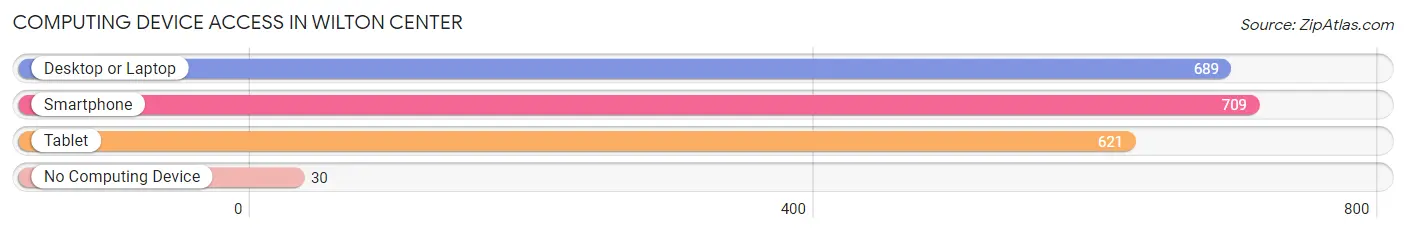
| Device Type | # Households | % Households |
| Desktop or Laptop | 689 | 84.9% |
| Smartphone | 709 | 87.3% |
| Tablet | 621 | 76.5% |
| No Computing Device | 30 | 3.7% |
| Total | 812 | 100.0% |
Internet Access in Wilton Center
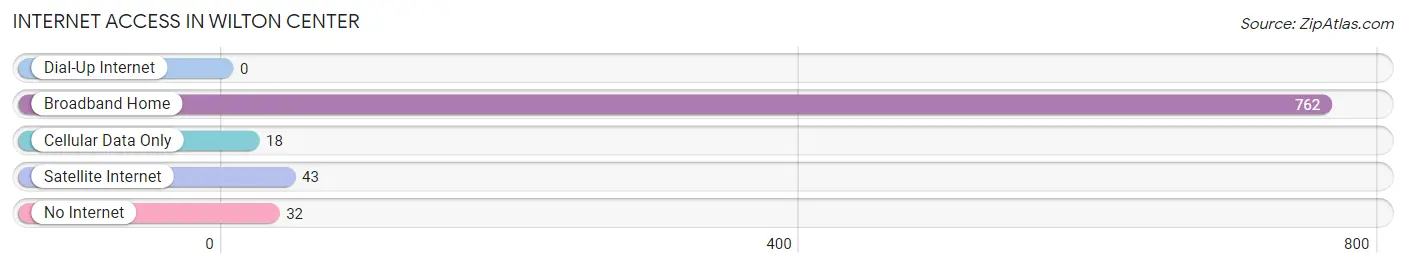
| Internet Type | # Households | % Households |
| Dial-Up Internet | 0 | 0.0% |
| Broadband Home | 762 | 93.8% |
| Cellular Data Only | 18 | 2.2% |
| Satellite Internet | 43 | 5.3% |
| No Internet | 32 | 3.9% |
| Total | 812 | 100.0% |
Wilton Center Summary
Wilton Center is a census-designated place (CDP) located in Fairfield County, Connecticut. It is situated in the town of Wilton, and is bordered by the towns of Norwalk, Weston, and Westport. As of the 2010 census, the population of Wilton Center was 1,062.
Geography
Wilton Center is located at 41°14'25" North, 73°27'45" West (41.240278, -73.4625). It has an area of 0.7 square miles, all of which is land. Wilton Center is located in the southwestern corner of Wilton, and is bordered by the towns of Norwalk, Weston, and Westport.
History
Wilton Center was first settled in 1726, and was originally known as Norwalk Parish. It was incorporated as the town of Wilton in 1802. The town was named after Wilton, England, and was the first town in Connecticut to be named after a foreign place.
The town of Wilton was originally a farming community, and the center of town was the site of a grist mill. In the late 19th century, Wilton Center began to develop into a residential community, and by the early 20th century, it had become a popular summer resort destination.
In the 1950s, Wilton Center began to experience rapid growth, as many people moved to the area from New York City. This growth continued into the 1970s, and by the 1980s, Wilton Center had become a popular bedroom community for commuters to New York City.
Economy
Wilton Center is primarily a residential community, and the majority of its residents are employed in the nearby cities of Norwalk and Stamford. The town is also home to several small businesses, including restaurants, retail stores, and professional services.
Demographics
As of the 2010 census, there were 1,062 people, 431 households, and 294 families residing in Wilton Center. The population density was 1,521.3 people per square mile. The racial makeup of the town was 94.2% White, 1.2% African American, 0.2% Native American, 2.3% Asian, 0.9% from other races, and 1.2% from two or more races. Hispanic or Latino of any race were 3.2% of the population.
The median income for a household in Wilton Center was $117,917, and the median income for a family was $136,917. The per capita income for the town was $60,917. About 2.2% of families and 3.2% of the population were below the poverty line, including 3.2% of those under age 18 and 0.0% of those age 65 or over.
Common Questions
What is Per Capita Income in Wilton Center?
Per Capita income in Wilton Center is $111,988.
What is the Median Family Income in Wilton Center?
Median Family Income in Wilton Center is $204,250.
What is the Median Household income in Wilton Center?
Median Household Income in Wilton Center is $130,543.
What is Income or Wage Gap in Wilton Center?
Income or Wage Gap in Wilton Center is 68.6%.
Women in Wilton Center earn 31.4 cents for every dollar earned by a man.
What is Inequality or Gini Index in Wilton Center?
Inequality or Gini Index in Wilton Center is 0.56.
What is the Total Population of Wilton Center?
Total Population of Wilton Center is 1,642.
What is the Total Male Population of Wilton Center?
Total Male Population of Wilton Center is 713.
What is the Total Female Population of Wilton Center?
Total Female Population of Wilton Center is 929.
What is the Ratio of Males per 100 Females in Wilton Center?
There are 76.75 Males per 100 Females in Wilton Center.
What is the Ratio of Females per 100 Males in Wilton Center?
There are 130.29 Females per 100 Males in Wilton Center.
What is the Median Population Age in Wilton Center?
Median Population Age in Wilton Center is 50.8 Years.
What is the Average Family Size in Wilton Center
Average Family Size in Wilton Center is 2.8 People.
What is the Average Household Size in Wilton Center
Average Household Size in Wilton Center is 2.0 People.
How Large is the Labor Force in Wilton Center?
There are 874 People in the Labor Forcein in Wilton Center.
What is the Percentage of People in the Labor Force in Wilton Center?
61.4% of People are in the Labor Force in Wilton Center.
What is the Unemployment Rate in Wilton Center?
Unemployment Rate in Wilton Center is 2.4%.