Woodmont borough, CT Map & Demographics
Woodmont borough Overview
$74,027
PER CAPITA INCOME
$171,420
AVG FAMILY INCOME
$97,171
AVG HOUSEHOLD INCOME
28.6%
WAGE / INCOME GAP [ % ]
71.4¢/ $1
WAGE / INCOME GAP [ $ ]
0.46
INEQUALITY / GINI INDEX
1,619
TOTAL POPULATION
779
MALE POPULATION
840
FEMALE POPULATION
92.74
MALES / 100 FEMALES
107.83
FEMALES / 100 MALES
51.0
MEDIAN AGE
2.9
AVG FAMILY SIZE
2.0
AVG HOUSEHOLD SIZE
986
LABOR FORCE [ PEOPLE ]
69.5%
PERCENT IN LABOR FORCE
2.8%
UNEMPLOYMENT RATE
Income in Woodmont borough
Income Overview in Woodmont borough
Per Capita Income in Woodmont borough is $74,027, while median incomes of families and households are $171,420 and $97,171 respectively.
| Characteristic | Number | Measure |
| Per Capita Income | 1,619 | $74,027 |
| Median Family Income | 425 | $171,420 |
| Mean Family Income | 425 | $214,864 |
| Median Household Income | 799 | $97,171 |
| Mean Household Income | 799 | $148,071 |
| Income Deficit | 425 | $0 |
| Wage / Income Gap (%) | 1,619 | 28.64% |
| Wage / Income Gap ($) | 1,619 | 71.36¢ per $1 |
| Gini / Inequality Index | 1,619 | 0.46 |
Earnings by Sex in Woodmont borough
Average Earnings in Woodmont borough are $63,173, $82,778 for men and $59,069 for women, a difference of 28.6%.
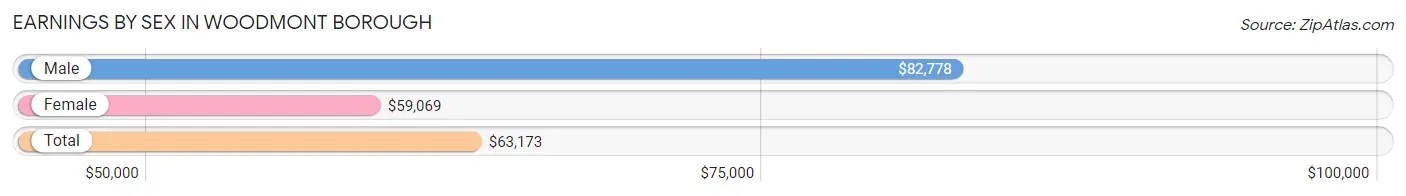
| Sex | Number | Average Earnings |
| Male | 532 (52.1%) | $82,778 |
| Female | 489 (47.9%) | $59,069 |
| Total | 1,021 (100.0%) | $63,173 |
Earnings by Sex by Income Bracket in Woodmont borough
The most common earnings brackets in Woodmont borough are $100,000+ for men (212 | 39.9%) and $100,000+ for women (141 | 28.8%).
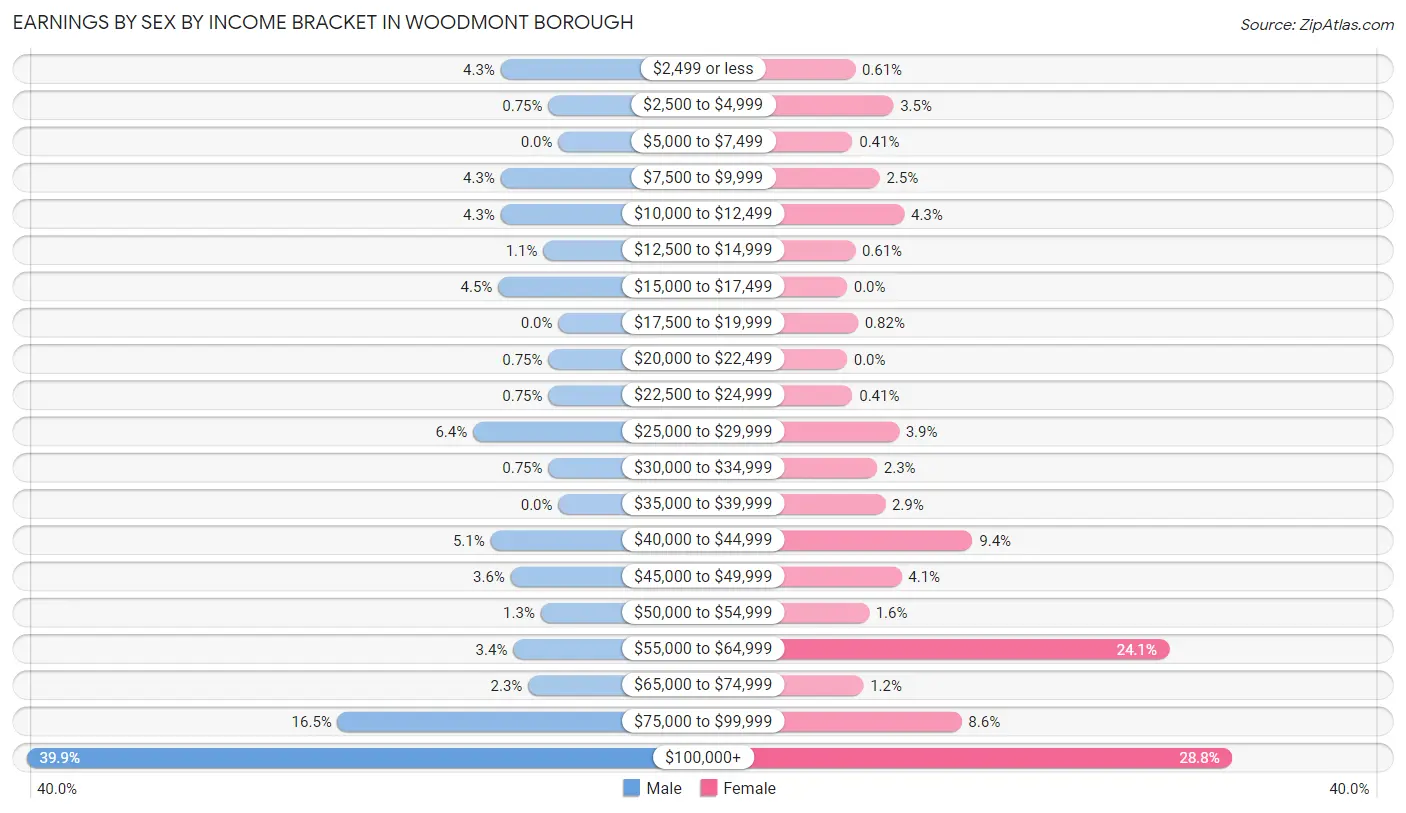
| Income | Male | Female |
| $2,499 or less | 23 (4.3%) | 3 (0.6%) |
| $2,500 to $4,999 | 4 (0.7%) | 17 (3.5%) |
| $5,000 to $7,499 | 0 (0.0%) | 2 (0.4%) |
| $7,500 to $9,999 | 23 (4.3%) | 12 (2.5%) |
| $10,000 to $12,499 | 23 (4.3%) | 21 (4.3%) |
| $12,500 to $14,999 | 6 (1.1%) | 3 (0.6%) |
| $15,000 to $17,499 | 24 (4.5%) | 0 (0.0%) |
| $17,500 to $19,999 | 0 (0.0%) | 4 (0.8%) |
| $20,000 to $22,499 | 4 (0.7%) | 0 (0.0%) |
| $22,500 to $24,999 | 4 (0.7%) | 2 (0.4%) |
| $25,000 to $29,999 | 34 (6.4%) | 19 (3.9%) |
| $30,000 to $34,999 | 4 (0.7%) | 11 (2.2%) |
| $35,000 to $39,999 | 0 (0.0%) | 14 (2.9%) |
| $40,000 to $44,999 | 27 (5.1%) | 46 (9.4%) |
| $45,000 to $49,999 | 19 (3.6%) | 20 (4.1%) |
| $50,000 to $54,999 | 7 (1.3%) | 8 (1.6%) |
| $55,000 to $64,999 | 18 (3.4%) | 118 (24.1%) |
| $65,000 to $74,999 | 12 (2.3%) | 6 (1.2%) |
| $75,000 to $99,999 | 88 (16.5%) | 42 (8.6%) |
| $100,000+ | 212 (39.9%) | 141 (28.8%) |
| Total | 532 (100.0%) | 489 (100.0%) |
Earnings by Sex by Educational Attainment in Woodmont borough
Average earnings in Woodmont borough are $92,188 for men and $59,605 for women, a difference of 35.3%. Men with an educational attainment of college or associate's degree enjoy the highest average annual earnings of $118,077, while those with high school diploma education earn the least with $44,276. Women with an educational attainment of bachelor's degree earn the most with the average annual earnings of $89,028, while those with high school diploma education have the smallest earnings of $34,375.
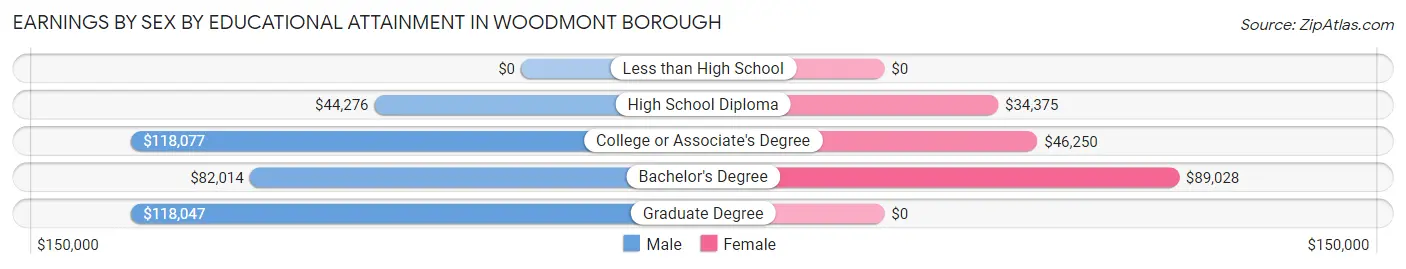
| Educational Attainment | Male Income | Female Income |
| Less than High School | - | - |
| High School Diploma | $44,276 | $34,375 |
| College or Associate's Degree | $118,077 | $46,250 |
| Bachelor's Degree | $82,014 | $89,028 |
| Graduate Degree | $118,047 | $0 |
| Total | $92,188 | $59,605 |
Family Income in Woodmont borough
Family Income Brackets in Woodmont borough
According to the Woodmont borough family income data, there are 178 families falling into the $200,000+ income range, which is the most common income bracket and makes up 41.9% of all families.
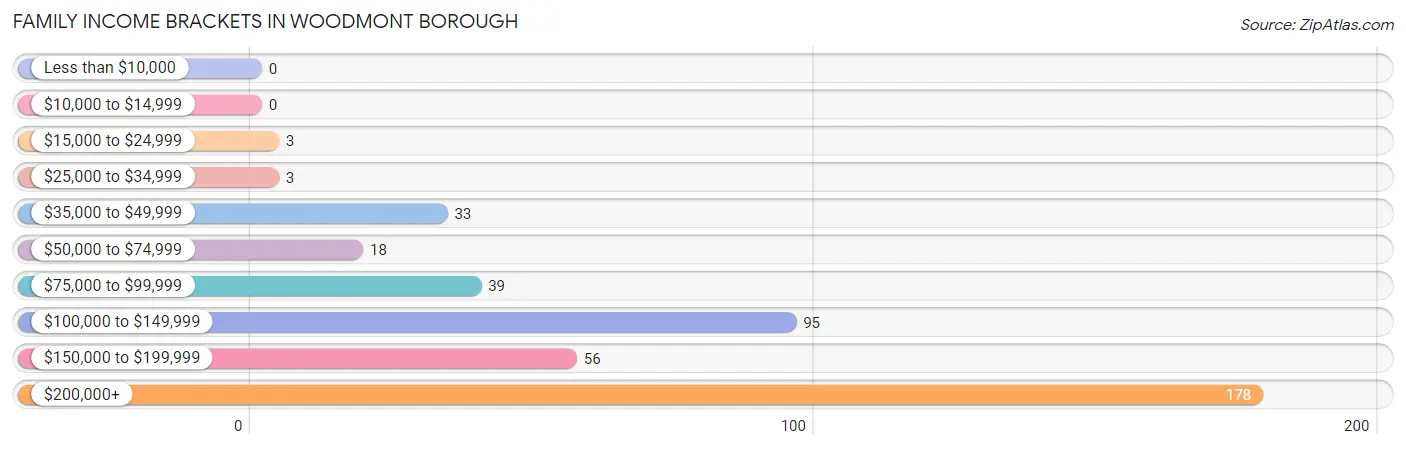
| Income Bracket | # Families | % Families |
| Less than $10,000 | 0 | 0.0% |
| $10,000 to $14,999 | 0 | 0.0% |
| $15,000 to $24,999 | 3 | 0.7% |
| $25,000 to $34,999 | 3 | 0.7% |
| $35,000 to $49,999 | 33 | 7.8% |
| $50,000 to $74,999 | 18 | 4.2% |
| $75,000 to $99,999 | 39 | 9.2% |
| $100,000 to $149,999 | 95 | 22.4% |
| $150,000 to $199,999 | 56 | 13.2% |
| $200,000+ | 178 | 41.9% |
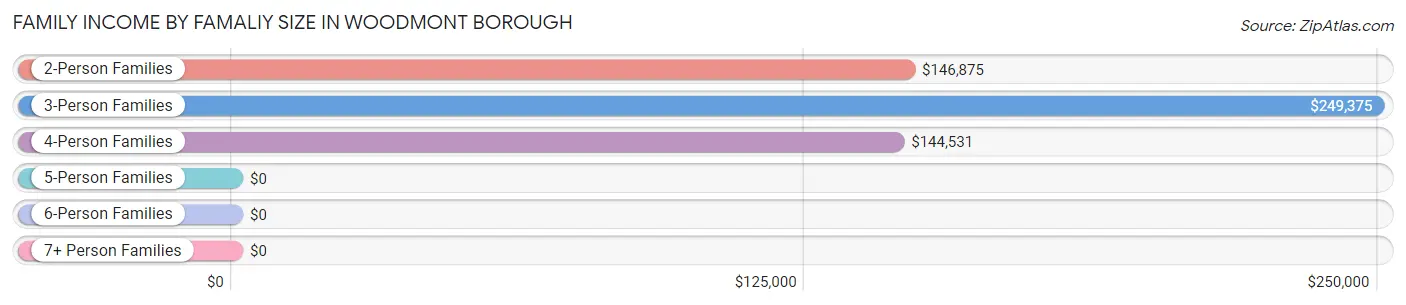
Family Income by Famaliy Size in Woodmont borough
3-person families (127 | 29.9%) account for the highest median family income in Woodmont borough with $249,375 per family, while 3-person families (127 | 29.9%) have the highest median income of $83,125 per family member.
| Income Bracket | # Families | Median Income |
| 2-Person Families | 212 (49.9%) | $146,875 |
| 3-Person Families | 127 (29.9%) | $249,375 |
| 4-Person Families | 79 (18.6%) | $144,531 |
| 5-Person Families | 7 (1.7%) | $0 |
| 6-Person Families | 0 (0.0%) | $0 |
| 7+ Person Families | 0 (0.0%) | $0 |
| Total | 425 (100.0%) | $171,420 |
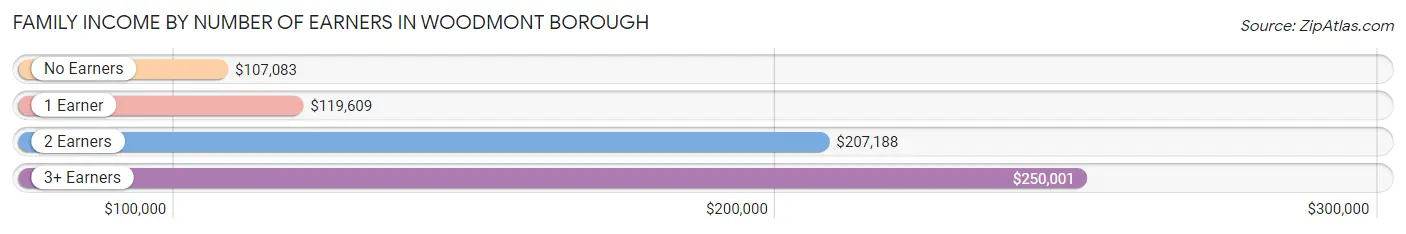
Family Income by Number of Earners in Woodmont borough
The median family income in Woodmont borough is $171,420, with families comprising 3+ earners (65) having the highest median family income of $250,001, while families with no earners (46) have the lowest median family income of $107,083, accounting for 15.3% and 10.8% of families, respectively.
| Number of Earners | # Families | Median Income |
| No Earners | 46 (10.8%) | $107,083 |
| 1 Earner | 123 (28.9%) | $119,609 |
| 2 Earners | 191 (44.9%) | $207,188 |
| 3+ Earners | 65 (15.3%) | $250,001 |
| Total | 425 (100.0%) | $171,420 |
Household Income in Woodmont borough
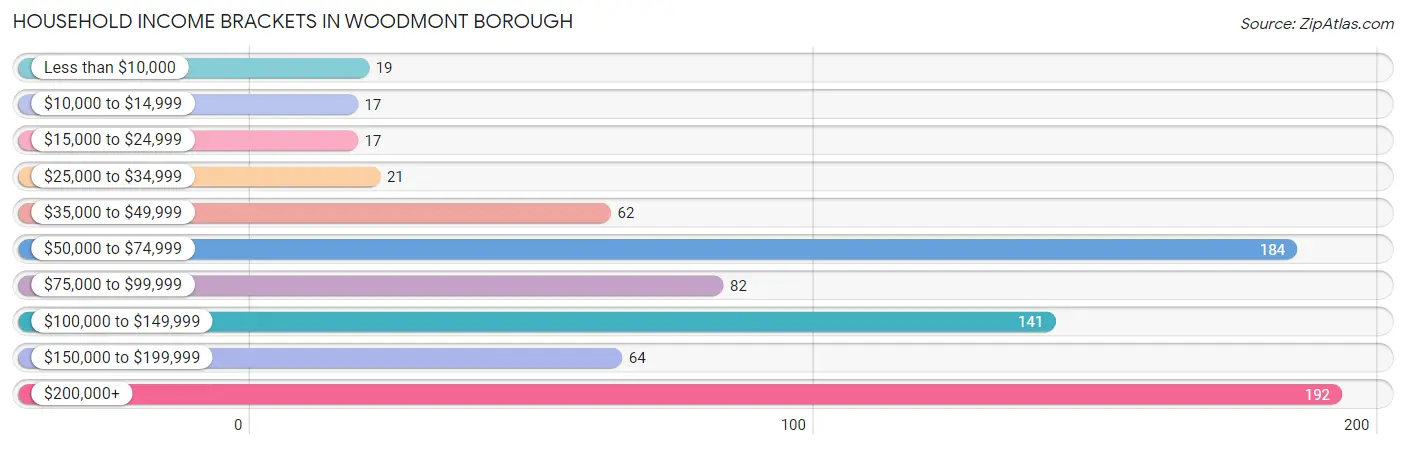
Household Income Brackets in Woodmont borough
With 192 households falling in the category, the $200,000+ income range is the most frequent in Woodmont borough, accounting for 24.0% of all households. In contrast, only 17 households (2.1%) fall into the $10,000 to $14,999 income bracket, making it the least populous group.
| Income Bracket | # Households | % Households |
| Less than $10,000 | 19 | 2.4% |
| $10,000 to $14,999 | 17 | 2.1% |
| $15,000 to $24,999 | 17 | 2.1% |
| $25,000 to $34,999 | 21 | 2.6% |
| $35,000 to $49,999 | 62 | 7.8% |
| $50,000 to $74,999 | 184 | 23.0% |
| $75,000 to $99,999 | 82 | 10.3% |
| $100,000 to $149,999 | 141 | 17.6% |
| $150,000 to $199,999 | 64 | 8.0% |
| $200,000+ | 192 | 24.0% |
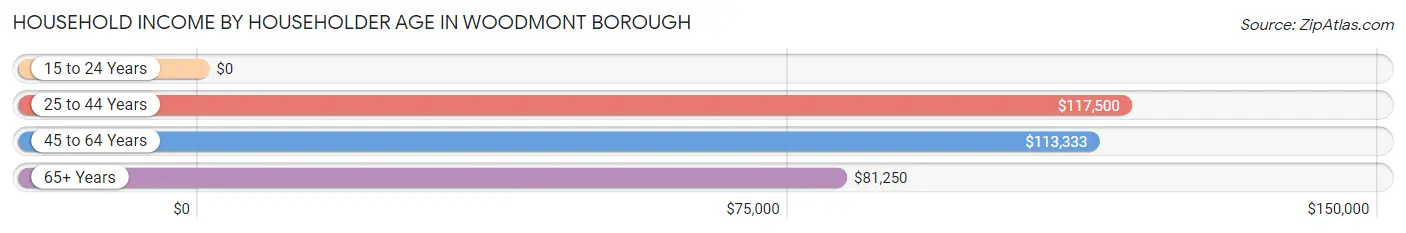
Household Income by Householder Age in Woodmont borough
The median household income in Woodmont borough is $97,171, with the highest median household income of $117,500 found in the 25 to 44 years age bracket for the primary householder. A total of 148 households (18.5%) fall into this category. Meanwhile, the 15 to 24 years age bracket for the primary householder has the lowest median household income of $0, with 4 households (0.5%) in this group.
| Income Bracket | # Households | Median Income |
| 15 to 24 Years | 4 (0.5%) | $0 |
| 25 to 44 Years | 148 (18.5%) | $117,500 |
| 45 to 64 Years | 398 (49.8%) | $113,333 |
| 65+ Years | 249 (31.2%) | $81,250 |
| Total | 799 (100.0%) | $97,171 |
Poverty in Woodmont borough
Income Below Poverty by Sex and Age in Woodmont borough
With 3.7% poverty level for males and 2.0% for females among the residents of Woodmont borough, 25 to 34 year old males and 75 year old and over females are the most vulnerable to poverty, with 15 males (18.5%) and 11 females (15.3%) in their respective age groups living below the poverty level.
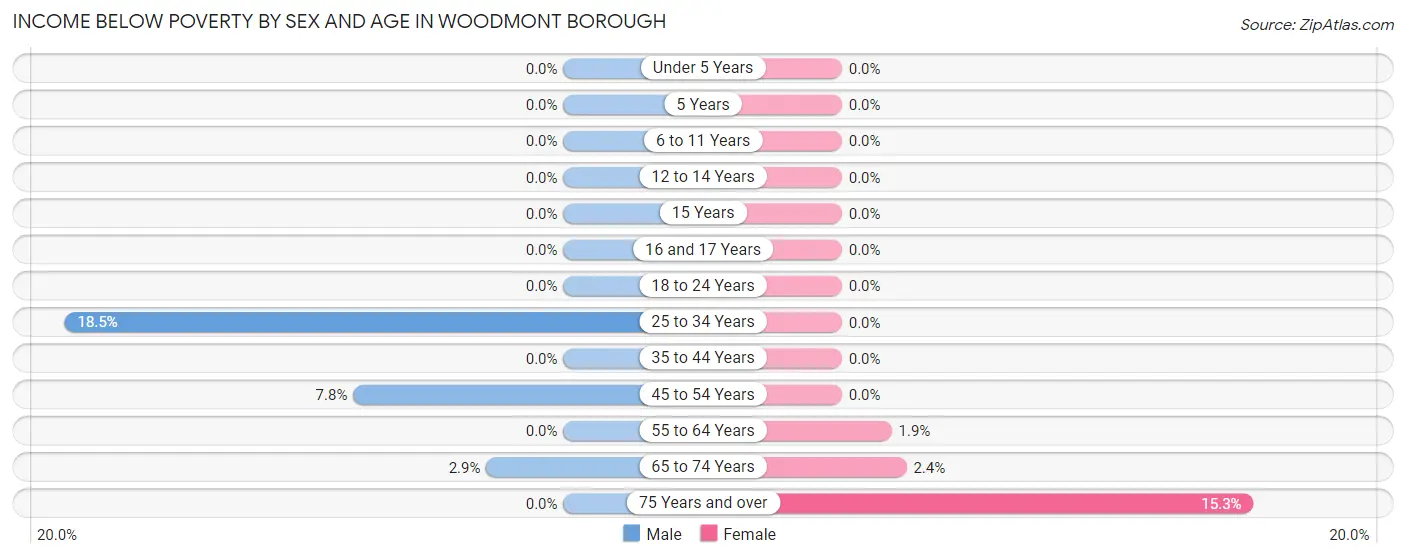
| Age Bracket | Male | Female |
| Under 5 Years | 0 (0.0%) | 0 (0.0%) |
| 5 Years | 0 (0.0%) | 0 (0.0%) |
| 6 to 11 Years | 0 (0.0%) | 0 (0.0%) |
| 12 to 14 Years | 0 (0.0%) | 0 (0.0%) |
| 15 Years | 0 (0.0%) | 0 (0.0%) |
| 16 and 17 Years | 0 (0.0%) | 0 (0.0%) |
| 18 to 24 Years | 0 (0.0%) | 0 (0.0%) |
| 25 to 34 Years | 15 (18.5%) | 0 (0.0%) |
| 35 to 44 Years | 0 (0.0%) | 0 (0.0%) |
| 45 to 54 Years | 11 (7.8%) | 0 (0.0%) |
| 55 to 64 Years | 0 (0.0%) | 3 (1.8%) |
| 65 to 74 Years | 3 (2.9%) | 3 (2.4%) |
| 75 Years and over | 0 (0.0%) | 11 (15.3%) |
| Total | 29 (3.7%) | 17 (2.0%) |
Income Above Poverty by Sex and Age in Woodmont borough
According to the poverty statistics in Woodmont borough, males aged under 5 years and females aged under 5 years are the age groups that are most secure financially, with 100.0% of males and 100.0% of females in these age groups living above the poverty line.
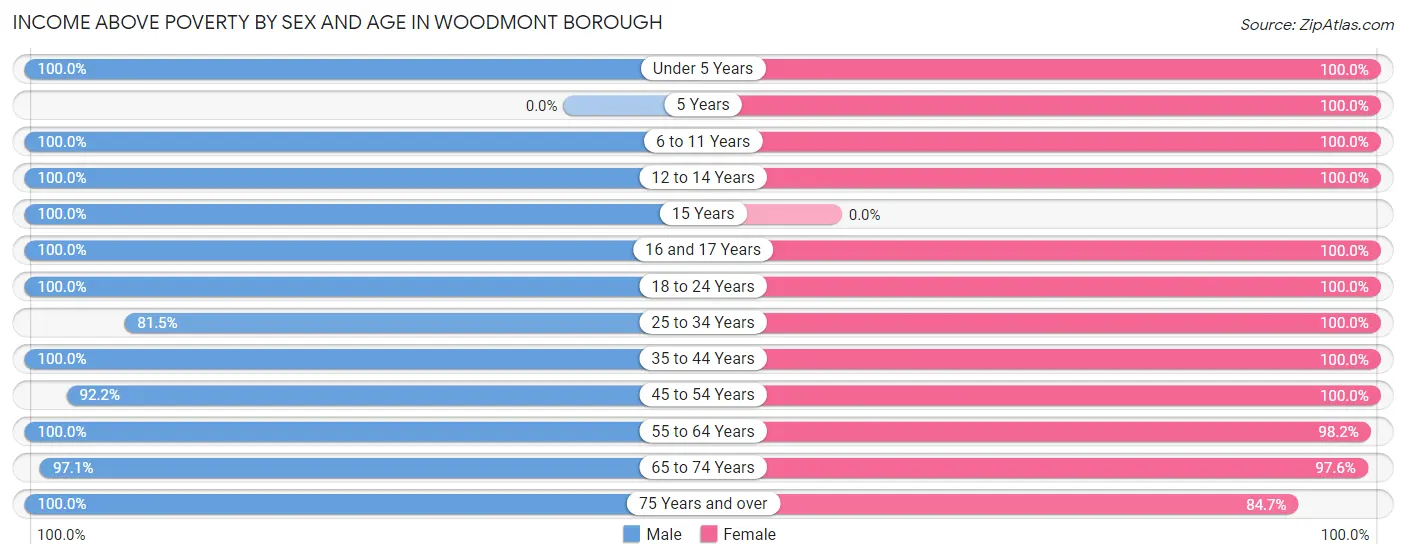
| Age Bracket | Male | Female |
| Under 5 Years | 4 (100.0%) | 15 (100.0%) |
| 5 Years | 0 (0.0%) | 12 (100.0%) |
| 6 to 11 Years | 59 (100.0%) | 44 (100.0%) |
| 12 to 14 Years | 3 (100.0%) | 32 (100.0%) |
| 15 Years | 32 (100.0%) | 0 (0.0%) |
| 16 and 17 Years | 20 (100.0%) | 14 (100.0%) |
| 18 to 24 Years | 88 (100.0%) | 58 (100.0%) |
| 25 to 34 Years | 66 (81.5%) | 54 (100.0%) |
| 35 to 44 Years | 78 (100.0%) | 60 (100.0%) |
| 45 to 54 Years | 130 (92.2%) | 192 (100.0%) |
| 55 to 64 Years | 110 (100.0%) | 159 (98.2%) |
| 65 to 74 Years | 102 (97.1%) | 122 (97.6%) |
| 75 Years and over | 58 (100.0%) | 61 (84.7%) |
| Total | 750 (96.3%) | 823 (98.0%) |
Income Below Poverty Among Married-Couple Families in Woodmont borough
The poverty statistics for married-couple families in Woodmont borough show that 0.9% or 3 of the total 353 families live below the poverty line. Families with no children have the highest poverty rate of 1.3%, comprising of 3 families. On the other hand, families with 1 or 2 children have the lowest poverty rate of 0.0%, which includes 0 families.
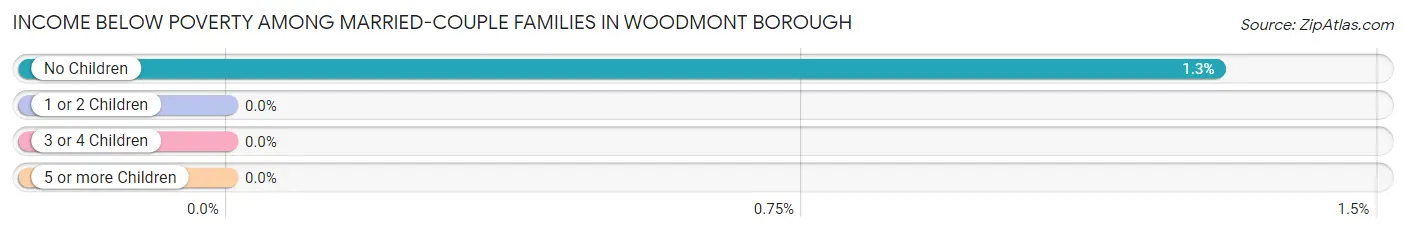
| Children | Above Poverty | Below Poverty |
| No Children | 230 (98.7%) | 3 (1.3%) |
| 1 or 2 Children | 115 (100.0%) | 0 (0.0%) |
| 3 or 4 Children | 5 (100.0%) | 0 (0.0%) |
| 5 or more Children | 0 (0.0%) | 0 (0.0%) |
| Total | 350 (99.2%) | 3 (0.9%) |
Income Below Poverty Among Single-Parent Households in Woodmont borough
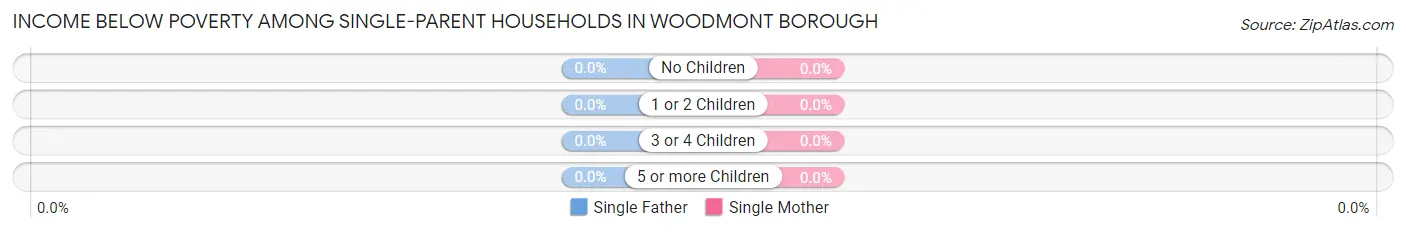
| Children | Single Father | Single Mother |
| No Children | 0 (0.0%) | 0 (0.0%) |
| 1 or 2 Children | 0 (0.0%) | 0 (0.0%) |
| 3 or 4 Children | 0 (0.0%) | 0 (0.0%) |
| 5 or more Children | 0 (0.0%) | 0 (0.0%) |
| Total | 0 (0.0%) | 0 (0.0%) |
Income Below Poverty Among Married-Couple vs Single-Parent Households in Woodmont borough
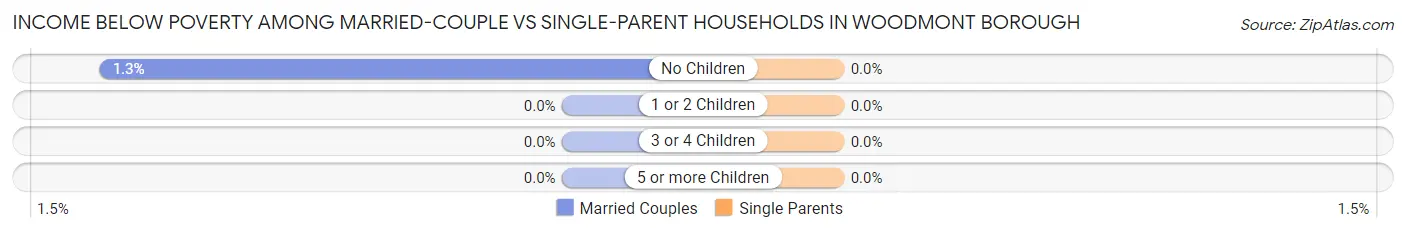
| Children | Married-Couple Families | Single-Parent Households |
| No Children | 3 (1.3%) | 0 (0.0%) |
| 1 or 2 Children | 0 (0.0%) | 0 (0.0%) |
| 3 or 4 Children | 0 (0.0%) | 0 (0.0%) |
| 5 or more Children | 0 (0.0%) | 0 (0.0%) |
| Total | 3 (0.9%) | 0 (0.0%) |
Race in Woodmont borough
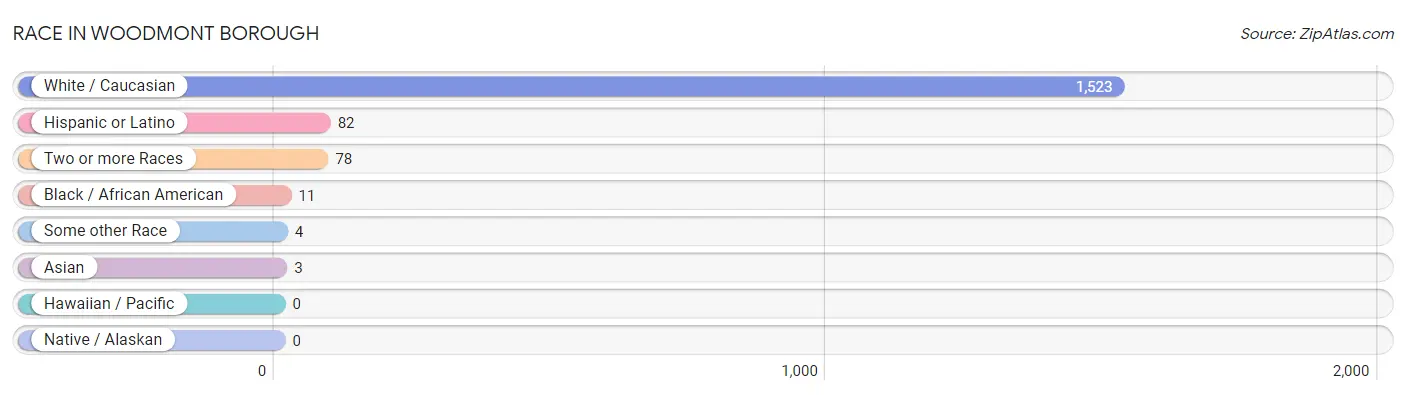
The most populous races in Woodmont borough are White / Caucasian (1,523 | 94.1%), Hispanic or Latino (82 | 5.1%), and Two or more Races (78 | 4.8%).
| Race | # Population | % Population |
| Asian | 3 | 0.2% |
| Black / African American | 11 | 0.7% |
| Hawaiian / Pacific | 0 | 0.0% |
| Hispanic or Latino | 82 | 5.1% |
| Native / Alaskan | 0 | 0.0% |
| White / Caucasian | 1,523 | 94.1% |
| Two or more Races | 78 | 4.8% |
| Some other Race | 4 | 0.3% |
| Total | 1,619 | 100.0% |
Ancestry in Woodmont borough
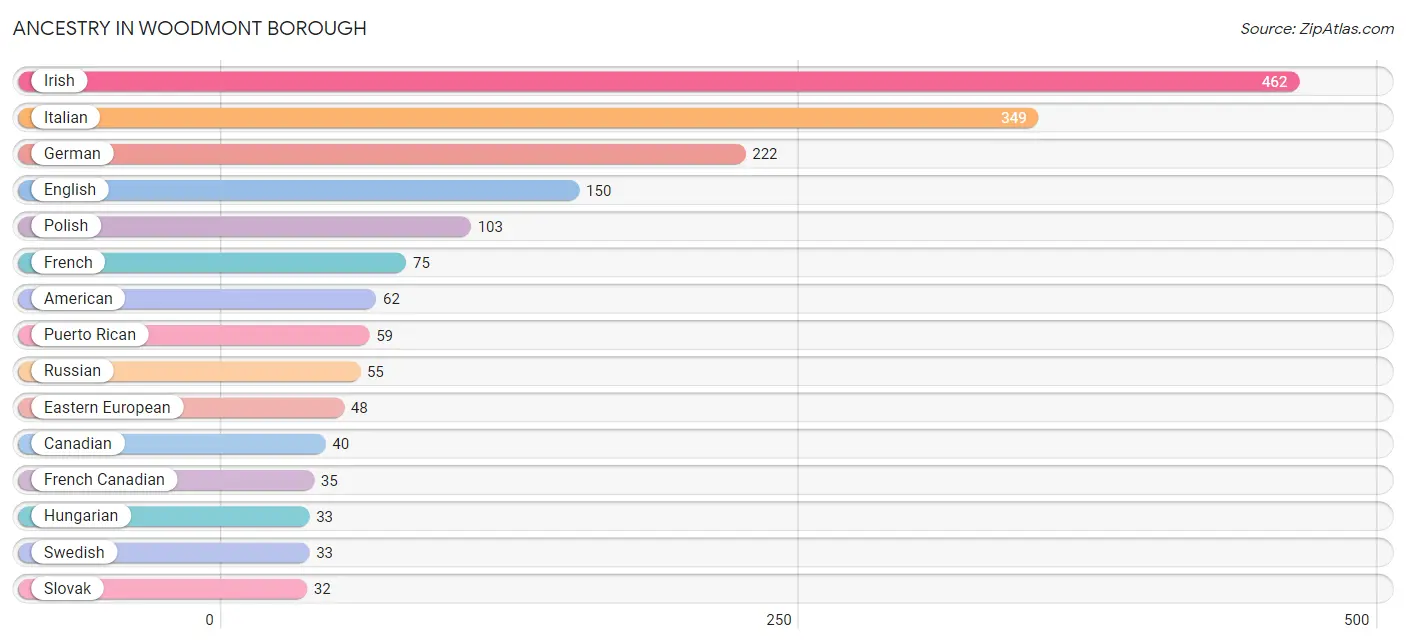
The most populous ancestries reported in Woodmont borough are Irish (462 | 28.5%), Italian (349 | 21.6%), German (222 | 13.7%), English (150 | 9.3%), and Polish (103 | 6.4%), together accounting for 79.4% of all Woodmont borough residents.
| Ancestry | # Population | % Population |
| American | 62 | 3.8% |
| Armenian | 3 | 0.2% |
| Australian | 3 | 0.2% |
| Austrian | 11 | 0.7% |
| Bhutanese | 2 | 0.1% |
| Blackfeet | 27 | 1.7% |
| British | 23 | 1.4% |
| Canadian | 40 | 2.5% |
| Cherokee | 25 | 1.5% |
| Colombian | 7 | 0.4% |
| Croatian | 6 | 0.4% |
| Czech | 19 | 1.2% |
| Danish | 4 | 0.3% |
| Dominican | 4 | 0.3% |
| Dutch | 11 | 0.7% |
| Eastern European | 48 | 3.0% |
| English | 150 | 9.3% |
| Finnish | 11 | 0.7% |
| French | 75 | 4.6% |
| French Canadian | 35 | 2.2% |
| German | 222 | 13.7% |
| Greek | 14 | 0.9% |
| Hungarian | 33 | 2.0% |
| Irish | 462 | 28.5% |
| Italian | 349 | 21.6% |
| Laotian | 3 | 0.2% |
| Lithuanian | 7 | 0.4% |
| Northern European | 3 | 0.2% |
| Norwegian | 10 | 0.6% |
| Polish | 103 | 6.4% |
| Portuguese | 11 | 0.7% |
| Puerto Rican | 59 | 3.6% |
| Romanian | 6 | 0.4% |
| Russian | 55 | 3.4% |
| Scotch-Irish | 5 | 0.3% |
| Scottish | 13 | 0.8% |
| Slavic | 7 | 0.4% |
| Slovak | 32 | 2.0% |
| South American | 7 | 0.4% |
| Spaniard | 12 | 0.7% |
| Swedish | 33 | 2.0% |
| Swiss | 3 | 0.2% |
| Thai | 3 | 0.2% |
| Ukrainian | 21 | 1.3% |
| Yugoslavian | 15 | 0.9% | View All 45 Rows |
Immigrants in Woodmont borough
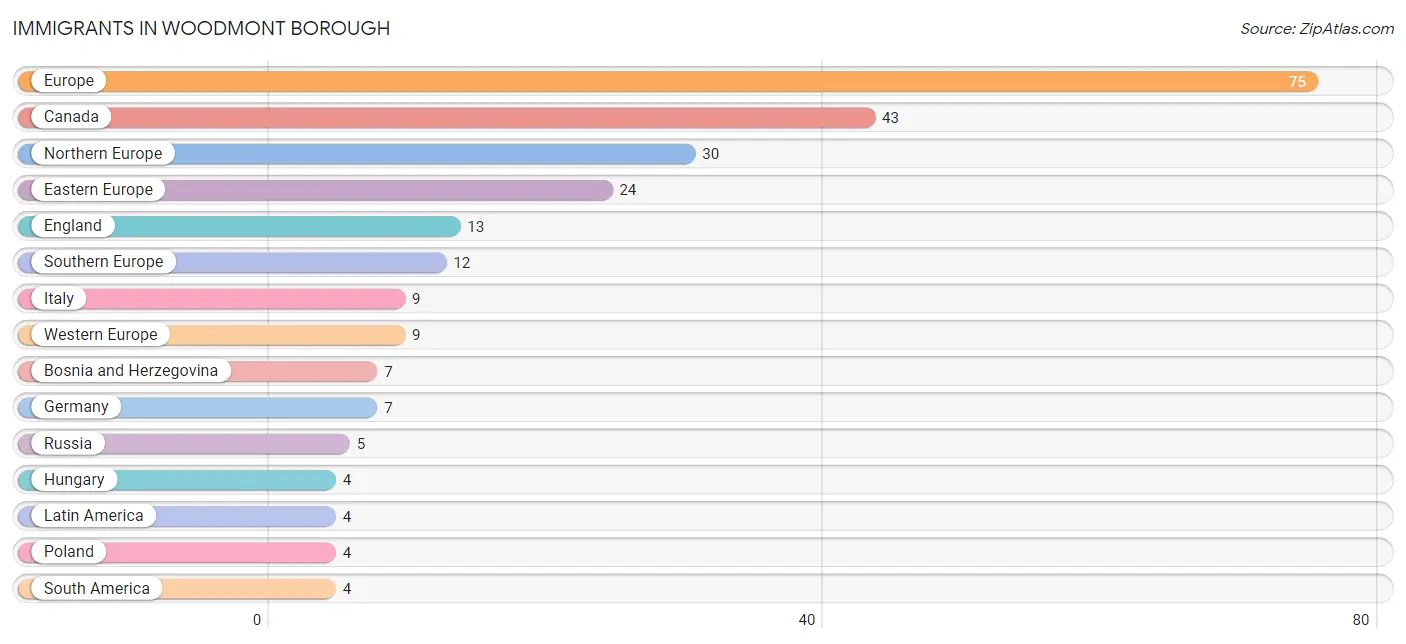
The most numerous immigrant groups reported in Woodmont borough came from Europe (75 | 4.6%), Canada (43 | 2.7%), Northern Europe (30 | 1.8%), Eastern Europe (24 | 1.5%), and England (13 | 0.8%), together accounting for 11.4% of all Woodmont borough residents.
| Immigration Origin | # Population | % Population |
| Africa | 3 | 0.2% |
| Asia | 3 | 0.2% |
| Austria | 2 | 0.1% |
| Bosnia and Herzegovina | 7 | 0.4% |
| Brazil | 2 | 0.1% |
| Canada | 43 | 2.7% |
| Colombia | 2 | 0.1% |
| Eastern Europe | 24 | 1.5% |
| England | 13 | 0.8% |
| Europe | 75 | 4.6% |
| Germany | 7 | 0.4% |
| Hungary | 4 | 0.3% |
| Indonesia | 3 | 0.2% |
| Italy | 9 | 0.6% |
| Latin America | 4 | 0.3% |
| Northern Europe | 30 | 1.8% |
| Poland | 4 | 0.3% |
| Russia | 5 | 0.3% |
| South Africa | 3 | 0.2% |
| South America | 4 | 0.3% |
| South Eastern Asia | 3 | 0.2% |
| Southern Europe | 12 | 0.7% |
| Spain | 3 | 0.2% |
| Ukraine | 4 | 0.3% |
| Western Europe | 9 | 0.6% | View All 25 Rows |
Sex and Age in Woodmont borough
Sex and Age in Woodmont borough
The most populous age groups in Woodmont borough are 50 to 54 Years (98 | 12.6%) for men and 50 to 54 Years (150 | 17.9%) for women.
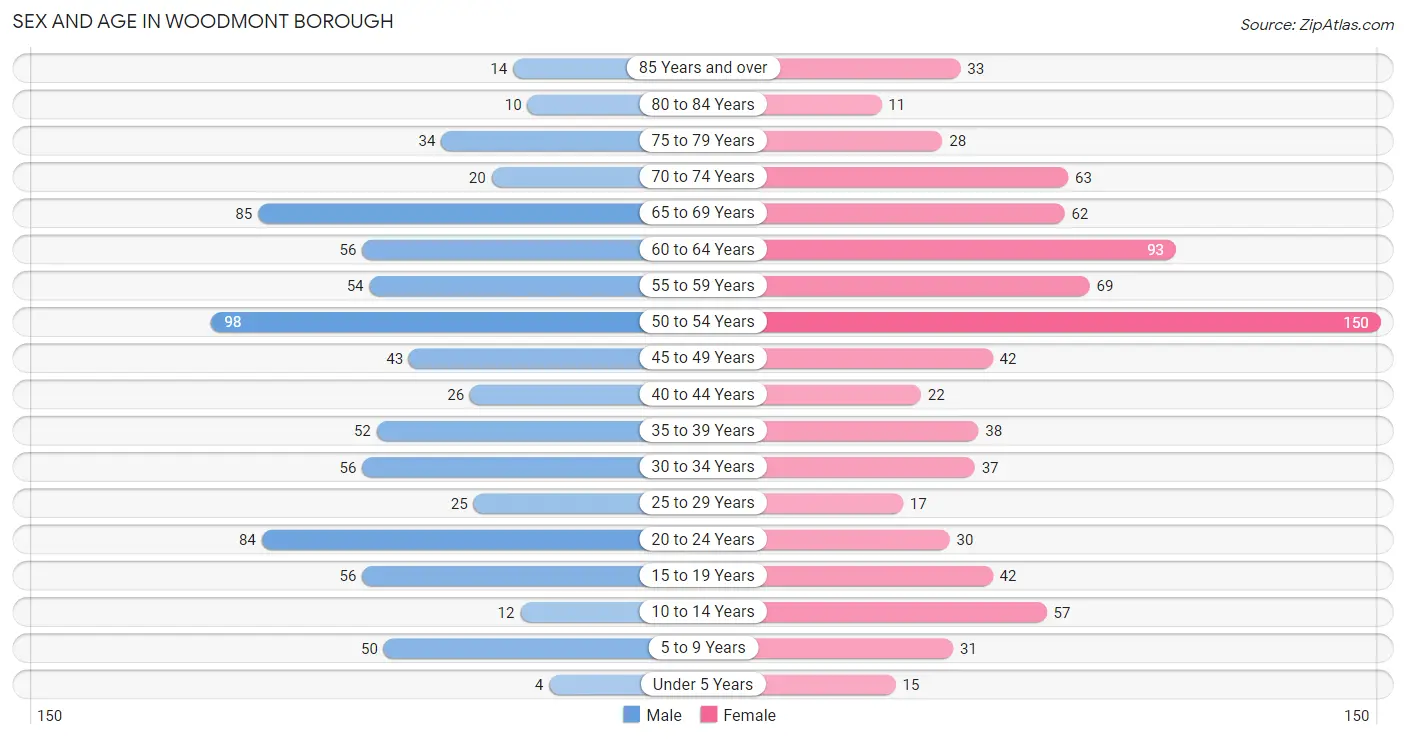
| Age Bracket | Male | Female |
| Under 5 Years | 4 (0.5%) | 15 (1.8%) |
| 5 to 9 Years | 50 (6.4%) | 31 (3.7%) |
| 10 to 14 Years | 12 (1.5%) | 57 (6.8%) |
| 15 to 19 Years | 56 (7.2%) | 42 (5.0%) |
| 20 to 24 Years | 84 (10.8%) | 30 (3.6%) |
| 25 to 29 Years | 25 (3.2%) | 17 (2.0%) |
| 30 to 34 Years | 56 (7.2%) | 37 (4.4%) |
| 35 to 39 Years | 52 (6.7%) | 38 (4.5%) |
| 40 to 44 Years | 26 (3.3%) | 22 (2.6%) |
| 45 to 49 Years | 43 (5.5%) | 42 (5.0%) |
| 50 to 54 Years | 98 (12.6%) | 150 (17.9%) |
| 55 to 59 Years | 54 (6.9%) | 69 (8.2%) |
| 60 to 64 Years | 56 (7.2%) | 93 (11.1%) |
| 65 to 69 Years | 85 (10.9%) | 62 (7.4%) |
| 70 to 74 Years | 20 (2.6%) | 63 (7.5%) |
| 75 to 79 Years | 34 (4.4%) | 28 (3.3%) |
| 80 to 84 Years | 10 (1.3%) | 11 (1.3%) |
| 85 Years and over | 14 (1.8%) | 33 (3.9%) |
| Total | 779 (100.0%) | 840 (100.0%) |
Families and Households in Woodmont borough
Median Family Size in Woodmont borough
The median family size in Woodmont borough is 2.87 persons per family, with married-couple families (353 | 83.1%) accounting for the largest median family size of 2.9 persons per family. On the other hand, single male/father families (29 | 6.8%) represent the smallest median family size with 2.69 persons per family.
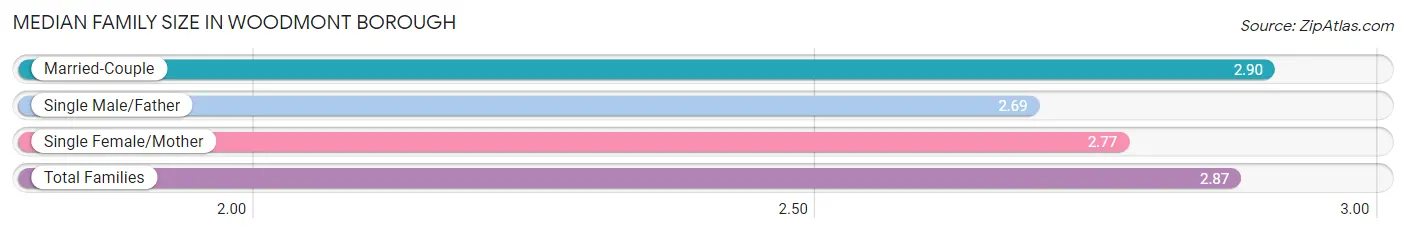
| Family Type | # Families | Family Size |
| Married-Couple | 353 (83.1%) | 2.90 |
| Single Male/Father | 29 (6.8%) | 2.69 |
| Single Female/Mother | 43 (10.1%) | 2.77 |
| Total Families | 425 (100.0%) | 2.87 |
Median Household Size in Woodmont borough
The median household size in Woodmont borough is 2.03 persons per household, with married-couple households (353 | 44.2%) accounting for the largest median household size of 2.9 persons per household. non-family households (374 | 46.8%) represent the smallest median household size with 1.06 persons per household.
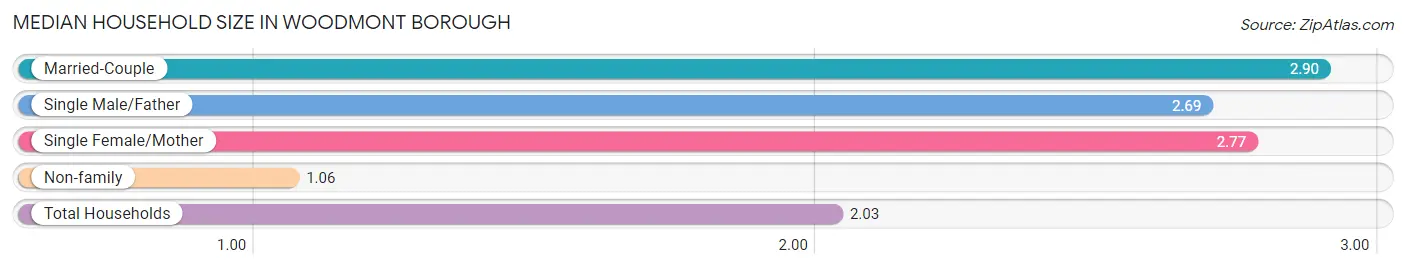
| Household Type | # Households | Household Size |
| Married-Couple | 353 (44.2%) | 2.90 |
| Single Male/Father | 29 (3.6%) | 2.69 |
| Single Female/Mother | 43 (5.4%) | 2.77 |
| Non-family | 374 (46.8%) | 1.06 |
| Total Households | 799 (100.0%) | 2.03 |
Household Size by Marriage Status in Woodmont borough
Out of a total of 799 households in Woodmont borough, 425 (53.2%) are family households, while 374 (46.8%) are nonfamily households. The most numerous type of family households are 2-person households, comprising 212, and the most common type of nonfamily households are 1-person households, comprising 350.
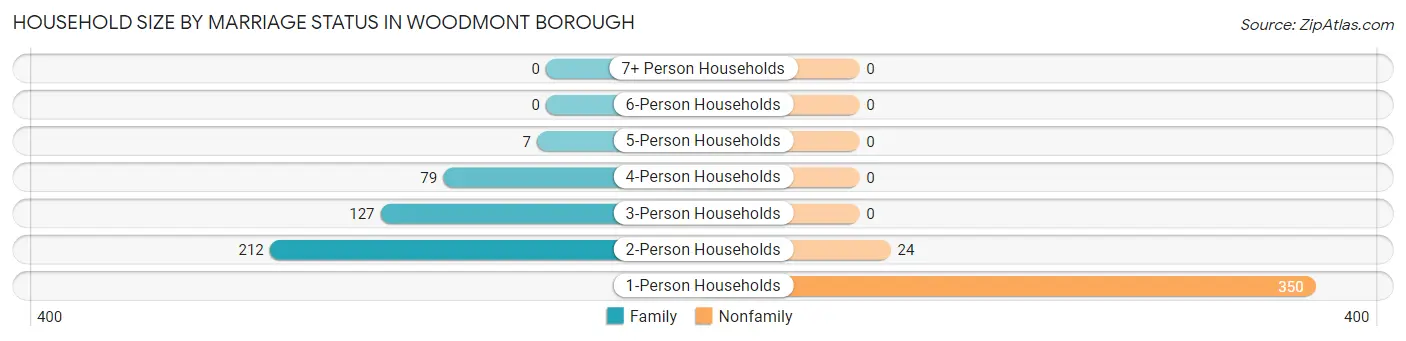
| Household Size | Family Households | Nonfamily Households |
| 1-Person Households | - | 350 (43.8%) |
| 2-Person Households | 212 (26.5%) | 24 (3.0%) |
| 3-Person Households | 127 (15.9%) | 0 (0.0%) |
| 4-Person Households | 79 (9.9%) | 0 (0.0%) |
| 5-Person Households | 7 (0.9%) | 0 (0.0%) |
| 6-Person Households | 0 (0.0%) | 0 (0.0%) |
| 7+ Person Households | 0 (0.0%) | 0 (0.0%) |
| Total | 425 (53.2%) | 374 (46.8%) |
Female Fertility in Woodmont borough
Fertility by Age in Woodmont borough
Average fertility rate in Woodmont borough is 31.0 births per 1,000 women. Women in the age bracket of 20 to 34 years have the highest fertility rate with 48.0 births per 1,000 women. Women in the age bracket of 20 to 34 years acount for 50.0% of all women with births.
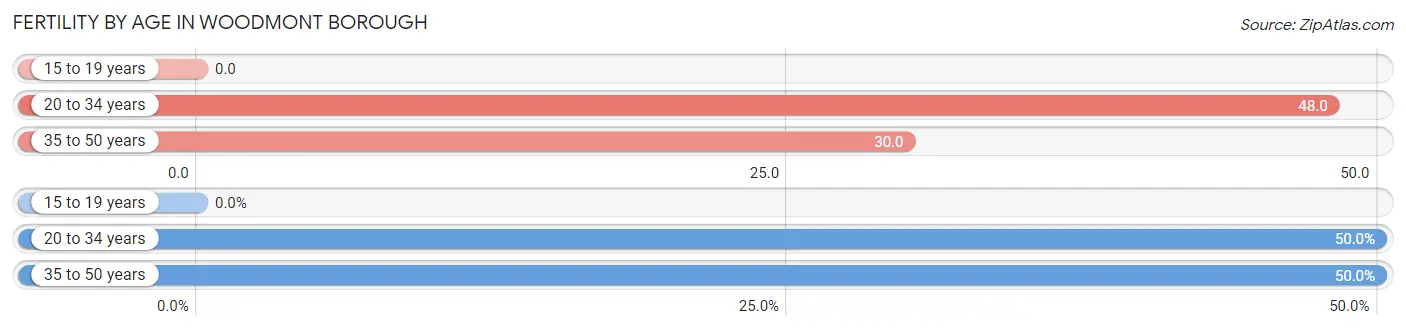
| Age Bracket | Women with Births | Births / 1,000 Women |
| 15 to 19 years | 0 (0.0%) | 0.0 |
| 20 to 34 years | 4 (50.0%) | 48.0 |
| 35 to 50 years | 4 (50.0%) | 30.0 |
| Total | 8 (100.0%) | 31.0 |
Fertility by Age by Marriage Status in Woodmont borough
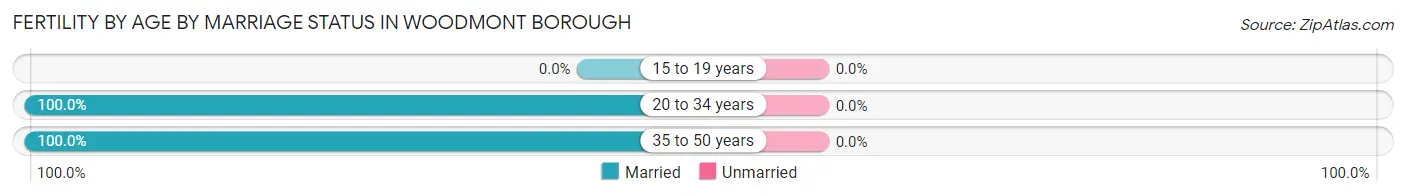
| Age Bracket | Married | Unmarried |
| 15 to 19 years | 0 (0.0%) | 0 (0.0%) |
| 20 to 34 years | 4 (100.0%) | 0 (0.0%) |
| 35 to 50 years | 4 (100.0%) | 0 (0.0%) |
| Total | 8 (100.0%) | 0 (0.0%) |
Fertility by Education in Woodmont borough
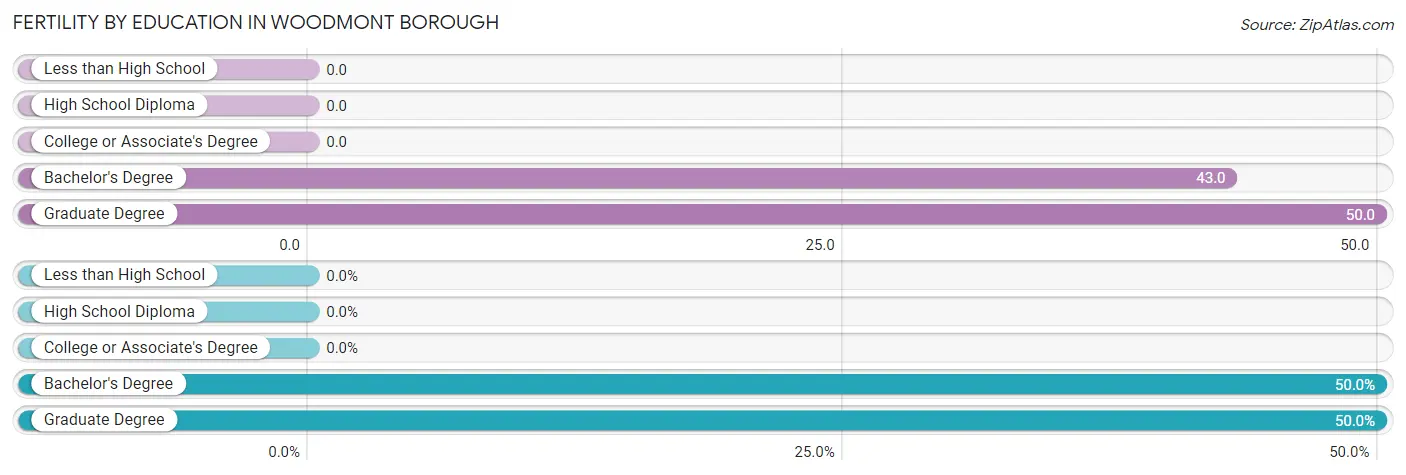
| Educational Attainment | Women with Births | Births / 1,000 Women |
| Less than High School | 0 (0.0%) | 0.0 |
| High School Diploma | 0 (0.0%) | 0.0 |
| College or Associate's Degree | 0 (0.0%) | 0.0 |
| Bachelor's Degree | 4 (50.0%) | 43.0 |
| Graduate Degree | 4 (50.0%) | 50.0 |
| Total | 8 (100.0%) | 31.0 |
Fertility by Education by Marriage Status in Woodmont borough
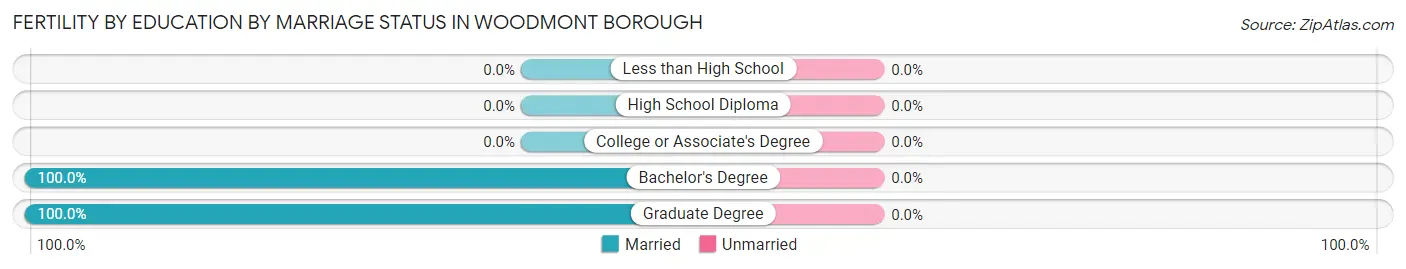
| Educational Attainment | Married | Unmarried |
| Less than High School | 0 (0.0%) | 0 (0.0%) |
| High School Diploma | 0 (0.0%) | 0 (0.0%) |
| College or Associate's Degree | 0 (0.0%) | 0 (0.0%) |
| Bachelor's Degree | 4 (100.0%) | 0 (0.0%) |
| Graduate Degree | 4 (100.0%) | 0 (0.0%) |
| Total | 8 (100.0%) | 0 (0.0%) |
Employment Characteristics in Woodmont borough
Employment by Class of Employer in Woodmont borough
Among the 935 employed individuals in Woodmont borough, private company employees (517 | 55.3%), not-for-profit organizations (111 | 11.9%), and local government employees (111 | 11.9%) make up the most common classes of employment.
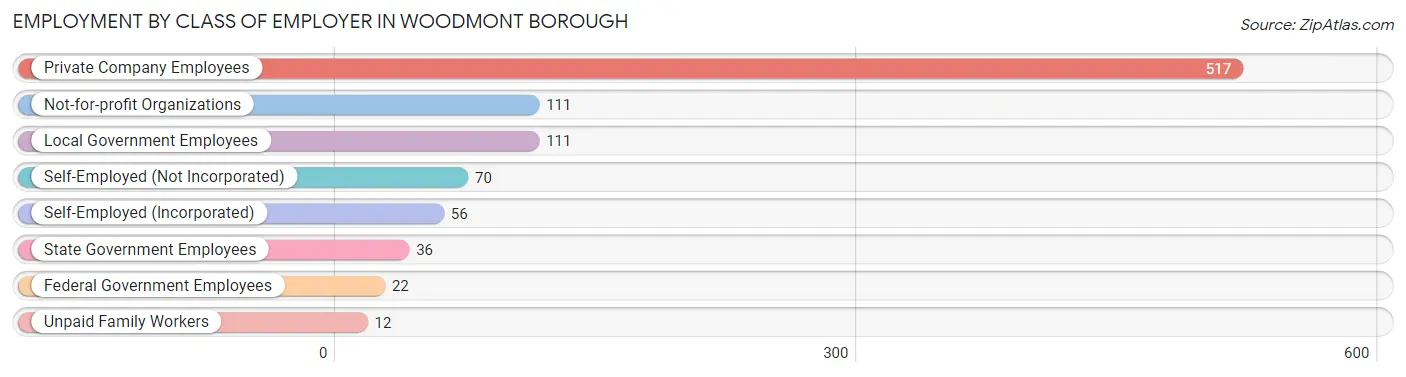
| Employer Class | # Employees | % Employees |
| Private Company Employees | 517 | 55.3% |
| Self-Employed (Incorporated) | 56 | 6.0% |
| Self-Employed (Not Incorporated) | 70 | 7.5% |
| Not-for-profit Organizations | 111 | 11.9% |
| Local Government Employees | 111 | 11.9% |
| State Government Employees | 36 | 3.8% |
| Federal Government Employees | 22 | 2.4% |
| Unpaid Family Workers | 12 | 1.3% |
| Total | 935 | 100.0% |
Employment Status by Age in Woodmont borough
According to the labor force statistics for Woodmont borough, out of the total population over 16 years of age (1,418), 69.5% or 986 individuals are in the labor force, with 2.8% or 28 of them unemployed. The age group with the highest labor force participation rate is 30 to 34 years, with 100.0% or 93 individuals in the labor force. Within the labor force, the 20 to 24 years age range has the highest percentage of unemployed individuals, with 19.0% or 12 of them being unemployed.
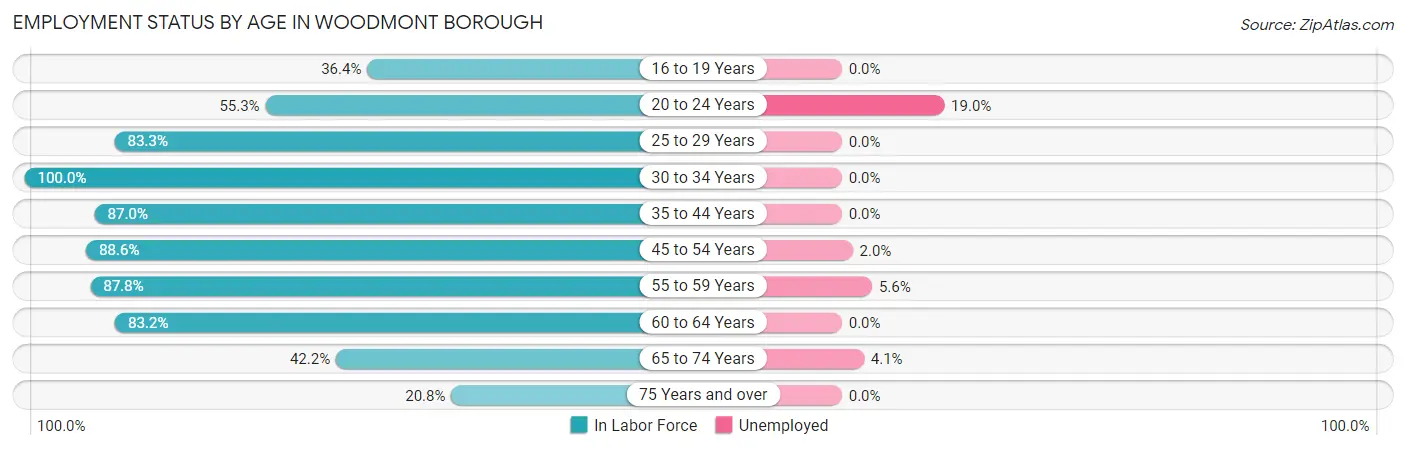
| Age Bracket | In Labor Force | Unemployed |
| 16 to 19 Years | 24 (36.4%) | 0 (0.0%) |
| 20 to 24 Years | 63 (55.3%) | 12 (19.0%) |
| 25 to 29 Years | 35 (83.3%) | 0 (0.0%) |
| 30 to 34 Years | 93 (100.0%) | 0 (0.0%) |
| 35 to 44 Years | 120 (87.0%) | 0 (0.0%) |
| 45 to 54 Years | 295 (88.6%) | 6 (2.0%) |
| 55 to 59 Years | 108 (87.8%) | 6 (5.6%) |
| 60 to 64 Years | 124 (83.2%) | 0 (0.0%) |
| 65 to 74 Years | 97 (42.2%) | 4 (4.1%) |
| 75 Years and over | 27 (20.8%) | 0 (0.0%) |
| Total | 986 (69.5%) | 28 (2.8%) |
Employment Status by Educational Attainment in Woodmont borough
According to labor force statistics for Woodmont borough, 88.3% of individuals (775) out of the total population between 25 and 64 years of age (878) are in the labor force, with 1.5% or 12 of them being unemployed. The group with the highest labor force participation rate are those with the educational attainment of bachelor's degree or higher, with 95.8% or 548 individuals in the labor force. Within the labor force, individuals with high school diploma education have the highest percentage of unemployment, with 8.7% or 6 of them being unemployed.
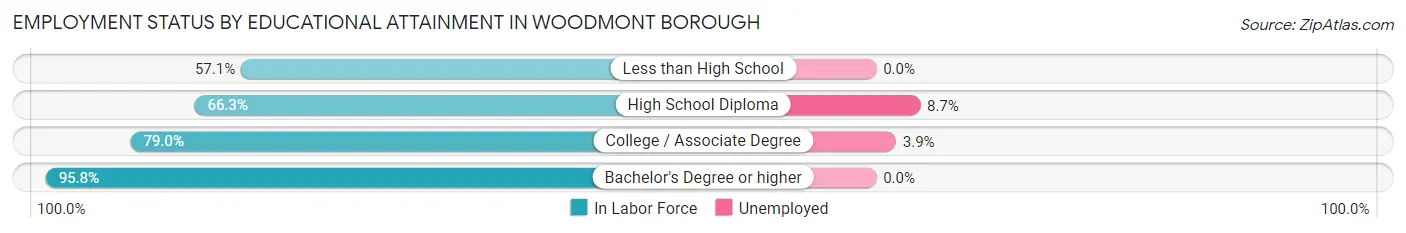
| Educational Attainment | In Labor Force | Unemployed |
| Less than High School | 4 (57.1%) | 0 (0.0%) |
| High School Diploma | 69 (66.3%) | 9 (8.7%) |
| College / Associate Degree | 154 (79.0%) | 8 (3.9%) |
| Bachelor's Degree or higher | 548 (95.8%) | 0 (0.0%) |
| Total | 775 (88.3%) | 13 (1.5%) |
Employment Occupations by Sex in Woodmont borough
Management, Business, Science and Arts Occupations
The most common Management, Business, Science and Arts occupations in Woodmont borough are Management (179 | 18.7%), Community & Social Service (174 | 18.2%), Education Instruction & Library (115 | 12.0%), Health Diagnosing & Treating (97 | 10.1%), and Health Technologists (79 | 8.3%).
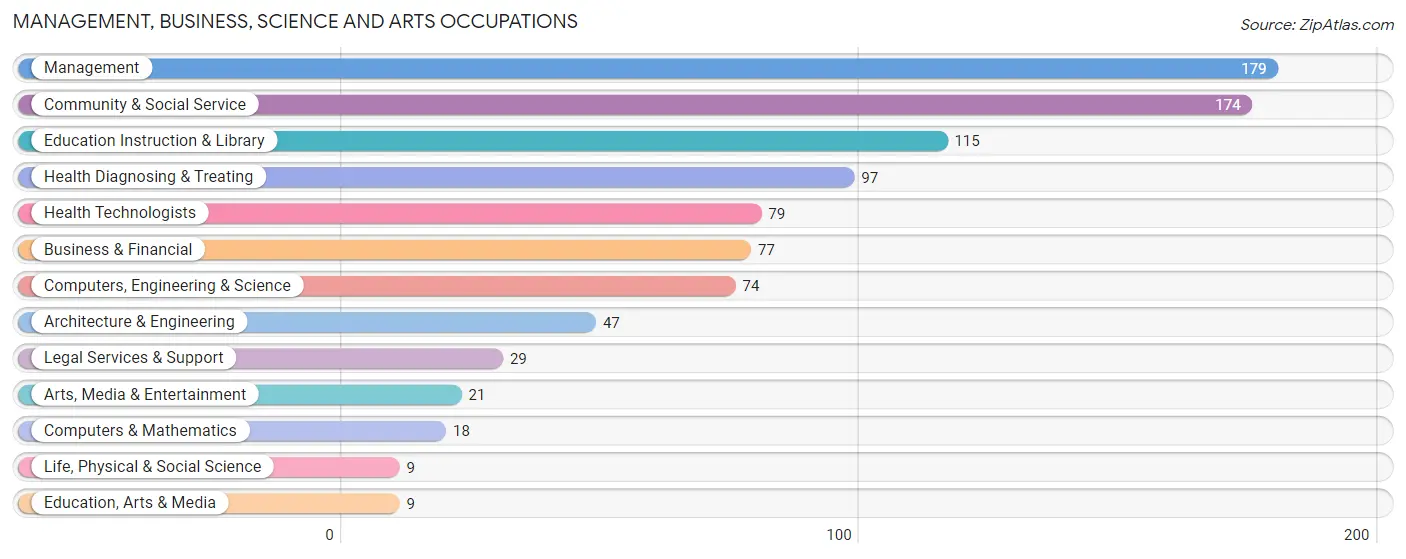
Management, Business, Science and Arts Occupations by Sex
Within the Management, Business, Science and Arts occupations in Woodmont borough, the most male-oriented occupations are Architecture & Engineering (83.0%), Computers, Engineering & Science (74.3%), and Management (66.5%), while the most female-oriented occupations are Education, Arts & Media (100.0%), Health Diagnosing & Treating (63.9%), and Health Technologists (55.7%).
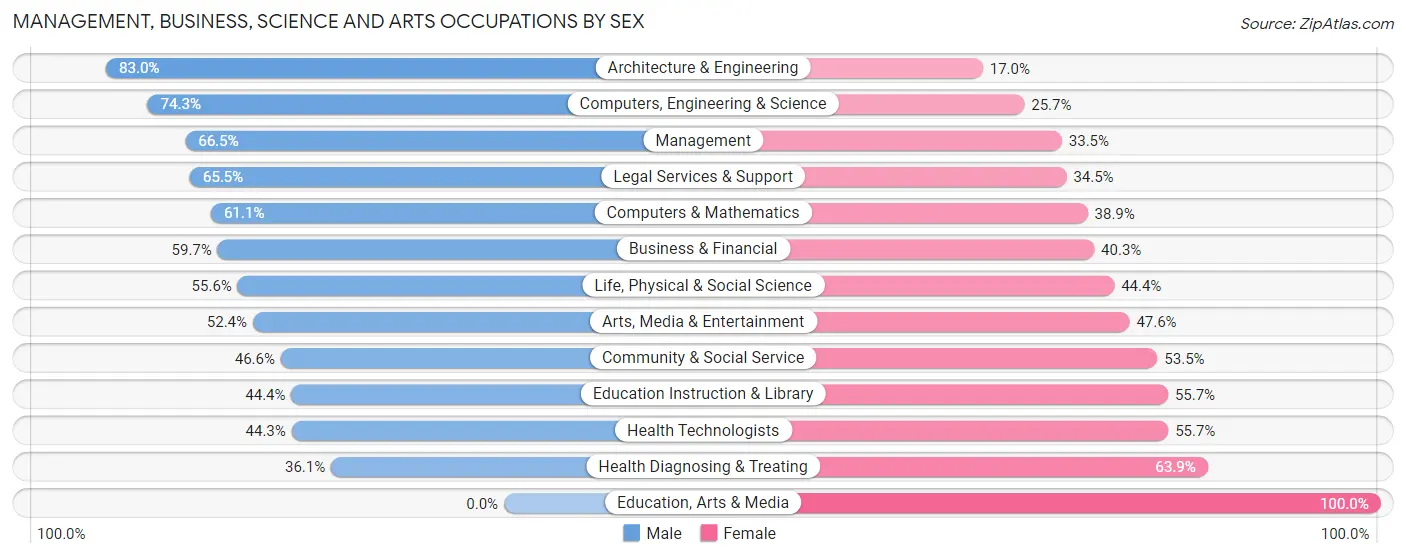
| Occupation | Male | Female |
| Management | 119 (66.5%) | 60 (33.5%) |
| Business & Financial | 46 (59.7%) | 31 (40.3%) |
| Computers, Engineering & Science | 55 (74.3%) | 19 (25.7%) |
| Computers & Mathematics | 11 (61.1%) | 7 (38.9%) |
| Architecture & Engineering | 39 (83.0%) | 8 (17.0%) |
| Life, Physical & Social Science | 5 (55.6%) | 4 (44.4%) |
| Community & Social Service | 81 (46.6%) | 93 (53.4%) |
| Education, Arts & Media | 0 (0.0%) | 9 (100.0%) |
| Legal Services & Support | 19 (65.5%) | 10 (34.5%) |
| Education Instruction & Library | 51 (44.4%) | 64 (55.6%) |
| Arts, Media & Entertainment | 11 (52.4%) | 10 (47.6%) |
| Health Diagnosing & Treating | 35 (36.1%) | 62 (63.9%) |
| Health Technologists | 35 (44.3%) | 44 (55.7%) |
| Total (Category) | 336 (55.9%) | 265 (44.1%) |
| Total (Overall) | 492 (51.4%) | 466 (48.6%) |
Services Occupations
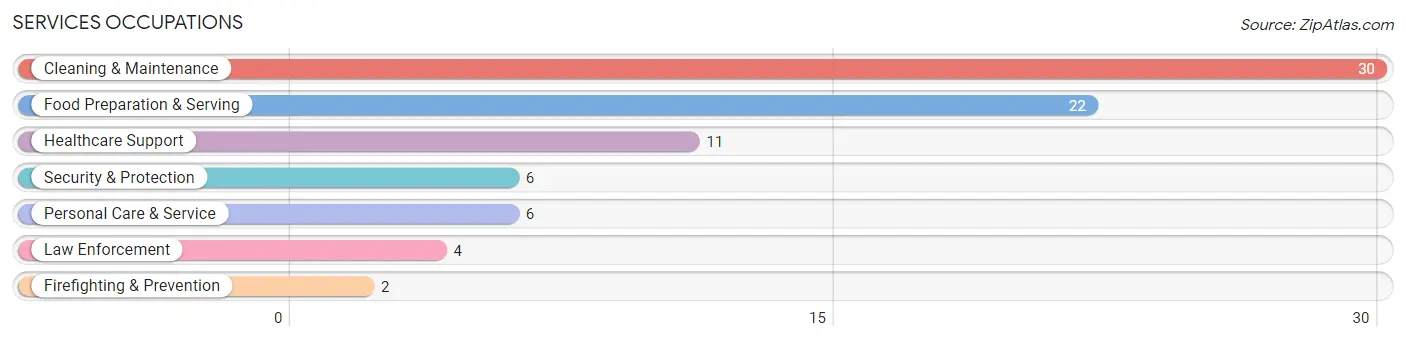
The most common Services occupations in Woodmont borough are Cleaning & Maintenance (30 | 3.1%), Food Preparation & Serving (22 | 2.3%), Healthcare Support (11 | 1.1%), Security & Protection (6 | 0.6%), and Personal Care & Service (6 | 0.6%).
Services Occupations by Sex
Within the Services occupations in Woodmont borough, the most male-oriented occupations are Security & Protection (100.0%), Firefighting & Prevention (100.0%), and Law Enforcement (100.0%), while the most female-oriented occupations are Healthcare Support (100.0%), Cleaning & Maintenance (86.7%), and Food Preparation & Serving (54.5%).
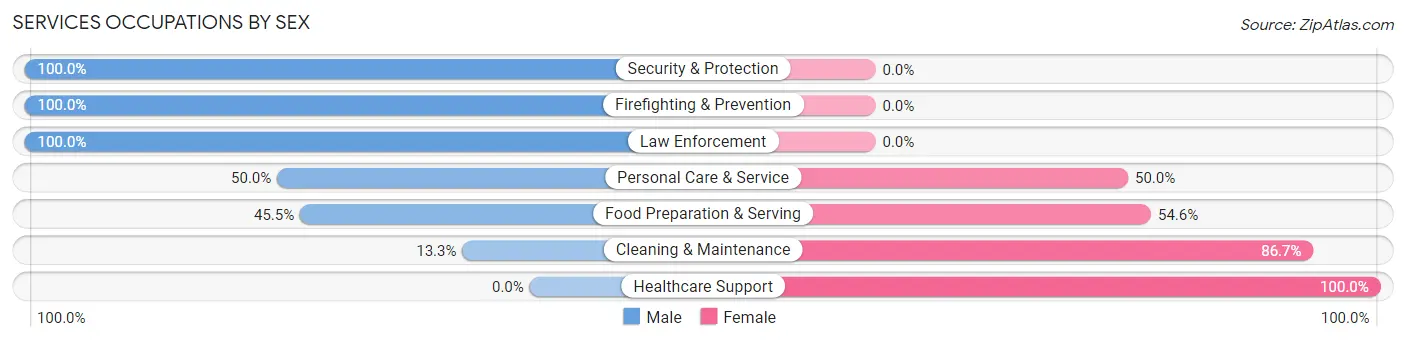
| Occupation | Male | Female |
| Healthcare Support | 0 (0.0%) | 11 (100.0%) |
| Security & Protection | 6 (100.0%) | 0 (0.0%) |
| Firefighting & Prevention | 2 (100.0%) | 0 (0.0%) |
| Law Enforcement | 4 (100.0%) | 0 (0.0%) |
| Food Preparation & Serving | 10 (45.5%) | 12 (54.5%) |
| Cleaning & Maintenance | 4 (13.3%) | 26 (86.7%) |
| Personal Care & Service | 3 (50.0%) | 3 (50.0%) |
| Total (Category) | 23 (30.7%) | 52 (69.3%) |
| Total (Overall) | 492 (51.4%) | 466 (48.6%) |
Sales and Office Occupations
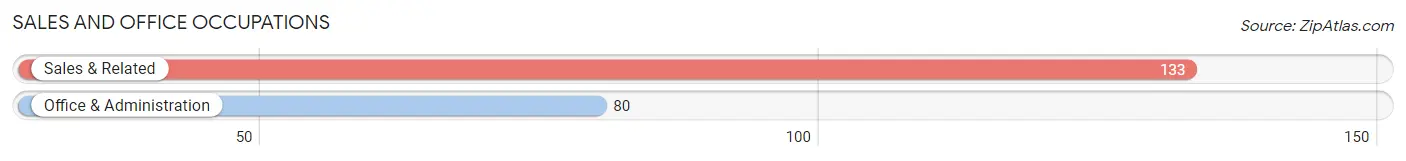
The most common Sales and Office occupations in Woodmont borough are Sales & Related (133 | 13.9%), and Office & Administration (80 | 8.4%).
Sales and Office Occupations by Sex
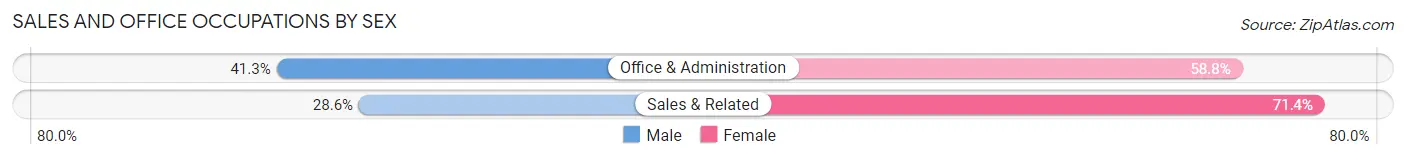
| Occupation | Male | Female |
| Sales & Related | 38 (28.6%) | 95 (71.4%) |
| Office & Administration | 33 (41.2%) | 47 (58.8%) |
| Total (Category) | 71 (33.3%) | 142 (66.7%) |
| Total (Overall) | 492 (51.4%) | 466 (48.6%) |
Natural Resources, Construction and Maintenance Occupations
The most common Natural Resources, Construction and Maintenance occupations in Woodmont borough are Construction & Extraction (29 | 3.0%), and Installation, Maintenance & Repair (11 | 1.1%).
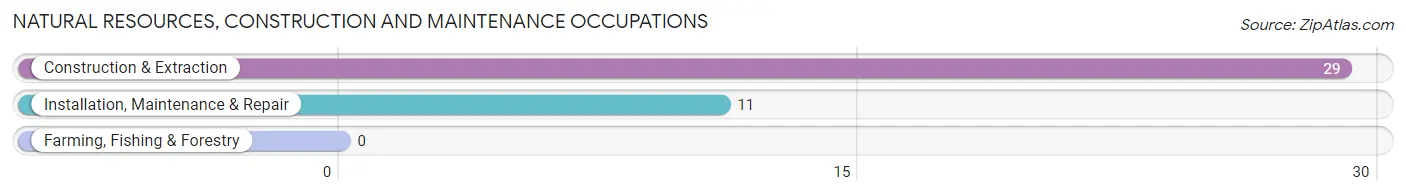
Natural Resources, Construction and Maintenance Occupations by Sex
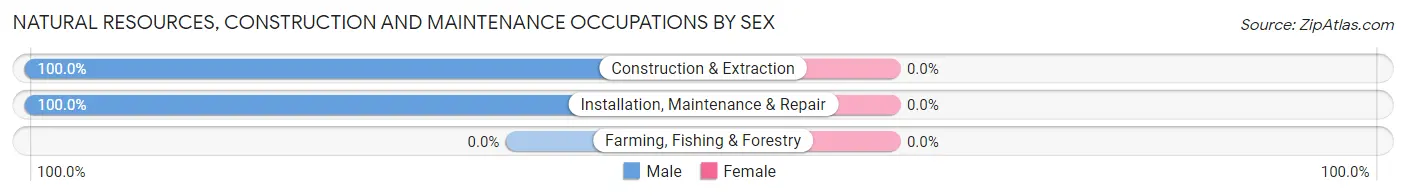
| Occupation | Male | Female |
| Farming, Fishing & Forestry | 0 (0.0%) | 0 (0.0%) |
| Construction & Extraction | 29 (100.0%) | 0 (0.0%) |
| Installation, Maintenance & Repair | 11 (100.0%) | 0 (0.0%) |
| Total (Category) | 40 (100.0%) | 0 (0.0%) |
| Total (Overall) | 492 (51.4%) | 466 (48.6%) |
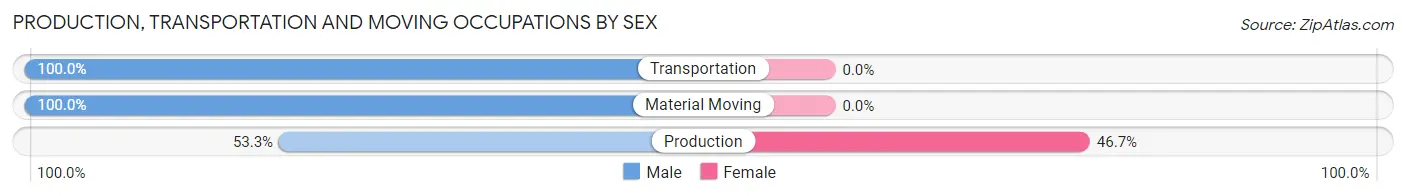
Production, Transportation and Moving Occupations
The most common Production, Transportation and Moving occupations in Woodmont borough are Production (15 | 1.6%), Material Moving (11 | 1.1%), and Transportation (3 | 0.3%).
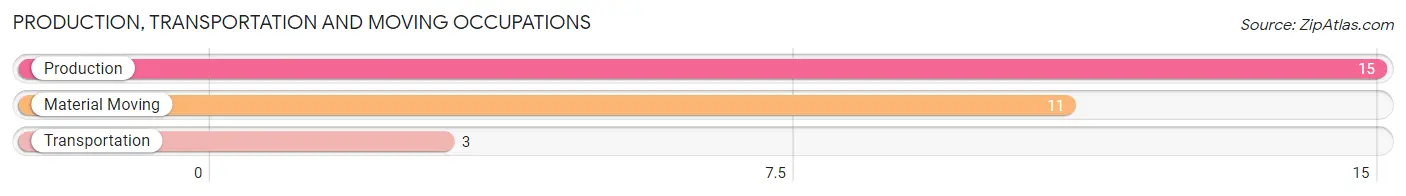
Production, Transportation and Moving Occupations by Sex
| Occupation | Male | Female |
| Production | 8 (53.3%) | 7 (46.7%) |
| Transportation | 3 (100.0%) | 0 (0.0%) |
| Material Moving | 11 (100.0%) | 0 (0.0%) |
| Total (Category) | 22 (75.9%) | 7 (24.1%) |
| Total (Overall) | 492 (51.4%) | 466 (48.6%) |
Employment Industries by Sex in Woodmont borough
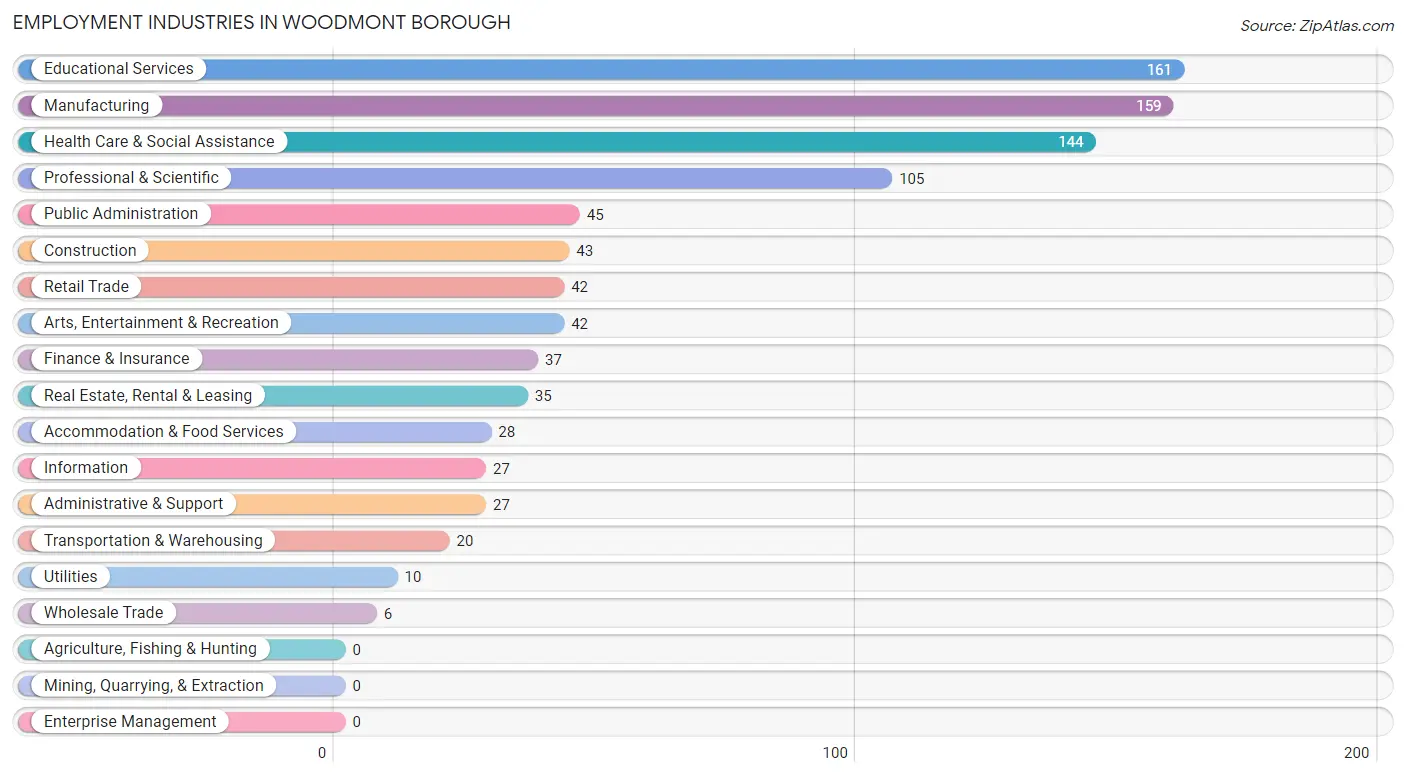
Employment Industries in Woodmont borough
The major employment industries in Woodmont borough include Educational Services (161 | 16.8%), Manufacturing (159 | 16.6%), Health Care & Social Assistance (144 | 15.0%), Professional & Scientific (105 | 11.0%), and Public Administration (45 | 4.7%).
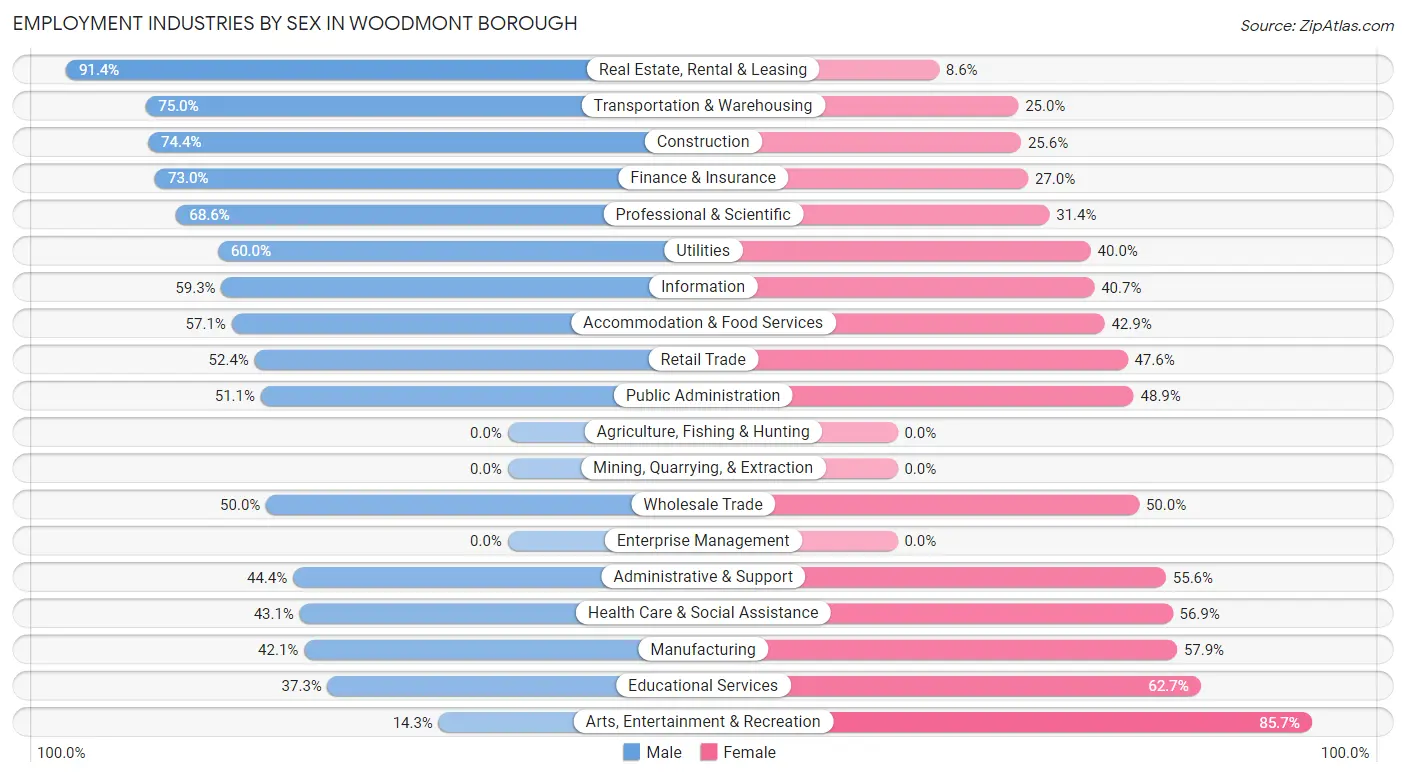
Employment Industries by Sex in Woodmont borough
The Woodmont borough industries that see more men than women are Real Estate, Rental & Leasing (91.4%), Transportation & Warehousing (75.0%), and Construction (74.4%), whereas the industries that tend to have a higher number of women are Arts, Entertainment & Recreation (85.7%), Educational Services (62.7%), and Manufacturing (57.9%).
| Industry | Male | Female |
| Agriculture, Fishing & Hunting | 0 (0.0%) | 0 (0.0%) |
| Mining, Quarrying, & Extraction | 0 (0.0%) | 0 (0.0%) |
| Construction | 32 (74.4%) | 11 (25.6%) |
| Manufacturing | 67 (42.1%) | 92 (57.9%) |
| Wholesale Trade | 3 (50.0%) | 3 (50.0%) |
| Retail Trade | 22 (52.4%) | 20 (47.6%) |
| Transportation & Warehousing | 15 (75.0%) | 5 (25.0%) |
| Utilities | 6 (60.0%) | 4 (40.0%) |
| Information | 16 (59.3%) | 11 (40.7%) |
| Finance & Insurance | 27 (73.0%) | 10 (27.0%) |
| Real Estate, Rental & Leasing | 32 (91.4%) | 3 (8.6%) |
| Professional & Scientific | 72 (68.6%) | 33 (31.4%) |
| Enterprise Management | 0 (0.0%) | 0 (0.0%) |
| Administrative & Support | 12 (44.4%) | 15 (55.6%) |
| Educational Services | 60 (37.3%) | 101 (62.7%) |
| Health Care & Social Assistance | 62 (43.1%) | 82 (56.9%) |
| Arts, Entertainment & Recreation | 6 (14.3%) | 36 (85.7%) |
| Accommodation & Food Services | 16 (57.1%) | 12 (42.9%) |
| Public Administration | 23 (51.1%) | 22 (48.9%) |
| Total | 492 (51.4%) | 466 (48.6%) |
Education in Woodmont borough
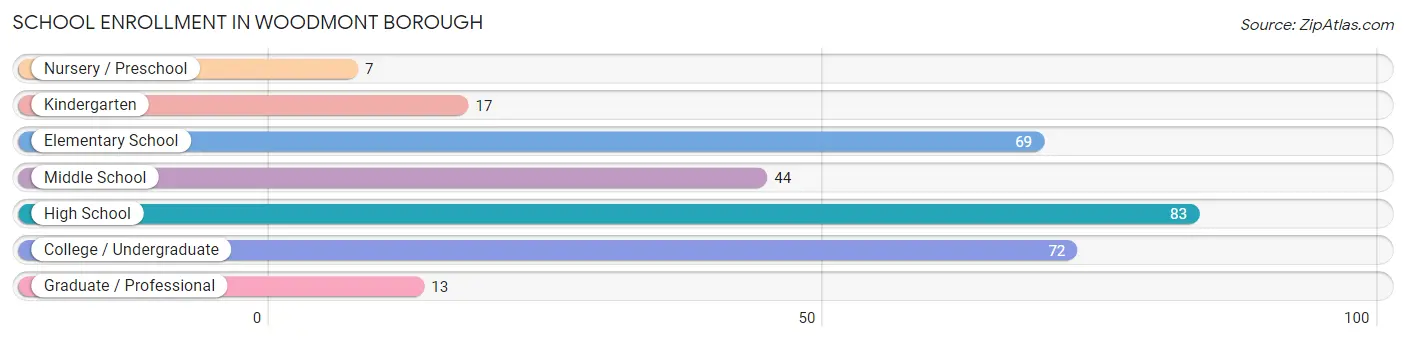
School Enrollment in Woodmont borough
The most common levels of schooling among the 305 students in Woodmont borough are high school (83 | 27.2%), college / undergraduate (72 | 23.6%), and elementary school (69 | 22.6%).
| School Level | # Students | % Students |
| Nursery / Preschool | 7 | 2.3% |
| Kindergarten | 17 | 5.6% |
| Elementary School | 69 | 22.6% |
| Middle School | 44 | 14.4% |
| High School | 83 | 27.2% |
| College / Undergraduate | 72 | 23.6% |
| Graduate / Professional | 13 | 4.3% |
| Total | 305 | 100.0% |
School Enrollment by Age by Funding Source in Woodmont borough
Out of a total of 305 students who are enrolled in schools in Woodmont borough, 63 (20.7%) attend a private institution, while the remaining 242 (79.3%) are enrolled in public schools. The age group of 18 to 19 year olds has the highest likelihood of being enrolled in private schools, with 24 (100.0% in the age bracket) enrolled. Conversely, the age group of 10 to 14 year olds has the lowest likelihood of being enrolled in a private school, with 63 (95.5% in the age bracket) attending a public institution.
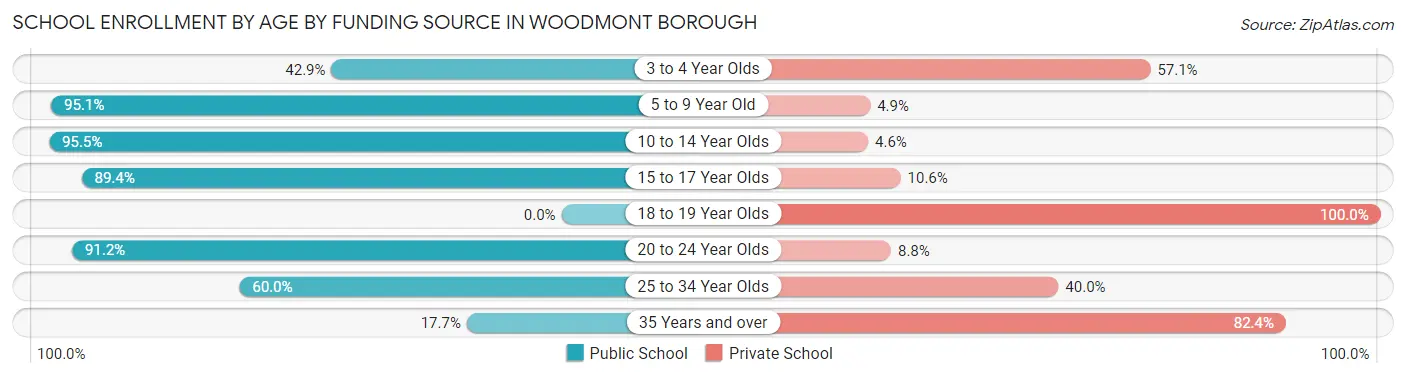
| Age Bracket | Public School | Private School |
| 3 to 4 Year Olds | 3 (42.9%) | 4 (57.1%) |
| 5 to 9 Year Old | 77 (95.1%) | 4 (4.9%) |
| 10 to 14 Year Olds | 63 (95.5%) | 3 (4.5%) |
| 15 to 17 Year Olds | 59 (89.4%) | 7 (10.6%) |
| 18 to 19 Year Olds | 0 (0.0%) | 24 (100.0%) |
| 20 to 24 Year Olds | 31 (91.2%) | 3 (8.8%) |
| 25 to 34 Year Olds | 6 (60.0%) | 4 (40.0%) |
| 35 Years and over | 3 (17.6%) | 14 (82.4%) |
| Total | 242 (79.3%) | 63 (20.7%) |
Educational Attainment by Field of Study in Woodmont borough
Business (207 | 24.2%), social sciences (90 | 10.5%), psychology (82 | 9.6%), education (73 | 8.5%), and literature & languages (69 | 8.1%) are the most common fields of study among 855 individuals in Woodmont borough who have obtained a bachelor's degree or higher.
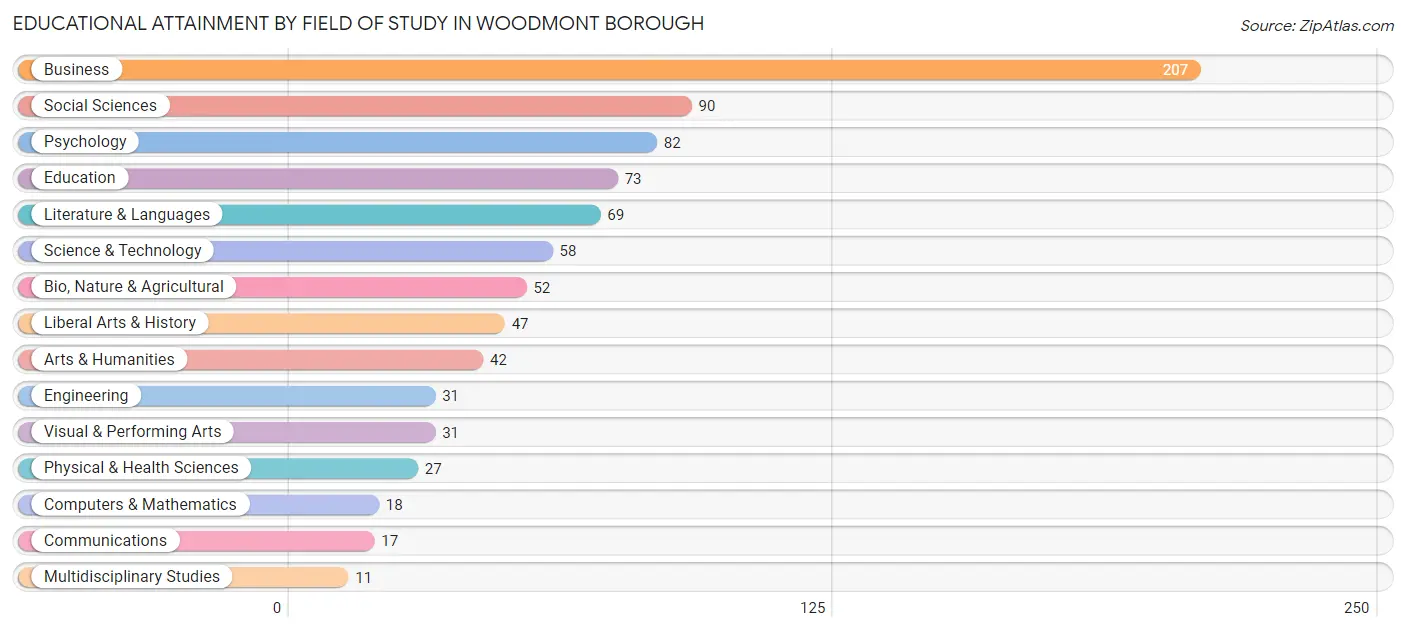
| Field of Study | # Graduates | % Graduates |
| Computers & Mathematics | 18 | 2.1% |
| Bio, Nature & Agricultural | 52 | 6.1% |
| Physical & Health Sciences | 27 | 3.2% |
| Psychology | 82 | 9.6% |
| Social Sciences | 90 | 10.5% |
| Engineering | 31 | 3.6% |
| Multidisciplinary Studies | 11 | 1.3% |
| Science & Technology | 58 | 6.8% |
| Business | 207 | 24.2% |
| Education | 73 | 8.5% |
| Literature & Languages | 69 | 8.1% |
| Liberal Arts & History | 47 | 5.5% |
| Visual & Performing Arts | 31 | 3.6% |
| Communications | 17 | 2.0% |
| Arts & Humanities | 42 | 4.9% |
| Total | 855 | 100.0% |
Transportation & Commute in Woodmont borough
Vehicle Availability by Sex in Woodmont borough
The most prevalent vehicle ownership categories in Woodmont borough are males with 2 vehicles (234, accounting for 47.9%) and females with 2 vehicles (188, making up 52.3%).
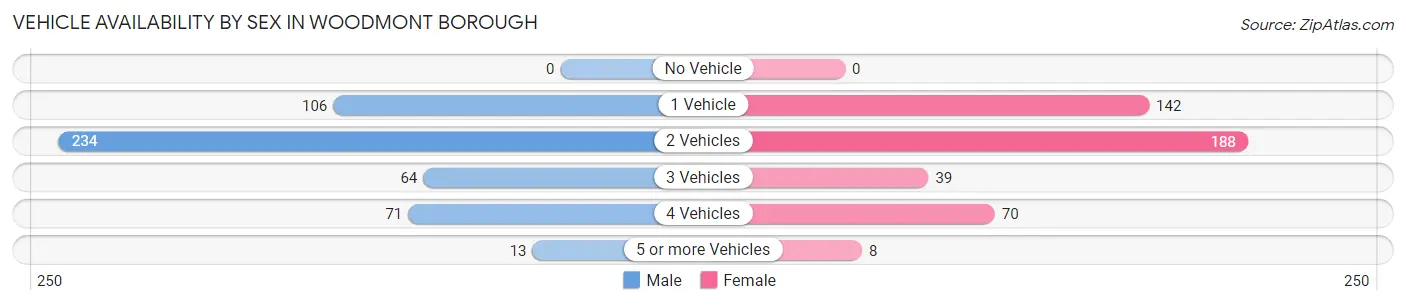
| Vehicles Available | Male | Female |
| No Vehicle | 0 (0.0%) | 0 (0.0%) |
| 1 Vehicle | 106 (21.7%) | 142 (31.8%) |
| 2 Vehicles | 234 (47.9%) | 188 (42.1%) |
| 3 Vehicles | 64 (13.1%) | 39 (8.7%) |
| 4 Vehicles | 71 (14.5%) | 70 (15.7%) |
| 5 or more Vehicles | 13 (2.7%) | 8 (1.8%) |
| Total | 488 (100.0%) | 447 (100.0%) |
Commute Time in Woodmont borough
The most frequently occuring commute durations in Woodmont borough are 20 to 24 minutes (192 commuters, 22.5%), 10 to 14 minutes (112 commuters, 13.2%), and 60 to 89 minutes (100 commuters, 11.7%).
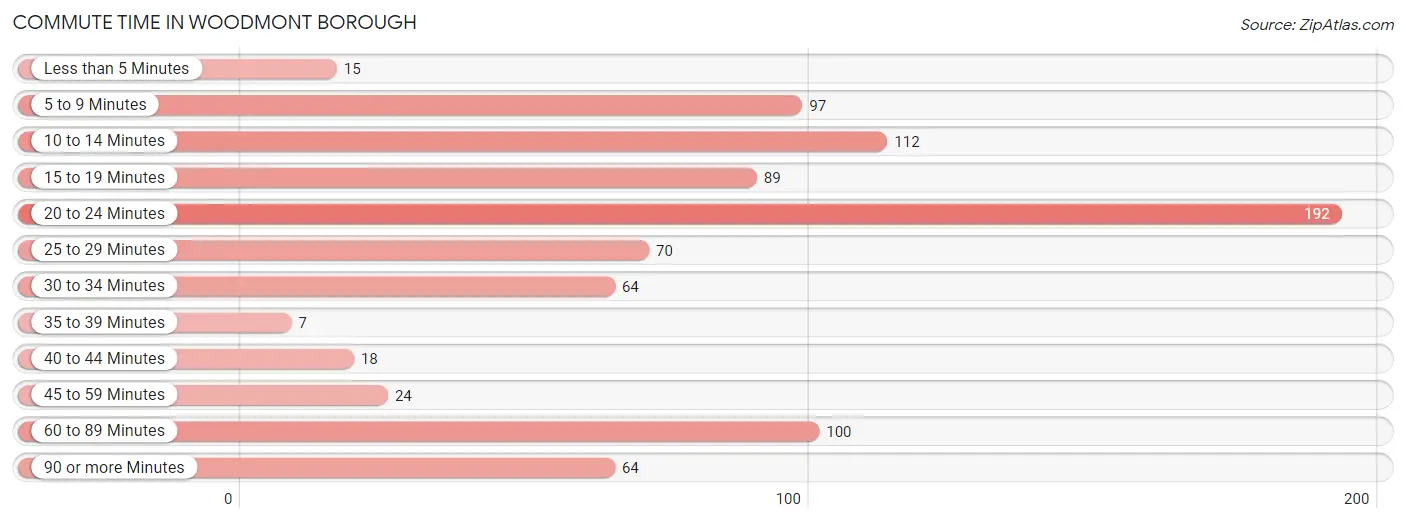
| Commute Time | # Commuters | % Commuters |
| Less than 5 Minutes | 15 | 1.8% |
| 5 to 9 Minutes | 97 | 11.4% |
| 10 to 14 Minutes | 112 | 13.2% |
| 15 to 19 Minutes | 89 | 10.4% |
| 20 to 24 Minutes | 192 | 22.5% |
| 25 to 29 Minutes | 70 | 8.2% |
| 30 to 34 Minutes | 64 | 7.5% |
| 35 to 39 Minutes | 7 | 0.8% |
| 40 to 44 Minutes | 18 | 2.1% |
| 45 to 59 Minutes | 24 | 2.8% |
| 60 to 89 Minutes | 100 | 11.7% |
| 90 or more Minutes | 64 | 7.5% |
Commute Time by Sex in Woodmont borough
The most common commute times in Woodmont borough are 60 to 89 minutes (67 commuters, 15.7%) for males and 20 to 24 minutes (142 commuters, 33.5%) for females.
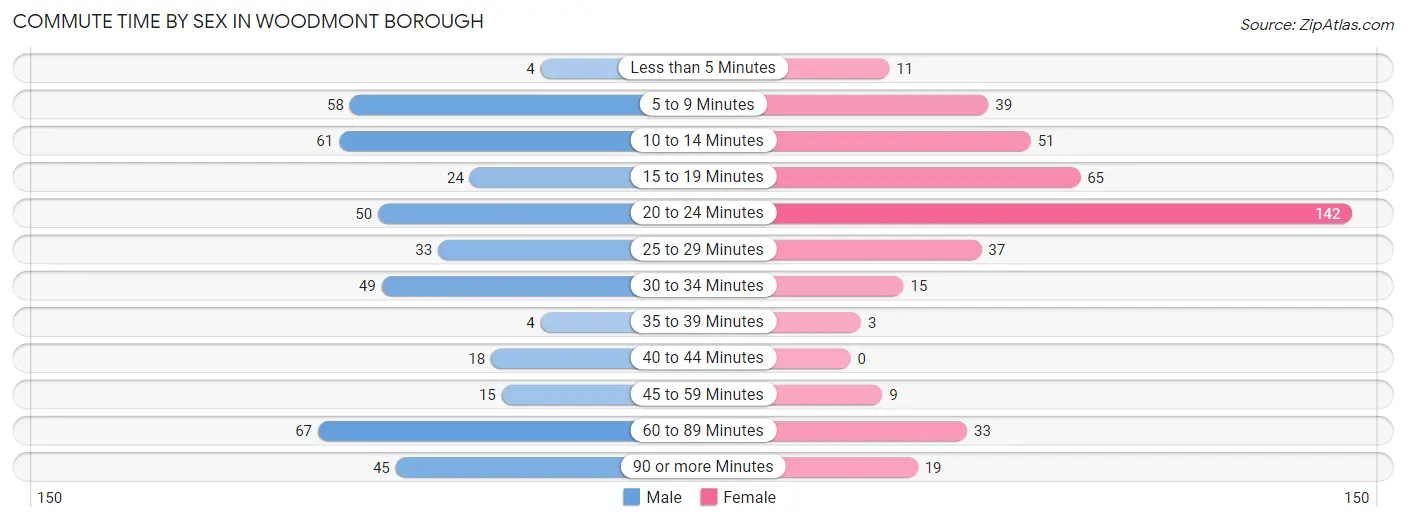
| Commute Time | Male | Female |
| Less than 5 Minutes | 4 (0.9%) | 11 (2.6%) |
| 5 to 9 Minutes | 58 (13.6%) | 39 (9.2%) |
| 10 to 14 Minutes | 61 (14.2%) | 51 (12.0%) |
| 15 to 19 Minutes | 24 (5.6%) | 65 (15.3%) |
| 20 to 24 Minutes | 50 (11.7%) | 142 (33.5%) |
| 25 to 29 Minutes | 33 (7.7%) | 37 (8.7%) |
| 30 to 34 Minutes | 49 (11.5%) | 15 (3.5%) |
| 35 to 39 Minutes | 4 (0.9%) | 3 (0.7%) |
| 40 to 44 Minutes | 18 (4.2%) | 0 (0.0%) |
| 45 to 59 Minutes | 15 (3.5%) | 9 (2.1%) |
| 60 to 89 Minutes | 67 (15.7%) | 33 (7.8%) |
| 90 or more Minutes | 45 (10.5%) | 19 (4.5%) |
Time of Departure to Work by Sex in Woodmont borough
The most frequent times of departure to work in Woodmont borough are 6:00 AM to 6:29 AM (83, 19.4%) for males and 8:30 AM to 8:59 AM (113, 26.7%) for females.
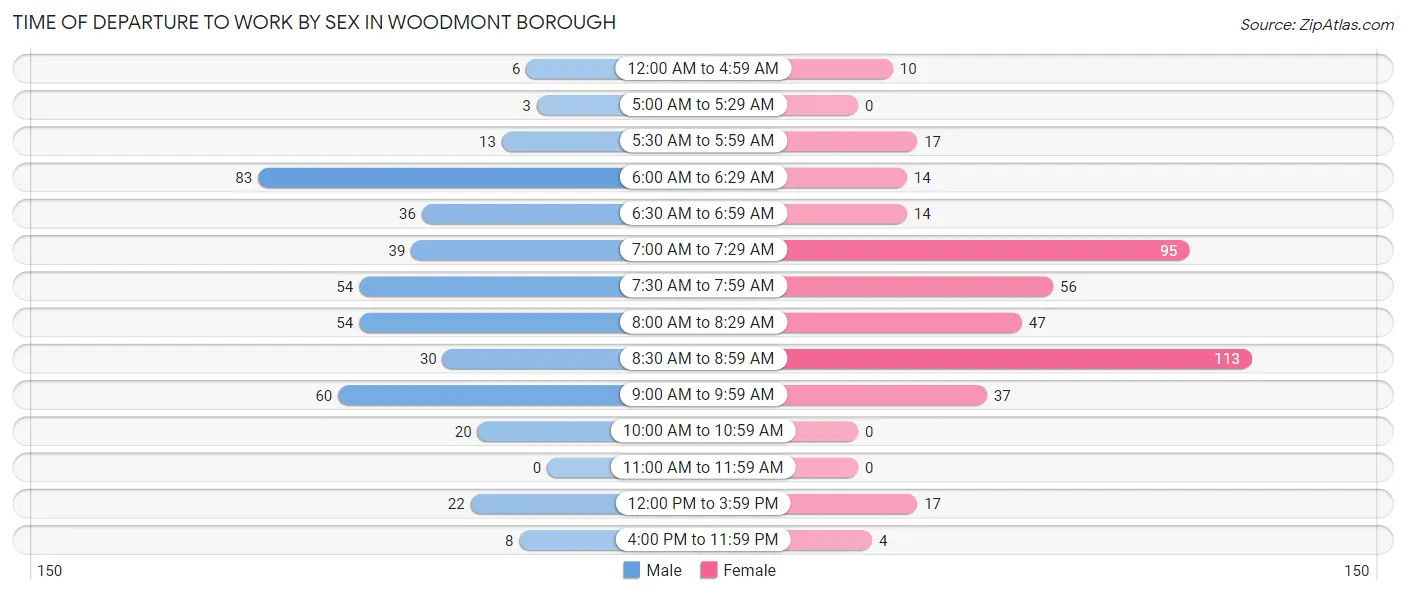
| Time of Departure | Male | Female |
| 12:00 AM to 4:59 AM | 6 (1.4%) | 10 (2.4%) |
| 5:00 AM to 5:29 AM | 3 (0.7%) | 0 (0.0%) |
| 5:30 AM to 5:59 AM | 13 (3.0%) | 17 (4.0%) |
| 6:00 AM to 6:29 AM | 83 (19.4%) | 14 (3.3%) |
| 6:30 AM to 6:59 AM | 36 (8.4%) | 14 (3.3%) |
| 7:00 AM to 7:29 AM | 39 (9.1%) | 95 (22.4%) |
| 7:30 AM to 7:59 AM | 54 (12.6%) | 56 (13.2%) |
| 8:00 AM to 8:29 AM | 54 (12.6%) | 47 (11.1%) |
| 8:30 AM to 8:59 AM | 30 (7.0%) | 113 (26.7%) |
| 9:00 AM to 9:59 AM | 60 (14.0%) | 37 (8.7%) |
| 10:00 AM to 10:59 AM | 20 (4.7%) | 0 (0.0%) |
| 11:00 AM to 11:59 AM | 0 (0.0%) | 0 (0.0%) |
| 12:00 PM to 3:59 PM | 22 (5.1%) | 17 (4.0%) |
| 4:00 PM to 11:59 PM | 8 (1.9%) | 4 (0.9%) |
| Total | 428 (100.0%) | 424 (100.0%) |
Housing Occupancy in Woodmont borough
Occupancy by Ownership in Woodmont borough
Of the total 799 dwellings in Woodmont borough, owner-occupied units account for 649 (81.2%), while renter-occupied units make up 150 (18.8%).
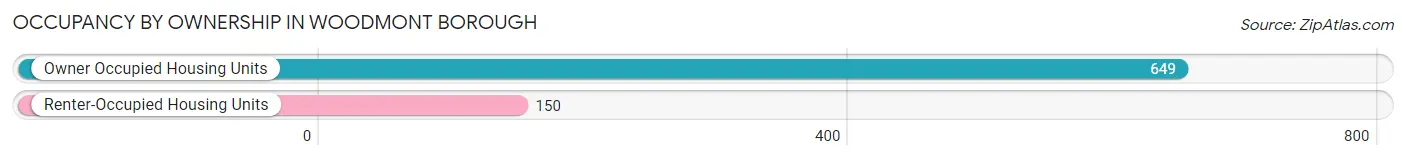
| Occupancy | # Housing Units | % Housing Units |
| Owner Occupied Housing Units | 649 | 81.2% |
| Renter-Occupied Housing Units | 150 | 18.8% |
| Total Occupied Housing Units | 799 | 100.0% |
Occupancy by Household Size in Woodmont borough
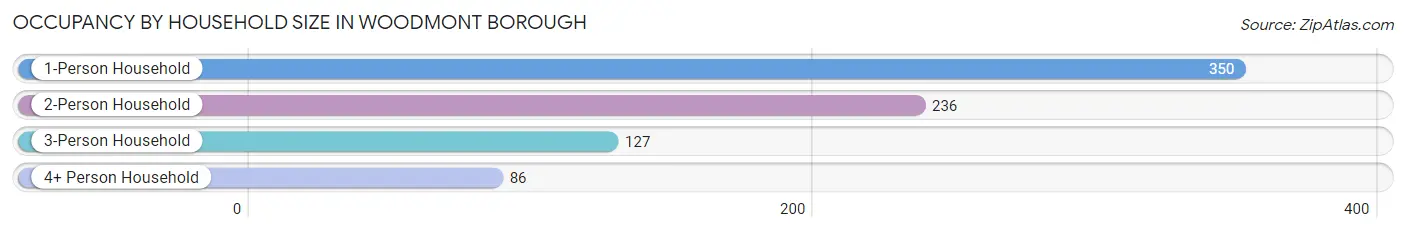
| Household Size | # Housing Units | % Housing Units |
| 1-Person Household | 350 | 43.8% |
| 2-Person Household | 236 | 29.5% |
| 3-Person Household | 127 | 15.9% |
| 4+ Person Household | 86 | 10.8% |
| Total Housing Units | 799 | 100.0% |
Occupancy by Ownership by Household Size in Woodmont borough
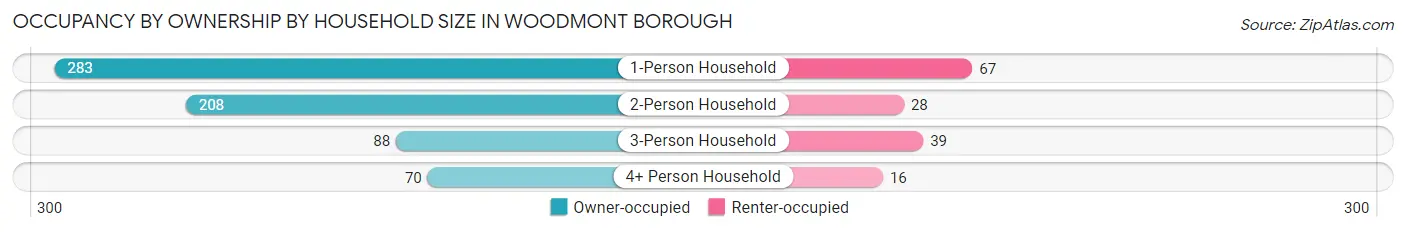
| Household Size | Owner-occupied | Renter-occupied |
| 1-Person Household | 283 (80.9%) | 67 (19.1%) |
| 2-Person Household | 208 (88.1%) | 28 (11.9%) |
| 3-Person Household | 88 (69.3%) | 39 (30.7%) |
| 4+ Person Household | 70 (81.4%) | 16 (18.6%) |
| Total Housing Units | 649 (81.2%) | 150 (18.8%) |
Occupancy by Educational Attainment in Woodmont borough
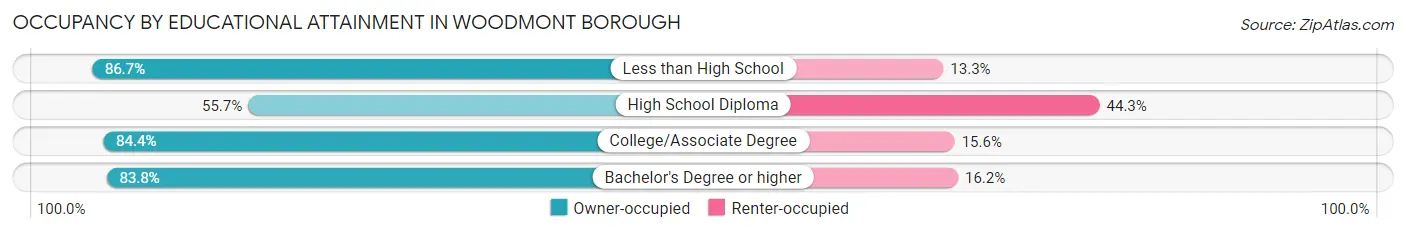
| Household Size | Owner-occupied | Renter-occupied |
| Less than High School | 26 (86.7%) | 4 (13.3%) |
| High School Diploma | 44 (55.7%) | 35 (44.3%) |
| College/Associate Degree | 130 (84.4%) | 24 (15.6%) |
| Bachelor's Degree or higher | 449 (83.8%) | 87 (16.2%) |
Occupancy by Age of Householder in Woodmont borough
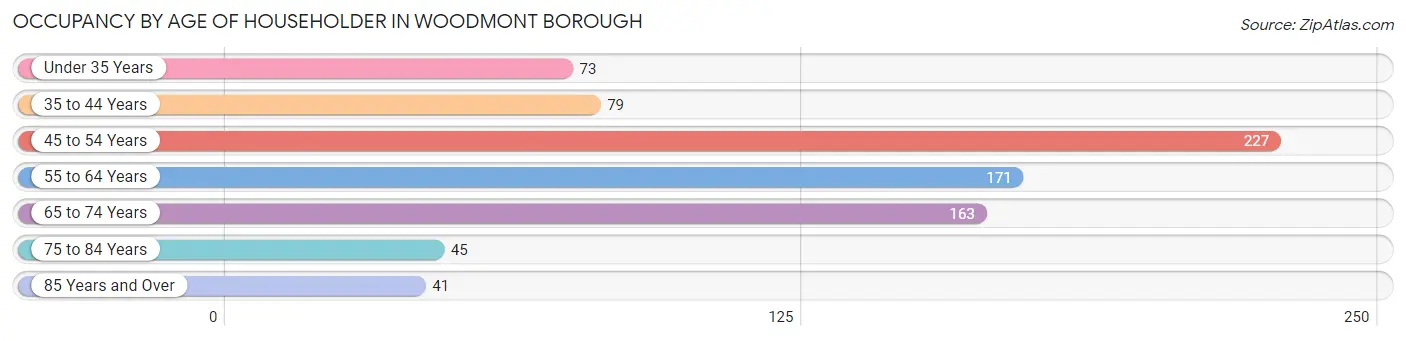
| Age Bracket | # Households | % Households |
| Under 35 Years | 73 | 9.1% |
| 35 to 44 Years | 79 | 9.9% |
| 45 to 54 Years | 227 | 28.4% |
| 55 to 64 Years | 171 | 21.4% |
| 65 to 74 Years | 163 | 20.4% |
| 75 to 84 Years | 45 | 5.6% |
| 85 Years and Over | 41 | 5.1% |
| Total | 799 | 100.0% |
Housing Finances in Woodmont borough
Median Income by Occupancy in Woodmont borough
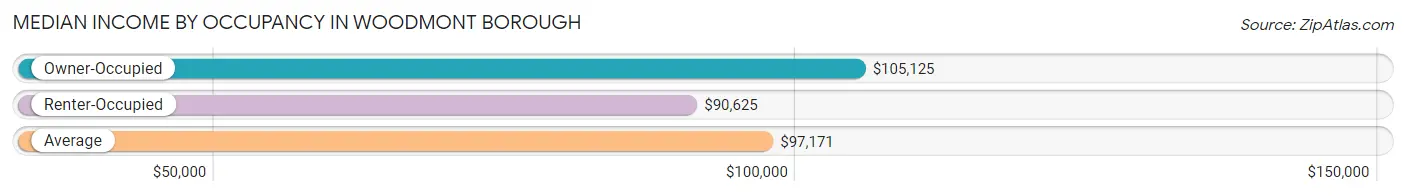
| Occupancy Type | # Households | Median Income |
| Owner-Occupied | 649 (81.2%) | $105,125 |
| Renter-Occupied | 150 (18.8%) | $90,625 |
| Average | 799 (100.0%) | $97,171 |
Occupancy by Householder Income Bracket in Woodmont borough
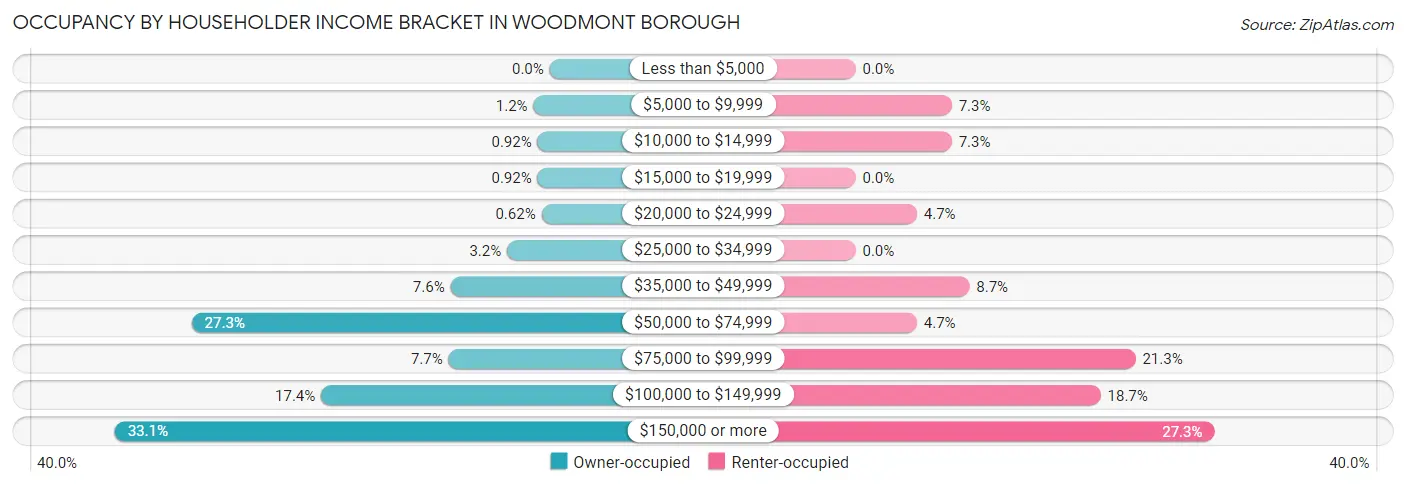
| Income Bracket | Owner-occupied | Renter-occupied |
| Less than $5,000 | 0 (0.0%) | 0 (0.0%) |
| $5,000 to $9,999 | 8 (1.2%) | 11 (7.3%) |
| $10,000 to $14,999 | 6 (0.9%) | 11 (7.3%) |
| $15,000 to $19,999 | 6 (0.9%) | 0 (0.0%) |
| $20,000 to $24,999 | 4 (0.6%) | 7 (4.7%) |
| $25,000 to $34,999 | 21 (3.2%) | 0 (0.0%) |
| $35,000 to $49,999 | 49 (7.5%) | 13 (8.7%) |
| $50,000 to $74,999 | 177 (27.3%) | 7 (4.7%) |
| $75,000 to $99,999 | 50 (7.7%) | 32 (21.3%) |
| $100,000 to $149,999 | 113 (17.4%) | 28 (18.7%) |
| $150,000 or more | 215 (33.1%) | 41 (27.3%) |
| Total | 649 (100.0%) | 150 (100.0%) |
Monthly Housing Cost Tiers in Woodmont borough
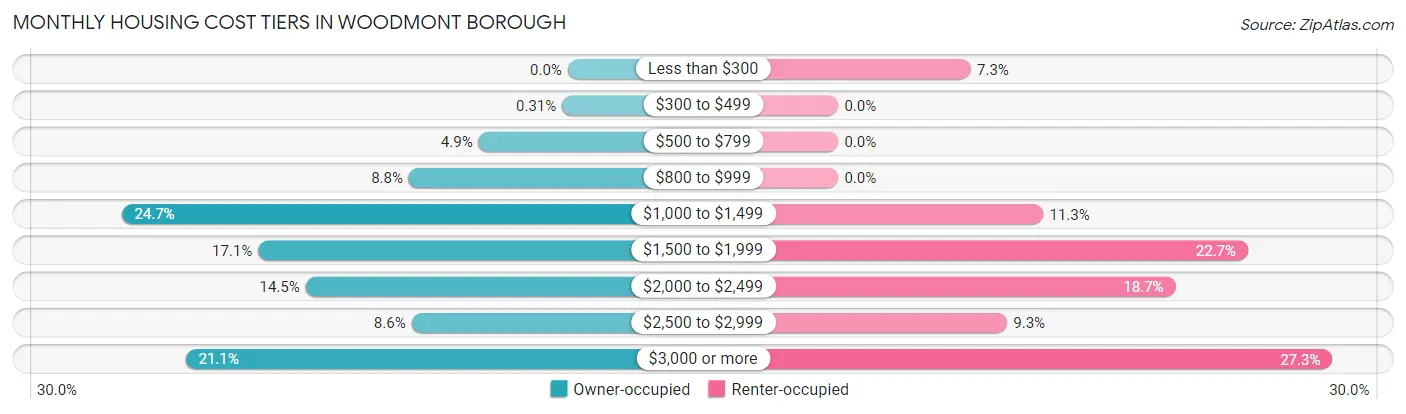
| Monthly Cost | Owner-occupied | Renter-occupied |
| Less than $300 | 0 (0.0%) | 11 (7.3%) |
| $300 to $499 | 2 (0.3%) | 0 (0.0%) |
| $500 to $799 | 32 (4.9%) | 0 (0.0%) |
| $800 to $999 | 57 (8.8%) | 0 (0.0%) |
| $1,000 to $1,499 | 160 (24.6%) | 17 (11.3%) |
| $1,500 to $1,999 | 111 (17.1%) | 34 (22.7%) |
| $2,000 to $2,499 | 94 (14.5%) | 28 (18.7%) |
| $2,500 to $2,999 | 56 (8.6%) | 14 (9.3%) |
| $3,000 or more | 137 (21.1%) | 41 (27.3%) |
| Total | 649 (100.0%) | 150 (100.0%) |
Physical Housing Characteristics in Woodmont borough
Housing Structures in Woodmont borough
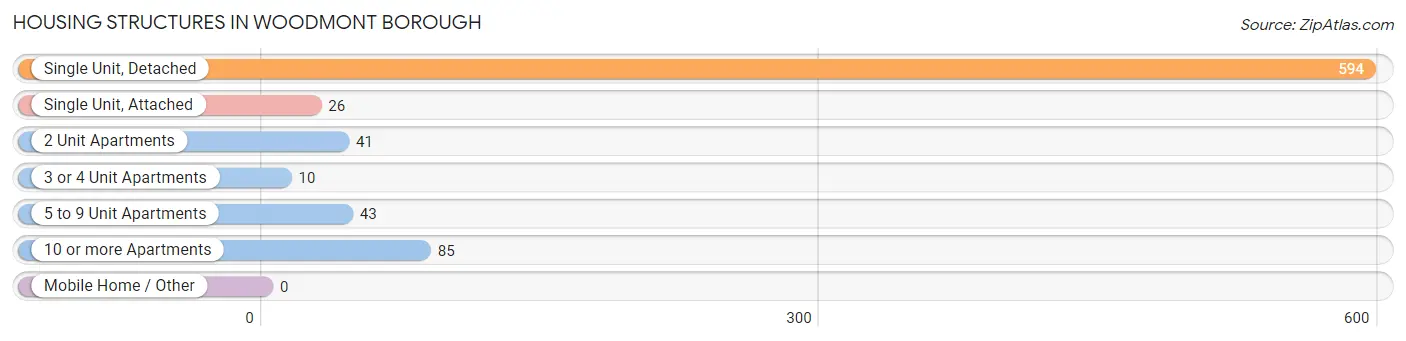
| Structure Type | # Housing Units | % Housing Units |
| Single Unit, Detached | 594 | 74.3% |
| Single Unit, Attached | 26 | 3.3% |
| 2 Unit Apartments | 41 | 5.1% |
| 3 or 4 Unit Apartments | 10 | 1.3% |
| 5 to 9 Unit Apartments | 43 | 5.4% |
| 10 or more Apartments | 85 | 10.6% |
| Mobile Home / Other | 0 | 0.0% |
| Total | 799 | 100.0% |
Housing Structures by Occupancy in Woodmont borough
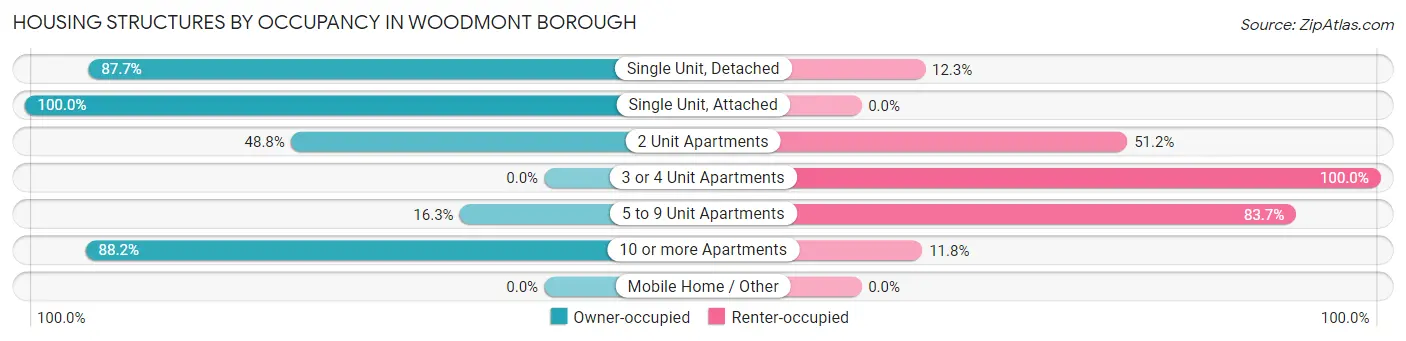
| Structure Type | Owner-occupied | Renter-occupied |
| Single Unit, Detached | 521 (87.7%) | 73 (12.3%) |
| Single Unit, Attached | 26 (100.0%) | 0 (0.0%) |
| 2 Unit Apartments | 20 (48.8%) | 21 (51.2%) |
| 3 or 4 Unit Apartments | 0 (0.0%) | 10 (100.0%) |
| 5 to 9 Unit Apartments | 7 (16.3%) | 36 (83.7%) |
| 10 or more Apartments | 75 (88.2%) | 10 (11.8%) |
| Mobile Home / Other | 0 (0.0%) | 0 (0.0%) |
| Total | 649 (81.2%) | 150 (18.8%) |
Housing Structures by Number of Rooms in Woodmont borough
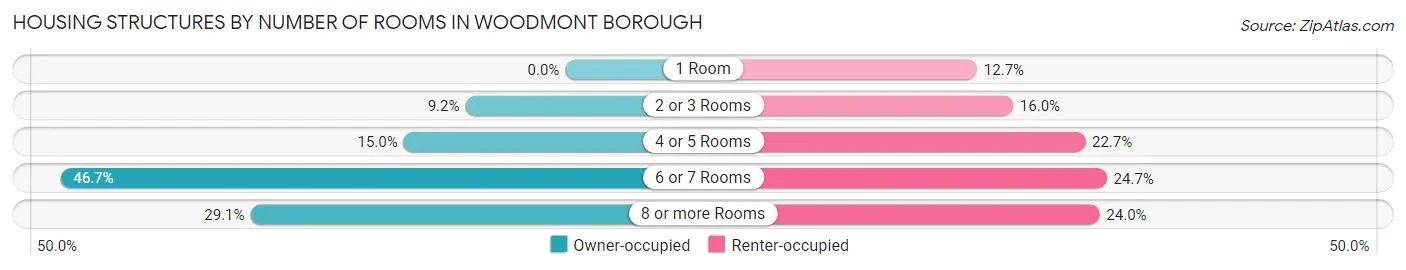
| Number of Rooms | Owner-occupied | Renter-occupied |
| 1 Room | 0 (0.0%) | 19 (12.7%) |
| 2 or 3 Rooms | 60 (9.2%) | 24 (16.0%) |
| 4 or 5 Rooms | 97 (14.9%) | 34 (22.7%) |
| 6 or 7 Rooms | 303 (46.7%) | 37 (24.7%) |
| 8 or more Rooms | 189 (29.1%) | 36 (24.0%) |
| Total | 649 (100.0%) | 150 (100.0%) |
Housing Structure by Heating Type in Woodmont borough
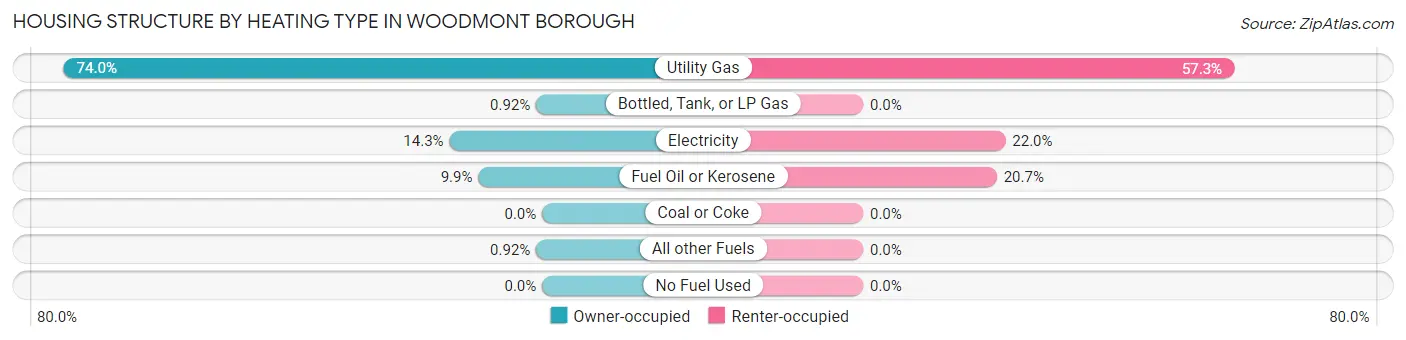
| Heating Type | Owner-occupied | Renter-occupied |
| Utility Gas | 480 (74.0%) | 86 (57.3%) |
| Bottled, Tank, or LP Gas | 6 (0.9%) | 0 (0.0%) |
| Electricity | 93 (14.3%) | 33 (22.0%) |
| Fuel Oil or Kerosene | 64 (9.9%) | 31 (20.7%) |
| Coal or Coke | 0 (0.0%) | 0 (0.0%) |
| All other Fuels | 6 (0.9%) | 0 (0.0%) |
| No Fuel Used | 0 (0.0%) | 0 (0.0%) |
| Total | 649 (100.0%) | 150 (100.0%) |
Household Vehicle Usage in Woodmont borough
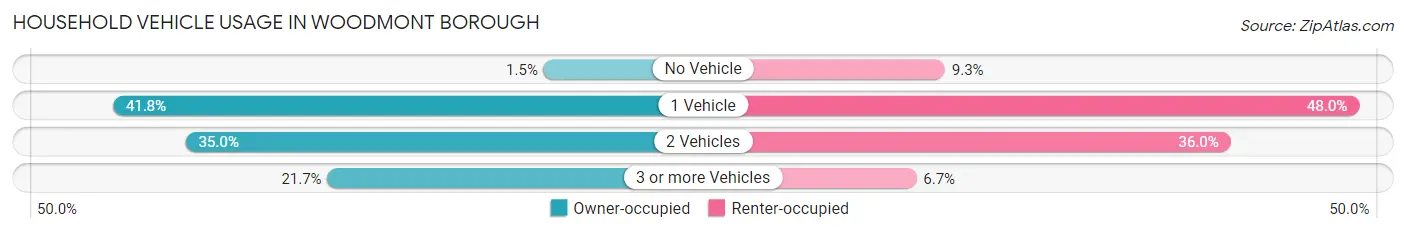
| Vehicles per Household | Owner-occupied | Renter-occupied |
| No Vehicle | 10 (1.5%) | 14 (9.3%) |
| 1 Vehicle | 271 (41.8%) | 72 (48.0%) |
| 2 Vehicles | 227 (35.0%) | 54 (36.0%) |
| 3 or more Vehicles | 141 (21.7%) | 10 (6.7%) |
| Total | 649 (100.0%) | 150 (100.0%) |
Real Estate & Mortgages in Woodmont borough
Real Estate and Mortgage Overview in Woodmont borough
| Characteristic | Without Mortgage | With Mortgage |
| Housing Units | 278 | 371 |
| Median Property Value | $387,700 | $446,000 |
| Median Household Income | $59,857 | $147 |
| Monthly Housing Costs | $1,307 | $134 |
| Real Estate Taxes | $6,808 | $4 |
Property Value by Mortgage Status in Woodmont borough
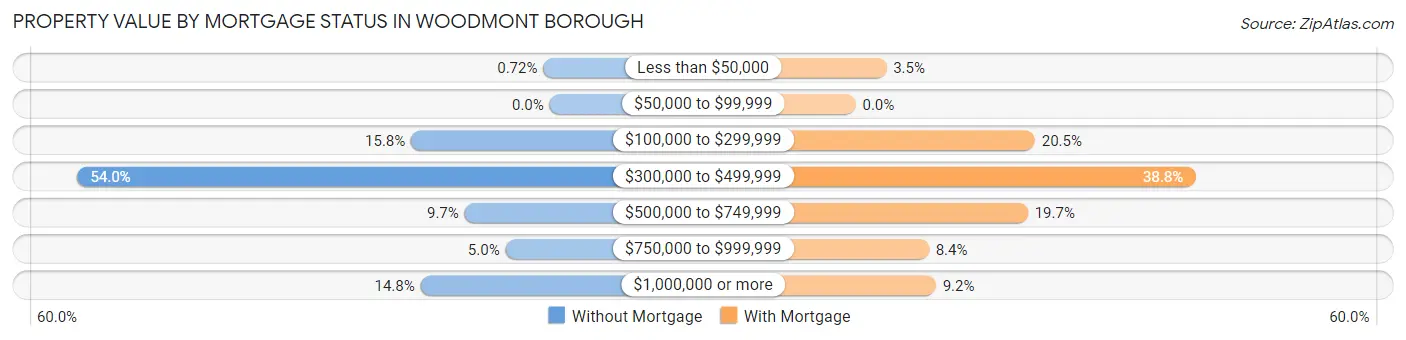
| Property Value | Without Mortgage | With Mortgage |
| Less than $50,000 | 2 (0.7%) | 13 (3.5%) |
| $50,000 to $99,999 | 0 (0.0%) | 0 (0.0%) |
| $100,000 to $299,999 | 44 (15.8%) | 76 (20.5%) |
| $300,000 to $499,999 | 150 (54.0%) | 144 (38.8%) |
| $500,000 to $749,999 | 27 (9.7%) | 73 (19.7%) |
| $750,000 to $999,999 | 14 (5.0%) | 31 (8.4%) |
| $1,000,000 or more | 41 (14.7%) | 34 (9.2%) |
| Total | 278 (100.0%) | 371 (100.0%) |
Household Income by Mortgage Status in Woodmont borough
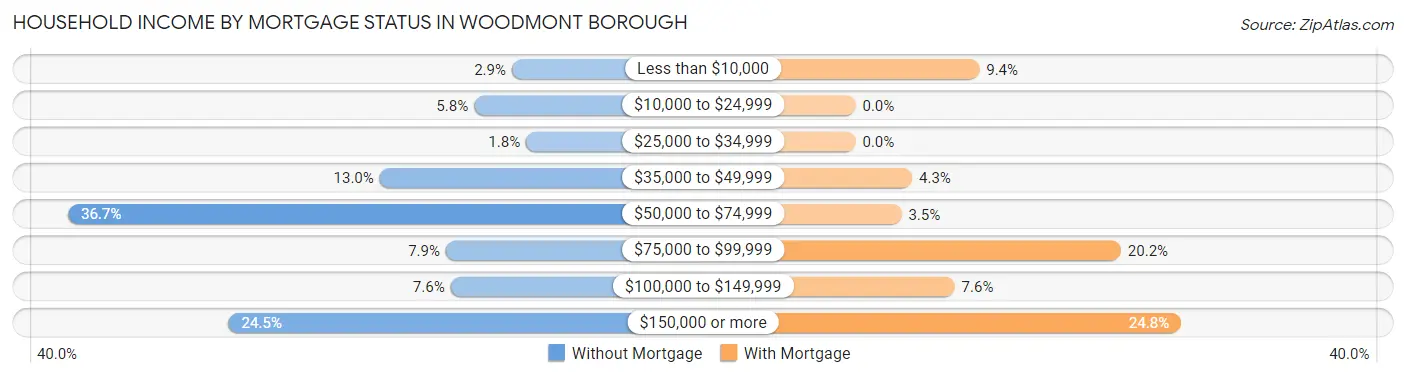
| Household Income | Without Mortgage | With Mortgage |
| Less than $10,000 | 8 (2.9%) | 35 (9.4%) |
| $10,000 to $24,999 | 16 (5.8%) | 0 (0.0%) |
| $25,000 to $34,999 | 5 (1.8%) | 0 (0.0%) |
| $35,000 to $49,999 | 36 (13.0%) | 16 (4.3%) |
| $50,000 to $74,999 | 102 (36.7%) | 13 (3.5%) |
| $75,000 to $99,999 | 22 (7.9%) | 75 (20.2%) |
| $100,000 to $149,999 | 21 (7.5%) | 28 (7.5%) |
| $150,000 or more | 68 (24.5%) | 92 (24.8%) |
| Total | 278 (100.0%) | 371 (100.0%) |
Property Value to Household Income Ratio in Woodmont borough
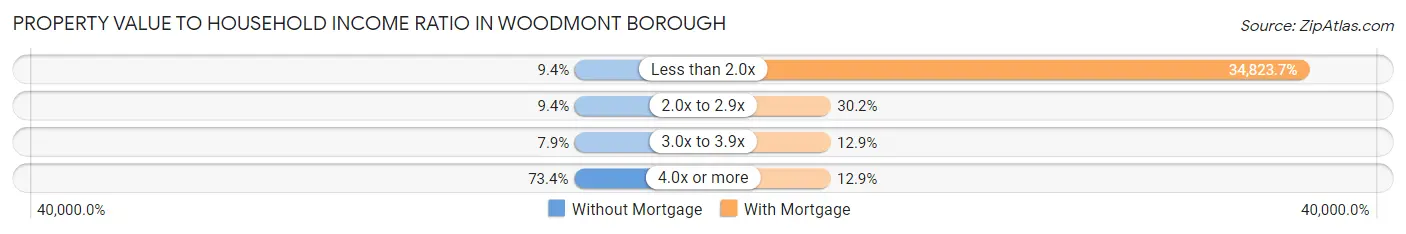
| Value-to-Income Ratio | Without Mortgage | With Mortgage |
| Less than 2.0x | 26 (9.3%) | 129,196 (34,823.7%) |
| 2.0x to 2.9x | 26 (9.3%) | 112 (30.2%) |
| 3.0x to 3.9x | 22 (7.9%) | 48 (12.9%) |
| 4.0x or more | 204 (73.4%) | 48 (12.9%) |
| Total | 278 (100.0%) | 371 (100.0%) |
Real Estate Taxes by Mortgage Status in Woodmont borough
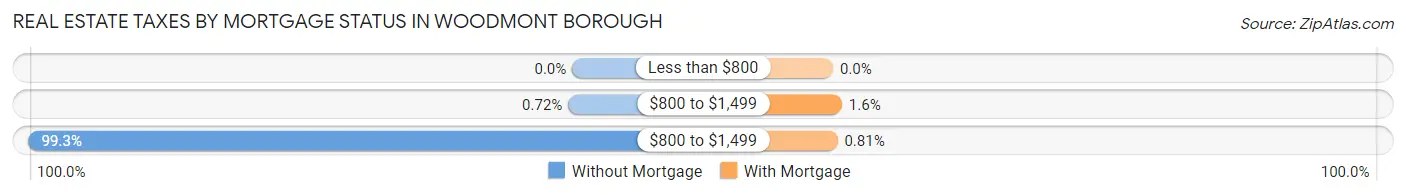
| Property Taxes | Without Mortgage | With Mortgage |
| Less than $800 | 0 (0.0%) | 0 (0.0%) |
| $800 to $1,499 | 2 (0.7%) | 6 (1.6%) |
| $800 to $1,499 | 276 (99.3%) | 3 (0.8%) |
| Total | 278 (100.0%) | 371 (100.0%) |
Health & Disability in Woodmont borough
Health Insurance Coverage by Age in Woodmont borough
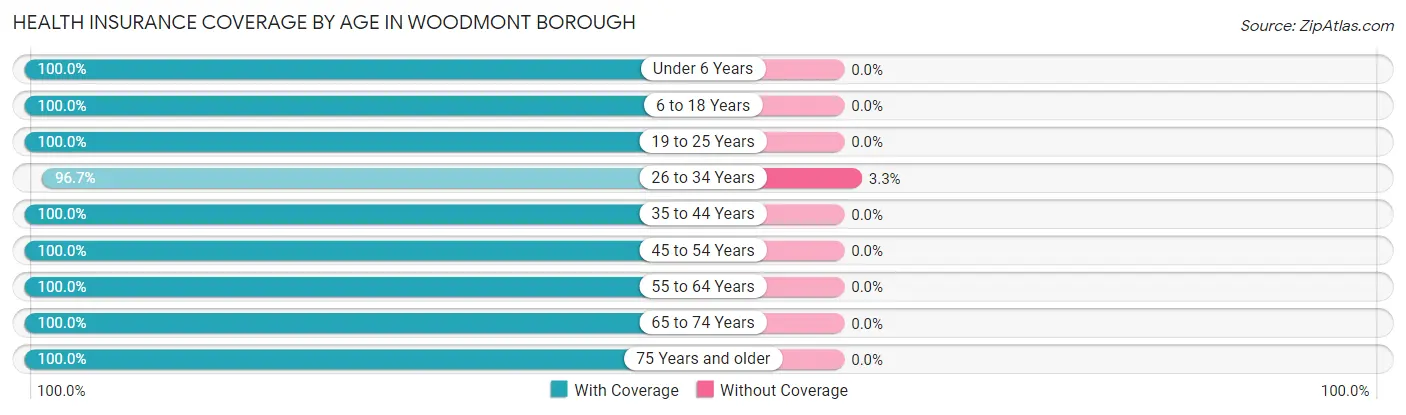
| Age Bracket | With Coverage | Without Coverage |
| Under 6 Years | 31 (100.0%) | 0 (0.0%) |
| 6 to 18 Years | 204 (100.0%) | 0 (0.0%) |
| 19 to 25 Years | 159 (100.0%) | 0 (0.0%) |
| 26 to 34 Years | 118 (96.7%) | 4 (3.3%) |
| 35 to 44 Years | 138 (100.0%) | 0 (0.0%) |
| 45 to 54 Years | 333 (100.0%) | 0 (0.0%) |
| 55 to 64 Years | 272 (100.0%) | 0 (0.0%) |
| 65 to 74 Years | 230 (100.0%) | 0 (0.0%) |
| 75 Years and older | 130 (100.0%) | 0 (0.0%) |
| Total | 1,615 (99.8%) | 4 (0.3%) |
Health Insurance Coverage by Citizenship Status in Woodmont borough
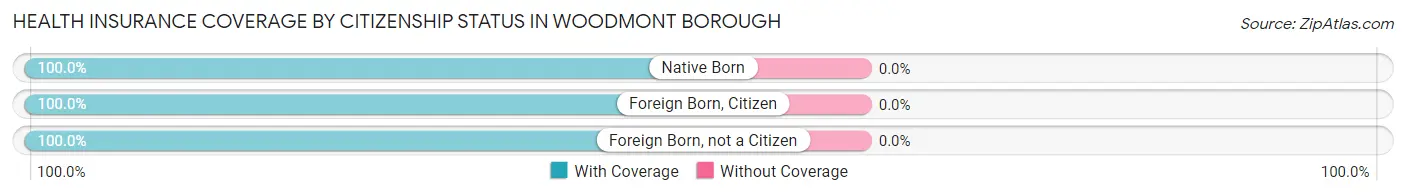
| Citizenship Status | With Coverage | Without Coverage |
| Native Born | 31 (100.0%) | 0 (0.0%) |
| Foreign Born, Citizen | 204 (100.0%) | 0 (0.0%) |
| Foreign Born, not a Citizen | 159 (100.0%) | 0 (0.0%) |
Health Insurance Coverage by Household Income in Woodmont borough
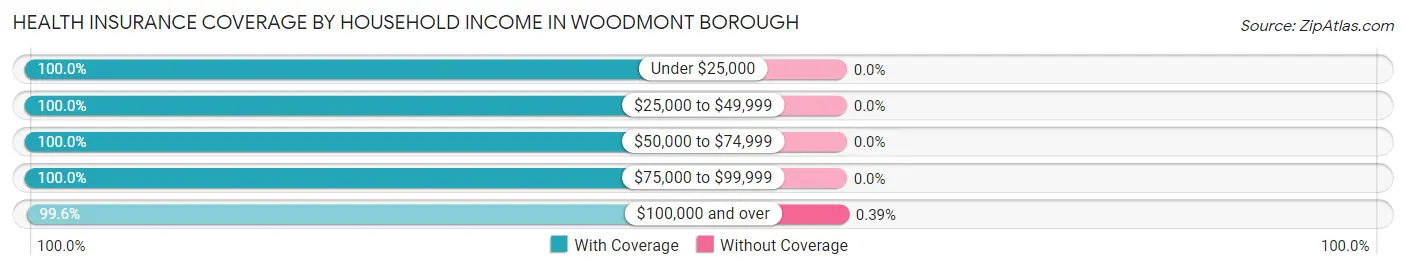
| Household Income | With Coverage | Without Coverage |
| Under $25,000 | 56 (100.0%) | 0 (0.0%) |
| $25,000 to $49,999 | 152 (100.0%) | 0 (0.0%) |
| $50,000 to $74,999 | 228 (100.0%) | 0 (0.0%) |
| $75,000 to $99,999 | 169 (100.0%) | 0 (0.0%) |
| $100,000 and over | 1,010 (99.6%) | 4 (0.4%) |
Public vs Private Health Insurance Coverage by Age in Woodmont borough
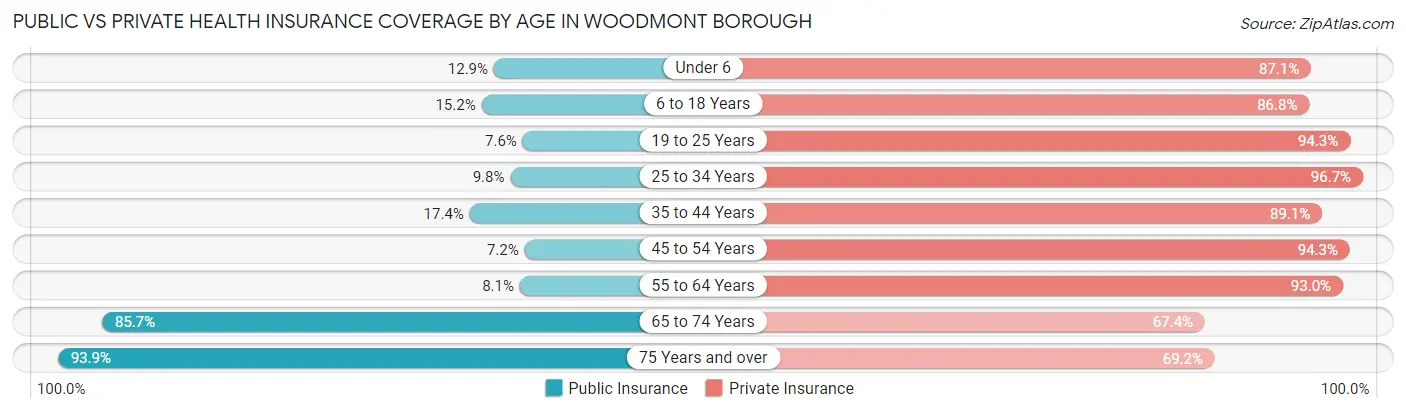
| Age Bracket | Public Insurance | Private Insurance |
| Under 6 | 4 (12.9%) | 27 (87.1%) |
| 6 to 18 Years | 31 (15.2%) | 177 (86.8%) |
| 19 to 25 Years | 12 (7.5%) | 150 (94.3%) |
| 25 to 34 Years | 12 (9.8%) | 118 (96.7%) |
| 35 to 44 Years | 24 (17.4%) | 123 (89.1%) |
| 45 to 54 Years | 24 (7.2%) | 314 (94.3%) |
| 55 to 64 Years | 22 (8.1%) | 253 (93.0%) |
| 65 to 74 Years | 197 (85.7%) | 155 (67.4%) |
| 75 Years and over | 122 (93.9%) | 90 (69.2%) |
| Total | 448 (27.7%) | 1,407 (86.9%) |
Disability Status by Sex by Age in Woodmont borough
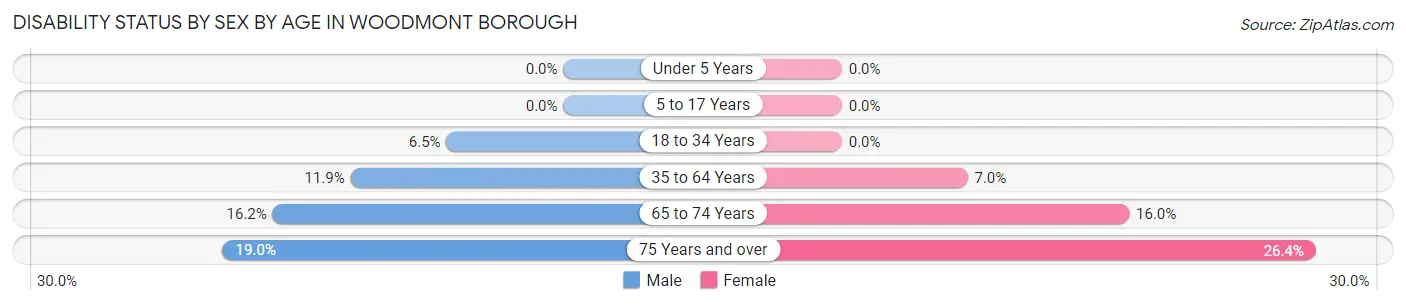
| Age Bracket | Male | Female |
| Under 5 Years | 0 (0.0%) | 0 (0.0%) |
| 5 to 17 Years | 0 (0.0%) | 0 (0.0%) |
| 18 to 34 Years | 11 (6.5%) | 0 (0.0%) |
| 35 to 64 Years | 39 (11.8%) | 29 (7.0%) |
| 65 to 74 Years | 17 (16.2%) | 20 (16.0%) |
| 75 Years and over | 11 (19.0%) | 19 (26.4%) |
Disability Class by Sex by Age in Woodmont borough
Disability Class: Hearing Difficulty
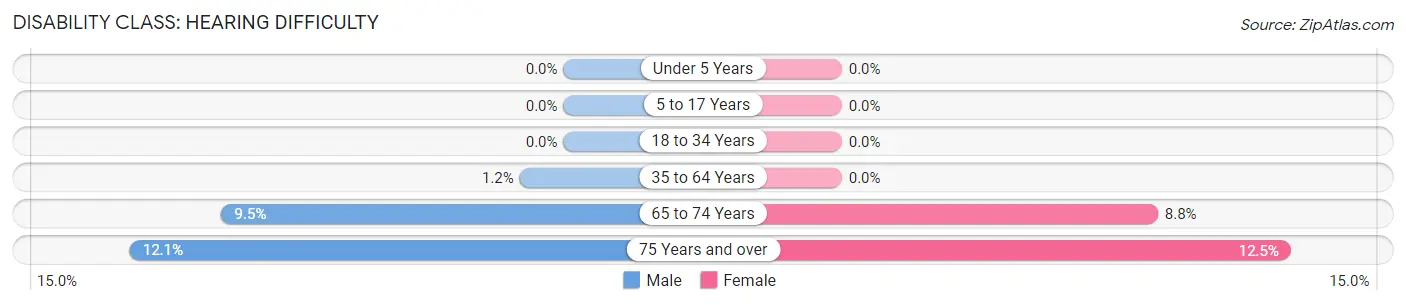
| Age Bracket | Male | Female |
| Under 5 Years | 0 (0.0%) | 0 (0.0%) |
| 5 to 17 Years | 0 (0.0%) | 0 (0.0%) |
| 18 to 34 Years | 0 (0.0%) | 0 (0.0%) |
| 35 to 64 Years | 4 (1.2%) | 0 (0.0%) |
| 65 to 74 Years | 10 (9.5%) | 11 (8.8%) |
| 75 Years and over | 7 (12.1%) | 9 (12.5%) |
Disability Class: Vision Difficulty
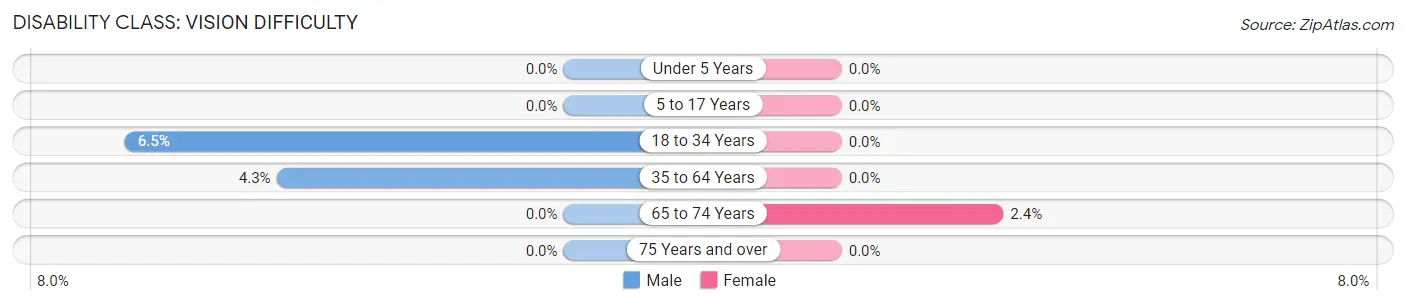
| Age Bracket | Male | Female |
| Under 5 Years | 0 (0.0%) | 0 (0.0%) |
| 5 to 17 Years | 0 (0.0%) | 0 (0.0%) |
| 18 to 34 Years | 11 (6.5%) | 0 (0.0%) |
| 35 to 64 Years | 14 (4.3%) | 0 (0.0%) |
| 65 to 74 Years | 0 (0.0%) | 3 (2.4%) |
| 75 Years and over | 0 (0.0%) | 0 (0.0%) |
Disability Class: Cognitive Difficulty
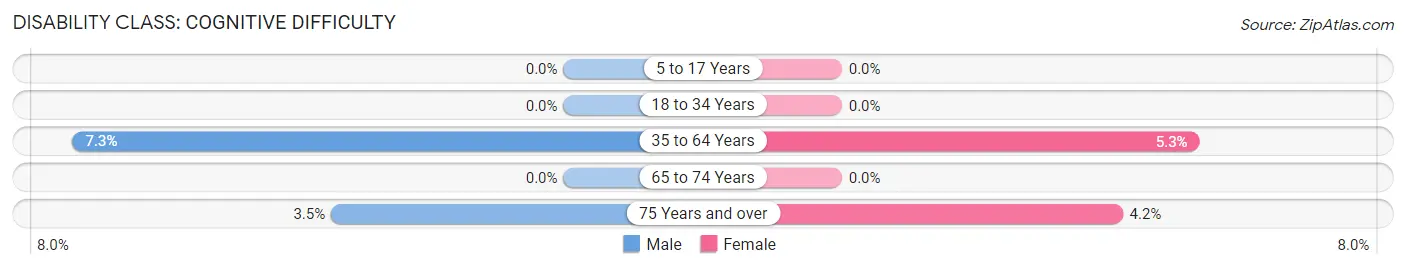
| Age Bracket | Male | Female |
| 5 to 17 Years | 0 (0.0%) | 0 (0.0%) |
| 18 to 34 Years | 0 (0.0%) | 0 (0.0%) |
| 35 to 64 Years | 24 (7.3%) | 22 (5.3%) |
| 65 to 74 Years | 0 (0.0%) | 0 (0.0%) |
| 75 Years and over | 2 (3.5%) | 3 (4.2%) |
Disability Class: Ambulatory Difficulty
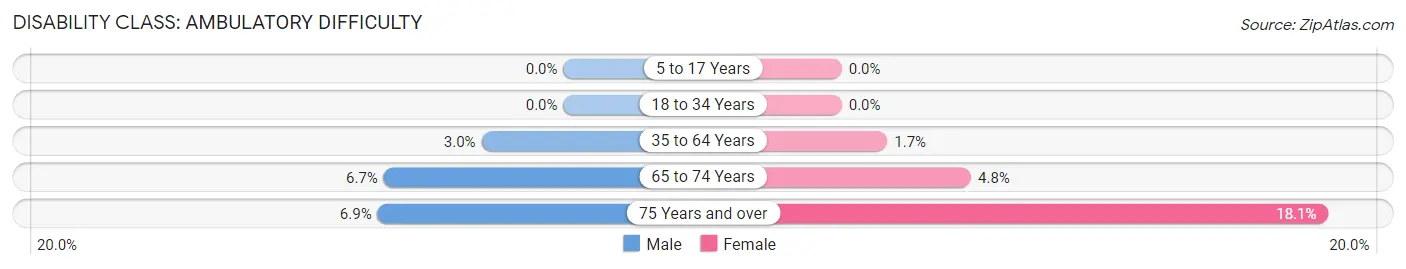
| Age Bracket | Male | Female |
| 5 to 17 Years | 0 (0.0%) | 0 (0.0%) |
| 18 to 34 Years | 0 (0.0%) | 0 (0.0%) |
| 35 to 64 Years | 10 (3.0%) | 7 (1.7%) |
| 65 to 74 Years | 7 (6.7%) | 6 (4.8%) |
| 75 Years and over | 4 (6.9%) | 13 (18.1%) |
Disability Class: Self-Care Difficulty
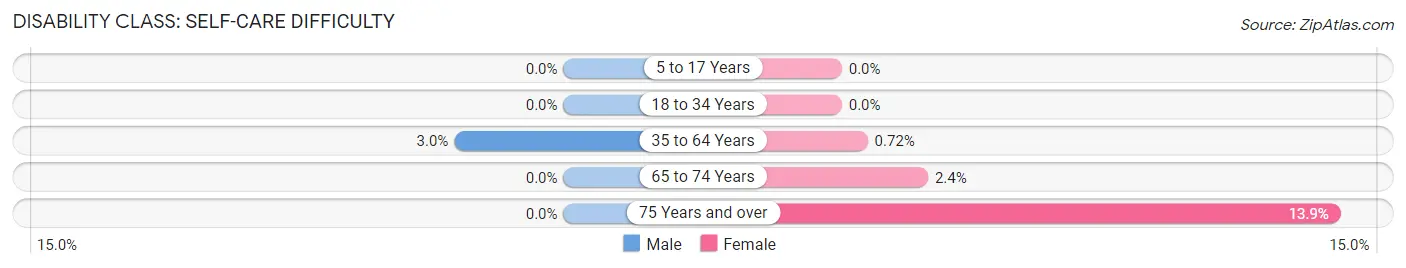
| Age Bracket | Male | Female |
| 5 to 17 Years | 0 (0.0%) | 0 (0.0%) |
| 18 to 34 Years | 0 (0.0%) | 0 (0.0%) |
| 35 to 64 Years | 10 (3.0%) | 3 (0.7%) |
| 65 to 74 Years | 0 (0.0%) | 3 (2.4%) |
| 75 Years and over | 0 (0.0%) | 10 (13.9%) |
Technology Access in Woodmont borough
Computing Device Access in Woodmont borough
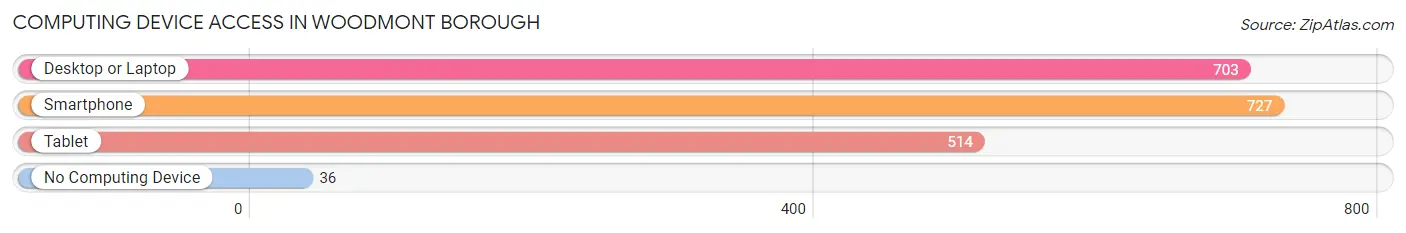
| Device Type | # Households | % Households |
| Desktop or Laptop | 703 | 88.0% |
| Smartphone | 727 | 91.0% |
| Tablet | 514 | 64.3% |
| No Computing Device | 36 | 4.5% |
| Total | 799 | 100.0% |
Internet Access in Woodmont borough
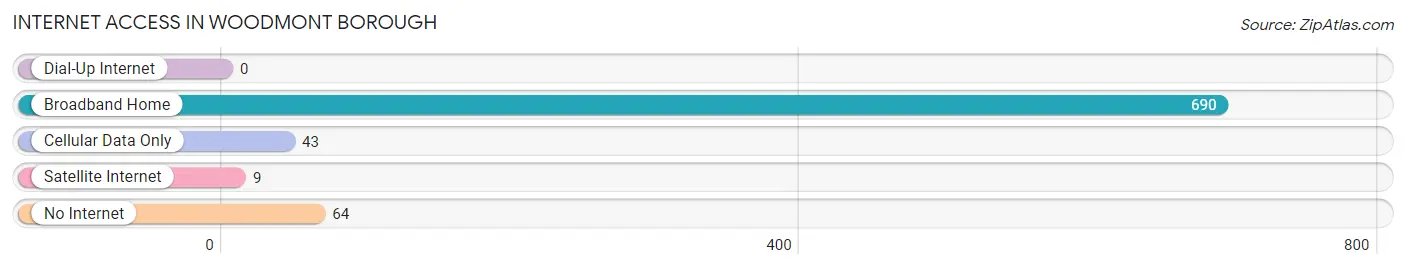
| Internet Type | # Households | % Households |
| Dial-Up Internet | 0 | 0.0% |
| Broadband Home | 690 | 86.4% |
| Cellular Data Only | 43 | 5.4% |
| Satellite Internet | 9 | 1.1% |
| No Internet | 64 | 8.0% |
| Total | 799 | 100.0% |
Woodmont borough Summary
Woodmont Borough is a small town located in the state of Connecticut. It is situated in the southwestern corner of the state, along the Long Island Sound. The town has a population of approximately 4,000 people and covers an area of 1.3 square miles.
History
Woodmont Borough was first settled in 1639 by English settlers from the nearby town of Milford. The town was originally known as “West Farms” and was part of the larger town of Milford. In 1784, the town was officially incorporated as the Borough of Woodmont. The name was chosen to honor the many trees that grew in the area.
In the 19th century, Woodmont Borough was a popular summer destination for wealthy New Yorkers. The town was known for its beautiful beaches and scenic views of the Long Island Sound. The town also had a thriving fishing industry, which provided employment for many of the town’s residents.
In the early 20th century, Woodmont Borough began to experience a decline in population as many of its residents moved away to larger cities. The town’s economy was further weakened by the Great Depression and World War II. In the 1950s, the town began to experience a resurgence as many of its former residents returned to the area.
Geography
Woodmont Borough is located in the southwestern corner of Connecticut, along the Long Island Sound. The town is bordered by the towns of Milford, Orange, and West Haven. The town is situated on a peninsula, with the Long Island Sound to the south and the Housatonic River to the north.
The town has a total area of 1.3 square miles, all of which is land. The town is mostly flat, with some rolling hills in the northern part of the town. The town is home to several parks, including Woodmont Beach Park, which offers views of the Long Island Sound.
Economy
Woodmont Borough has a small, but diverse economy. The town’s largest employer is the local government, which employs approximately 200 people. Other major employers in the town include a variety of small businesses, such as restaurants, retail stores, and professional services.
The town also has a thriving tourism industry, with many visitors coming to the area to enjoy the town’s beaches and scenic views. The town also has a small fishing industry, with several local fishermen operating out of the town’s harbor.
Demographics
As of the 2010 census, Woodmont Borough had a population of 4,000 people. The town has a median household income of $60,000 and a median home value of $250,000. The town is predominantly white, with approximately 90% of the population identifying as Caucasian. The town also has a small Hispanic population, with approximately 5% of the population identifying as Hispanic or Latino.
Conclusion
Woodmont Borough is a small town located in the southwestern corner of Connecticut. The town has a population of approximately 4,000 people and covers an area of 1.3 square miles. The town has a diverse economy, with the local government, small businesses, and tourism industry providing employment for many of the town’s residents. The town is predominantly white, with approximately 90% of the population identifying as Caucasian. Woodmont Borough is a beautiful town with a rich history and a bright future.
Common Questions
What is Per Capita Income in Woodmont borough?
Per Capita income in Woodmont borough is $74,027.
What is the Median Family Income in Woodmont borough?
Median Family Income in Woodmont borough is $171,420.
What is the Median Household income in Woodmont borough?
Median Household Income in Woodmont borough is $97,171.
What is Income or Wage Gap in Woodmont borough?
Income or Wage Gap in Woodmont borough is 28.6%.
Women in Woodmont borough earn 71.4 cents for every dollar earned by a man.
What is Inequality or Gini Index in Woodmont borough?
Inequality or Gini Index in Woodmont borough is 0.46.
What is the Total Population of Woodmont borough?
Total Population of Woodmont borough is 1,619.
What is the Total Male Population of Woodmont borough?
Total Male Population of Woodmont borough is 779.
What is the Total Female Population of Woodmont borough?
Total Female Population of Woodmont borough is 840.
What is the Ratio of Males per 100 Females in Woodmont borough?
There are 92.74 Males per 100 Females in Woodmont borough.
What is the Ratio of Females per 100 Males in Woodmont borough?
There are 107.83 Females per 100 Males in Woodmont borough.
What is the Median Population Age in Woodmont borough?
Median Population Age in Woodmont borough is 51.0 Years.
What is the Average Family Size in Woodmont borough
Average Family Size in Woodmont borough is 2.9 People.
What is the Average Household Size in Woodmont borough
Average Household Size in Woodmont borough is 2.0 People.
How Large is the Labor Force in Woodmont borough?
There are 986 People in the Labor Forcein in Woodmont borough.
What is the Percentage of People in the Labor Force in Woodmont borough?
69.5% of People are in the Labor Force in Woodmont borough.
What is the Unemployment Rate in Woodmont borough?
Unemployment Rate in Woodmont borough is 2.8%.