Cheshire Village, CT Map & Demographics
Cheshire Village Map
Cheshire Village Overview
$64,033
PER CAPITA INCOME
$180,931
AVG FAMILY INCOME
$107,577
AVG HOUSEHOLD INCOME
21.0%
WAGE / INCOME GAP [ % ]
79.0¢/ $1
WAGE / INCOME GAP [ $ ]
0.51
INEQUALITY / GINI INDEX
5,879
TOTAL POPULATION
2,750
MALE POPULATION
3,129
FEMALE POPULATION
87.89
MALES / 100 FEMALES
113.78
FEMALES / 100 MALES
46.5
MEDIAN AGE
3.3
AVG FAMILY SIZE
2.3
AVG HOUSEHOLD SIZE
3,076
LABOR FORCE [ PEOPLE ]
63.7%
PERCENT IN LABOR FORCE
4.6%
UNEMPLOYMENT RATE
Income in Cheshire Village
Income Overview in Cheshire Village
Per Capita Income in Cheshire Village is $64,033, while median incomes of families and households are $180,931 and $107,577 respectively.
| Characteristic | Number | Measure |
| Per Capita Income | 5,879 | $64,033 |
| Median Family Income | 1,345 | $180,931 |
| Mean Family Income | 1,345 | $210,483 |
| Median Household Income | 2,449 | $107,577 |
| Mean Household Income | 2,449 | $147,223 |
| Income Deficit | 1,345 | $0 |
| Wage / Income Gap (%) | 5,879 | 21.01% |
| Wage / Income Gap ($) | 5,879 | 78.99¢ per $1 |
| Gini / Inequality Index | 5,879 | 0.51 |
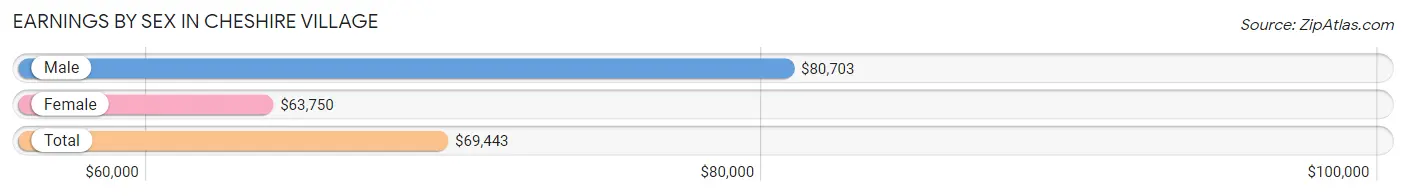
Earnings by Sex in Cheshire Village
Average Earnings in Cheshire Village are $69,443, $80,703 for men and $63,750 for women, a difference of 21.0%.
| Sex | Number | Average Earnings |
| Male | 1,707 (53.7%) | $80,703 |
| Female | 1,474 (46.3%) | $63,750 |
| Total | 3,181 (100.0%) | $69,443 |
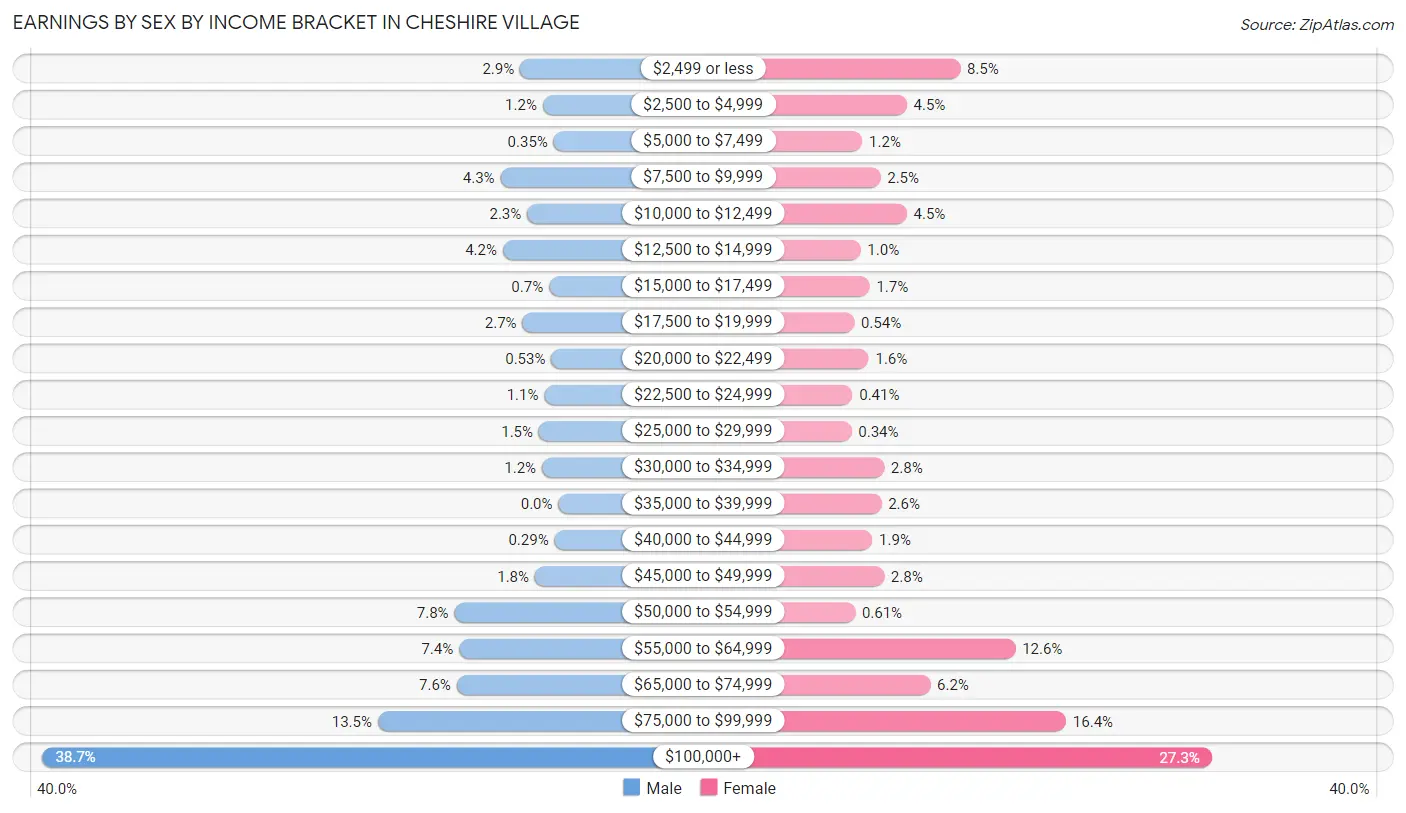
Earnings by Sex by Income Bracket in Cheshire Village
The most common earnings brackets in Cheshire Village are $100,000+ for men (660 | 38.7%) and $100,000+ for women (403 | 27.3%).
| Income | Male | Female |
| $2,499 or less | 49 (2.9%) | 125 (8.5%) |
| $2,500 to $4,999 | 20 (1.2%) | 66 (4.5%) |
| $5,000 to $7,499 | 6 (0.4%) | 17 (1.1%) |
| $7,500 to $9,999 | 74 (4.3%) | 37 (2.5%) |
| $10,000 to $12,499 | 40 (2.3%) | 66 (4.5%) |
| $12,500 to $14,999 | 71 (4.2%) | 15 (1.0%) |
| $15,000 to $17,499 | 12 (0.7%) | 25 (1.7%) |
| $17,500 to $19,999 | 46 (2.7%) | 8 (0.5%) |
| $20,000 to $22,499 | 9 (0.5%) | 24 (1.6%) |
| $22,500 to $24,999 | 18 (1.1%) | 6 (0.4%) |
| $25,000 to $29,999 | 25 (1.5%) | 5 (0.3%) |
| $30,000 to $34,999 | 21 (1.2%) | 41 (2.8%) |
| $35,000 to $39,999 | 0 (0.0%) | 38 (2.6%) |
| $40,000 to $44,999 | 5 (0.3%) | 28 (1.9%) |
| $45,000 to $49,999 | 30 (1.8%) | 41 (2.8%) |
| $50,000 to $54,999 | 133 (7.8%) | 9 (0.6%) |
| $55,000 to $64,999 | 127 (7.4%) | 186 (12.6%) |
| $65,000 to $74,999 | 130 (7.6%) | 92 (6.2%) |
| $75,000 to $99,999 | 231 (13.5%) | 242 (16.4%) |
| $100,000+ | 660 (38.7%) | 403 (27.3%) |
| Total | 1,707 (100.0%) | 1,474 (100.0%) |
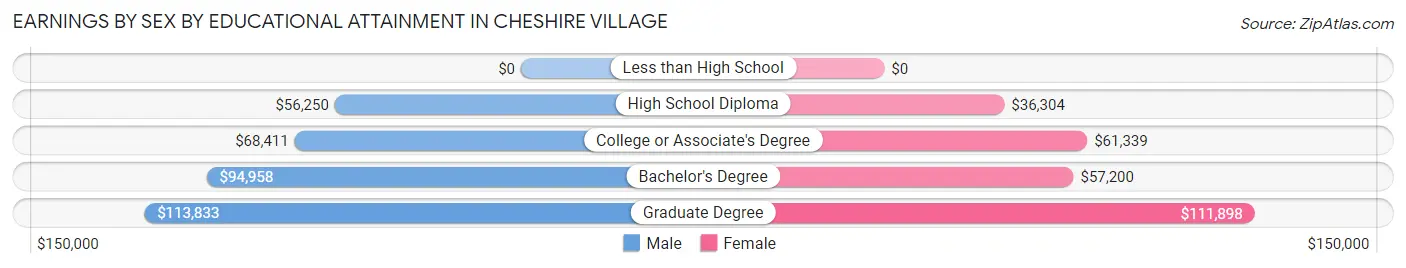
Earnings by Sex by Educational Attainment in Cheshire Village
Average earnings in Cheshire Village are $91,538 for men and $68,995 for women, a difference of 24.6%. Men with an educational attainment of graduate degree enjoy the highest average annual earnings of $113,833, while those with high school diploma education earn the least with $56,250. Women with an educational attainment of graduate degree earn the most with the average annual earnings of $111,898, while those with high school diploma education have the smallest earnings of $36,304.
| Educational Attainment | Male Income | Female Income |
| Less than High School | - | - |
| High School Diploma | $56,250 | $36,304 |
| College or Associate's Degree | $68,411 | $61,339 |
| Bachelor's Degree | $94,958 | $57,200 |
| Graduate Degree | $113,833 | $111,898 |
| Total | $91,538 | $68,995 |
Family Income in Cheshire Village
Family Income Brackets in Cheshire Village
According to the Cheshire Village family income data, there are 555 families falling into the $200,000+ income range, which is the most common income bracket and makes up 41.3% of all families.
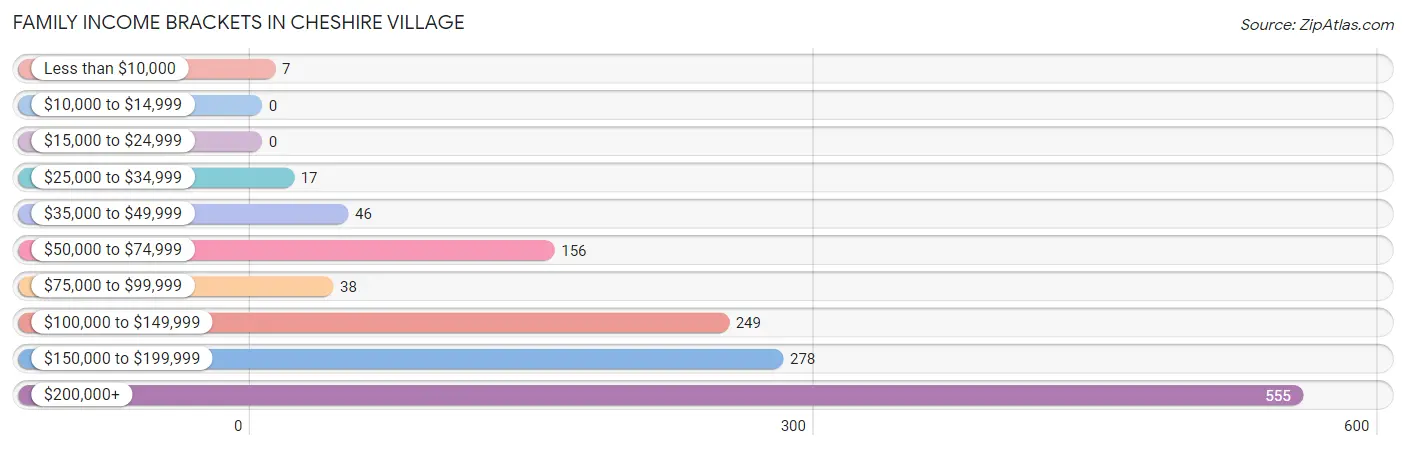
| Income Bracket | # Families | % Families |
| Less than $10,000 | 7 | 0.5% |
| $10,000 to $14,999 | 0 | 0.0% |
| $15,000 to $24,999 | 0 | 0.0% |
| $25,000 to $34,999 | 17 | 1.3% |
| $35,000 to $49,999 | 46 | 3.4% |
| $50,000 to $74,999 | 156 | 11.6% |
| $75,000 to $99,999 | 38 | 2.8% |
| $100,000 to $149,999 | 249 | 18.5% |
| $150,000 to $199,999 | 278 | 20.7% |
| $200,000+ | 555 | 41.3% |
Family Income by Famaliy Size in Cheshire Village
6-person families (50 | 3.7%) account for the highest median family income in Cheshire Village with $250,001 per family, while 2-person families (560 | 41.6%) have the highest median income of $76,562 per family member.
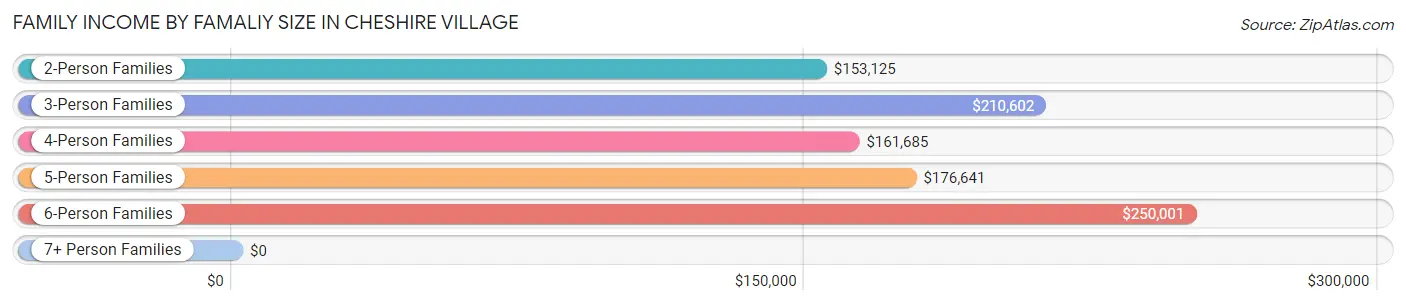
| Income Bracket | # Families | Median Income |
| 2-Person Families | 560 (41.6%) | $153,125 |
| 3-Person Families | 343 (25.5%) | $210,602 |
| 4-Person Families | 291 (21.6%) | $161,685 |
| 5-Person Families | 97 (7.2%) | $176,641 |
| 6-Person Families | 50 (3.7%) | $250,001 |
| 7+ Person Families | 4 (0.3%) | $0 |
| Total | 1,345 (100.0%) | $180,931 |
Family Income by Number of Earners in Cheshire Village
The median family income in Cheshire Village is $180,931, with families comprising 2 earners (669) having the highest median family income of $210,938, while families with no earners (125) have the lowest median family income of $70,208, accounting for 49.7% and 9.3% of families, respectively.
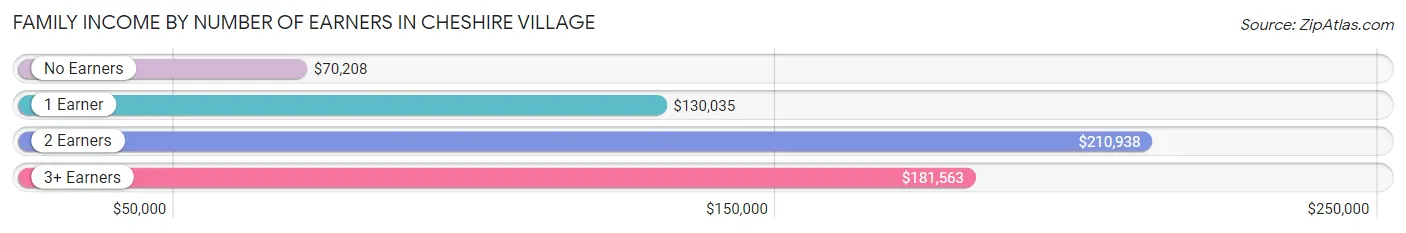
| Number of Earners | # Families | Median Income |
| No Earners | 125 (9.3%) | $70,208 |
| 1 Earner | 371 (27.6%) | $130,035 |
| 2 Earners | 669 (49.7%) | $210,938 |
| 3+ Earners | 180 (13.4%) | $181,563 |
| Total | 1,345 (100.0%) | $180,931 |
Household Income in Cheshire Village
Household Income Brackets in Cheshire Village
With 595 households falling in the category, the $200,000+ income range is the most frequent in Cheshire Village, accounting for 24.3% of all households. In contrast, only 66 households (2.7%) fall into the $10,000 to $14,999 income bracket, making it the least populous group.
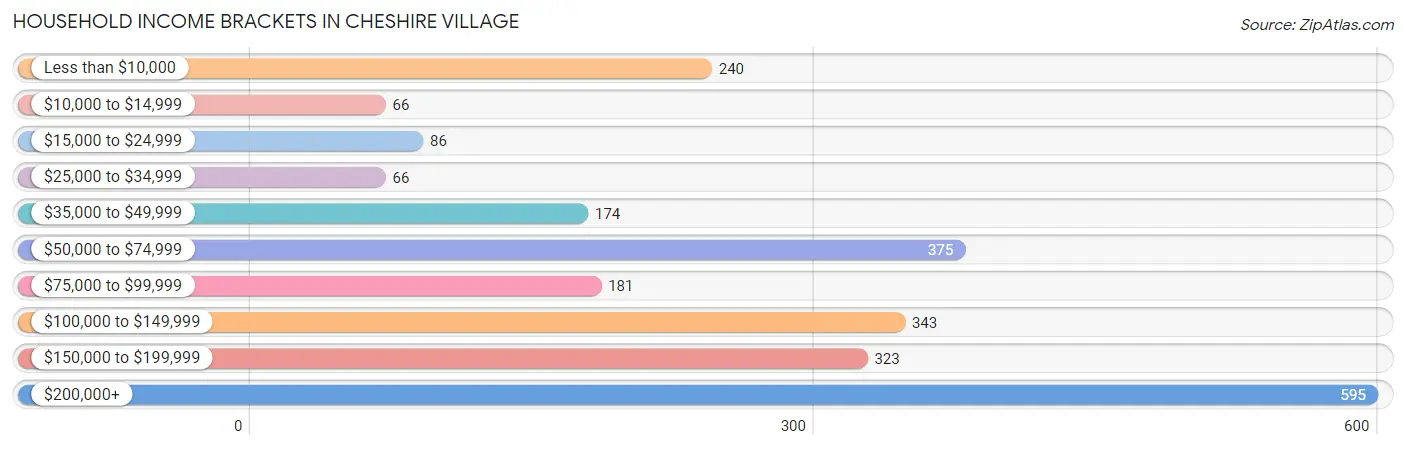
| Income Bracket | # Households | % Households |
| Less than $10,000 | 240 | 9.8% |
| $10,000 to $14,999 | 66 | 2.7% |
| $15,000 to $24,999 | 86 | 3.5% |
| $25,000 to $34,999 | 66 | 2.7% |
| $35,000 to $49,999 | 174 | 7.1% |
| $50,000 to $74,999 | 375 | 15.3% |
| $75,000 to $99,999 | 181 | 7.4% |
| $100,000 to $149,999 | 343 | 14.0% |
| $150,000 to $199,999 | 323 | 13.2% |
| $200,000+ | 595 | 24.3% |
Household Income by Householder Age in Cheshire Village
The median household income in Cheshire Village is $107,577, with the highest median household income of $175,550 found in the 45 to 64 years age bracket for the primary householder. A total of 1,007 households (41.1%) fall into this category. Meanwhile, the 15 to 24 years age bracket for the primary householder has the lowest median household income of $0, with 21 households (0.9%) in this group.
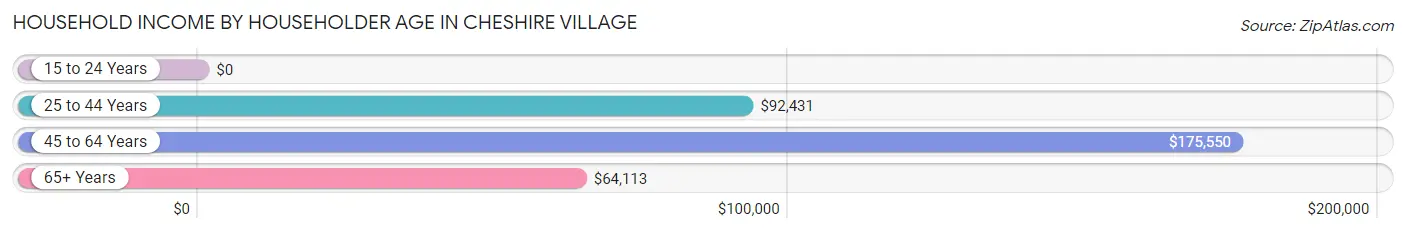
| Income Bracket | # Households | Median Income |
| 15 to 24 Years | 21 (0.9%) | $0 |
| 25 to 44 Years | 513 (20.9%) | $92,431 |
| 45 to 64 Years | 1,007 (41.1%) | $175,550 |
| 65+ Years | 908 (37.1%) | $64,113 |
| Total | 2,449 (100.0%) | $107,577 |
Poverty in Cheshire Village
Income Below Poverty by Sex and Age in Cheshire Village
With 3.2% poverty level for males and 9.4% for females among the residents of Cheshire Village, 75 year old and over males and 45 to 54 year old females are the most vulnerable to poverty, with 28 males (14.7%) and 149 females (27.1%) in their respective age groups living below the poverty level.
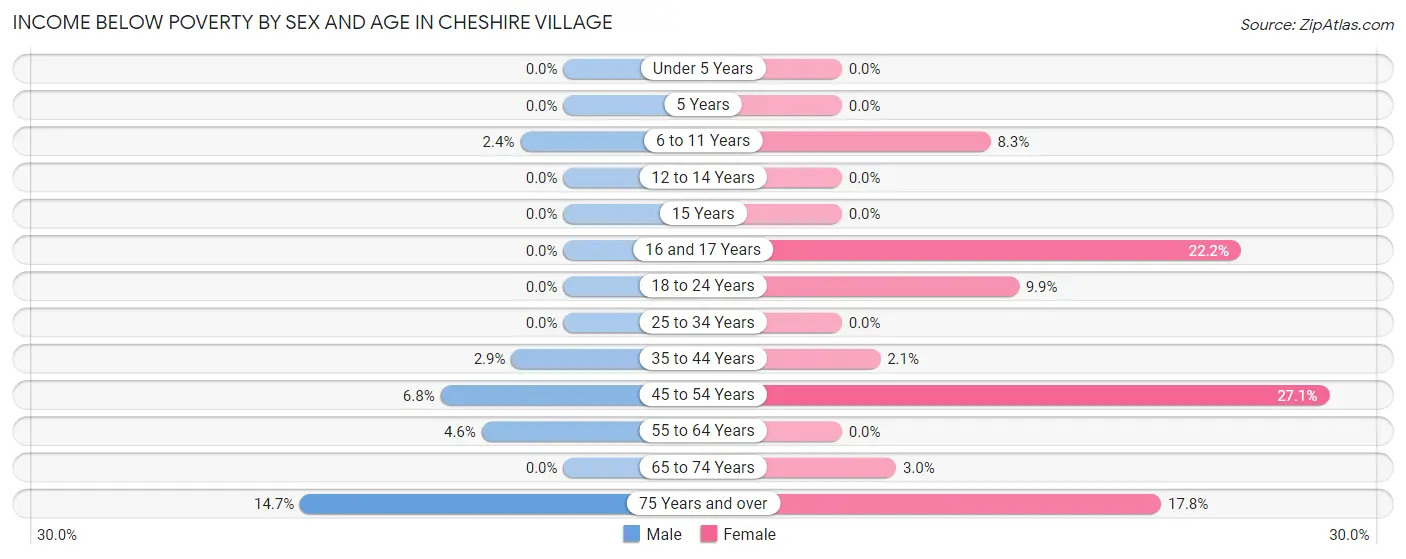
| Age Bracket | Male | Female |
| Under 5 Years | 0 (0.0%) | 0 (0.0%) |
| 5 Years | 0 (0.0%) | 0 (0.0%) |
| 6 to 11 Years | 6 (2.4%) | 14 (8.3%) |
| 12 to 14 Years | 0 (0.0%) | 0 (0.0%) |
| 15 Years | 0 (0.0%) | 0 (0.0%) |
| 16 and 17 Years | 0 (0.0%) | 8 (22.2%) |
| 18 to 24 Years | 0 (0.0%) | 26 (9.9%) |
| 25 to 34 Years | 0 (0.0%) | 0 (0.0%) |
| 35 to 44 Years | 8 (2.9%) | 7 (2.1%) |
| 45 to 54 Years | 26 (6.8%) | 149 (27.1%) |
| 55 to 64 Years | 20 (4.5%) | 0 (0.0%) |
| 65 to 74 Years | 0 (0.0%) | 13 (3.0%) |
| 75 Years and over | 28 (14.7%) | 69 (17.8%) |
| Total | 88 (3.2%) | 286 (9.4%) |
Income Above Poverty by Sex and Age in Cheshire Village
According to the poverty statistics in Cheshire Village, males aged under 5 years and females aged under 5 years are the age groups that are most secure financially, with 100.0% of males and 100.0% of females in these age groups living above the poverty line.
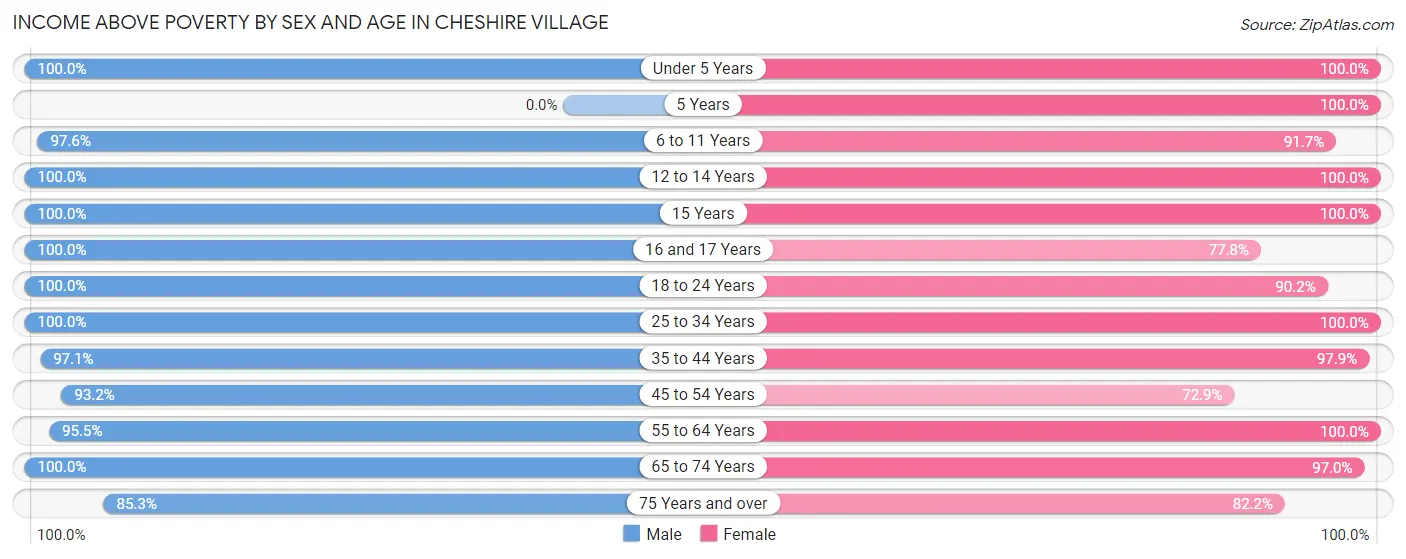
| Age Bracket | Male | Female |
| Under 5 Years | 125 (100.0%) | 107 (100.0%) |
| 5 Years | 0 (0.0%) | 12 (100.0%) |
| 6 to 11 Years | 244 (97.6%) | 155 (91.7%) |
| 12 to 14 Years | 180 (100.0%) | 95 (100.0%) |
| 15 Years | 56 (100.0%) | 56 (100.0%) |
| 16 and 17 Years | 59 (100.0%) | 28 (77.8%) |
| 18 to 24 Years | 222 (100.0%) | 238 (90.1%) |
| 25 to 34 Years | 224 (100.0%) | 238 (100.0%) |
| 35 to 44 Years | 268 (97.1%) | 320 (97.9%) |
| 45 to 54 Years | 354 (93.2%) | 400 (72.9%) |
| 55 to 64 Years | 420 (95.5%) | 375 (100.0%) |
| 65 to 74 Years | 315 (100.0%) | 418 (97.0%) |
| 75 Years and over | 163 (85.3%) | 319 (82.2%) |
| Total | 2,630 (96.8%) | 2,761 (90.6%) |
Income Below Poverty Among Married-Couple Families in Cheshire Village
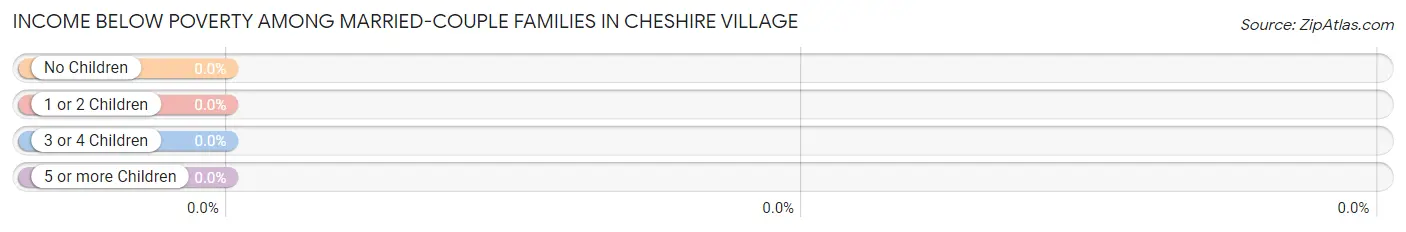
| Children | Above Poverty | Below Poverty |
| No Children | 708 (100.0%) | 0 (0.0%) |
| 1 or 2 Children | 434 (100.0%) | 0 (0.0%) |
| 3 or 4 Children | 66 (100.0%) | 0 (0.0%) |
| 5 or more Children | 0 (0.0%) | 0 (0.0%) |
| Total | 1,208 (100.0%) | 0 (0.0%) |
Income Below Poverty Among Single-Parent Households in Cheshire Village
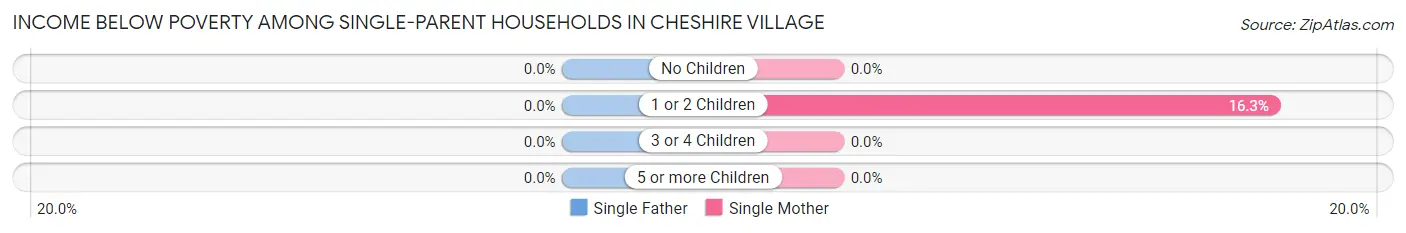
| Children | Single Father | Single Mother |
| No Children | 0 (0.0%) | 0 (0.0%) |
| 1 or 2 Children | 0 (0.0%) | 7 (16.3%) |
| 3 or 4 Children | 0 (0.0%) | 0 (0.0%) |
| 5 or more Children | 0 (0.0%) | 0 (0.0%) |
| Total | 0 (0.0%) | 7 (6.9%) |
Income Below Poverty Among Married-Couple vs Single-Parent Households in Cheshire Village
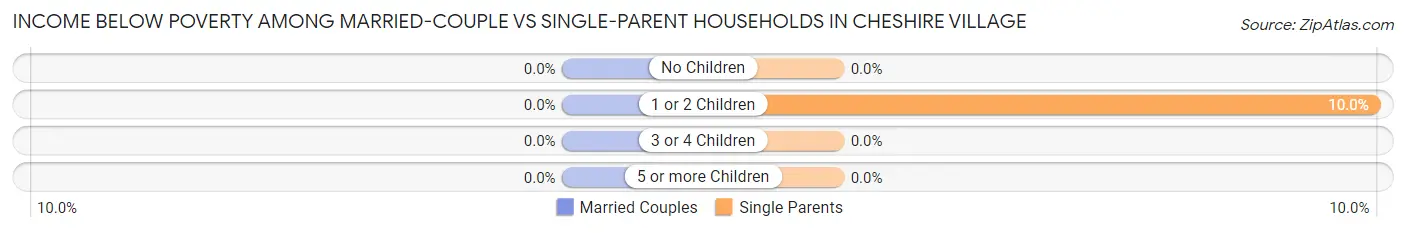
| Children | Married-Couple Families | Single-Parent Households |
| No Children | 0 (0.0%) | 0 (0.0%) |
| 1 or 2 Children | 0 (0.0%) | 7 (10.0%) |
| 3 or 4 Children | 0 (0.0%) | 0 (0.0%) |
| 5 or more Children | 0 (0.0%) | 0 (0.0%) |
| Total | 0 (0.0%) | 7 (5.1%) |
Race in Cheshire Village
The most populous races in Cheshire Village are White / Caucasian (4,324 | 73.6%), Asian (858 | 14.6%), and Hispanic or Latino (452 | 7.7%).
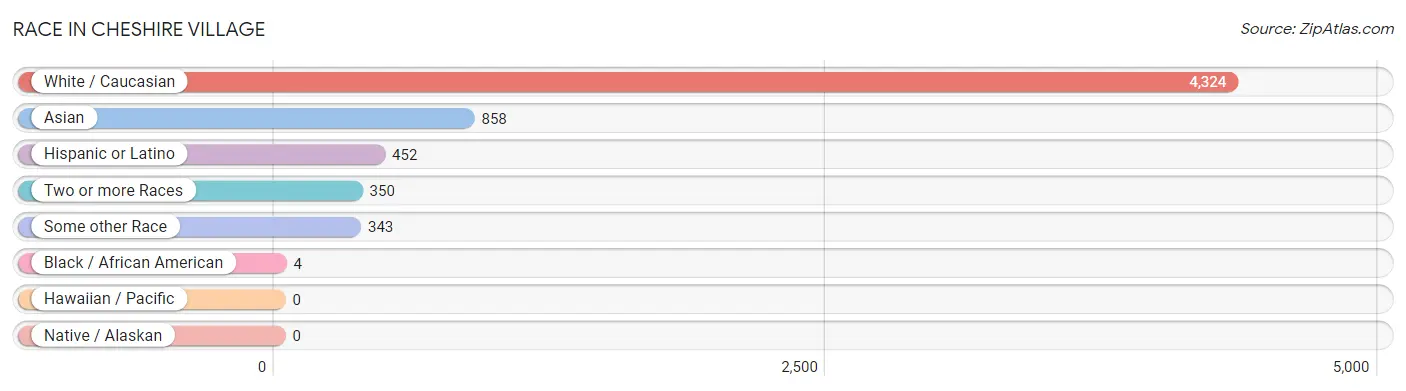
| Race | # Population | % Population |
| Asian | 858 | 14.6% |
| Black / African American | 4 | 0.1% |
| Hawaiian / Pacific | 0 | 0.0% |
| Hispanic or Latino | 452 | 7.7% |
| Native / Alaskan | 0 | 0.0% |
| White / Caucasian | 4,324 | 73.6% |
| Two or more Races | 350 | 5.9% |
| Some other Race | 343 | 5.8% |
| Total | 5,879 | 100.0% |
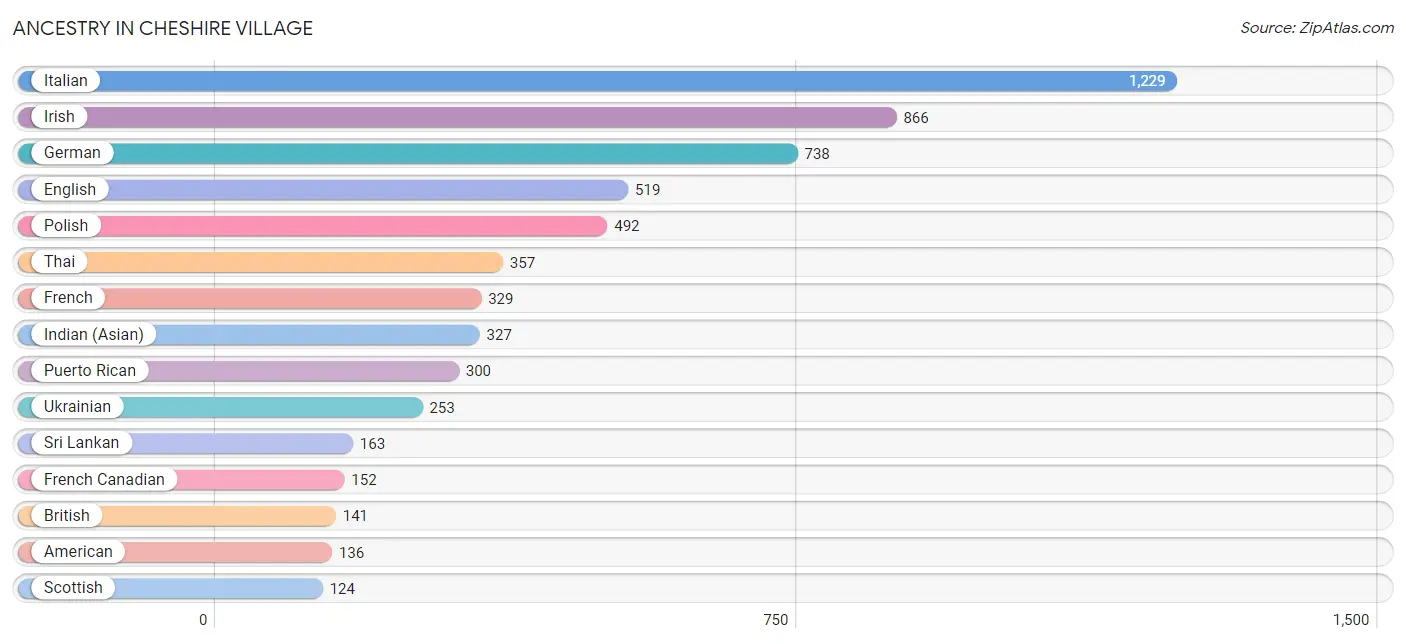
Ancestry in Cheshire Village
The most populous ancestries reported in Cheshire Village are Italian (1,229 | 20.9%), Irish (866 | 14.7%), German (738 | 12.6%), English (519 | 8.8%), and Polish (492 | 8.4%), together accounting for 65.4% of all Cheshire Village residents.
| Ancestry | # Population | % Population |
| American | 136 | 2.3% |
| Arab | 10 | 0.2% |
| Australian | 7 | 0.1% |
| Austrian | 24 | 0.4% |
| Belgian | 40 | 0.7% |
| Belizean | 15 | 0.3% |
| Bhutanese | 88 | 1.5% |
| Brazilian | 1 | 0.0% |
| British | 141 | 2.4% |
| Burmese | 99 | 1.7% |
| Canadian | 15 | 0.3% |
| Chilean | 54 | 0.9% |
| Cuban | 23 | 0.4% |
| Czech | 7 | 0.1% |
| Czechoslovakian | 18 | 0.3% |
| Dominican | 33 | 0.6% |
| Dutch | 25 | 0.4% |
| Eastern European | 27 | 0.5% |
| English | 519 | 8.8% |
| European | 13 | 0.2% |
| Filipino | 112 | 1.9% |
| Finnish | 18 | 0.3% |
| French | 329 | 5.6% |
| French American Indian | 6 | 0.1% |
| French Canadian | 152 | 2.6% |
| German | 738 | 12.6% |
| Greek | 24 | 0.4% |
| Hungarian | 12 | 0.2% |
| Indian (Asian) | 327 | 5.6% |
| Irish | 866 | 14.7% |
| Italian | 1,229 | 20.9% |
| Jamaican | 9 | 0.2% |
| Korean | 13 | 0.2% |
| Lithuanian | 20 | 0.3% |
| Mexican | 42 | 0.7% |
| Native Hawaiian | 50 | 0.9% |
| Norwegian | 88 | 1.5% |
| Polish | 492 | 8.4% |
| Portuguese | 28 | 0.5% |
| Puerto Rican | 300 | 5.1% |
| Romanian | 91 | 1.5% |
| Russian | 36 | 0.6% |
| Scottish | 124 | 2.1% |
| South American | 54 | 0.9% |
| Sri Lankan | 163 | 2.8% |
| Swedish | 50 | 0.9% |
| Syrian | 10 | 0.2% |
| Thai | 357 | 6.1% |
| Ukrainian | 253 | 4.3% |
| Welsh | 16 | 0.3% | View All 50 Rows |
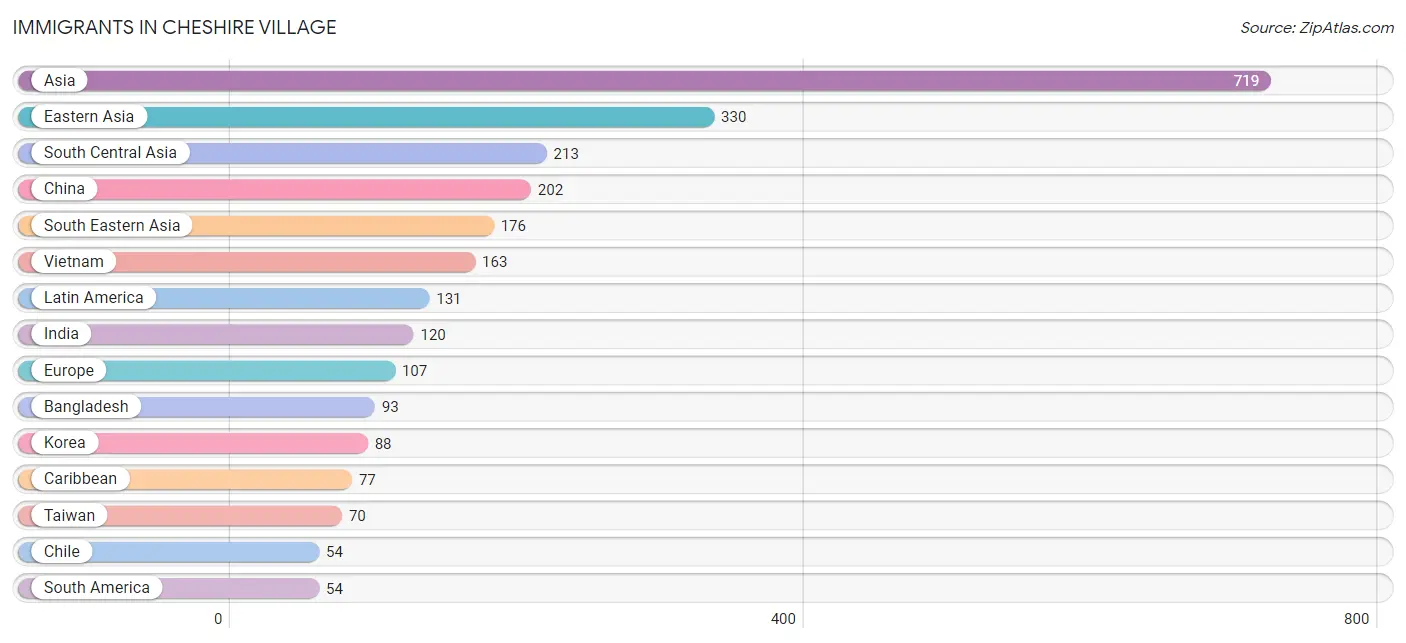
Immigrants in Cheshire Village
The most numerous immigrant groups reported in Cheshire Village came from Asia (719 | 12.2%), Eastern Asia (330 | 5.6%), South Central Asia (213 | 3.6%), China (202 | 3.4%), and South Eastern Asia (176 | 3.0%), together accounting for 27.9% of all Cheshire Village residents.
| Immigration Origin | # Population | % Population |
| Asia | 719 | 12.2% |
| Australia | 7 | 0.1% |
| Bangladesh | 93 | 1.6% |
| Belgium | 2 | 0.0% |
| Canada | 37 | 0.6% |
| Caribbean | 77 | 1.3% |
| Chile | 54 | 0.9% |
| China | 202 | 3.4% |
| Cuba | 25 | 0.4% |
| Dominican Republic | 33 | 0.6% |
| Eastern Asia | 330 | 5.6% |
| Eastern Europe | 39 | 0.7% |
| England | 8 | 0.1% |
| Europe | 107 | 1.8% |
| Germany | 7 | 0.1% |
| India | 120 | 2.0% |
| Italy | 29 | 0.5% |
| Jamaica | 19 | 0.3% |
| Japan | 40 | 0.7% |
| Korea | 88 | 1.5% |
| Latin America | 131 | 2.2% |
| Northern Europe | 23 | 0.4% |
| Oceania | 7 | 0.1% |
| Philippines | 13 | 0.2% |
| Portugal | 7 | 0.1% |
| Romania | 27 | 0.5% |
| Russia | 6 | 0.1% |
| South America | 54 | 0.9% |
| South Central Asia | 213 | 3.6% |
| South Eastern Asia | 176 | 3.0% |
| Southern Europe | 36 | 0.6% |
| Taiwan | 70 | 1.2% |
| Ukraine | 6 | 0.1% |
| Vietnam | 163 | 2.8% |
| Western Europe | 9 | 0.2% | View All 35 Rows |
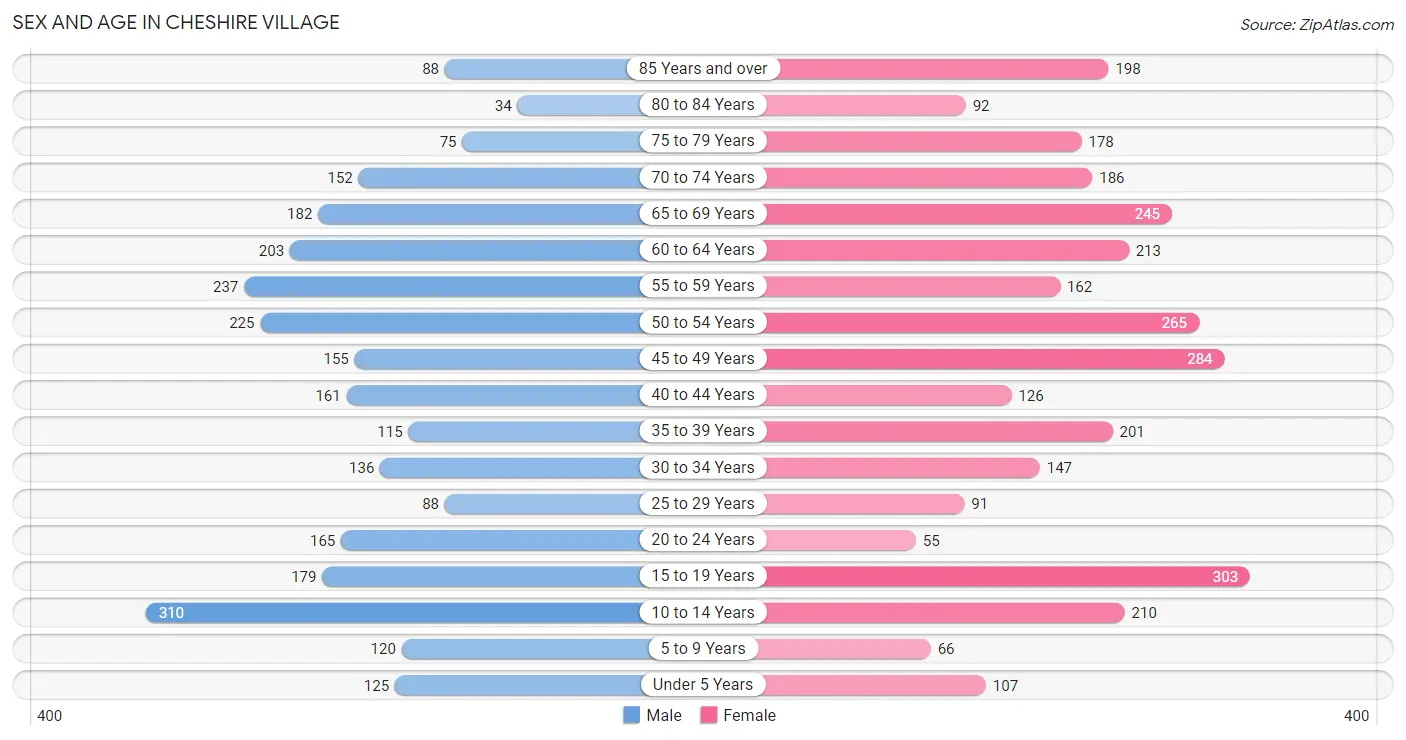
Sex and Age in Cheshire Village
Sex and Age in Cheshire Village
The most populous age groups in Cheshire Village are 10 to 14 Years (310 | 11.3%) for men and 15 to 19 Years (303 | 9.7%) for women.
| Age Bracket | Male | Female |
| Under 5 Years | 125 (4.5%) | 107 (3.4%) |
| 5 to 9 Years | 120 (4.4%) | 66 (2.1%) |
| 10 to 14 Years | 310 (11.3%) | 210 (6.7%) |
| 15 to 19 Years | 179 (6.5%) | 303 (9.7%) |
| 20 to 24 Years | 165 (6.0%) | 55 (1.8%) |
| 25 to 29 Years | 88 (3.2%) | 91 (2.9%) |
| 30 to 34 Years | 136 (5.0%) | 147 (4.7%) |
| 35 to 39 Years | 115 (4.2%) | 201 (6.4%) |
| 40 to 44 Years | 161 (5.9%) | 126 (4.0%) |
| 45 to 49 Years | 155 (5.6%) | 284 (9.1%) |
| 50 to 54 Years | 225 (8.2%) | 265 (8.5%) |
| 55 to 59 Years | 237 (8.6%) | 162 (5.2%) |
| 60 to 64 Years | 203 (7.4%) | 213 (6.8%) |
| 65 to 69 Years | 182 (6.6%) | 245 (7.8%) |
| 70 to 74 Years | 152 (5.5%) | 186 (5.9%) |
| 75 to 79 Years | 75 (2.7%) | 178 (5.7%) |
| 80 to 84 Years | 34 (1.2%) | 92 (2.9%) |
| 85 Years and over | 88 (3.2%) | 198 (6.3%) |
| Total | 2,750 (100.0%) | 3,129 (100.0%) |
Families and Households in Cheshire Village
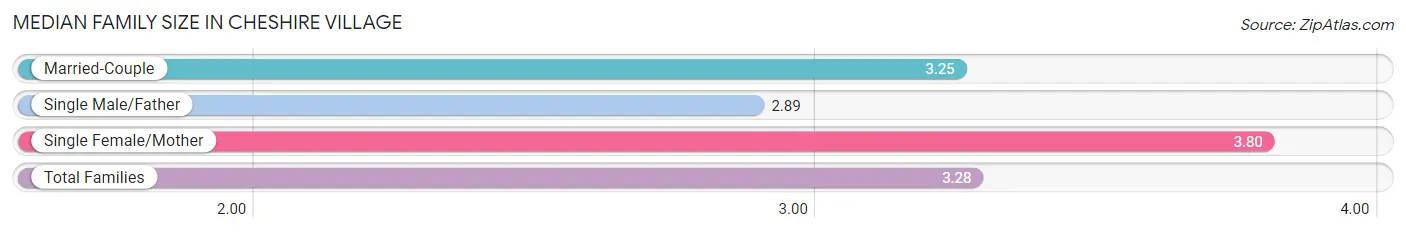
Median Family Size in Cheshire Village
The median family size in Cheshire Village is 3.28 persons per family, with single female/mother families (101 | 7.5%) accounting for the largest median family size of 3.8 persons per family. On the other hand, single male/father families (36 | 2.7%) represent the smallest median family size with 2.89 persons per family.
| Family Type | # Families | Family Size |
| Married-Couple | 1,208 (89.8%) | 3.25 |
| Single Male/Father | 36 (2.7%) | 2.89 |
| Single Female/Mother | 101 (7.5%) | 3.80 |
| Total Families | 1,345 (100.0%) | 3.28 |
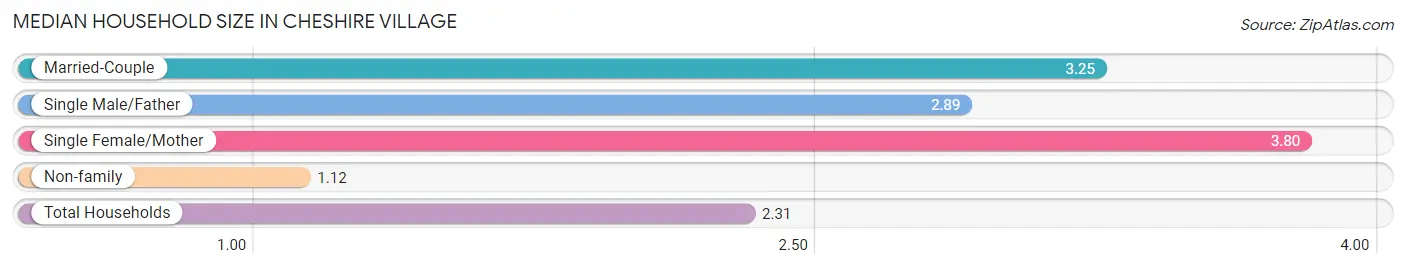
Median Household Size in Cheshire Village
The median household size in Cheshire Village is 2.31 persons per household, with single female/mother households (101 | 4.1%) accounting for the largest median household size of 3.8 persons per household. non-family households (1,104 | 45.1%) represent the smallest median household size with 1.12 persons per household.
| Household Type | # Households | Household Size |
| Married-Couple | 1,208 (49.3%) | 3.25 |
| Single Male/Father | 36 (1.5%) | 2.89 |
| Single Female/Mother | 101 (4.1%) | 3.80 |
| Non-family | 1,104 (45.1%) | 1.12 |
| Total Households | 2,449 (100.0%) | 2.31 |
Household Size by Marriage Status in Cheshire Village
Out of a total of 2,449 households in Cheshire Village, 1,345 (54.9%) are family households, while 1,104 (45.1%) are nonfamily households. The most numerous type of family households are 2-person households, comprising 560, and the most common type of nonfamily households are 1-person households, comprising 1,015.
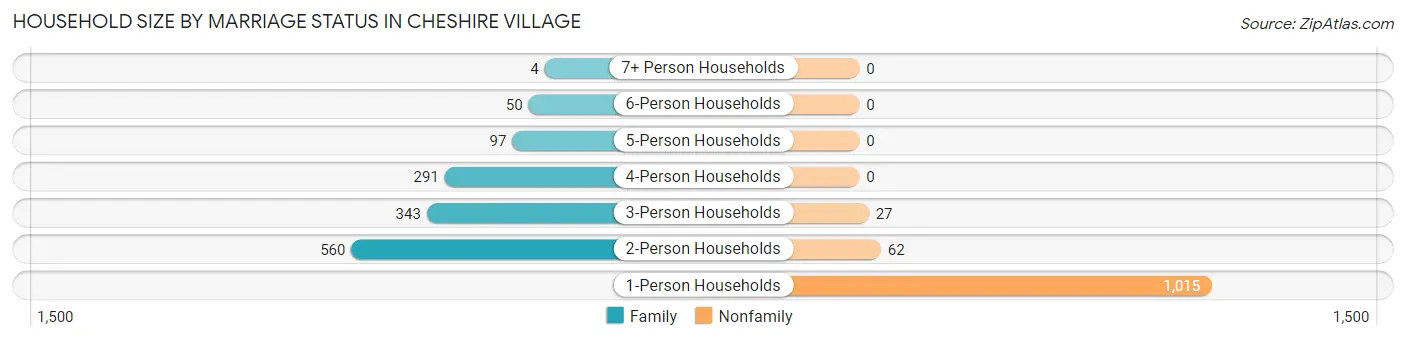
| Household Size | Family Households | Nonfamily Households |
| 1-Person Households | - | 1,015 (41.4%) |
| 2-Person Households | 560 (22.9%) | 62 (2.5%) |
| 3-Person Households | 343 (14.0%) | 27 (1.1%) |
| 4-Person Households | 291 (11.9%) | 0 (0.0%) |
| 5-Person Households | 97 (4.0%) | 0 (0.0%) |
| 6-Person Households | 50 (2.0%) | 0 (0.0%) |
| 7+ Person Households | 4 (0.2%) | 0 (0.0%) |
| Total | 1,345 (54.9%) | 1,104 (45.1%) |
Female Fertility in Cheshire Village
Fertility by Age in Cheshire Village
Average fertility rate in Cheshire Village is 47.0 births per 1,000 women. Women in the age bracket of 35 to 50 years have the highest fertility rate with 62.0 births per 1,000 women. Women in the age bracket of 35 to 50 years acount for 72.6% of all women with births.
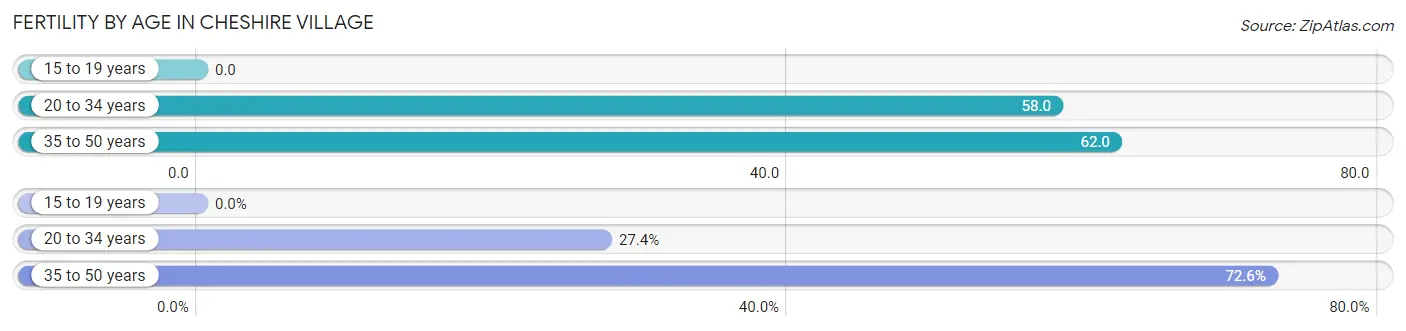
| Age Bracket | Women with Births | Births / 1,000 Women |
| 15 to 19 years | 0 (0.0%) | 0.0 |
| 20 to 34 years | 17 (27.4%) | 58.0 |
| 35 to 50 years | 45 (72.6%) | 62.0 |
| Total | 62 (100.0%) | 47.0 |
Fertility by Age by Marriage Status in Cheshire Village
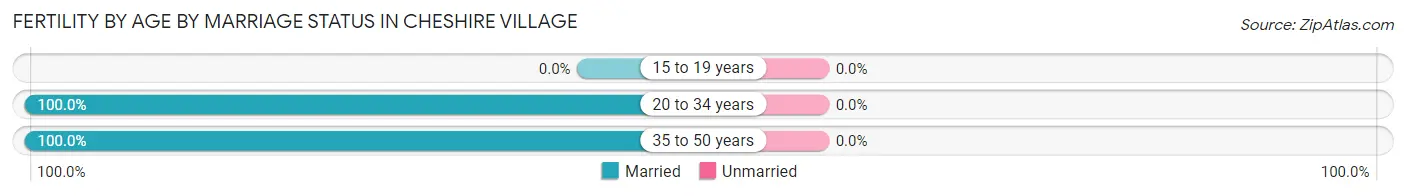
| Age Bracket | Married | Unmarried |
| 15 to 19 years | 0 (0.0%) | 0 (0.0%) |
| 20 to 34 years | 17 (100.0%) | 0 (0.0%) |
| 35 to 50 years | 45 (100.0%) | 0 (0.0%) |
| Total | 62 (100.0%) | 0 (0.0%) |
Fertility by Education in Cheshire Village
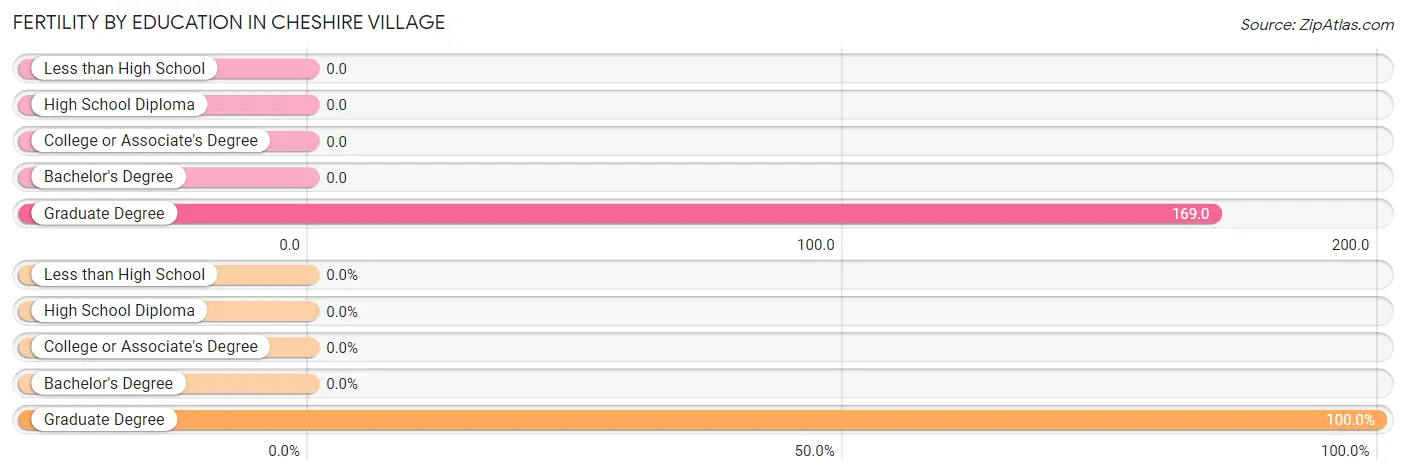
| Educational Attainment | Women with Births | Births / 1,000 Women |
| Less than High School | 0 (0.0%) | 0.0 |
| High School Diploma | 0 (0.0%) | 0.0 |
| College or Associate's Degree | 0 (0.0%) | 0.0 |
| Bachelor's Degree | 0 (0.0%) | 0.0 |
| Graduate Degree | 62 (100.0%) | 169.0 |
| Total | 62 (100.0%) | 47.0 |
Fertility by Education by Marriage Status in Cheshire Village
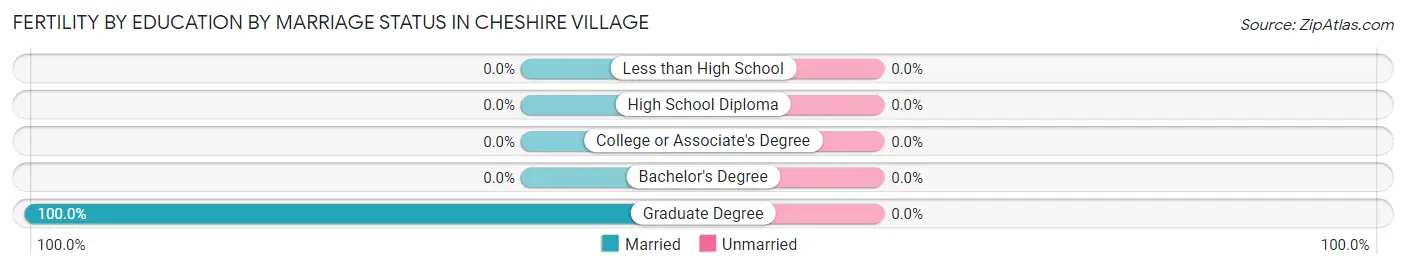
| Educational Attainment | Married | Unmarried |
| Less than High School | 0 (0.0%) | 0 (0.0%) |
| High School Diploma | 0 (0.0%) | 0 (0.0%) |
| College or Associate's Degree | 0 (0.0%) | 0 (0.0%) |
| Bachelor's Degree | 0 (0.0%) | 0 (0.0%) |
| Graduate Degree | 62 (100.0%) | 0 (0.0%) |
| Total | 62 (100.0%) | 0 (0.0%) |
Employment Characteristics in Cheshire Village
Employment by Class of Employer in Cheshire Village
Among the 2,931 employed individuals in Cheshire Village, private company employees (1,755 | 59.9%), not-for-profit organizations (427 | 14.6%), and local government employees (297 | 10.1%) make up the most common classes of employment.
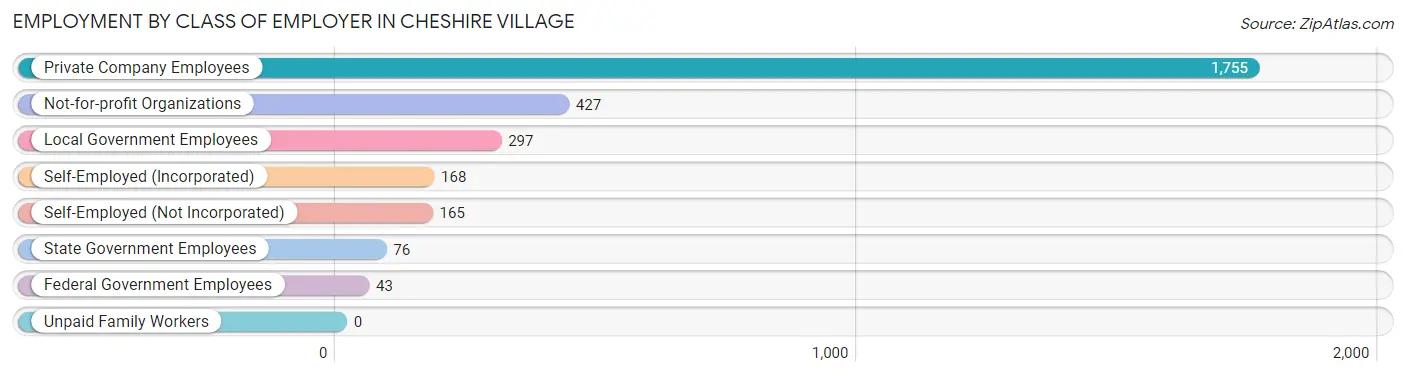
| Employer Class | # Employees | % Employees |
| Private Company Employees | 1,755 | 59.9% |
| Self-Employed (Incorporated) | 168 | 5.7% |
| Self-Employed (Not Incorporated) | 165 | 5.6% |
| Not-for-profit Organizations | 427 | 14.6% |
| Local Government Employees | 297 | 10.1% |
| State Government Employees | 76 | 2.6% |
| Federal Government Employees | 43 | 1.5% |
| Unpaid Family Workers | 0 | 0.0% |
| Total | 2,931 | 100.0% |
Employment Status by Age in Cheshire Village
According to the labor force statistics for Cheshire Village, out of the total population over 16 years of age (4,829), 63.7% or 3,076 individuals are in the labor force, with 4.6% or 141 of them unemployed. The age group with the highest labor force participation rate is 25 to 29 years, with 100.0% or 179 individuals in the labor force. Within the labor force, the 20 to 24 years age range has the highest percentage of unemployed individuals, with 17.1% or 28 of them being unemployed.
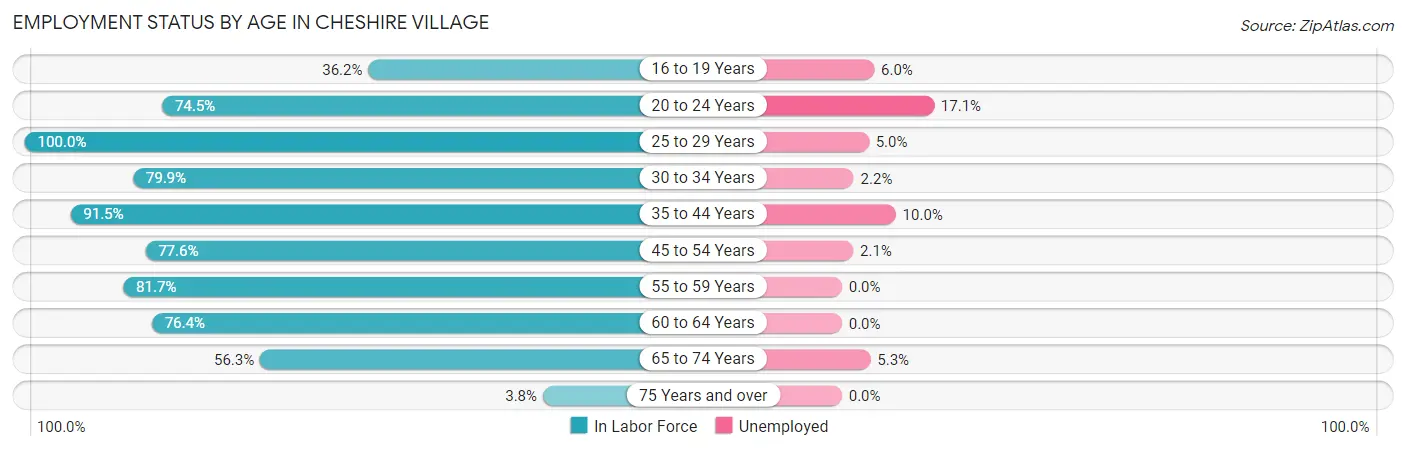
| Age Bracket | In Labor Force | Unemployed |
| 16 to 19 Years | 134 (36.2%) | 8 (6.0%) |
| 20 to 24 Years | 164 (74.5%) | 28 (17.1%) |
| 25 to 29 Years | 179 (100.0%) | 9 (5.0%) |
| 30 to 34 Years | 226 (79.9%) | 5 (2.2%) |
| 35 to 44 Years | 552 (91.5%) | 55 (10.0%) |
| 45 to 54 Years | 721 (77.6%) | 15 (2.1%) |
| 55 to 59 Years | 326 (81.7%) | 0 (0.0%) |
| 60 to 64 Years | 318 (76.4%) | 0 (0.0%) |
| 65 to 74 Years | 431 (56.3%) | 23 (5.3%) |
| 75 Years and over | 25 (3.8%) | 0 (0.0%) |
| Total | 3,076 (63.7%) | 141 (4.6%) |
Employment Status by Educational Attainment in Cheshire Village
According to labor force statistics for Cheshire Village, 82.7% of individuals (2,323) out of the total population between 25 and 64 years of age (2,809) are in the labor force, with 3.6% or 84 of them being unemployed. The group with the highest labor force participation rate are those with the educational attainment of bachelor's degree or higher, with 92.4% or 1,732 individuals in the labor force. Within the labor force, individuals with college / associate degree education have the highest percentage of unemployment, with 4.1% or 13 of them being unemployed.
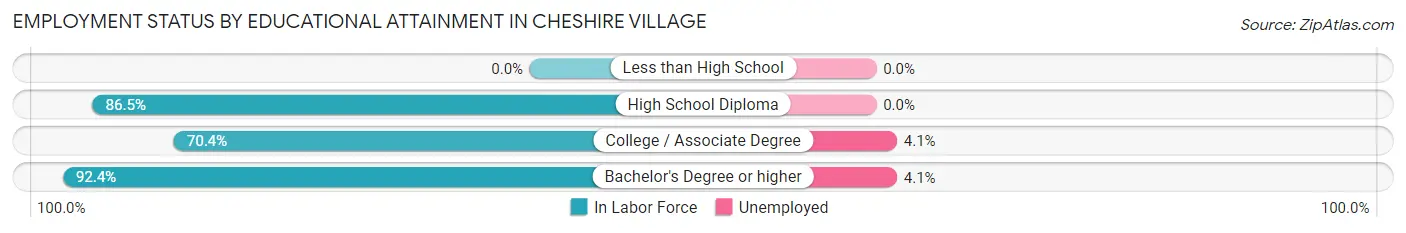
| Educational Attainment | In Labor Force | Unemployed |
| Less than High School | 0 (0.0%) | 0 (0.0%) |
| High School Diploma | 270 (86.5%) | 0 (0.0%) |
| College / Associate Degree | 319 (70.4%) | 19 (4.1%) |
| Bachelor's Degree or higher | 1,732 (92.4%) | 77 (4.1%) |
| Total | 2,323 (82.7%) | 101 (3.6%) |
Employment Occupations by Sex in Cheshire Village
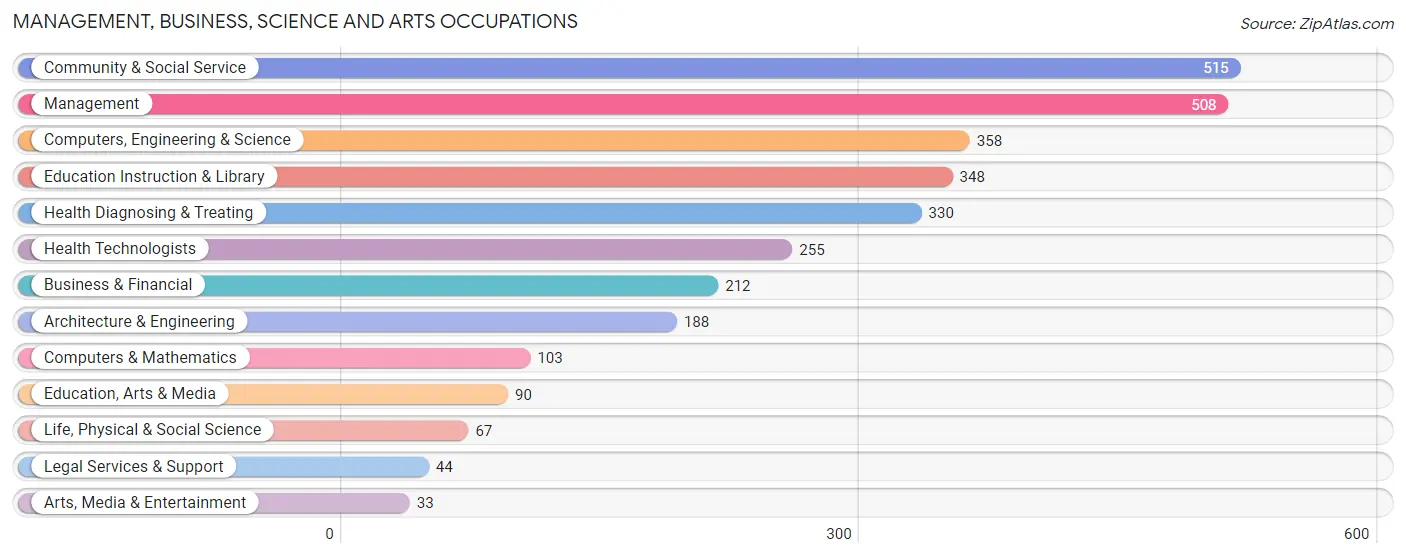
Management, Business, Science and Arts Occupations
The most common Management, Business, Science and Arts occupations in Cheshire Village are Community & Social Service (515 | 17.6%), Management (508 | 17.3%), Computers, Engineering & Science (358 | 12.2%), Education Instruction & Library (348 | 11.9%), and Health Diagnosing & Treating (330 | 11.3%).
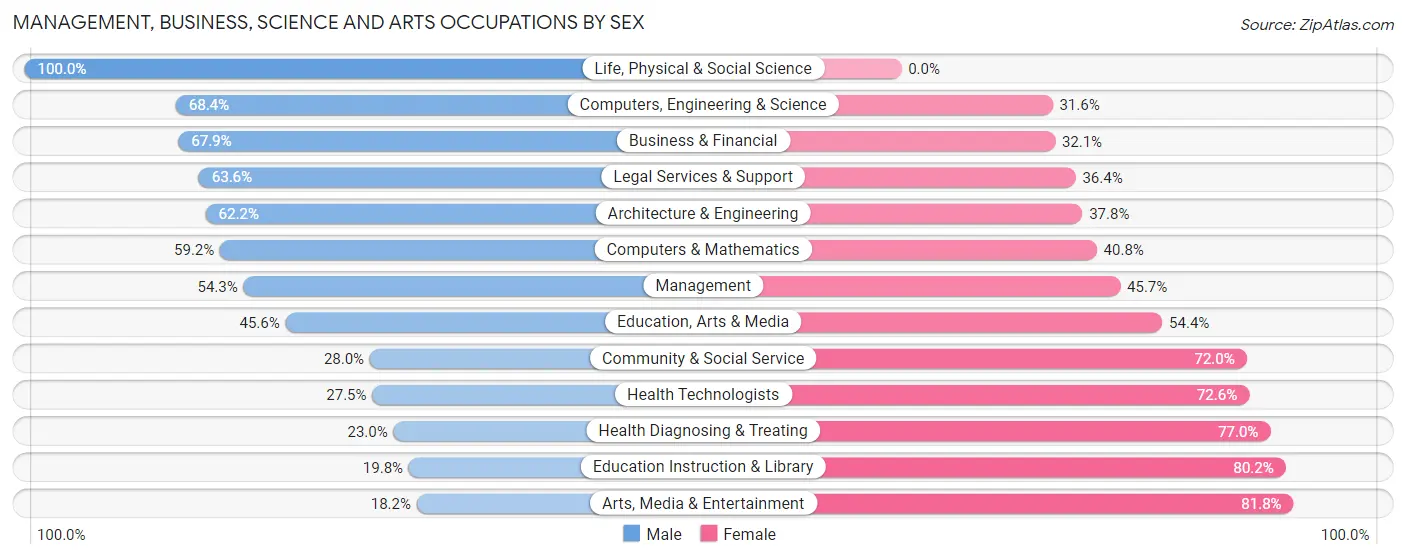
Management, Business, Science and Arts Occupations by Sex
Within the Management, Business, Science and Arts occupations in Cheshire Village, the most male-oriented occupations are Life, Physical & Social Science (100.0%), Computers, Engineering & Science (68.4%), and Business & Financial (67.9%), while the most female-oriented occupations are Arts, Media & Entertainment (81.8%), Education Instruction & Library (80.2%), and Health Diagnosing & Treating (77.0%).
| Occupation | Male | Female |
| Management | 276 (54.3%) | 232 (45.7%) |
| Business & Financial | 144 (67.9%) | 68 (32.1%) |
| Computers, Engineering & Science | 245 (68.4%) | 113 (31.6%) |
| Computers & Mathematics | 61 (59.2%) | 42 (40.8%) |
| Architecture & Engineering | 117 (62.2%) | 71 (37.8%) |
| Life, Physical & Social Science | 67 (100.0%) | 0 (0.0%) |
| Community & Social Service | 144 (28.0%) | 371 (72.0%) |
| Education, Arts & Media | 41 (45.6%) | 49 (54.4%) |
| Legal Services & Support | 28 (63.6%) | 16 (36.4%) |
| Education Instruction & Library | 69 (19.8%) | 279 (80.2%) |
| Arts, Media & Entertainment | 6 (18.2%) | 27 (81.8%) |
| Health Diagnosing & Treating | 76 (23.0%) | 254 (77.0%) |
| Health Technologists | 70 (27.5%) | 185 (72.6%) |
| Total (Category) | 885 (46.0%) | 1,038 (54.0%) |
| Total (Overall) | 1,618 (55.2%) | 1,315 (44.8%) |
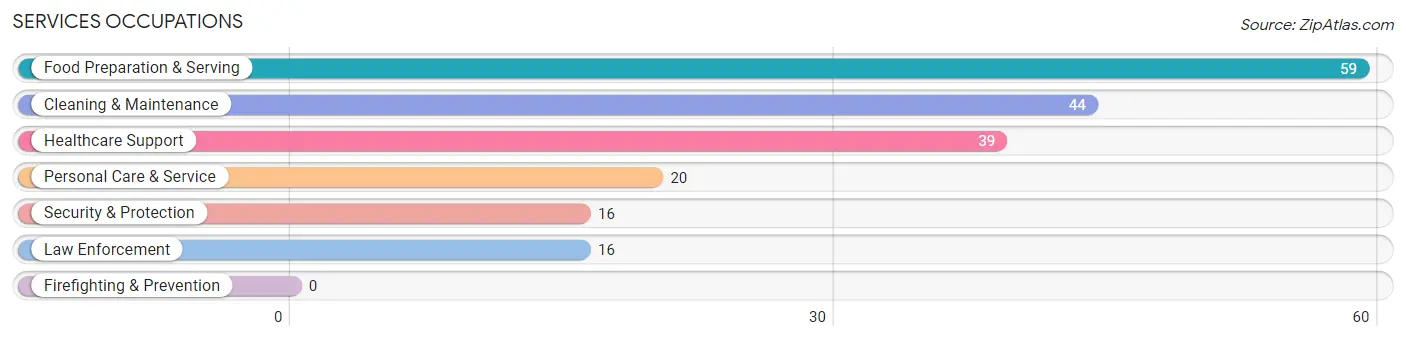
Services Occupations
The most common Services occupations in Cheshire Village are Food Preparation & Serving (59 | 2.0%), Cleaning & Maintenance (44 | 1.5%), Healthcare Support (39 | 1.3%), Personal Care & Service (20 | 0.7%), and Security & Protection (16 | 0.5%).
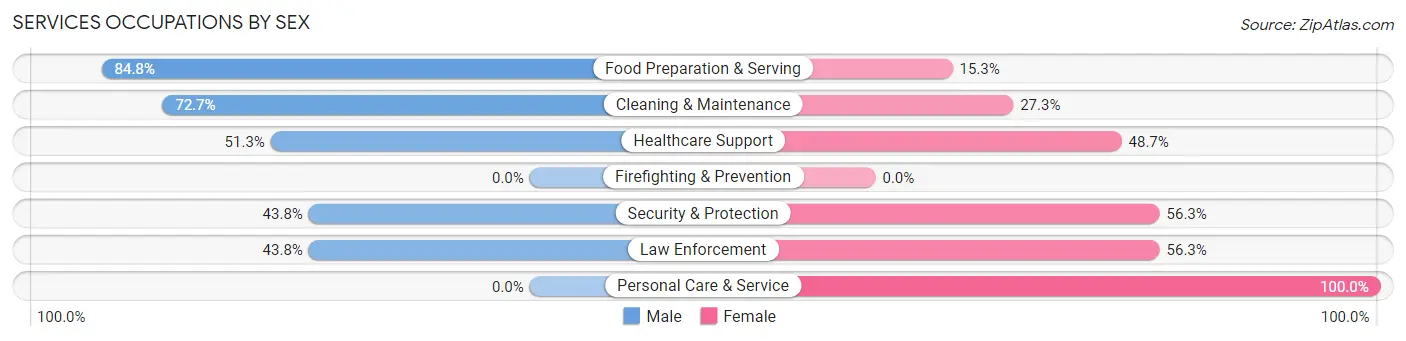
Services Occupations by Sex
Within the Services occupations in Cheshire Village, the most male-oriented occupations are Food Preparation & Serving (84.8%), Cleaning & Maintenance (72.7%), and Healthcare Support (51.3%), while the most female-oriented occupations are Personal Care & Service (100.0%), Security & Protection (56.2%), and Law Enforcement (56.2%).
| Occupation | Male | Female |
| Healthcare Support | 20 (51.3%) | 19 (48.7%) |
| Security & Protection | 7 (43.8%) | 9 (56.2%) |
| Firefighting & Prevention | 0 (0.0%) | 0 (0.0%) |
| Law Enforcement | 7 (43.8%) | 9 (56.2%) |
| Food Preparation & Serving | 50 (84.8%) | 9 (15.2%) |
| Cleaning & Maintenance | 32 (72.7%) | 12 (27.3%) |
| Personal Care & Service | 0 (0.0%) | 20 (100.0%) |
| Total (Category) | 109 (61.2%) | 69 (38.8%) |
| Total (Overall) | 1,618 (55.2%) | 1,315 (44.8%) |
Sales and Office Occupations
The most common Sales and Office occupations in Cheshire Village are Sales & Related (323 | 11.0%), and Office & Administration (194 | 6.6%).

Sales and Office Occupations by Sex
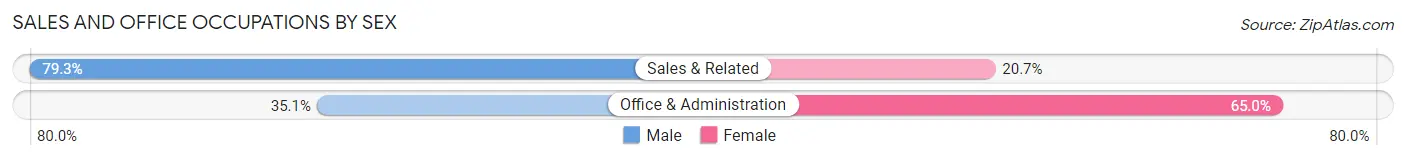
| Occupation | Male | Female |
| Sales & Related | 256 (79.3%) | 67 (20.7%) |
| Office & Administration | 68 (35.0%) | 126 (64.9%) |
| Total (Category) | 324 (62.7%) | 193 (37.3%) |
| Total (Overall) | 1,618 (55.2%) | 1,315 (44.8%) |
Natural Resources, Construction and Maintenance Occupations
The most common Natural Resources, Construction and Maintenance occupations in Cheshire Village are Installation, Maintenance & Repair (61 | 2.1%), Construction & Extraction (59 | 2.0%), and Farming, Fishing & Forestry (39 | 1.3%).

Natural Resources, Construction and Maintenance Occupations by Sex
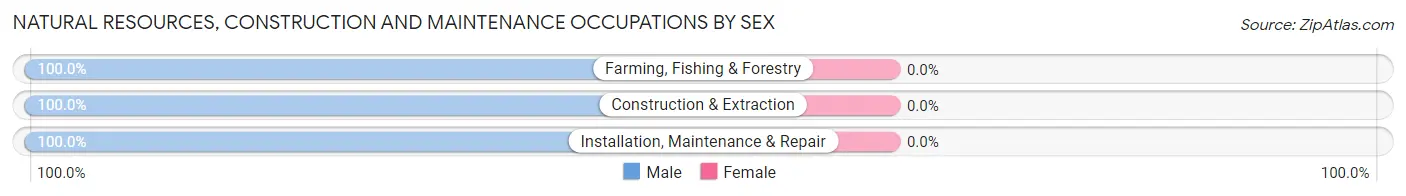
| Occupation | Male | Female |
| Farming, Fishing & Forestry | 39 (100.0%) | 0 (0.0%) |
| Construction & Extraction | 59 (100.0%) | 0 (0.0%) |
| Installation, Maintenance & Repair | 61 (100.0%) | 0 (0.0%) |
| Total (Category) | 159 (100.0%) | 0 (0.0%) |
| Total (Overall) | 1,618 (55.2%) | 1,315 (44.8%) |
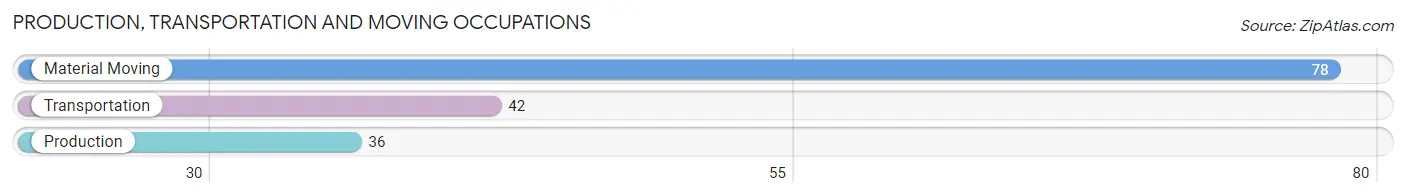
Production, Transportation and Moving Occupations
The most common Production, Transportation and Moving occupations in Cheshire Village are Material Moving (78 | 2.7%), Transportation (42 | 1.4%), and Production (36 | 1.2%).
Production, Transportation and Moving Occupations by Sex
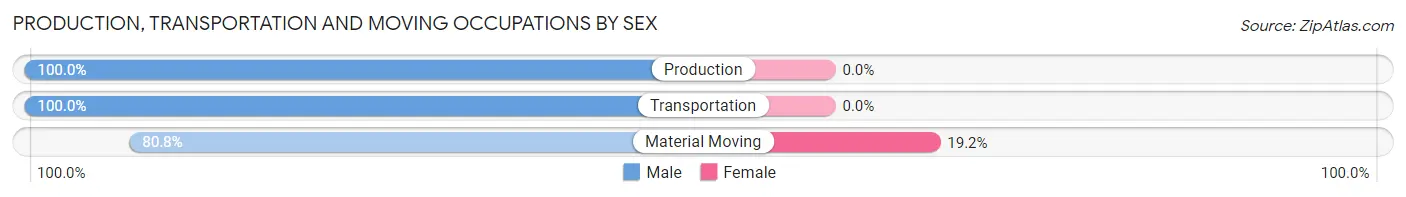
| Occupation | Male | Female |
| Production | 36 (100.0%) | 0 (0.0%) |
| Transportation | 42 (100.0%) | 0 (0.0%) |
| Material Moving | 63 (80.8%) | 15 (19.2%) |
| Total (Category) | 141 (90.4%) | 15 (9.6%) |
| Total (Overall) | 1,618 (55.2%) | 1,315 (44.8%) |
Employment Industries by Sex in Cheshire Village
Employment Industries in Cheshire Village
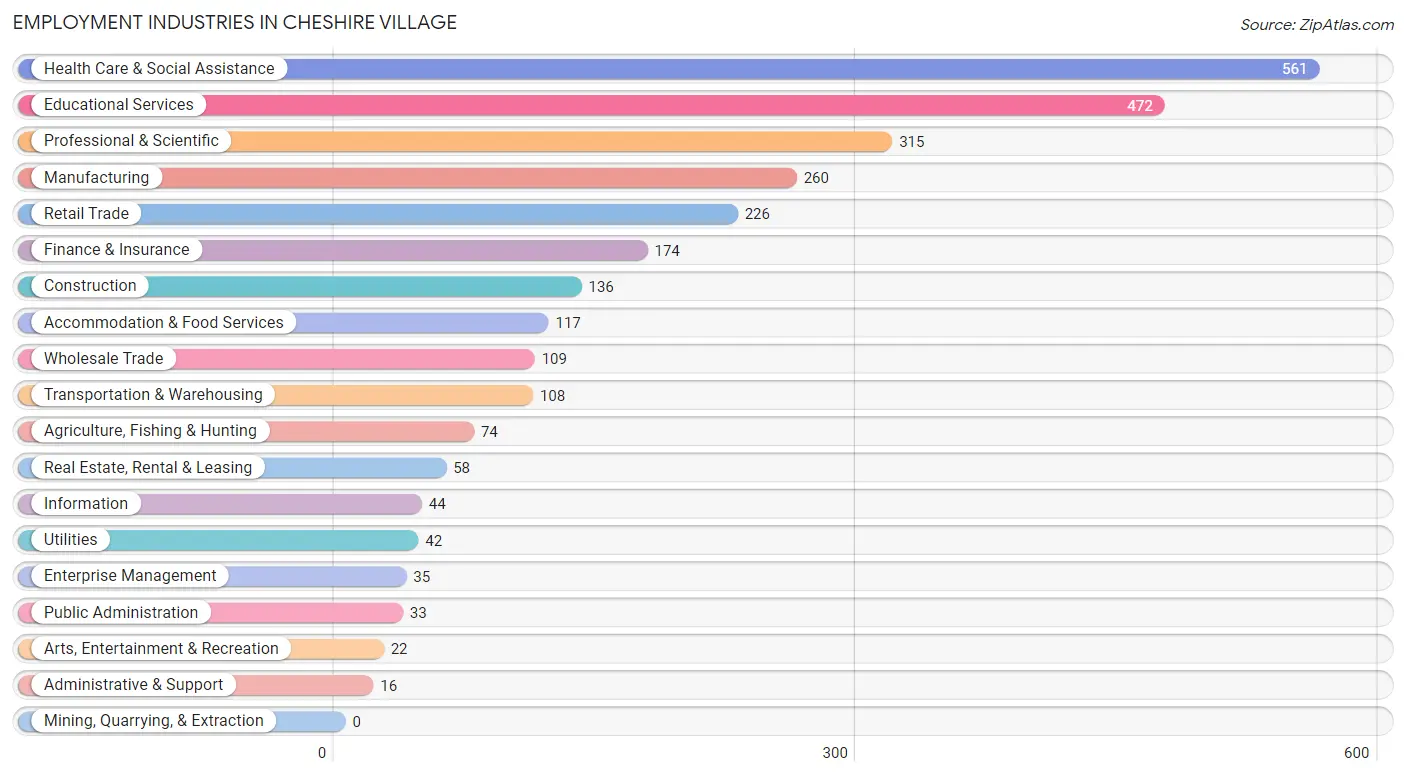
The major employment industries in Cheshire Village include Health Care & Social Assistance (561 | 19.1%), Educational Services (472 | 16.1%), Professional & Scientific (315 | 10.7%), Manufacturing (260 | 8.9%), and Retail Trade (226 | 7.7%).
Employment Industries by Sex in Cheshire Village
The Cheshire Village industries that see more men than women are Agriculture, Fishing & Hunting (100.0%), Construction (100.0%), and Transportation & Warehousing (100.0%), whereas the industries that tend to have a higher number of women are Real Estate, Rental & Leasing (86.2%), Educational Services (73.7%), and Health Care & Social Assistance (66.7%).
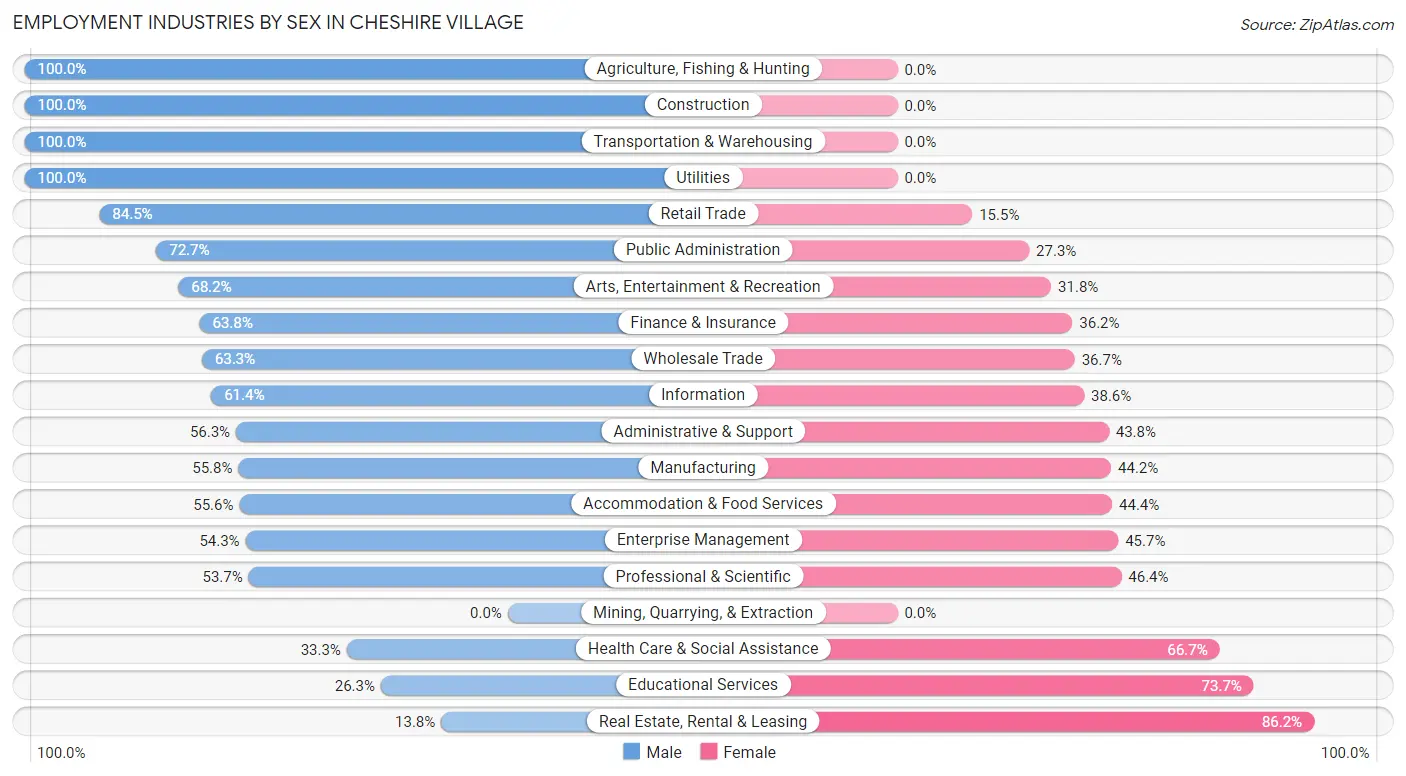
| Industry | Male | Female |
| Agriculture, Fishing & Hunting | 74 (100.0%) | 0 (0.0%) |
| Mining, Quarrying, & Extraction | 0 (0.0%) | 0 (0.0%) |
| Construction | 136 (100.0%) | 0 (0.0%) |
| Manufacturing | 145 (55.8%) | 115 (44.2%) |
| Wholesale Trade | 69 (63.3%) | 40 (36.7%) |
| Retail Trade | 191 (84.5%) | 35 (15.5%) |
| Transportation & Warehousing | 108 (100.0%) | 0 (0.0%) |
| Utilities | 42 (100.0%) | 0 (0.0%) |
| Information | 27 (61.4%) | 17 (38.6%) |
| Finance & Insurance | 111 (63.8%) | 63 (36.2%) |
| Real Estate, Rental & Leasing | 8 (13.8%) | 50 (86.2%) |
| Professional & Scientific | 169 (53.6%) | 146 (46.4%) |
| Enterprise Management | 19 (54.3%) | 16 (45.7%) |
| Administrative & Support | 9 (56.2%) | 7 (43.8%) |
| Educational Services | 124 (26.3%) | 348 (73.7%) |
| Health Care & Social Assistance | 187 (33.3%) | 374 (66.7%) |
| Arts, Entertainment & Recreation | 15 (68.2%) | 7 (31.8%) |
| Accommodation & Food Services | 65 (55.6%) | 52 (44.4%) |
| Public Administration | 24 (72.7%) | 9 (27.3%) |
| Total | 1,618 (55.2%) | 1,315 (44.8%) |
Education in Cheshire Village
School Enrollment in Cheshire Village
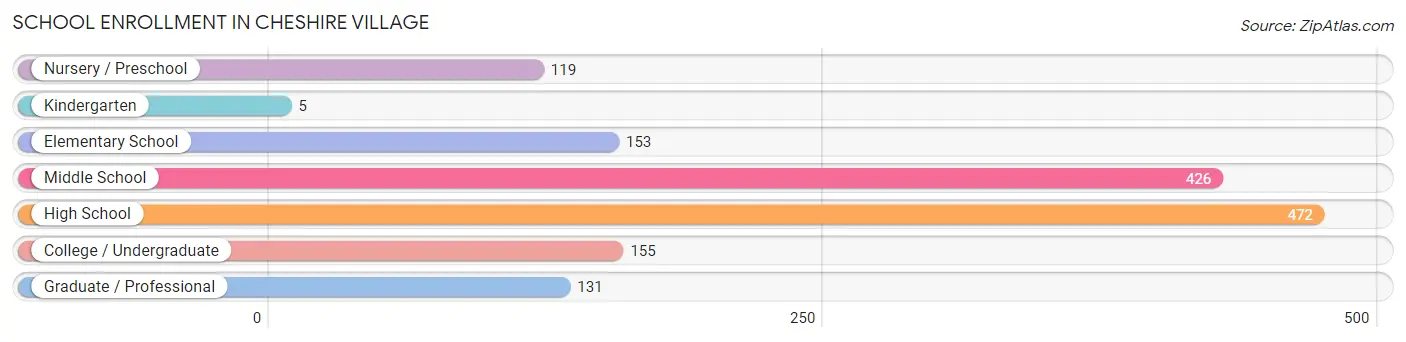
The most common levels of schooling among the 1,461 students in Cheshire Village are high school (472 | 32.3%), middle school (426 | 29.2%), and college / undergraduate (155 | 10.6%).
| School Level | # Students | % Students |
| Nursery / Preschool | 119 | 8.2% |
| Kindergarten | 5 | 0.3% |
| Elementary School | 153 | 10.5% |
| Middle School | 426 | 29.2% |
| High School | 472 | 32.3% |
| College / Undergraduate | 155 | 10.6% |
| Graduate / Professional | 131 | 9.0% |
| Total | 1,461 | 100.0% |
School Enrollment by Age by Funding Source in Cheshire Village
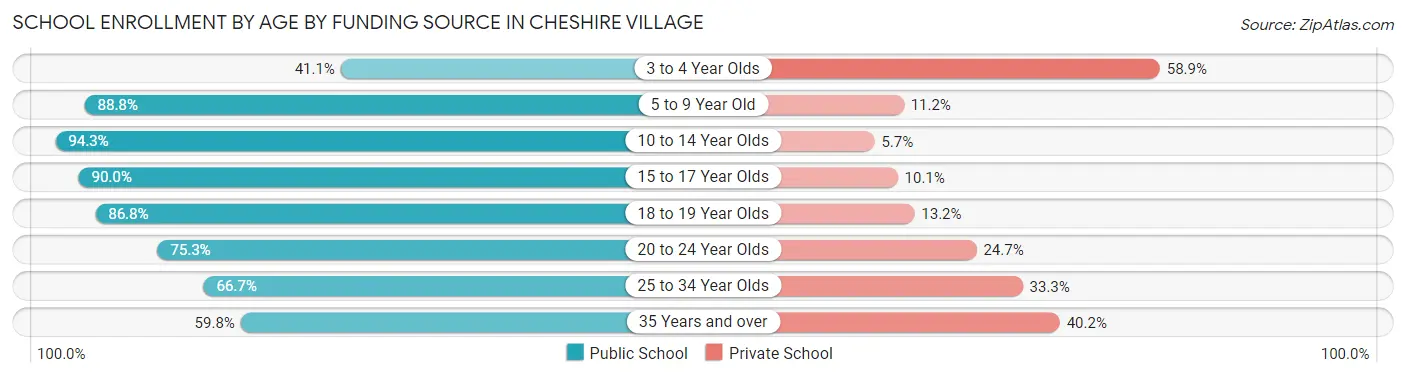
Out of a total of 1,461 students who are enrolled in schools in Cheshire Village, 244 (16.7%) attend a private institution, while the remaining 1,217 (83.3%) are enrolled in public schools. The age group of 3 to 4 year olds has the highest likelihood of being enrolled in private schools, with 63 (58.9% in the age bracket) enrolled. Conversely, the age group of 10 to 14 year olds has the lowest likelihood of being enrolled in a private school, with 460 (94.3% in the age bracket) attending a public institution.
| Age Bracket | Public School | Private School |
| 3 to 4 Year Olds | 44 (41.1%) | 63 (58.9%) |
| 5 to 9 Year Old | 151 (88.8%) | 19 (11.2%) |
| 10 to 14 Year Olds | 460 (94.3%) | 28 (5.7%) |
| 15 to 17 Year Olds | 179 (89.9%) | 20 (10.1%) |
| 18 to 19 Year Olds | 211 (86.8%) | 32 (13.2%) |
| 20 to 24 Year Olds | 73 (75.3%) | 24 (24.7%) |
| 25 to 34 Year Olds | 50 (66.7%) | 25 (33.3%) |
| 35 Years and over | 49 (59.8%) | 33 (40.2%) |
| Total | 1,217 (83.3%) | 244 (16.7%) |
Educational Attainment by Field of Study in Cheshire Village
Engineering (384 | 14.0%), business (377 | 13.8%), education (353 | 12.9%), science & technology (341 | 12.4%), and literature & languages (166 | 6.0%) are the most common fields of study among 2,742 individuals in Cheshire Village who have obtained a bachelor's degree or higher.
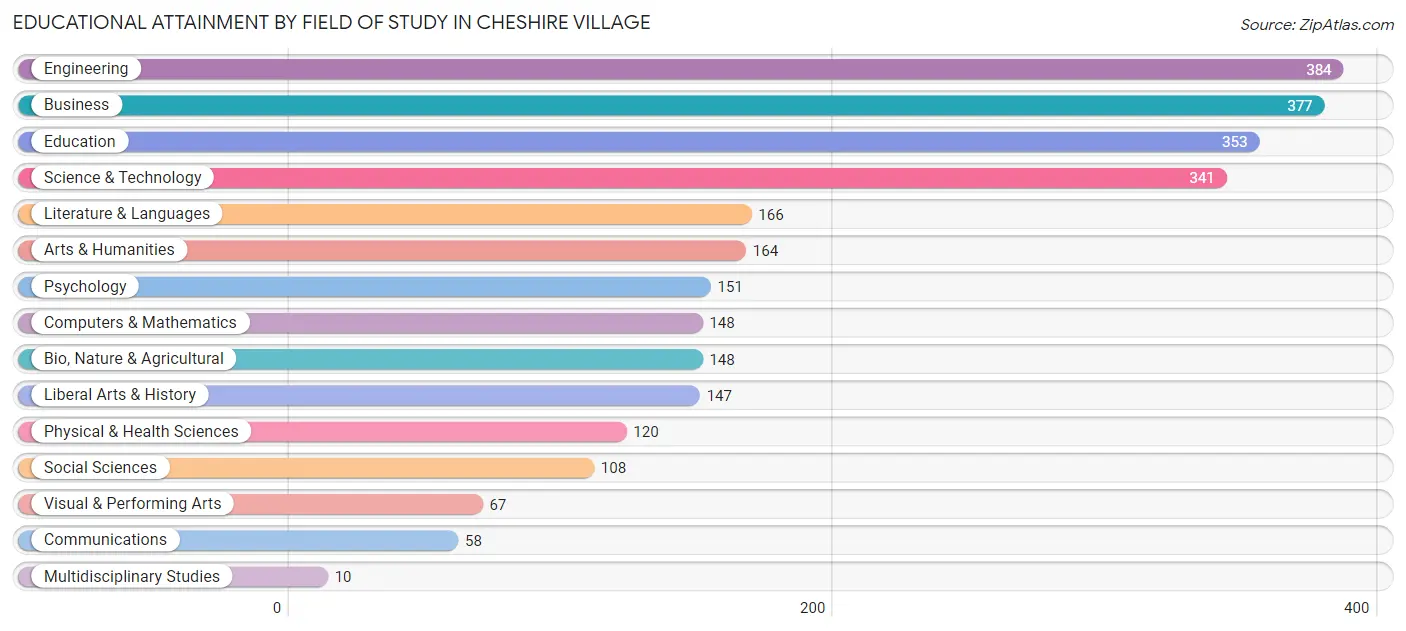
| Field of Study | # Graduates | % Graduates |
| Computers & Mathematics | 148 | 5.4% |
| Bio, Nature & Agricultural | 148 | 5.4% |
| Physical & Health Sciences | 120 | 4.4% |
| Psychology | 151 | 5.5% |
| Social Sciences | 108 | 3.9% |
| Engineering | 384 | 14.0% |
| Multidisciplinary Studies | 10 | 0.4% |
| Science & Technology | 341 | 12.4% |
| Business | 377 | 13.8% |
| Education | 353 | 12.9% |
| Literature & Languages | 166 | 6.0% |
| Liberal Arts & History | 147 | 5.4% |
| Visual & Performing Arts | 67 | 2.4% |
| Communications | 58 | 2.1% |
| Arts & Humanities | 164 | 6.0% |
| Total | 2,742 | 100.0% |
Transportation & Commute in Cheshire Village
Vehicle Availability by Sex in Cheshire Village
The most prevalent vehicle ownership categories in Cheshire Village are males with 2 vehicles (701, accounting for 44.7%) and females with 2 vehicles (489, making up 54.6%).
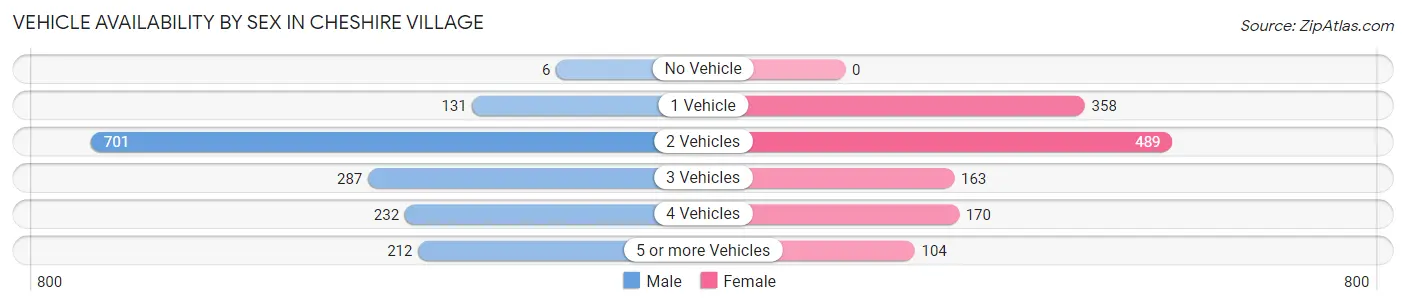
| Vehicles Available | Male | Female |
| No Vehicle | 6 (0.4%) | 0 (0.0%) |
| 1 Vehicle | 131 (8.4%) | 358 (27.9%) |
| 2 Vehicles | 701 (44.7%) | 489 (38.1%) |
| 3 Vehicles | 287 (18.3%) | 163 (12.7%) |
| 4 Vehicles | 232 (14.8%) | 170 (13.2%) |
| 5 or more Vehicles | 212 (13.5%) | 104 (8.1%) |
| Total | 1,569 (100.0%) | 1,284 (100.0%) |
Commute Time in Cheshire Village
The most frequently occuring commute durations in Cheshire Village are 30 to 34 minutes (387 commuters, 14.8%), 45 to 59 minutes (384 commuters, 14.7%), and 20 to 24 minutes (353 commuters, 13.5%).
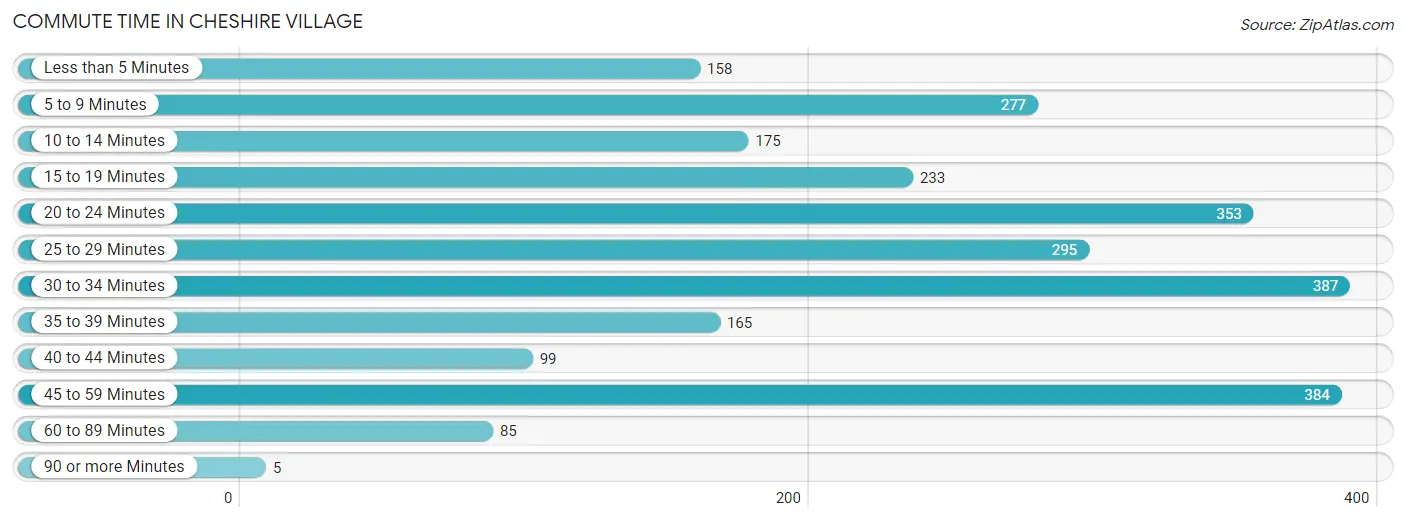
| Commute Time | # Commuters | % Commuters |
| Less than 5 Minutes | 158 | 6.0% |
| 5 to 9 Minutes | 277 | 10.6% |
| 10 to 14 Minutes | 175 | 6.7% |
| 15 to 19 Minutes | 233 | 8.9% |
| 20 to 24 Minutes | 353 | 13.5% |
| 25 to 29 Minutes | 295 | 11.3% |
| 30 to 34 Minutes | 387 | 14.8% |
| 35 to 39 Minutes | 165 | 6.3% |
| 40 to 44 Minutes | 99 | 3.8% |
| 45 to 59 Minutes | 384 | 14.7% |
| 60 to 89 Minutes | 85 | 3.3% |
| 90 or more Minutes | 5 | 0.2% |
Commute Time by Sex in Cheshire Village
The most common commute times in Cheshire Village are 20 to 24 minutes (229 commuters, 16.1%) for males and 5 to 9 minutes (190 commuters, 15.9%) for females.
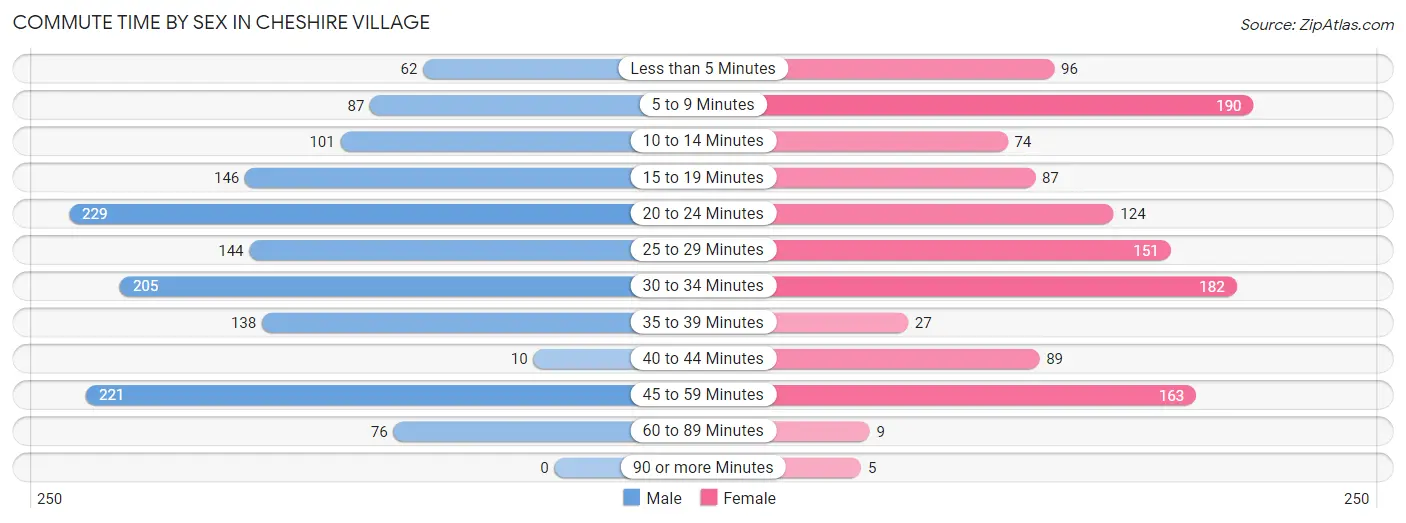
| Commute Time | Male | Female |
| Less than 5 Minutes | 62 (4.4%) | 96 (8.0%) |
| 5 to 9 Minutes | 87 (6.1%) | 190 (15.9%) |
| 10 to 14 Minutes | 101 (7.1%) | 74 (6.2%) |
| 15 to 19 Minutes | 146 (10.3%) | 87 (7.3%) |
| 20 to 24 Minutes | 229 (16.1%) | 124 (10.4%) |
| 25 to 29 Minutes | 144 (10.2%) | 151 (12.6%) |
| 30 to 34 Minutes | 205 (14.4%) | 182 (15.2%) |
| 35 to 39 Minutes | 138 (9.7%) | 27 (2.3%) |
| 40 to 44 Minutes | 10 (0.7%) | 89 (7.4%) |
| 45 to 59 Minutes | 221 (15.6%) | 163 (13.6%) |
| 60 to 89 Minutes | 76 (5.4%) | 9 (0.7%) |
| 90 or more Minutes | 0 (0.0%) | 5 (0.4%) |
Time of Departure to Work by Sex in Cheshire Village
The most frequent times of departure to work in Cheshire Village are 8:00 AM to 8:29 AM (258, 18.2%) for males and 7:30 AM to 7:59 AM (268, 22.4%) for females.
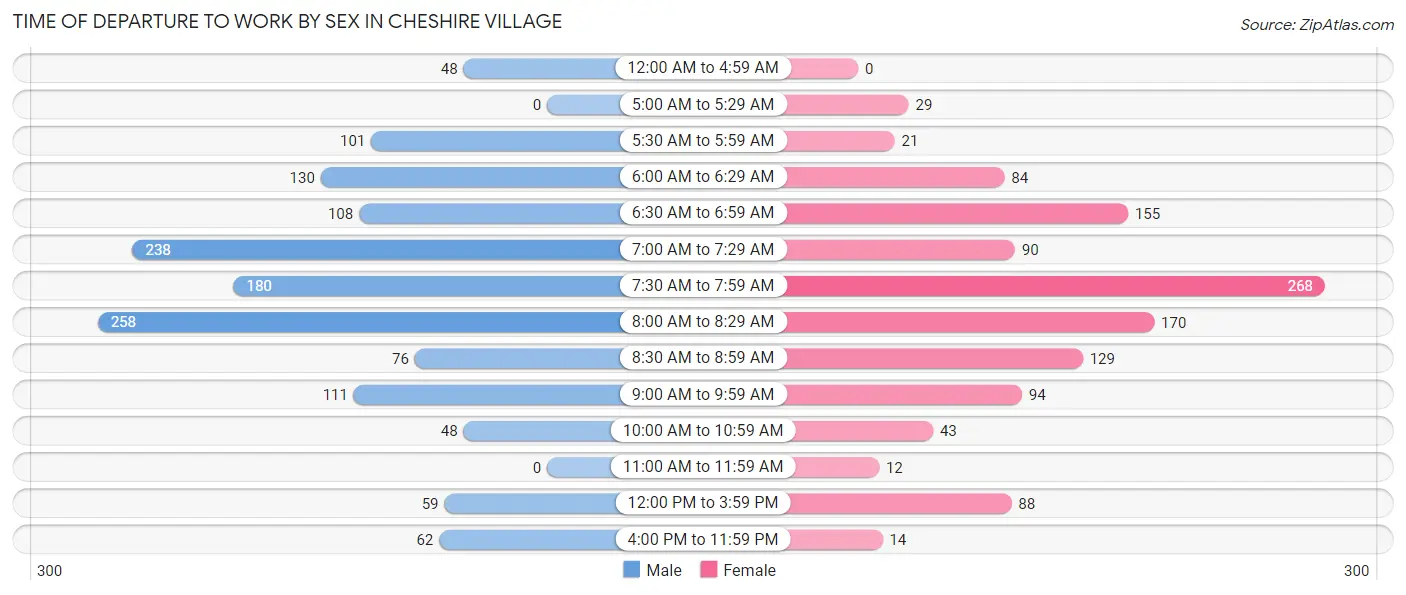
| Time of Departure | Male | Female |
| 12:00 AM to 4:59 AM | 48 (3.4%) | 0 (0.0%) |
| 5:00 AM to 5:29 AM | 0 (0.0%) | 29 (2.4%) |
| 5:30 AM to 5:59 AM | 101 (7.1%) | 21 (1.8%) |
| 6:00 AM to 6:29 AM | 130 (9.2%) | 84 (7.0%) |
| 6:30 AM to 6:59 AM | 108 (7.6%) | 155 (13.0%) |
| 7:00 AM to 7:29 AM | 238 (16.8%) | 90 (7.5%) |
| 7:30 AM to 7:59 AM | 180 (12.7%) | 268 (22.4%) |
| 8:00 AM to 8:29 AM | 258 (18.2%) | 170 (14.2%) |
| 8:30 AM to 8:59 AM | 76 (5.4%) | 129 (10.8%) |
| 9:00 AM to 9:59 AM | 111 (7.8%) | 94 (7.9%) |
| 10:00 AM to 10:59 AM | 48 (3.4%) | 43 (3.6%) |
| 11:00 AM to 11:59 AM | 0 (0.0%) | 12 (1.0%) |
| 12:00 PM to 3:59 PM | 59 (4.2%) | 88 (7.3%) |
| 4:00 PM to 11:59 PM | 62 (4.4%) | 14 (1.2%) |
| Total | 1,419 (100.0%) | 1,197 (100.0%) |
Housing Occupancy in Cheshire Village
Occupancy by Ownership in Cheshire Village
Of the total 2,449 dwellings in Cheshire Village, owner-occupied units account for 1,788 (73.0%), while renter-occupied units make up 661 (27.0%).
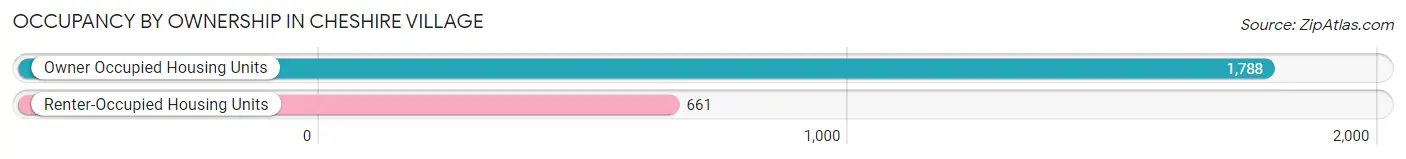
| Occupancy | # Housing Units | % Housing Units |
| Owner Occupied Housing Units | 1,788 | 73.0% |
| Renter-Occupied Housing Units | 661 | 27.0% |
| Total Occupied Housing Units | 2,449 | 100.0% |
Occupancy by Household Size in Cheshire Village
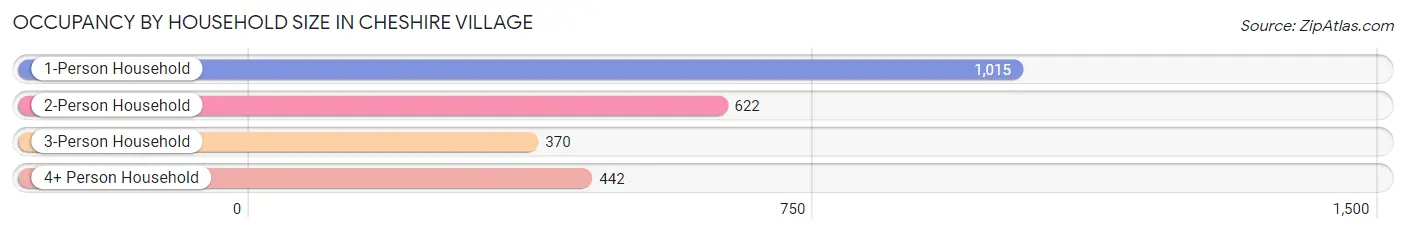
| Household Size | # Housing Units | % Housing Units |
| 1-Person Household | 1,015 | 41.4% |
| 2-Person Household | 622 | 25.4% |
| 3-Person Household | 370 | 15.1% |
| 4+ Person Household | 442 | 18.0% |
| Total Housing Units | 2,449 | 100.0% |
Occupancy by Ownership by Household Size in Cheshire Village
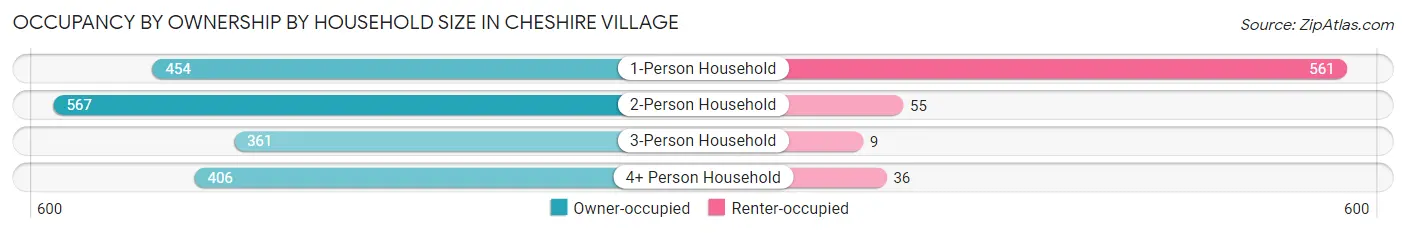
| Household Size | Owner-occupied | Renter-occupied |
| 1-Person Household | 454 (44.7%) | 561 (55.3%) |
| 2-Person Household | 567 (91.2%) | 55 (8.8%) |
| 3-Person Household | 361 (97.6%) | 9 (2.4%) |
| 4+ Person Household | 406 (91.9%) | 36 (8.1%) |
| Total Housing Units | 1,788 (73.0%) | 661 (27.0%) |
Occupancy by Educational Attainment in Cheshire Village
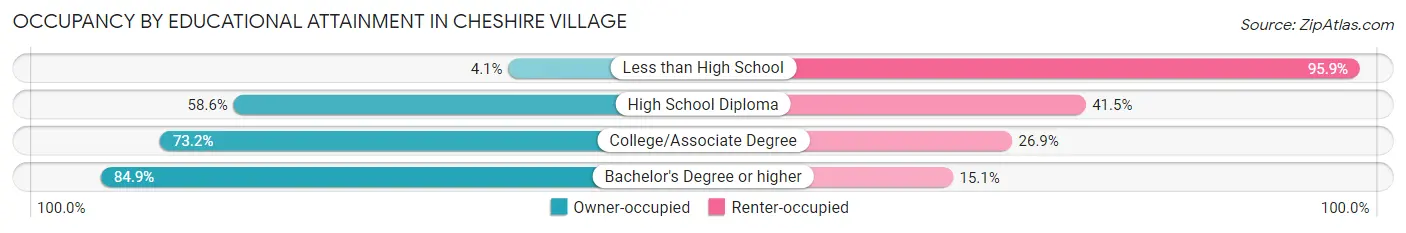
| Household Size | Owner-occupied | Renter-occupied |
| Less than High School | 7 (4.1%) | 164 (95.9%) |
| High School Diploma | 226 (58.6%) | 160 (41.4%) |
| College/Associate Degree | 316 (73.2%) | 116 (26.9%) |
| Bachelor's Degree or higher | 1,239 (84.9%) | 221 (15.1%) |
Occupancy by Age of Householder in Cheshire Village

| Age Bracket | # Households | % Households |
| Under 35 Years | 223 | 9.1% |
| 35 to 44 Years | 311 | 12.7% |
| 45 to 54 Years | 566 | 23.1% |
| 55 to 64 Years | 441 | 18.0% |
| 65 to 74 Years | 500 | 20.4% |
| 75 to 84 Years | 252 | 10.3% |
| 85 Years and Over | 156 | 6.4% |
| Total | 2,449 | 100.0% |
Housing Finances in Cheshire Village
Median Income by Occupancy in Cheshire Village
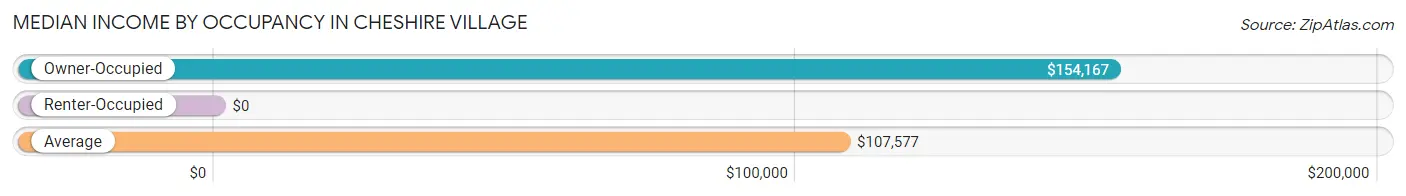
| Occupancy Type | # Households | Median Income |
| Owner-Occupied | 1,788 (73.0%) | $154,167 |
| Renter-Occupied | 661 (27.0%) | $0 |
| Average | 2,449 (100.0%) | $107,577 |
Occupancy by Householder Income Bracket in Cheshire Village
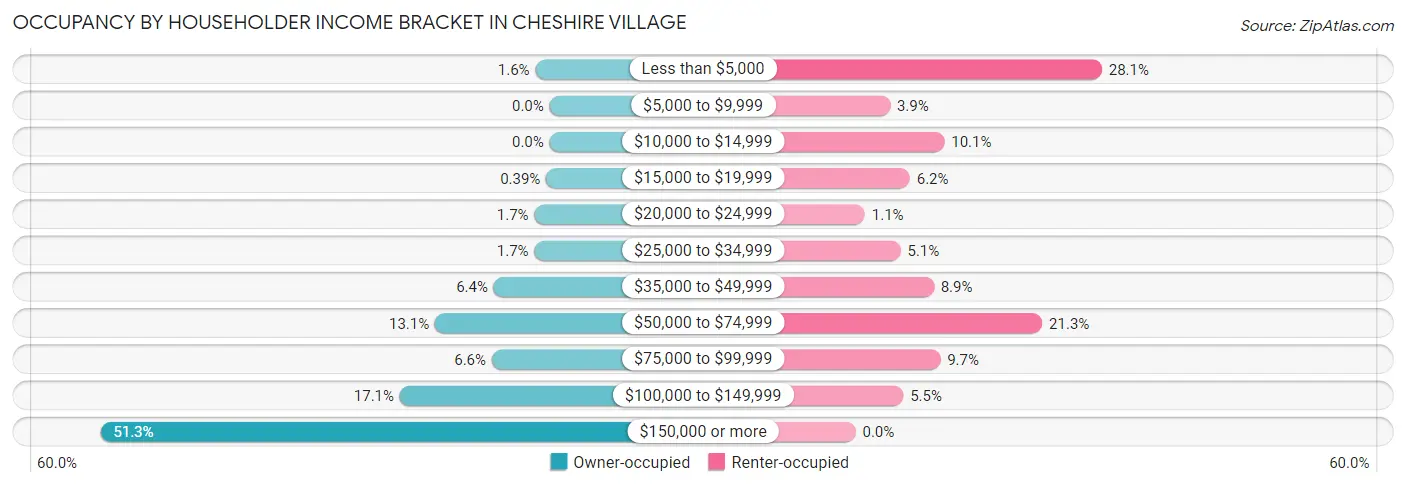
| Income Bracket | Owner-occupied | Renter-occupied |
| Less than $5,000 | 29 (1.6%) | 186 (28.1%) |
| $5,000 to $9,999 | 0 (0.0%) | 26 (3.9%) |
| $10,000 to $14,999 | 0 (0.0%) | 67 (10.1%) |
| $15,000 to $19,999 | 7 (0.4%) | 41 (6.2%) |
| $20,000 to $24,999 | 31 (1.7%) | 7 (1.1%) |
| $25,000 to $34,999 | 31 (1.7%) | 34 (5.1%) |
| $35,000 to $49,999 | 114 (6.4%) | 59 (8.9%) |
| $50,000 to $74,999 | 234 (13.1%) | 141 (21.3%) |
| $75,000 to $99,999 | 118 (6.6%) | 64 (9.7%) |
| $100,000 to $149,999 | 306 (17.1%) | 36 (5.4%) |
| $150,000 or more | 918 (51.3%) | 0 (0.0%) |
| Total | 1,788 (100.0%) | 661 (100.0%) |
Monthly Housing Cost Tiers in Cheshire Village
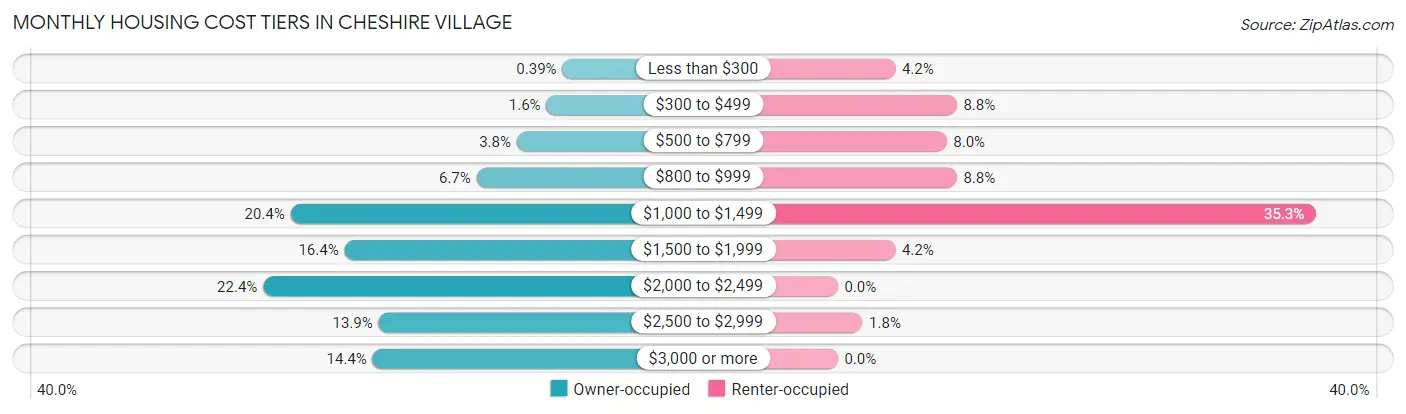
| Monthly Cost | Owner-occupied | Renter-occupied |
| Less than $300 | 7 (0.4%) | 28 (4.2%) |
| $300 to $499 | 28 (1.6%) | 58 (8.8%) |
| $500 to $799 | 67 (3.7%) | 53 (8.0%) |
| $800 to $999 | 120 (6.7%) | 58 (8.8%) |
| $1,000 to $1,499 | 365 (20.4%) | 233 (35.2%) |
| $1,500 to $1,999 | 294 (16.4%) | 28 (4.2%) |
| $2,000 to $2,499 | 401 (22.4%) | 0 (0.0%) |
| $2,500 to $2,999 | 249 (13.9%) | 12 (1.8%) |
| $3,000 or more | 257 (14.4%) | 0 (0.0%) |
| Total | 1,788 (100.0%) | 661 (100.0%) |
Physical Housing Characteristics in Cheshire Village
Housing Structures in Cheshire Village
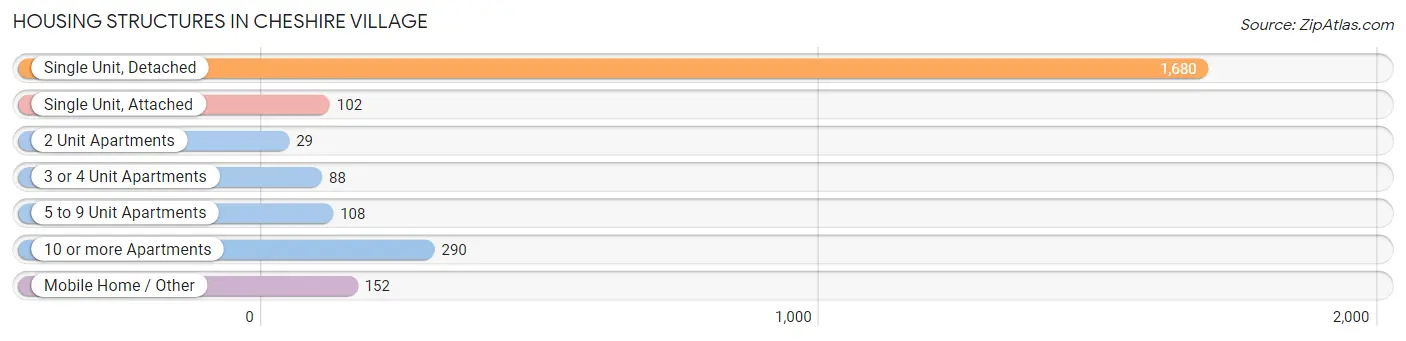
| Structure Type | # Housing Units | % Housing Units |
| Single Unit, Detached | 1,680 | 68.6% |
| Single Unit, Attached | 102 | 4.2% |
| 2 Unit Apartments | 29 | 1.2% |
| 3 or 4 Unit Apartments | 88 | 3.6% |
| 5 to 9 Unit Apartments | 108 | 4.4% |
| 10 or more Apartments | 290 | 11.8% |
| Mobile Home / Other | 152 | 6.2% |
| Total | 2,449 | 100.0% |
Housing Structures by Occupancy in Cheshire Village
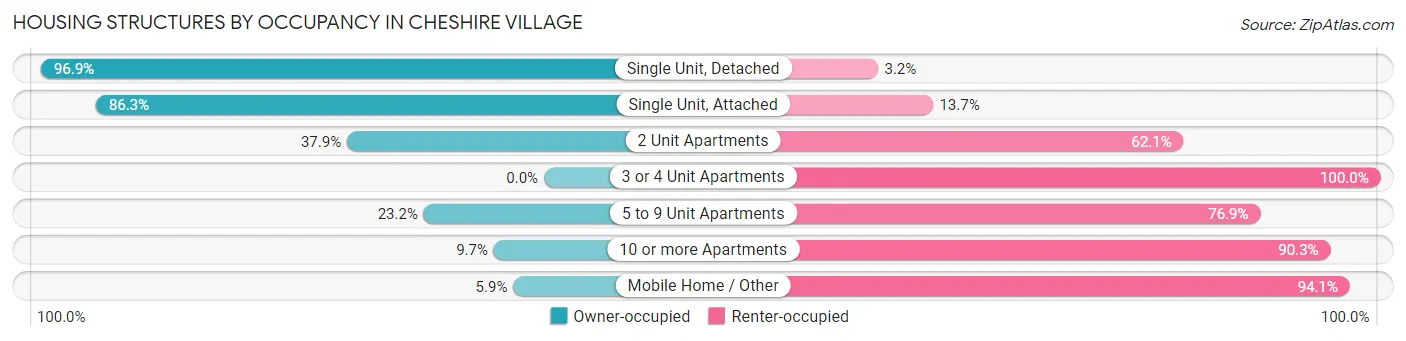
| Structure Type | Owner-occupied | Renter-occupied |
| Single Unit, Detached | 1,627 (96.9%) | 53 (3.2%) |
| Single Unit, Attached | 88 (86.3%) | 14 (13.7%) |
| 2 Unit Apartments | 11 (37.9%) | 18 (62.1%) |
| 3 or 4 Unit Apartments | 0 (0.0%) | 88 (100.0%) |
| 5 to 9 Unit Apartments | 25 (23.2%) | 83 (76.8%) |
| 10 or more Apartments | 28 (9.7%) | 262 (90.3%) |
| Mobile Home / Other | 9 (5.9%) | 143 (94.1%) |
| Total | 1,788 (73.0%) | 661 (27.0%) |
Housing Structures by Number of Rooms in Cheshire Village
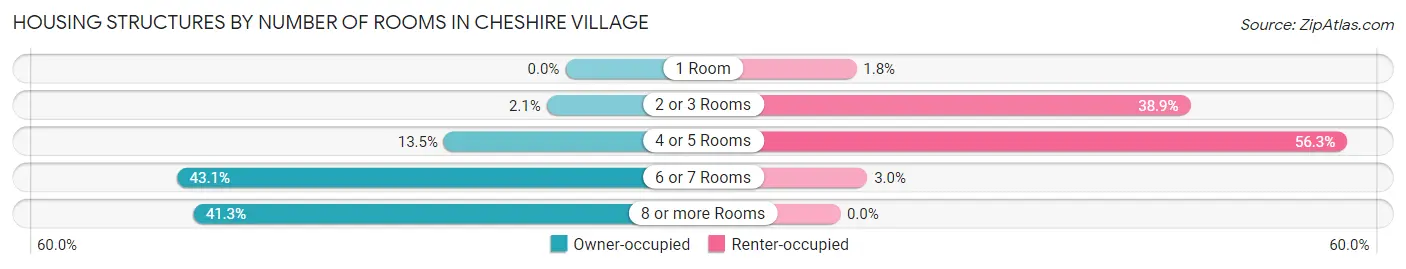
| Number of Rooms | Owner-occupied | Renter-occupied |
| 1 Room | 0 (0.0%) | 12 (1.8%) |
| 2 or 3 Rooms | 37 (2.1%) | 257 (38.9%) |
| 4 or 5 Rooms | 241 (13.5%) | 372 (56.3%) |
| 6 or 7 Rooms | 771 (43.1%) | 20 (3.0%) |
| 8 or more Rooms | 739 (41.3%) | 0 (0.0%) |
| Total | 1,788 (100.0%) | 661 (100.0%) |
Housing Structure by Heating Type in Cheshire Village

| Heating Type | Owner-occupied | Renter-occupied |
| Utility Gas | 326 (18.2%) | 117 (17.7%) |
| Bottled, Tank, or LP Gas | 61 (3.4%) | 12 (1.8%) |
| Electricity | 125 (7.0%) | 335 (50.7%) |
| Fuel Oil or Kerosene | 1,230 (68.8%) | 197 (29.8%) |
| Coal or Coke | 0 (0.0%) | 0 (0.0%) |
| All other Fuels | 46 (2.6%) | 0 (0.0%) |
| No Fuel Used | 0 (0.0%) | 0 (0.0%) |
| Total | 1,788 (100.0%) | 661 (100.0%) |
Household Vehicle Usage in Cheshire Village
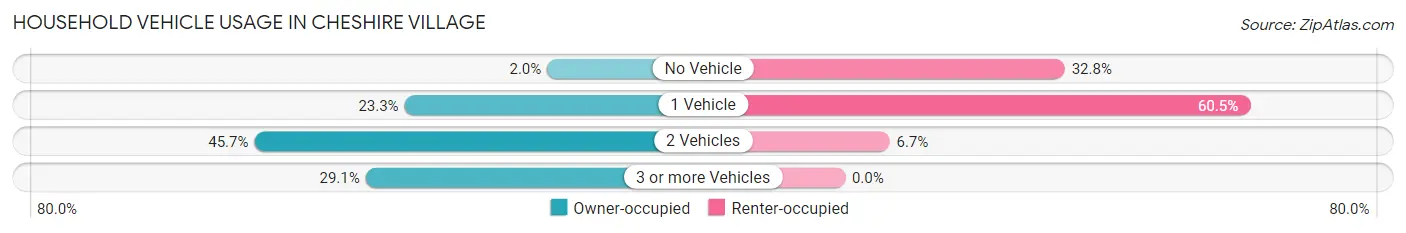
| Vehicles per Household | Owner-occupied | Renter-occupied |
| No Vehicle | 35 (2.0%) | 217 (32.8%) |
| 1 Vehicle | 416 (23.3%) | 400 (60.5%) |
| 2 Vehicles | 817 (45.7%) | 44 (6.7%) |
| 3 or more Vehicles | 520 (29.1%) | 0 (0.0%) |
| Total | 1,788 (100.0%) | 661 (100.0%) |
Real Estate & Mortgages in Cheshire Village
Real Estate and Mortgage Overview in Cheshire Village
| Characteristic | Without Mortgage | With Mortgage |
| Housing Units | 655 | 1,133 |
| Median Property Value | $370,500 | $382,200 |
| Median Household Income | $124,464 | $645 |
| Monthly Housing Costs | $1,188 | $257 |
| Real Estate Taxes | $7,176 | $0 |
Property Value by Mortgage Status in Cheshire Village
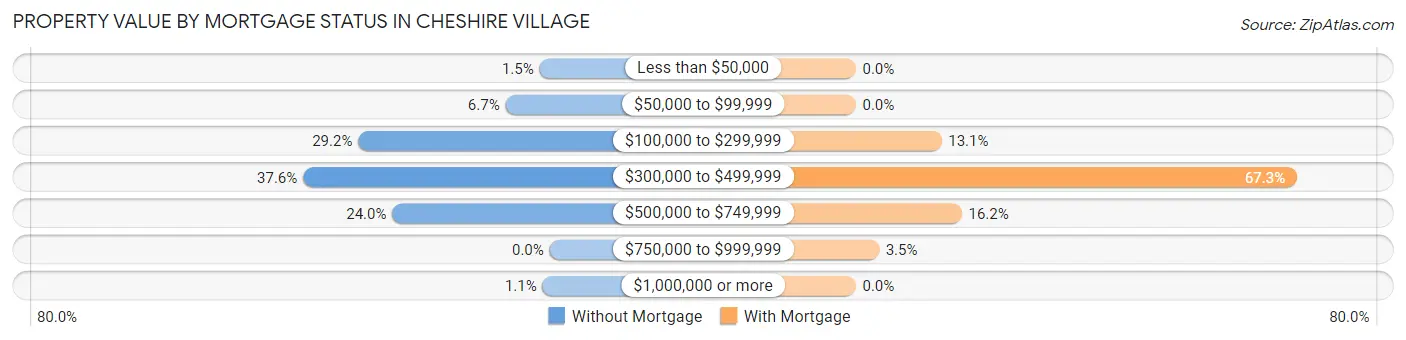
| Property Value | Without Mortgage | With Mortgage |
| Less than $50,000 | 10 (1.5%) | 0 (0.0%) |
| $50,000 to $99,999 | 44 (6.7%) | 0 (0.0%) |
| $100,000 to $299,999 | 191 (29.2%) | 148 (13.1%) |
| $300,000 to $499,999 | 246 (37.6%) | 762 (67.3%) |
| $500,000 to $749,999 | 157 (24.0%) | 183 (16.2%) |
| $750,000 to $999,999 | 0 (0.0%) | 40 (3.5%) |
| $1,000,000 or more | 7 (1.1%) | 0 (0.0%) |
| Total | 655 (100.0%) | 1,133 (100.0%) |
Household Income by Mortgage Status in Cheshire Village
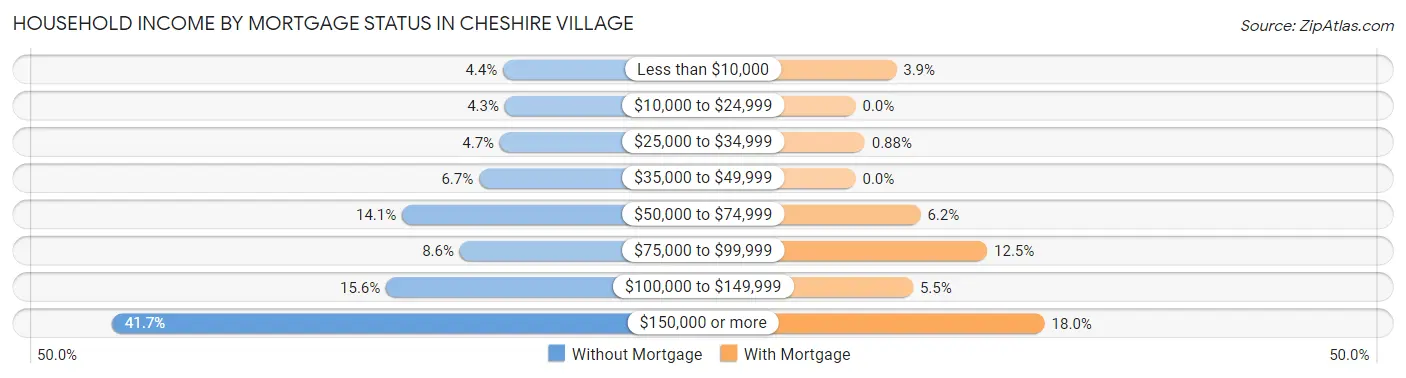
| Household Income | Without Mortgage | With Mortgage |
| Less than $10,000 | 29 (4.4%) | 44 (3.9%) |
| $10,000 to $24,999 | 28 (4.3%) | 0 (0.0%) |
| $25,000 to $34,999 | 31 (4.7%) | 10 (0.9%) |
| $35,000 to $49,999 | 44 (6.7%) | 0 (0.0%) |
| $50,000 to $74,999 | 92 (14.1%) | 70 (6.2%) |
| $75,000 to $99,999 | 56 (8.6%) | 142 (12.5%) |
| $100,000 to $149,999 | 102 (15.6%) | 62 (5.5%) |
| $150,000 or more | 273 (41.7%) | 204 (18.0%) |
| Total | 655 (100.0%) | 1,133 (100.0%) |
Property Value to Household Income Ratio in Cheshire Village
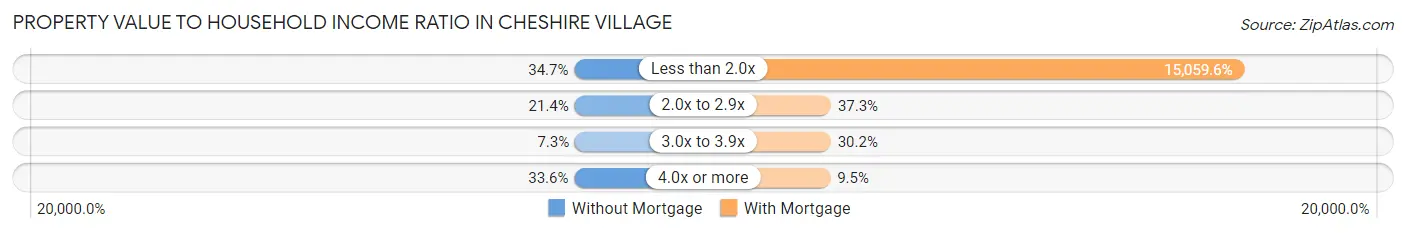
| Value-to-Income Ratio | Without Mortgage | With Mortgage |
| Less than 2.0x | 227 (34.7%) | 170,625 (15,059.6%) |
| 2.0x to 2.9x | 140 (21.4%) | 423 (37.3%) |
| 3.0x to 3.9x | 48 (7.3%) | 342 (30.2%) |
| 4.0x or more | 220 (33.6%) | 108 (9.5%) |
| Total | 655 (100.0%) | 1,133 (100.0%) |
Real Estate Taxes by Mortgage Status in Cheshire Village
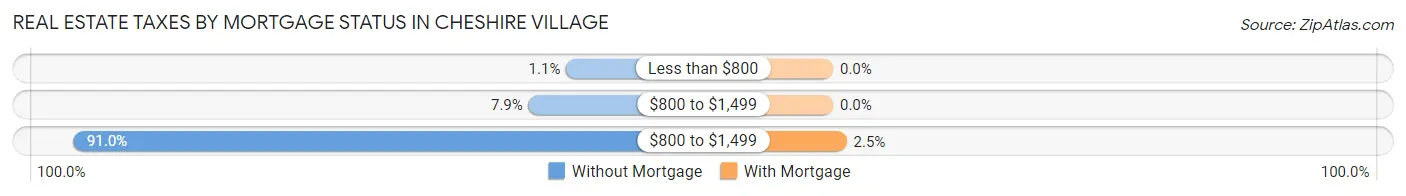
| Property Taxes | Without Mortgage | With Mortgage |
| Less than $800 | 7 (1.1%) | 0 (0.0%) |
| $800 to $1,499 | 52 (7.9%) | 0 (0.0%) |
| $800 to $1,499 | 596 (91.0%) | 28 (2.5%) |
| Total | 655 (100.0%) | 1,133 (100.0%) |
Health & Disability in Cheshire Village
Health Insurance Coverage by Age in Cheshire Village
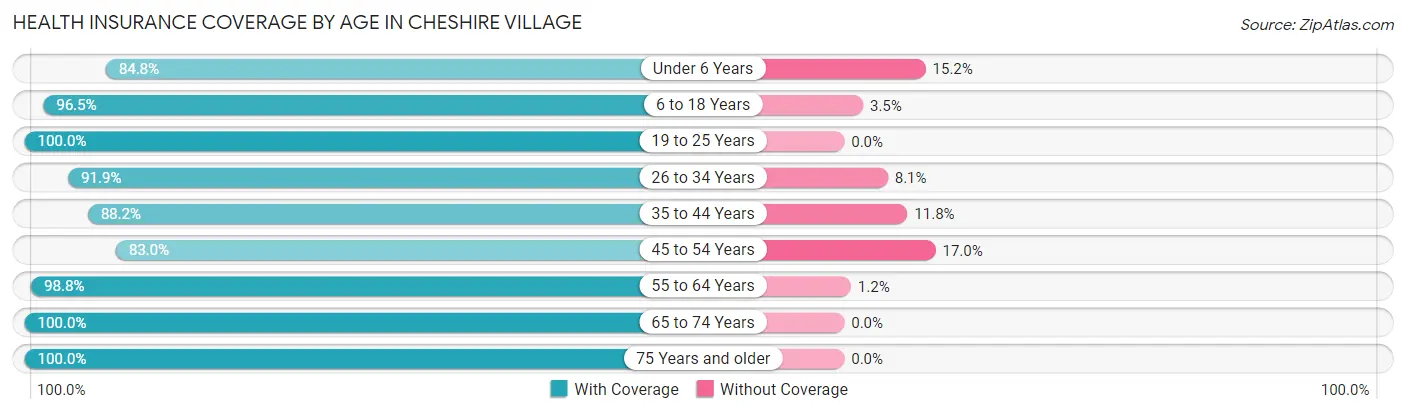
| Age Bracket | With Coverage | Without Coverage |
| Under 6 Years | 207 (84.8%) | 37 (15.2%) |
| 6 to 18 Years | 1,106 (96.5%) | 40 (3.5%) |
| 19 to 25 Years | 293 (100.0%) | 0 (0.0%) |
| 26 to 34 Years | 385 (91.9%) | 34 (8.1%) |
| 35 to 44 Years | 532 (88.2%) | 71 (11.8%) |
| 45 to 54 Years | 771 (83.0%) | 158 (17.0%) |
| 55 to 64 Years | 805 (98.8%) | 10 (1.2%) |
| 65 to 74 Years | 746 (100.0%) | 0 (0.0%) |
| 75 Years and older | 579 (100.0%) | 0 (0.0%) |
| Total | 5,424 (93.9%) | 350 (6.1%) |
Health Insurance Coverage by Citizenship Status in Cheshire Village
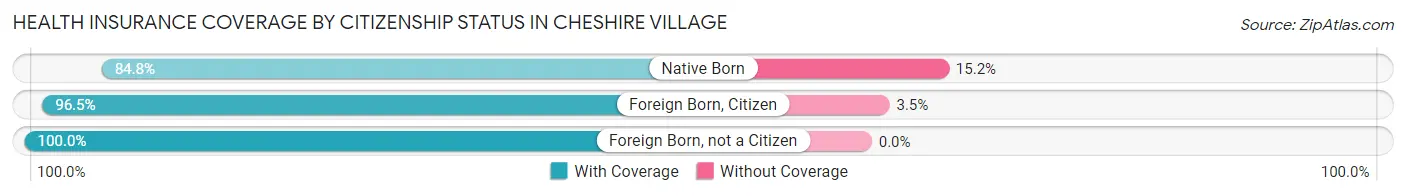
| Citizenship Status | With Coverage | Without Coverage |
| Native Born | 207 (84.8%) | 37 (15.2%) |
| Foreign Born, Citizen | 1,106 (96.5%) | 40 (3.5%) |
| Foreign Born, not a Citizen | 293 (100.0%) | 0 (0.0%) |
Health Insurance Coverage by Household Income in Cheshire Village
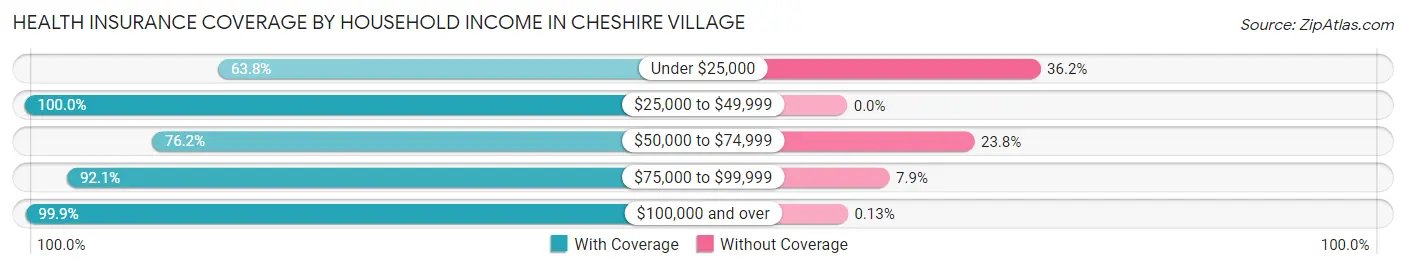
| Household Income | With Coverage | Without Coverage |
| Under $25,000 | 264 (63.8%) | 150 (36.2%) |
| $25,000 to $49,999 | 421 (100.0%) | 0 (0.0%) |
| $50,000 to $74,999 | 543 (76.2%) | 170 (23.8%) |
| $75,000 to $99,999 | 290 (92.1%) | 25 (7.9%) |
| $100,000 and over | 3,779 (99.9%) | 5 (0.1%) |
Public vs Private Health Insurance Coverage by Age in Cheshire Village
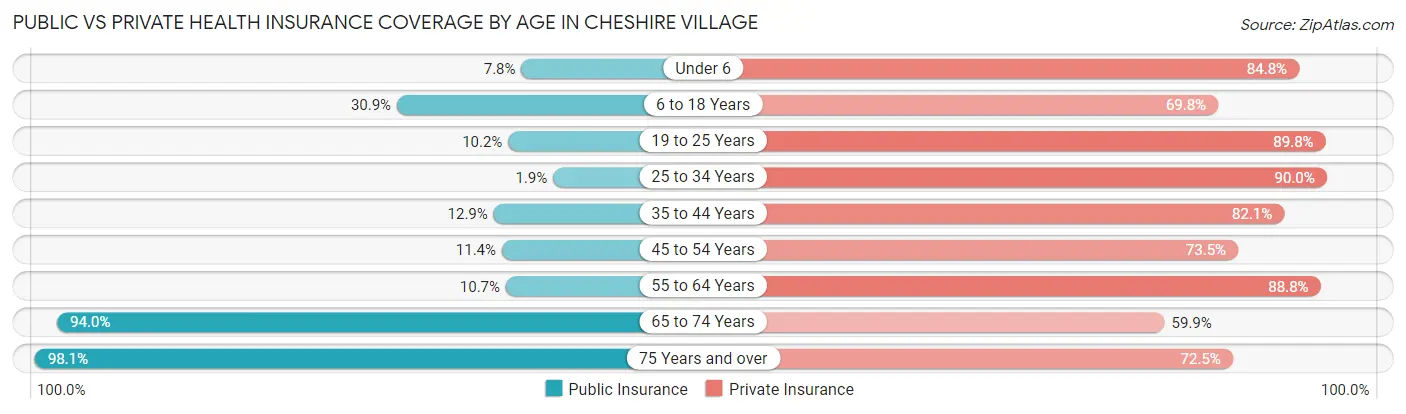
| Age Bracket | Public Insurance | Private Insurance |
| Under 6 | 19 (7.8%) | 207 (84.8%) |
| 6 to 18 Years | 354 (30.9%) | 800 (69.8%) |
| 19 to 25 Years | 30 (10.2%) | 263 (89.8%) |
| 25 to 34 Years | 8 (1.9%) | 377 (90.0%) |
| 35 to 44 Years | 78 (12.9%) | 495 (82.1%) |
| 45 to 54 Years | 106 (11.4%) | 683 (73.5%) |
| 55 to 64 Years | 87 (10.7%) | 724 (88.8%) |
| 65 to 74 Years | 701 (94.0%) | 447 (59.9%) |
| 75 Years and over | 568 (98.1%) | 420 (72.5%) |
| Total | 1,951 (33.8%) | 4,416 (76.5%) |
Disability Status by Sex by Age in Cheshire Village
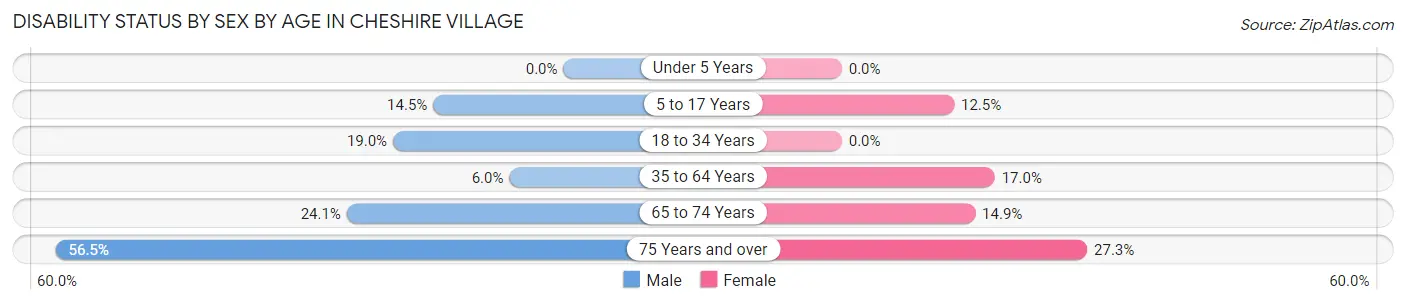
| Age Bracket | Male | Female |
| Under 5 Years | 0 (0.0%) | 0 (0.0%) |
| 5 to 17 Years | 79 (14.5%) | 46 (12.5%) |
| 18 to 34 Years | 86 (19.0%) | 0 (0.0%) |
| 35 to 64 Years | 66 (6.0%) | 213 (17.0%) |
| 65 to 74 Years | 76 (24.1%) | 64 (14.8%) |
| 75 Years and over | 108 (56.5%) | 106 (27.3%) |
Disability Class by Sex by Age in Cheshire Village
Disability Class: Hearing Difficulty
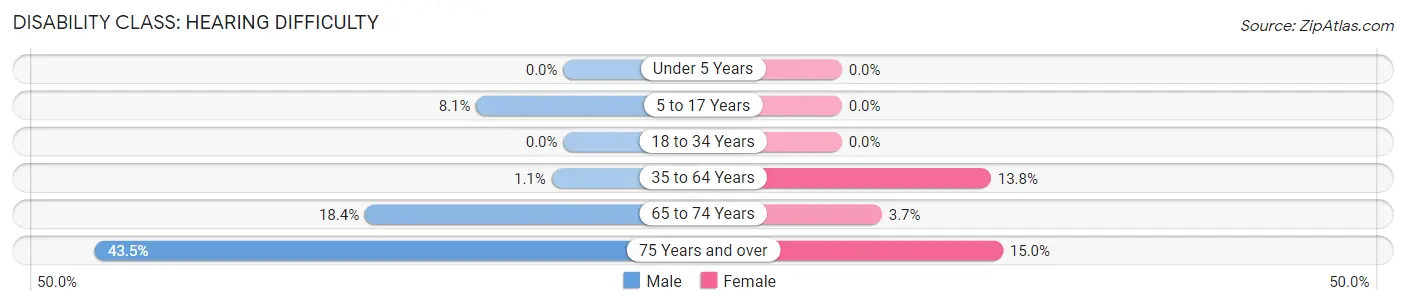
| Age Bracket | Male | Female |
| Under 5 Years | 0 (0.0%) | 0 (0.0%) |
| 5 to 17 Years | 44 (8.1%) | 0 (0.0%) |
| 18 to 34 Years | 0 (0.0%) | 0 (0.0%) |
| 35 to 64 Years | 12 (1.1%) | 173 (13.8%) |
| 65 to 74 Years | 58 (18.4%) | 16 (3.7%) |
| 75 Years and over | 83 (43.5%) | 58 (14.9%) |
Disability Class: Vision Difficulty
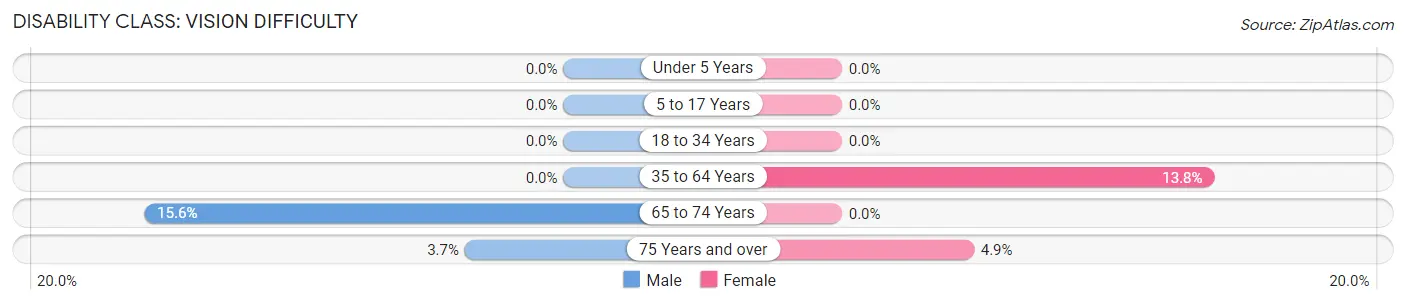
| Age Bracket | Male | Female |
| Under 5 Years | 0 (0.0%) | 0 (0.0%) |
| 5 to 17 Years | 0 (0.0%) | 0 (0.0%) |
| 18 to 34 Years | 0 (0.0%) | 0 (0.0%) |
| 35 to 64 Years | 0 (0.0%) | 173 (13.8%) |
| 65 to 74 Years | 49 (15.6%) | 0 (0.0%) |
| 75 Years and over | 7 (3.7%) | 19 (4.9%) |
Disability Class: Cognitive Difficulty
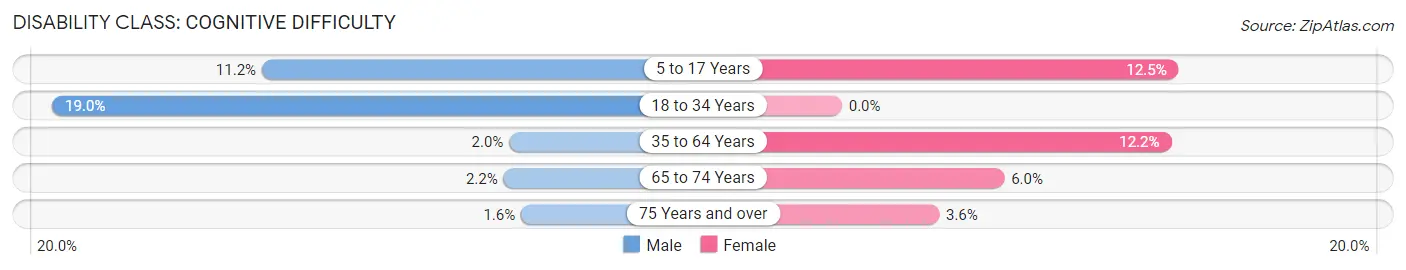
| Age Bracket | Male | Female |
| 5 to 17 Years | 61 (11.2%) | 46 (12.5%) |
| 18 to 34 Years | 86 (19.0%) | 0 (0.0%) |
| 35 to 64 Years | 22 (2.0%) | 153 (12.2%) |
| 65 to 74 Years | 7 (2.2%) | 26 (6.0%) |
| 75 Years and over | 3 (1.6%) | 14 (3.6%) |
Disability Class: Ambulatory Difficulty
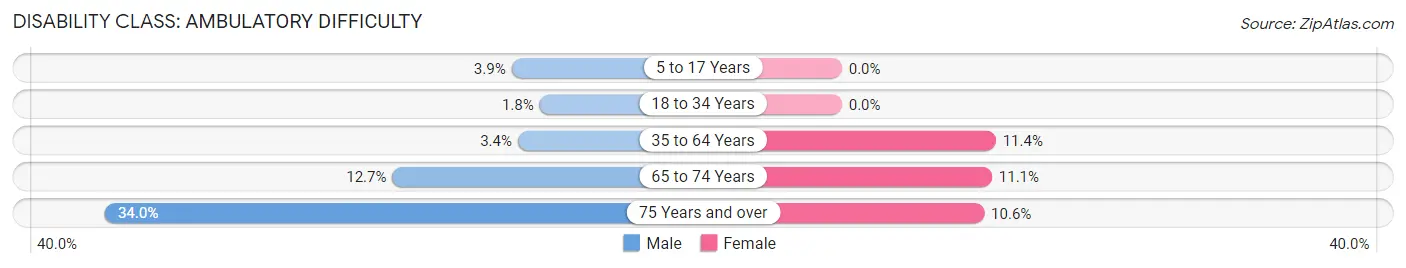
| Age Bracket | Male | Female |
| 5 to 17 Years | 21 (3.8%) | 0 (0.0%) |
| 18 to 34 Years | 8 (1.8%) | 0 (0.0%) |
| 35 to 64 Years | 37 (3.4%) | 143 (11.4%) |
| 65 to 74 Years | 40 (12.7%) | 48 (11.1%) |
| 75 Years and over | 65 (34.0%) | 41 (10.6%) |
Disability Class: Self-Care Difficulty
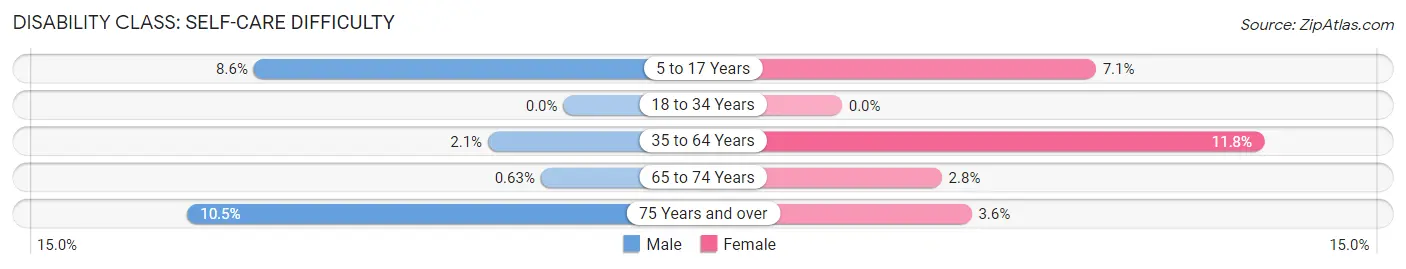
| Age Bracket | Male | Female |
| 5 to 17 Years | 47 (8.6%) | 26 (7.1%) |
| 18 to 34 Years | 0 (0.0%) | 0 (0.0%) |
| 35 to 64 Years | 23 (2.1%) | 147 (11.7%) |
| 65 to 74 Years | 2 (0.6%) | 12 (2.8%) |
| 75 Years and over | 20 (10.5%) | 14 (3.6%) |
Technology Access in Cheshire Village
Computing Device Access in Cheshire Village
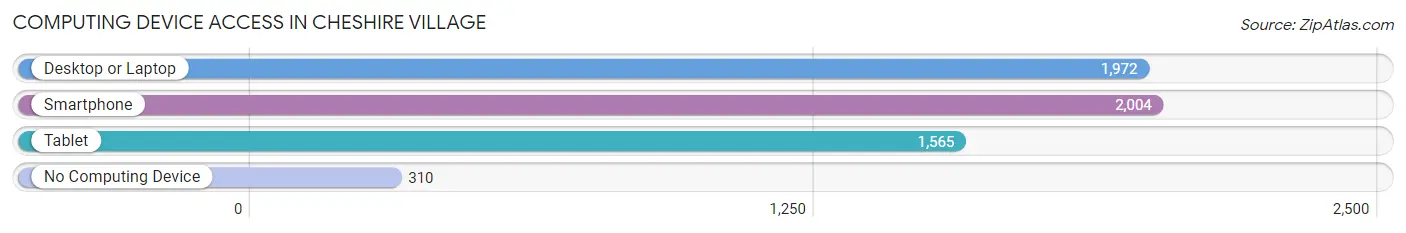
| Device Type | # Households | % Households |
| Desktop or Laptop | 1,972 | 80.5% |
| Smartphone | 2,004 | 81.8% |
| Tablet | 1,565 | 63.9% |
| No Computing Device | 310 | 12.7% |
| Total | 2,449 | 100.0% |
Internet Access in Cheshire Village
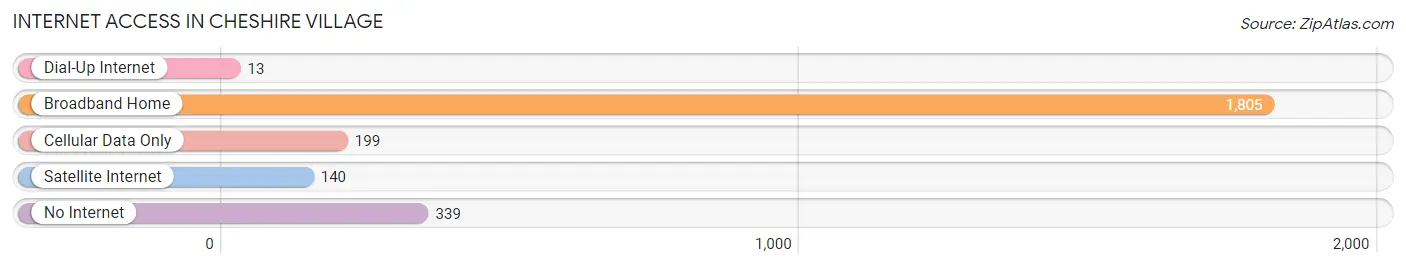
| Internet Type | # Households | % Households |
| Dial-Up Internet | 13 | 0.5% |
| Broadband Home | 1,805 | 73.7% |
| Cellular Data Only | 199 | 8.1% |
| Satellite Internet | 140 | 5.7% |
| No Internet | 339 | 13.8% |
| Total | 2,449 | 100.0% |
Cheshire Village Summary
Cheshire Village, Connecticut is a small town located in New Haven County, Connecticut. It is situated in the southwestern part of the state, about 20 miles from the city of New Haven. The town has a population of approximately 28,000 people and covers an area of about 24 square miles.
History
Cheshire Village was first settled in 1694 by a group of English settlers from Cheshire, England. The town was originally known as New Cheshire and was incorporated in 1780. The town was named after the English county of Cheshire, which is located in the northwest of England.
The town was primarily an agricultural community until the mid-19th century when the railroad was built through the town. This allowed for the development of industry and commerce in the area. The town also became a popular summer resort destination for wealthy New Yorkers.
Geography
Cheshire Village is located in the southwestern part of Connecticut, about 20 miles from the city of New Haven. The town is situated in the foothills of the Berkshire Mountains and is bordered by the towns of Wallingford, Meriden, and Waterbury. The town is located on the Quinnipiac River, which flows through the town and provides a source of recreation for the residents.
The town has a total area of 24 square miles, of which 22.7 square miles is land and 1.3 square miles is water. The town is mostly flat with some rolling hills and is located at an elevation of about 500 feet.
Economy
Cheshire Village has a diverse economy that is largely based on manufacturing and services. The town is home to several large companies, including the Cheshire Manufacturing Company, which produces a variety of products, including furniture, clothing, and electronics. The town is also home to several smaller businesses, including restaurants, retail stores, and professional services.
The town is also home to several educational institutions, including Cheshire High School, Cheshire Academy, and the University of New Haven. These institutions provide employment opportunities for the residents of the town.
Demographics
As of the 2010 census, the population of Cheshire Village was 28,543. The racial makeup of the town was 94.3% White, 1.7% African American, 0.3% Native American, 1.7% Asian, 0.1% Pacific Islander, 1.2% from other races, and 1.1% from two or more races. Hispanic or Latino of any race were 4.2% of the population.
The median income for a household in the town was $76,837, and the median income for a family was $90,945. The per capita income for the town was $35,945. About 2.7% of families and 4.2% of the population were below the poverty line, including 4.7% of those under age 18 and 4.2% of those age 65 or over.
Cheshire Village is a small town with a rich history and a diverse economy. The town is home to several large companies and educational institutions, providing employment opportunities for the residents. The town also has a diverse population, with a variety of racial and ethnic backgrounds.
Common Questions
What is Per Capita Income in Cheshire Village?
Per Capita income in Cheshire Village is $64,033.
What is the Median Family Income in Cheshire Village?
Median Family Income in Cheshire Village is $180,931.
What is the Median Household income in Cheshire Village?
Median Household Income in Cheshire Village is $107,577.
What is Income or Wage Gap in Cheshire Village?
Income or Wage Gap in Cheshire Village is 21.0%.
Women in Cheshire Village earn 79.0 cents for every dollar earned by a man.
What is Inequality or Gini Index in Cheshire Village?
Inequality or Gini Index in Cheshire Village is 0.51.
What is the Total Population of Cheshire Village?
Total Population of Cheshire Village is 5,879.
What is the Total Male Population of Cheshire Village?
Total Male Population of Cheshire Village is 2,750.
What is the Total Female Population of Cheshire Village?
Total Female Population of Cheshire Village is 3,129.
What is the Ratio of Males per 100 Females in Cheshire Village?
There are 87.89 Males per 100 Females in Cheshire Village.
What is the Ratio of Females per 100 Males in Cheshire Village?
There are 113.78 Females per 100 Males in Cheshire Village.
What is the Median Population Age in Cheshire Village?
Median Population Age in Cheshire Village is 46.5 Years.
What is the Average Family Size in Cheshire Village
Average Family Size in Cheshire Village is 3.3 People.
What is the Average Household Size in Cheshire Village
Average Household Size in Cheshire Village is 2.3 People.
How Large is the Labor Force in Cheshire Village?
There are 3,076 People in the Labor Forcein in Cheshire Village.
What is the Percentage of People in the Labor Force in Cheshire Village?
63.7% of People are in the Labor Force in Cheshire Village.
What is the Unemployment Rate in Cheshire Village?
Unemployment Rate in Cheshire Village is 4.6%.