West Simsbury, CT Map & Demographics
West Simsbury Map
West Simsbury Overview
$90,143
PER CAPITA INCOME
$176,295
AVG FAMILY INCOME
$175,045
AVG HOUSEHOLD INCOME
70.4%
WAGE / INCOME GAP [ % ]
29.6¢/ $1
WAGE / INCOME GAP [ $ ]
0.52
INEQUALITY / GINI INDEX
2,796
TOTAL POPULATION
1,310
MALE POPULATION
1,486
FEMALE POPULATION
88.16
MALES / 100 FEMALES
113.44
FEMALES / 100 MALES
57.1
MEDIAN AGE
3.0
AVG FAMILY SIZE
2.8
AVG HOUSEHOLD SIZE
1,189
LABOR FORCE [ PEOPLE ]
51.0%
PERCENT IN LABOR FORCE
4.5%
UNEMPLOYMENT RATE
West Simsbury Zip Codes
West Simsbury Area Codes
Income in West Simsbury
Income Overview in West Simsbury
Per Capita Income in West Simsbury is $90,143, while median incomes of families and households are $176,295 and $175,045 respectively.
| Characteristic | Number | Measure |
| Per Capita Income | 2,796 | $90,143 |
| Median Family Income | 737 | $176,295 |
| Mean Family Income | 737 | $307,895 |
| Median Household Income | 865 | $175,045 |
| Mean Household Income | 865 | $277,520 |
| Income Deficit | 737 | $0 |
| Wage / Income Gap (%) | 2,796 | 70.36% |
| Wage / Income Gap ($) | 2,796 | 29.64¢ per $1 |
| Gini / Inequality Index | 2,796 | 0.52 |
Earnings by Sex in West Simsbury
Average Earnings in West Simsbury are $71,250, $143,690 for men and $42,596 for women, a difference of 70.4%.
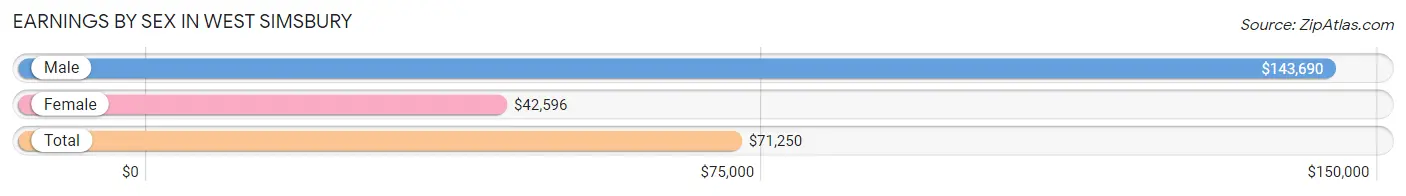
| Sex | Number | Average Earnings |
| Male | 736 (58.9%) | $143,690 |
| Female | 513 (41.1%) | $42,596 |
| Total | 1,249 (100.0%) | $71,250 |
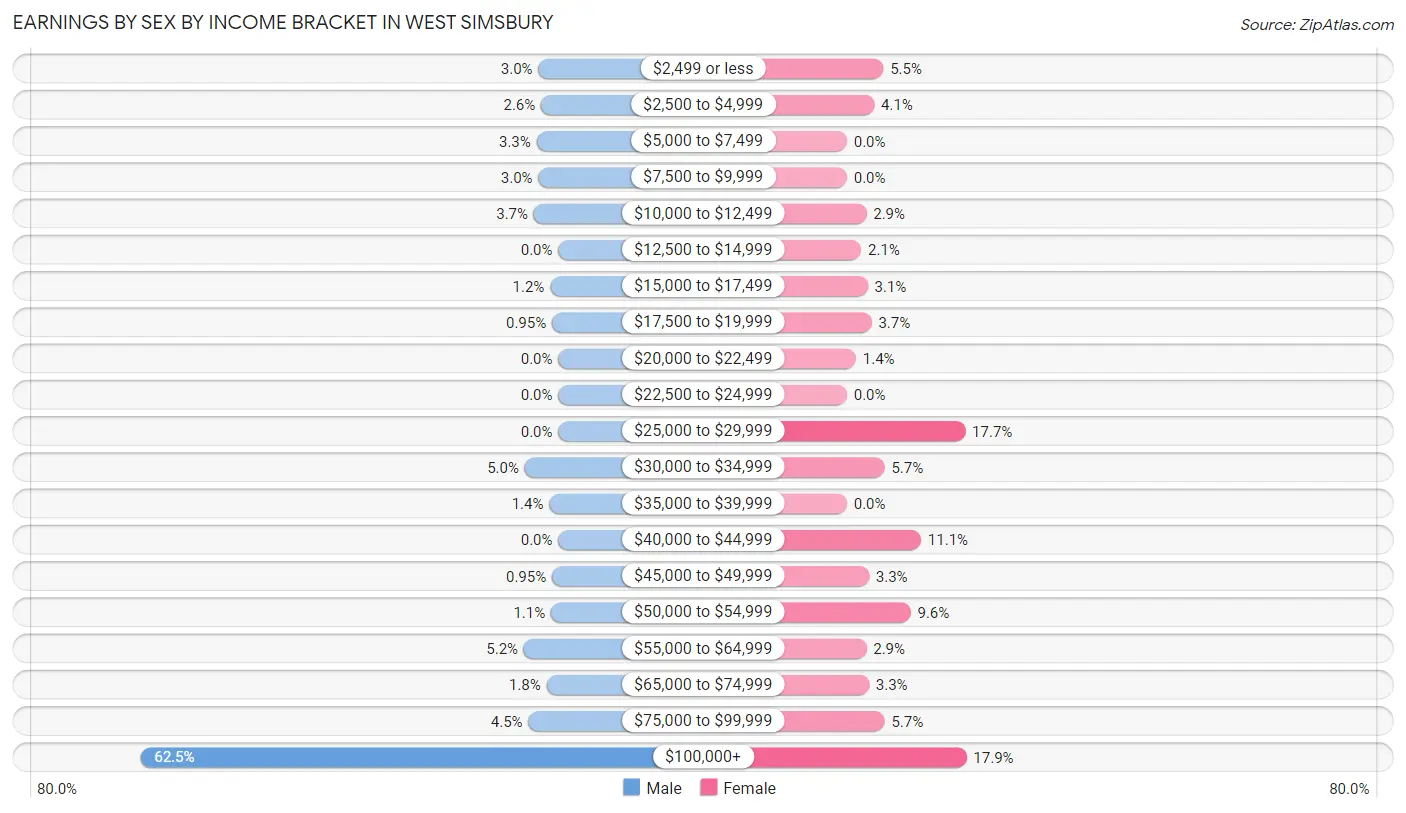
Earnings by Sex by Income Bracket in West Simsbury
The most common earnings brackets in West Simsbury are $100,000+ for men (460 | 62.5%) and $100,000+ for women (92 | 17.9%).
| Income | Male | Female |
| $2,499 or less | 22 (3.0%) | 28 (5.5%) |
| $2,500 to $4,999 | 19 (2.6%) | 21 (4.1%) |
| $5,000 to $7,499 | 24 (3.3%) | 0 (0.0%) |
| $7,500 to $9,999 | 22 (3.0%) | 0 (0.0%) |
| $10,000 to $12,499 | 27 (3.7%) | 15 (2.9%) |
| $12,500 to $14,999 | 0 (0.0%) | 11 (2.1%) |
| $15,000 to $17,499 | 9 (1.2%) | 16 (3.1%) |
| $17,500 to $19,999 | 7 (0.9%) | 19 (3.7%) |
| $20,000 to $22,499 | 0 (0.0%) | 7 (1.4%) |
| $22,500 to $24,999 | 0 (0.0%) | 0 (0.0%) |
| $25,000 to $29,999 | 0 (0.0%) | 91 (17.7%) |
| $30,000 to $34,999 | 37 (5.0%) | 29 (5.7%) |
| $35,000 to $39,999 | 10 (1.4%) | 0 (0.0%) |
| $40,000 to $44,999 | 0 (0.0%) | 57 (11.1%) |
| $45,000 to $49,999 | 7 (0.9%) | 17 (3.3%) |
| $50,000 to $54,999 | 8 (1.1%) | 49 (9.6%) |
| $55,000 to $64,999 | 38 (5.2%) | 15 (2.9%) |
| $65,000 to $74,999 | 13 (1.8%) | 17 (3.3%) |
| $75,000 to $99,999 | 33 (4.5%) | 29 (5.7%) |
| $100,000+ | 460 (62.5%) | 92 (17.9%) |
| Total | 736 (100.0%) | 513 (100.0%) |
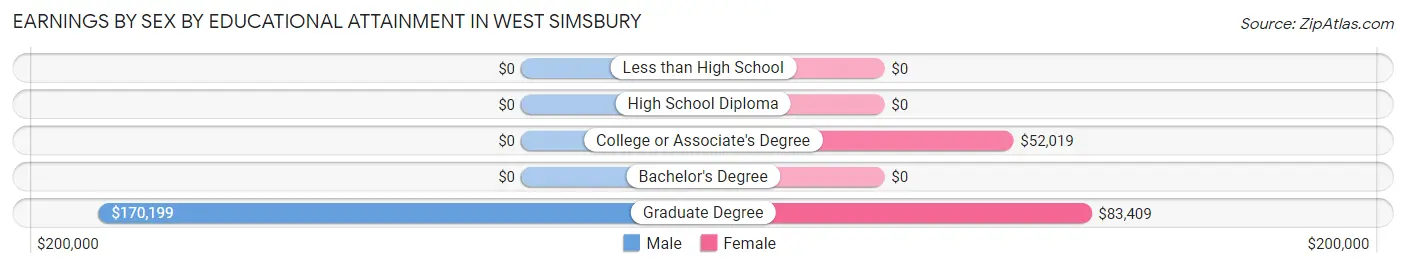
Earnings by Sex by Educational Attainment in West Simsbury
Average earnings in West Simsbury are $144,286 for men and $43,974 for women, a difference of 69.5%. Men with an educational attainment of graduate degree enjoy the highest average annual earnings of $170,199, while those with graduate degree education earn the least with $170,199. Women with an educational attainment of graduate degree earn the most with the average annual earnings of $83,409, while those with college or associate's degree education have the smallest earnings of $52,019.
| Educational Attainment | Male Income | Female Income |
| Less than High School | - | - |
| High School Diploma | - | - |
| College or Associate's Degree | - | - |
| Bachelor's Degree | - | - |
| Graduate Degree | $170,199 | $83,409 |
| Total | $144,286 | $43,974 |
Family Income in West Simsbury
Family Income Brackets in West Simsbury
According to the West Simsbury family income data, there are 321 families falling into the $200,000+ income range, which is the most common income bracket and makes up 43.5% of all families.
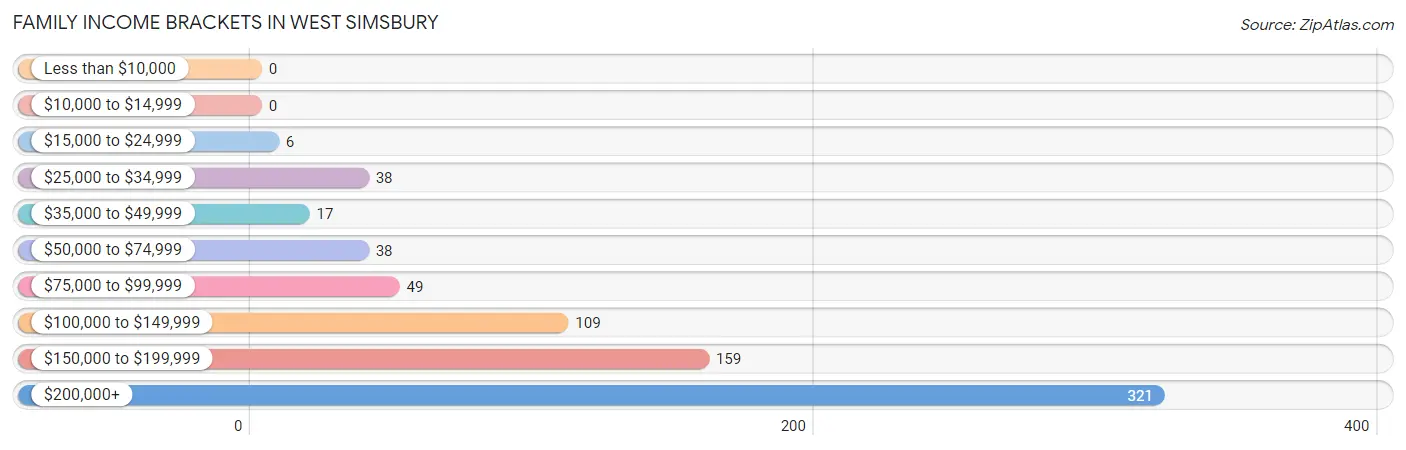
| Income Bracket | # Families | % Families |
| Less than $10,000 | 0 | 0.0% |
| $10,000 to $14,999 | 0 | 0.0% |
| $15,000 to $24,999 | 6 | 0.8% |
| $25,000 to $34,999 | 38 | 5.2% |
| $35,000 to $49,999 | 17 | 2.3% |
| $50,000 to $74,999 | 38 | 5.2% |
| $75,000 to $99,999 | 49 | 6.6% |
| $100,000 to $149,999 | 109 | 14.8% |
| $150,000 to $199,999 | 159 | 21.6% |
| $200,000+ | 321 | 43.6% |
Family Income by Famaliy Size in West Simsbury
4-person families (72 | 9.8%) account for the highest median family income in West Simsbury with $213,333 per family, while 2-person families (423 | 57.4%) have the highest median income of $100,188 per family member.
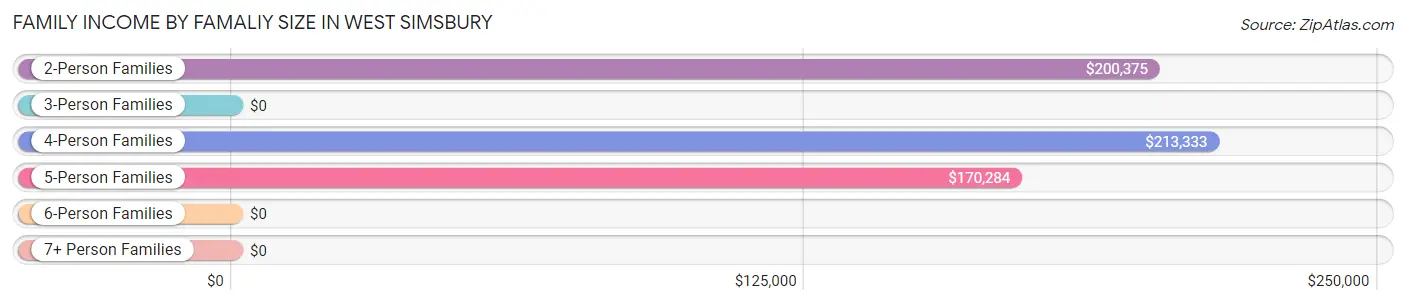
| Income Bracket | # Families | Median Income |
| 2-Person Families | 423 (57.4%) | $200,375 |
| 3-Person Families | 114 (15.5%) | $0 |
| 4-Person Families | 72 (9.8%) | $213,333 |
| 5-Person Families | 128 (17.4%) | $170,284 |
| 6-Person Families | 0 (0.0%) | $0 |
| 7+ Person Families | 0 (0.0%) | $0 |
| Total | 737 (100.0%) | $176,295 |
Family Income by Number of Earners in West Simsbury
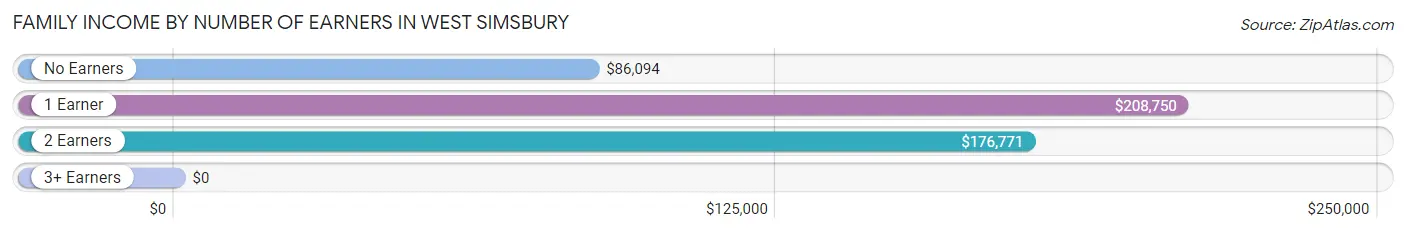
| Number of Earners | # Families | Median Income |
| No Earners | 91 (12.3%) | $86,094 |
| 1 Earner | 221 (30.0%) | $208,750 |
| 2 Earners | 383 (52.0%) | $176,771 |
| 3+ Earners | 42 (5.7%) | $0 |
| Total | 737 (100.0%) | $176,295 |
Household Income in West Simsbury
Household Income Brackets in West Simsbury
With 337 households falling in the category, the $200,000+ income range is the most frequent in West Simsbury, accounting for 39.0% of all households. In contrast, only 5 households (0.6%) fall into the $10,000 to $14,999 income bracket, making it the least populous group.
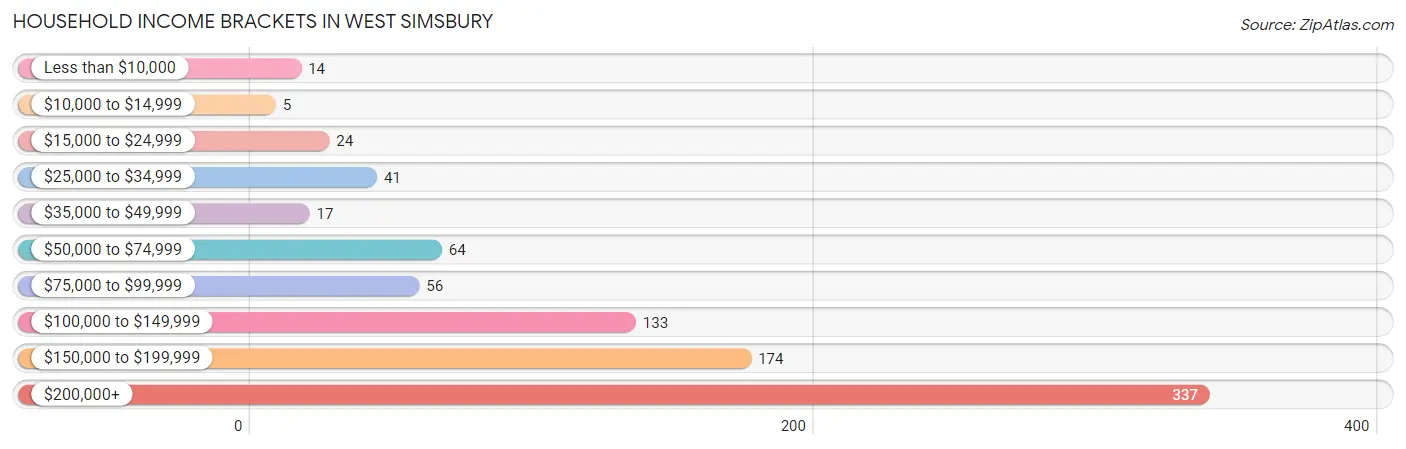
| Income Bracket | # Households | % Households |
| Less than $10,000 | 14 | 1.6% |
| $10,000 to $14,999 | 5 | 0.6% |
| $15,000 to $24,999 | 24 | 2.8% |
| $25,000 to $34,999 | 41 | 4.7% |
| $35,000 to $49,999 | 17 | 2.0% |
| $50,000 to $74,999 | 64 | 7.4% |
| $75,000 to $99,999 | 56 | 6.5% |
| $100,000 to $149,999 | 133 | 15.4% |
| $150,000 to $199,999 | 174 | 20.1% |
| $200,000+ | 337 | 39.0% |
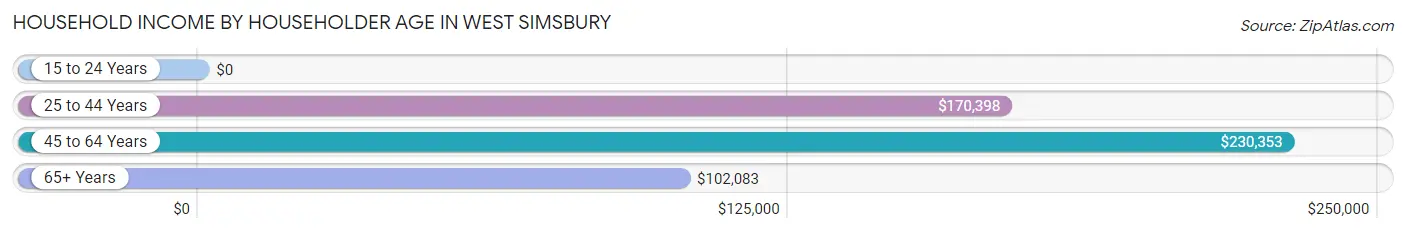
Household Income by Householder Age in West Simsbury
The median household income in West Simsbury is $175,045, with the highest median household income of $230,353 found in the 45 to 64 years age bracket for the primary householder. A total of 425 households (49.1%) fall into this category.
| Income Bracket | # Households | Median Income |
| 15 to 24 Years | 0 (0.0%) | $0 |
| 25 to 44 Years | 124 (14.3%) | $170,398 |
| 45 to 64 Years | 425 (49.1%) | $230,353 |
| 65+ Years | 316 (36.5%) | $102,083 |
| Total | 865 (100.0%) | $175,045 |
Poverty in West Simsbury
Income Below Poverty by Sex and Age in West Simsbury
With 10.1% poverty level for males and 8.6% for females among the residents of West Simsbury, 18 to 24 year old males and 18 to 24 year old females are the most vulnerable to poverty, with 24 males (36.4%) and 13 females (38.2%) in their respective age groups living below the poverty level.
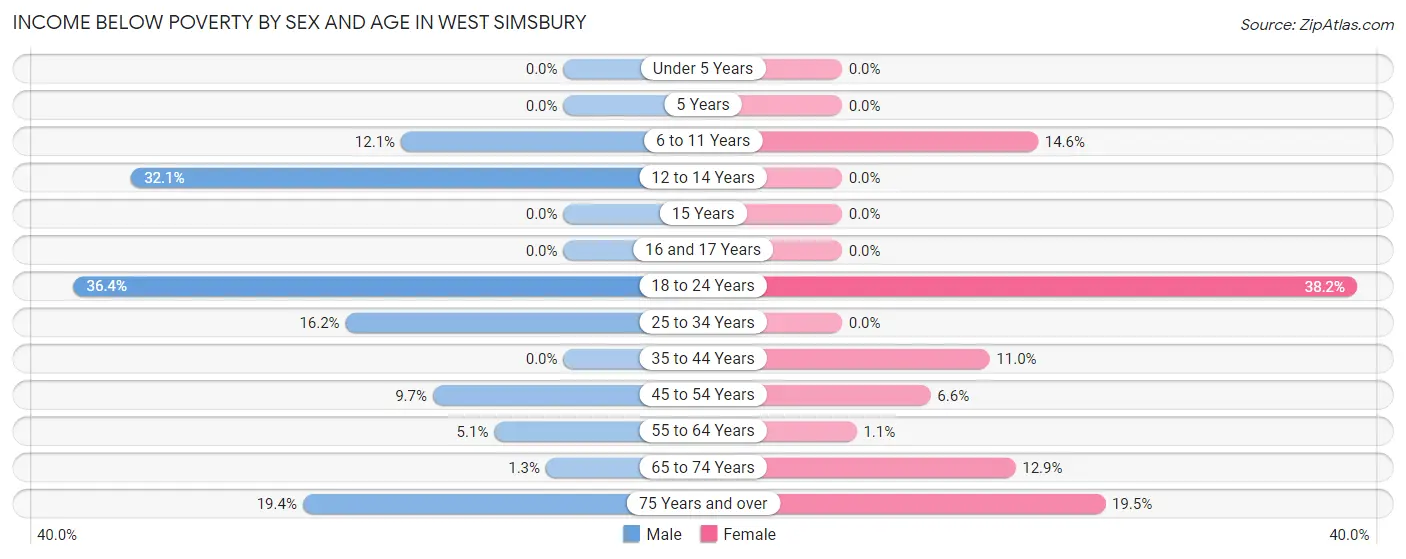
| Age Bracket | Male | Female |
| Under 5 Years | 0 (0.0%) | 0 (0.0%) |
| 5 Years | 0 (0.0%) | 0 (0.0%) |
| 6 to 11 Years | 17 (12.1%) | 16 (14.5%) |
| 12 to 14 Years | 17 (32.1%) | 0 (0.0%) |
| 15 Years | 0 (0.0%) | 0 (0.0%) |
| 16 and 17 Years | 0 (0.0%) | 0 (0.0%) |
| 18 to 24 Years | 24 (36.4%) | 13 (38.2%) |
| 25 to 34 Years | 11 (16.2%) | 0 (0.0%) |
| 35 to 44 Years | 0 (0.0%) | 16 (11.0%) |
| 45 to 54 Years | 19 (9.7%) | 10 (6.6%) |
| 55 to 64 Years | 14 (5.1%) | 3 (1.1%) |
| 65 to 74 Years | 3 (1.3%) | 21 (12.9%) |
| 75 Years and over | 18 (19.4%) | 34 (19.5%) |
| Total | 123 (10.1%) | 113 (8.6%) |
Income Above Poverty by Sex and Age in West Simsbury
According to the poverty statistics in West Simsbury, males aged 5 years and females aged under 5 years are the age groups that are most secure financially, with 100.0% of males and 100.0% of females in these age groups living above the poverty line.
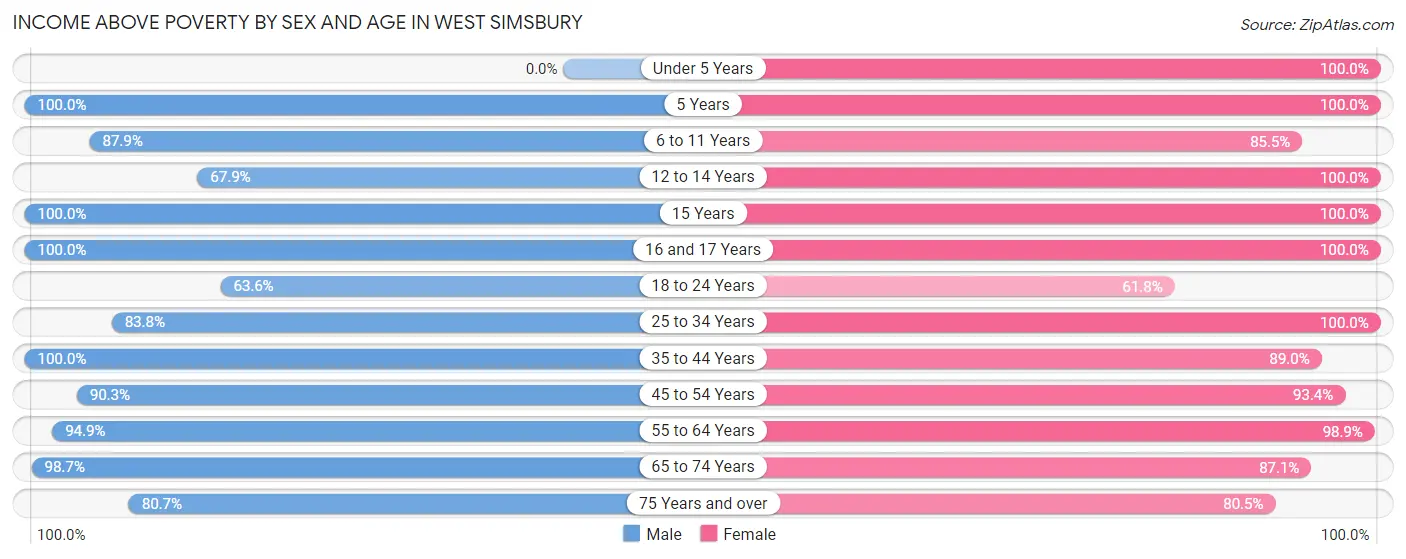
| Age Bracket | Male | Female |
| Under 5 Years | 0 (0.0%) | 22 (100.0%) |
| 5 Years | 7 (100.0%) | 75 (100.0%) |
| 6 to 11 Years | 124 (87.9%) | 94 (85.5%) |
| 12 to 14 Years | 36 (67.9%) | 31 (100.0%) |
| 15 Years | 11 (100.0%) | 14 (100.0%) |
| 16 and 17 Years | 22 (100.0%) | 51 (100.0%) |
| 18 to 24 Years | 42 (63.6%) | 21 (61.8%) |
| 25 to 34 Years | 57 (83.8%) | 70 (100.0%) |
| 35 to 44 Years | 60 (100.0%) | 130 (89.0%) |
| 45 to 54 Years | 177 (90.3%) | 142 (93.4%) |
| 55 to 64 Years | 259 (94.9%) | 272 (98.9%) |
| 65 to 74 Years | 227 (98.7%) | 142 (87.1%) |
| 75 Years and over | 75 (80.6%) | 140 (80.5%) |
| Total | 1,097 (89.9%) | 1,204 (91.4%) |
Income Below Poverty Among Married-Couple Families in West Simsbury
The poverty statistics for married-couple families in West Simsbury show that 3.8% or 26 of the total 692 families live below the poverty line. Families with 3 or 4 children have the highest poverty rate of 14.3%, comprising of 16 families. On the other hand, families with 1 or 2 children have the lowest poverty rate of 0.0%, which includes 0 families.
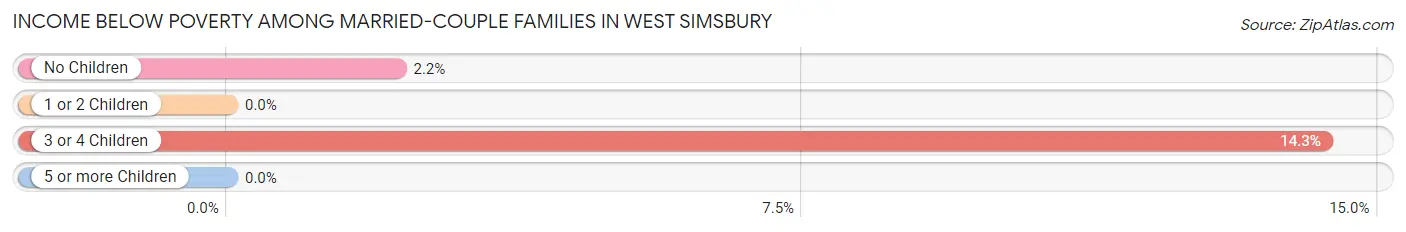
| Children | Above Poverty | Below Poverty |
| No Children | 444 (97.8%) | 10 (2.2%) |
| 1 or 2 Children | 126 (100.0%) | 0 (0.0%) |
| 3 or 4 Children | 96 (85.7%) | 16 (14.3%) |
| 5 or more Children | 0 (0.0%) | 0 (0.0%) |
| Total | 666 (96.2%) | 26 (3.8%) |
Income Below Poverty Among Single-Parent Households in West Simsbury
| Children | Single Father | Single Mother |
| No Children | 0 (0.0%) | 0 (0.0%) |
| 1 or 2 Children | 0 (0.0%) | 0 (0.0%) |
| 3 or 4 Children | 0 (0.0%) | 0 (0.0%) |
| 5 or more Children | 0 (0.0%) | 0 (0.0%) |
| Total | 0 (0.0%) | 0 (0.0%) |
Income Below Poverty Among Married-Couple vs Single-Parent Households in West Simsbury
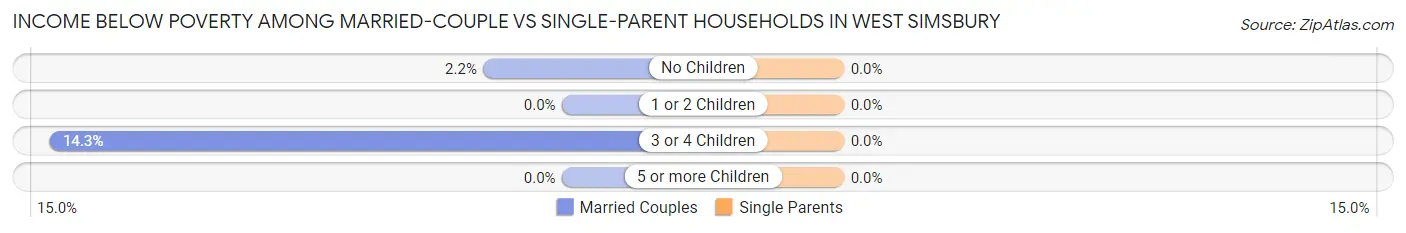
| Children | Married-Couple Families | Single-Parent Households |
| No Children | 10 (2.2%) | 0 (0.0%) |
| 1 or 2 Children | 0 (0.0%) | 0 (0.0%) |
| 3 or 4 Children | 16 (14.3%) | 0 (0.0%) |
| 5 or more Children | 0 (0.0%) | 0 (0.0%) |
| Total | 26 (3.8%) | 0 (0.0%) |
Race in West Simsbury
The most populous races in West Simsbury are White / Caucasian (2,641 | 94.5%), Hispanic or Latino (108 | 3.9%), and Asian (82 | 2.9%).
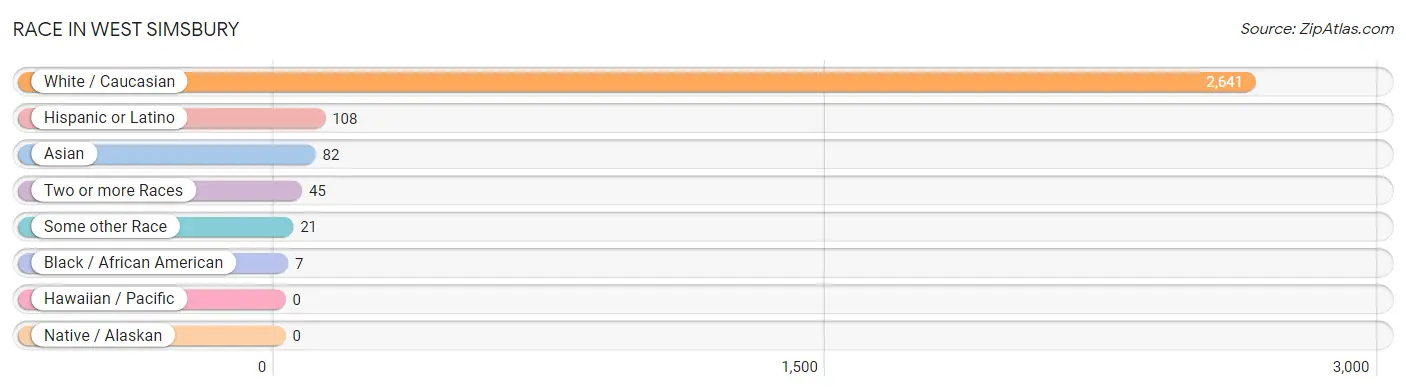
| Race | # Population | % Population |
| Asian | 82 | 2.9% |
| Black / African American | 7 | 0.3% |
| Hawaiian / Pacific | 0 | 0.0% |
| Hispanic or Latino | 108 | 3.9% |
| Native / Alaskan | 0 | 0.0% |
| White / Caucasian | 2,641 | 94.5% |
| Two or more Races | 45 | 1.6% |
| Some other Race | 21 | 0.7% |
| Total | 2,796 | 100.0% |
Ancestry in West Simsbury
The most populous ancestries reported in West Simsbury are Irish (704 | 25.2%), English (657 | 23.5%), German (420 | 15.0%), Polish (298 | 10.7%), and Italian (220 | 7.9%), together accounting for 82.2% of all West Simsbury residents.
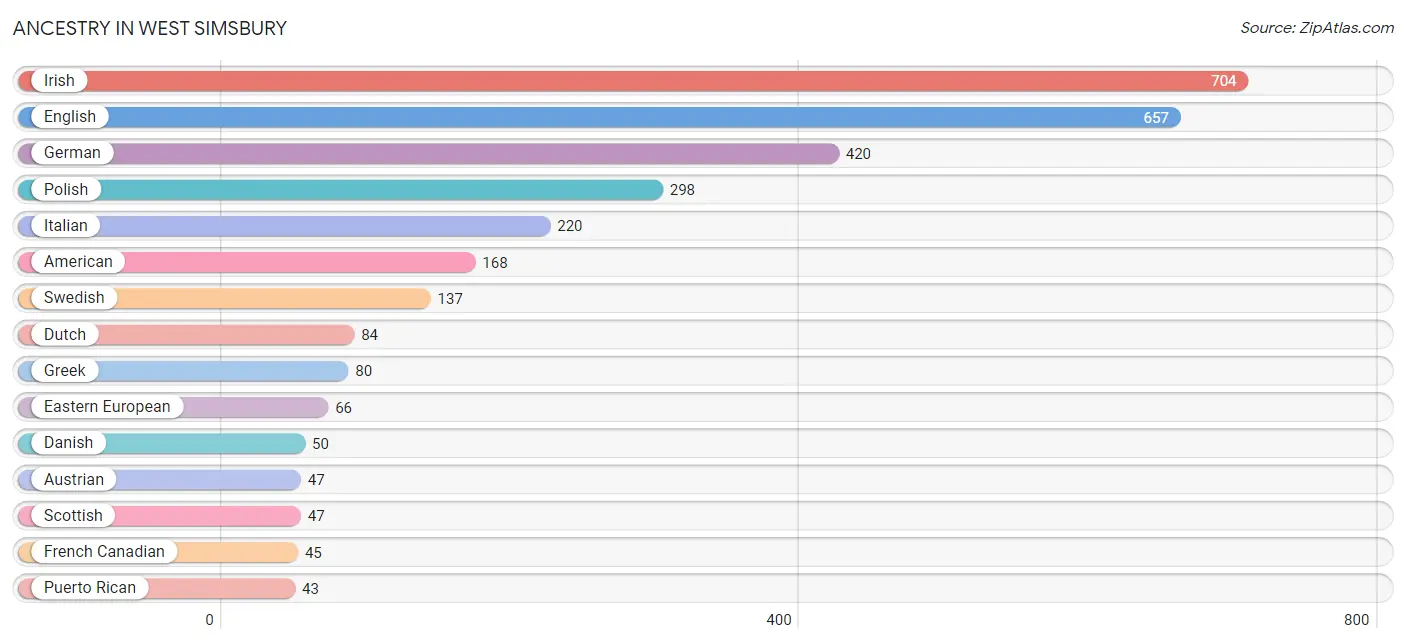
| Ancestry | # Population | % Population |
| Albanian | 7 | 0.3% |
| American | 168 | 6.0% |
| Argentinean | 20 | 0.7% |
| Armenian | 4 | 0.1% |
| Austrian | 47 | 1.7% |
| British | 25 | 0.9% |
| Burmese | 15 | 0.5% |
| Central American | 36 | 1.3% |
| Costa Rican | 36 | 1.3% |
| Cuban | 9 | 0.3% |
| Czech | 9 | 0.3% |
| Czechoslovakian | 8 | 0.3% |
| Danish | 50 | 1.8% |
| Dutch | 84 | 3.0% |
| Eastern European | 66 | 2.4% |
| English | 657 | 23.5% |
| European | 27 | 1.0% |
| French | 20 | 0.7% |
| French Canadian | 45 | 1.6% |
| German | 420 | 15.0% |
| Greek | 80 | 2.9% |
| Hungarian | 14 | 0.5% |
| Indian (Asian) | 11 | 0.4% |
| Irish | 704 | 25.2% |
| Italian | 220 | 7.9% |
| Jamaican | 5 | 0.2% |
| Lithuanian | 16 | 0.6% |
| Pennsylvania German | 7 | 0.3% |
| Polish | 298 | 10.7% |
| Portuguese | 21 | 0.7% |
| Puerto Rican | 43 | 1.5% |
| Russian | 16 | 0.6% |
| Scotch-Irish | 17 | 0.6% |
| Scottish | 47 | 1.7% |
| South American | 20 | 0.7% |
| Sri Lankan | 18 | 0.6% |
| Swedish | 137 | 4.9% |
| Swiss | 13 | 0.5% |
| Thai | 38 | 1.4% | View All 39 Rows |
Immigrants in West Simsbury
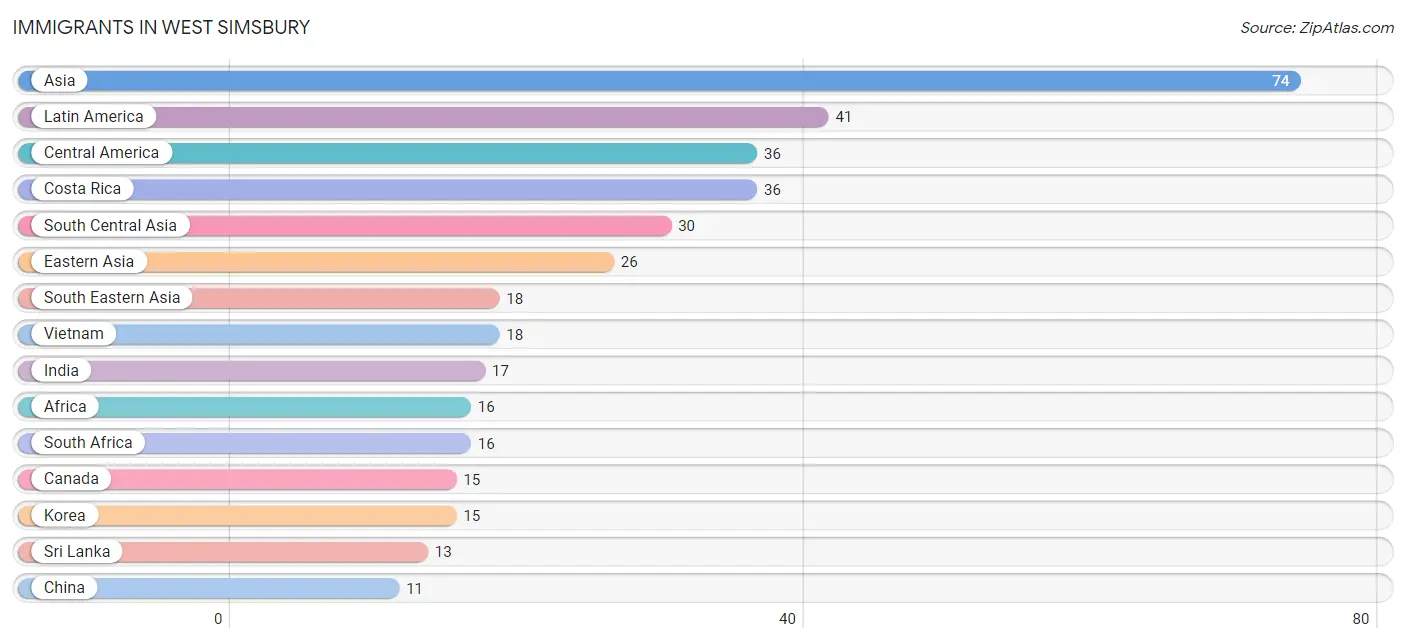
The most numerous immigrant groups reported in West Simsbury came from Asia (74 | 2.6%), Latin America (41 | 1.5%), Central America (36 | 1.3%), Costa Rica (36 | 1.3%), and South Central Asia (30 | 1.1%), together accounting for 7.8% of all West Simsbury residents.
| Immigration Origin | # Population | % Population |
| Africa | 16 | 0.6% |
| Asia | 74 | 2.6% |
| Canada | 15 | 0.5% |
| Caribbean | 5 | 0.2% |
| Central America | 36 | 1.3% |
| China | 11 | 0.4% |
| Costa Rica | 36 | 1.3% |
| Eastern Asia | 26 | 0.9% |
| England | 2 | 0.1% |
| Europe | 2 | 0.1% |
| India | 17 | 0.6% |
| Jamaica | 5 | 0.2% |
| Korea | 15 | 0.5% |
| Latin America | 41 | 1.5% |
| Northern Europe | 2 | 0.1% |
| South Africa | 16 | 0.6% |
| South Central Asia | 30 | 1.1% |
| South Eastern Asia | 18 | 0.6% |
| Sri Lanka | 13 | 0.5% |
| Vietnam | 18 | 0.6% | View All 20 Rows |
Sex and Age in West Simsbury
Sex and Age in West Simsbury
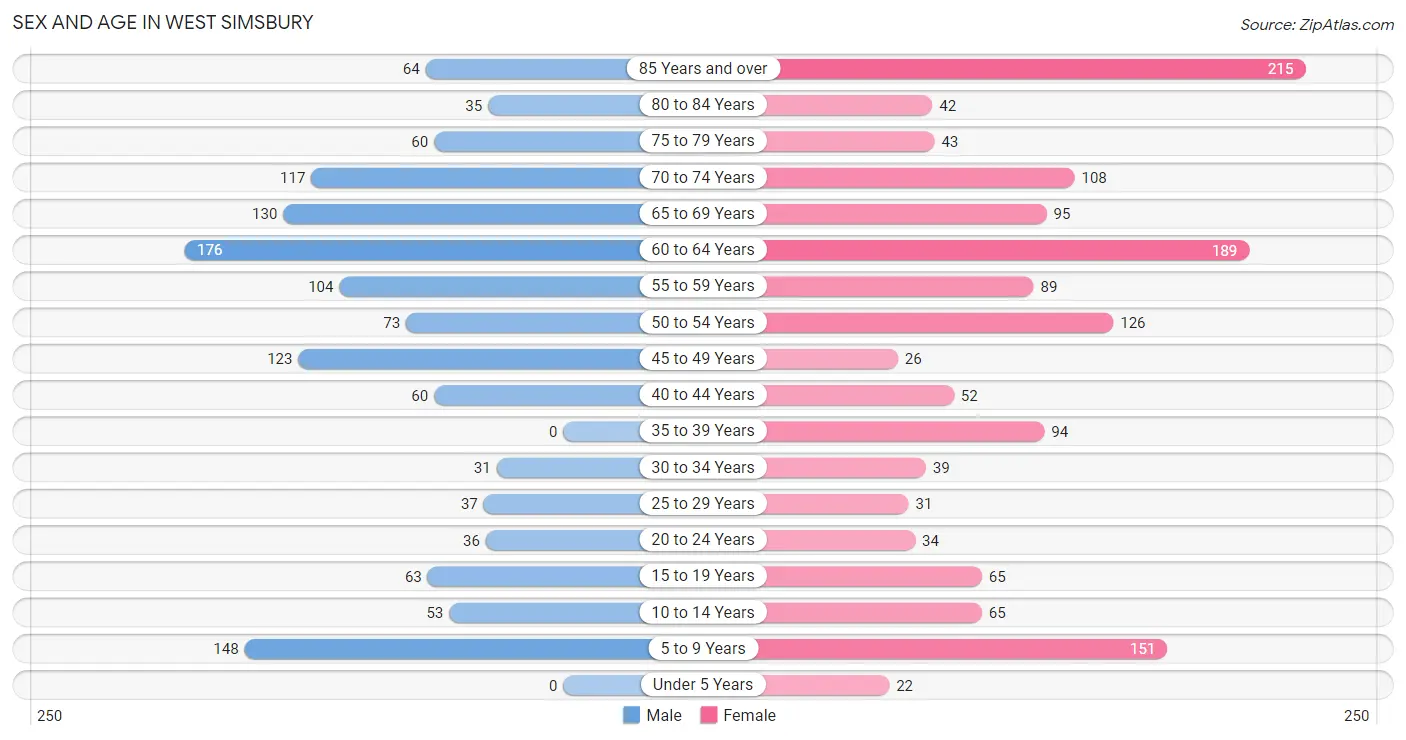
The most populous age groups in West Simsbury are 60 to 64 Years (176 | 13.4%) for men and 85 Years and over (215 | 14.5%) for women.
| Age Bracket | Male | Female |
| Under 5 Years | 0 (0.0%) | 22 (1.5%) |
| 5 to 9 Years | 148 (11.3%) | 151 (10.2%) |
| 10 to 14 Years | 53 (4.1%) | 65 (4.4%) |
| 15 to 19 Years | 63 (4.8%) | 65 (4.4%) |
| 20 to 24 Years | 36 (2.8%) | 34 (2.3%) |
| 25 to 29 Years | 37 (2.8%) | 31 (2.1%) |
| 30 to 34 Years | 31 (2.4%) | 39 (2.6%) |
| 35 to 39 Years | 0 (0.0%) | 94 (6.3%) |
| 40 to 44 Years | 60 (4.6%) | 52 (3.5%) |
| 45 to 49 Years | 123 (9.4%) | 26 (1.8%) |
| 50 to 54 Years | 73 (5.6%) | 126 (8.5%) |
| 55 to 59 Years | 104 (7.9%) | 89 (6.0%) |
| 60 to 64 Years | 176 (13.4%) | 189 (12.7%) |
| 65 to 69 Years | 130 (9.9%) | 95 (6.4%) |
| 70 to 74 Years | 117 (8.9%) | 108 (7.3%) |
| 75 to 79 Years | 60 (4.6%) | 43 (2.9%) |
| 80 to 84 Years | 35 (2.7%) | 42 (2.8%) |
| 85 Years and over | 64 (4.9%) | 215 (14.5%) |
| Total | 1,310 (100.0%) | 1,486 (100.0%) |
Families and Households in West Simsbury
Median Family Size in West Simsbury
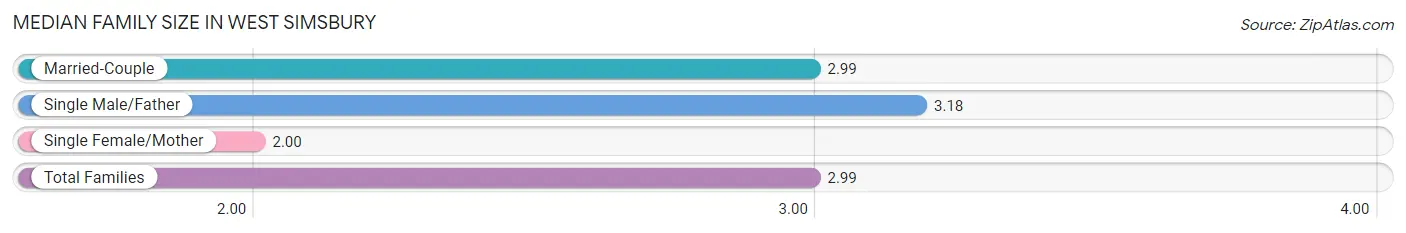
The median family size in West Simsbury is 2.99 persons per family, with single male/father families (38 | 5.2%) accounting for the largest median family size of 3.18 persons per family. On the other hand, single female/mother families (7 | 0.9%) represent the smallest median family size with 2.00 persons per family.
| Family Type | # Families | Family Size |
| Married-Couple | 692 (93.9%) | 2.99 |
| Single Male/Father | 38 (5.2%) | 3.18 |
| Single Female/Mother | 7 (0.9%) | 2.00 |
| Total Families | 737 (100.0%) | 2.99 |
Median Household Size in West Simsbury
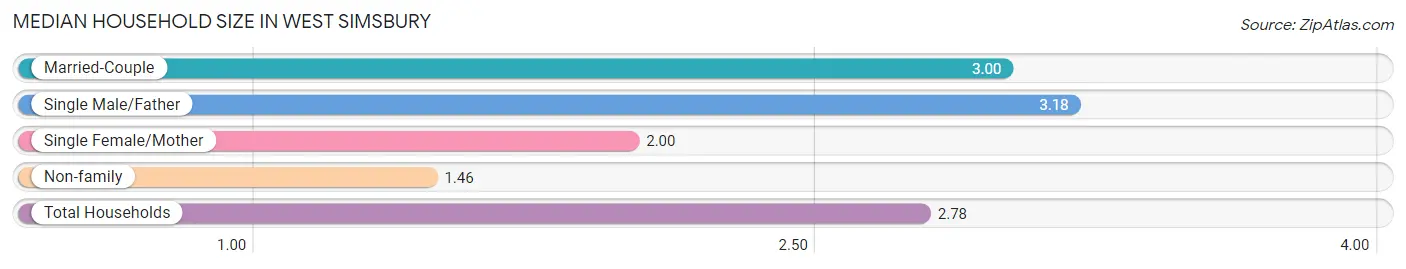
The median household size in West Simsbury is 2.78 persons per household, with single male/father households (38 | 4.4%) accounting for the largest median household size of 3.18 persons per household. non-family households (128 | 14.8%) represent the smallest median household size with 1.46 persons per household.
| Household Type | # Households | Household Size |
| Married-Couple | 692 (80.0%) | 3.00 |
| Single Male/Father | 38 (4.4%) | 3.18 |
| Single Female/Mother | 7 (0.8%) | 2.00 |
| Non-family | 128 (14.8%) | 1.46 |
| Total Households | 865 (100.0%) | 2.78 |
Household Size by Marriage Status in West Simsbury
Out of a total of 865 households in West Simsbury, 737 (85.2%) are family households, while 128 (14.8%) are nonfamily households. The most numerous type of family households are 2-person households, comprising 423, and the most common type of nonfamily households are 1-person households, comprising 105.
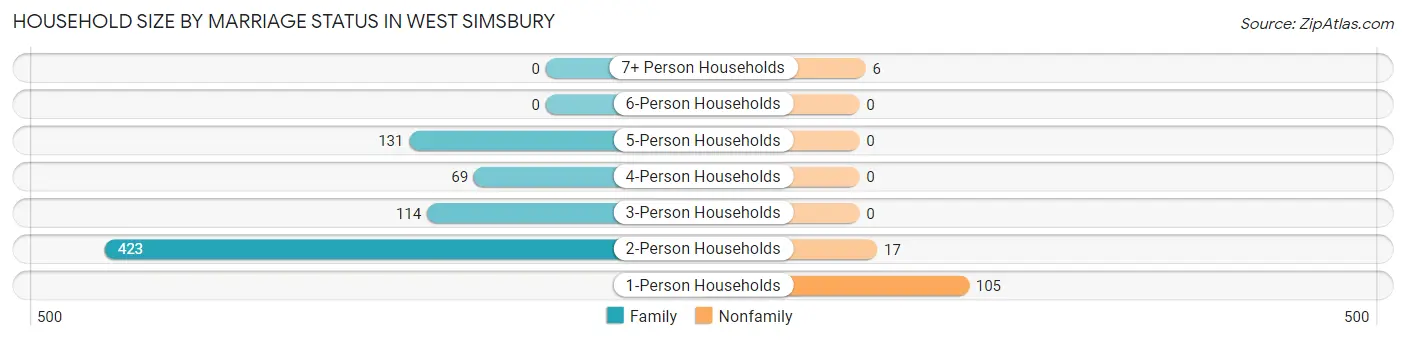
| Household Size | Family Households | Nonfamily Households |
| 1-Person Households | - | 105 (12.1%) |
| 2-Person Households | 423 (48.9%) | 17 (2.0%) |
| 3-Person Households | 114 (13.2%) | 0 (0.0%) |
| 4-Person Households | 69 (8.0%) | 0 (0.0%) |
| 5-Person Households | 131 (15.1%) | 0 (0.0%) |
| 6-Person Households | 0 (0.0%) | 0 (0.0%) |
| 7+ Person Households | 0 (0.0%) | 6 (0.7%) |
| Total | 737 (85.2%) | 128 (14.8%) |
Female Fertility in West Simsbury
Fertility by Age in West Simsbury
| Age Bracket | Women with Births | Births / 1,000 Women |
| 15 to 19 years | 0 (0.0%) | 0.0 |
| 20 to 34 years | 0 (0.0%) | 0.0 |
| 35 to 50 years | 0 (0.0%) | 0.0 |
| Total | 0 (0.0%) | 0.0 |
Fertility by Age by Marriage Status in West Simsbury
| Age Bracket | Married | Unmarried |
| 15 to 19 years | 0 (0.0%) | 0 (0.0%) |
| 20 to 34 years | 0 (0.0%) | 0 (0.0%) |
| 35 to 50 years | 0 (0.0%) | 0 (0.0%) |
| Total | 0 (0.0%) | 0 (0.0%) |
Fertility by Education in West Simsbury
| Educational Attainment | Women with Births | Births / 1,000 Women |
| Less than High School | 0 (0.0%) | 0.0 |
| High School Diploma | 0 (0.0%) | 0.0 |
| College or Associate's Degree | 0 (0.0%) | 0.0 |
| Bachelor's Degree | 0 (0.0%) | 0.0 |
| Graduate Degree | 0 (0.0%) | 0.0 |
| Total | 0 (0.0%) | 0.0 |
Fertility by Education by Marriage Status in West Simsbury
| Educational Attainment | Married | Unmarried |
| Less than High School | 0 (0.0%) | 0 (0.0%) |
| High School Diploma | 0 (0.0%) | 0 (0.0%) |
| College or Associate's Degree | 0 (0.0%) | 0 (0.0%) |
| Bachelor's Degree | 0 (0.0%) | 0 (0.0%) |
| Graduate Degree | 0 (0.0%) | 0 (0.0%) |
| Total | 0 (0.0%) | 0 (0.0%) |
Employment Characteristics in West Simsbury
Employment by Class of Employer in West Simsbury
Among the 1,135 employed individuals in West Simsbury, private company employees (740 | 65.2%), not-for-profit organizations (160 | 14.1%), and self-employed (incorporated) (100 | 8.8%) make up the most common classes of employment.
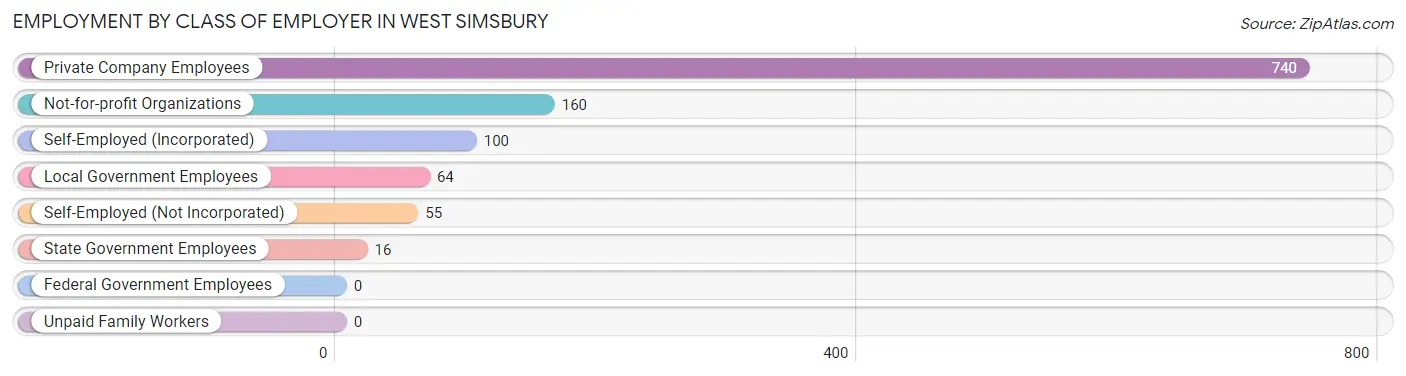
| Employer Class | # Employees | % Employees |
| Private Company Employees | 740 | 65.2% |
| Self-Employed (Incorporated) | 100 | 8.8% |
| Self-Employed (Not Incorporated) | 55 | 4.9% |
| Not-for-profit Organizations | 160 | 14.1% |
| Local Government Employees | 64 | 5.6% |
| State Government Employees | 16 | 1.4% |
| Federal Government Employees | 0 | 0.0% |
| Unpaid Family Workers | 0 | 0.0% |
| Total | 1,135 | 100.0% |
Employment Status by Age in West Simsbury
According to the labor force statistics for West Simsbury, out of the total population over 16 years of age (2,332), 51.0% or 1,189 individuals are in the labor force, with 4.5% or 54 of them unemployed. The age group with the highest labor force participation rate is 30 to 34 years, with 100.0% or 70 individuals in the labor force. Within the labor force, the 20 to 24 years age range has the highest percentage of unemployed individuals, with 43.1% or 25 of them being unemployed.
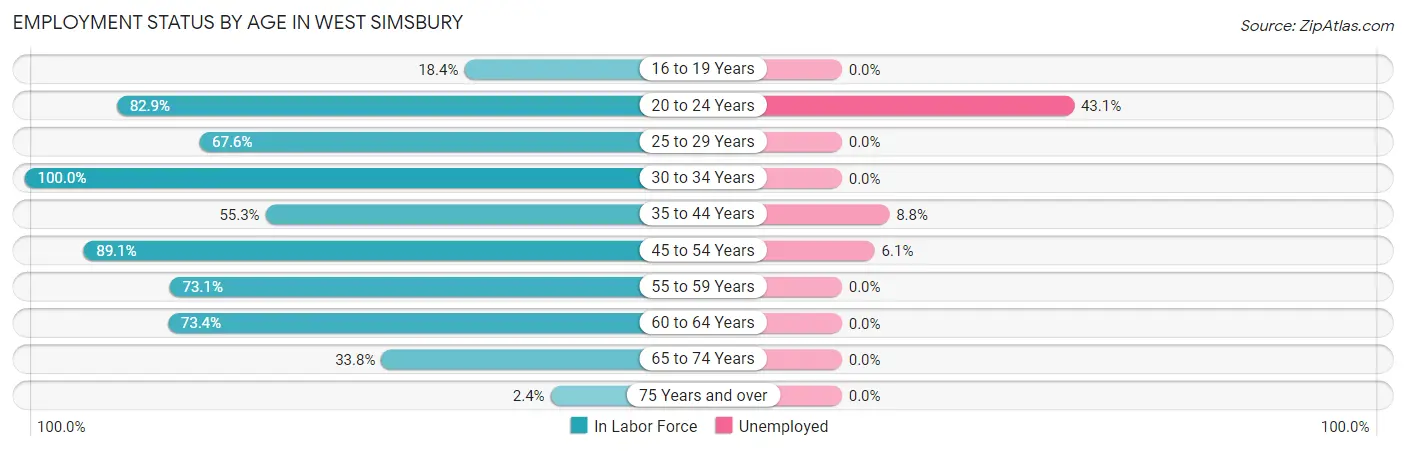
| Age Bracket | In Labor Force | Unemployed |
| 16 to 19 Years | 19 (18.4%) | 0 (0.0%) |
| 20 to 24 Years | 58 (82.9%) | 25 (43.1%) |
| 25 to 29 Years | 46 (67.6%) | 0 (0.0%) |
| 30 to 34 Years | 70 (100.0%) | 0 (0.0%) |
| 35 to 44 Years | 114 (55.3%) | 10 (8.8%) |
| 45 to 54 Years | 310 (89.1%) | 19 (6.1%) |
| 55 to 59 Years | 141 (73.1%) | 0 (0.0%) |
| 60 to 64 Years | 268 (73.4%) | 0 (0.0%) |
| 65 to 74 Years | 152 (33.8%) | 0 (0.0%) |
| 75 Years and over | 11 (2.4%) | 0 (0.0%) |
| Total | 1,189 (51.0%) | 54 (4.5%) |
Employment Status by Educational Attainment in West Simsbury
According to labor force statistics for West Simsbury, 75.9% of individuals (949) out of the total population between 25 and 64 years of age (1,250) are in the labor force, with 3.1% or 29 of them being unemployed. The group with the highest labor force participation rate are those with the educational attainment of college / associate degree, with 81.9% or 221 individuals in the labor force. Within the labor force, individuals with high school diploma education have the highest percentage of unemployment, with 32.2% or 19 of them being unemployed.
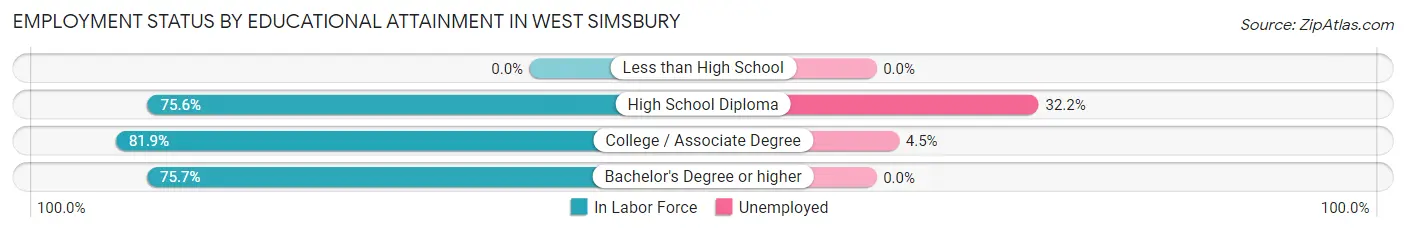
| Educational Attainment | In Labor Force | Unemployed |
| Less than High School | 0 (0.0%) | 0 (0.0%) |
| High School Diploma | 59 (75.6%) | 25 (32.2%) |
| College / Associate Degree | 221 (81.9%) | 12 (4.5%) |
| Bachelor's Degree or higher | 669 (75.7%) | 0 (0.0%) |
| Total | 949 (75.9%) | 39 (3.1%) |
Employment Occupations by Sex in West Simsbury
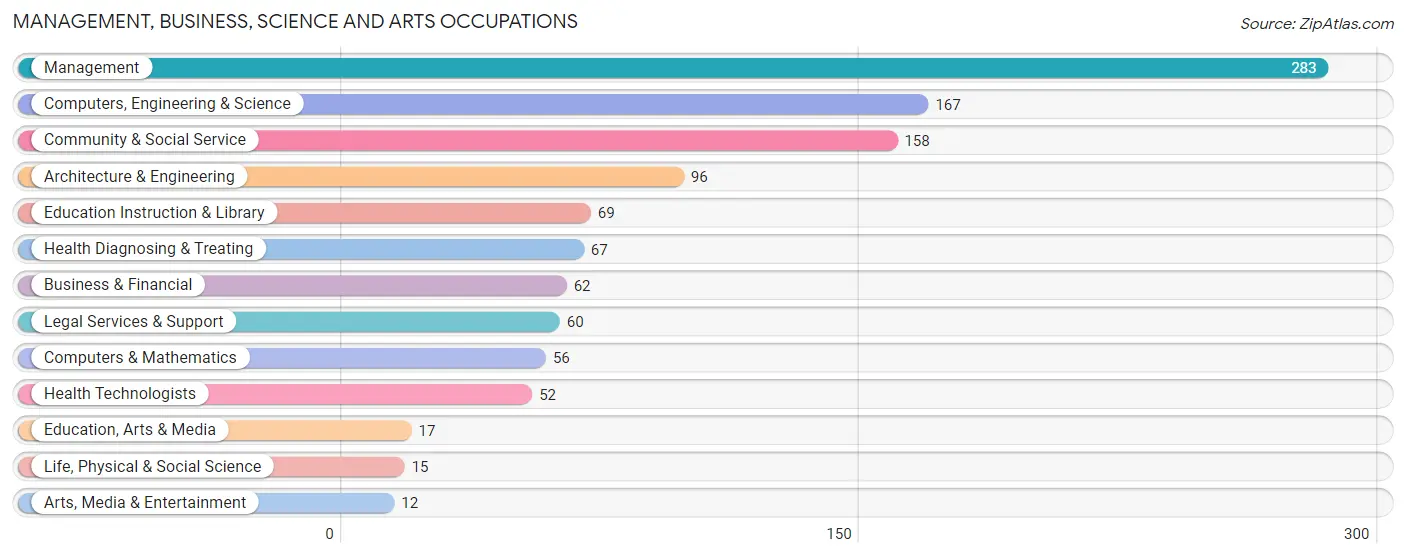
Management, Business, Science and Arts Occupations
The most common Management, Business, Science and Arts occupations in West Simsbury are Management (283 | 24.9%), Computers, Engineering & Science (167 | 14.7%), Community & Social Service (158 | 13.9%), Architecture & Engineering (96 | 8.5%), and Education Instruction & Library (69 | 6.1%).
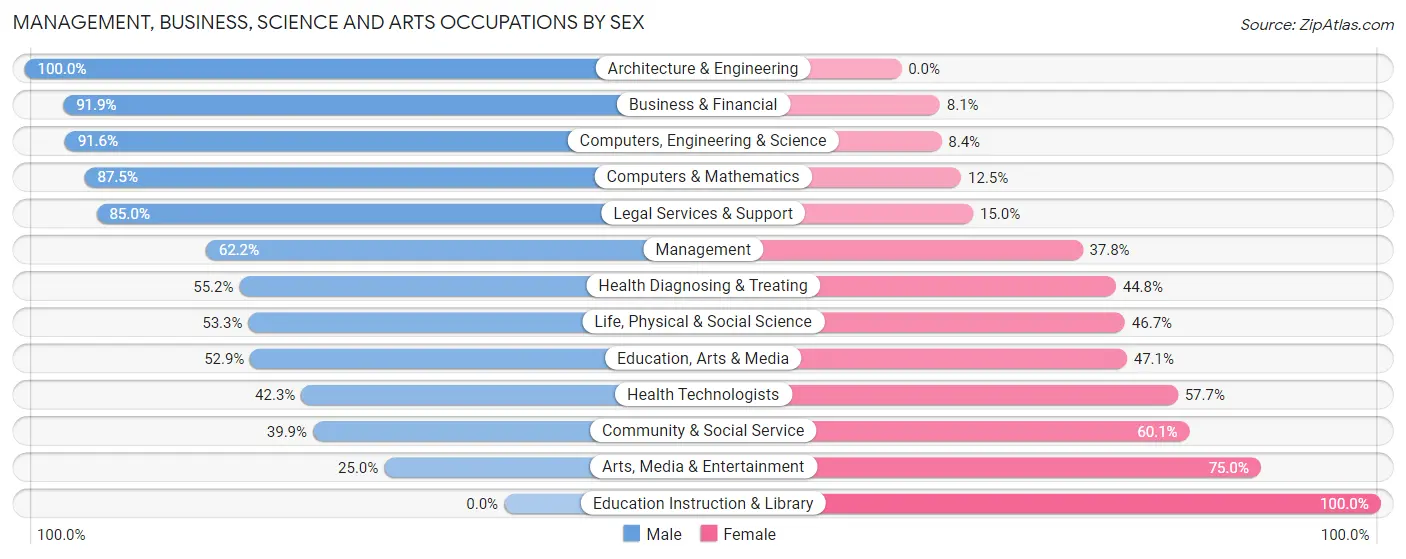
Management, Business, Science and Arts Occupations by Sex
Within the Management, Business, Science and Arts occupations in West Simsbury, the most male-oriented occupations are Architecture & Engineering (100.0%), Business & Financial (91.9%), and Computers, Engineering & Science (91.6%), while the most female-oriented occupations are Education Instruction & Library (100.0%), Arts, Media & Entertainment (75.0%), and Community & Social Service (60.1%).
| Occupation | Male | Female |
| Management | 176 (62.2%) | 107 (37.8%) |
| Business & Financial | 57 (91.9%) | 5 (8.1%) |
| Computers, Engineering & Science | 153 (91.6%) | 14 (8.4%) |
| Computers & Mathematics | 49 (87.5%) | 7 (12.5%) |
| Architecture & Engineering | 96 (100.0%) | 0 (0.0%) |
| Life, Physical & Social Science | 8 (53.3%) | 7 (46.7%) |
| Community & Social Service | 63 (39.9%) | 95 (60.1%) |
| Education, Arts & Media | 9 (52.9%) | 8 (47.1%) |
| Legal Services & Support | 51 (85.0%) | 9 (15.0%) |
| Education Instruction & Library | 0 (0.0%) | 69 (100.0%) |
| Arts, Media & Entertainment | 3 (25.0%) | 9 (75.0%) |
| Health Diagnosing & Treating | 37 (55.2%) | 30 (44.8%) |
| Health Technologists | 22 (42.3%) | 30 (57.7%) |
| Total (Category) | 486 (65.9%) | 251 (34.1%) |
| Total (Overall) | 659 (58.1%) | 476 (41.9%) |
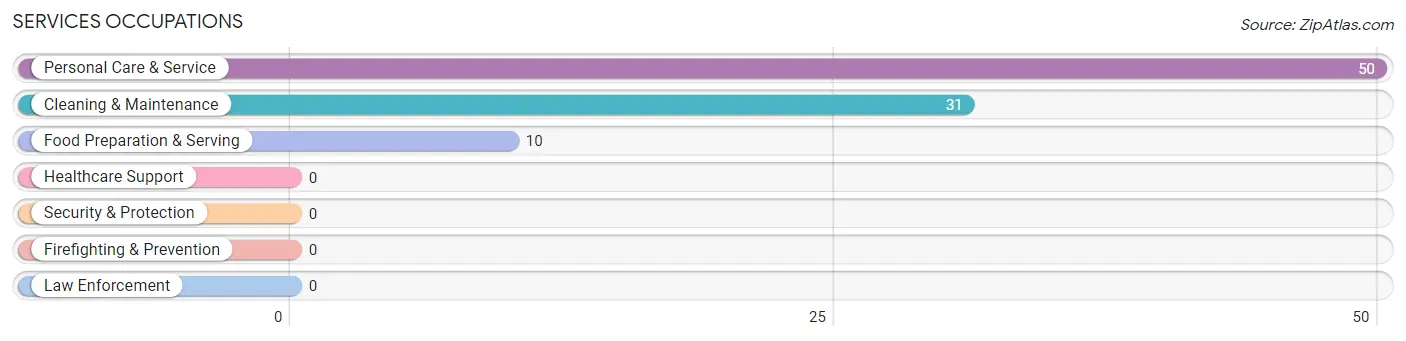
Services Occupations
The most common Services occupations in West Simsbury are Personal Care & Service (50 | 4.4%), Cleaning & Maintenance (31 | 2.7%), and Food Preparation & Serving (10 | 0.9%).
Services Occupations by Sex
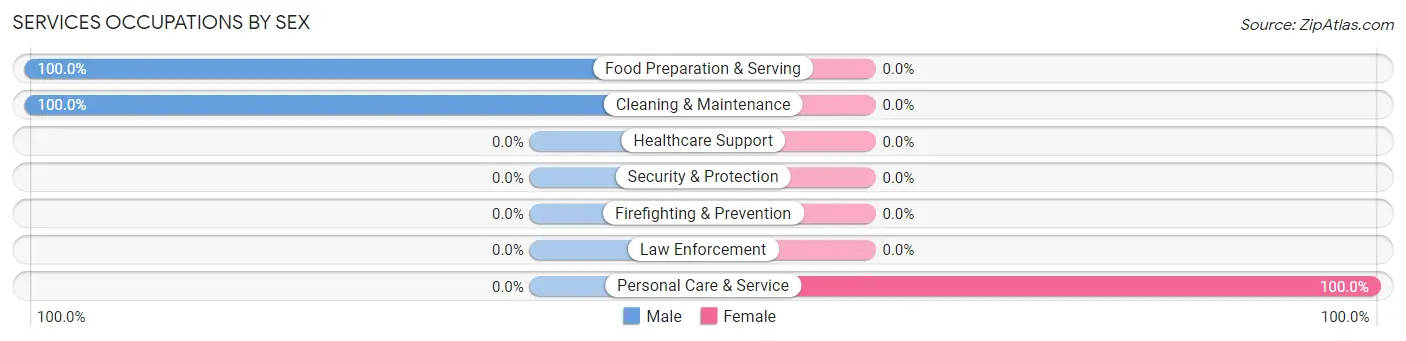
| Occupation | Male | Female |
| Healthcare Support | 0 (0.0%) | 0 (0.0%) |
| Security & Protection | 0 (0.0%) | 0 (0.0%) |
| Firefighting & Prevention | 0 (0.0%) | 0 (0.0%) |
| Law Enforcement | 0 (0.0%) | 0 (0.0%) |
| Food Preparation & Serving | 10 (100.0%) | 0 (0.0%) |
| Cleaning & Maintenance | 31 (100.0%) | 0 (0.0%) |
| Personal Care & Service | 0 (0.0%) | 50 (100.0%) |
| Total (Category) | 41 (45.1%) | 50 (54.9%) |
| Total (Overall) | 659 (58.1%) | 476 (41.9%) |
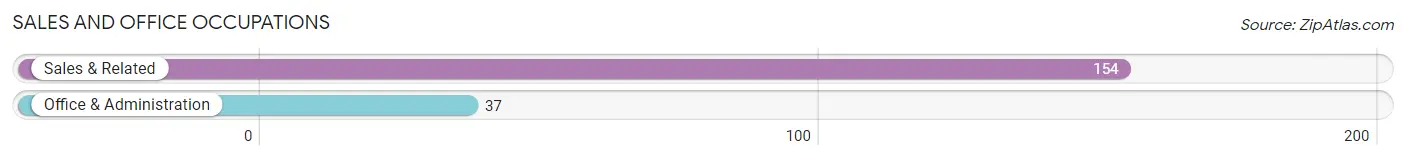
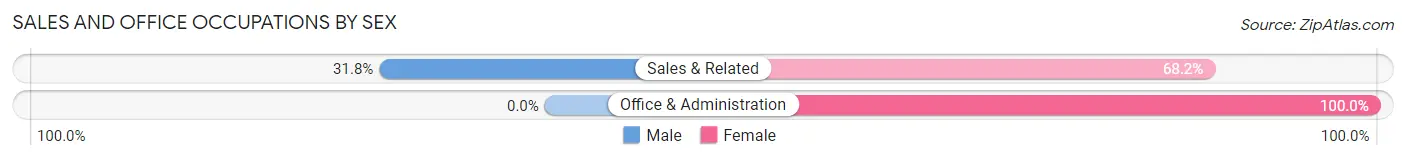
Sales and Office Occupations
The most common Sales and Office occupations in West Simsbury are Sales & Related (154 | 13.6%), and Office & Administration (37 | 3.3%).
Sales and Office Occupations by Sex
| Occupation | Male | Female |
| Sales & Related | 49 (31.8%) | 105 (68.2%) |
| Office & Administration | 0 (0.0%) | 37 (100.0%) |
| Total (Category) | 49 (25.7%) | 142 (74.4%) |
| Total (Overall) | 659 (58.1%) | 476 (41.9%) |
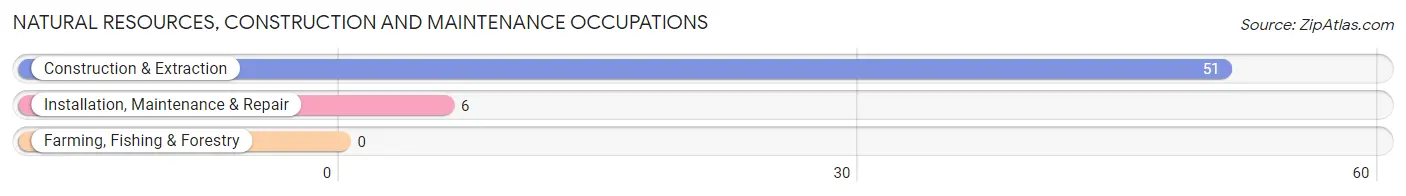
Natural Resources, Construction and Maintenance Occupations
The most common Natural Resources, Construction and Maintenance occupations in West Simsbury are Construction & Extraction (51 | 4.5%), and Installation, Maintenance & Repair (6 | 0.5%).
Natural Resources, Construction and Maintenance Occupations by Sex

| Occupation | Male | Female |
| Farming, Fishing & Forestry | 0 (0.0%) | 0 (0.0%) |
| Construction & Extraction | 51 (100.0%) | 0 (0.0%) |
| Installation, Maintenance & Repair | 6 (100.0%) | 0 (0.0%) |
| Total (Category) | 57 (100.0%) | 0 (0.0%) |
| Total (Overall) | 659 (58.1%) | 476 (41.9%) |
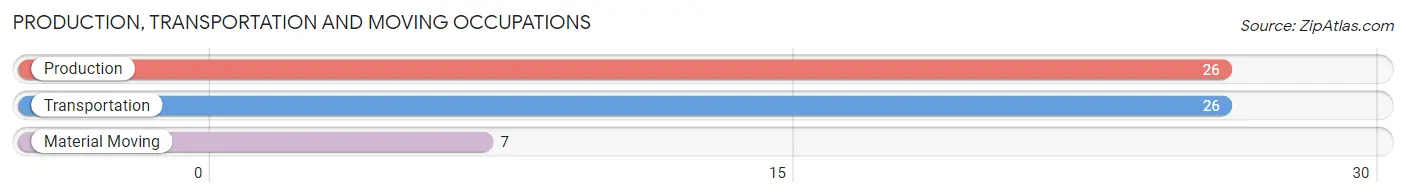
Production, Transportation and Moving Occupations
The most common Production, Transportation and Moving occupations in West Simsbury are Production (26 | 2.3%), Transportation (26 | 2.3%), and Material Moving (7 | 0.6%).
Production, Transportation and Moving Occupations by Sex
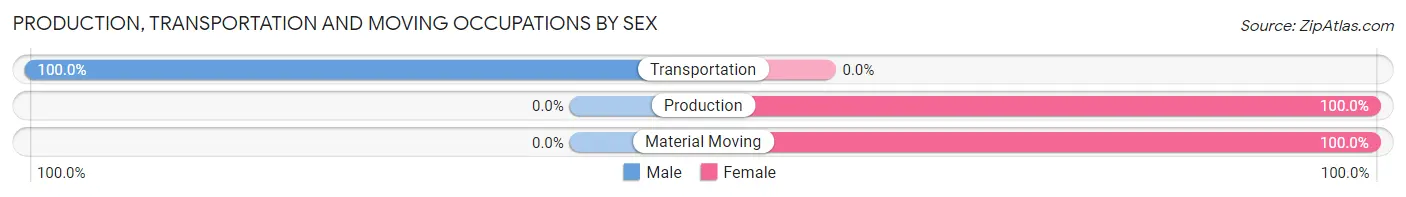
| Occupation | Male | Female |
| Production | 0 (0.0%) | 26 (100.0%) |
| Transportation | 26 (100.0%) | 0 (0.0%) |
| Material Moving | 0 (0.0%) | 7 (100.0%) |
| Total (Category) | 26 (44.1%) | 33 (55.9%) |
| Total (Overall) | 659 (58.1%) | 476 (41.9%) |
Employment Industries by Sex in West Simsbury
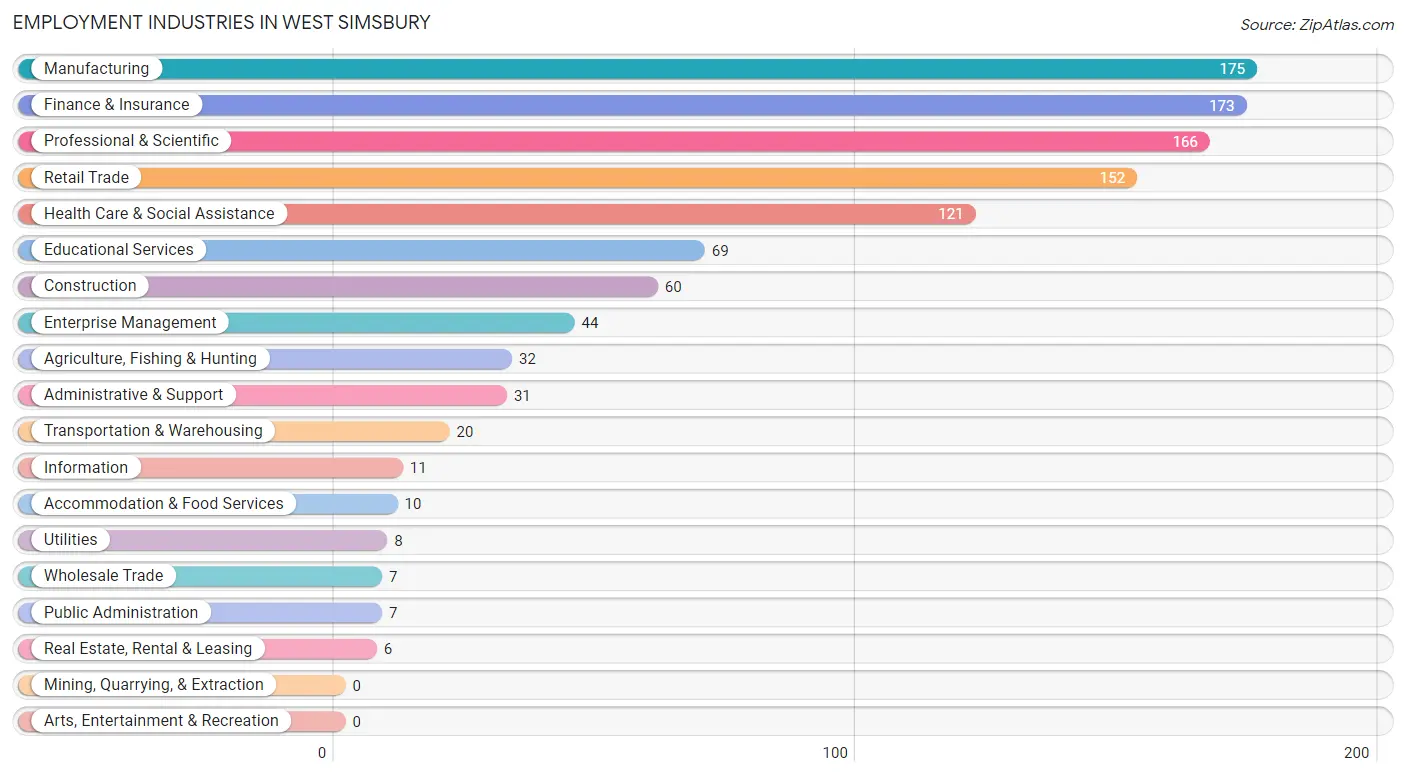
Employment Industries in West Simsbury
The major employment industries in West Simsbury include Manufacturing (175 | 15.4%), Finance & Insurance (173 | 15.2%), Professional & Scientific (166 | 14.6%), Retail Trade (152 | 13.4%), and Health Care & Social Assistance (121 | 10.7%).
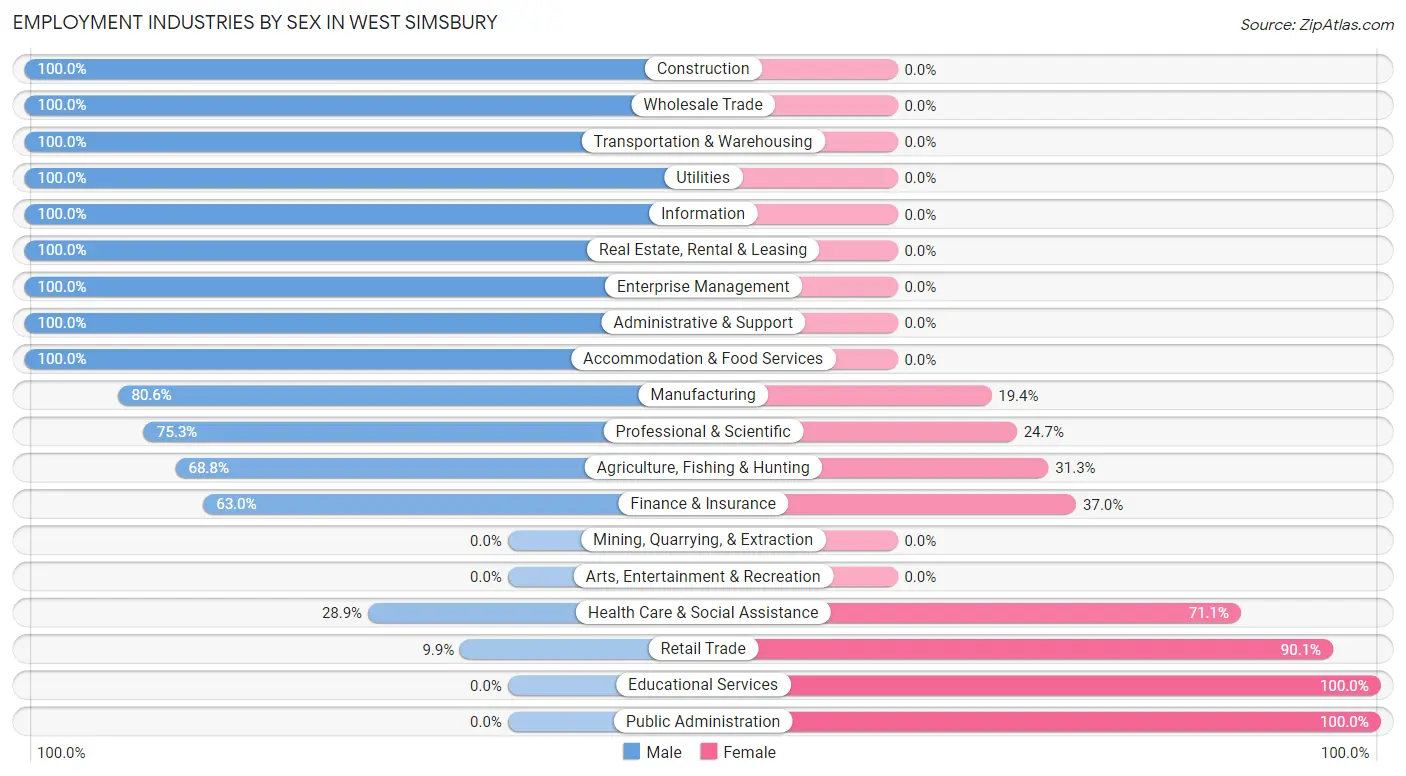
Employment Industries by Sex in West Simsbury
The West Simsbury industries that see more men than women are Construction (100.0%), Wholesale Trade (100.0%), and Transportation & Warehousing (100.0%), whereas the industries that tend to have a higher number of women are Educational Services (100.0%), Public Administration (100.0%), and Retail Trade (90.1%).
| Industry | Male | Female |
| Agriculture, Fishing & Hunting | 22 (68.8%) | 10 (31.2%) |
| Mining, Quarrying, & Extraction | 0 (0.0%) | 0 (0.0%) |
| Construction | 60 (100.0%) | 0 (0.0%) |
| Manufacturing | 141 (80.6%) | 34 (19.4%) |
| Wholesale Trade | 7 (100.0%) | 0 (0.0%) |
| Retail Trade | 15 (9.9%) | 137 (90.1%) |
| Transportation & Warehousing | 20 (100.0%) | 0 (0.0%) |
| Utilities | 8 (100.0%) | 0 (0.0%) |
| Information | 11 (100.0%) | 0 (0.0%) |
| Finance & Insurance | 109 (63.0%) | 64 (37.0%) |
| Real Estate, Rental & Leasing | 6 (100.0%) | 0 (0.0%) |
| Professional & Scientific | 125 (75.3%) | 41 (24.7%) |
| Enterprise Management | 44 (100.0%) | 0 (0.0%) |
| Administrative & Support | 31 (100.0%) | 0 (0.0%) |
| Educational Services | 0 (0.0%) | 69 (100.0%) |
| Health Care & Social Assistance | 35 (28.9%) | 86 (71.1%) |
| Arts, Entertainment & Recreation | 0 (0.0%) | 0 (0.0%) |
| Accommodation & Food Services | 10 (100.0%) | 0 (0.0%) |
| Public Administration | 0 (0.0%) | 7 (100.0%) |
| Total | 659 (58.1%) | 476 (41.9%) |
Education in West Simsbury
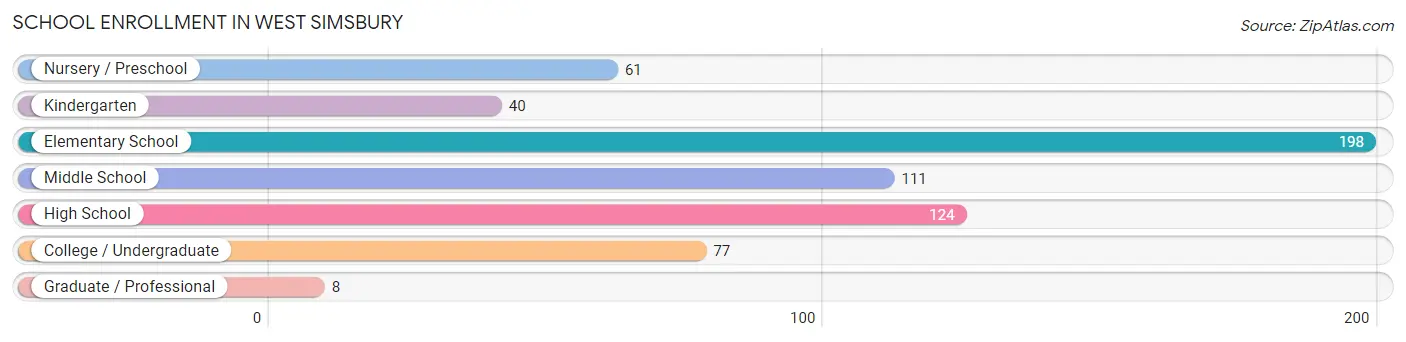
School Enrollment in West Simsbury
The most common levels of schooling among the 619 students in West Simsbury are elementary school (198 | 32.0%), high school (124 | 20.0%), and middle school (111 | 17.9%).
| School Level | # Students | % Students |
| Nursery / Preschool | 61 | 9.9% |
| Kindergarten | 40 | 6.5% |
| Elementary School | 198 | 32.0% |
| Middle School | 111 | 17.9% |
| High School | 124 | 20.0% |
| College / Undergraduate | 77 | 12.4% |
| Graduate / Professional | 8 | 1.3% |
| Total | 619 | 100.0% |
School Enrollment by Age by Funding Source in West Simsbury
Out of a total of 619 students who are enrolled in schools in West Simsbury, 102 (16.5%) attend a private institution, while the remaining 517 (83.5%) are enrolled in public schools. The age group of 25 to 34 year olds has the highest likelihood of being enrolled in private schools, with 8 (47.1% in the age bracket) enrolled. Conversely, the age group of 20 to 24 year olds has the lowest likelihood of being enrolled in a private school, with 48 (100.0% in the age bracket) attending a public institution.
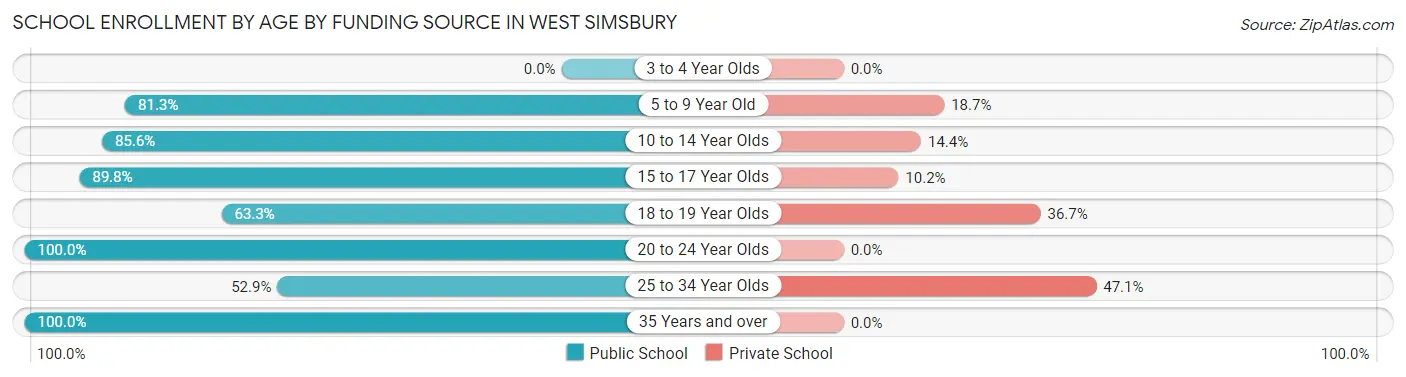
| Age Bracket | Public School | Private School |
| 3 to 4 Year Olds | 0 (0.0%) | 0 (0.0%) |
| 5 to 9 Year Old | 243 (81.3%) | 56 (18.7%) |
| 10 to 14 Year Olds | 101 (85.6%) | 17 (14.4%) |
| 15 to 17 Year Olds | 88 (89.8%) | 10 (10.2%) |
| 18 to 19 Year Olds | 19 (63.3%) | 11 (36.7%) |
| 20 to 24 Year Olds | 48 (100.0%) | 0 (0.0%) |
| 25 to 34 Year Olds | 9 (52.9%) | 8 (47.1%) |
| 35 Years and over | 9 (100.0%) | 0 (0.0%) |
| Total | 517 (83.5%) | 102 (16.5%) |
Educational Attainment by Field of Study in West Simsbury
Social sciences (282 | 20.1%), business (241 | 17.1%), physical & health sciences (126 | 9.0%), education (116 | 8.3%), and bio, nature & agricultural (115 | 8.2%) are the most common fields of study among 1,406 individuals in West Simsbury who have obtained a bachelor's degree or higher.
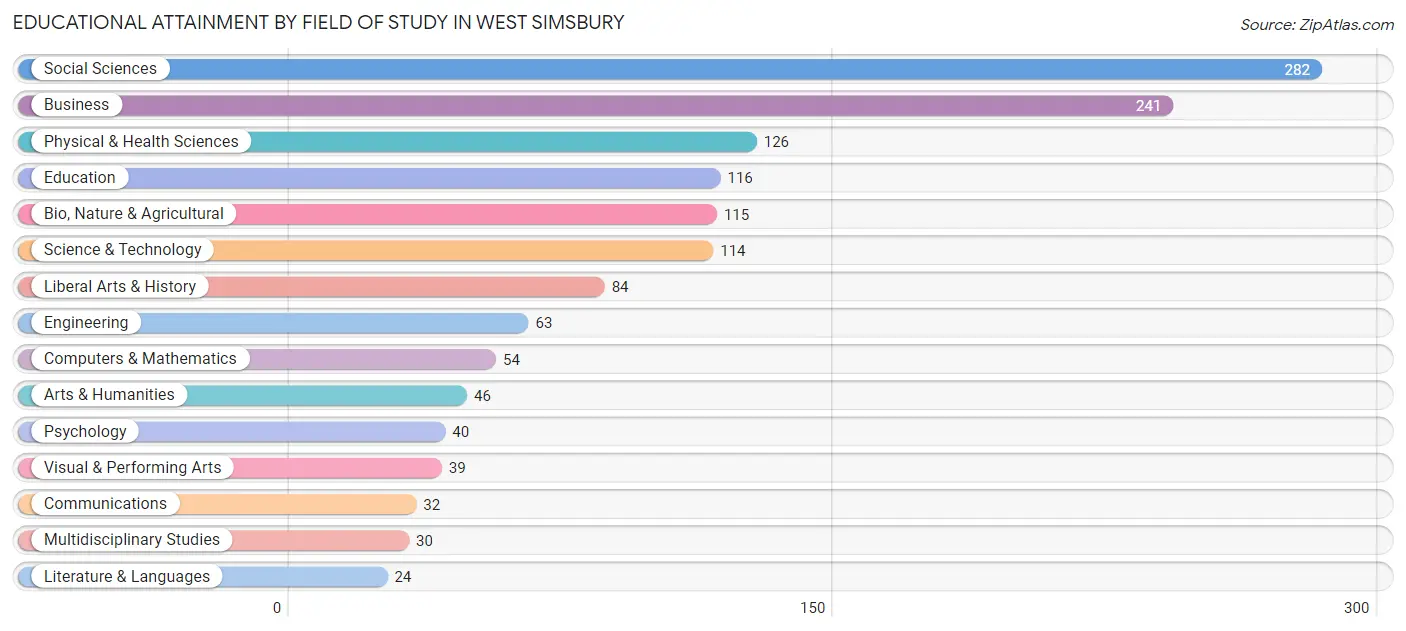
| Field of Study | # Graduates | % Graduates |
| Computers & Mathematics | 54 | 3.8% |
| Bio, Nature & Agricultural | 115 | 8.2% |
| Physical & Health Sciences | 126 | 9.0% |
| Psychology | 40 | 2.8% |
| Social Sciences | 282 | 20.1% |
| Engineering | 63 | 4.5% |
| Multidisciplinary Studies | 30 | 2.1% |
| Science & Technology | 114 | 8.1% |
| Business | 241 | 17.1% |
| Education | 116 | 8.3% |
| Literature & Languages | 24 | 1.7% |
| Liberal Arts & History | 84 | 6.0% |
| Visual & Performing Arts | 39 | 2.8% |
| Communications | 32 | 2.3% |
| Arts & Humanities | 46 | 3.3% |
| Total | 1,406 | 100.0% |
Transportation & Commute in West Simsbury
Vehicle Availability by Sex in West Simsbury
The most prevalent vehicle ownership categories in West Simsbury are males with 2 vehicles (328, accounting for 49.8%) and females with 2 vehicles (238, making up 69.3%).
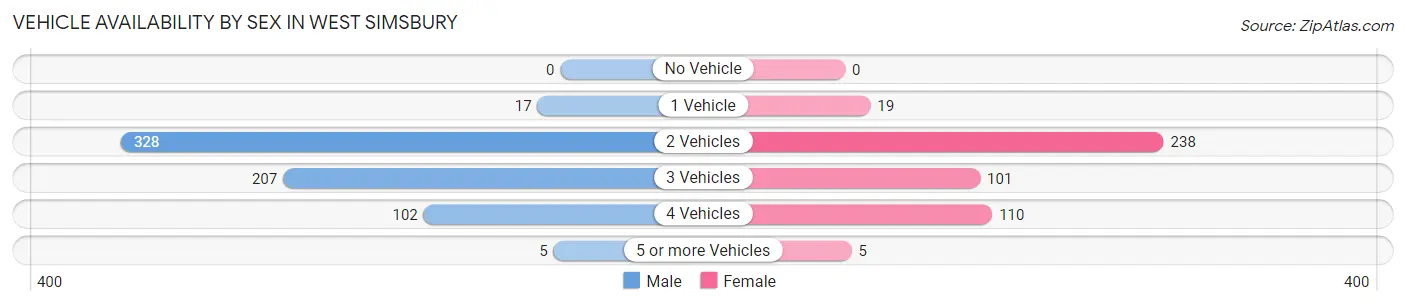
| Vehicles Available | Male | Female |
| No Vehicle | 0 (0.0%) | 0 (0.0%) |
| 1 Vehicle | 17 (2.6%) | 19 (4.0%) |
| 2 Vehicles | 328 (49.8%) | 238 (50.3%) |
| 3 Vehicles | 207 (31.4%) | 101 (21.3%) |
| 4 Vehicles | 102 (15.5%) | 110 (23.3%) |
| 5 or more Vehicles | 5 (0.8%) | 5 (1.1%) |
| Total | 659 (100.0%) | 473 (100.0%) |
Commute Time in West Simsbury
The most frequently occuring commute durations in West Simsbury are 10 to 14 minutes (173 commuters, 20.6%), 30 to 34 minutes (146 commuters, 17.4%), and 5 to 9 minutes (107 commuters, 12.8%).
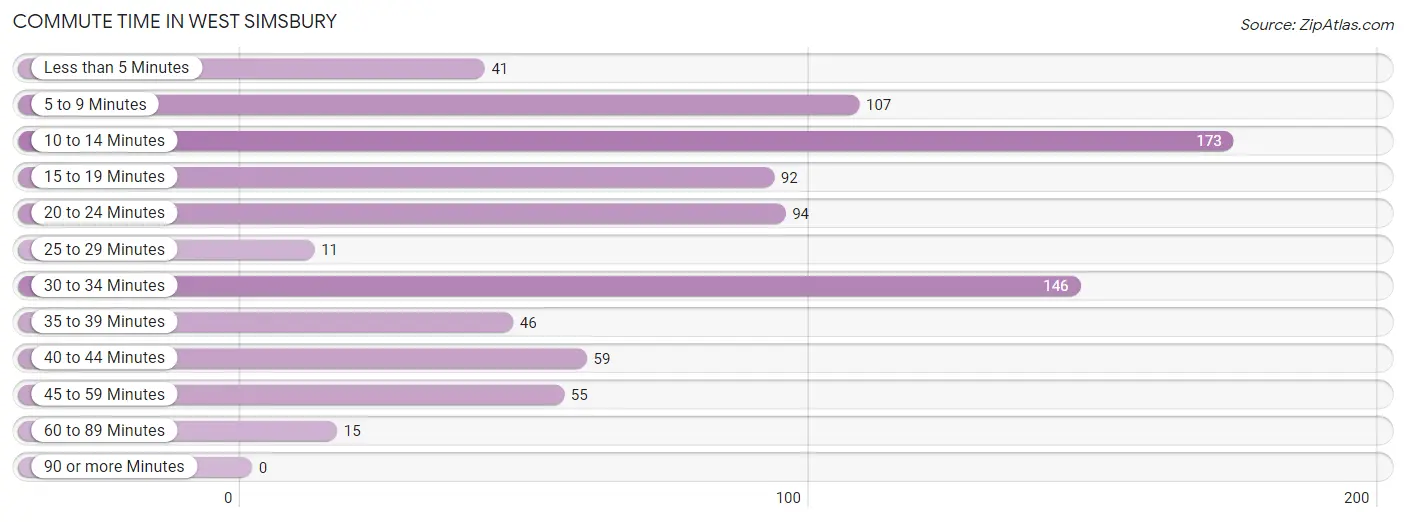
| Commute Time | # Commuters | % Commuters |
| Less than 5 Minutes | 41 | 4.9% |
| 5 to 9 Minutes | 107 | 12.8% |
| 10 to 14 Minutes | 173 | 20.6% |
| 15 to 19 Minutes | 92 | 11.0% |
| 20 to 24 Minutes | 94 | 11.2% |
| 25 to 29 Minutes | 11 | 1.3% |
| 30 to 34 Minutes | 146 | 17.4% |
| 35 to 39 Minutes | 46 | 5.5% |
| 40 to 44 Minutes | 59 | 7.0% |
| 45 to 59 Minutes | 55 | 6.6% |
| 60 to 89 Minutes | 15 | 1.8% |
| 90 or more Minutes | 0 | 0.0% |
Commute Time by Sex in West Simsbury
The most common commute times in West Simsbury are 30 to 34 minutes (108 commuters, 26.5%) for males and 10 to 14 minutes (166 commuters, 38.4%) for females.
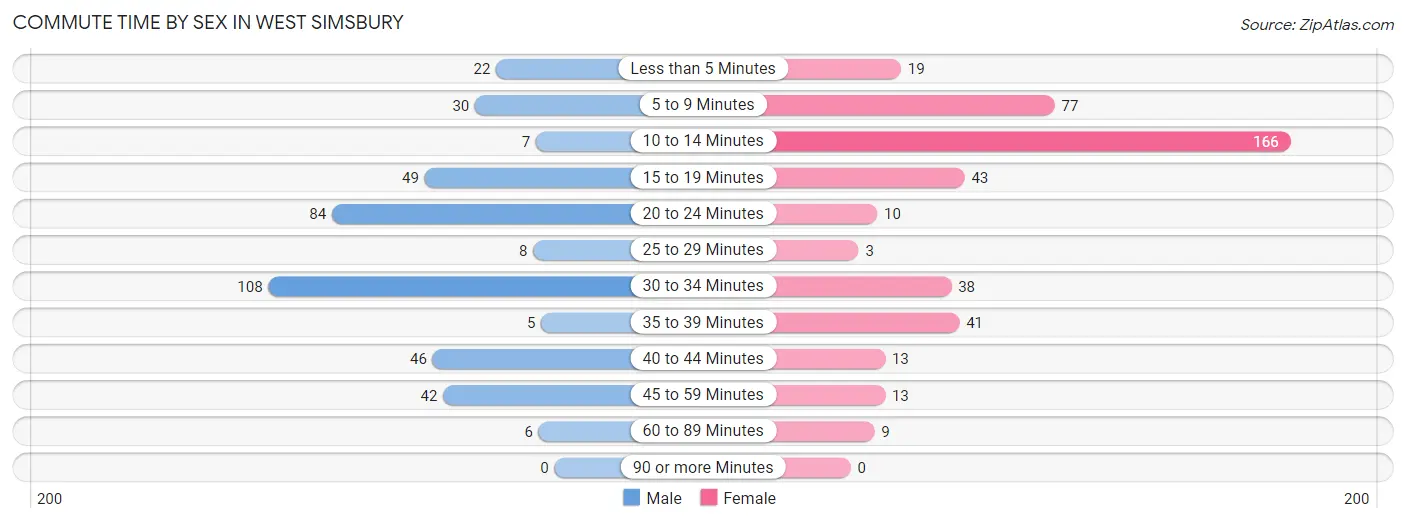
| Commute Time | Male | Female |
| Less than 5 Minutes | 22 (5.4%) | 19 (4.4%) |
| 5 to 9 Minutes | 30 (7.4%) | 77 (17.8%) |
| 10 to 14 Minutes | 7 (1.7%) | 166 (38.4%) |
| 15 to 19 Minutes | 49 (12.0%) | 43 (10.0%) |
| 20 to 24 Minutes | 84 (20.6%) | 10 (2.3%) |
| 25 to 29 Minutes | 8 (2.0%) | 3 (0.7%) |
| 30 to 34 Minutes | 108 (26.5%) | 38 (8.8%) |
| 35 to 39 Minutes | 5 (1.2%) | 41 (9.5%) |
| 40 to 44 Minutes | 46 (11.3%) | 13 (3.0%) |
| 45 to 59 Minutes | 42 (10.3%) | 13 (3.0%) |
| 60 to 89 Minutes | 6 (1.5%) | 9 (2.1%) |
| 90 or more Minutes | 0 (0.0%) | 0 (0.0%) |
Time of Departure to Work by Sex in West Simsbury
The most frequent times of departure to work in West Simsbury are 7:00 AM to 7:29 AM (81, 19.9%) for males and 8:30 AM to 8:59 AM (139, 32.2%) for females.
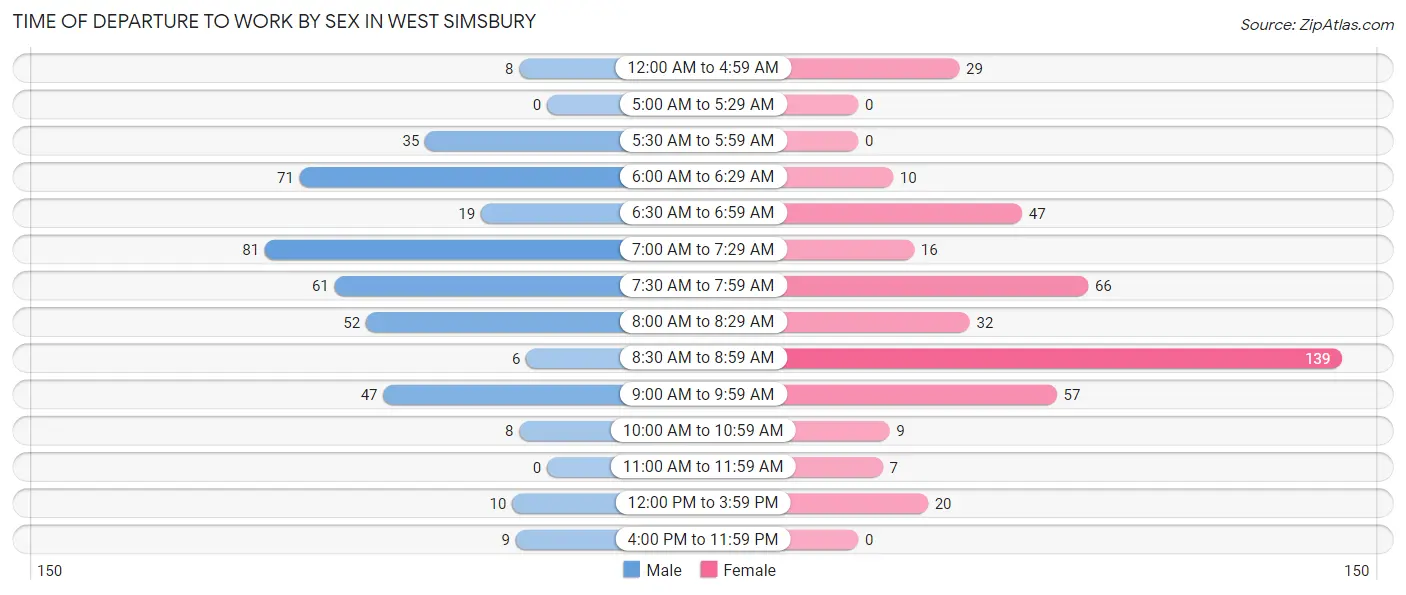
| Time of Departure | Male | Female |
| 12:00 AM to 4:59 AM | 8 (2.0%) | 29 (6.7%) |
| 5:00 AM to 5:29 AM | 0 (0.0%) | 0 (0.0%) |
| 5:30 AM to 5:59 AM | 35 (8.6%) | 0 (0.0%) |
| 6:00 AM to 6:29 AM | 71 (17.4%) | 10 (2.3%) |
| 6:30 AM to 6:59 AM | 19 (4.7%) | 47 (10.9%) |
| 7:00 AM to 7:29 AM | 81 (19.9%) | 16 (3.7%) |
| 7:30 AM to 7:59 AM | 61 (15.0%) | 66 (15.3%) |
| 8:00 AM to 8:29 AM | 52 (12.8%) | 32 (7.4%) |
| 8:30 AM to 8:59 AM | 6 (1.5%) | 139 (32.2%) |
| 9:00 AM to 9:59 AM | 47 (11.6%) | 57 (13.2%) |
| 10:00 AM to 10:59 AM | 8 (2.0%) | 9 (2.1%) |
| 11:00 AM to 11:59 AM | 0 (0.0%) | 7 (1.6%) |
| 12:00 PM to 3:59 PM | 10 (2.5%) | 20 (4.6%) |
| 4:00 PM to 11:59 PM | 9 (2.2%) | 0 (0.0%) |
| Total | 407 (100.0%) | 432 (100.0%) |
Housing Occupancy in West Simsbury
Occupancy by Ownership in West Simsbury
Of the total 865 dwellings in West Simsbury, owner-occupied units account for 775 (89.6%), while renter-occupied units make up 90 (10.4%).
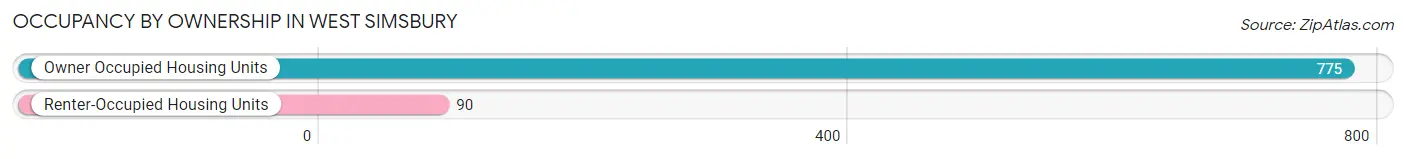
| Occupancy | # Housing Units | % Housing Units |
| Owner Occupied Housing Units | 775 | 89.6% |
| Renter-Occupied Housing Units | 90 | 10.4% |
| Total Occupied Housing Units | 865 | 100.0% |
Occupancy by Household Size in West Simsbury
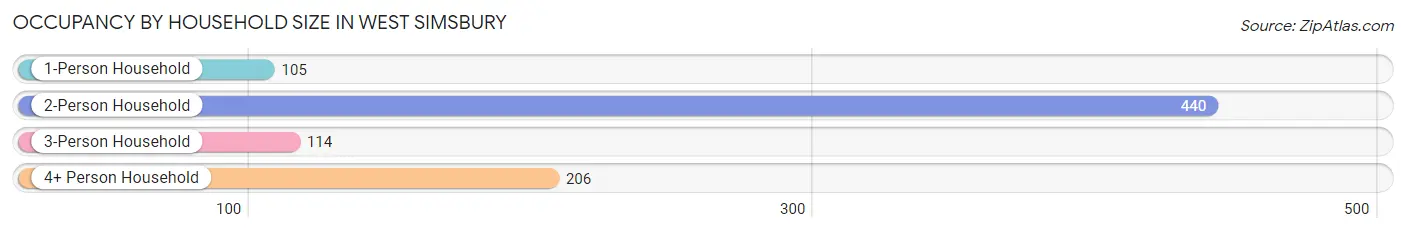
| Household Size | # Housing Units | % Housing Units |
| 1-Person Household | 105 | 12.1% |
| 2-Person Household | 440 | 50.9% |
| 3-Person Household | 114 | 13.2% |
| 4+ Person Household | 206 | 23.8% |
| Total Housing Units | 865 | 100.0% |
Occupancy by Ownership by Household Size in West Simsbury
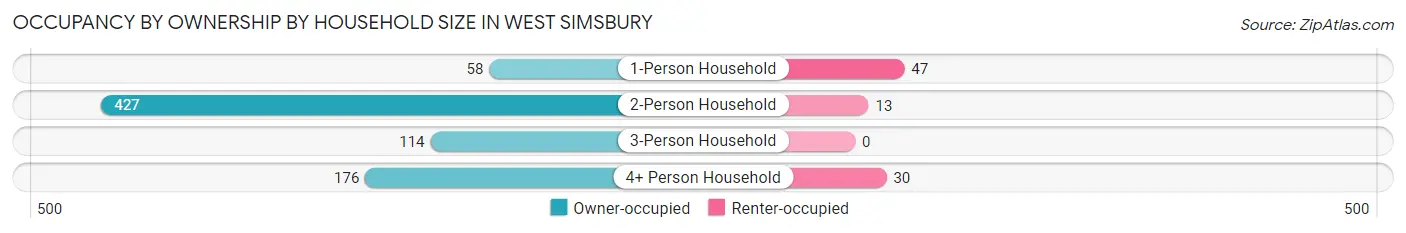
| Household Size | Owner-occupied | Renter-occupied |
| 1-Person Household | 58 (55.2%) | 47 (44.8%) |
| 2-Person Household | 427 (97.1%) | 13 (2.9%) |
| 3-Person Household | 114 (100.0%) | 0 (0.0%) |
| 4+ Person Household | 176 (85.4%) | 30 (14.6%) |
| Total Housing Units | 775 (89.6%) | 90 (10.4%) |
Occupancy by Educational Attainment in West Simsbury
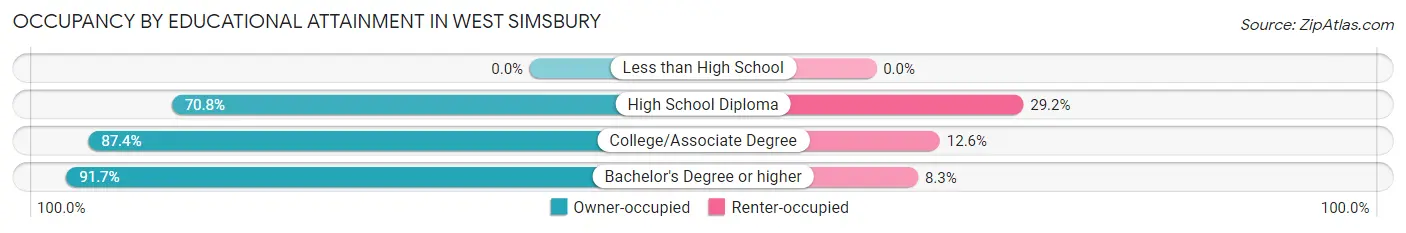
| Household Size | Owner-occupied | Renter-occupied |
| Less than High School | 0 (0.0%) | 0 (0.0%) |
| High School Diploma | 34 (70.8%) | 14 (29.2%) |
| College/Associate Degree | 166 (87.4%) | 24 (12.6%) |
| Bachelor's Degree or higher | 575 (91.7%) | 52 (8.3%) |
Occupancy by Age of Householder in West Simsbury
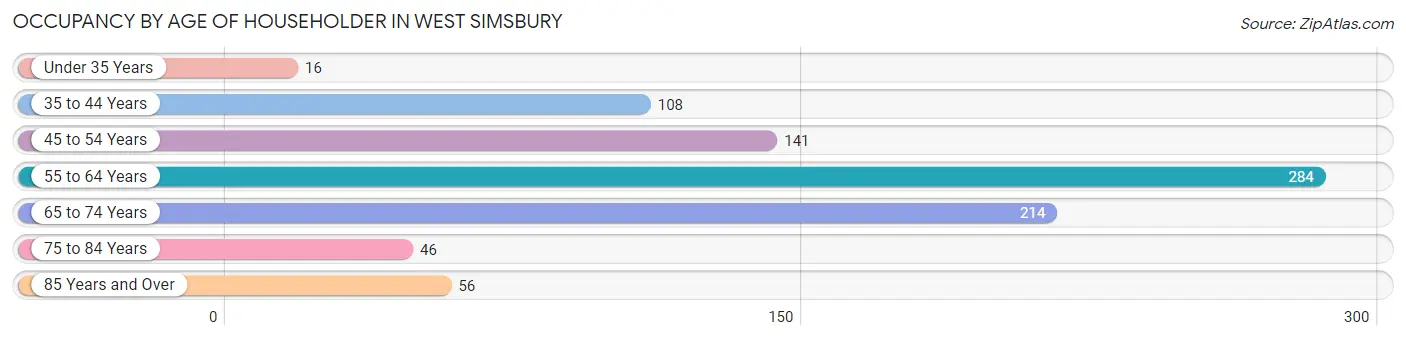
| Age Bracket | # Households | % Households |
| Under 35 Years | 16 | 1.8% |
| 35 to 44 Years | 108 | 12.5% |
| 45 to 54 Years | 141 | 16.3% |
| 55 to 64 Years | 284 | 32.8% |
| 65 to 74 Years | 214 | 24.7% |
| 75 to 84 Years | 46 | 5.3% |
| 85 Years and Over | 56 | 6.5% |
| Total | 865 | 100.0% |
Housing Finances in West Simsbury
Median Income by Occupancy in West Simsbury
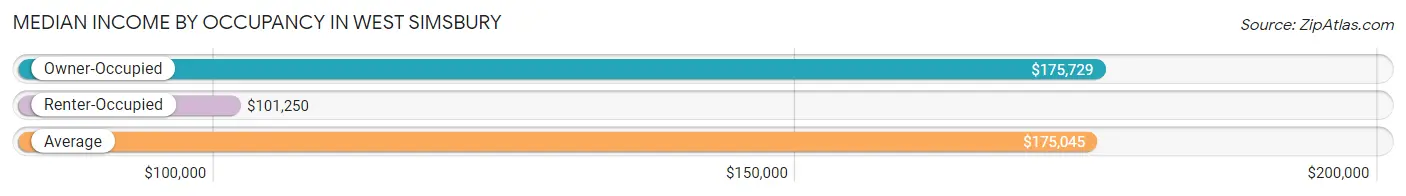
| Occupancy Type | # Households | Median Income |
| Owner-Occupied | 775 (89.6%) | $175,729 |
| Renter-Occupied | 90 (10.4%) | $101,250 |
| Average | 865 (100.0%) | $175,045 |
Occupancy by Householder Income Bracket in West Simsbury
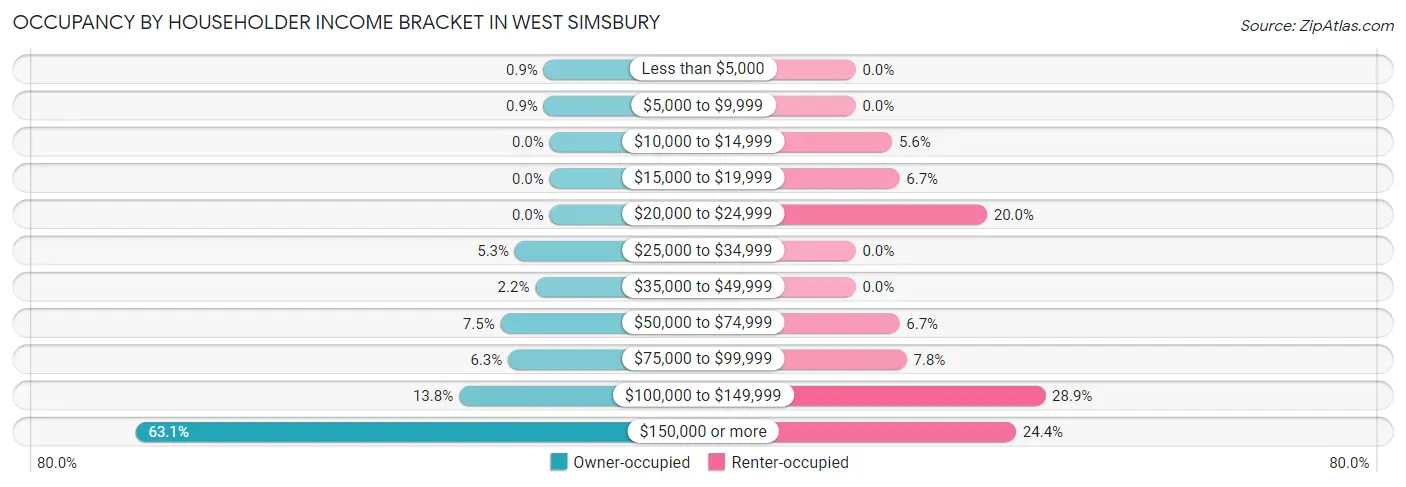
| Income Bracket | Owner-occupied | Renter-occupied |
| Less than $5,000 | 7 (0.9%) | 0 (0.0%) |
| $5,000 to $9,999 | 7 (0.9%) | 0 (0.0%) |
| $10,000 to $14,999 | 0 (0.0%) | 5 (5.6%) |
| $15,000 to $19,999 | 0 (0.0%) | 6 (6.7%) |
| $20,000 to $24,999 | 0 (0.0%) | 18 (20.0%) |
| $25,000 to $34,999 | 41 (5.3%) | 0 (0.0%) |
| $35,000 to $49,999 | 17 (2.2%) | 0 (0.0%) |
| $50,000 to $74,999 | 58 (7.5%) | 6 (6.7%) |
| $75,000 to $99,999 | 49 (6.3%) | 7 (7.8%) |
| $100,000 to $149,999 | 107 (13.8%) | 26 (28.9%) |
| $150,000 or more | 489 (63.1%) | 22 (24.4%) |
| Total | 775 (100.0%) | 90 (100.0%) |
Monthly Housing Cost Tiers in West Simsbury
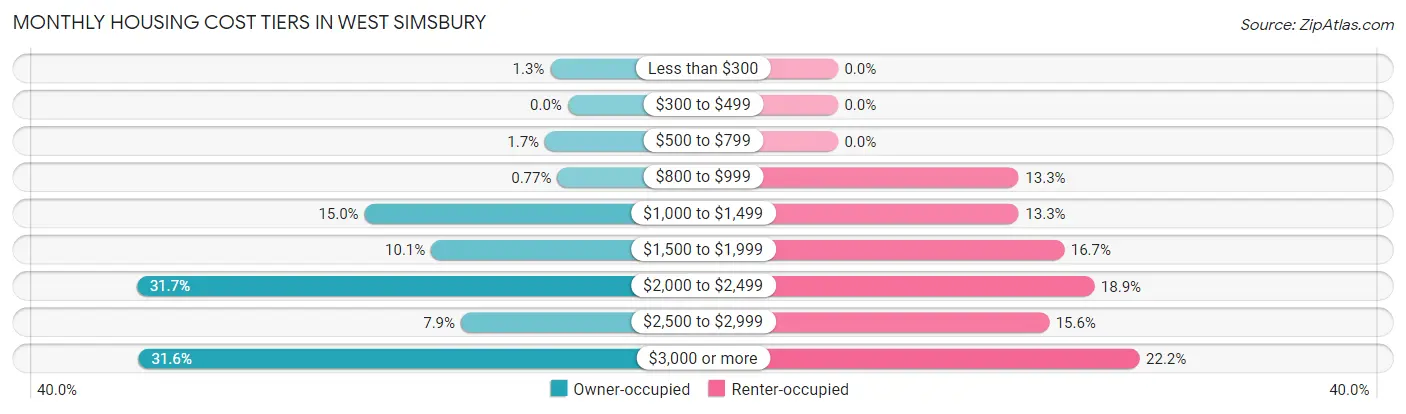
| Monthly Cost | Owner-occupied | Renter-occupied |
| Less than $300 | 10 (1.3%) | 0 (0.0%) |
| $300 to $499 | 0 (0.0%) | 0 (0.0%) |
| $500 to $799 | 13 (1.7%) | 0 (0.0%) |
| $800 to $999 | 6 (0.8%) | 12 (13.3%) |
| $1,000 to $1,499 | 116 (15.0%) | 12 (13.3%) |
| $1,500 to $1,999 | 78 (10.1%) | 15 (16.7%) |
| $2,000 to $2,499 | 246 (31.7%) | 17 (18.9%) |
| $2,500 to $2,999 | 61 (7.9%) | 14 (15.6%) |
| $3,000 or more | 245 (31.6%) | 20 (22.2%) |
| Total | 775 (100.0%) | 90 (100.0%) |
Physical Housing Characteristics in West Simsbury
Housing Structures in West Simsbury
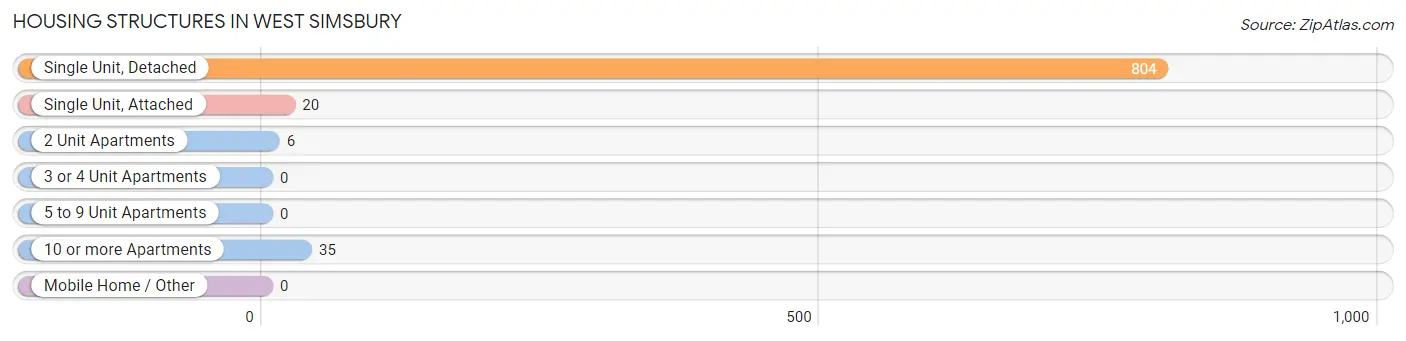
| Structure Type | # Housing Units | % Housing Units |
| Single Unit, Detached | 804 | 92.9% |
| Single Unit, Attached | 20 | 2.3% |
| 2 Unit Apartments | 6 | 0.7% |
| 3 or 4 Unit Apartments | 0 | 0.0% |
| 5 to 9 Unit Apartments | 0 | 0.0% |
| 10 or more Apartments | 35 | 4.1% |
| Mobile Home / Other | 0 | 0.0% |
| Total | 865 | 100.0% |
Housing Structures by Occupancy in West Simsbury
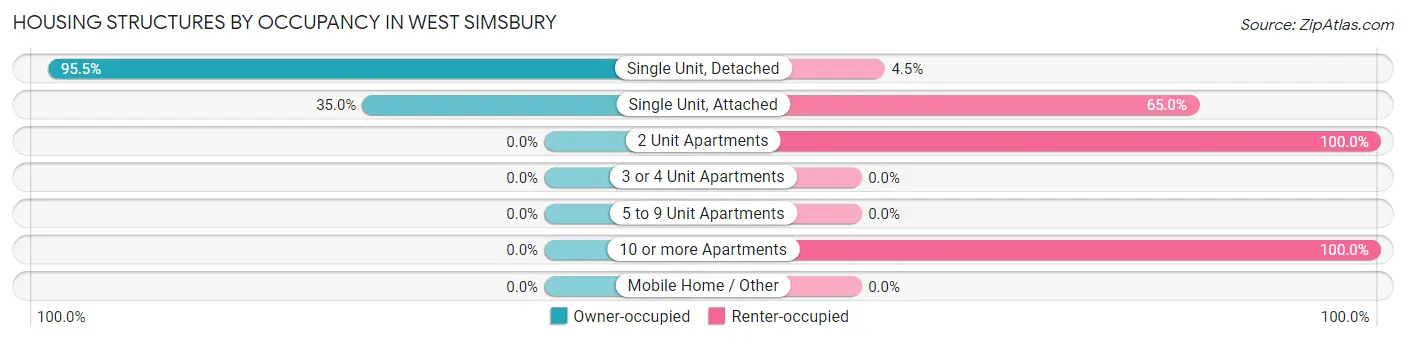
| Structure Type | Owner-occupied | Renter-occupied |
| Single Unit, Detached | 768 (95.5%) | 36 (4.5%) |
| Single Unit, Attached | 7 (35.0%) | 13 (65.0%) |
| 2 Unit Apartments | 0 (0.0%) | 6 (100.0%) |
| 3 or 4 Unit Apartments | 0 (0.0%) | 0 (0.0%) |
| 5 to 9 Unit Apartments | 0 (0.0%) | 0 (0.0%) |
| 10 or more Apartments | 0 (0.0%) | 35 (100.0%) |
| Mobile Home / Other | 0 (0.0%) | 0 (0.0%) |
| Total | 775 (89.6%) | 90 (10.4%) |
Housing Structures by Number of Rooms in West Simsbury
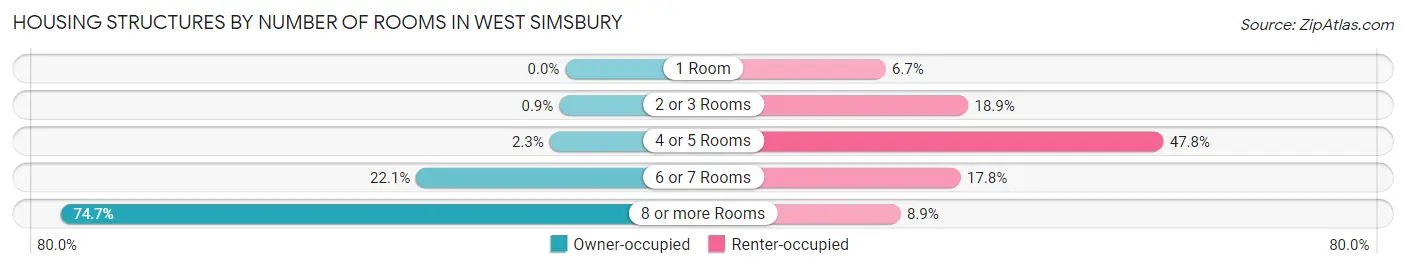
| Number of Rooms | Owner-occupied | Renter-occupied |
| 1 Room | 0 (0.0%) | 6 (6.7%) |
| 2 or 3 Rooms | 7 (0.9%) | 17 (18.9%) |
| 4 or 5 Rooms | 18 (2.3%) | 43 (47.8%) |
| 6 or 7 Rooms | 171 (22.1%) | 16 (17.8%) |
| 8 or more Rooms | 579 (74.7%) | 8 (8.9%) |
| Total | 775 (100.0%) | 90 (100.0%) |
Housing Structure by Heating Type in West Simsbury
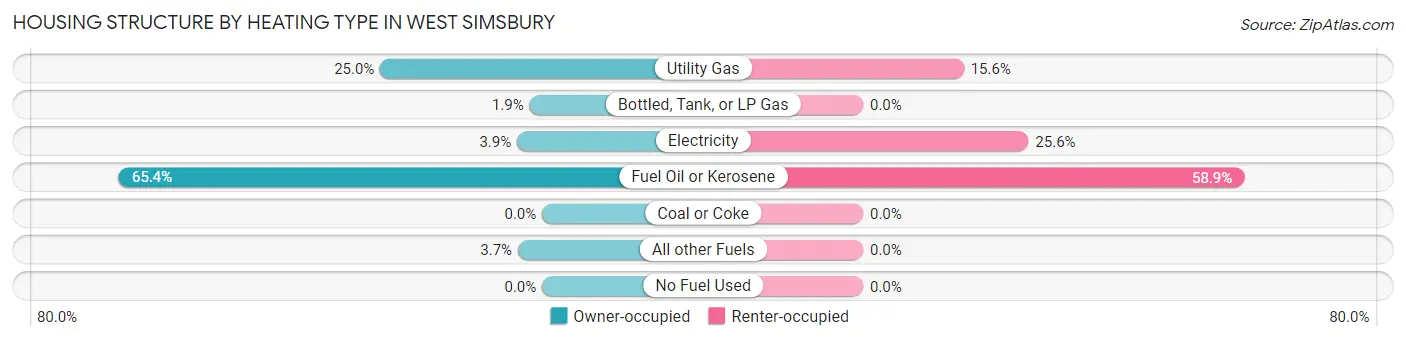
| Heating Type | Owner-occupied | Renter-occupied |
| Utility Gas | 194 (25.0%) | 14 (15.6%) |
| Bottled, Tank, or LP Gas | 15 (1.9%) | 0 (0.0%) |
| Electricity | 30 (3.9%) | 23 (25.6%) |
| Fuel Oil or Kerosene | 507 (65.4%) | 53 (58.9%) |
| Coal or Coke | 0 (0.0%) | 0 (0.0%) |
| All other Fuels | 29 (3.7%) | 0 (0.0%) |
| No Fuel Used | 0 (0.0%) | 0 (0.0%) |
| Total | 775 (100.0%) | 90 (100.0%) |
Household Vehicle Usage in West Simsbury
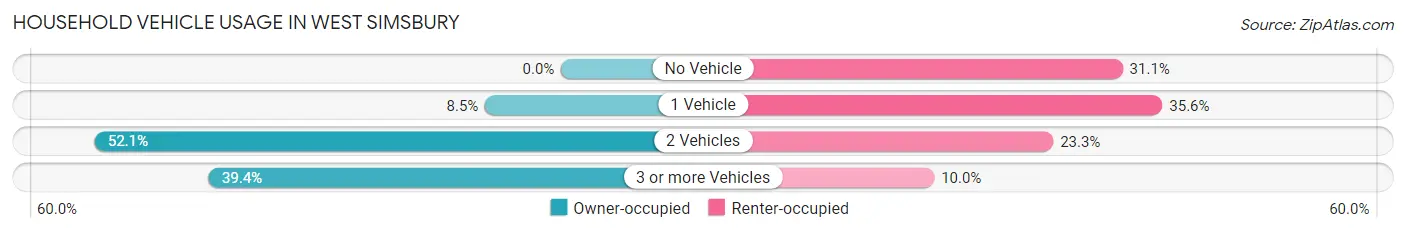
| Vehicles per Household | Owner-occupied | Renter-occupied |
| No Vehicle | 0 (0.0%) | 28 (31.1%) |
| 1 Vehicle | 66 (8.5%) | 32 (35.6%) |
| 2 Vehicles | 404 (52.1%) | 21 (23.3%) |
| 3 or more Vehicles | 305 (39.4%) | 9 (10.0%) |
| Total | 775 (100.0%) | 90 (100.0%) |
Real Estate & Mortgages in West Simsbury
Real Estate and Mortgage Overview in West Simsbury
| Characteristic | Without Mortgage | With Mortgage |
| Housing Units | 270 | 505 |
| Median Property Value | $448,100 | $461,900 |
| Median Household Income | $230,769 | $329 |
| Monthly Housing Costs | $1,490 | $216 |
| Real Estate Taxes | $10,001 | $0 |
Property Value by Mortgage Status in West Simsbury
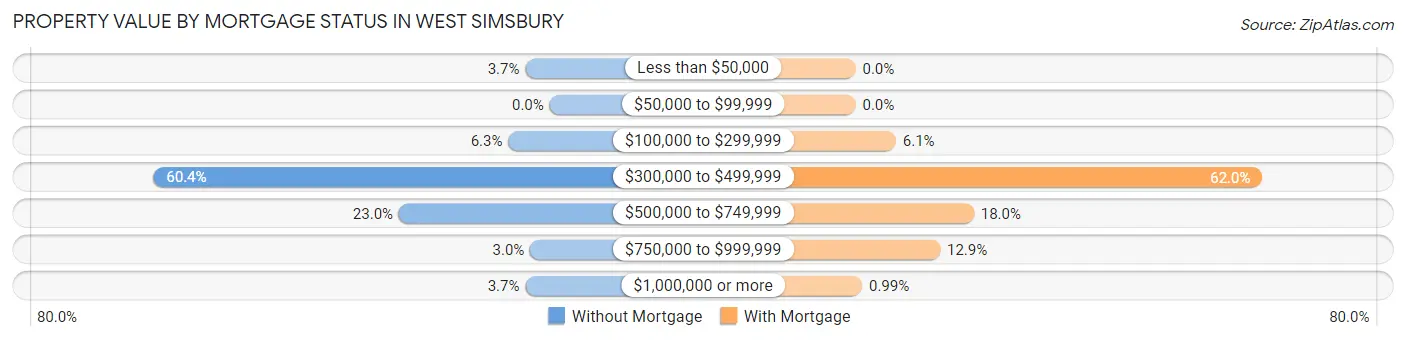
| Property Value | Without Mortgage | With Mortgage |
| Less than $50,000 | 10 (3.7%) | 0 (0.0%) |
| $50,000 to $99,999 | 0 (0.0%) | 0 (0.0%) |
| $100,000 to $299,999 | 17 (6.3%) | 31 (6.1%) |
| $300,000 to $499,999 | 163 (60.4%) | 313 (62.0%) |
| $500,000 to $749,999 | 62 (23.0%) | 91 (18.0%) |
| $750,000 to $999,999 | 8 (3.0%) | 65 (12.9%) |
| $1,000,000 or more | 10 (3.7%) | 5 (1.0%) |
| Total | 270 (100.0%) | 505 (100.0%) |
Household Income by Mortgage Status in West Simsbury
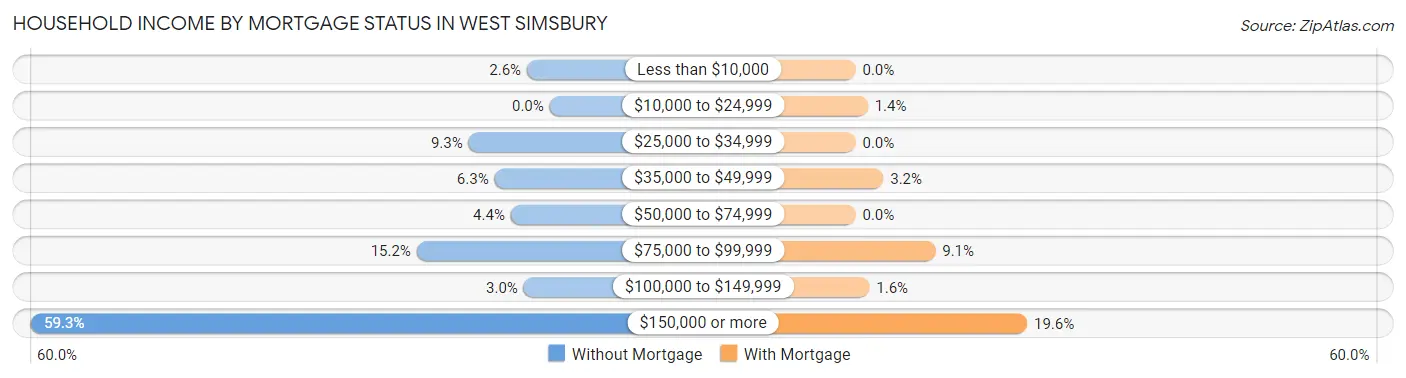
| Household Income | Without Mortgage | With Mortgage |
| Less than $10,000 | 7 (2.6%) | 0 (0.0%) |
| $10,000 to $24,999 | 0 (0.0%) | 7 (1.4%) |
| $25,000 to $34,999 | 25 (9.3%) | 0 (0.0%) |
| $35,000 to $49,999 | 17 (6.3%) | 16 (3.2%) |
| $50,000 to $74,999 | 12 (4.4%) | 0 (0.0%) |
| $75,000 to $99,999 | 41 (15.2%) | 46 (9.1%) |
| $100,000 to $149,999 | 8 (3.0%) | 8 (1.6%) |
| $150,000 or more | 160 (59.3%) | 99 (19.6%) |
| Total | 270 (100.0%) | 505 (100.0%) |
Property Value to Household Income Ratio in West Simsbury
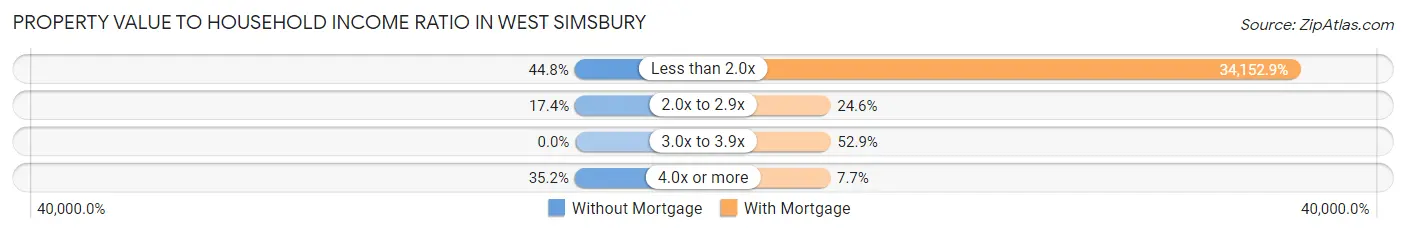
| Value-to-Income Ratio | Without Mortgage | With Mortgage |
| Less than 2.0x | 121 (44.8%) | 172,472 (34,152.9%) |
| 2.0x to 2.9x | 47 (17.4%) | 124 (24.5%) |
| 3.0x to 3.9x | 0 (0.0%) | 267 (52.9%) |
| 4.0x or more | 95 (35.2%) | 39 (7.7%) |
| Total | 270 (100.0%) | 505 (100.0%) |
Real Estate Taxes by Mortgage Status in West Simsbury
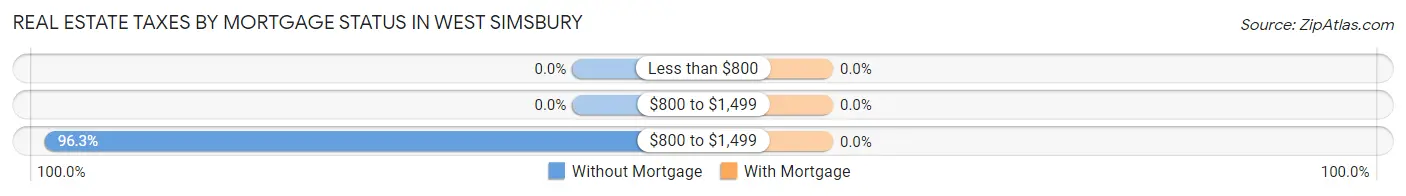
| Property Taxes | Without Mortgage | With Mortgage |
| Less than $800 | 0 (0.0%) | 0 (0.0%) |
| $800 to $1,499 | 0 (0.0%) | 0 (0.0%) |
| $800 to $1,499 | 260 (96.3%) | 0 (0.0%) |
| Total | 270 (100.0%) | 505 (100.0%) |
Health & Disability in West Simsbury
Health Insurance Coverage by Age in West Simsbury
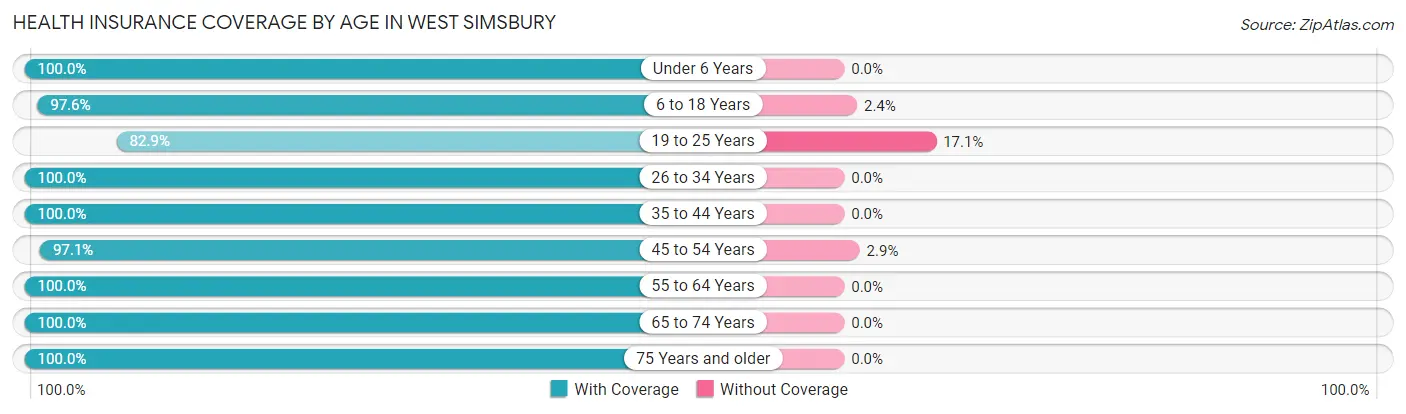
| Age Bracket | With Coverage | Without Coverage |
| Under 6 Years | 104 (100.0%) | 0 (0.0%) |
| 6 to 18 Years | 452 (97.6%) | 11 (2.4%) |
| 19 to 25 Years | 58 (82.9%) | 12 (17.1%) |
| 26 to 34 Years | 138 (100.0%) | 0 (0.0%) |
| 35 to 44 Years | 206 (100.0%) | 0 (0.0%) |
| 45 to 54 Years | 338 (97.1%) | 10 (2.9%) |
| 55 to 64 Years | 548 (100.0%) | 0 (0.0%) |
| 65 to 74 Years | 393 (100.0%) | 0 (0.0%) |
| 75 Years and older | 267 (100.0%) | 0 (0.0%) |
| Total | 2,504 (98.7%) | 33 (1.3%) |
Health Insurance Coverage by Citizenship Status in West Simsbury
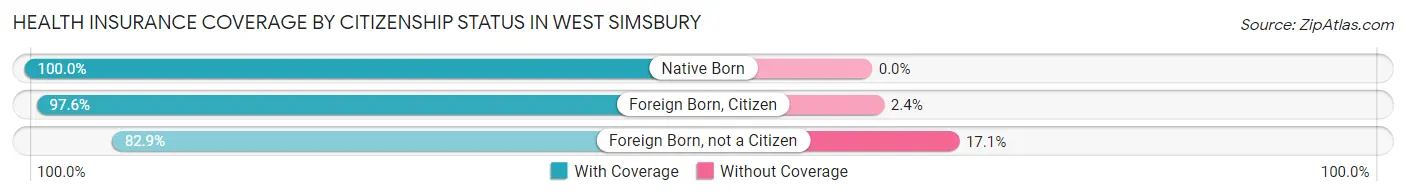
| Citizenship Status | With Coverage | Without Coverage |
| Native Born | 104 (100.0%) | 0 (0.0%) |
| Foreign Born, Citizen | 452 (97.6%) | 11 (2.4%) |
| Foreign Born, not a Citizen | 58 (82.9%) | 12 (17.1%) |
Health Insurance Coverage by Household Income in West Simsbury
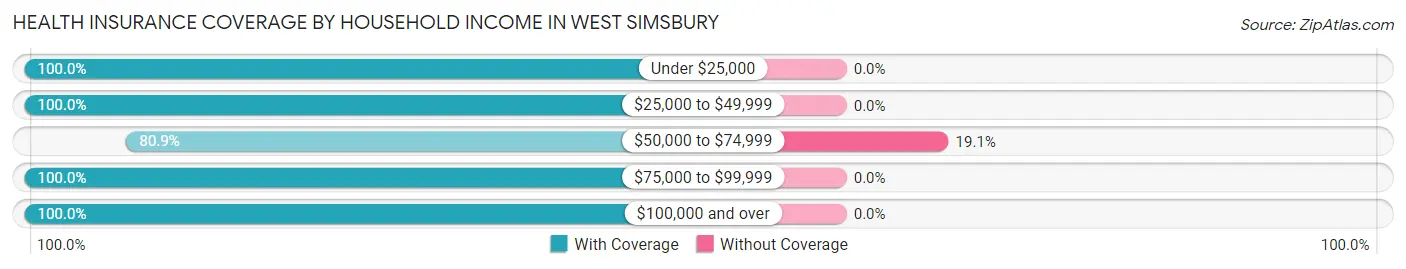
| Household Income | With Coverage | Without Coverage |
| Under $25,000 | 49 (100.0%) | 0 (0.0%) |
| $25,000 to $49,999 | 202 (100.0%) | 0 (0.0%) |
| $50,000 to $74,999 | 140 (80.9%) | 33 (19.1%) |
| $75,000 to $99,999 | 113 (100.0%) | 0 (0.0%) |
| $100,000 and over | 1,864 (100.0%) | 0 (0.0%) |
Public vs Private Health Insurance Coverage by Age in West Simsbury
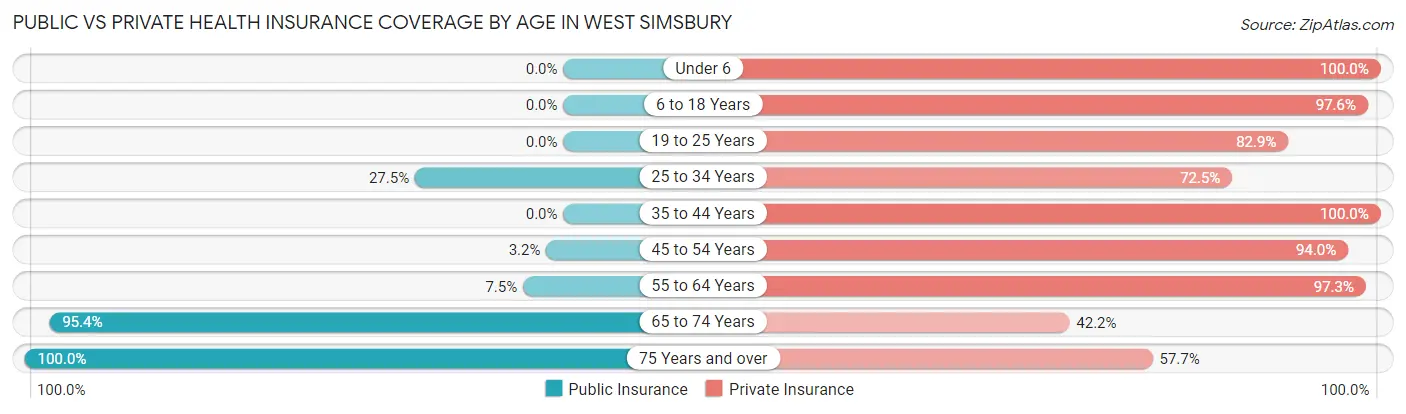
| Age Bracket | Public Insurance | Private Insurance |
| Under 6 | 0 (0.0%) | 104 (100.0%) |
| 6 to 18 Years | 0 (0.0%) | 452 (97.6%) |
| 19 to 25 Years | 0 (0.0%) | 58 (82.9%) |
| 25 to 34 Years | 38 (27.5%) | 100 (72.5%) |
| 35 to 44 Years | 0 (0.0%) | 206 (100.0%) |
| 45 to 54 Years | 11 (3.2%) | 327 (94.0%) |
| 55 to 64 Years | 41 (7.5%) | 533 (97.3%) |
| 65 to 74 Years | 375 (95.4%) | 166 (42.2%) |
| 75 Years and over | 267 (100.0%) | 154 (57.7%) |
| Total | 732 (28.8%) | 2,100 (82.8%) |
Disability Status by Sex by Age in West Simsbury
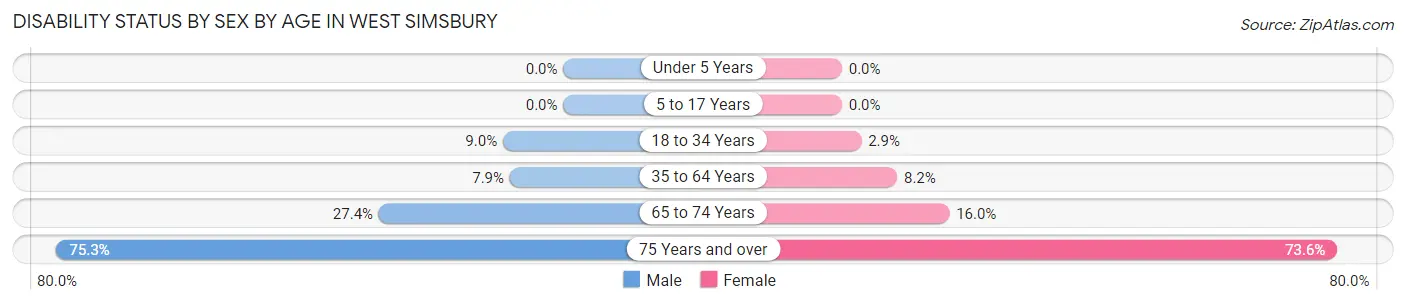
| Age Bracket | Male | Female |
| Under 5 Years | 0 (0.0%) | 0 (0.0%) |
| 5 to 17 Years | 0 (0.0%) | 0 (0.0%) |
| 18 to 34 Years | 12 (9.0%) | 3 (2.9%) |
| 35 to 64 Years | 42 (7.9%) | 47 (8.2%) |
| 65 to 74 Years | 63 (27.4%) | 26 (16.0%) |
| 75 Years and over | 70 (75.3%) | 128 (73.6%) |
Disability Class by Sex by Age in West Simsbury
Disability Class: Hearing Difficulty
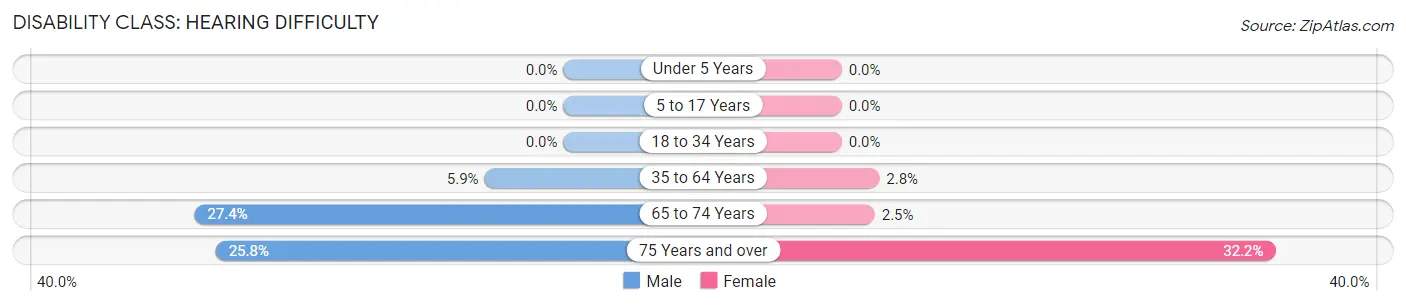
| Age Bracket | Male | Female |
| Under 5 Years | 0 (0.0%) | 0 (0.0%) |
| 5 to 17 Years | 0 (0.0%) | 0 (0.0%) |
| 18 to 34 Years | 0 (0.0%) | 0 (0.0%) |
| 35 to 64 Years | 31 (5.9%) | 16 (2.8%) |
| 65 to 74 Years | 63 (27.4%) | 4 (2.5%) |
| 75 Years and over | 24 (25.8%) | 56 (32.2%) |
Disability Class: Vision Difficulty
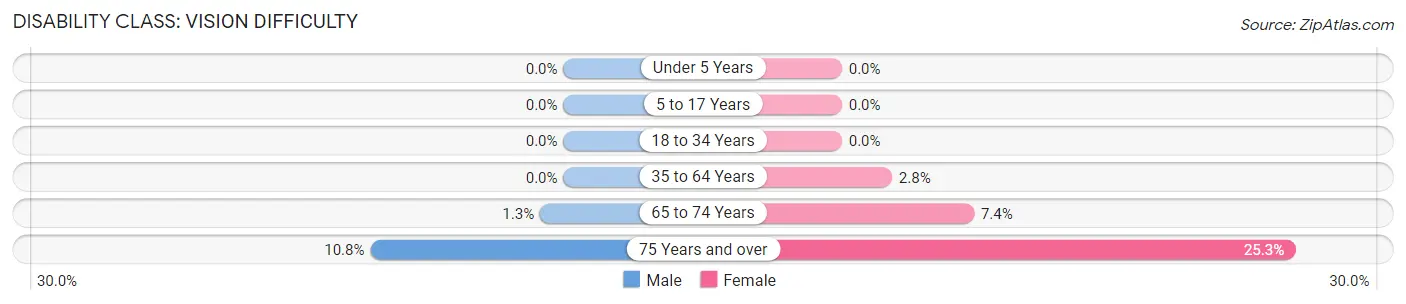
| Age Bracket | Male | Female |
| Under 5 Years | 0 (0.0%) | 0 (0.0%) |
| 5 to 17 Years | 0 (0.0%) | 0 (0.0%) |
| 18 to 34 Years | 0 (0.0%) | 0 (0.0%) |
| 35 to 64 Years | 0 (0.0%) | 16 (2.8%) |
| 65 to 74 Years | 3 (1.3%) | 12 (7.4%) |
| 75 Years and over | 10 (10.7%) | 44 (25.3%) |
Disability Class: Cognitive Difficulty
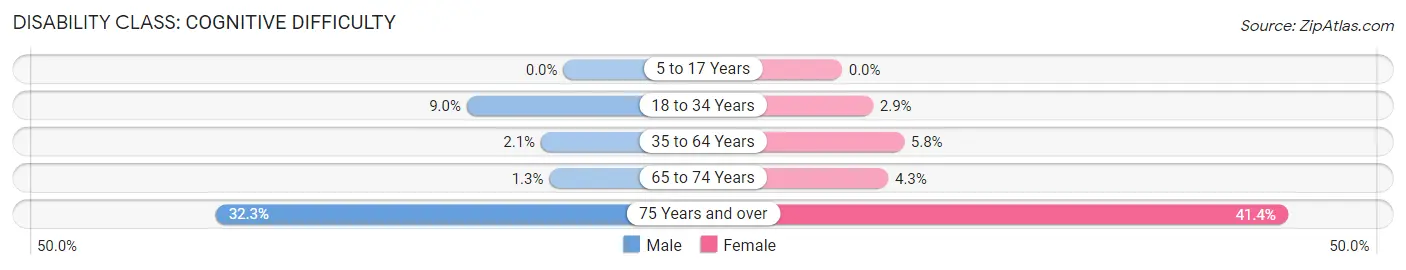
| Age Bracket | Male | Female |
| 5 to 17 Years | 0 (0.0%) | 0 (0.0%) |
| 18 to 34 Years | 12 (9.0%) | 3 (2.9%) |
| 35 to 64 Years | 11 (2.1%) | 33 (5.8%) |
| 65 to 74 Years | 3 (1.3%) | 7 (4.3%) |
| 75 Years and over | 30 (32.3%) | 72 (41.4%) |
Disability Class: Ambulatory Difficulty
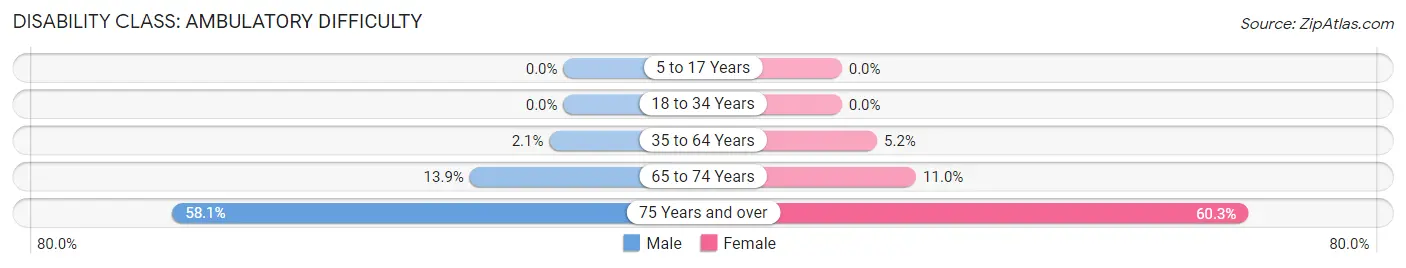
| Age Bracket | Male | Female |
| 5 to 17 Years | 0 (0.0%) | 0 (0.0%) |
| 18 to 34 Years | 0 (0.0%) | 0 (0.0%) |
| 35 to 64 Years | 11 (2.1%) | 30 (5.2%) |
| 65 to 74 Years | 32 (13.9%) | 18 (11.0%) |
| 75 Years and over | 54 (58.1%) | 105 (60.3%) |
Disability Class: Self-Care Difficulty
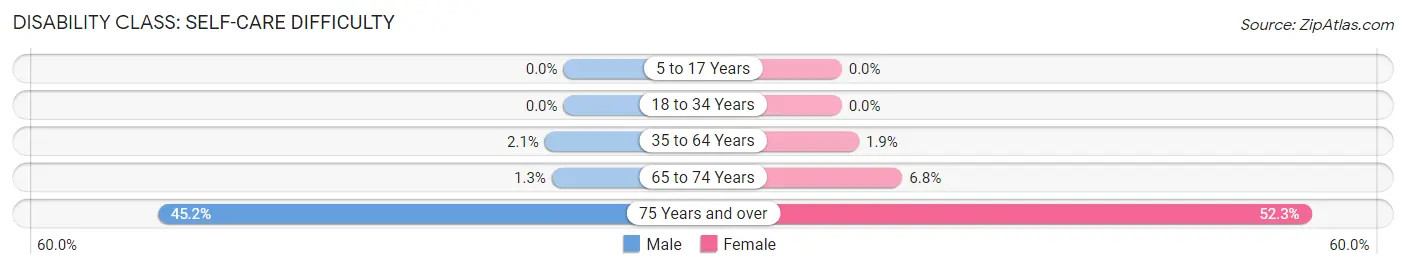
| Age Bracket | Male | Female |
| 5 to 17 Years | 0 (0.0%) | 0 (0.0%) |
| 18 to 34 Years | 0 (0.0%) | 0 (0.0%) |
| 35 to 64 Years | 11 (2.1%) | 11 (1.9%) |
| 65 to 74 Years | 3 (1.3%) | 11 (6.8%) |
| 75 Years and over | 42 (45.2%) | 91 (52.3%) |
Technology Access in West Simsbury
Computing Device Access in West Simsbury
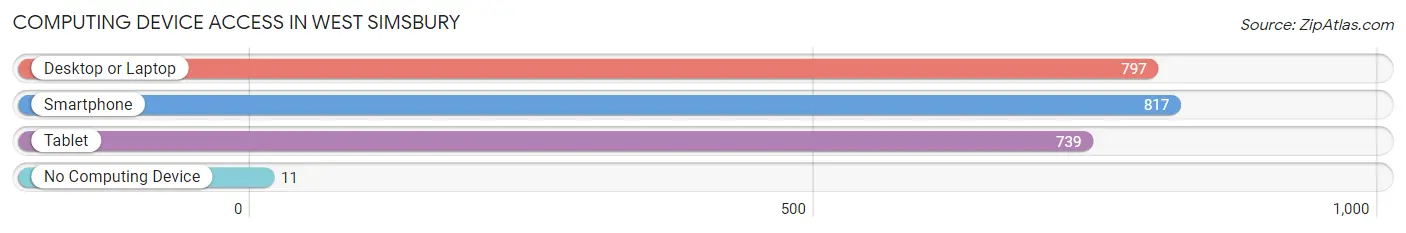
| Device Type | # Households | % Households |
| Desktop or Laptop | 797 | 92.1% |
| Smartphone | 817 | 94.5% |
| Tablet | 739 | 85.4% |
| No Computing Device | 11 | 1.3% |
| Total | 865 | 100.0% |
Internet Access in West Simsbury
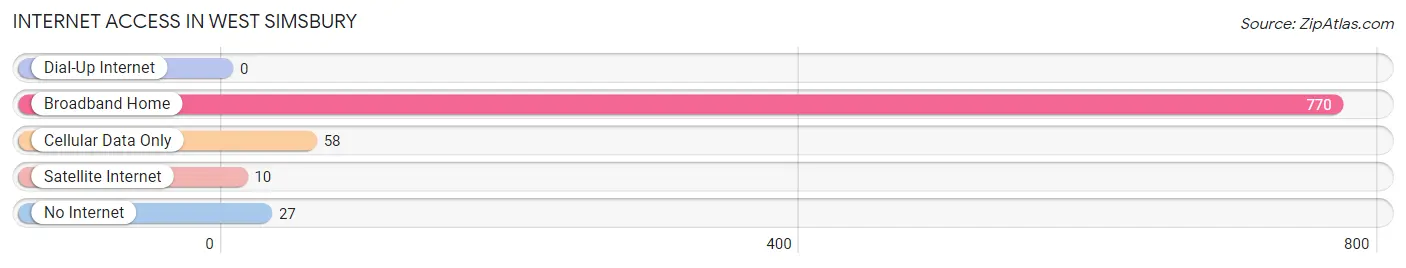
| Internet Type | # Households | % Households |
| Dial-Up Internet | 0 | 0.0% |
| Broadband Home | 770 | 89.0% |
| Cellular Data Only | 58 | 6.7% |
| Satellite Internet | 10 | 1.2% |
| No Internet | 27 | 3.1% |
| Total | 865 | 100.0% |
West Simsbury Summary
History
West Simsbury, Connecticut is a small town located in the Farmington Valley region of Hartford County. It was originally part of the town of Simsbury, which was established in 1670. In 1845, the town of West Simsbury was incorporated as a separate town.
The town of West Simsbury was originally a farming community, with many of the original settlers coming from Massachusetts and Rhode Island. The town was known for its dairy farms, and the town’s economy was largely based on agriculture. In the late 19th century, the town began to develop into a more suburban community, with the construction of the Farmington Valley Railroad in 1871. This allowed for the development of the town’s first industry, the West Simsbury Manufacturing Company, which produced woolen goods.
The town of West Simsbury continued to grow throughout the 20th century, with the construction of the West Simsbury Reservoir in the 1950s. This provided the town with a reliable source of water, and allowed for the development of the town’s second industry, the West Simsbury Paper Company. The town also saw the development of several residential neighborhoods, as well as the construction of the West Simsbury Shopping Center in the 1970s.
Geography
West Simsbury is located in the Farmington Valley region of Hartford County, Connecticut. The town is bordered by the towns of Avon, Canton, Granby, and Simsbury. The town is located in the western part of the state, and is approximately 20 miles from the state capital of Hartford.
The town of West Simsbury is located in a hilly region, with elevations ranging from 500 to 1,000 feet above sea level. The town is located in the Farmington River watershed, and is home to several small streams and ponds. The town is also home to the West Simsbury Reservoir, which provides the town with a reliable source of water.
Economy
The economy of West Simsbury is largely based on the service industry, with many of the town’s residents employed in the retail, healthcare, and education sectors. The town is also home to several small businesses, including a number of restaurants, retail stores, and professional services.
The town is also home to the West Simsbury Paper Company, which produces paper products for the commercial and industrial markets. The company has been in operation since the 1950s, and is one of the town’s largest employers.
Demographics
As of the 2010 census, the town of West Simsbury had a population of 8,845. The population is largely white (94.3%), with small percentages of African American (2.2%), Asian (1.3%), and Hispanic (1.2%) residents. The median household income in the town is $90,945, and the median home value is $400,000.
The town of West Simsbury is served by the Simsbury Public Schools, which includes four elementary schools, one middle school, and one high school. The town is also home to the University of Connecticut Health Center, which provides medical and research services to the region.
Common Questions
What is Per Capita Income in West Simsbury?
Per Capita income in West Simsbury is $90,143.
What is the Median Family Income in West Simsbury?
Median Family Income in West Simsbury is $176,295.
What is the Median Household income in West Simsbury?
Median Household Income in West Simsbury is $175,045.
What is Income or Wage Gap in West Simsbury?
Income or Wage Gap in West Simsbury is 70.4%.
Women in West Simsbury earn 29.6 cents for every dollar earned by a man.
What is Inequality or Gini Index in West Simsbury?
Inequality or Gini Index in West Simsbury is 0.52.
What is the Total Population of West Simsbury?
Total Population of West Simsbury is 2,796.
What is the Total Male Population of West Simsbury?
Total Male Population of West Simsbury is 1,310.
What is the Total Female Population of West Simsbury?
Total Female Population of West Simsbury is 1,486.
What is the Ratio of Males per 100 Females in West Simsbury?
There are 88.16 Males per 100 Females in West Simsbury.
What is the Ratio of Females per 100 Males in West Simsbury?
There are 113.44 Females per 100 Males in West Simsbury.
What is the Median Population Age in West Simsbury?
Median Population Age in West Simsbury is 57.1 Years.
What is the Average Family Size in West Simsbury
Average Family Size in West Simsbury is 3.0 People.
What is the Average Household Size in West Simsbury
Average Household Size in West Simsbury is 2.8 People.
How Large is the Labor Force in West Simsbury?
There are 1,189 People in the Labor Forcein in West Simsbury.
What is the Percentage of People in the Labor Force in West Simsbury?
51.0% of People are in the Labor Force in West Simsbury.
What is the Unemployment Rate in West Simsbury?
Unemployment Rate in West Simsbury is 4.5%.