Zip Codes with the Highest Percentage of Population Employed in Architecture & Engineering in Milford, CT
RELATED REPORTS & OPTIONS
Architecture & Engineering
Milford
Compare Zip Codes
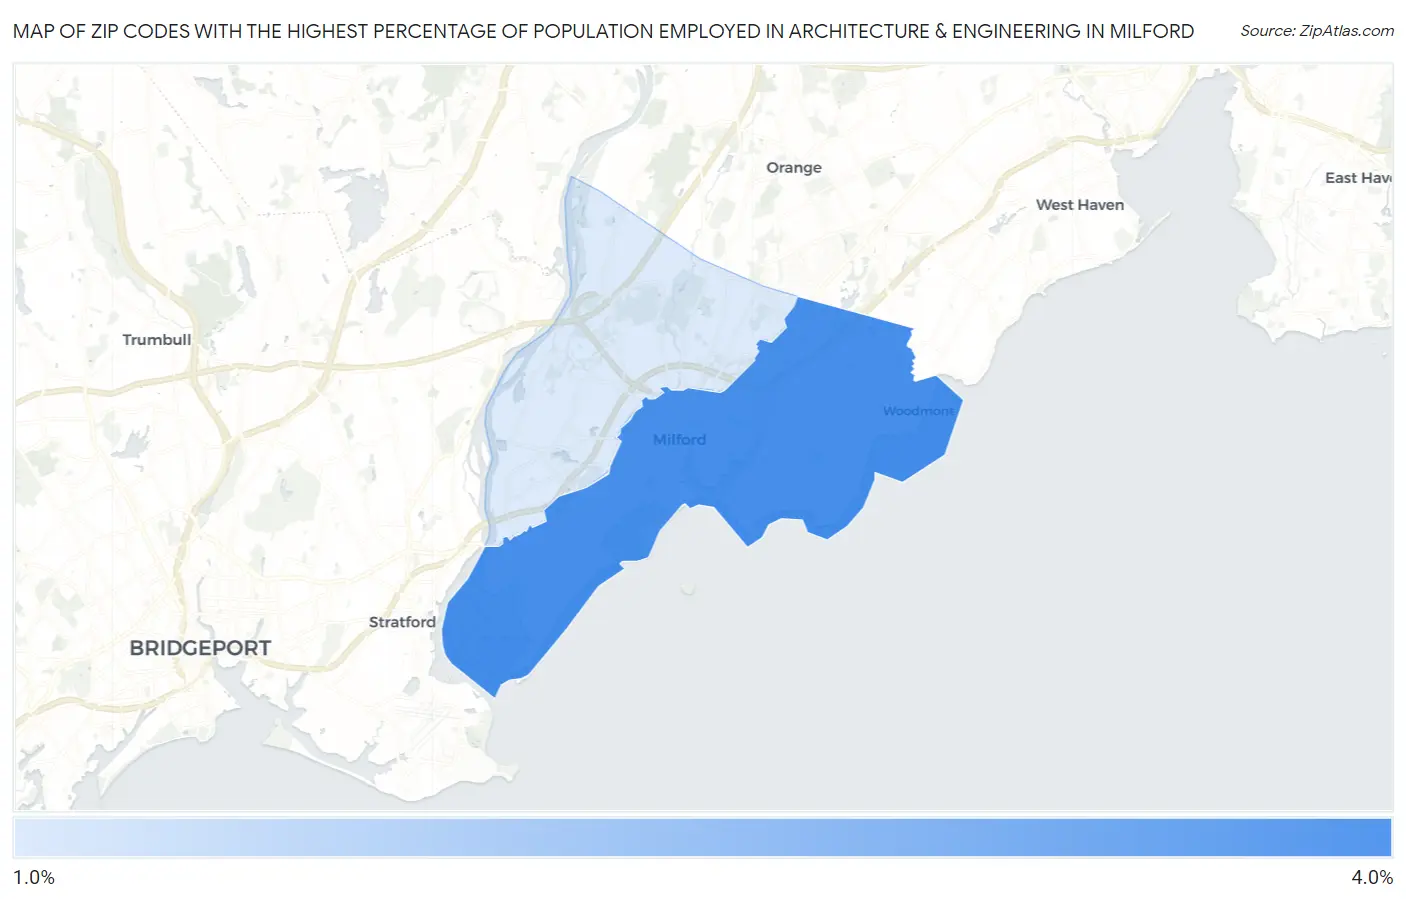
Map of Zip Codes with the Highest Percentage of Population Employed in Architecture & Engineering in Milford
1.8%
3.5%
Zip Codes with the Highest Percentage of Population Employed in Architecture & Engineering in Milford, CT
| Zip Code | % Employed | vs State | vs National | |
| 1. | 06460 | 3.5% | 2.6%(+0.944)#70 | 2.1%(+1.37)#3,685 |
| 2. | 06461 | 1.8% | 2.6%(-0.733)#158 | 2.1%(-0.306)#10,592 |
1
Common Questions
What are the Top Zip Codes with the Highest Percentage of Population Employed in Architecture & Engineering in Milford, CT?
Top Zip Codes with the Highest Percentage of Population Employed in Architecture & Engineering in Milford, CT are:
What zip code has the Highest Percentage of Population Employed in Architecture & Engineering in Milford, CT?
06460 has the Highest Percentage of Population Employed in Architecture & Engineering in Milford, CT with 3.5%.
What is the Percentage of Population Employed in Architecture & Engineering in Connecticut?
Percentage of Population Employed in Architecture & Engineering in Connecticut is 2.6%.
What is the Percentage of Population Employed in Architecture & Engineering in the United States?
Percentage of Population Employed in Architecture & Engineering in the United States is 2.1%.