Shenandoah Heights, PA Map & Demographics
Shenandoah Heights Map
Shenandoah Heights Overview
$39,263
PER CAPITA INCOME
$82,684
AVG FAMILY INCOME
$83,566
AVG HOUSEHOLD INCOME
7.4%
WAGE / INCOME GAP [ % ]
92.6¢/ $1
WAGE / INCOME GAP [ $ ]
0.23
INEQUALITY / GINI INDEX
1,383
TOTAL POPULATION
646
MALE POPULATION
737
FEMALE POPULATION
87.65
MALES / 100 FEMALES
114.09
FEMALES / 100 MALES
49.2
MEDIAN AGE
2.2
AVG FAMILY SIZE
2.1
AVG HOUSEHOLD SIZE
918
LABOR FORCE [ PEOPLE ]
71.5%
PERCENT IN LABOR FORCE
10.0%
UNEMPLOYMENT RATE
Income in Shenandoah Heights
Income Overview in Shenandoah Heights
Per Capita Income in Shenandoah Heights is $39,263, while median incomes of families and households are $82,684 and $83,566 respectively.
| Characteristic | Number | Measure |
| Per Capita Income | 1,383 | $39,263 |
| Median Family Income | 465 | $82,684 |
| Mean Family Income | 465 | $96,209 |
| Median Household Income | 609 | $83,566 |
| Mean Household Income | 609 | $90,718 |
| Income Deficit | 465 | $0 |
| Wage / Income Gap (%) | 1,383 | 7.36% |
| Wage / Income Gap ($) | 1,383 | 92.64¢ per $1 |
| Gini / Inequality Index | 1,383 | 0.23 |
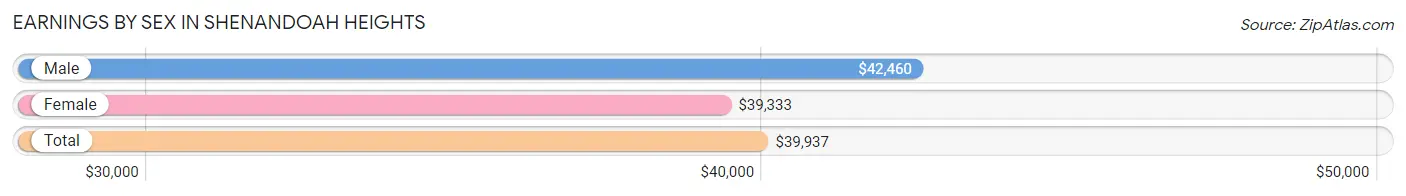
Earnings by Sex in Shenandoah Heights
Average Earnings in Shenandoah Heights are $39,937, $42,460 for men and $39,333 for women, a difference of 7.4%.
| Sex | Number | Average Earnings |
| Male | 373 (40.6%) | $42,460 |
| Female | 546 (59.4%) | $39,333 |
| Total | 919 (100.0%) | $39,937 |
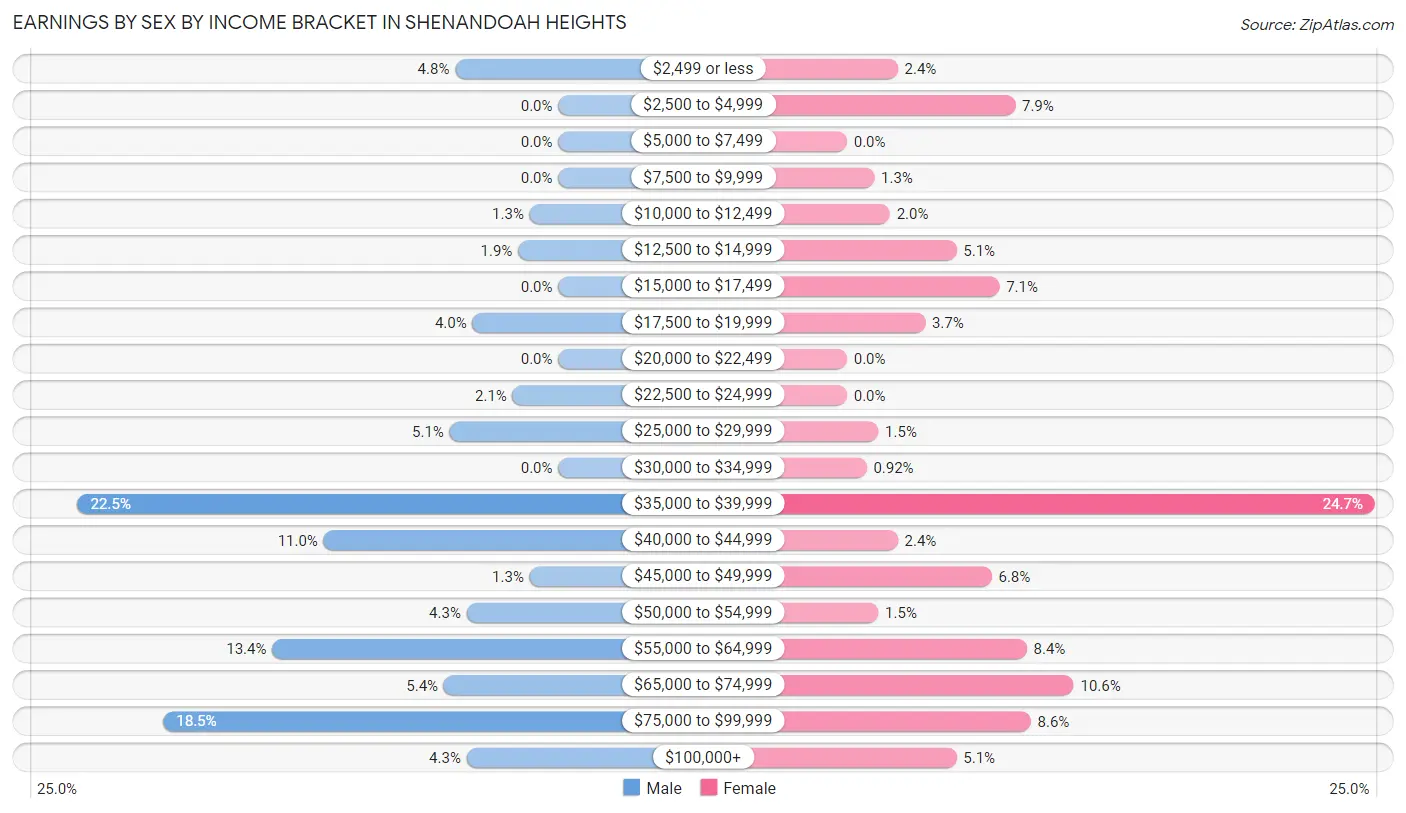
Earnings by Sex by Income Bracket in Shenandoah Heights
The most common earnings brackets in Shenandoah Heights are $35,000 to $39,999 for men (84 | 22.5%) and $35,000 to $39,999 for women (135 | 24.7%).
| Income | Male | Female |
| $2,499 or less | 18 (4.8%) | 13 (2.4%) |
| $2,500 to $4,999 | 0 (0.0%) | 43 (7.9%) |
| $5,000 to $7,499 | 0 (0.0%) | 0 (0.0%) |
| $7,500 to $9,999 | 0 (0.0%) | 7 (1.3%) |
| $10,000 to $12,499 | 5 (1.3%) | 11 (2.0%) |
| $12,500 to $14,999 | 7 (1.9%) | 28 (5.1%) |
| $15,000 to $17,499 | 0 (0.0%) | 39 (7.1%) |
| $17,500 to $19,999 | 15 (4.0%) | 20 (3.7%) |
| $20,000 to $22,499 | 0 (0.0%) | 0 (0.0%) |
| $22,500 to $24,999 | 8 (2.1%) | 0 (0.0%) |
| $25,000 to $29,999 | 19 (5.1%) | 8 (1.5%) |
| $30,000 to $34,999 | 0 (0.0%) | 5 (0.9%) |
| $35,000 to $39,999 | 84 (22.5%) | 135 (24.7%) |
| $40,000 to $44,999 | 41 (11.0%) | 13 (2.4%) |
| $45,000 to $49,999 | 5 (1.3%) | 37 (6.8%) |
| $50,000 to $54,999 | 16 (4.3%) | 8 (1.5%) |
| $55,000 to $64,999 | 50 (13.4%) | 46 (8.4%) |
| $65,000 to $74,999 | 20 (5.4%) | 58 (10.6%) |
| $75,000 to $99,999 | 69 (18.5%) | 47 (8.6%) |
| $100,000+ | 16 (4.3%) | 28 (5.1%) |
| Total | 373 (100.0%) | 546 (100.0%) |
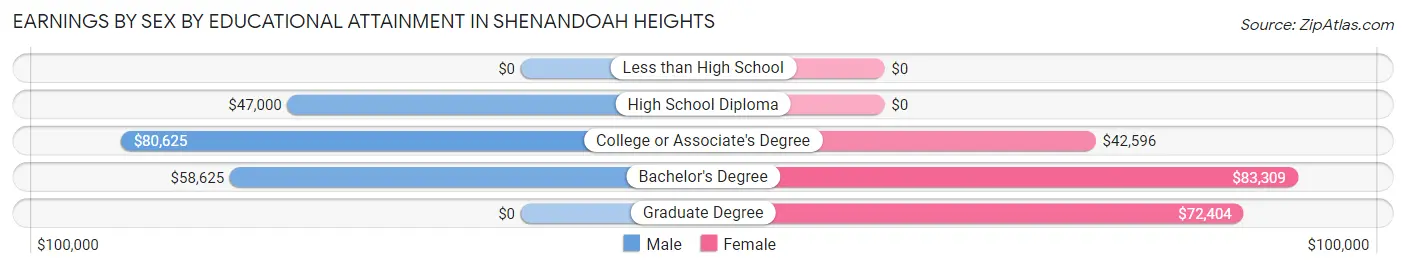
Earnings by Sex by Educational Attainment in Shenandoah Heights
Average earnings in Shenandoah Heights are $57,875 for men and $39,787 for women, a difference of 31.2%. Men with an educational attainment of college or associate's degree enjoy the highest average annual earnings of $80,625, while those with high school diploma education earn the least with $47,000. Women with an educational attainment of bachelor's degree earn the most with the average annual earnings of $83,309, while those with college or associate's degree education have the smallest earnings of $42,596.
| Educational Attainment | Male Income | Female Income |
| Less than High School | - | - |
| High School Diploma | $47,000 | $0 |
| College or Associate's Degree | $80,625 | $42,596 |
| Bachelor's Degree | $58,625 | $83,309 |
| Graduate Degree | - | - |
| Total | $57,875 | $39,787 |
Family Income in Shenandoah Heights
Family Income Brackets in Shenandoah Heights
According to the Shenandoah Heights family income data, there are 184 families falling into the $75,000 to $99,999 income range, which is the most common income bracket and makes up 39.6% of all families.
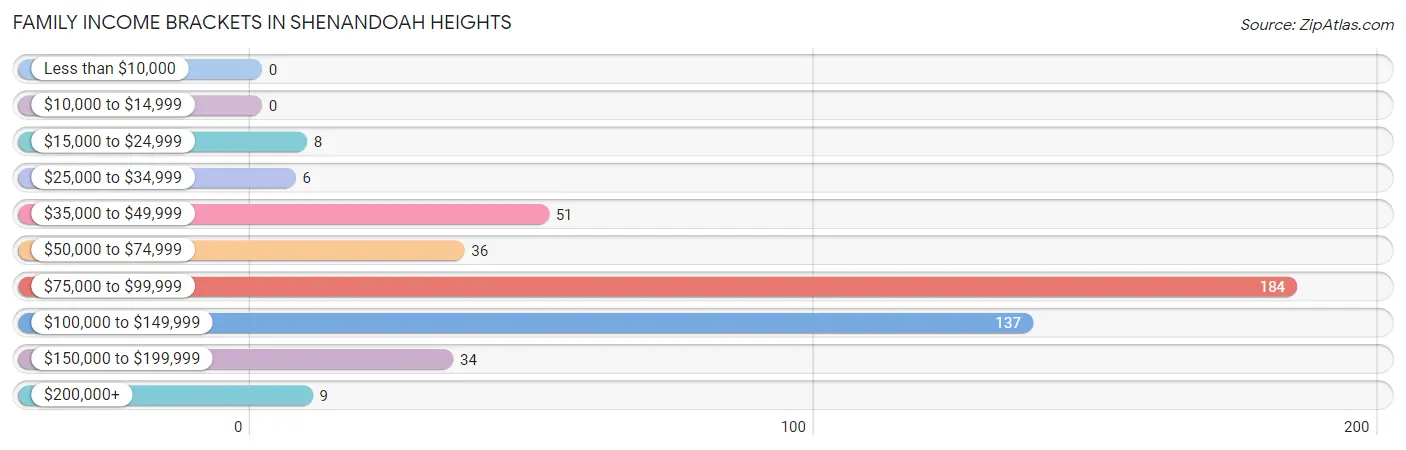
| Income Bracket | # Families | % Families |
| Less than $10,000 | 0 | 0.0% |
| $10,000 to $14,999 | 0 | 0.0% |
| $15,000 to $24,999 | 8 | 1.7% |
| $25,000 to $34,999 | 6 | 1.3% |
| $35,000 to $49,999 | 51 | 11.0% |
| $50,000 to $74,999 | 36 | 7.7% |
| $75,000 to $99,999 | 184 | 39.6% |
| $100,000 to $149,999 | 137 | 29.5% |
| $150,000 to $199,999 | 34 | 7.3% |
| $200,000+ | 9 | 1.9% |
Family Income by Famaliy Size in Shenandoah Heights
4-person families (61 | 13.1%) account for the highest median family income in Shenandoah Heights with $102,426 per family, while 2-person families (375 | 80.6%) have the highest median income of $39,825 per family member.
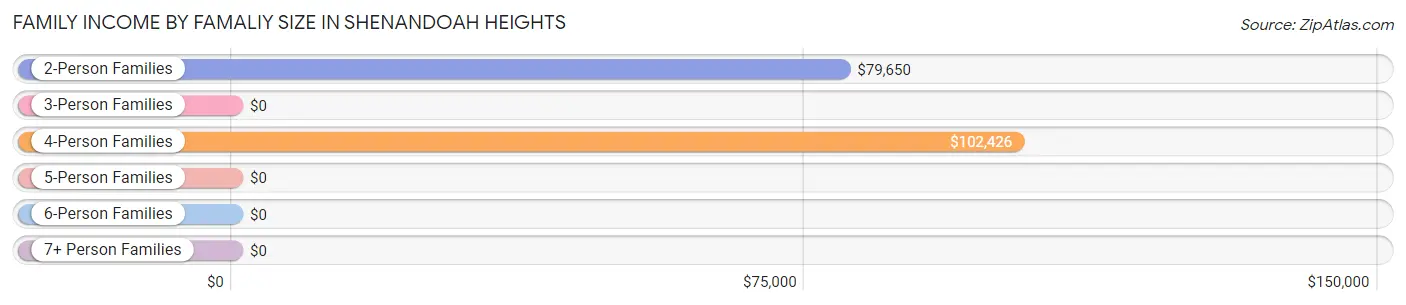
| Income Bracket | # Families | Median Income |
| 2-Person Families | 375 (80.6%) | $79,650 |
| 3-Person Families | 22 (4.7%) | $0 |
| 4-Person Families | 61 (13.1%) | $102,426 |
| 5-Person Families | 7 (1.5%) | $0 |
| 6-Person Families | 0 (0.0%) | $0 |
| 7+ Person Families | 0 (0.0%) | $0 |
| Total | 465 (100.0%) | $82,684 |
Family Income by Number of Earners in Shenandoah Heights
The median family income in Shenandoah Heights is $82,684, with families comprising 3+ earners (38) having the highest median family income of $136,000, while families with no earners (62) have the lowest median family income of $71,136, accounting for 8.2% and 13.3% of families, respectively.
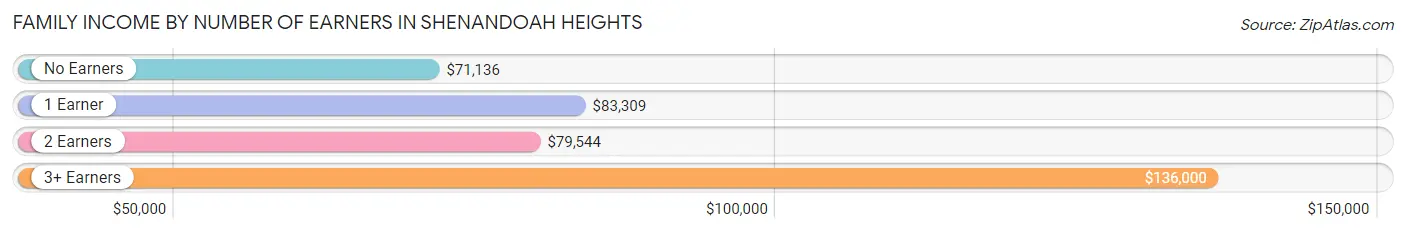
| Number of Earners | # Families | Median Income |
| No Earners | 62 (13.3%) | $71,136 |
| 1 Earner | 86 (18.5%) | $83,309 |
| 2 Earners | 279 (60.0%) | $79,544 |
| 3+ Earners | 38 (8.2%) | $136,000 |
| Total | 465 (100.0%) | $82,684 |
Household Income in Shenandoah Heights
Household Income Brackets in Shenandoah Heights
With 255 households falling in the category, the $75,000 to $99,999 income range is the most frequent in Shenandoah Heights, accounting for 41.9% of all households.
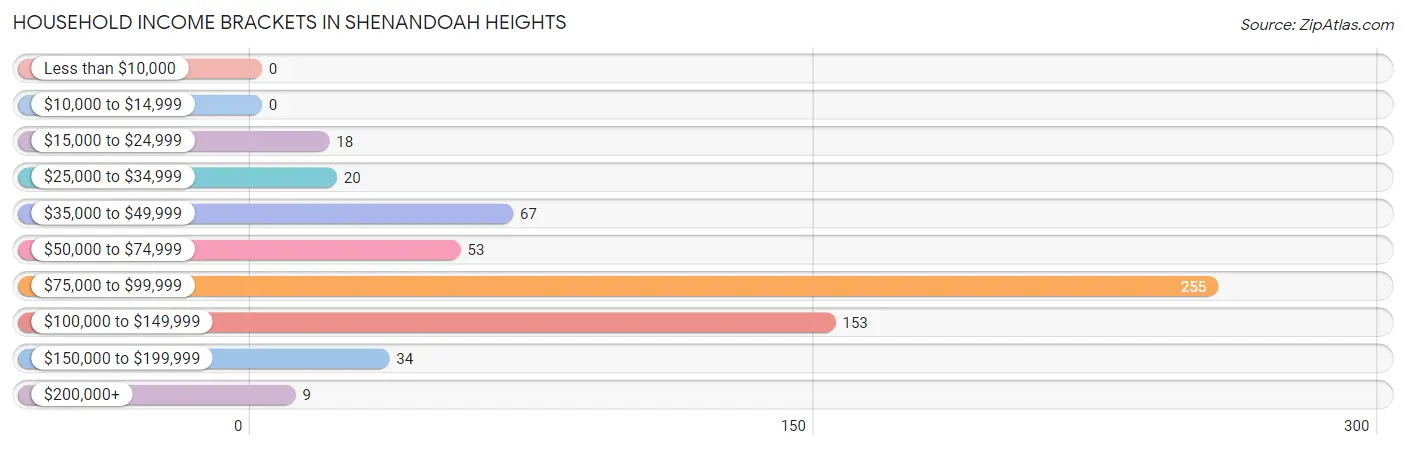
| Income Bracket | # Households | % Households |
| Less than $10,000 | 0 | 0.0% |
| $10,000 to $14,999 | 0 | 0.0% |
| $15,000 to $24,999 | 18 | 3.0% |
| $25,000 to $34,999 | 20 | 3.3% |
| $35,000 to $49,999 | 67 | 11.0% |
| $50,000 to $74,999 | 53 | 8.7% |
| $75,000 to $99,999 | 255 | 41.9% |
| $100,000 to $149,999 | 153 | 25.1% |
| $150,000 to $199,999 | 34 | 5.6% |
| $200,000+ | 9 | 1.5% |
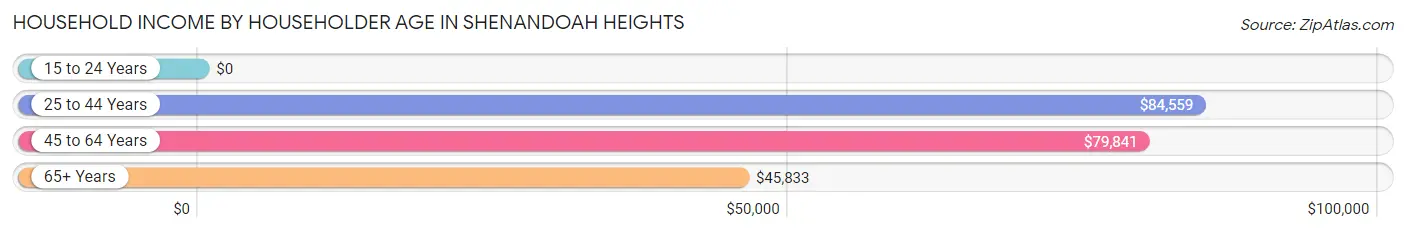
Household Income by Householder Age in Shenandoah Heights
The median household income in Shenandoah Heights is $83,566, with the highest median household income of $84,559 found in the 25 to 44 years age bracket for the primary householder. A total of 110 households (18.1%) fall into this category. Meanwhile, the 15 to 24 years age bracket for the primary householder has the lowest median household income of $0, with 47 households (7.7%) in this group.
| Income Bracket | # Households | Median Income |
| 15 to 24 Years | 47 (7.7%) | $0 |
| 25 to 44 Years | 110 (18.1%) | $84,559 |
| 45 to 64 Years | 350 (57.5%) | $79,841 |
| 65+ Years | 102 (16.8%) | $45,833 |
| Total | 609 (100.0%) | $83,566 |
Poverty in Shenandoah Heights
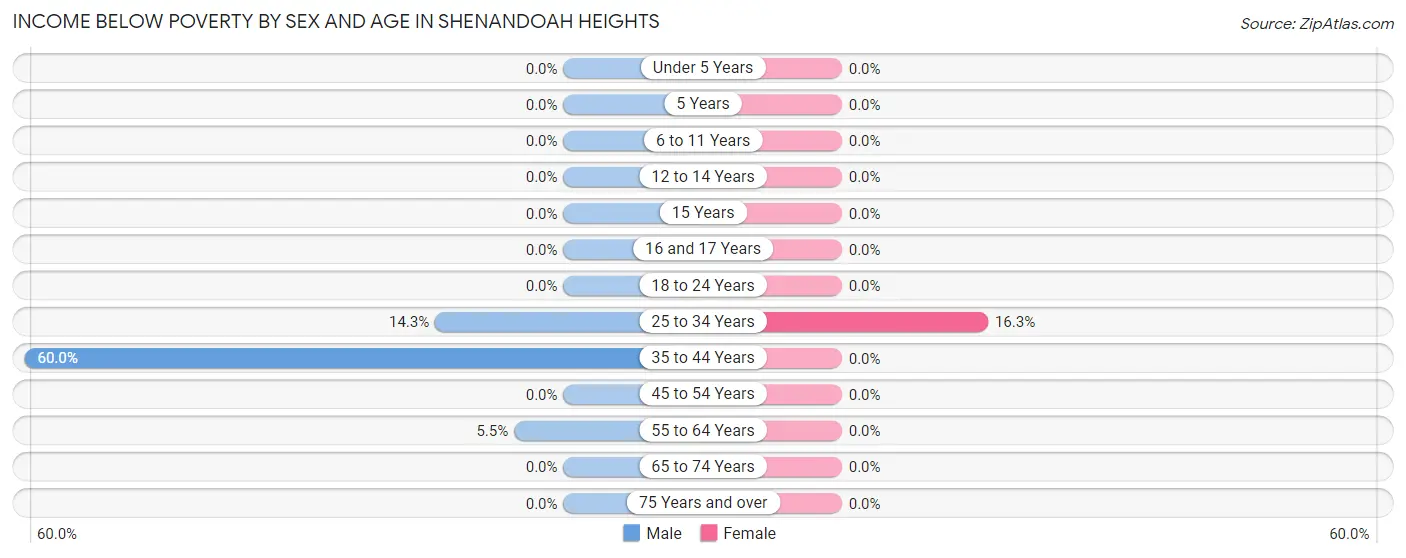
Income Below Poverty by Sex and Age in Shenandoah Heights
With 7.9% poverty level for males and 1.0% for females among the residents of Shenandoah Heights, 35 to 44 year old males and 25 to 34 year old females are the most vulnerable to poverty, with 36 males (60.0%) and 7 females (16.3%) in their respective age groups living below the poverty level.
| Age Bracket | Male | Female |
| Under 5 Years | 0 (0.0%) | 0 (0.0%) |
| 5 Years | 0 (0.0%) | 0 (0.0%) |
| 6 to 11 Years | 0 (0.0%) | 0 (0.0%) |
| 12 to 14 Years | 0 (0.0%) | 0 (0.0%) |
| 15 Years | 0 (0.0%) | 0 (0.0%) |
| 16 and 17 Years | 0 (0.0%) | 0 (0.0%) |
| 18 to 24 Years | 0 (0.0%) | 0 (0.0%) |
| 25 to 34 Years | 7 (14.3%) | 7 (16.3%) |
| 35 to 44 Years | 36 (60.0%) | 0 (0.0%) |
| 45 to 54 Years | 0 (0.0%) | 0 (0.0%) |
| 55 to 64 Years | 5 (5.5%) | 0 (0.0%) |
| 65 to 74 Years | 0 (0.0%) | 0 (0.0%) |
| 75 Years and over | 0 (0.0%) | 0 (0.0%) |
| Total | 48 (7.9%) | 7 (1.0%) |
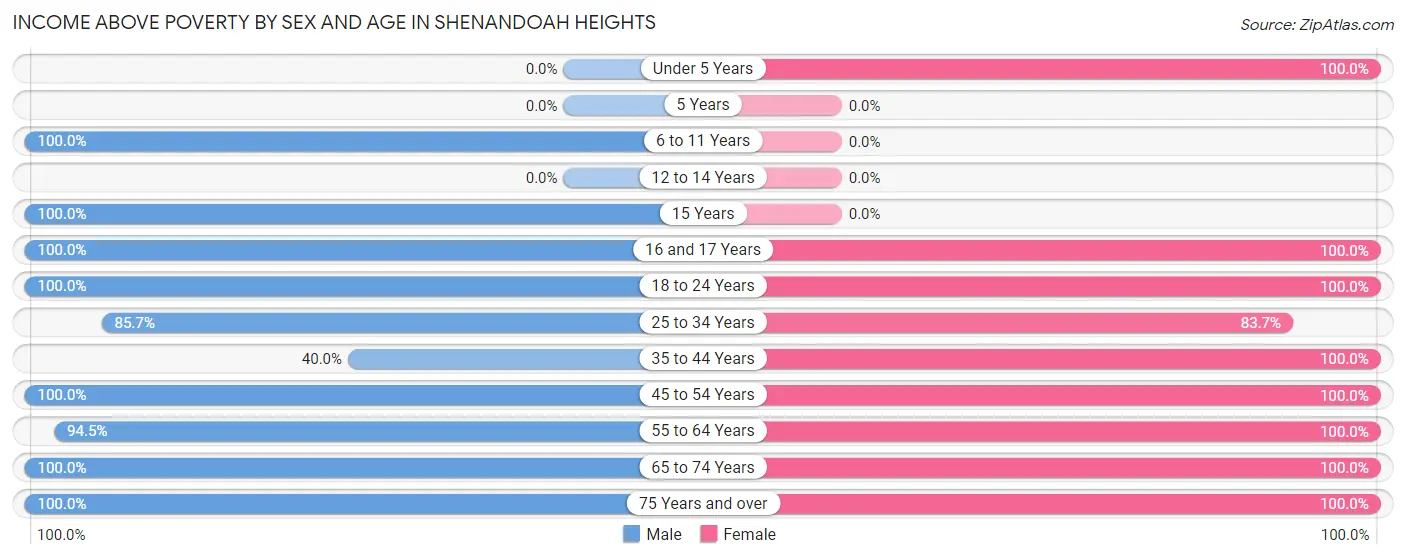
Income Above Poverty by Sex and Age in Shenandoah Heights
According to the poverty statistics in Shenandoah Heights, males aged 6 to 11 years and females aged under 5 years are the age groups that are most secure financially, with 100.0% of males and 100.0% of females in these age groups living above the poverty line.
| Age Bracket | Male | Female |
| Under 5 Years | 0 (0.0%) | 16 (100.0%) |
| 5 Years | 0 (0.0%) | 0 (0.0%) |
| 6 to 11 Years | 72 (100.0%) | 0 (0.0%) |
| 12 to 14 Years | 0 (0.0%) | 0 (0.0%) |
| 15 Years | 11 (100.0%) | 0 (0.0%) |
| 16 and 17 Years | 8 (100.0%) | 29 (100.0%) |
| 18 to 24 Years | 106 (100.0%) | 86 (100.0%) |
| 25 to 34 Years | 42 (85.7%) | 36 (83.7%) |
| 35 to 44 Years | 24 (40.0%) | 93 (100.0%) |
| 45 to 54 Years | 114 (100.0%) | 229 (100.0%) |
| 55 to 64 Years | 86 (94.5%) | 81 (100.0%) |
| 65 to 74 Years | 52 (100.0%) | 38 (100.0%) |
| 75 Years and over | 43 (100.0%) | 64 (100.0%) |
| Total | 558 (92.1%) | 672 (99.0%) |
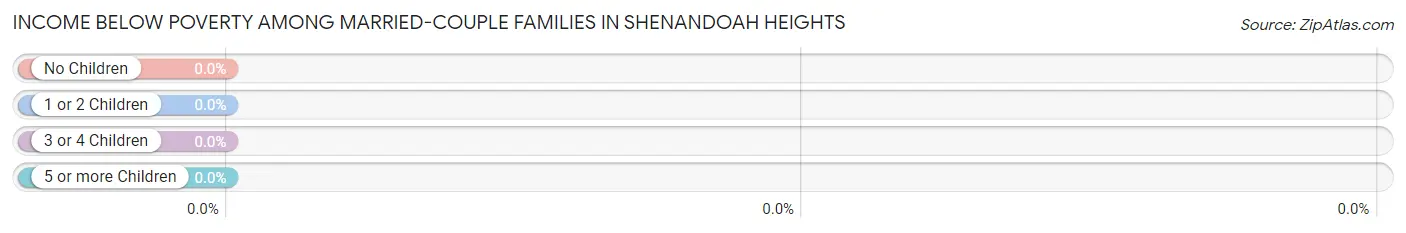
Income Below Poverty Among Married-Couple Families in Shenandoah Heights
| Children | Above Poverty | Below Poverty |
| No Children | 191 (100.0%) | 0 (0.0%) |
| 1 or 2 Children | 52 (100.0%) | 0 (0.0%) |
| 3 or 4 Children | 0 (0.0%) | 0 (0.0%) |
| 5 or more Children | 0 (0.0%) | 0 (0.0%) |
| Total | 243 (100.0%) | 0 (0.0%) |
Income Below Poverty Among Single-Parent Households in Shenandoah Heights
| Children | Single Father | Single Mother |
| No Children | 0 (0.0%) | 0 (0.0%) |
| 1 or 2 Children | 0 (0.0%) | 0 (0.0%) |
| 3 or 4 Children | 0 (0.0%) | 0 (0.0%) |
| 5 or more Children | 0 (0.0%) | 0 (0.0%) |
| Total | 0 (0.0%) | 0 (0.0%) |
Income Below Poverty Among Married-Couple vs Single-Parent Households in Shenandoah Heights
| Children | Married-Couple Families | Single-Parent Households |
| No Children | 0 (0.0%) | 0 (0.0%) |
| 1 or 2 Children | 0 (0.0%) | 0 (0.0%) |
| 3 or 4 Children | 0 (0.0%) | 0 (0.0%) |
| 5 or more Children | 0 (0.0%) | 0 (0.0%) |
| Total | 0 (0.0%) | 0 (0.0%) |
Race in Shenandoah Heights
The most populous races in Shenandoah Heights are White / Caucasian (1,355 | 98.0%), Hispanic or Latino (128 | 9.3%), and Two or more Races (28 | 2.0%).
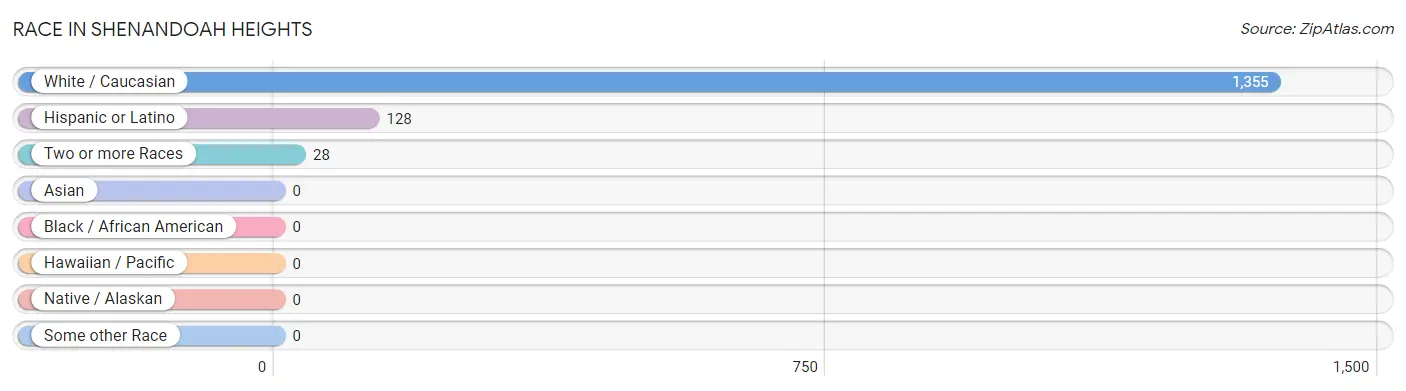
| Race | # Population | % Population |
| Asian | 0 | 0.0% |
| Black / African American | 0 | 0.0% |
| Hawaiian / Pacific | 0 | 0.0% |
| Hispanic or Latino | 128 | 9.3% |
| Native / Alaskan | 0 | 0.0% |
| White / Caucasian | 1,355 | 98.0% |
| Two or more Races | 28 | 2.0% |
| Some other Race | 0 | 0.0% |
| Total | 1,383 | 100.0% |
Ancestry in Shenandoah Heights
The most populous ancestries reported in Shenandoah Heights are Polish (533 | 38.5%), Lithuanian (231 | 16.7%), German (192 | 13.9%), Italian (181 | 13.1%), and Irish (172 | 12.4%), together accounting for 94.7% of all Shenandoah Heights residents.
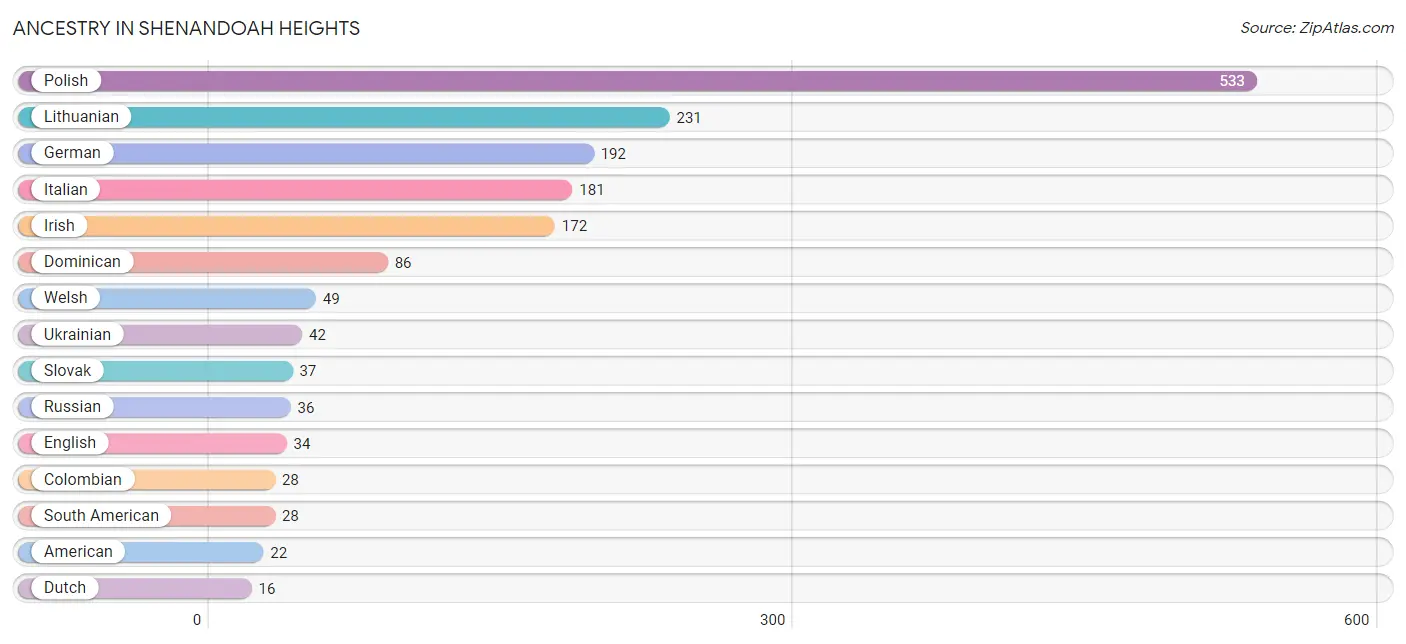
| Ancestry | # Population | % Population |
| American | 22 | 1.6% |
| Austrian | 6 | 0.4% |
| Colombian | 28 | 2.0% |
| Dominican | 86 | 6.2% |
| Dutch | 16 | 1.2% |
| English | 34 | 2.5% |
| German | 192 | 13.9% |
| Greek | 11 | 0.8% |
| Irish | 172 | 12.4% |
| Italian | 181 | 13.1% |
| Lithuanian | 231 | 16.7% |
| Pennsylvania German | 8 | 0.6% |
| Polish | 533 | 38.5% |
| Puerto Rican | 14 | 1.0% |
| Russian | 36 | 2.6% |
| Slovak | 37 | 2.7% |
| South American | 28 | 2.0% |
| Swedish | 8 | 0.6% |
| Ukrainian | 42 | 3.0% |
| Welsh | 49 | 3.5% | View All 20 Rows |
Immigrants in Shenandoah Heights
The most numerous immigrant groups reported in Shenandoah Heights came from Latin America (114 | 8.2%), Caribbean (86 | 6.2%), Dominican Republic (86 | 6.2%), Colombia (28 | 2.0%), and South America (28 | 2.0%), together accounting for 24.7% of all Shenandoah Heights residents.
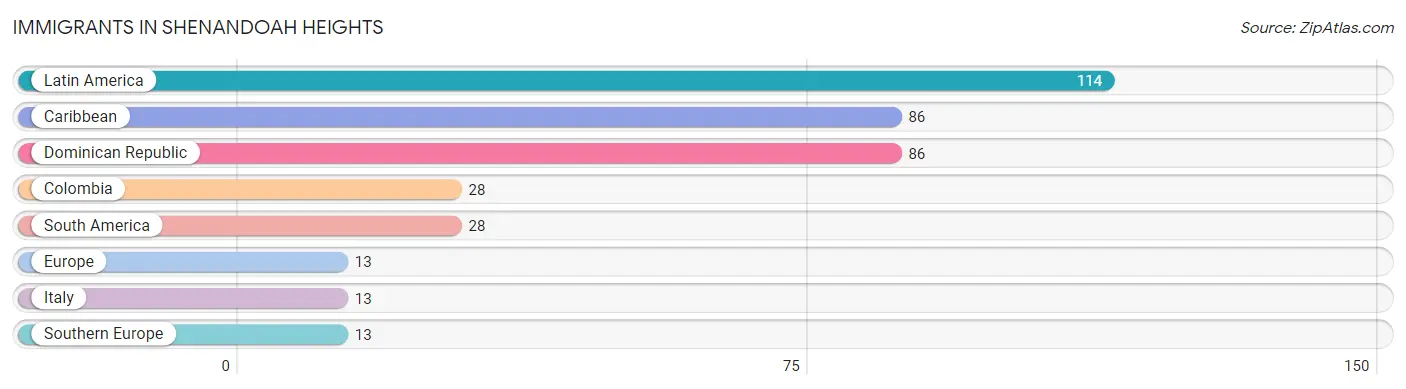
| Immigration Origin | # Population | % Population |
| Caribbean | 86 | 6.2% |
| Colombia | 28 | 2.0% |
| Dominican Republic | 86 | 6.2% |
| Europe | 13 | 0.9% |
| Italy | 13 | 0.9% |
| Latin America | 114 | 8.2% |
| South America | 28 | 2.0% |
| Southern Europe | 13 | 0.9% | View All 8 Rows |
Sex and Age in Shenandoah Heights
Sex and Age in Shenandoah Heights
The most populous age groups in Shenandoah Heights are 20 to 24 Years (106 | 16.4%) for men and 45 to 49 Years (182 | 24.7%) for women.
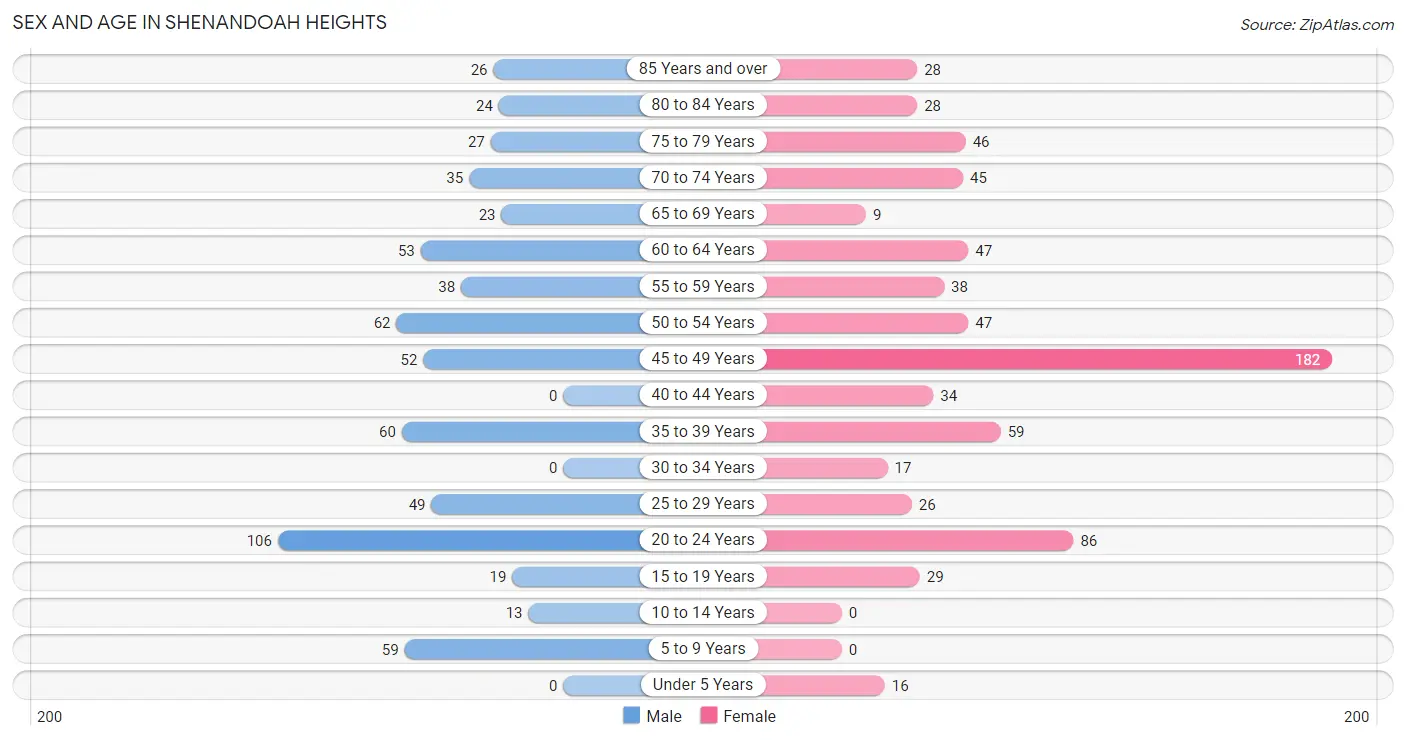
| Age Bracket | Male | Female |
| Under 5 Years | 0 (0.0%) | 16 (2.2%) |
| 5 to 9 Years | 59 (9.1%) | 0 (0.0%) |
| 10 to 14 Years | 13 (2.0%) | 0 (0.0%) |
| 15 to 19 Years | 19 (2.9%) | 29 (3.9%) |
| 20 to 24 Years | 106 (16.4%) | 86 (11.7%) |
| 25 to 29 Years | 49 (7.6%) | 26 (3.5%) |
| 30 to 34 Years | 0 (0.0%) | 17 (2.3%) |
| 35 to 39 Years | 60 (9.3%) | 59 (8.0%) |
| 40 to 44 Years | 0 (0.0%) | 34 (4.6%) |
| 45 to 49 Years | 52 (8.1%) | 182 (24.7%) |
| 50 to 54 Years | 62 (9.6%) | 47 (6.4%) |
| 55 to 59 Years | 38 (5.9%) | 38 (5.2%) |
| 60 to 64 Years | 53 (8.2%) | 47 (6.4%) |
| 65 to 69 Years | 23 (3.6%) | 9 (1.2%) |
| 70 to 74 Years | 35 (5.4%) | 45 (6.1%) |
| 75 to 79 Years | 27 (4.2%) | 46 (6.2%) |
| 80 to 84 Years | 24 (3.7%) | 28 (3.8%) |
| 85 Years and over | 26 (4.0%) | 28 (3.8%) |
| Total | 646 (100.0%) | 737 (100.0%) |
Families and Households in Shenandoah Heights
Median Family Size in Shenandoah Heights
The median family size in Shenandoah Heights is 2.24 persons per family, with married-couple families (243 | 52.3%) accounting for the largest median family size of 2.63 persons per family. On the other hand, single female/mother families (201 | 43.2%) represent the smallest median family size with 1.77 persons per family.
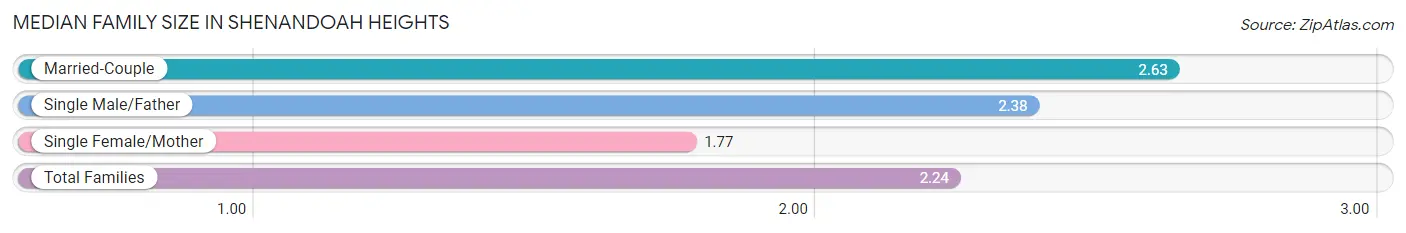
| Family Type | # Families | Family Size |
| Married-Couple | 243 (52.3%) | 2.63 |
| Single Male/Father | 21 (4.5%) | 2.38 |
| Single Female/Mother | 201 (43.2%) | 1.77 |
| Total Families | 465 (100.0%) | 2.24 |
Median Household Size in Shenandoah Heights
The median household size in Shenandoah Heights is 2.11 persons per household, with married-couple households (243 | 39.9%) accounting for the largest median household size of 2.63 persons per household. non-family households (144 | 23.6%) represent the smallest median household size with 1.40 persons per household.
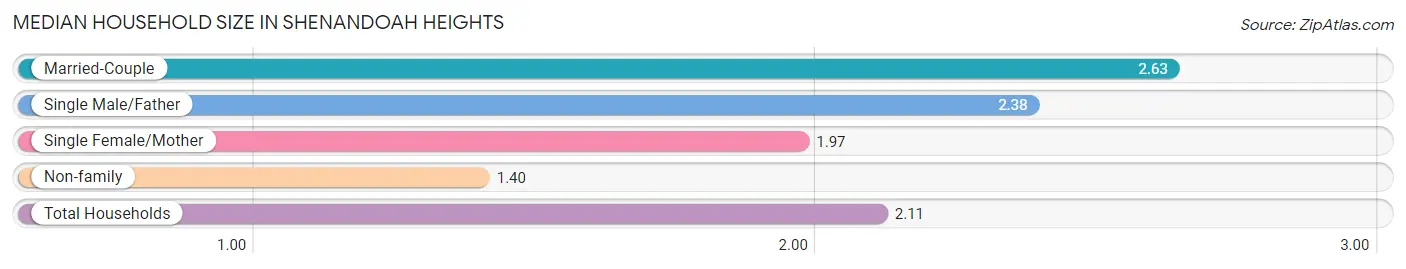
| Household Type | # Households | Household Size |
| Married-Couple | 243 (39.9%) | 2.63 |
| Single Male/Father | 21 (3.5%) | 2.38 |
| Single Female/Mother | 201 (33.0%) | 1.97 |
| Non-family | 144 (23.6%) | 1.40 |
| Total Households | 609 (100.0%) | 2.11 |
Household Size by Marriage Status in Shenandoah Heights
Out of a total of 609 households in Shenandoah Heights, 465 (76.3%) are family households, while 144 (23.6%) are nonfamily households. The most numerous type of family households are 2-person households, comprising 336, and the most common type of nonfamily households are 1-person households, comprising 80.
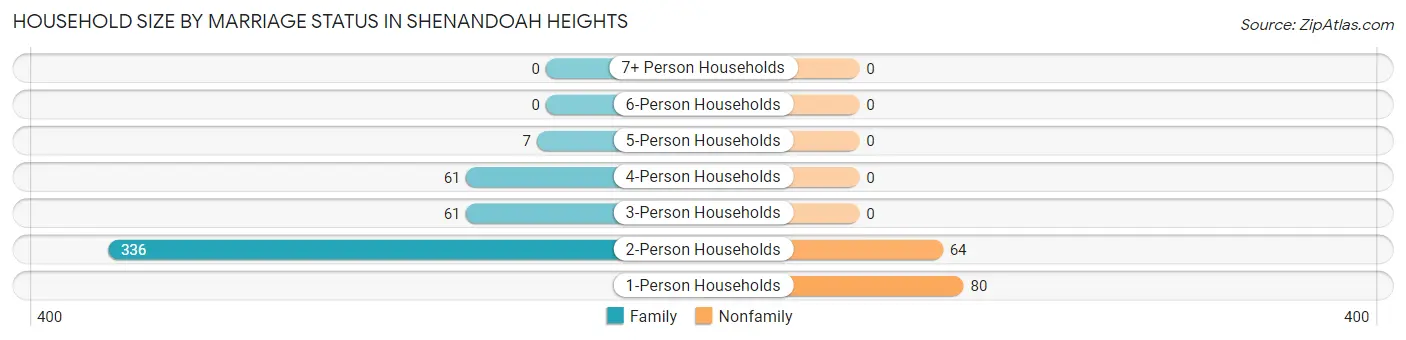
| Household Size | Family Households | Nonfamily Households |
| 1-Person Households | - | 80 (13.1%) |
| 2-Person Households | 336 (55.2%) | 64 (10.5%) |
| 3-Person Households | 61 (10.0%) | 0 (0.0%) |
| 4-Person Households | 61 (10.0%) | 0 (0.0%) |
| 5-Person Households | 7 (1.1%) | 0 (0.0%) |
| 6-Person Households | 0 (0.0%) | 0 (0.0%) |
| 7+ Person Households | 0 (0.0%) | 0 (0.0%) |
| Total | 465 (76.3%) | 144 (23.6%) |
Female Fertility in Shenandoah Heights
Fertility by Age in Shenandoah Heights
Average fertility rate in Shenandoah Heights is 71.0 births per 1,000 women. Women in the age bracket of 20 to 34 years have the highest fertility rate with 109.0 births per 1,000 women. Women in the age bracket of 35 to 50 years acount for 54.8% of all women with births.
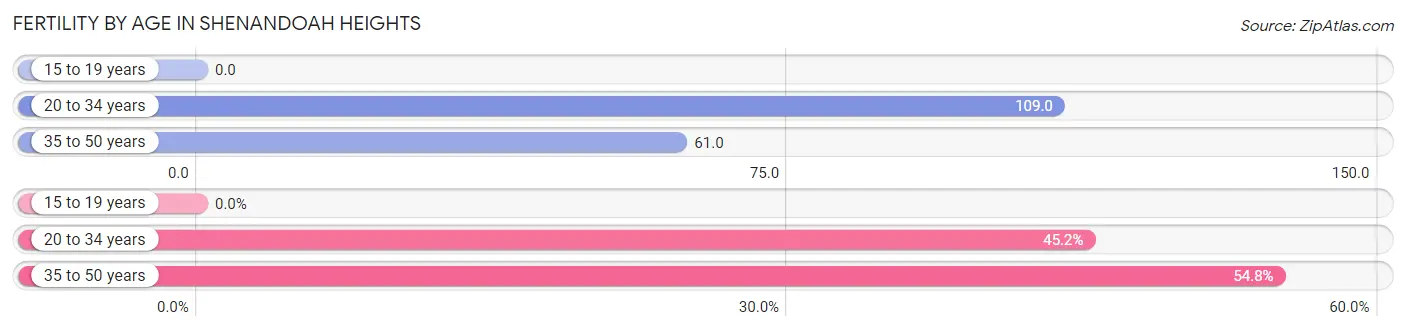
| Age Bracket | Women with Births | Births / 1,000 Women |
| 15 to 19 years | 0 (0.0%) | 0.0 |
| 20 to 34 years | 14 (45.2%) | 109.0 |
| 35 to 50 years | 17 (54.8%) | 61.0 |
| Total | 31 (100.0%) | 71.0 |
Fertility by Age by Marriage Status in Shenandoah Heights
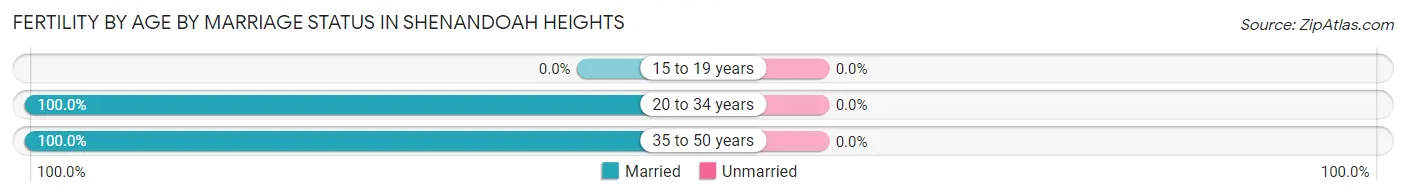
| Age Bracket | Married | Unmarried |
| 15 to 19 years | 0 (0.0%) | 0 (0.0%) |
| 20 to 34 years | 14 (100.0%) | 0 (0.0%) |
| 35 to 50 years | 17 (100.0%) | 0 (0.0%) |
| Total | 31 (100.0%) | 0 (0.0%) |
Fertility by Education in Shenandoah Heights
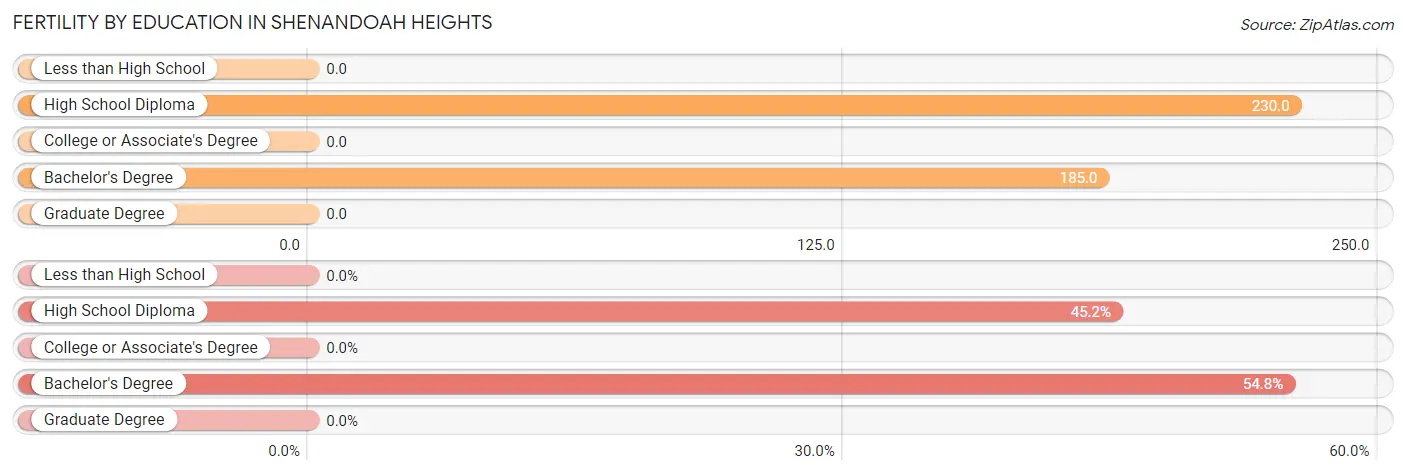
| Educational Attainment | Women with Births | Births / 1,000 Women |
| Less than High School | 0 (0.0%) | 0.0 |
| High School Diploma | 14 (45.2%) | 230.0 |
| College or Associate's Degree | 0 (0.0%) | 0.0 |
| Bachelor's Degree | 17 (54.8%) | 185.0 |
| Graduate Degree | 0 (0.0%) | 0.0 |
| Total | 31 (100.0%) | 71.0 |
Fertility by Education by Marriage Status in Shenandoah Heights
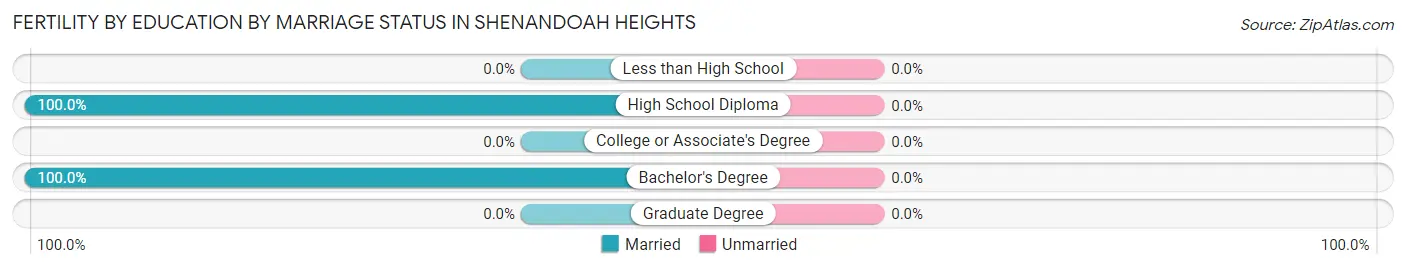
| Educational Attainment | Married | Unmarried |
| Less than High School | 0 (0.0%) | 0 (0.0%) |
| High School Diploma | 14 (100.0%) | 0 (0.0%) |
| College or Associate's Degree | 0 (0.0%) | 0 (0.0%) |
| Bachelor's Degree | 17 (100.0%) | 0 (0.0%) |
| Graduate Degree | 0 (0.0%) | 0 (0.0%) |
| Total | 31 (100.0%) | 0 (0.0%) |
Employment Characteristics in Shenandoah Heights
Employment by Class of Employer in Shenandoah Heights
Among the 826 employed individuals in Shenandoah Heights, private company employees (514 | 62.2%), local government employees (157 | 19.0%), and not-for-profit organizations (79 | 9.6%) make up the most common classes of employment.
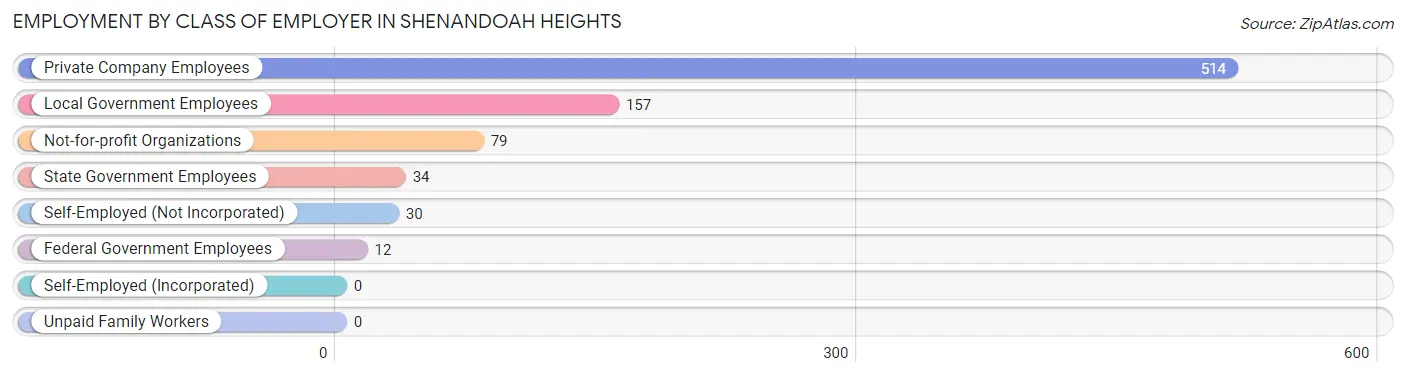
| Employer Class | # Employees | % Employees |
| Private Company Employees | 514 | 62.2% |
| Self-Employed (Incorporated) | 0 | 0.0% |
| Self-Employed (Not Incorporated) | 30 | 3.6% |
| Not-for-profit Organizations | 79 | 9.6% |
| Local Government Employees | 157 | 19.0% |
| State Government Employees | 34 | 4.1% |
| Federal Government Employees | 12 | 1.5% |
| Unpaid Family Workers | 0 | 0.0% |
| Total | 826 | 100.0% |
Employment Status by Age in Shenandoah Heights
According to the labor force statistics for Shenandoah Heights, out of the total population over 16 years of age (1,284), 71.5% or 918 individuals are in the labor force, with 10.0% or 92 of them unemployed. The age group with the highest labor force participation rate is 20 to 24 years, with 100.0% or 192 individuals in the labor force. Within the labor force, the 20 to 24 years age range has the highest percentage of unemployed individuals, with 24.5% or 47 of them being unemployed.
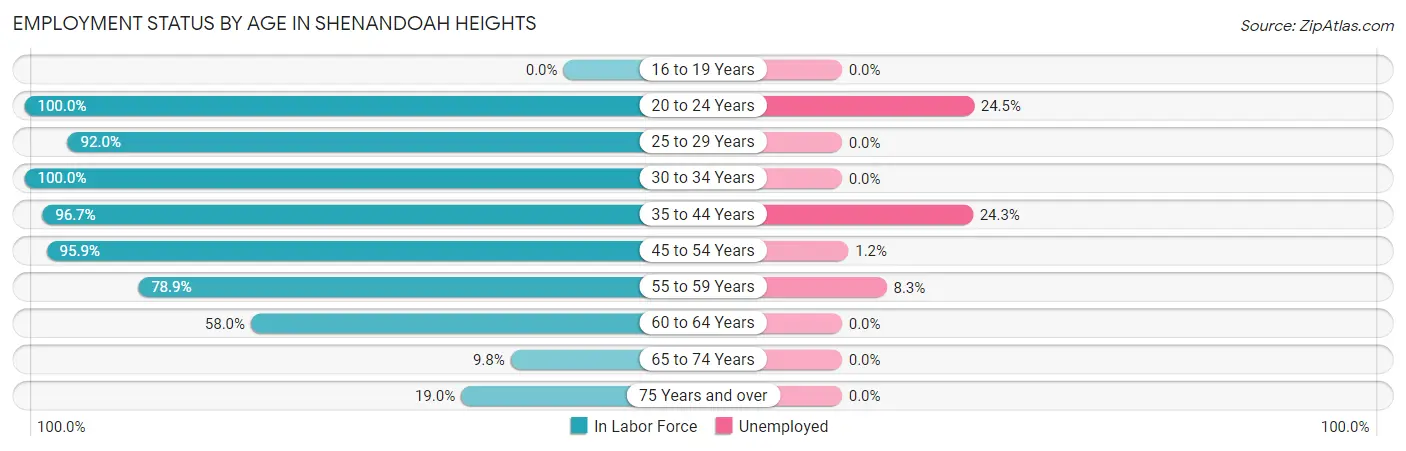
| Age Bracket | In Labor Force | Unemployed |
| 16 to 19 Years | 0 (0.0%) | 0 (0.0%) |
| 20 to 24 Years | 192 (100.0%) | 47 (24.5%) |
| 25 to 29 Years | 69 (92.0%) | 0 (0.0%) |
| 30 to 34 Years | 17 (100.0%) | 0 (0.0%) |
| 35 to 44 Years | 148 (96.7%) | 36 (24.3%) |
| 45 to 54 Years | 329 (95.9%) | 4 (1.2%) |
| 55 to 59 Years | 60 (78.9%) | 5 (8.3%) |
| 60 to 64 Years | 58 (58.0%) | 0 (0.0%) |
| 65 to 74 Years | 11 (9.8%) | 0 (0.0%) |
| 75 Years and over | 34 (19.0%) | 0 (0.0%) |
| Total | 918 (71.5%) | 92 (10.0%) |
Employment Status by Educational Attainment in Shenandoah Heights
According to labor force statistics for Shenandoah Heights, 89.1% of individuals (681) out of the total population between 25 and 64 years of age (764) are in the labor force, with 6.6% or 45 of them being unemployed. The group with the highest labor force participation rate are those with the educational attainment of bachelor's degree or higher, with 100.0% or 215 individuals in the labor force. Within the labor force, individuals with high school diploma education have the highest percentage of unemployment, with 20.8% or 36 of them being unemployed.
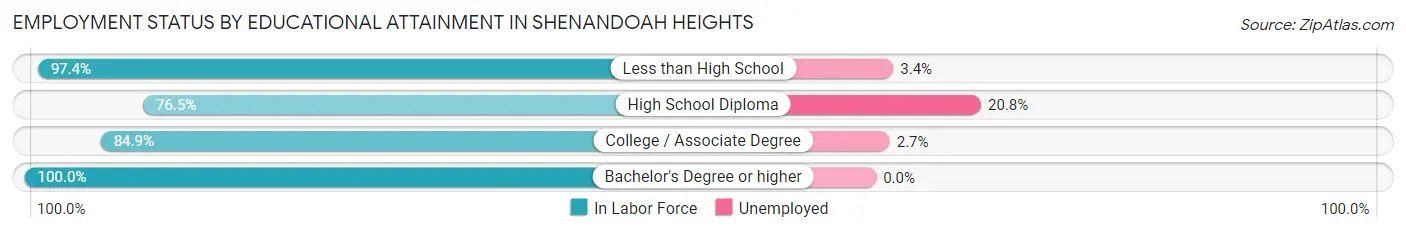
| Educational Attainment | In Labor Force | Unemployed |
| Less than High School | 147 (97.4%) | 5 (3.4%) |
| High School Diploma | 173 (76.5%) | 47 (20.8%) |
| College / Associate Degree | 146 (84.9%) | 5 (2.7%) |
| Bachelor's Degree or higher | 215 (100.0%) | 0 (0.0%) |
| Total | 681 (89.1%) | 50 (6.6%) |
Employment Occupations by Sex in Shenandoah Heights
Management, Business, Science and Arts Occupations
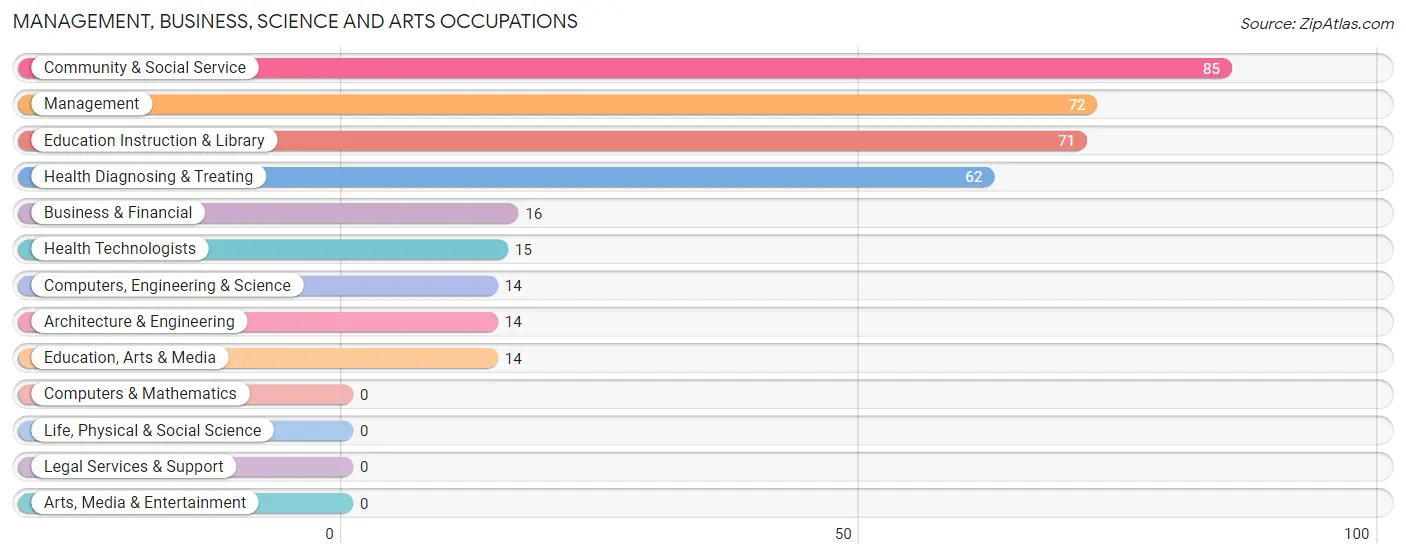
The most common Management, Business, Science and Arts occupations in Shenandoah Heights are Community & Social Service (85 | 10.3%), Management (72 | 8.7%), Education Instruction & Library (71 | 8.6%), Health Diagnosing & Treating (62 | 7.5%), and Business & Financial (16 | 1.9%).
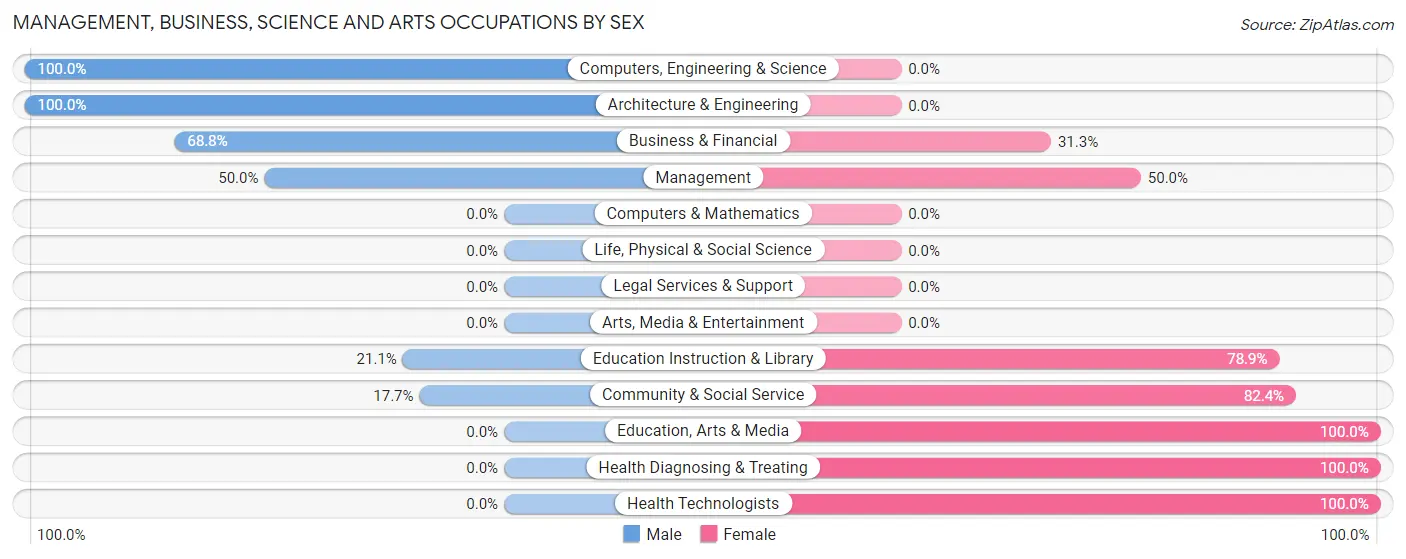
Management, Business, Science and Arts Occupations by Sex
Within the Management, Business, Science and Arts occupations in Shenandoah Heights, the most male-oriented occupations are Computers, Engineering & Science (100.0%), Architecture & Engineering (100.0%), and Business & Financial (68.8%), while the most female-oriented occupations are Education, Arts & Media (100.0%), Health Diagnosing & Treating (100.0%), and Health Technologists (100.0%).
| Occupation | Male | Female |
| Management | 36 (50.0%) | 36 (50.0%) |
| Business & Financial | 11 (68.8%) | 5 (31.2%) |
| Computers, Engineering & Science | 14 (100.0%) | 0 (0.0%) |
| Computers & Mathematics | 0 (0.0%) | 0 (0.0%) |
| Architecture & Engineering | 14 (100.0%) | 0 (0.0%) |
| Life, Physical & Social Science | 0 (0.0%) | 0 (0.0%) |
| Community & Social Service | 15 (17.6%) | 70 (82.4%) |
| Education, Arts & Media | 0 (0.0%) | 14 (100.0%) |
| Legal Services & Support | 0 (0.0%) | 0 (0.0%) |
| Education Instruction & Library | 15 (21.1%) | 56 (78.9%) |
| Arts, Media & Entertainment | 0 (0.0%) | 0 (0.0%) |
| Health Diagnosing & Treating | 0 (0.0%) | 62 (100.0%) |
| Health Technologists | 0 (0.0%) | 15 (100.0%) |
| Total (Category) | 76 (30.5%) | 173 (69.5%) |
| Total (Overall) | 356 (43.1%) | 470 (56.9%) |
Services Occupations
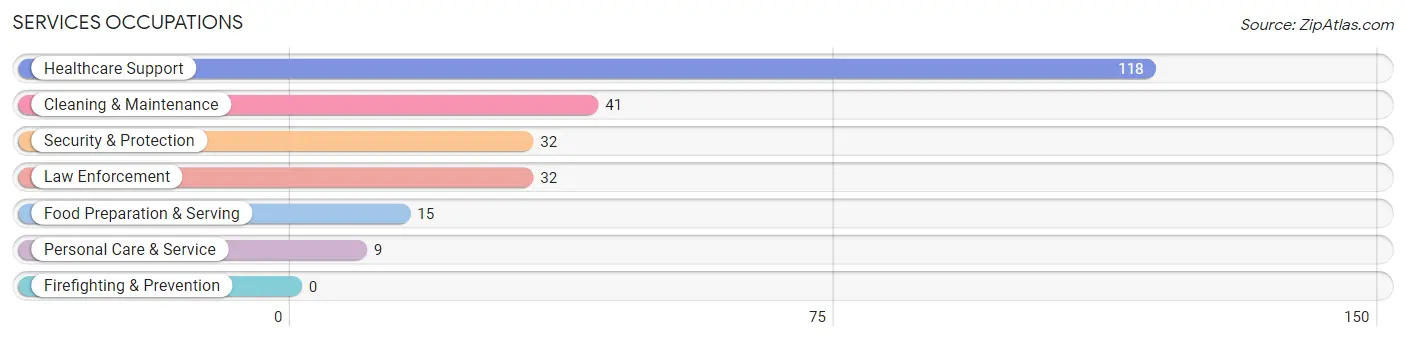
The most common Services occupations in Shenandoah Heights are Healthcare Support (118 | 14.3%), Cleaning & Maintenance (41 | 5.0%), Security & Protection (32 | 3.9%), Law Enforcement (32 | 3.9%), and Food Preparation & Serving (15 | 1.8%).
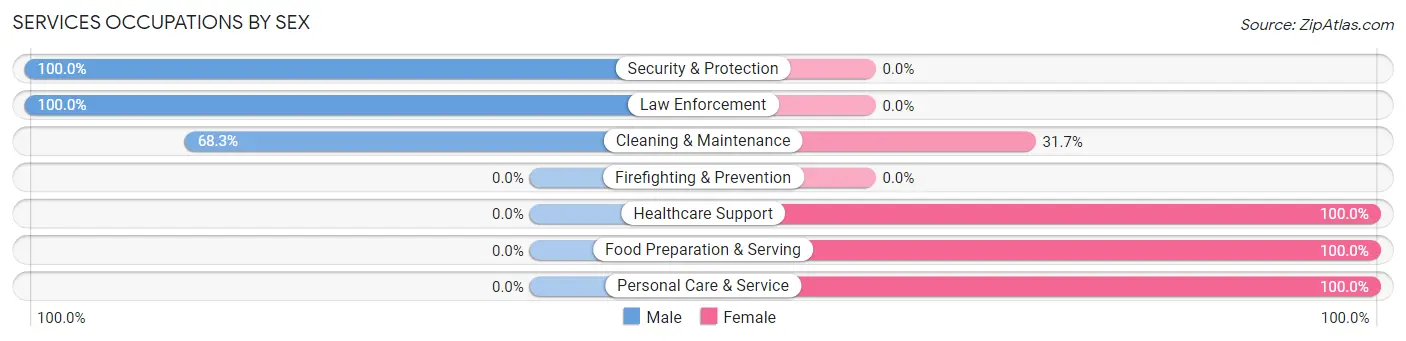
Services Occupations by Sex
Within the Services occupations in Shenandoah Heights, the most male-oriented occupations are Security & Protection (100.0%), Law Enforcement (100.0%), and Cleaning & Maintenance (68.3%), while the most female-oriented occupations are Healthcare Support (100.0%), Food Preparation & Serving (100.0%), and Personal Care & Service (100.0%).
| Occupation | Male | Female |
| Healthcare Support | 0 (0.0%) | 118 (100.0%) |
| Security & Protection | 32 (100.0%) | 0 (0.0%) |
| Firefighting & Prevention | 0 (0.0%) | 0 (0.0%) |
| Law Enforcement | 32 (100.0%) | 0 (0.0%) |
| Food Preparation & Serving | 0 (0.0%) | 15 (100.0%) |
| Cleaning & Maintenance | 28 (68.3%) | 13 (31.7%) |
| Personal Care & Service | 0 (0.0%) | 9 (100.0%) |
| Total (Category) | 60 (27.9%) | 155 (72.1%) |
| Total (Overall) | 356 (43.1%) | 470 (56.9%) |
Sales and Office Occupations
The most common Sales and Office occupations in Shenandoah Heights are Office & Administration (37 | 4.5%), and Sales & Related (12 | 1.5%).
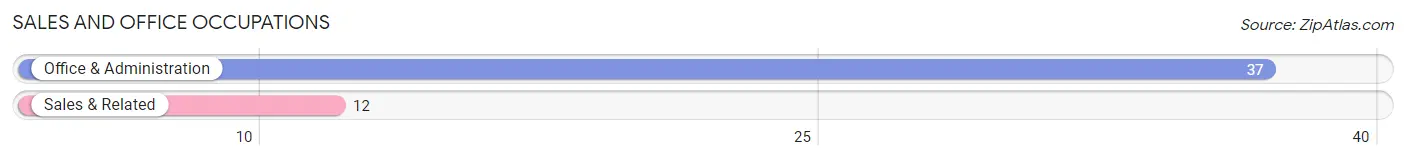
Sales and Office Occupations by Sex
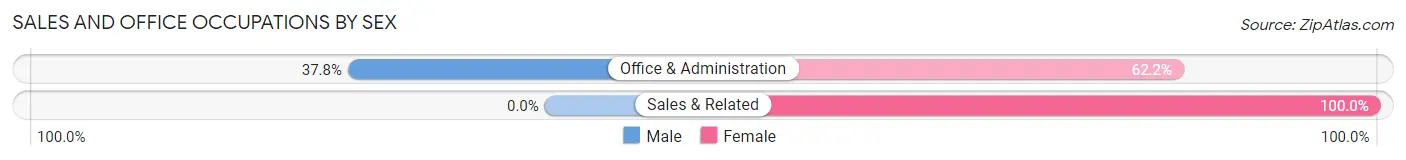
| Occupation | Male | Female |
| Sales & Related | 0 (0.0%) | 12 (100.0%) |
| Office & Administration | 14 (37.8%) | 23 (62.2%) |
| Total (Category) | 14 (28.6%) | 35 (71.4%) |
| Total (Overall) | 356 (43.1%) | 470 (56.9%) |
Natural Resources, Construction and Maintenance Occupations
The most common Natural Resources, Construction and Maintenance occupations in Shenandoah Heights are Construction & Extraction (88 | 10.6%), and Installation, Maintenance & Repair (10 | 1.2%).
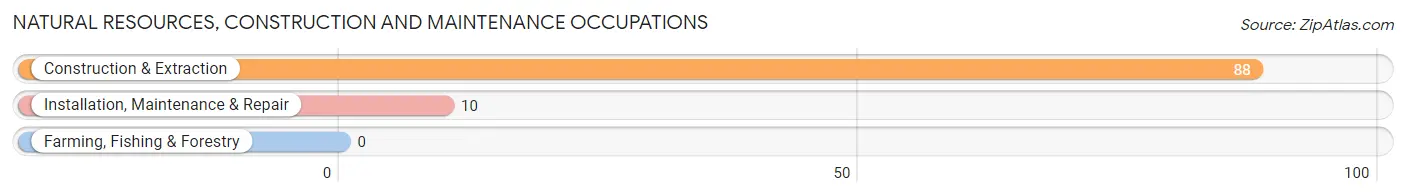
Natural Resources, Construction and Maintenance Occupations by Sex
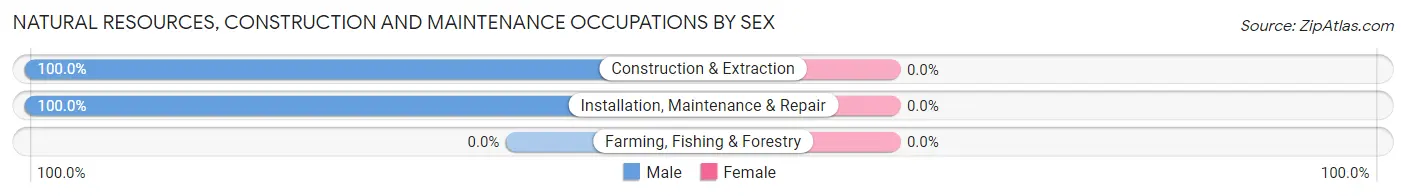
| Occupation | Male | Female |
| Farming, Fishing & Forestry | 0 (0.0%) | 0 (0.0%) |
| Construction & Extraction | 88 (100.0%) | 0 (0.0%) |
| Installation, Maintenance & Repair | 10 (100.0%) | 0 (0.0%) |
| Total (Category) | 98 (100.0%) | 0 (0.0%) |
| Total (Overall) | 356 (43.1%) | 470 (56.9%) |
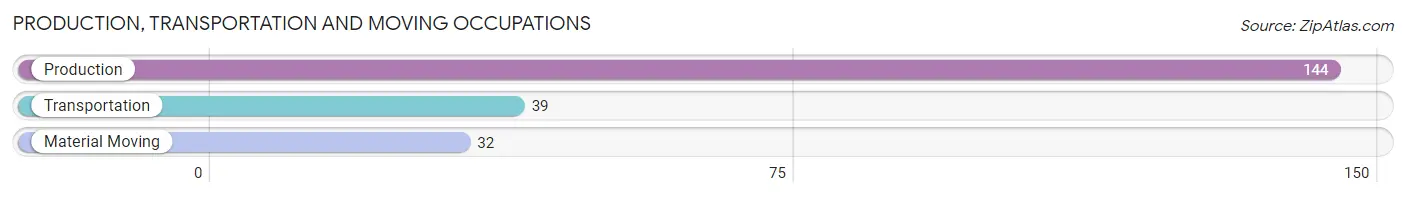
Production, Transportation and Moving Occupations
The most common Production, Transportation and Moving occupations in Shenandoah Heights are Production (144 | 17.4%), Transportation (39 | 4.7%), and Material Moving (32 | 3.9%).
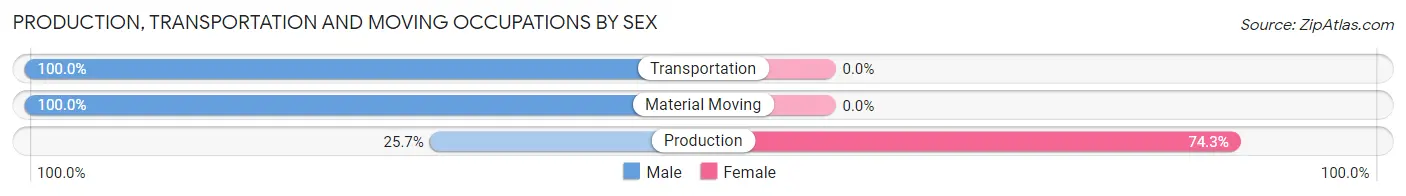
Production, Transportation and Moving Occupations by Sex
| Occupation | Male | Female |
| Production | 37 (25.7%) | 107 (74.3%) |
| Transportation | 39 (100.0%) | 0 (0.0%) |
| Material Moving | 32 (100.0%) | 0 (0.0%) |
| Total (Category) | 108 (50.2%) | 107 (49.8%) |
| Total (Overall) | 356 (43.1%) | 470 (56.9%) |
Employment Industries by Sex in Shenandoah Heights
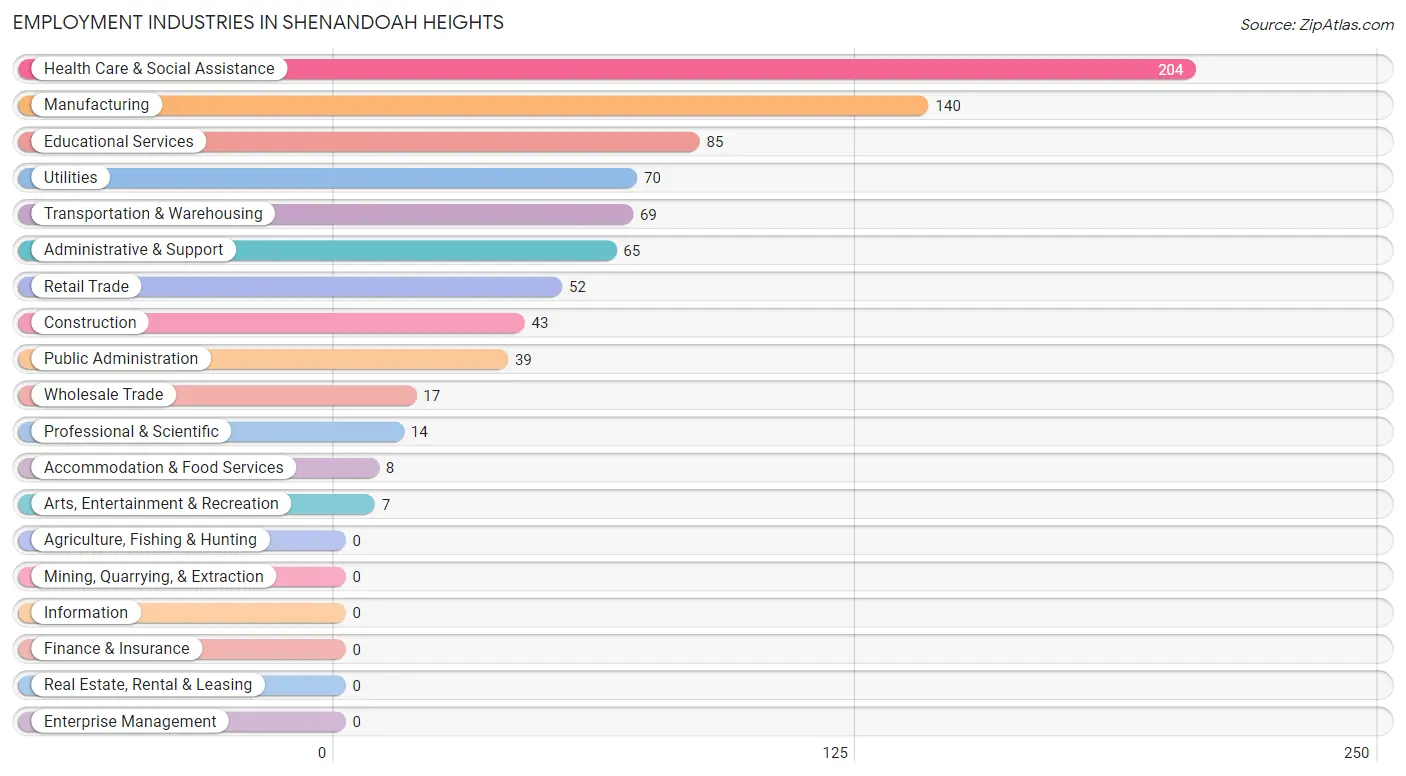
Employment Industries in Shenandoah Heights
The major employment industries in Shenandoah Heights include Health Care & Social Assistance (204 | 24.7%), Manufacturing (140 | 17.0%), Educational Services (85 | 10.3%), Utilities (70 | 8.5%), and Transportation & Warehousing (69 | 8.4%).
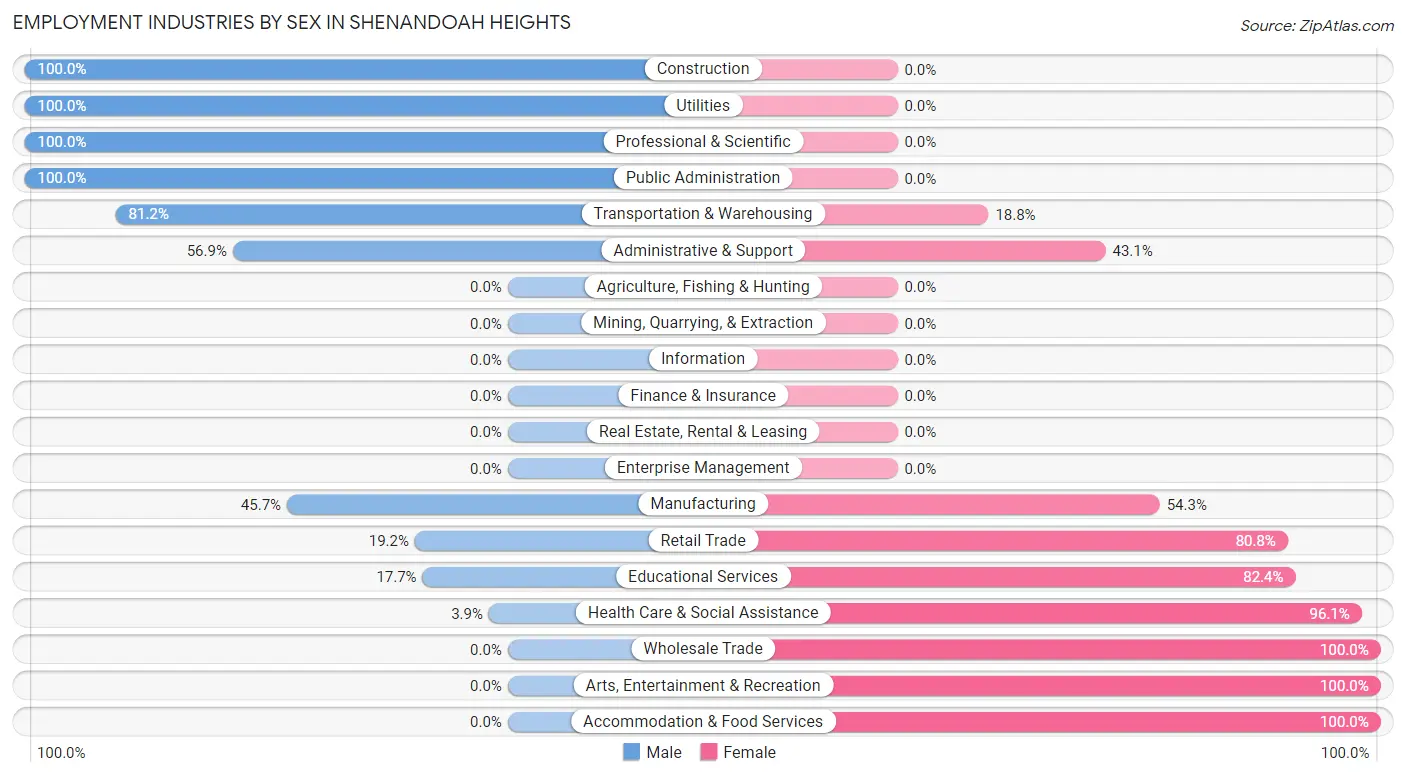
Employment Industries by Sex in Shenandoah Heights
The Shenandoah Heights industries that see more men than women are Construction (100.0%), Utilities (100.0%), and Professional & Scientific (100.0%), whereas the industries that tend to have a higher number of women are Wholesale Trade (100.0%), Arts, Entertainment & Recreation (100.0%), and Accommodation & Food Services (100.0%).
| Industry | Male | Female |
| Agriculture, Fishing & Hunting | 0 (0.0%) | 0 (0.0%) |
| Mining, Quarrying, & Extraction | 0 (0.0%) | 0 (0.0%) |
| Construction | 43 (100.0%) | 0 (0.0%) |
| Manufacturing | 64 (45.7%) | 76 (54.3%) |
| Wholesale Trade | 0 (0.0%) | 17 (100.0%) |
| Retail Trade | 10 (19.2%) | 42 (80.8%) |
| Transportation & Warehousing | 56 (81.2%) | 13 (18.8%) |
| Utilities | 70 (100.0%) | 0 (0.0%) |
| Information | 0 (0.0%) | 0 (0.0%) |
| Finance & Insurance | 0 (0.0%) | 0 (0.0%) |
| Real Estate, Rental & Leasing | 0 (0.0%) | 0 (0.0%) |
| Professional & Scientific | 14 (100.0%) | 0 (0.0%) |
| Enterprise Management | 0 (0.0%) | 0 (0.0%) |
| Administrative & Support | 37 (56.9%) | 28 (43.1%) |
| Educational Services | 15 (17.6%) | 70 (82.4%) |
| Health Care & Social Assistance | 8 (3.9%) | 196 (96.1%) |
| Arts, Entertainment & Recreation | 0 (0.0%) | 7 (100.0%) |
| Accommodation & Food Services | 0 (0.0%) | 8 (100.0%) |
| Public Administration | 39 (100.0%) | 0 (0.0%) |
| Total | 356 (43.1%) | 470 (56.9%) |
Education in Shenandoah Heights
School Enrollment in Shenandoah Heights
The most common levels of schooling among the 172 students in Shenandoah Heights are elementary school (59 | 34.3%), high school (48 | 27.9%), and college / undergraduate (48 | 27.9%).
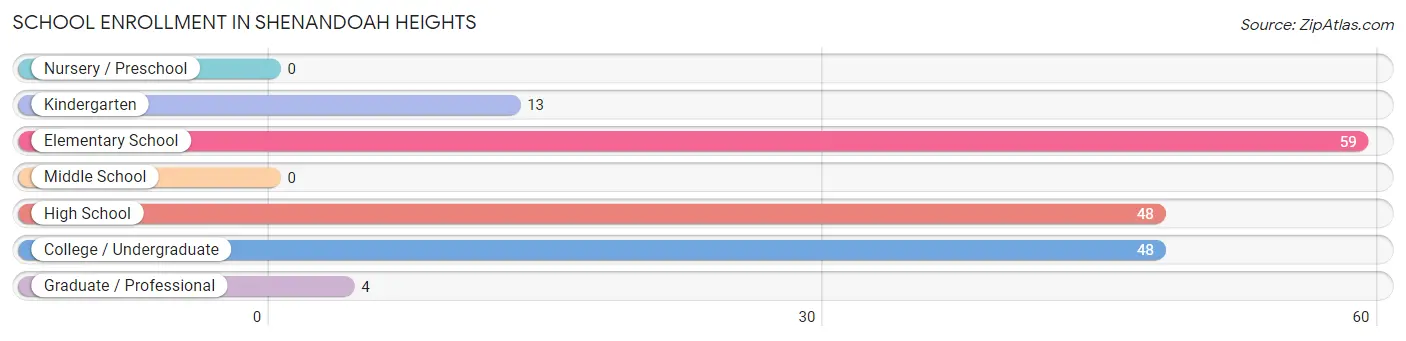
| School Level | # Students | % Students |
| Nursery / Preschool | 0 | 0.0% |
| Kindergarten | 13 | 7.6% |
| Elementary School | 59 | 34.3% |
| Middle School | 0 | 0.0% |
| High School | 48 | 27.9% |
| College / Undergraduate | 48 | 27.9% |
| Graduate / Professional | 4 | 2.3% |
| Total | 172 | 100.0% |
School Enrollment by Age by Funding Source in Shenandoah Heights
Out of a total of 172 students who are enrolled in schools in Shenandoah Heights, 34 (19.8%) attend a private institution, while the remaining 138 (80.2%) are enrolled in public schools. The age group of 5 to 9 year old has the highest likelihood of being enrolled in private schools, with 34 (57.6% in the age bracket) enrolled. Conversely, the age group of 10 to 14 year olds has the lowest likelihood of being enrolled in a private school, with 13 (100.0% in the age bracket) attending a public institution.
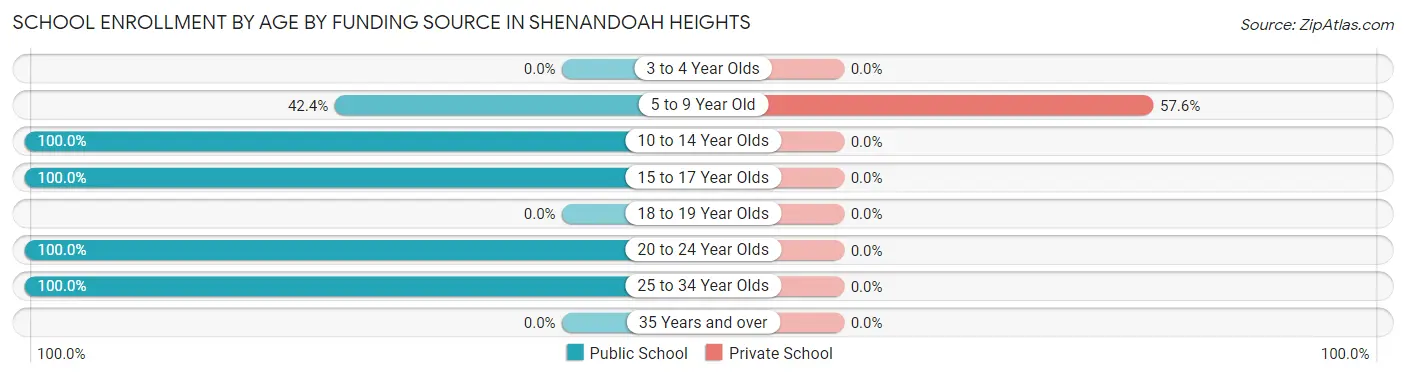
| Age Bracket | Public School | Private School |
| 3 to 4 Year Olds | 0 (0.0%) | 0 (0.0%) |
| 5 to 9 Year Old | 25 (42.4%) | 34 (57.6%) |
| 10 to 14 Year Olds | 13 (100.0%) | 0 (0.0%) |
| 15 to 17 Year Olds | 48 (100.0%) | 0 (0.0%) |
| 18 to 19 Year Olds | 0 (0.0%) | 0 (0.0%) |
| 20 to 24 Year Olds | 48 (100.0%) | 0 (0.0%) |
| 25 to 34 Year Olds | 4 (100.0%) | 0 (0.0%) |
| 35 Years and over | 0 (0.0%) | 0 (0.0%) |
| Total | 138 (80.2%) | 34 (19.8%) |
Educational Attainment by Field of Study in Shenandoah Heights
Education (104 | 44.1%), science & technology (57 | 24.1%), literature & languages (25 | 10.6%), psychology (14 | 5.9%), and engineering (14 | 5.9%) are the most common fields of study among 236 individuals in Shenandoah Heights who have obtained a bachelor's degree or higher.
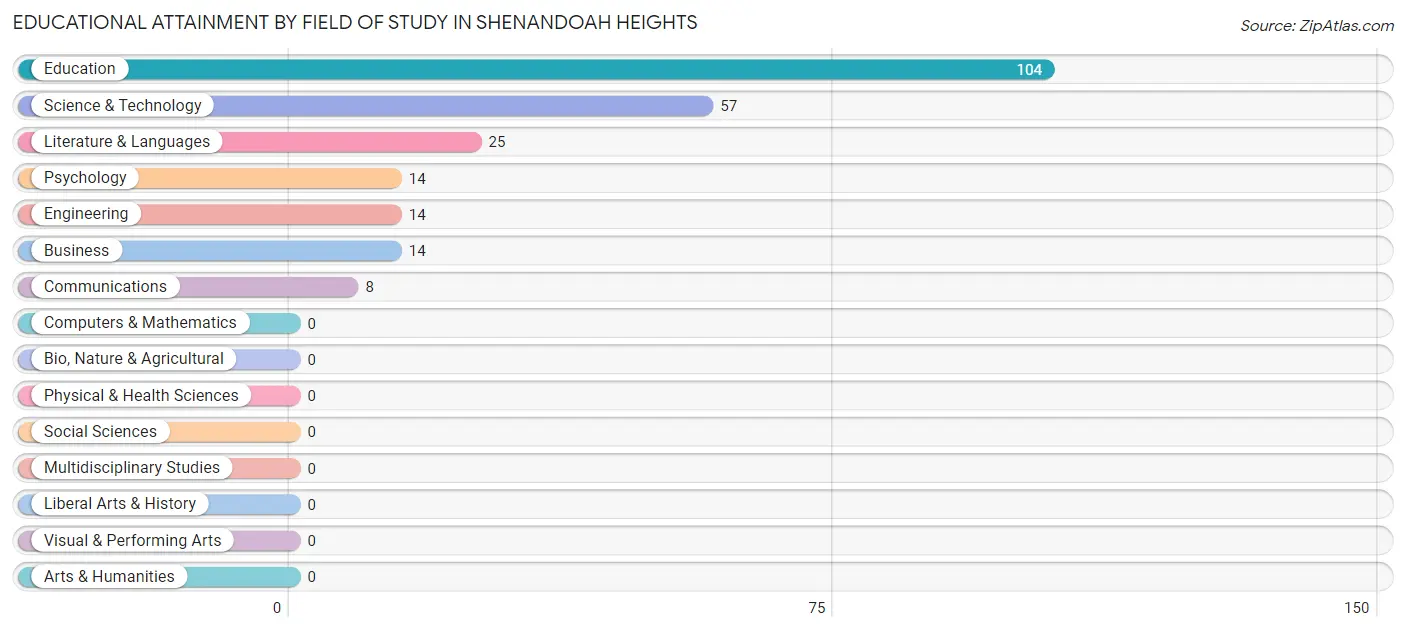
| Field of Study | # Graduates | % Graduates |
| Computers & Mathematics | 0 | 0.0% |
| Bio, Nature & Agricultural | 0 | 0.0% |
| Physical & Health Sciences | 0 | 0.0% |
| Psychology | 14 | 5.9% |
| Social Sciences | 0 | 0.0% |
| Engineering | 14 | 5.9% |
| Multidisciplinary Studies | 0 | 0.0% |
| Science & Technology | 57 | 24.1% |
| Business | 14 | 5.9% |
| Education | 104 | 44.1% |
| Literature & Languages | 25 | 10.6% |
| Liberal Arts & History | 0 | 0.0% |
| Visual & Performing Arts | 0 | 0.0% |
| Communications | 8 | 3.4% |
| Arts & Humanities | 0 | 0.0% |
| Total | 236 | 100.0% |
Transportation & Commute in Shenandoah Heights
Vehicle Availability by Sex in Shenandoah Heights
The most prevalent vehicle ownership categories in Shenandoah Heights are males with 2 vehicles (217, accounting for 61.0%) and females with 2 vehicles (291, making up 46.2%).
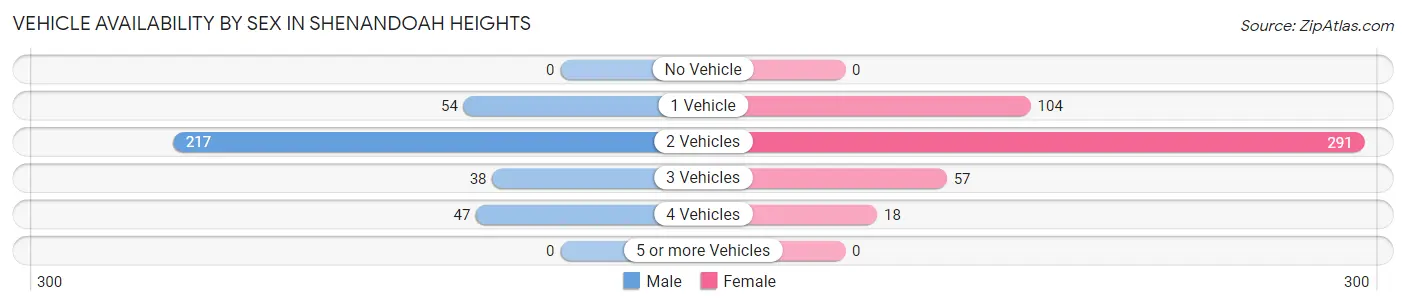
| Vehicles Available | Male | Female |
| No Vehicle | 0 (0.0%) | 0 (0.0%) |
| 1 Vehicle | 54 (15.2%) | 104 (22.1%) |
| 2 Vehicles | 217 (61.0%) | 291 (61.9%) |
| 3 Vehicles | 38 (10.7%) | 57 (12.1%) |
| 4 Vehicles | 47 (13.2%) | 18 (3.8%) |
| 5 or more Vehicles | 0 (0.0%) | 0 (0.0%) |
| Total | 356 (100.0%) | 470 (100.0%) |
Commute Time in Shenandoah Heights
The most frequently occuring commute durations in Shenandoah Heights are 15 to 19 minutes (186 commuters, 22.5%), 30 to 34 minutes (167 commuters, 20.2%), and 10 to 14 minutes (90 commuters, 10.9%).
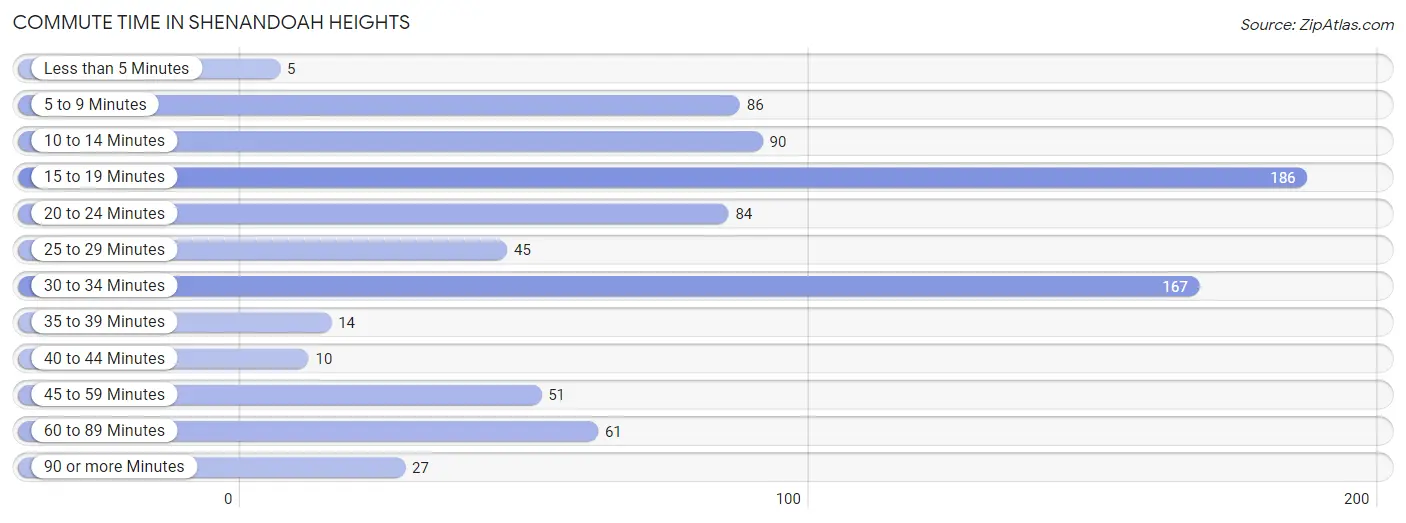
| Commute Time | # Commuters | % Commuters |
| Less than 5 Minutes | 5 | 0.6% |
| 5 to 9 Minutes | 86 | 10.4% |
| 10 to 14 Minutes | 90 | 10.9% |
| 15 to 19 Minutes | 186 | 22.5% |
| 20 to 24 Minutes | 84 | 10.2% |
| 25 to 29 Minutes | 45 | 5.4% |
| 30 to 34 Minutes | 167 | 20.2% |
| 35 to 39 Minutes | 14 | 1.7% |
| 40 to 44 Minutes | 10 | 1.2% |
| 45 to 59 Minutes | 51 | 6.2% |
| 60 to 89 Minutes | 61 | 7.4% |
| 90 or more Minutes | 27 | 3.3% |
Commute Time by Sex in Shenandoah Heights
The most common commute times in Shenandoah Heights are 10 to 14 minutes (70 commuters, 19.7%) for males and 15 to 19 minutes (126 commuters, 26.8%) for females.
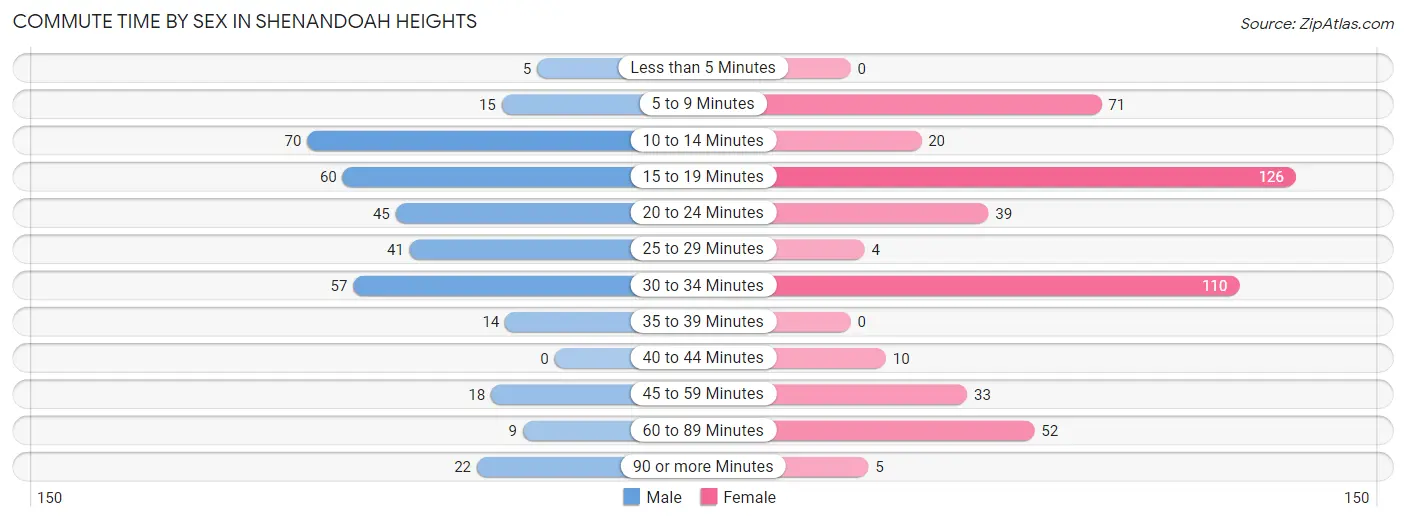
| Commute Time | Male | Female |
| Less than 5 Minutes | 5 (1.4%) | 0 (0.0%) |
| 5 to 9 Minutes | 15 (4.2%) | 71 (15.1%) |
| 10 to 14 Minutes | 70 (19.7%) | 20 (4.3%) |
| 15 to 19 Minutes | 60 (16.9%) | 126 (26.8%) |
| 20 to 24 Minutes | 45 (12.6%) | 39 (8.3%) |
| 25 to 29 Minutes | 41 (11.5%) | 4 (0.9%) |
| 30 to 34 Minutes | 57 (16.0%) | 110 (23.4%) |
| 35 to 39 Minutes | 14 (3.9%) | 0 (0.0%) |
| 40 to 44 Minutes | 0 (0.0%) | 10 (2.1%) |
| 45 to 59 Minutes | 18 (5.1%) | 33 (7.0%) |
| 60 to 89 Minutes | 9 (2.5%) | 52 (11.1%) |
| 90 or more Minutes | 22 (6.2%) | 5 (1.1%) |
Time of Departure to Work by Sex in Shenandoah Heights
The most frequent times of departure to work in Shenandoah Heights are 7:30 AM to 7:59 AM (75, 21.1%) for males and 8:30 AM to 8:59 AM (162, 34.5%) for females.
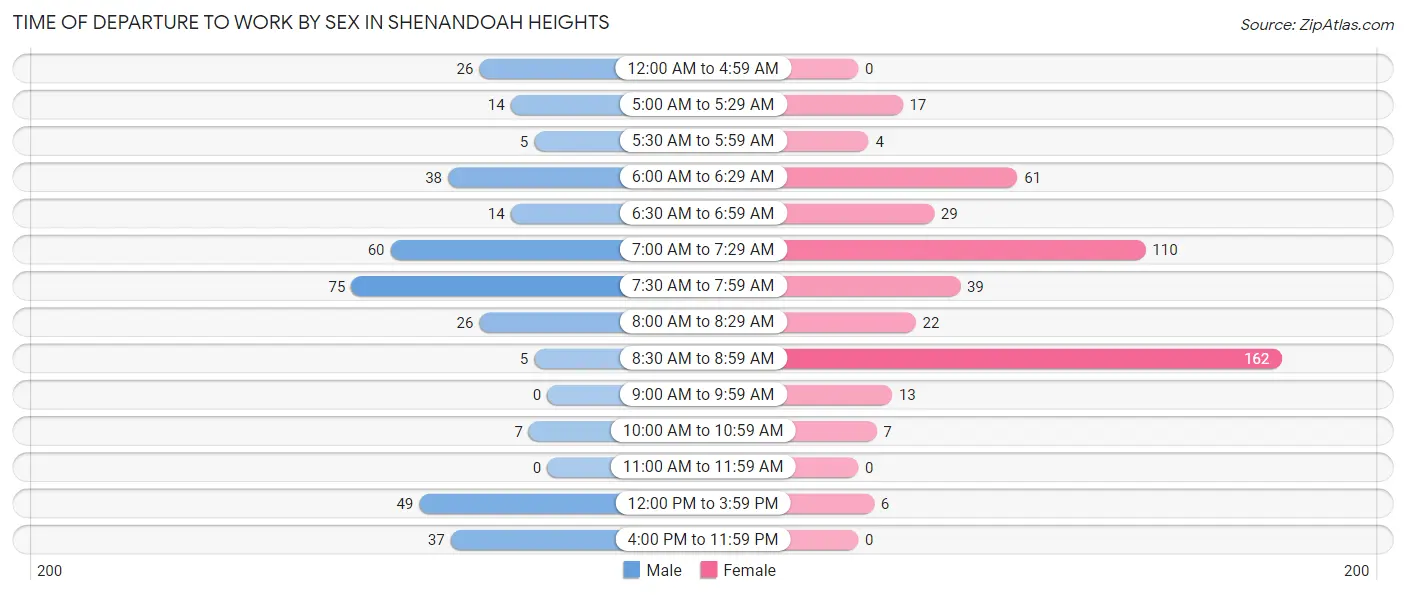
| Time of Departure | Male | Female |
| 12:00 AM to 4:59 AM | 26 (7.3%) | 0 (0.0%) |
| 5:00 AM to 5:29 AM | 14 (3.9%) | 17 (3.6%) |
| 5:30 AM to 5:59 AM | 5 (1.4%) | 4 (0.9%) |
| 6:00 AM to 6:29 AM | 38 (10.7%) | 61 (13.0%) |
| 6:30 AM to 6:59 AM | 14 (3.9%) | 29 (6.2%) |
| 7:00 AM to 7:29 AM | 60 (16.9%) | 110 (23.4%) |
| 7:30 AM to 7:59 AM | 75 (21.1%) | 39 (8.3%) |
| 8:00 AM to 8:29 AM | 26 (7.3%) | 22 (4.7%) |
| 8:30 AM to 8:59 AM | 5 (1.4%) | 162 (34.5%) |
| 9:00 AM to 9:59 AM | 0 (0.0%) | 13 (2.8%) |
| 10:00 AM to 10:59 AM | 7 (2.0%) | 7 (1.5%) |
| 11:00 AM to 11:59 AM | 0 (0.0%) | 0 (0.0%) |
| 12:00 PM to 3:59 PM | 49 (13.8%) | 6 (1.3%) |
| 4:00 PM to 11:59 PM | 37 (10.4%) | 0 (0.0%) |
| Total | 356 (100.0%) | 470 (100.0%) |
Housing Occupancy in Shenandoah Heights
Occupancy by Ownership in Shenandoah Heights
Of the total 609 dwellings in Shenandoah Heights, owner-occupied units account for 569 (93.4%), while renter-occupied units make up 40 (6.6%).
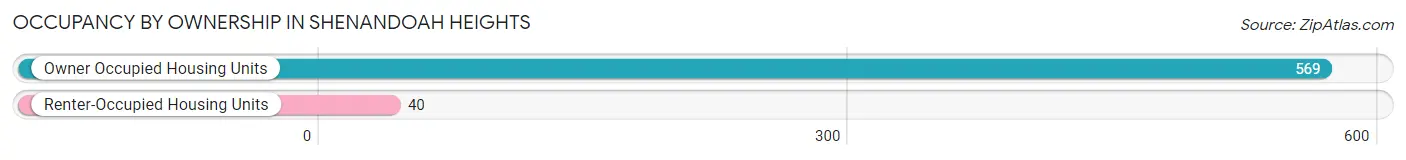
| Occupancy | # Housing Units | % Housing Units |
| Owner Occupied Housing Units | 569 | 93.4% |
| Renter-Occupied Housing Units | 40 | 6.6% |
| Total Occupied Housing Units | 609 | 100.0% |
Occupancy by Household Size in Shenandoah Heights
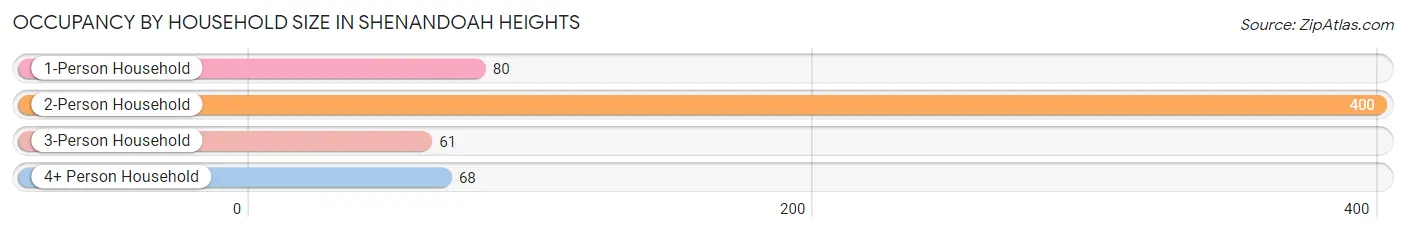
| Household Size | # Housing Units | % Housing Units |
| 1-Person Household | 80 | 13.1% |
| 2-Person Household | 400 | 65.7% |
| 3-Person Household | 61 | 10.0% |
| 4+ Person Household | 68 | 11.2% |
| Total Housing Units | 609 | 100.0% |
Occupancy by Ownership by Household Size in Shenandoah Heights
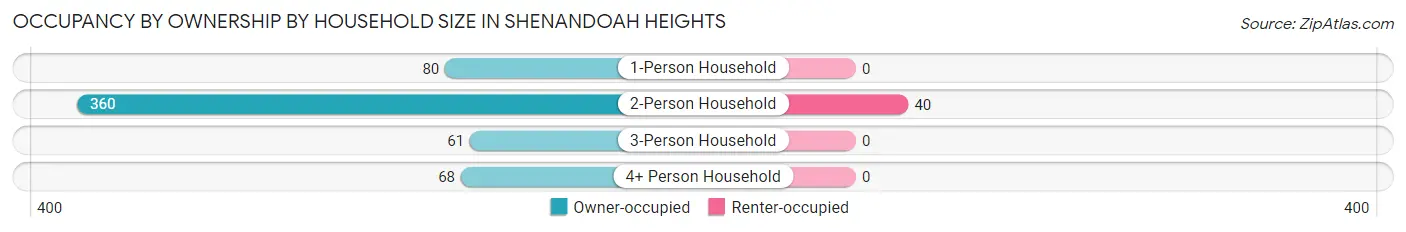
| Household Size | Owner-occupied | Renter-occupied |
| 1-Person Household | 80 (100.0%) | 0 (0.0%) |
| 2-Person Household | 360 (90.0%) | 40 (10.0%) |
| 3-Person Household | 61 (100.0%) | 0 (0.0%) |
| 4+ Person Household | 68 (100.0%) | 0 (0.0%) |
| Total Housing Units | 569 (93.4%) | 40 (6.6%) |
Occupancy by Educational Attainment in Shenandoah Heights
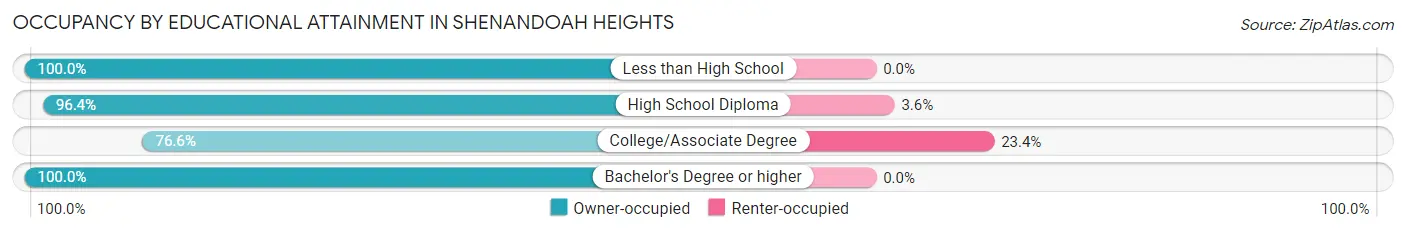
| Household Size | Owner-occupied | Renter-occupied |
| Less than High School | 118 (100.0%) | 0 (0.0%) |
| High School Diploma | 186 (96.4%) | 7 (3.6%) |
| College/Associate Degree | 108 (76.6%) | 33 (23.4%) |
| Bachelor's Degree or higher | 157 (100.0%) | 0 (0.0%) |
Occupancy by Age of Householder in Shenandoah Heights
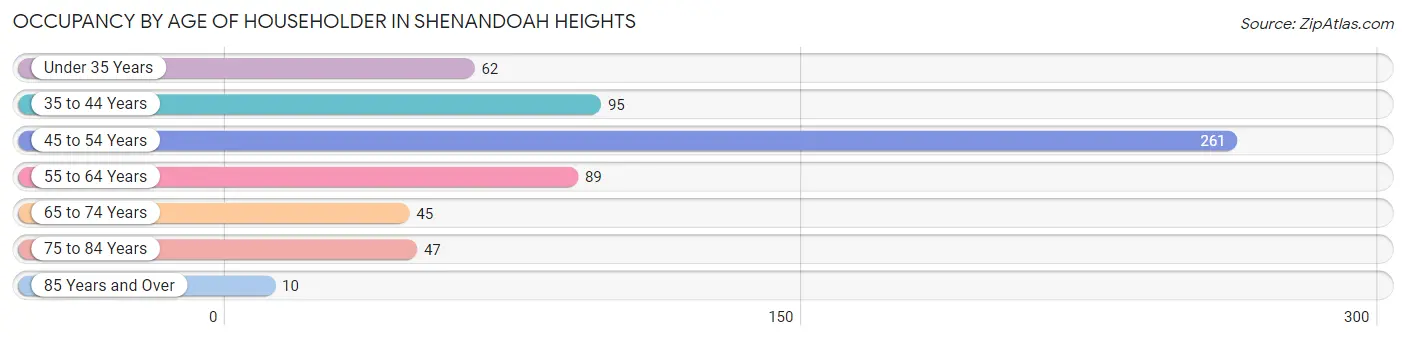
| Age Bracket | # Households | % Households |
| Under 35 Years | 62 | 10.2% |
| 35 to 44 Years | 95 | 15.6% |
| 45 to 54 Years | 261 | 42.9% |
| 55 to 64 Years | 89 | 14.6% |
| 65 to 74 Years | 45 | 7.4% |
| 75 to 84 Years | 47 | 7.7% |
| 85 Years and Over | 10 | 1.6% |
| Total | 609 | 100.0% |
Housing Finances in Shenandoah Heights
Median Income by Occupancy in Shenandoah Heights
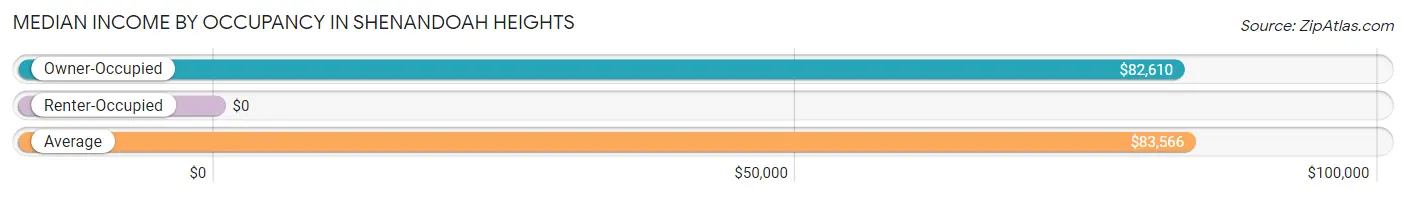
| Occupancy Type | # Households | Median Income |
| Owner-Occupied | 569 (93.4%) | $82,610 |
| Renter-Occupied | 40 (6.6%) | $0 |
| Average | 609 (100.0%) | $83,566 |
Occupancy by Householder Income Bracket in Shenandoah Heights
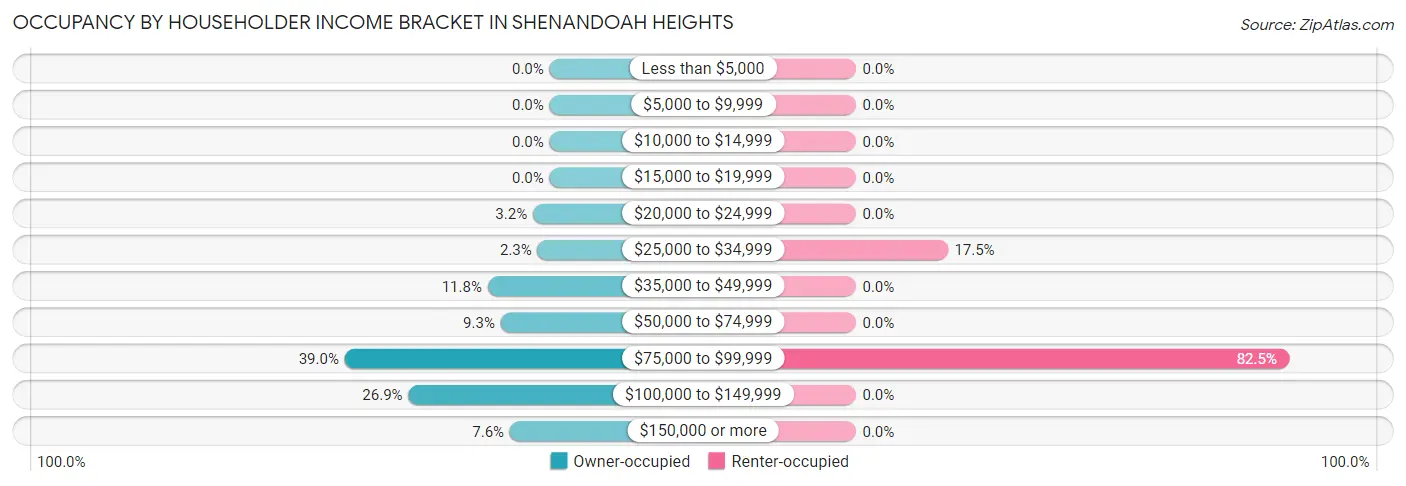
| Income Bracket | Owner-occupied | Renter-occupied |
| Less than $5,000 | 0 (0.0%) | 0 (0.0%) |
| $5,000 to $9,999 | 0 (0.0%) | 0 (0.0%) |
| $10,000 to $14,999 | 0 (0.0%) | 0 (0.0%) |
| $15,000 to $19,999 | 0 (0.0%) | 0 (0.0%) |
| $20,000 to $24,999 | 18 (3.2%) | 0 (0.0%) |
| $25,000 to $34,999 | 13 (2.3%) | 7 (17.5%) |
| $35,000 to $49,999 | 67 (11.8%) | 0 (0.0%) |
| $50,000 to $74,999 | 53 (9.3%) | 0 (0.0%) |
| $75,000 to $99,999 | 222 (39.0%) | 33 (82.5%) |
| $100,000 to $149,999 | 153 (26.9%) | 0 (0.0%) |
| $150,000 or more | 43 (7.6%) | 0 (0.0%) |
| Total | 569 (100.0%) | 40 (100.0%) |
Monthly Housing Cost Tiers in Shenandoah Heights
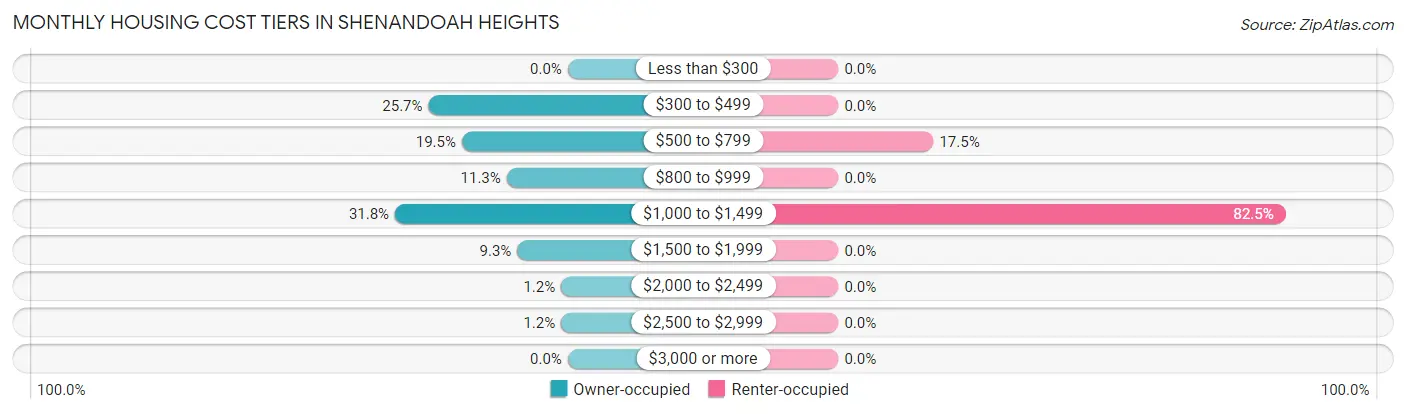
| Monthly Cost | Owner-occupied | Renter-occupied |
| Less than $300 | 0 (0.0%) | 0 (0.0%) |
| $300 to $499 | 146 (25.7%) | 0 (0.0%) |
| $500 to $799 | 111 (19.5%) | 7 (17.5%) |
| $800 to $999 | 64 (11.3%) | 0 (0.0%) |
| $1,000 to $1,499 | 181 (31.8%) | 33 (82.5%) |
| $1,500 to $1,999 | 53 (9.3%) | 0 (0.0%) |
| $2,000 to $2,499 | 7 (1.2%) | 0 (0.0%) |
| $2,500 to $2,999 | 7 (1.2%) | 0 (0.0%) |
| $3,000 or more | 0 (0.0%) | 0 (0.0%) |
| Total | 569 (100.0%) | 40 (100.0%) |
Physical Housing Characteristics in Shenandoah Heights
Housing Structures in Shenandoah Heights
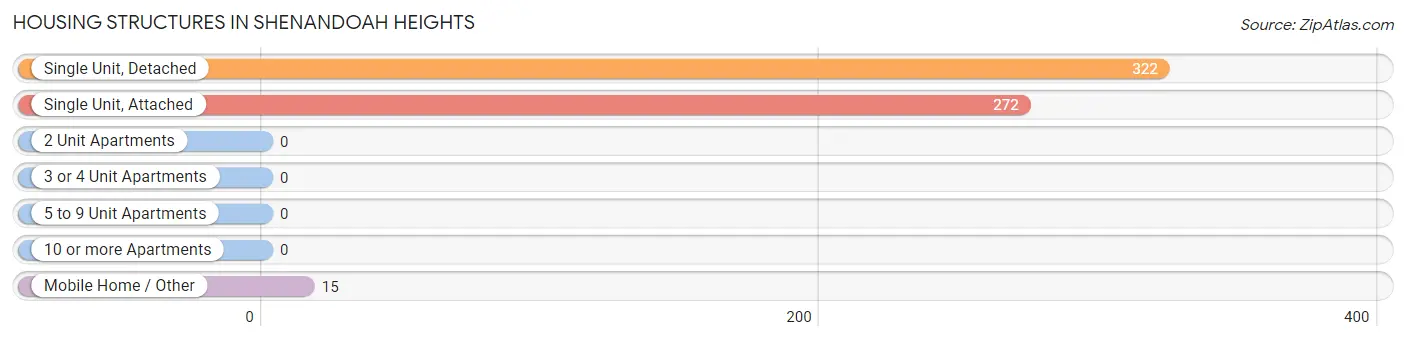
| Structure Type | # Housing Units | % Housing Units |
| Single Unit, Detached | 322 | 52.9% |
| Single Unit, Attached | 272 | 44.7% |
| 2 Unit Apartments | 0 | 0.0% |
| 3 or 4 Unit Apartments | 0 | 0.0% |
| 5 to 9 Unit Apartments | 0 | 0.0% |
| 10 or more Apartments | 0 | 0.0% |
| Mobile Home / Other | 15 | 2.5% |
| Total | 609 | 100.0% |
Housing Structures by Occupancy in Shenandoah Heights
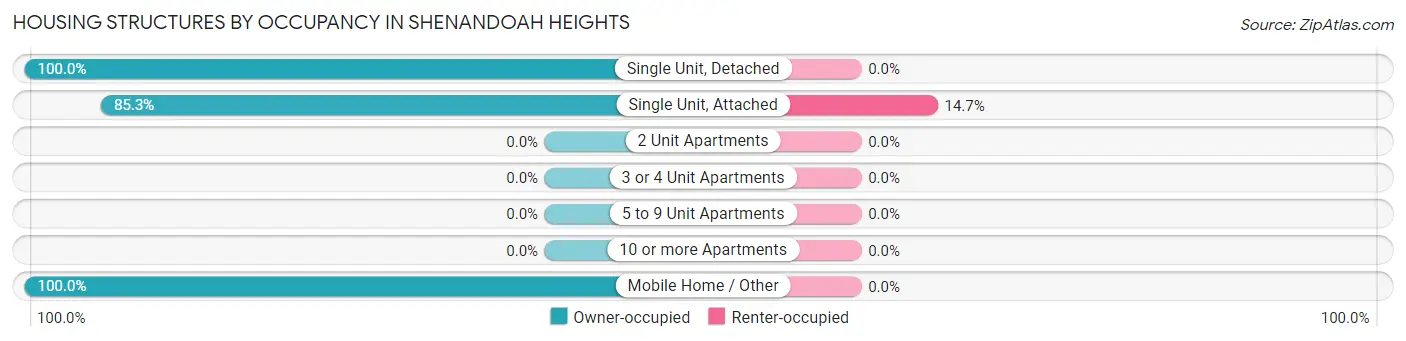
| Structure Type | Owner-occupied | Renter-occupied |
| Single Unit, Detached | 322 (100.0%) | 0 (0.0%) |
| Single Unit, Attached | 232 (85.3%) | 40 (14.7%) |
| 2 Unit Apartments | 0 (0.0%) | 0 (0.0%) |
| 3 or 4 Unit Apartments | 0 (0.0%) | 0 (0.0%) |
| 5 to 9 Unit Apartments | 0 (0.0%) | 0 (0.0%) |
| 10 or more Apartments | 0 (0.0%) | 0 (0.0%) |
| Mobile Home / Other | 15 (100.0%) | 0 (0.0%) |
| Total | 569 (93.4%) | 40 (6.6%) |
Housing Structures by Number of Rooms in Shenandoah Heights
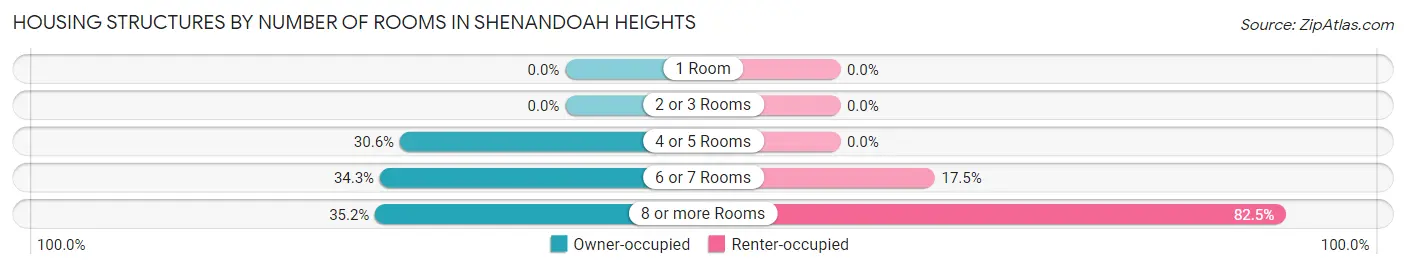
| Number of Rooms | Owner-occupied | Renter-occupied |
| 1 Room | 0 (0.0%) | 0 (0.0%) |
| 2 or 3 Rooms | 0 (0.0%) | 0 (0.0%) |
| 4 or 5 Rooms | 174 (30.6%) | 0 (0.0%) |
| 6 or 7 Rooms | 195 (34.3%) | 7 (17.5%) |
| 8 or more Rooms | 200 (35.1%) | 33 (82.5%) |
| Total | 569 (100.0%) | 40 (100.0%) |
Housing Structure by Heating Type in Shenandoah Heights
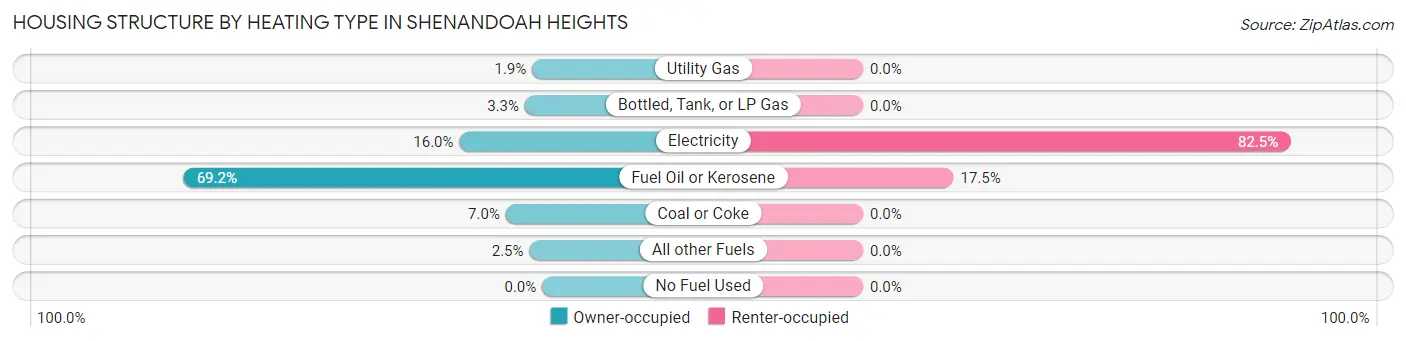
| Heating Type | Owner-occupied | Renter-occupied |
| Utility Gas | 11 (1.9%) | 0 (0.0%) |
| Bottled, Tank, or LP Gas | 19 (3.3%) | 0 (0.0%) |
| Electricity | 91 (16.0%) | 33 (82.5%) |
| Fuel Oil or Kerosene | 394 (69.2%) | 7 (17.5%) |
| Coal or Coke | 40 (7.0%) | 0 (0.0%) |
| All other Fuels | 14 (2.5%) | 0 (0.0%) |
| No Fuel Used | 0 (0.0%) | 0 (0.0%) |
| Total | 569 (100.0%) | 40 (100.0%) |
Household Vehicle Usage in Shenandoah Heights
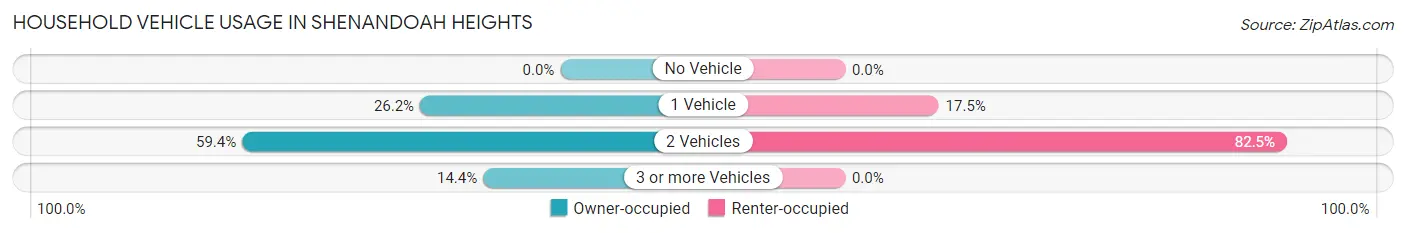
| Vehicles per Household | Owner-occupied | Renter-occupied |
| No Vehicle | 0 (0.0%) | 0 (0.0%) |
| 1 Vehicle | 149 (26.2%) | 7 (17.5%) |
| 2 Vehicles | 338 (59.4%) | 33 (82.5%) |
| 3 or more Vehicles | 82 (14.4%) | 0 (0.0%) |
| Total | 569 (100.0%) | 40 (100.0%) |
Real Estate & Mortgages in Shenandoah Heights
Real Estate and Mortgage Overview in Shenandoah Heights
| Characteristic | Without Mortgage | With Mortgage |
| Housing Units | 313 | 256 |
| Median Property Value | $45,500 | $118,400 |
| Median Household Income | $78,803 | $34 |
| Monthly Housing Costs | $546 | $0 |
| Real Estate Taxes | $1,274 | $0 |
Property Value by Mortgage Status in Shenandoah Heights
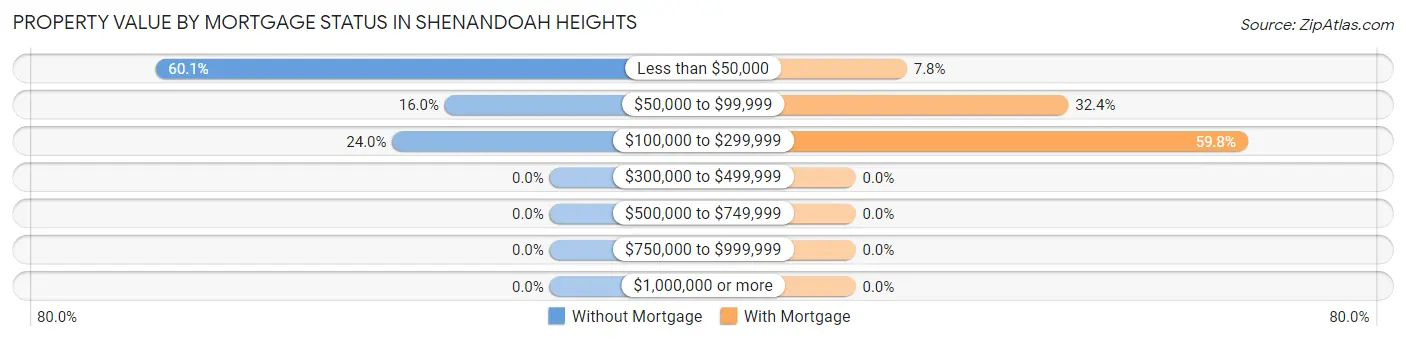
| Property Value | Without Mortgage | With Mortgage |
| Less than $50,000 | 188 (60.1%) | 20 (7.8%) |
| $50,000 to $99,999 | 50 (16.0%) | 83 (32.4%) |
| $100,000 to $299,999 | 75 (24.0%) | 153 (59.8%) |
| $300,000 to $499,999 | 0 (0.0%) | 0 (0.0%) |
| $500,000 to $749,999 | 0 (0.0%) | 0 (0.0%) |
| $750,000 to $999,999 | 0 (0.0%) | 0 (0.0%) |
| $1,000,000 or more | 0 (0.0%) | 0 (0.0%) |
| Total | 313 (100.0%) | 256 (100.0%) |
Household Income by Mortgage Status in Shenandoah Heights
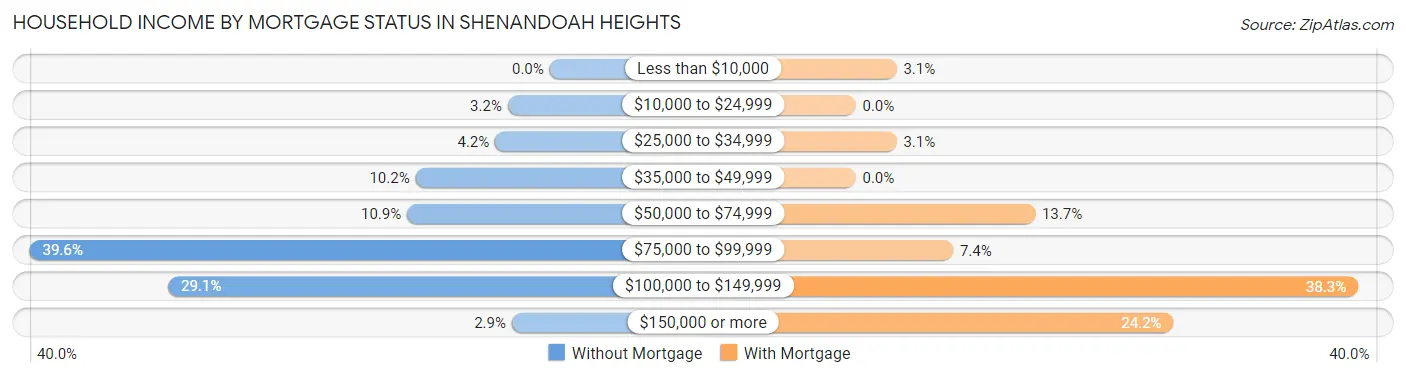
| Household Income | Without Mortgage | With Mortgage |
| Less than $10,000 | 0 (0.0%) | 8 (3.1%) |
| $10,000 to $24,999 | 10 (3.2%) | 0 (0.0%) |
| $25,000 to $34,999 | 13 (4.2%) | 8 (3.1%) |
| $35,000 to $49,999 | 32 (10.2%) | 0 (0.0%) |
| $50,000 to $74,999 | 34 (10.9%) | 35 (13.7%) |
| $75,000 to $99,999 | 124 (39.6%) | 19 (7.4%) |
| $100,000 to $149,999 | 91 (29.1%) | 98 (38.3%) |
| $150,000 or more | 9 (2.9%) | 62 (24.2%) |
| Total | 313 (100.0%) | 256 (100.0%) |
Property Value to Household Income Ratio in Shenandoah Heights
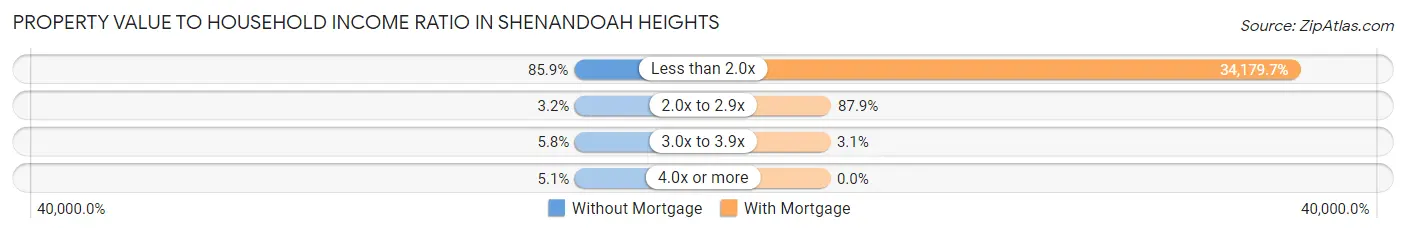
| Value-to-Income Ratio | Without Mortgage | With Mortgage |
| Less than 2.0x | 269 (85.9%) | 87,500 (34,179.7%) |
| 2.0x to 2.9x | 10 (3.2%) | 225 (87.9%) |
| 3.0x to 3.9x | 18 (5.8%) | 8 (3.1%) |
| 4.0x or more | 16 (5.1%) | 0 (0.0%) |
| Total | 313 (100.0%) | 256 (100.0%) |
Real Estate Taxes by Mortgage Status in Shenandoah Heights
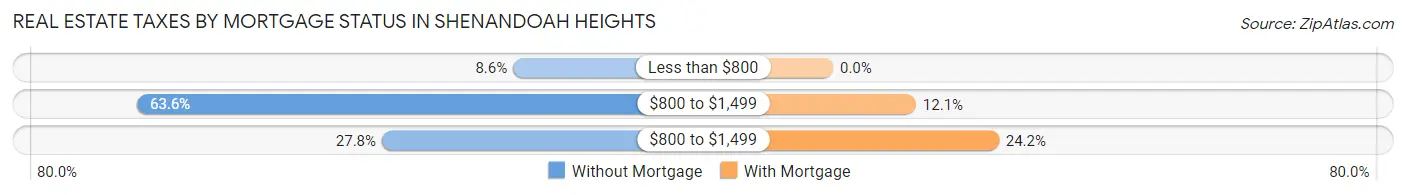
| Property Taxes | Without Mortgage | With Mortgage |
| Less than $800 | 27 (8.6%) | 0 (0.0%) |
| $800 to $1,499 | 199 (63.6%) | 31 (12.1%) |
| $800 to $1,499 | 87 (27.8%) | 62 (24.2%) |
| Total | 313 (100.0%) | 256 (100.0%) |
Health & Disability in Shenandoah Heights
Health Insurance Coverage by Age in Shenandoah Heights
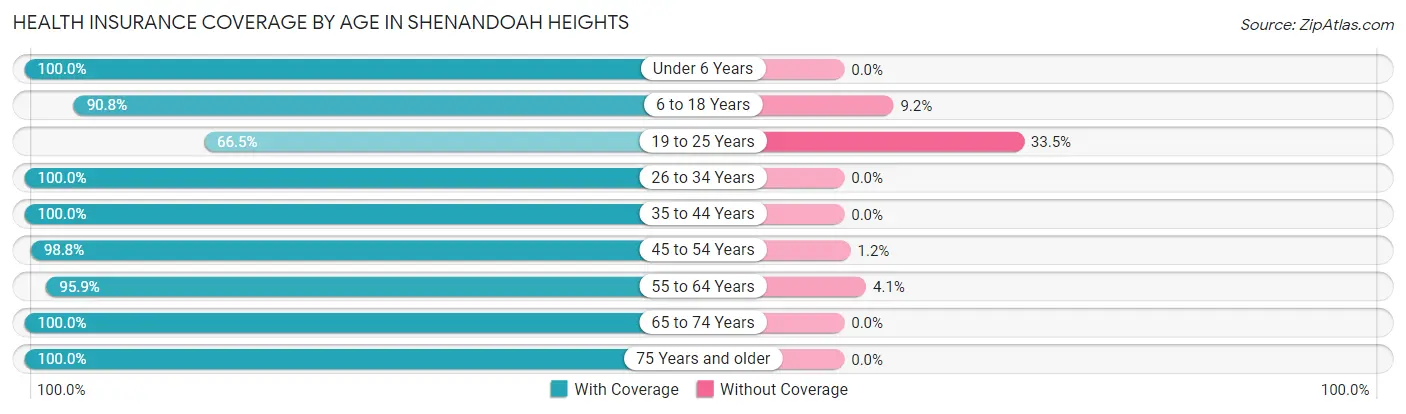
| Age Bracket | With Coverage | Without Coverage |
| Under 6 Years | 16 (100.0%) | 0 (0.0%) |
| 6 to 18 Years | 109 (90.8%) | 11 (9.2%) |
| 19 to 25 Years | 143 (66.5%) | 72 (33.5%) |
| 26 to 34 Years | 69 (100.0%) | 0 (0.0%) |
| 35 to 44 Years | 153 (100.0%) | 0 (0.0%) |
| 45 to 54 Years | 339 (98.8%) | 4 (1.2%) |
| 55 to 64 Years | 165 (95.9%) | 7 (4.1%) |
| 65 to 74 Years | 90 (100.0%) | 0 (0.0%) |
| 75 Years and older | 107 (100.0%) | 0 (0.0%) |
| Total | 1,191 (92.7%) | 94 (7.3%) |
Health Insurance Coverage by Citizenship Status in Shenandoah Heights
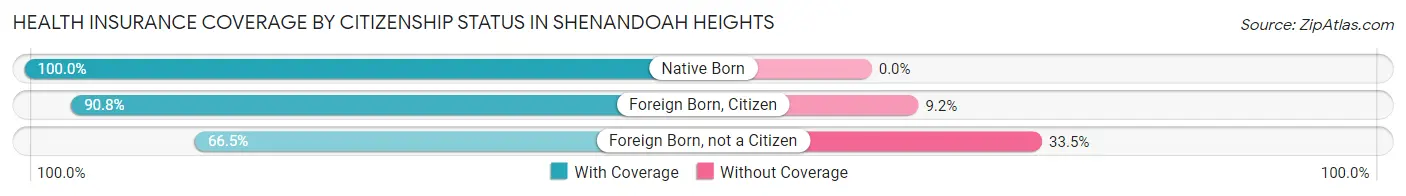
| Citizenship Status | With Coverage | Without Coverage |
| Native Born | 16 (100.0%) | 0 (0.0%) |
| Foreign Born, Citizen | 109 (90.8%) | 11 (9.2%) |
| Foreign Born, not a Citizen | 143 (66.5%) | 72 (33.5%) |
Health Insurance Coverage by Household Income in Shenandoah Heights
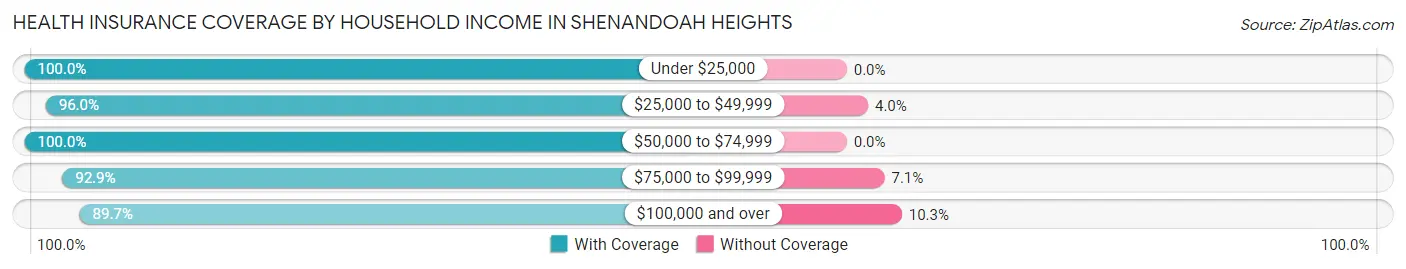
| Household Income | With Coverage | Without Coverage |
| Under $25,000 | 26 (100.0%) | 0 (0.0%) |
| $25,000 to $49,999 | 169 (96.0%) | 7 (4.0%) |
| $50,000 to $74,999 | 92 (100.0%) | 0 (0.0%) |
| $75,000 to $99,999 | 434 (92.9%) | 33 (7.1%) |
| $100,000 and over | 470 (89.7%) | 54 (10.3%) |
Public vs Private Health Insurance Coverage by Age in Shenandoah Heights
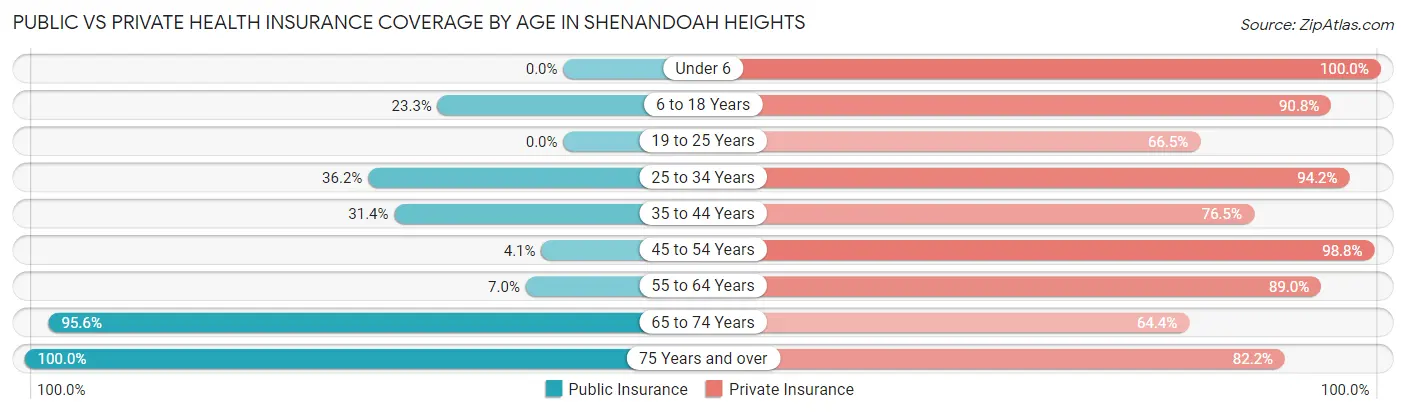
| Age Bracket | Public Insurance | Private Insurance |
| Under 6 | 0 (0.0%) | 16 (100.0%) |
| 6 to 18 Years | 28 (23.3%) | 109 (90.8%) |
| 19 to 25 Years | 0 (0.0%) | 143 (66.5%) |
| 25 to 34 Years | 25 (36.2%) | 65 (94.2%) |
| 35 to 44 Years | 48 (31.4%) | 117 (76.5%) |
| 45 to 54 Years | 14 (4.1%) | 339 (98.8%) |
| 55 to 64 Years | 12 (7.0%) | 153 (88.9%) |
| 65 to 74 Years | 86 (95.6%) | 58 (64.4%) |
| 75 Years and over | 107 (100.0%) | 88 (82.2%) |
| Total | 320 (24.9%) | 1,088 (84.7%) |
Disability Status by Sex by Age in Shenandoah Heights
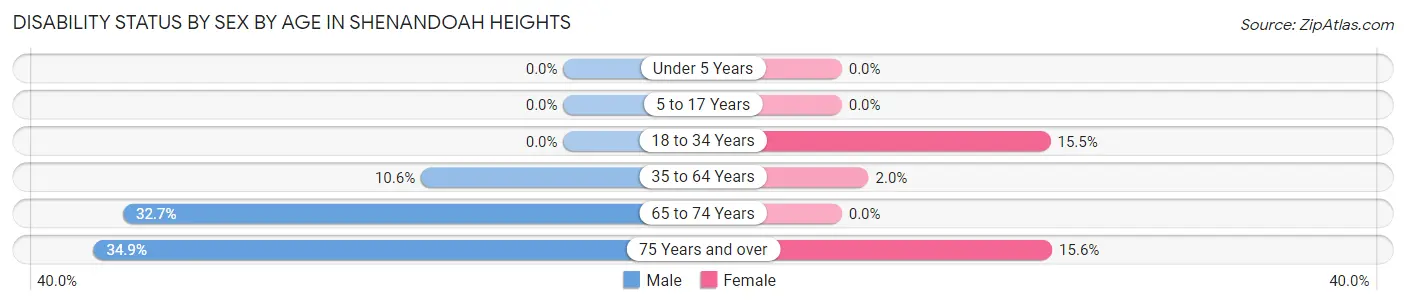
| Age Bracket | Male | Female |
| Under 5 Years | 0 (0.0%) | 0 (0.0%) |
| 5 to 17 Years | 0 (0.0%) | 0 (0.0%) |
| 18 to 34 Years | 0 (0.0%) | 20 (15.5%) |
| 35 to 64 Years | 28 (10.6%) | 8 (2.0%) |
| 65 to 74 Years | 17 (32.7%) | 0 (0.0%) |
| 75 Years and over | 15 (34.9%) | 10 (15.6%) |
Disability Class by Sex by Age in Shenandoah Heights
Disability Class: Hearing Difficulty
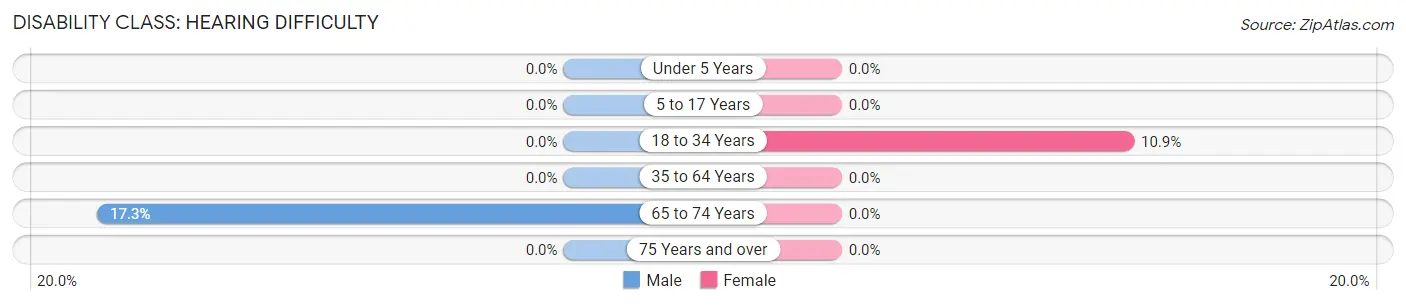
| Age Bracket | Male | Female |
| Under 5 Years | 0 (0.0%) | 0 (0.0%) |
| 5 to 17 Years | 0 (0.0%) | 0 (0.0%) |
| 18 to 34 Years | 0 (0.0%) | 14 (10.8%) |
| 35 to 64 Years | 0 (0.0%) | 0 (0.0%) |
| 65 to 74 Years | 9 (17.3%) | 0 (0.0%) |
| 75 Years and over | 0 (0.0%) | 0 (0.0%) |
Disability Class: Vision Difficulty
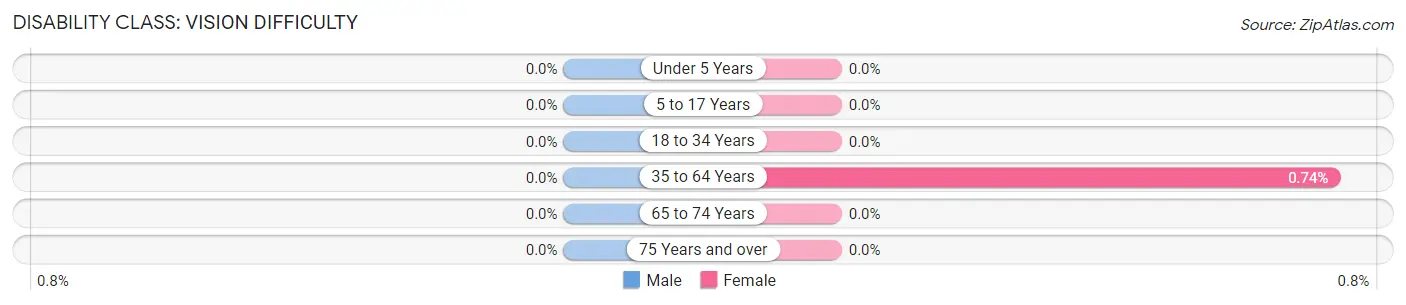
| Age Bracket | Male | Female |
| Under 5 Years | 0 (0.0%) | 0 (0.0%) |
| 5 to 17 Years | 0 (0.0%) | 0 (0.0%) |
| 18 to 34 Years | 0 (0.0%) | 0 (0.0%) |
| 35 to 64 Years | 0 (0.0%) | 3 (0.7%) |
| 65 to 74 Years | 0 (0.0%) | 0 (0.0%) |
| 75 Years and over | 0 (0.0%) | 0 (0.0%) |
Disability Class: Cognitive Difficulty
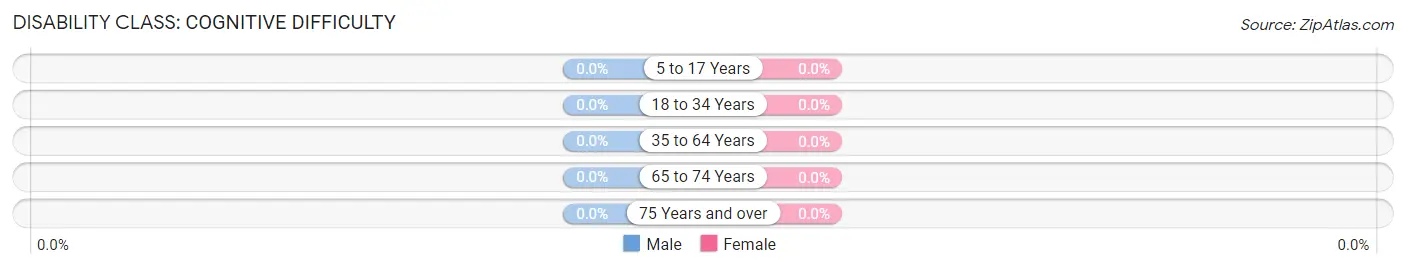
| Age Bracket | Male | Female |
| 5 to 17 Years | 0 (0.0%) | 0 (0.0%) |
| 18 to 34 Years | 0 (0.0%) | 0 (0.0%) |
| 35 to 64 Years | 0 (0.0%) | 0 (0.0%) |
| 65 to 74 Years | 0 (0.0%) | 0 (0.0%) |
| 75 Years and over | 0 (0.0%) | 0 (0.0%) |
Disability Class: Ambulatory Difficulty
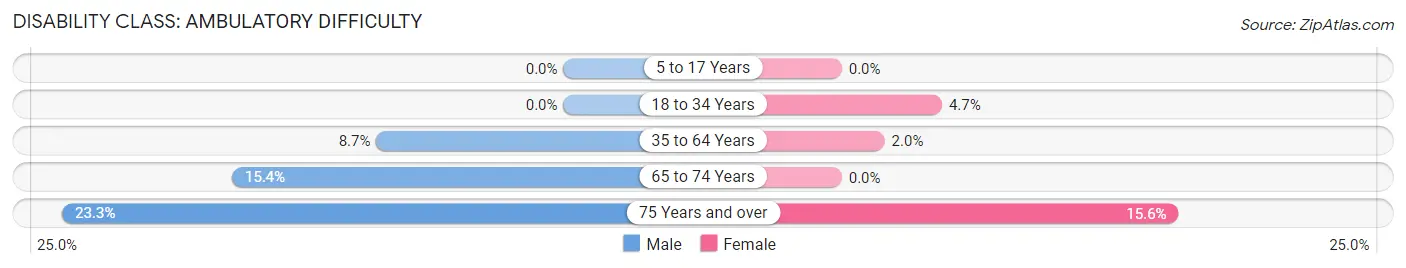
| Age Bracket | Male | Female |
| 5 to 17 Years | 0 (0.0%) | 0 (0.0%) |
| 18 to 34 Years | 0 (0.0%) | 6 (4.6%) |
| 35 to 64 Years | 23 (8.7%) | 8 (2.0%) |
| 65 to 74 Years | 8 (15.4%) | 0 (0.0%) |
| 75 Years and over | 10 (23.3%) | 10 (15.6%) |
Disability Class: Self-Care Difficulty
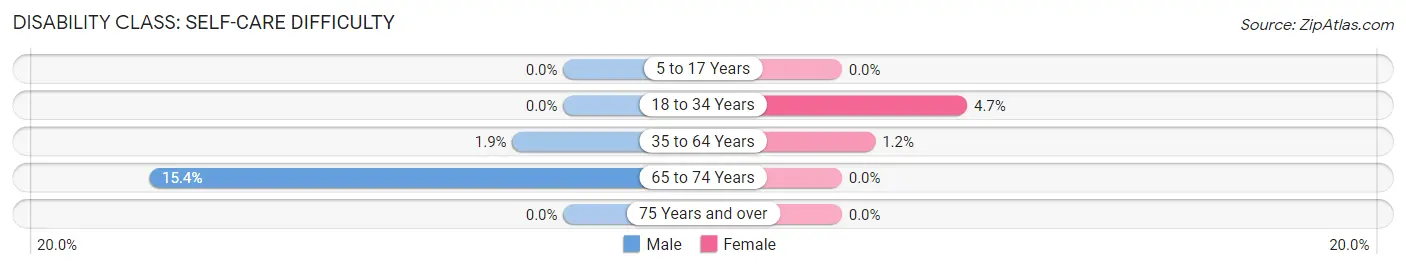
| Age Bracket | Male | Female |
| 5 to 17 Years | 0 (0.0%) | 0 (0.0%) |
| 18 to 34 Years | 0 (0.0%) | 6 (4.6%) |
| 35 to 64 Years | 5 (1.9%) | 5 (1.2%) |
| 65 to 74 Years | 8 (15.4%) | 0 (0.0%) |
| 75 Years and over | 0 (0.0%) | 0 (0.0%) |
Technology Access in Shenandoah Heights
Computing Device Access in Shenandoah Heights
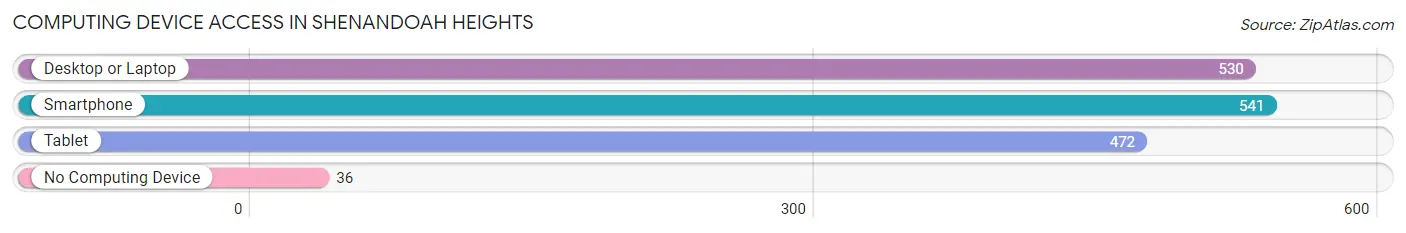
| Device Type | # Households | % Households |
| Desktop or Laptop | 530 | 87.0% |
| Smartphone | 541 | 88.8% |
| Tablet | 472 | 77.5% |
| No Computing Device | 36 | 5.9% |
| Total | 609 | 100.0% |
Internet Access in Shenandoah Heights
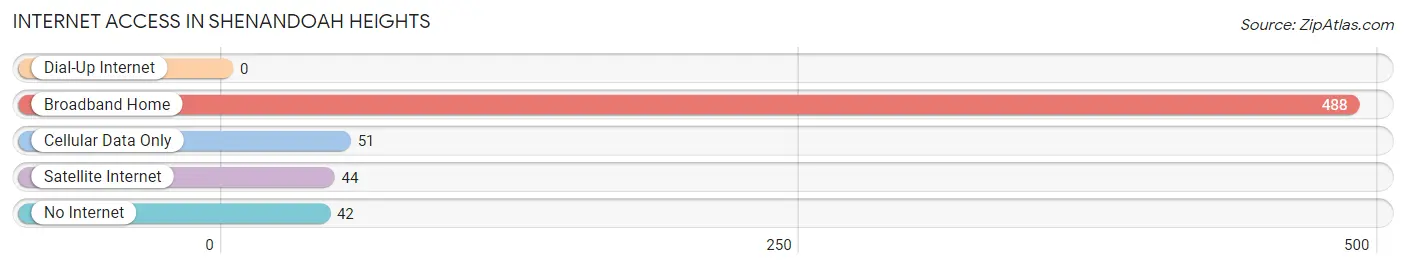
| Internet Type | # Households | % Households |
| Dial-Up Internet | 0 | 0.0% |
| Broadband Home | 488 | 80.1% |
| Cellular Data Only | 51 | 8.4% |
| Satellite Internet | 44 | 7.2% |
| No Internet | 42 | 6.9% |
| Total | 609 | 100.0% |
Shenandoah Heights Summary
Shenandoah Heights is a borough located in Schuylkill County, Pennsylvania. It is situated in the southern part of the state, approximately two miles north of the city of Pottsville. The population of Shenandoah Heights was 2,845 at the 2010 census.
History
Shenandoah Heights was founded in 1872 by the Shenandoah Coal Company. The company was formed by a group of investors from Philadelphia, who purchased a large tract of land in the area. The company built a railroad line to transport coal from the mines to the city of Pottsville. The town was named after the nearby Shenandoah Mountain, which was named after the Shenandoah River in Virginia.
The town grew rapidly in the late 19th century, as the coal industry flourished in the area. The town was incorporated as a borough in 1891. By the early 20th century, Shenandoah Heights had become a thriving community, with a population of over 5,000.
The coal industry declined in the mid-20th century, and the population of Shenandoah Heights began to decline. The population was 2,845 at the 2010 census.
Geography
Shenandoah Heights is located at 40°45'17" North, 76°14'17" West (40.754722, -76.238333). It is situated in the southern part of Schuylkill County, approximately two miles north of the city of Pottsville.
The borough is located in the Appalachian Mountains, and is surrounded by mountains on all sides. The highest point in the borough is Shenandoah Mountain, which has an elevation of 1,845 feet (562 m).
The borough has a total area of 1 2 square miles 3 1 km2 all of which is land
Economy
The economy of Shenandoah Heights is largely based on the coal industry. The town is home to several coal mines, and the coal industry is the main source of employment in the area.
In addition to the coal industry, Shenandoah Heights is home to several small businesses, including restaurants, retail stores, and service providers. The town is also home to a number of manufacturing companies, including a paper mill and a steel mill.
Demographics
As of the 2010 census, the population of Shenandoah Heights was 2,845. The racial makeup of the borough was 97.3% White, 0.7% African American, 0.2% Native American, 0.3% Asian, 0.1% from other races, and 1.4% from two or more races. Hispanic or Latino of any race were 0.7% of the population.
The median income for a household in the borough was $37,917, and the median income for a family was $45,625. Males had a median income of $35,000 versus $25,000 for females. The per capita income for the borough was $17,845. About 8.3% of families and 10.2% of the population were below the poverty line, including 14.2% of those under age 18 and 8.2% of those age 65 or over.
Common Questions
What is Per Capita Income in Shenandoah Heights?
Per Capita income in Shenandoah Heights is $39,263.
What is the Median Family Income in Shenandoah Heights?
Median Family Income in Shenandoah Heights is $82,684.
What is the Median Household income in Shenandoah Heights?
Median Household Income in Shenandoah Heights is $83,566.
What is Income or Wage Gap in Shenandoah Heights?
Income or Wage Gap in Shenandoah Heights is 7.4%.
Women in Shenandoah Heights earn 92.6 cents for every dollar earned by a man.
What is Inequality or Gini Index in Shenandoah Heights?
Inequality or Gini Index in Shenandoah Heights is 0.23.
What is the Total Population of Shenandoah Heights?
Total Population of Shenandoah Heights is 1,383.
What is the Total Male Population of Shenandoah Heights?
Total Male Population of Shenandoah Heights is 646.
What is the Total Female Population of Shenandoah Heights?
Total Female Population of Shenandoah Heights is 737.
What is the Ratio of Males per 100 Females in Shenandoah Heights?
There are 87.65 Males per 100 Females in Shenandoah Heights.
What is the Ratio of Females per 100 Males in Shenandoah Heights?
There are 114.09 Females per 100 Males in Shenandoah Heights.
What is the Median Population Age in Shenandoah Heights?
Median Population Age in Shenandoah Heights is 49.2 Years.
What is the Average Family Size in Shenandoah Heights
Average Family Size in Shenandoah Heights is 2.2 People.
What is the Average Household Size in Shenandoah Heights
Average Household Size in Shenandoah Heights is 2.1 People.
How Large is the Labor Force in Shenandoah Heights?
There are 918 People in the Labor Forcein in Shenandoah Heights.
What is the Percentage of People in the Labor Force in Shenandoah Heights?
71.5% of People are in the Labor Force in Shenandoah Heights.
What is the Unemployment Rate in Shenandoah Heights?
Unemployment Rate in Shenandoah Heights is 10.0%.