Mount Carmel borough, PA Map & Demographics
Mount Carmel borough Overview
$24,233
PER CAPITA INCOME
$58,655
AVG FAMILY INCOME
$46,375
AVG HOUSEHOLD INCOME
33.4%
WAGE / INCOME GAP [ % ]
66.6¢/ $1
WAGE / INCOME GAP [ $ ]
$11,284
FAMILY INCOME DEFICIT
0.41
INEQUALITY / GINI INDEX
5,723
TOTAL POPULATION
2,931
MALE POPULATION
2,792
FEMALE POPULATION
104.98
MALES / 100 FEMALES
95.26
FEMALES / 100 MALES
42.9
MEDIAN AGE
3.0
AVG FAMILY SIZE
2.4
AVG HOUSEHOLD SIZE
2,388
LABOR FORCE [ PEOPLE ]
49.2%
PERCENT IN LABOR FORCE
7.1%
UNEMPLOYMENT RATE
Income in Mount Carmel borough
Income Overview in Mount Carmel borough
Per Capita Income in Mount Carmel borough is $24,233, while median incomes of families and households are $58,655 and $46,375 respectively.
| Characteristic | Number | Measure |
| Per Capita Income | 5,723 | $24,233 |
| Median Family Income | 1,501 | $58,655 |
| Mean Family Income | 1,501 | $67,607 |
| Median Household Income | 2,438 | $46,375 |
| Mean Household Income | 2,438 | $55,129 |
| Income Deficit | 1,501 | $11,284 |
| Wage / Income Gap (%) | 5,723 | 33.40% |
| Wage / Income Gap ($) | 5,723 | 66.60¢ per $1 |
| Gini / Inequality Index | 5,723 | 0.41 |
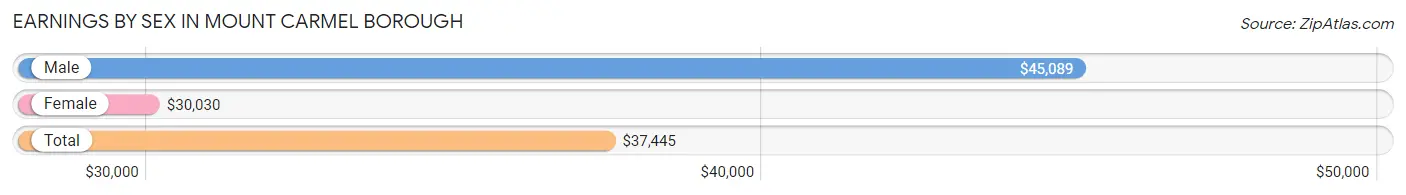
Earnings by Sex in Mount Carmel borough
Average Earnings in Mount Carmel borough are $37,445, $45,089 for men and $30,030 for women, a difference of 33.4%.
| Sex | Number | Average Earnings |
| Male | 1,424 (55.9%) | $45,089 |
| Female | 1,121 (44.1%) | $30,030 |
| Total | 2,545 (100.0%) | $37,445 |
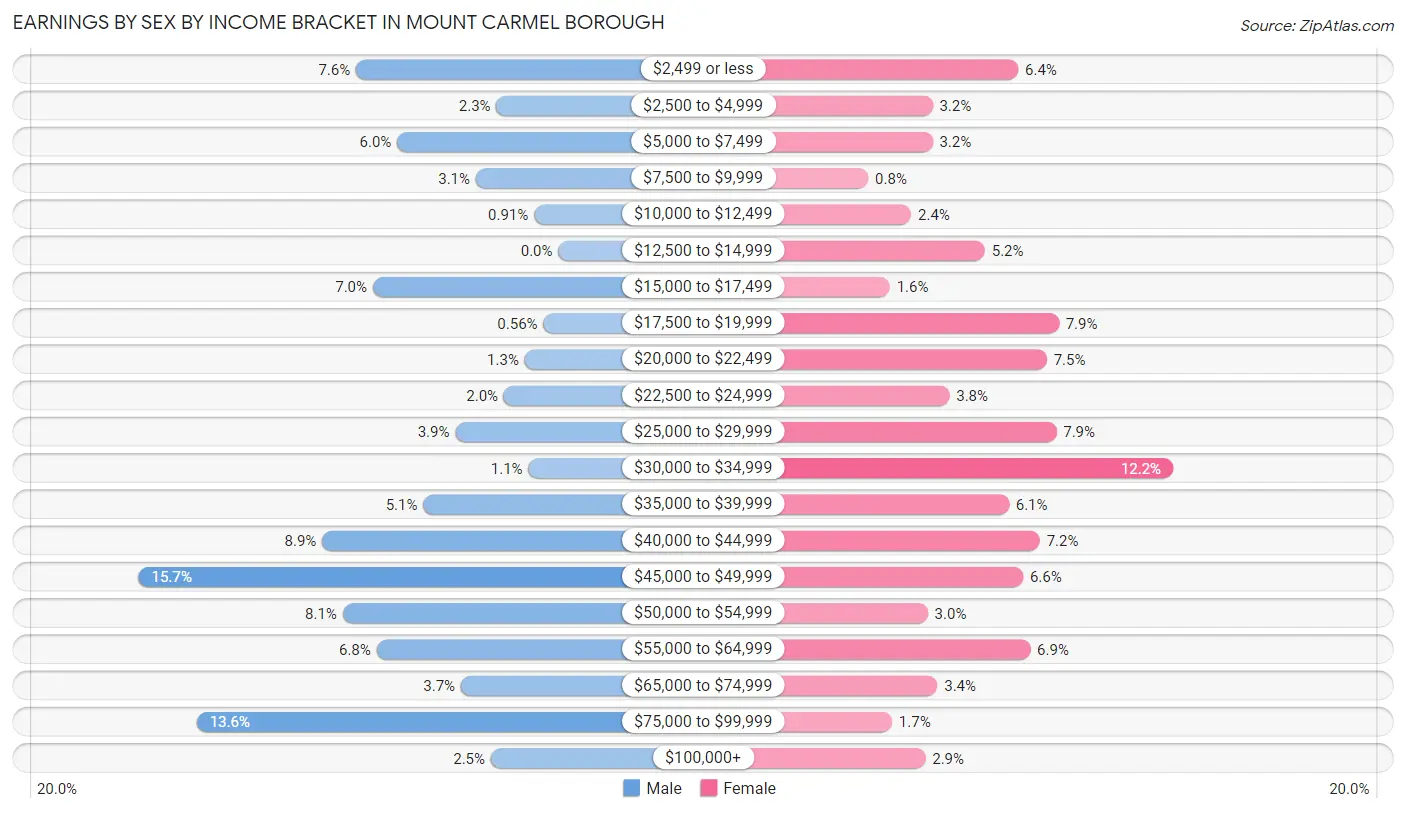
Earnings by Sex by Income Bracket in Mount Carmel borough
The most common earnings brackets in Mount Carmel borough are $45,000 to $49,999 for men (224 | 15.7%) and $30,000 to $34,999 for women (137 | 12.2%).
| Income | Male | Female |
| $2,499 or less | 108 (7.6%) | 72 (6.4%) |
| $2,500 to $4,999 | 33 (2.3%) | 36 (3.2%) |
| $5,000 to $7,499 | 86 (6.0%) | 36 (3.2%) |
| $7,500 to $9,999 | 44 (3.1%) | 9 (0.8%) |
| $10,000 to $12,499 | 13 (0.9%) | 27 (2.4%) |
| $12,500 to $14,999 | 0 (0.0%) | 58 (5.2%) |
| $15,000 to $17,499 | 99 (7.0%) | 18 (1.6%) |
| $17,500 to $19,999 | 8 (0.6%) | 89 (7.9%) |
| $20,000 to $22,499 | 18 (1.3%) | 84 (7.5%) |
| $22,500 to $24,999 | 29 (2.0%) | 43 (3.8%) |
| $25,000 to $29,999 | 55 (3.9%) | 88 (7.9%) |
| $30,000 to $34,999 | 16 (1.1%) | 137 (12.2%) |
| $35,000 to $39,999 | 72 (5.1%) | 68 (6.1%) |
| $40,000 to $44,999 | 126 (8.8%) | 81 (7.2%) |
| $45,000 to $49,999 | 224 (15.7%) | 74 (6.6%) |
| $50,000 to $54,999 | 115 (8.1%) | 34 (3.0%) |
| $55,000 to $64,999 | 97 (6.8%) | 77 (6.9%) |
| $65,000 to $74,999 | 52 (3.6%) | 38 (3.4%) |
| $75,000 to $99,999 | 193 (13.6%) | 19 (1.7%) |
| $100,000+ | 36 (2.5%) | 33 (2.9%) |
| Total | 1,424 (100.0%) | 1,121 (100.0%) |
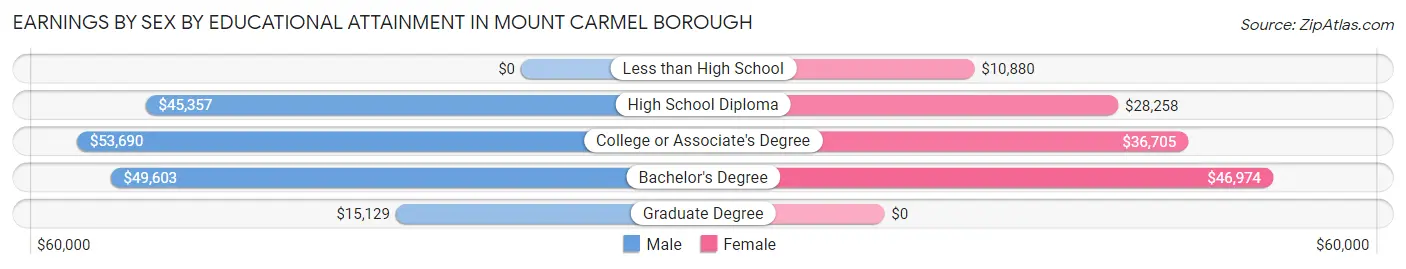
Earnings by Sex by Educational Attainment in Mount Carmel borough
Average earnings in Mount Carmel borough are $46,182 for men and $32,706 for women, a difference of 29.2%. Men with an educational attainment of college or associate's degree enjoy the highest average annual earnings of $53,690, while those with graduate degree education earn the least with $15,129. Women with an educational attainment of bachelor's degree earn the most with the average annual earnings of $46,974, while those with less than high school education have the smallest earnings of $10,880.
| Educational Attainment | Male Income | Female Income |
| Less than High School | - | - |
| High School Diploma | $45,357 | $28,258 |
| College or Associate's Degree | $53,690 | $36,705 |
| Bachelor's Degree | $49,603 | $46,974 |
| Graduate Degree | $15,129 | $0 |
| Total | $46,182 | $32,706 |
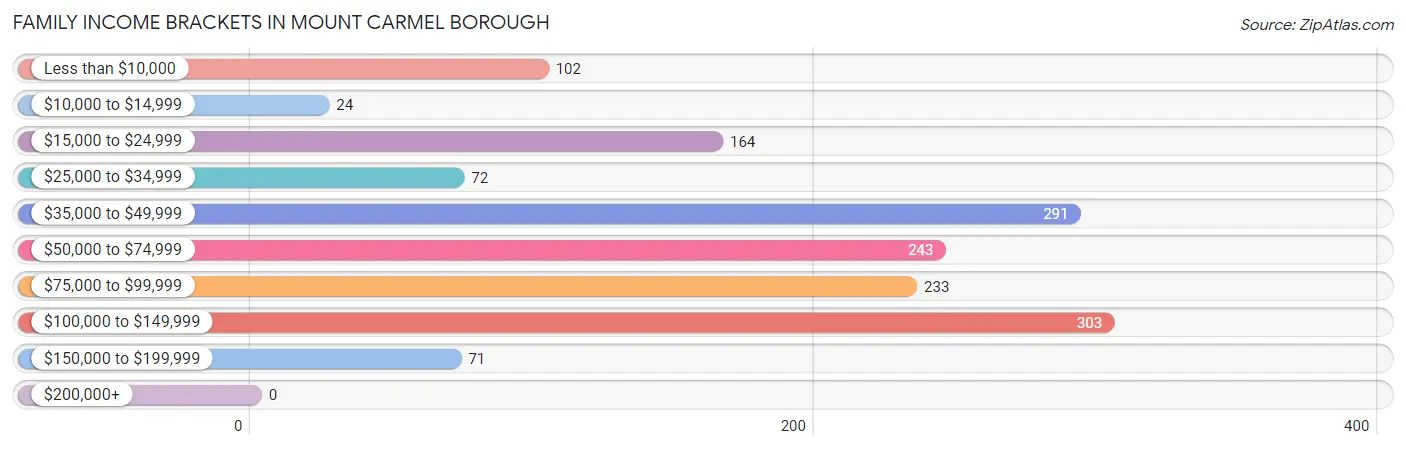
Family Income in Mount Carmel borough
Family Income Brackets in Mount Carmel borough
According to the Mount Carmel borough family income data, there are 303 families falling into the $100,000 to $149,999 income range, which is the most common income bracket and makes up 20.2% of all families.
| Income Bracket | # Families | % Families |
| Less than $10,000 | 102 | 6.8% |
| $10,000 to $14,999 | 24 | 1.6% |
| $15,000 to $24,999 | 164 | 10.9% |
| $25,000 to $34,999 | 72 | 4.8% |
| $35,000 to $49,999 | 291 | 19.4% |
| $50,000 to $74,999 | 243 | 16.2% |
| $75,000 to $99,999 | 233 | 15.5% |
| $100,000 to $149,999 | 303 | 20.2% |
| $150,000 to $199,999 | 71 | 4.7% |
| $200,000+ | 0 | 0.0% |
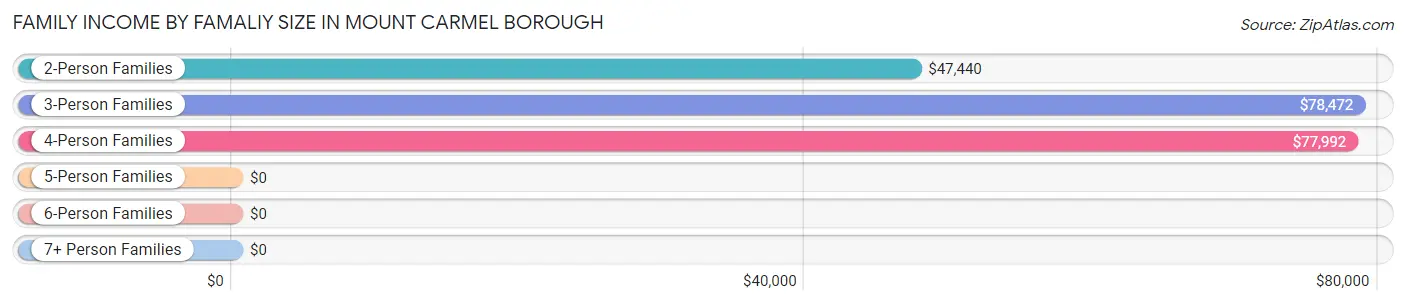
Family Income by Famaliy Size in Mount Carmel borough
3-person families (283 | 18.9%) account for the highest median family income in Mount Carmel borough with $78,472 per family, while 3-person families (283 | 18.9%) have the highest median income of $26,157 per family member.
| Income Bracket | # Families | Median Income |
| 2-Person Families | 779 (51.9%) | $47,440 |
| 3-Person Families | 283 (18.9%) | $78,472 |
| 4-Person Families | 253 (16.9%) | $77,992 |
| 5-Person Families | 124 (8.3%) | $0 |
| 6-Person Families | 62 (4.1%) | $0 |
| 7+ Person Families | 0 (0.0%) | $0 |
| Total | 1,501 (100.0%) | $58,655 |
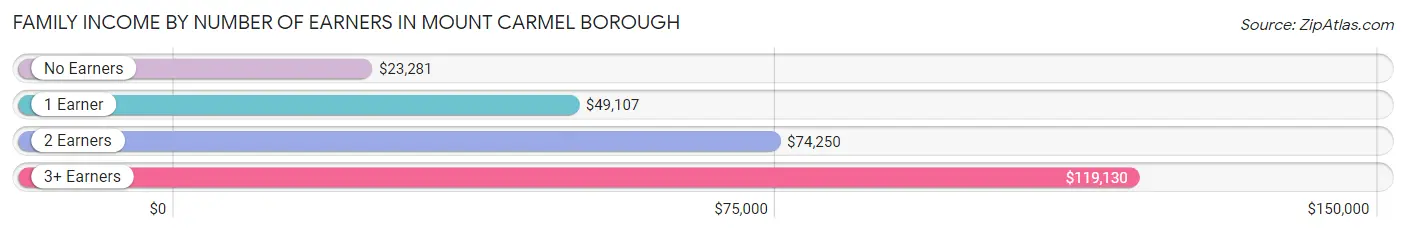
Family Income by Number of Earners in Mount Carmel borough
The median family income in Mount Carmel borough is $58,655, with families comprising 3+ earners (162) having the highest median family income of $119,130, while families with no earners (359) have the lowest median family income of $23,281, accounting for 10.8% and 23.9% of families, respectively.
| Number of Earners | # Families | Median Income |
| No Earners | 359 (23.9%) | $23,281 |
| 1 Earner | 504 (33.6%) | $49,107 |
| 2 Earners | 476 (31.7%) | $74,250 |
| 3+ Earners | 162 (10.8%) | $119,130 |
| Total | 1,501 (100.0%) | $58,655 |
Household Income in Mount Carmel borough
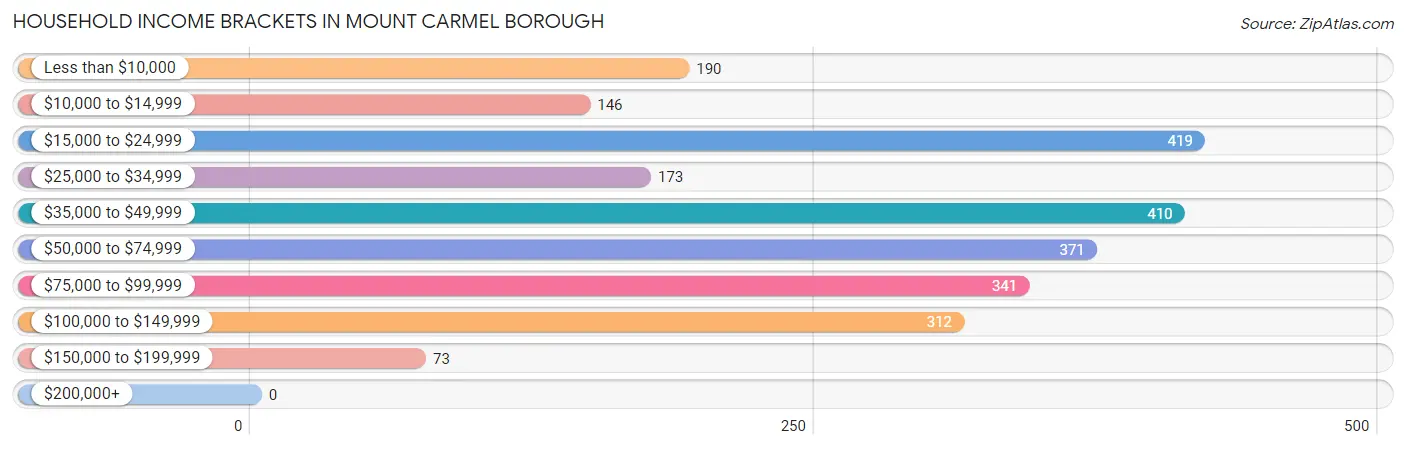
Household Income Brackets in Mount Carmel borough
With 419 households falling in the category, the $15,000 to $24,999 income range is the most frequent in Mount Carmel borough, accounting for 17.2% of all households.
| Income Bracket | # Households | % Households |
| Less than $10,000 | 190 | 7.8% |
| $10,000 to $14,999 | 146 | 6.0% |
| $15,000 to $24,999 | 419 | 17.2% |
| $25,000 to $34,999 | 173 | 7.1% |
| $35,000 to $49,999 | 410 | 16.8% |
| $50,000 to $74,999 | 371 | 15.2% |
| $75,000 to $99,999 | 341 | 14.0% |
| $100,000 to $149,999 | 312 | 12.8% |
| $150,000 to $199,999 | 73 | 3.0% |
| $200,000+ | 0 | 0.0% |
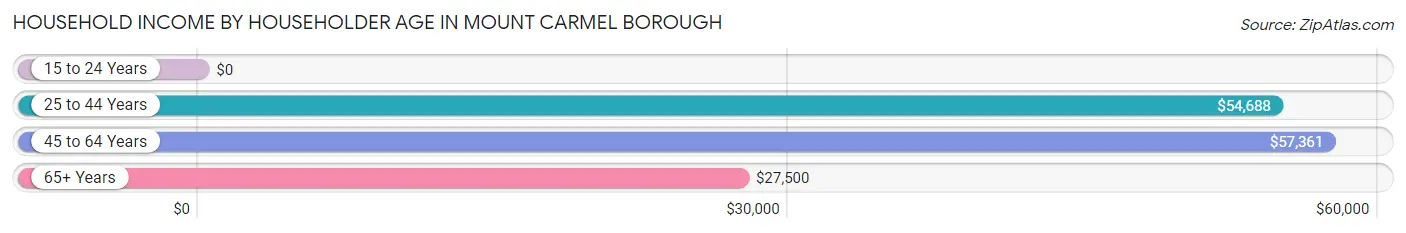
Household Income by Householder Age in Mount Carmel borough
The median household income in Mount Carmel borough is $46,375, with the highest median household income of $57,361 found in the 45 to 64 years age bracket for the primary householder. A total of 869 households (35.6%) fall into this category. Meanwhile, the 15 to 24 years age bracket for the primary householder has the lowest median household income of $0, with 58 households (2.4%) in this group.
| Income Bracket | # Households | Median Income |
| 15 to 24 Years | 58 (2.4%) | $0 |
| 25 to 44 Years | 665 (27.3%) | $54,688 |
| 45 to 64 Years | 869 (35.6%) | $57,361 |
| 65+ Years | 846 (34.7%) | $27,500 |
| Total | 2,438 (100.0%) | $46,375 |
Poverty in Mount Carmel borough
Income Below Poverty by Sex and Age in Mount Carmel borough
With 14.2% poverty level for males and 21.8% for females among the residents of Mount Carmel borough, under 5 year old males and 12 to 14 year old females are the most vulnerable to poverty, with 95 males (42.6%) and 30 females (62.5%) in their respective age groups living below the poverty level.
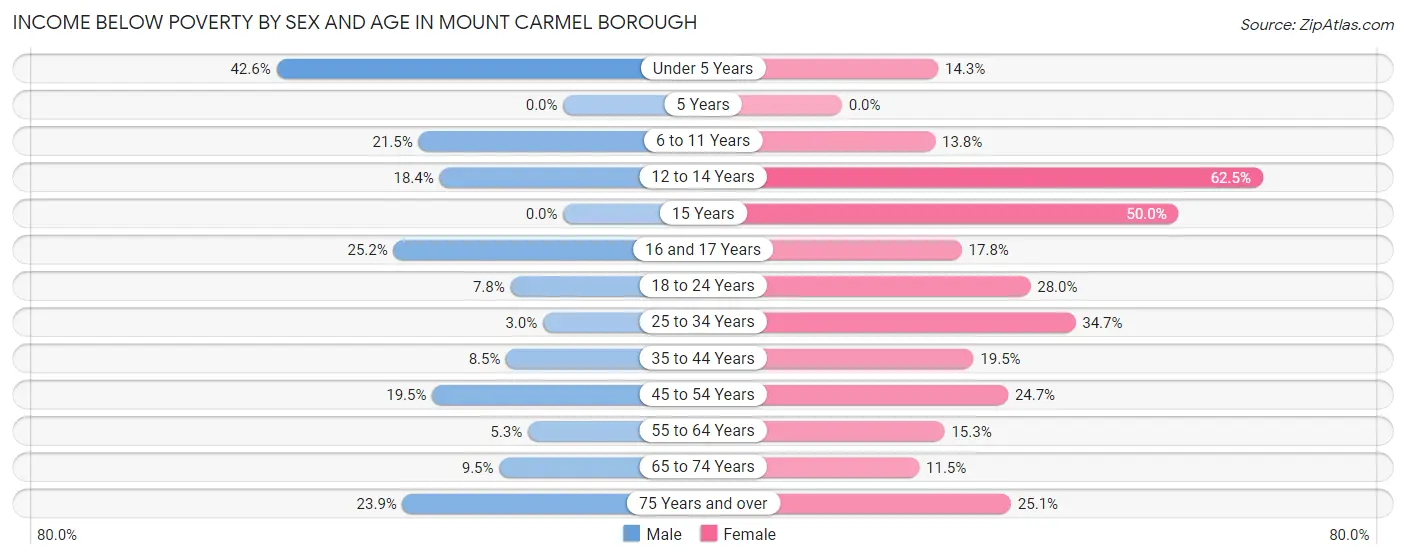
| Age Bracket | Male | Female |
| Under 5 Years | 95 (42.6%) | 8 (14.3%) |
| 5 Years | 0 (0.0%) | 0 (0.0%) |
| 6 to 11 Years | 46 (21.5%) | 22 (13.8%) |
| 12 to 14 Years | 16 (18.4%) | 30 (62.5%) |
| 15 Years | 0 (0.0%) | 11 (50.0%) |
| 16 and 17 Years | 30 (25.2%) | 21 (17.8%) |
| 18 to 24 Years | 12 (7.8%) | 82 (28.0%) |
| 25 to 34 Years | 11 (3.0%) | 121 (34.7%) |
| 35 to 44 Years | 41 (8.5%) | 68 (19.5%) |
| 45 to 54 Years | 58 (19.5%) | 74 (24.7%) |
| 55 to 64 Years | 20 (5.2%) | 70 (15.2%) |
| 65 to 74 Years | 38 (9.5%) | 42 (11.5%) |
| 75 Years and over | 47 (23.9%) | 56 (25.1%) |
| Total | 414 (14.2%) | 605 (21.8%) |
Income Above Poverty by Sex and Age in Mount Carmel borough
According to the poverty statistics in Mount Carmel borough, males aged 5 years and females aged 5 years are the age groups that are most secure financially, with 100.0% of males and 100.0% of females in these age groups living above the poverty line.

| Age Bracket | Male | Female |
| Under 5 Years | 128 (57.4%) | 48 (85.7%) |
| 5 Years | 1 (100.0%) | 36 (100.0%) |
| 6 to 11 Years | 168 (78.5%) | 137 (86.2%) |
| 12 to 14 Years | 71 (81.6%) | 18 (37.5%) |
| 15 Years | 0 (0.0%) | 11 (50.0%) |
| 16 and 17 Years | 89 (74.8%) | 97 (82.2%) |
| 18 to 24 Years | 141 (92.2%) | 211 (72.0%) |
| 25 to 34 Years | 354 (97.0%) | 228 (65.3%) |
| 35 to 44 Years | 443 (91.5%) | 280 (80.5%) |
| 45 to 54 Years | 240 (80.5%) | 226 (75.3%) |
| 55 to 64 Years | 361 (94.8%) | 389 (84.8%) |
| 65 to 74 Years | 362 (90.5%) | 324 (88.5%) |
| 75 Years and over | 150 (76.1%) | 167 (74.9%) |
| Total | 2,508 (85.8%) | 2,172 (78.2%) |
Income Below Poverty Among Married-Couple Families in Mount Carmel borough
The poverty statistics for married-couple families in Mount Carmel borough show that 4.6% or 45 of the total 971 families live below the poverty line. Families with no children have the highest poverty rate of 6.5%, comprising of 45 families. On the other hand, families with 1 or 2 children have the lowest poverty rate of 0.0%, which includes 0 families.
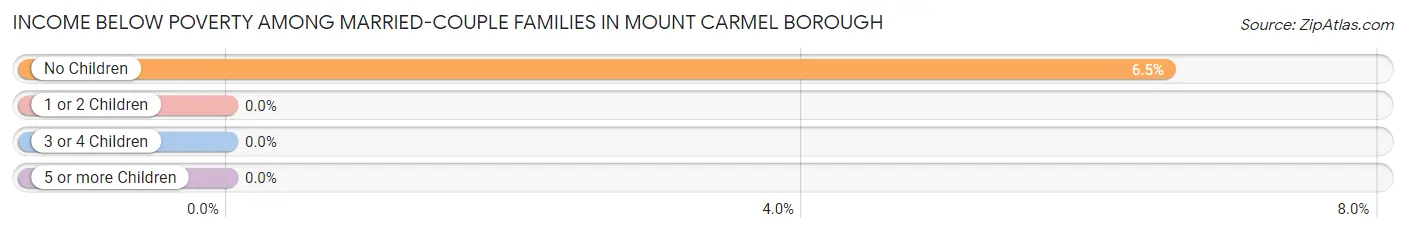
| Children | Above Poverty | Below Poverty |
| No Children | 644 (93.5%) | 45 (6.5%) |
| 1 or 2 Children | 224 (100.0%) | 0 (0.0%) |
| 3 or 4 Children | 58 (100.0%) | 0 (0.0%) |
| 5 or more Children | 0 (0.0%) | 0 (0.0%) |
| Total | 926 (95.4%) | 45 (4.6%) |
Income Below Poverty Among Single-Parent Households in Mount Carmel borough

| Children | Single Father | Single Mother |
| No Children | 0 (0.0%) | 34 (41.5%) |
| 1 or 2 Children | 0 (0.0%) | 95 (47.0%) |
| 3 or 4 Children | 0 (0.0%) | 34 (100.0%) |
| 5 or more Children | 0 (0.0%) | 24 (92.3%) |
| Total | 0 (0.0%) | 187 (54.4%) |
Income Below Poverty Among Married-Couple vs Single-Parent Households in Mount Carmel borough
The poverty data for Mount Carmel borough shows that 45 of the married-couple family households (4.6%) and 187 of the single-parent households (35.3%) are living below the poverty level. Within the married-couple family households, those with no children have the highest poverty rate, with 45 households (6.5%) falling below the poverty line. Among the single-parent households, those with 3 or 4 children have the highest poverty rate, with 34 household (100.0%) living below poverty.
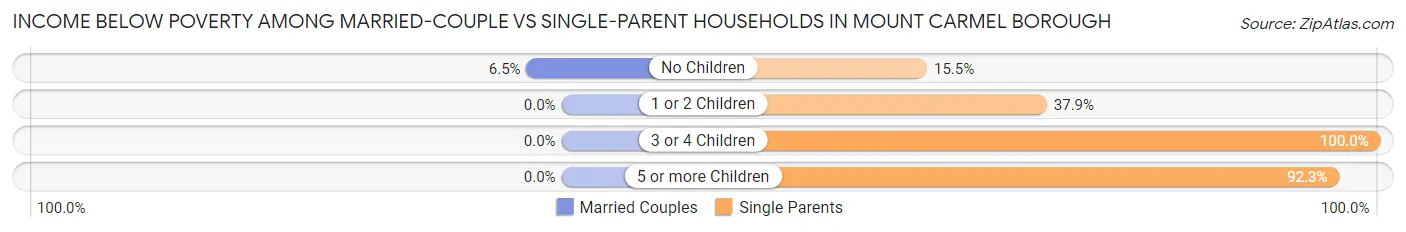
| Children | Married-Couple Families | Single-Parent Households |
| No Children | 45 (6.5%) | 34 (15.5%) |
| 1 or 2 Children | 0 (0.0%) | 95 (37.9%) |
| 3 or 4 Children | 0 (0.0%) | 34 (100.0%) |
| 5 or more Children | 0 (0.0%) | 24 (92.3%) |
| Total | 45 (4.6%) | 187 (35.3%) |
Race in Mount Carmel borough
The most populous races in Mount Carmel borough are White / Caucasian (5,271 | 92.1%), Two or more Races (275 | 4.8%), and Hispanic or Latino (240 | 4.2%).
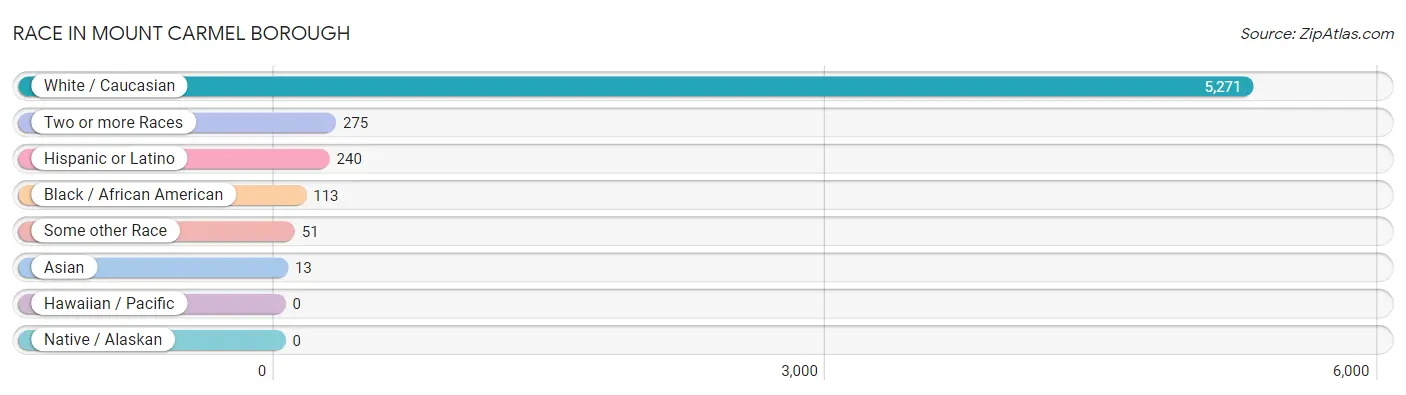
| Race | # Population | % Population |
| Asian | 13 | 0.2% |
| Black / African American | 113 | 2.0% |
| Hawaiian / Pacific | 0 | 0.0% |
| Hispanic or Latino | 240 | 4.2% |
| Native / Alaskan | 0 | 0.0% |
| White / Caucasian | 5,271 | 92.1% |
| Two or more Races | 275 | 4.8% |
| Some other Race | 51 | 0.9% |
| Total | 5,723 | 100.0% |
Ancestry in Mount Carmel borough
The most populous ancestries reported in Mount Carmel borough are German (1,244 | 21.7%), Polish (1,146 | 20.0%), Irish (1,030 | 18.0%), Italian (594 | 10.4%), and English (364 | 6.4%), together accounting for 76.5% of all Mount Carmel borough residents.
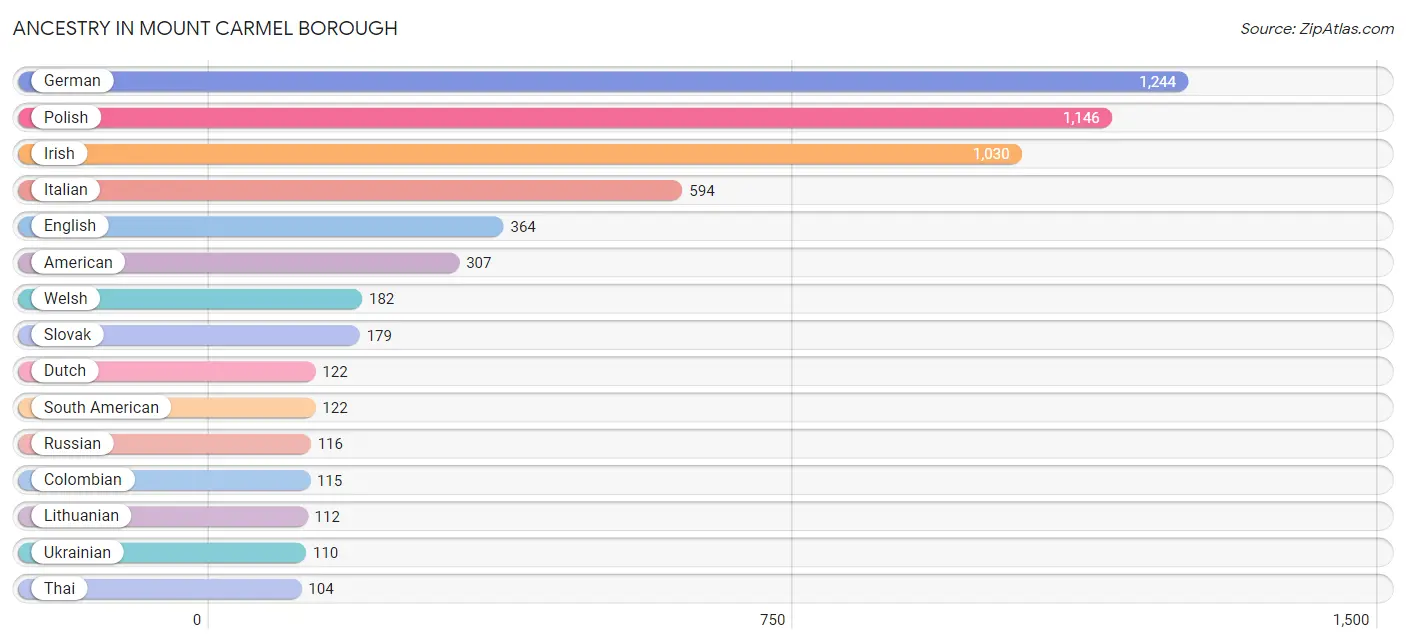
| Ancestry | # Population | % Population |
| American | 307 | 5.4% |
| Austrian | 46 | 0.8% |
| Belgian | 72 | 1.3% |
| Bhutanese | 7 | 0.1% |
| British | 101 | 1.8% |
| Colombian | 115 | 2.0% |
| Czech | 22 | 0.4% |
| Czechoslovakian | 8 | 0.1% |
| Dominican | 66 | 1.1% |
| Dutch | 122 | 2.1% |
| Eastern European | 9 | 0.2% |
| English | 364 | 6.4% |
| French | 68 | 1.2% |
| German | 1,244 | 21.7% |
| Greek | 10 | 0.2% |
| Hungarian | 9 | 0.2% |
| Irish | 1,030 | 18.0% |
| Italian | 594 | 10.4% |
| Lithuanian | 112 | 2.0% |
| Mexican | 21 | 0.4% |
| Pennsylvania German | 57 | 1.0% |
| Peruvian | 7 | 0.1% |
| Polish | 1,146 | 20.0% |
| Portuguese | 19 | 0.3% |
| Puerto Rican | 31 | 0.5% |
| Russian | 116 | 2.0% |
| Samoan | 3 | 0.1% |
| Scottish | 66 | 1.1% |
| Slavic | 76 | 1.3% |
| Slovak | 179 | 3.1% |
| Slovene | 8 | 0.1% |
| South American | 122 | 2.1% |
| Swedish | 10 | 0.2% |
| Thai | 104 | 1.8% |
| Ukrainian | 110 | 1.9% |
| Welsh | 182 | 3.2% | View All 36 Rows |
Immigrants in Mount Carmel borough
The most numerous immigrant groups reported in Mount Carmel borough came from Latin America (131 | 2.3%), South America (80 | 1.4%), Argentina (73 | 1.3%), Caribbean (51 | 0.9%), and Dominican Republic (51 | 0.9%), together accounting for 6.8% of all Mount Carmel borough residents.
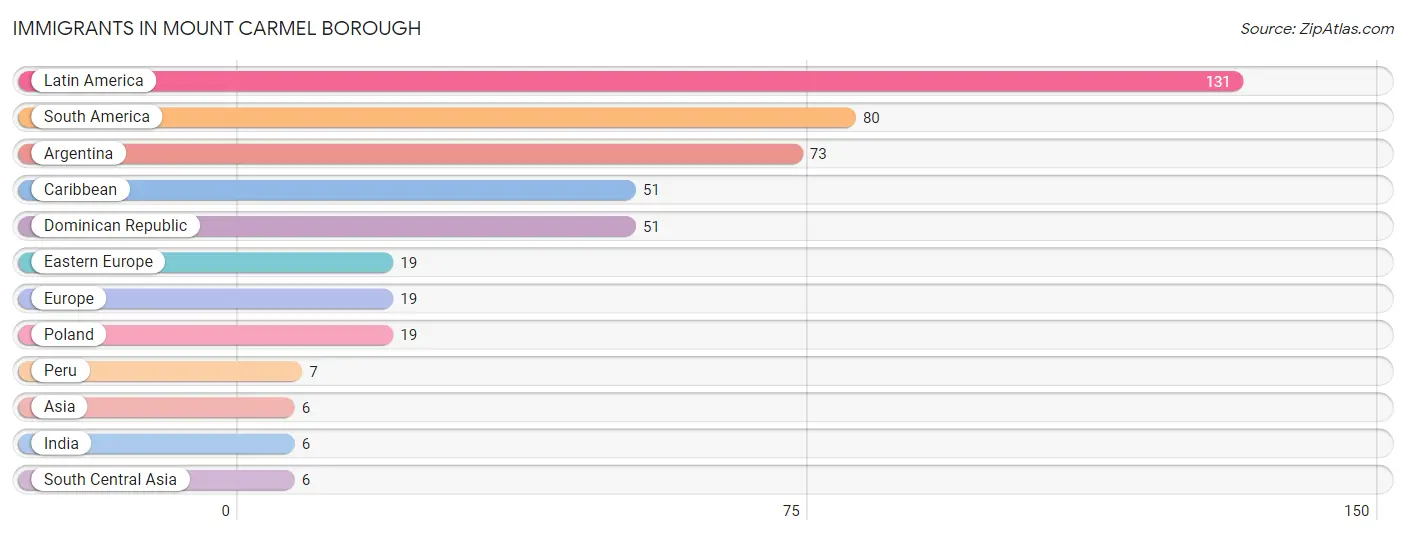
| Immigration Origin | # Population | % Population |
| Argentina | 73 | 1.3% |
| Asia | 6 | 0.1% |
| Caribbean | 51 | 0.9% |
| Dominican Republic | 51 | 0.9% |
| Eastern Europe | 19 | 0.3% |
| Europe | 19 | 0.3% |
| India | 6 | 0.1% |
| Latin America | 131 | 2.3% |
| Peru | 7 | 0.1% |
| Poland | 19 | 0.3% |
| South America | 80 | 1.4% |
| South Central Asia | 6 | 0.1% | View All 12 Rows |
Sex and Age in Mount Carmel borough
Sex and Age in Mount Carmel borough
The most populous age groups in Mount Carmel borough are 65 to 69 Years (282 | 9.6%) for men and 15 to 19 Years (288 | 10.3%) for women.
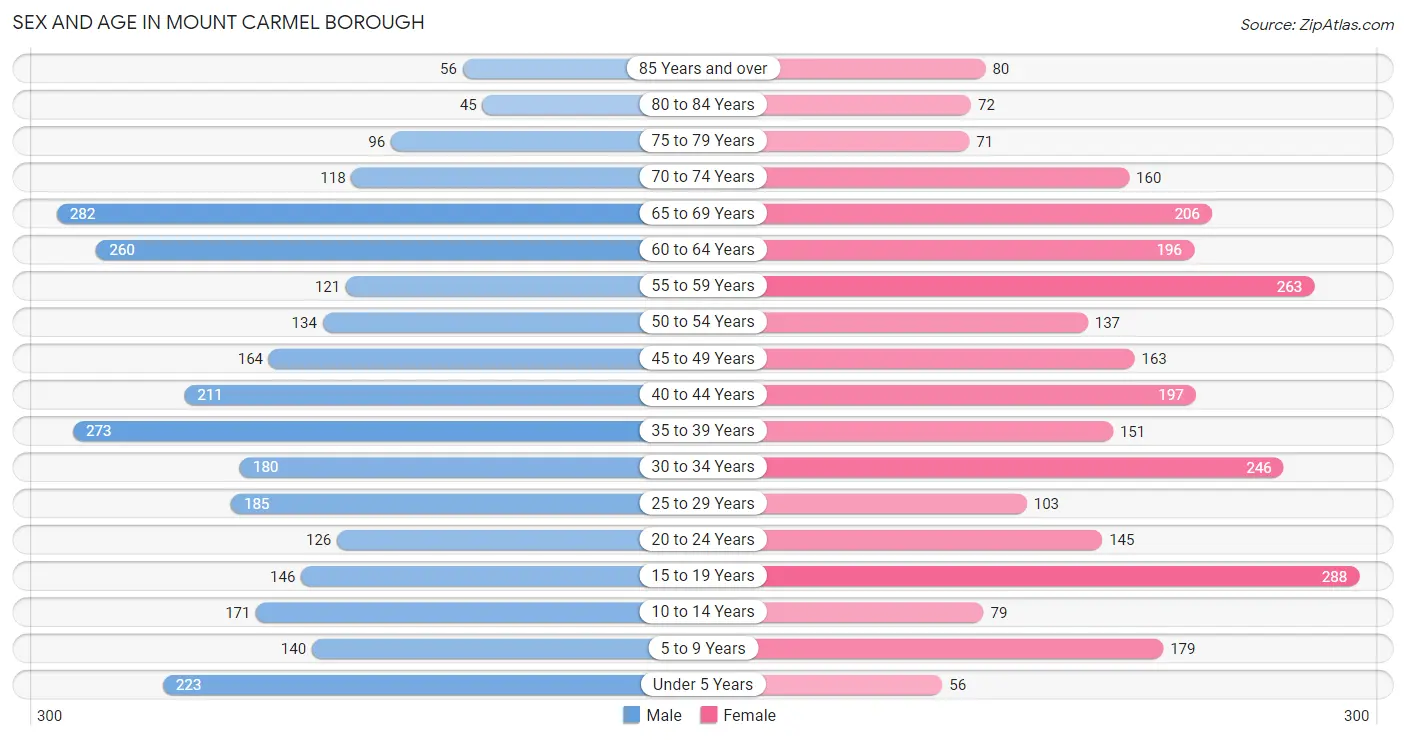
| Age Bracket | Male | Female |
| Under 5 Years | 223 (7.6%) | 56 (2.0%) |
| 5 to 9 Years | 140 (4.8%) | 179 (6.4%) |
| 10 to 14 Years | 171 (5.8%) | 79 (2.8%) |
| 15 to 19 Years | 146 (5.0%) | 288 (10.3%) |
| 20 to 24 Years | 126 (4.3%) | 145 (5.2%) |
| 25 to 29 Years | 185 (6.3%) | 103 (3.7%) |
| 30 to 34 Years | 180 (6.1%) | 246 (8.8%) |
| 35 to 39 Years | 273 (9.3%) | 151 (5.4%) |
| 40 to 44 Years | 211 (7.2%) | 197 (7.1%) |
| 45 to 49 Years | 164 (5.6%) | 163 (5.8%) |
| 50 to 54 Years | 134 (4.6%) | 137 (4.9%) |
| 55 to 59 Years | 121 (4.1%) | 263 (9.4%) |
| 60 to 64 Years | 260 (8.9%) | 196 (7.0%) |
| 65 to 69 Years | 282 (9.6%) | 206 (7.4%) |
| 70 to 74 Years | 118 (4.0%) | 160 (5.7%) |
| 75 to 79 Years | 96 (3.3%) | 71 (2.5%) |
| 80 to 84 Years | 45 (1.5%) | 72 (2.6%) |
| 85 Years and over | 56 (1.9%) | 80 (2.9%) |
| Total | 2,931 (100.0%) | 2,792 (100.0%) |
Families and Households in Mount Carmel borough
Median Family Size in Mount Carmel borough
The median family size in Mount Carmel borough is 2.95 persons per family, with married-couple families (971 | 64.7%) accounting for the largest median family size of 3.03 persons per family. On the other hand, single male/father families (186 | 12.4%) represent the smallest median family size with 2.45 persons per family.
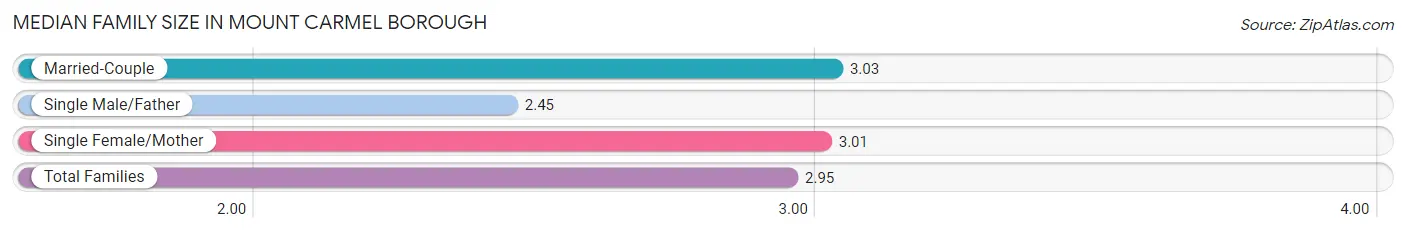
| Family Type | # Families | Family Size |
| Married-Couple | 971 (64.7%) | 3.03 |
| Single Male/Father | 186 (12.4%) | 2.45 |
| Single Female/Mother | 344 (22.9%) | 3.01 |
| Total Families | 1,501 (100.0%) | 2.95 |
Median Household Size in Mount Carmel borough
The median household size in Mount Carmel borough is 2.35 persons per household, with single female/mother households (344 | 14.1%) accounting for the largest median household size of 3.45 persons per household. non-family households (937 | 38.4%) represent the smallest median household size with 1.15 persons per household.
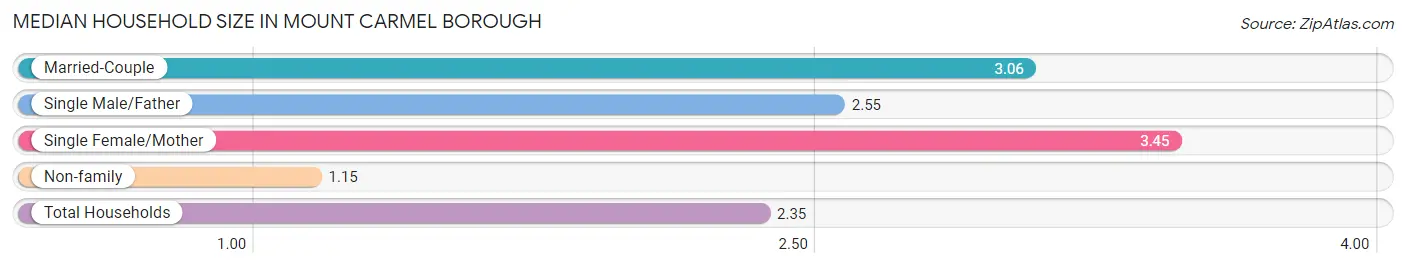
| Household Type | # Households | Household Size |
| Married-Couple | 971 (39.8%) | 3.06 |
| Single Male/Father | 186 (7.6%) | 2.55 |
| Single Female/Mother | 344 (14.1%) | 3.45 |
| Non-family | 937 (38.4%) | 1.15 |
| Total Households | 2,438 (100.0%) | 2.35 |
Household Size by Marriage Status in Mount Carmel borough
Out of a total of 2,438 households in Mount Carmel borough, 1,501 (61.6%) are family households, while 937 (38.4%) are nonfamily households. The most numerous type of family households are 2-person households, comprising 676, and the most common type of nonfamily households are 1-person households, comprising 856.
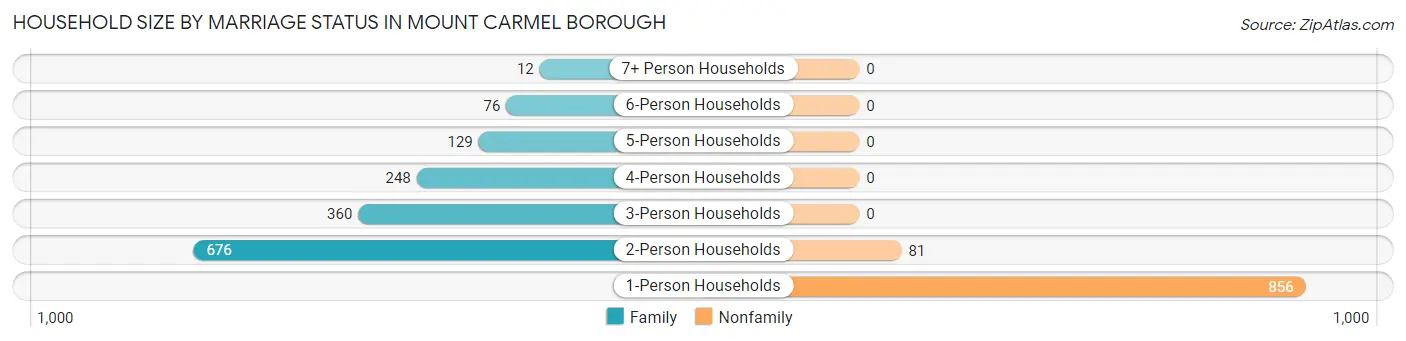
| Household Size | Family Households | Nonfamily Households |
| 1-Person Households | - | 856 (35.1%) |
| 2-Person Households | 676 (27.7%) | 81 (3.3%) |
| 3-Person Households | 360 (14.8%) | 0 (0.0%) |
| 4-Person Households | 248 (10.2%) | 0 (0.0%) |
| 5-Person Households | 129 (5.3%) | 0 (0.0%) |
| 6-Person Households | 76 (3.1%) | 0 (0.0%) |
| 7+ Person Households | 12 (0.5%) | 0 (0.0%) |
| Total | 1,501 (61.6%) | 937 (38.4%) |
Female Fertility in Mount Carmel borough
Fertility by Age in Mount Carmel borough
Average fertility rate in Mount Carmel borough is 66.0 births per 1,000 women. Women in the age bracket of 15 to 19 years have the highest fertility rate with 87.0 births per 1,000 women. Women in the age bracket of 35 to 50 years acount for 43.7% of all women with births.
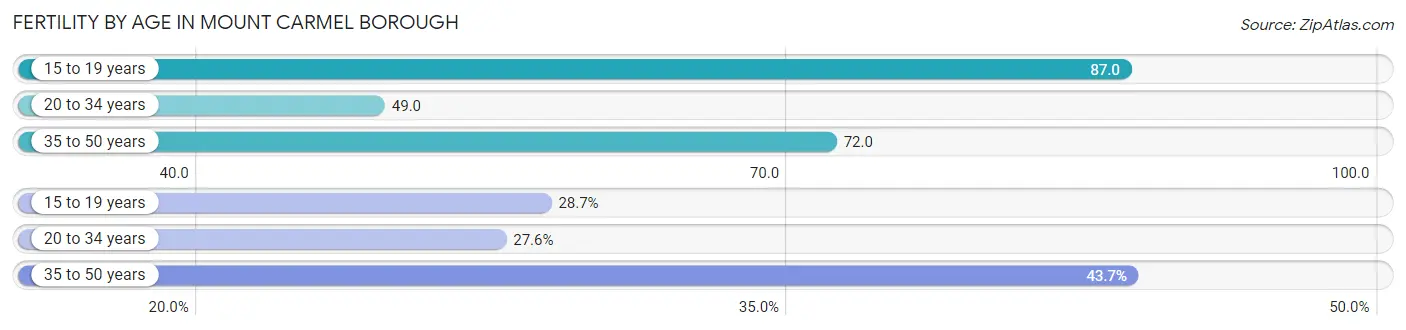
| Age Bracket | Women with Births | Births / 1,000 Women |
| 15 to 19 years | 25 (28.7%) | 87.0 |
| 20 to 34 years | 24 (27.6%) | 49.0 |
| 35 to 50 years | 38 (43.7%) | 72.0 |
| Total | 87 (100.0%) | 66.0 |
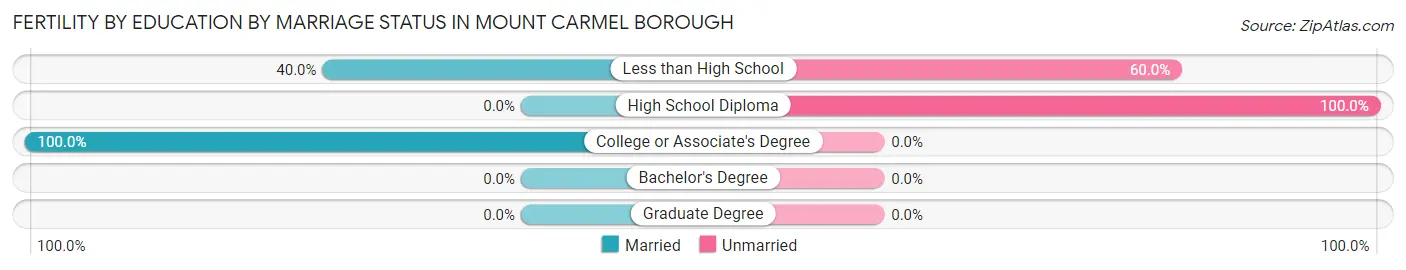
Fertility by Age by Marriage Status in Mount Carmel borough
43.7% of women with births (87) in Mount Carmel borough are married. The highest percentage of unmarried women with births falls into 15 to 19 years age bracket with 100.0% of them unmarried at the time of birth, while the lowest percentage of unmarried women with births belong to 35 to 50 years age bracket with 0.0% of them unmarried.
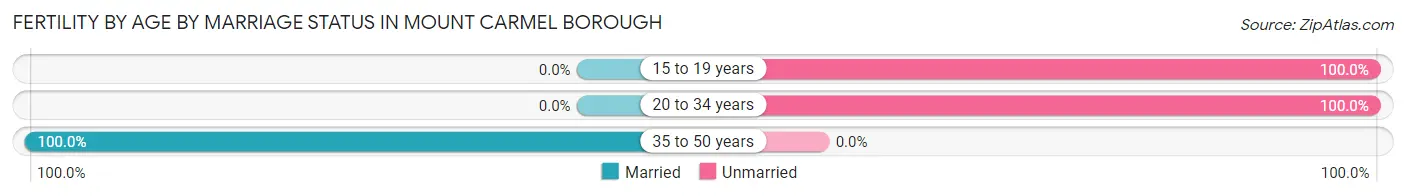
| Age Bracket | Married | Unmarried |
| 15 to 19 years | 0 (0.0%) | 25 (100.0%) |
| 20 to 34 years | 0 (0.0%) | 24 (100.0%) |
| 35 to 50 years | 38 (100.0%) | 0 (0.0%) |
| Total | 38 (43.7%) | 49 (56.3%) |
Fertility by Education in Mount Carmel borough
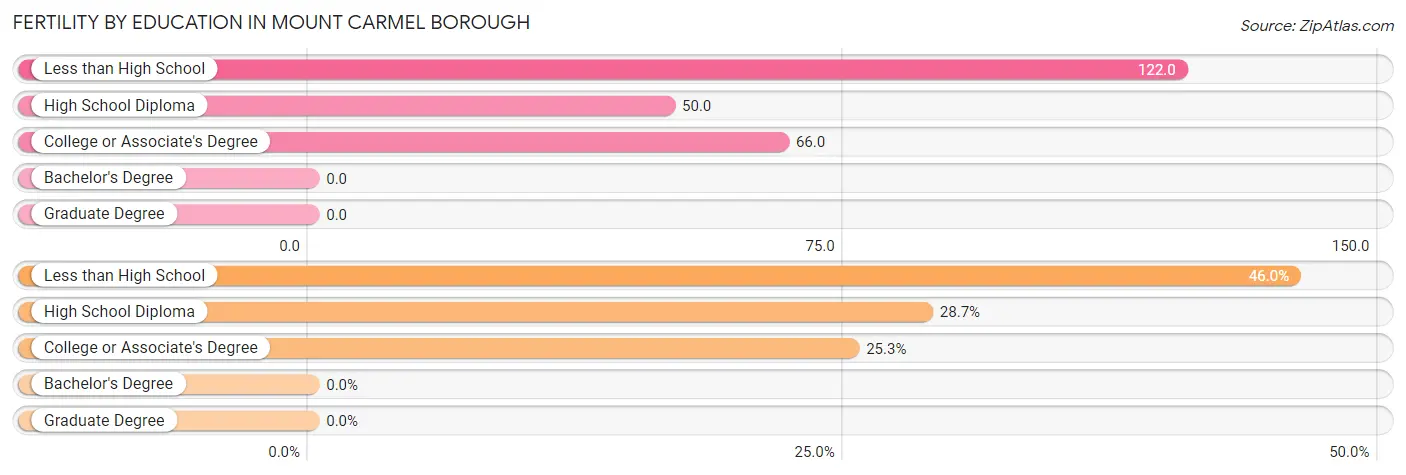
| Educational Attainment | Women with Births | Births / 1,000 Women |
| Less than High School | 40 (46.0%) | 122.0 |
| High School Diploma | 25 (28.7%) | 50.0 |
| College or Associate's Degree | 22 (25.3%) | 66.0 |
| Bachelor's Degree | 0 (0.0%) | 0.0 |
| Graduate Degree | 0 (0.0%) | 0.0 |
| Total | 87 (100.0%) | 66.0 |
Fertility by Education by Marriage Status in Mount Carmel borough
56.3% of women with births in Mount Carmel borough are unmarried. Women with the educational attainment of college or associate's degree are most likely to be married with 100.0% of them married at childbirth, while women with the educational attainment of high school diploma are least likely to be married with 100.0% of them unmarried at childbirth.
| Educational Attainment | Married | Unmarried |
| Less than High School | 16 (40.0%) | 24 (60.0%) |
| High School Diploma | 0 (0.0%) | 25 (100.0%) |
| College or Associate's Degree | 22 (100.0%) | 0 (0.0%) |
| Bachelor's Degree | 0 (0.0%) | 0 (0.0%) |
| Graduate Degree | 0 (0.0%) | 0 (0.0%) |
| Total | 38 (43.7%) | 49 (56.3%) |
Employment Characteristics in Mount Carmel borough
Employment by Class of Employer in Mount Carmel borough
Among the 2,184 employed individuals in Mount Carmel borough, private company employees (1,533 | 70.2%), state government employees (196 | 9.0%), and not-for-profit organizations (182 | 8.3%) make up the most common classes of employment.
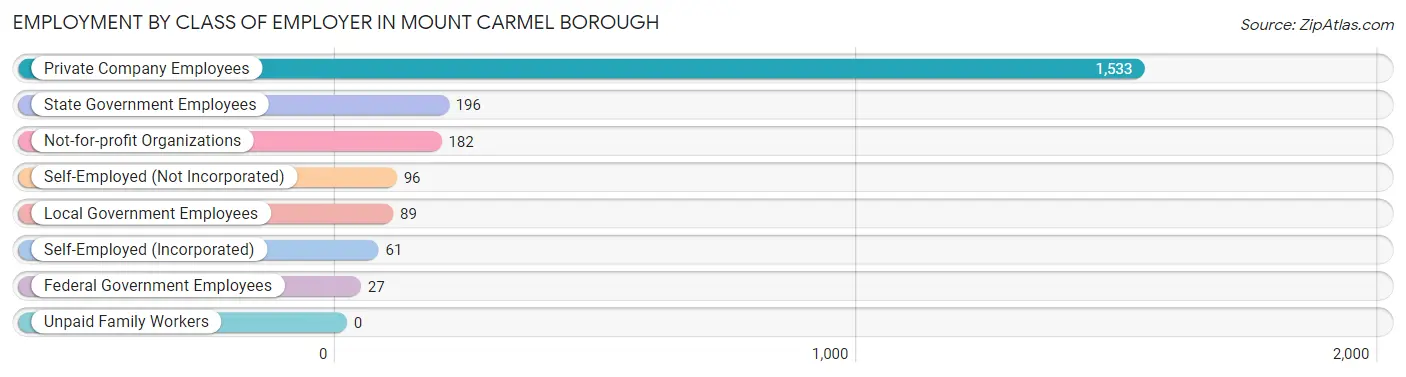
| Employer Class | # Employees | % Employees |
| Private Company Employees | 1,533 | 70.2% |
| Self-Employed (Incorporated) | 61 | 2.8% |
| Self-Employed (Not Incorporated) | 96 | 4.4% |
| Not-for-profit Organizations | 182 | 8.3% |
| Local Government Employees | 89 | 4.1% |
| State Government Employees | 196 | 9.0% |
| Federal Government Employees | 27 | 1.2% |
| Unpaid Family Workers | 0 | 0.0% |
| Total | 2,184 | 100.0% |
Employment Status by Age in Mount Carmel borough
According to the labor force statistics for Mount Carmel borough, out of the total population over 16 years of age (4,853), 49.2% or 2,388 individuals are in the labor force, with 7.1% or 170 of them unemployed. The age group with the highest labor force participation rate is 25 to 29 years, with 86.5% or 249 individuals in the labor force. Within the labor force, the 16 to 19 years age range has the highest percentage of unemployed individuals, with 33.8% or 47 of them being unemployed.
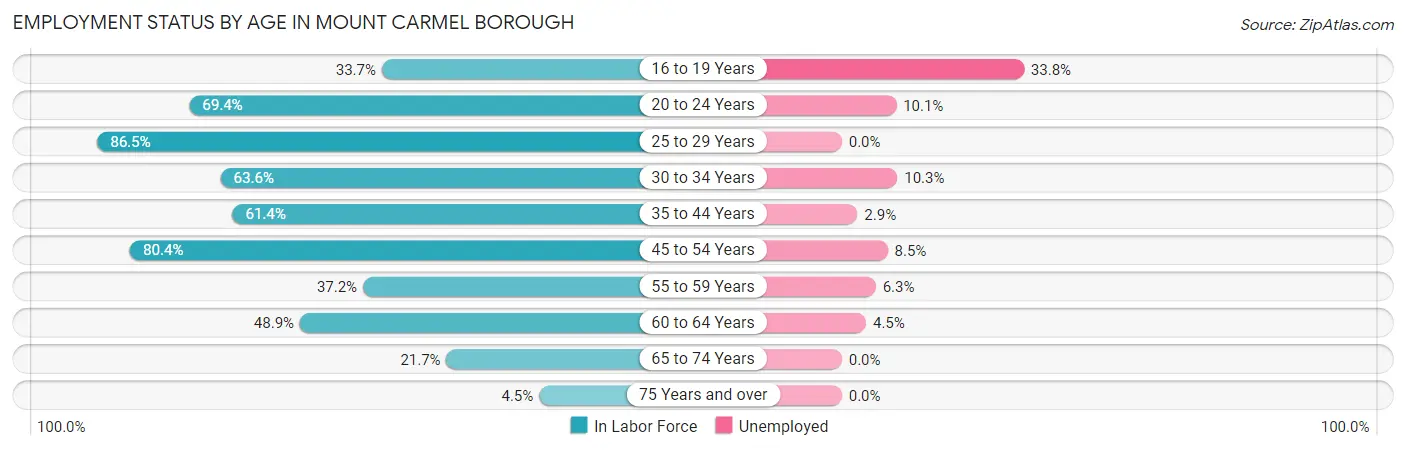
| Age Bracket | In Labor Force | Unemployed |
| 16 to 19 Years | 139 (33.7%) | 47 (33.8%) |
| 20 to 24 Years | 188 (69.4%) | 19 (10.1%) |
| 25 to 29 Years | 249 (86.5%) | 0 (0.0%) |
| 30 to 34 Years | 271 (63.6%) | 28 (10.3%) |
| 35 to 44 Years | 511 (61.4%) | 15 (2.9%) |
| 45 to 54 Years | 481 (80.4%) | 41 (8.5%) |
| 55 to 59 Years | 143 (37.2%) | 9 (6.3%) |
| 60 to 64 Years | 223 (48.9%) | 10 (4.5%) |
| 65 to 74 Years | 166 (21.7%) | 0 (0.0%) |
| 75 Years and over | 19 (4.5%) | 0 (0.0%) |
| Total | 2,388 (49.2%) | 170 (7.1%) |
Employment Status by Educational Attainment in Mount Carmel borough
According to labor force statistics for Mount Carmel borough, 62.9% of individuals (1,877) out of the total population between 25 and 64 years of age (2,984) are in the labor force, with 5.5% or 103 of them being unemployed. The group with the highest labor force participation rate are those with the educational attainment of bachelor's degree or higher, with 91.3% or 377 individuals in the labor force. Within the labor force, individuals with college / associate degree education have the highest percentage of unemployment, with 8.8% or 48 of them being unemployed.
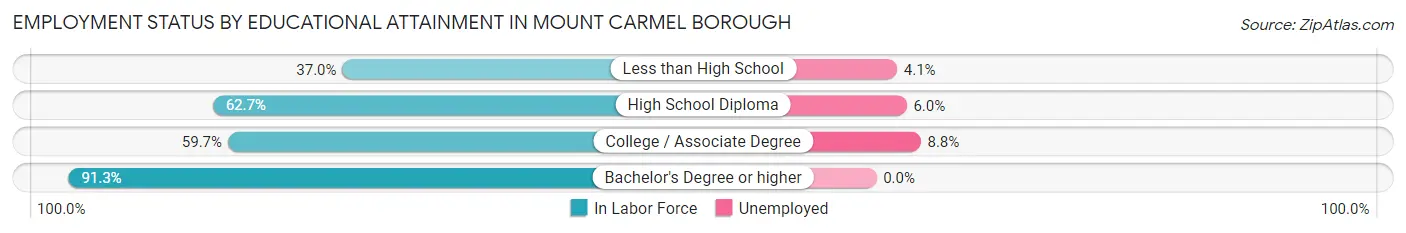
| Educational Attainment | In Labor Force | Unemployed |
| Less than High School | 121 (37.0%) | 13 (4.1%) |
| High School Diploma | 831 (62.7%) | 80 (6.0%) |
| College / Associate Degree | 548 (59.7%) | 81 (8.8%) |
| Bachelor's Degree or higher | 377 (91.3%) | 0 (0.0%) |
| Total | 1,877 (62.9%) | 164 (5.5%) |
Employment Occupations by Sex in Mount Carmel borough
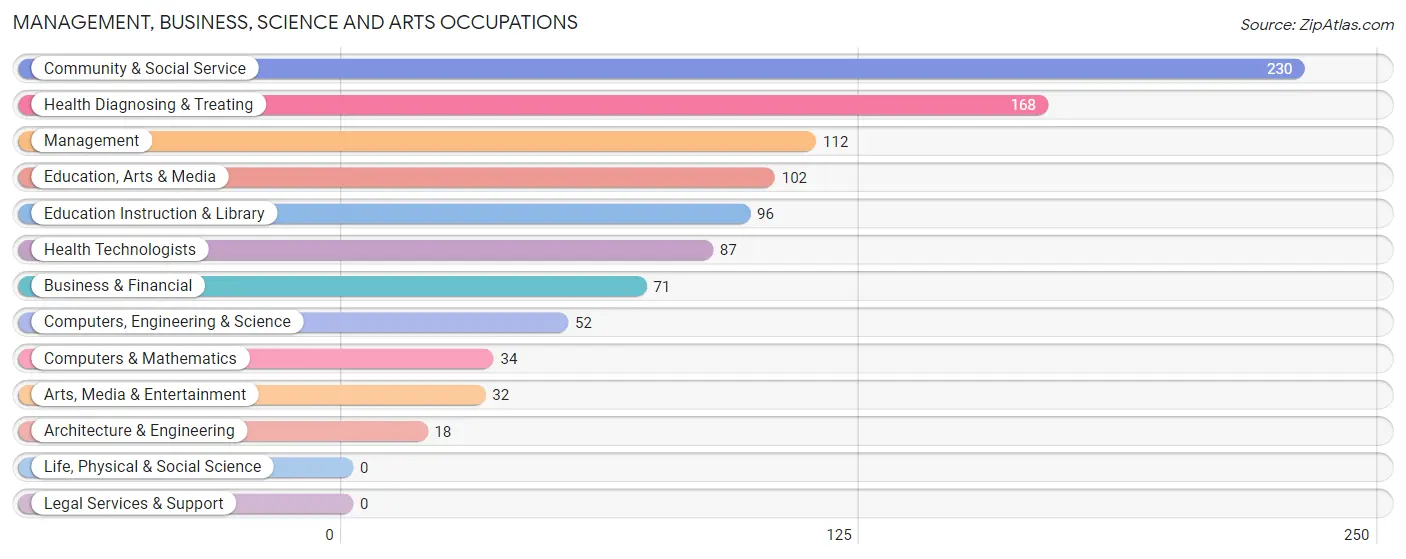
Management, Business, Science and Arts Occupations
The most common Management, Business, Science and Arts occupations in Mount Carmel borough are Community & Social Service (230 | 10.4%), Health Diagnosing & Treating (168 | 7.6%), Management (112 | 5.0%), Education, Arts & Media (102 | 4.6%), and Education Instruction & Library (96 | 4.3%).
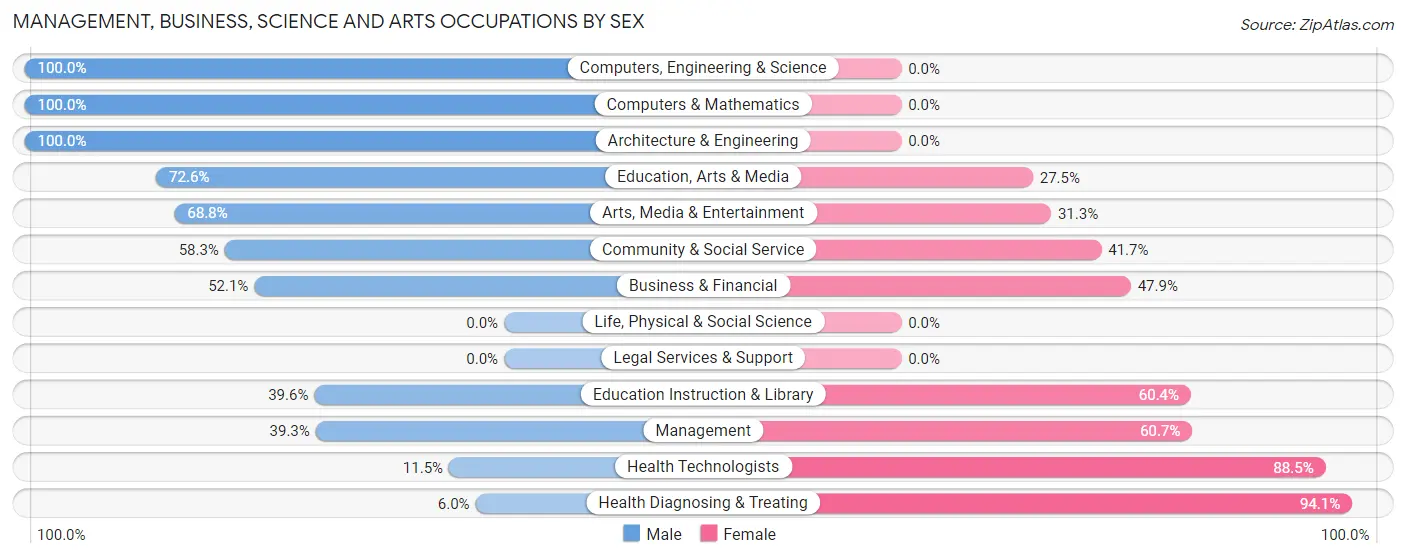
Management, Business, Science and Arts Occupations by Sex
Within the Management, Business, Science and Arts occupations in Mount Carmel borough, the most male-oriented occupations are Computers, Engineering & Science (100.0%), Computers & Mathematics (100.0%), and Architecture & Engineering (100.0%), while the most female-oriented occupations are Health Diagnosing & Treating (94.1%), Health Technologists (88.5%), and Management (60.7%).
| Occupation | Male | Female |
| Management | 44 (39.3%) | 68 (60.7%) |
| Business & Financial | 37 (52.1%) | 34 (47.9%) |
| Computers, Engineering & Science | 52 (100.0%) | 0 (0.0%) |
| Computers & Mathematics | 34 (100.0%) | 0 (0.0%) |
| Architecture & Engineering | 18 (100.0%) | 0 (0.0%) |
| Life, Physical & Social Science | 0 (0.0%) | 0 (0.0%) |
| Community & Social Service | 134 (58.3%) | 96 (41.7%) |
| Education, Arts & Media | 74 (72.6%) | 28 (27.5%) |
| Legal Services & Support | 0 (0.0%) | 0 (0.0%) |
| Education Instruction & Library | 38 (39.6%) | 58 (60.4%) |
| Arts, Media & Entertainment | 22 (68.8%) | 10 (31.2%) |
| Health Diagnosing & Treating | 10 (5.9%) | 158 (94.1%) |
| Health Technologists | 10 (11.5%) | 77 (88.5%) |
| Total (Category) | 277 (43.8%) | 356 (56.2%) |
| Total (Overall) | 1,289 (58.0%) | 932 (42.0%) |
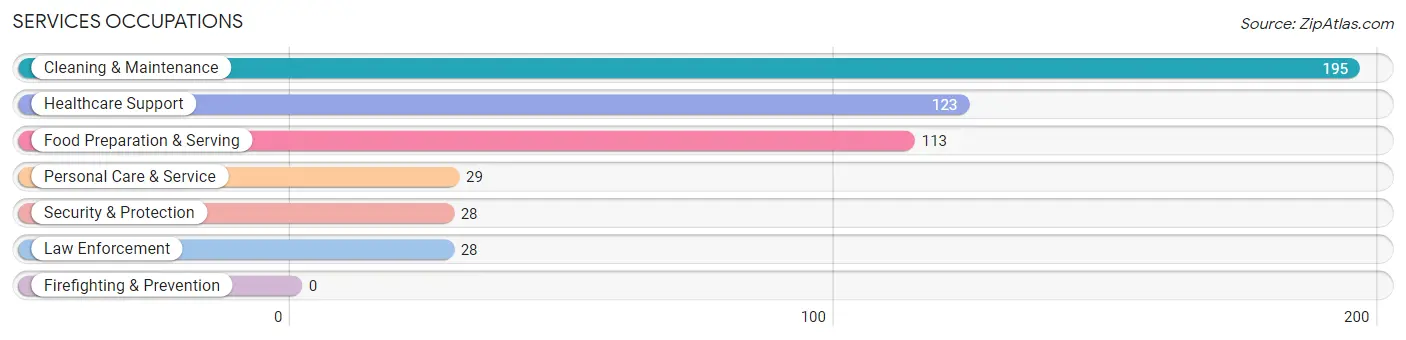
Services Occupations
The most common Services occupations in Mount Carmel borough are Cleaning & Maintenance (195 | 8.8%), Healthcare Support (123 | 5.5%), Food Preparation & Serving (113 | 5.1%), Personal Care & Service (29 | 1.3%), and Security & Protection (28 | 1.3%).
Services Occupations by Sex
Within the Services occupations in Mount Carmel borough, the most male-oriented occupations are Security & Protection (100.0%), Law Enforcement (100.0%), and Cleaning & Maintenance (96.4%), while the most female-oriented occupations are Healthcare Support (80.5%), Food Preparation & Serving (69.9%), and Personal Care & Service (58.6%).
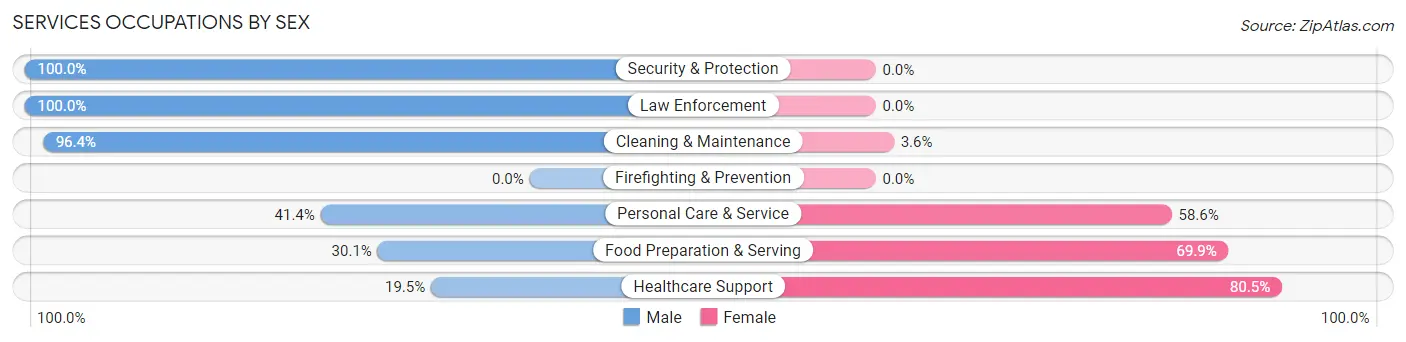
| Occupation | Male | Female |
| Healthcare Support | 24 (19.5%) | 99 (80.5%) |
| Security & Protection | 28 (100.0%) | 0 (0.0%) |
| Firefighting & Prevention | 0 (0.0%) | 0 (0.0%) |
| Law Enforcement | 28 (100.0%) | 0 (0.0%) |
| Food Preparation & Serving | 34 (30.1%) | 79 (69.9%) |
| Cleaning & Maintenance | 188 (96.4%) | 7 (3.6%) |
| Personal Care & Service | 12 (41.4%) | 17 (58.6%) |
| Total (Category) | 286 (58.6%) | 202 (41.4%) |
| Total (Overall) | 1,289 (58.0%) | 932 (42.0%) |
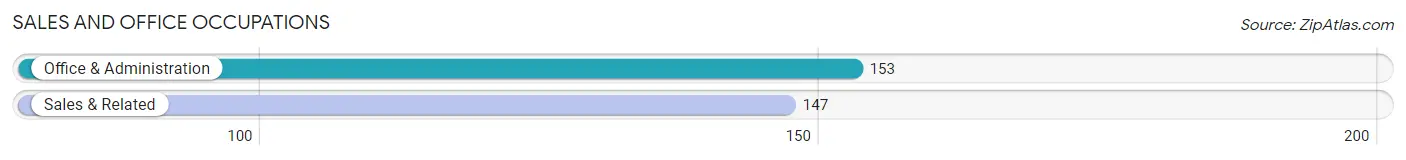
Sales and Office Occupations
The most common Sales and Office occupations in Mount Carmel borough are Office & Administration (153 | 6.9%), and Sales & Related (147 | 6.6%).
Sales and Office Occupations by Sex
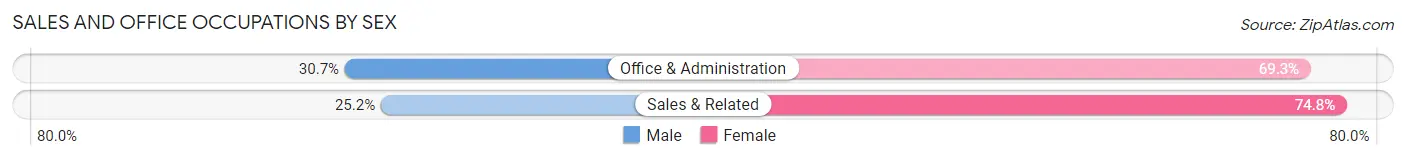
| Occupation | Male | Female |
| Sales & Related | 37 (25.2%) | 110 (74.8%) |
| Office & Administration | 47 (30.7%) | 106 (69.3%) |
| Total (Category) | 84 (28.0%) | 216 (72.0%) |
| Total (Overall) | 1,289 (58.0%) | 932 (42.0%) |
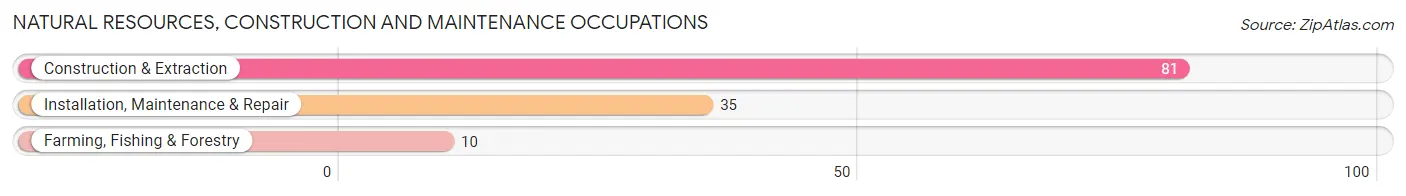
Natural Resources, Construction and Maintenance Occupations
The most common Natural Resources, Construction and Maintenance occupations in Mount Carmel borough are Construction & Extraction (81 | 3.6%), Installation, Maintenance & Repair (35 | 1.6%), and Farming, Fishing & Forestry (10 | 0.4%).
Natural Resources, Construction and Maintenance Occupations by Sex
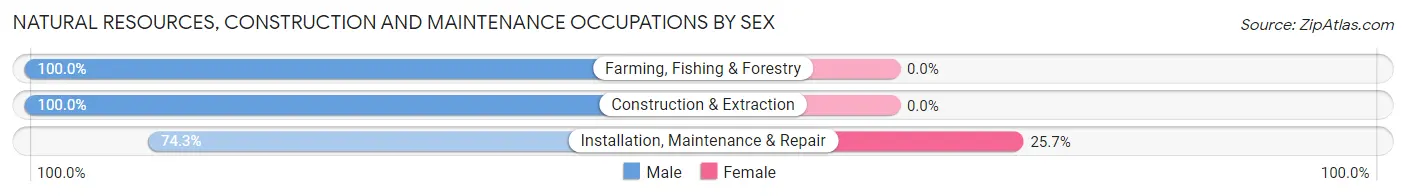
| Occupation | Male | Female |
| Farming, Fishing & Forestry | 10 (100.0%) | 0 (0.0%) |
| Construction & Extraction | 81 (100.0%) | 0 (0.0%) |
| Installation, Maintenance & Repair | 26 (74.3%) | 9 (25.7%) |
| Total (Category) | 117 (92.9%) | 9 (7.1%) |
| Total (Overall) | 1,289 (58.0%) | 932 (42.0%) |
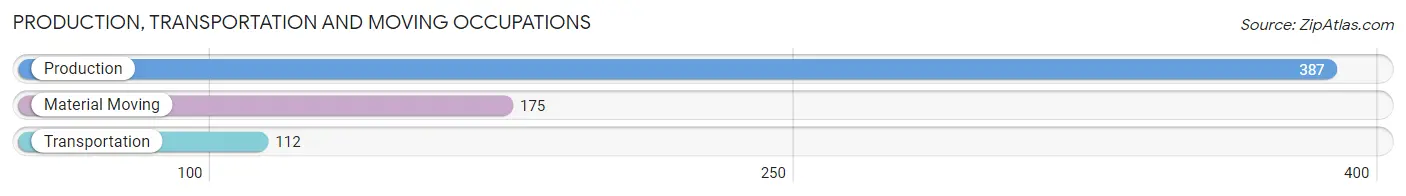
Production, Transportation and Moving Occupations
The most common Production, Transportation and Moving occupations in Mount Carmel borough are Production (387 | 17.4%), Material Moving (175 | 7.9%), and Transportation (112 | 5.0%).
Production, Transportation and Moving Occupations by Sex
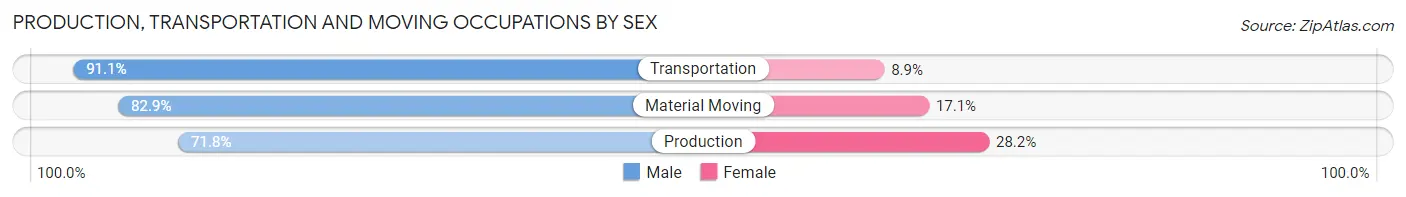
| Occupation | Male | Female |
| Production | 278 (71.8%) | 109 (28.2%) |
| Transportation | 102 (91.1%) | 10 (8.9%) |
| Material Moving | 145 (82.9%) | 30 (17.1%) |
| Total (Category) | 525 (77.9%) | 149 (22.1%) |
| Total (Overall) | 1,289 (58.0%) | 932 (42.0%) |
Employment Industries by Sex in Mount Carmel borough
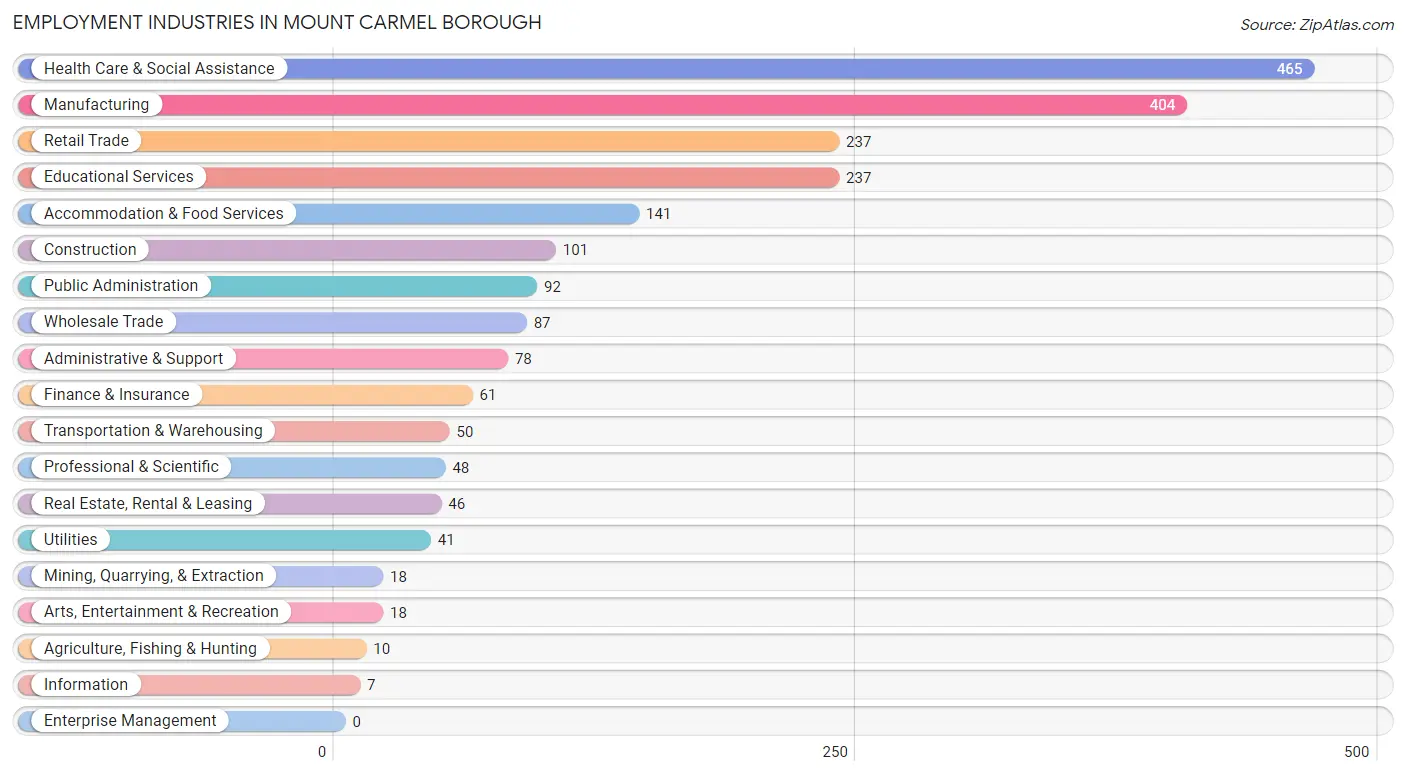
Employment Industries in Mount Carmel borough
The major employment industries in Mount Carmel borough include Health Care & Social Assistance (465 | 20.9%), Manufacturing (404 | 18.2%), Retail Trade (237 | 10.7%), Educational Services (237 | 10.7%), and Accommodation & Food Services (141 | 6.4%).
Employment Industries by Sex in Mount Carmel borough
The Mount Carmel borough industries that see more men than women are Agriculture, Fishing & Hunting (100.0%), Mining, Quarrying, & Extraction (100.0%), and Construction (100.0%), whereas the industries that tend to have a higher number of women are Information (100.0%), Health Care & Social Assistance (89.2%), and Finance & Insurance (70.5%).
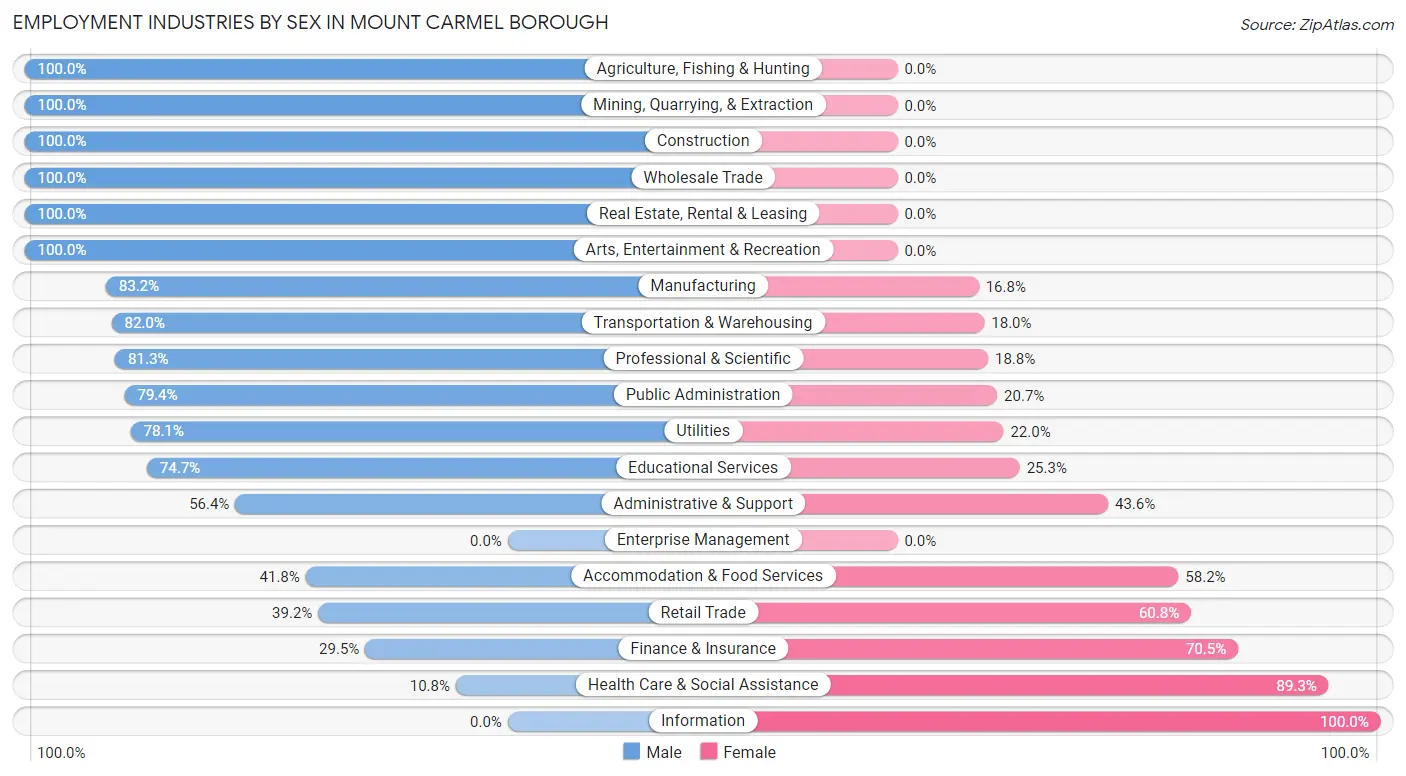
| Industry | Male | Female |
| Agriculture, Fishing & Hunting | 10 (100.0%) | 0 (0.0%) |
| Mining, Quarrying, & Extraction | 18 (100.0%) | 0 (0.0%) |
| Construction | 101 (100.0%) | 0 (0.0%) |
| Manufacturing | 336 (83.2%) | 68 (16.8%) |
| Wholesale Trade | 87 (100.0%) | 0 (0.0%) |
| Retail Trade | 93 (39.2%) | 144 (60.8%) |
| Transportation & Warehousing | 41 (82.0%) | 9 (18.0%) |
| Utilities | 32 (78.0%) | 9 (22.0%) |
| Information | 0 (0.0%) | 7 (100.0%) |
| Finance & Insurance | 18 (29.5%) | 43 (70.5%) |
| Real Estate, Rental & Leasing | 46 (100.0%) | 0 (0.0%) |
| Professional & Scientific | 39 (81.2%) | 9 (18.8%) |
| Enterprise Management | 0 (0.0%) | 0 (0.0%) |
| Administrative & Support | 44 (56.4%) | 34 (43.6%) |
| Educational Services | 177 (74.7%) | 60 (25.3%) |
| Health Care & Social Assistance | 50 (10.7%) | 415 (89.2%) |
| Arts, Entertainment & Recreation | 18 (100.0%) | 0 (0.0%) |
| Accommodation & Food Services | 59 (41.8%) | 82 (58.2%) |
| Public Administration | 73 (79.3%) | 19 (20.6%) |
| Total | 1,289 (58.0%) | 932 (42.0%) |
Education in Mount Carmel borough
School Enrollment in Mount Carmel borough
The most common levels of schooling among the 1,091 students in Mount Carmel borough are high school (382 | 35.0%), elementary school (354 | 32.5%), and middle school (152 | 13.9%).
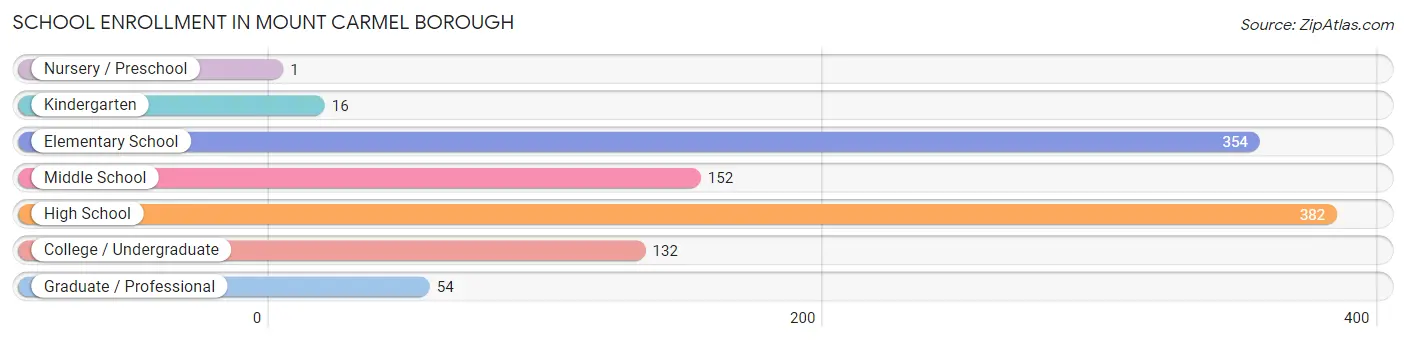
| School Level | # Students | % Students |
| Nursery / Preschool | 1 | 0.1% |
| Kindergarten | 16 | 1.5% |
| Elementary School | 354 | 32.5% |
| Middle School | 152 | 13.9% |
| High School | 382 | 35.0% |
| College / Undergraduate | 132 | 12.1% |
| Graduate / Professional | 54 | 5.0% |
| Total | 1,091 | 100.0% |
School Enrollment by Age by Funding Source in Mount Carmel borough
Out of a total of 1,091 students who are enrolled in schools in Mount Carmel borough, 226 (20.7%) attend a private institution, while the remaining 865 (79.3%) are enrolled in public schools. The age group of 18 to 19 year olds has the highest likelihood of being enrolled in private schools, with 43 (43.0% in the age bracket) enrolled. Conversely, the age group of 25 to 34 year olds has the lowest likelihood of being enrolled in a private school, with 55 (100.0% in the age bracket) attending a public institution.
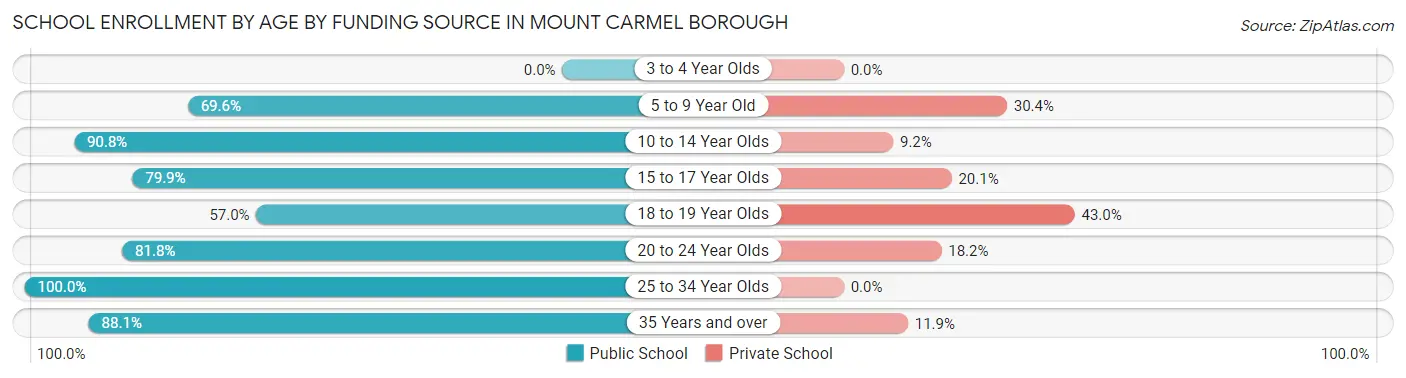
| Age Bracket | Public School | Private School |
| 3 to 4 Year Olds | 0 (0.0%) | 0 (0.0%) |
| 5 to 9 Year Old | 197 (69.6%) | 86 (30.4%) |
| 10 to 14 Year Olds | 227 (90.8%) | 23 (9.2%) |
| 15 to 17 Year Olds | 207 (79.9%) | 52 (20.1%) |
| 18 to 19 Year Olds | 57 (57.0%) | 43 (43.0%) |
| 20 to 24 Year Olds | 63 (81.8%) | 14 (18.2%) |
| 25 to 34 Year Olds | 55 (100.0%) | 0 (0.0%) |
| 35 Years and over | 59 (88.1%) | 8 (11.9%) |
| Total | 865 (79.3%) | 226 (20.7%) |
Educational Attainment by Field of Study in Mount Carmel borough
Science & technology (148 | 24.2%), education (112 | 18.3%), bio, nature & agricultural (72 | 11.8%), liberal arts & history (67 | 11.0%), and business (48 | 7.9%) are the most common fields of study among 611 individuals in Mount Carmel borough who have obtained a bachelor's degree or higher.
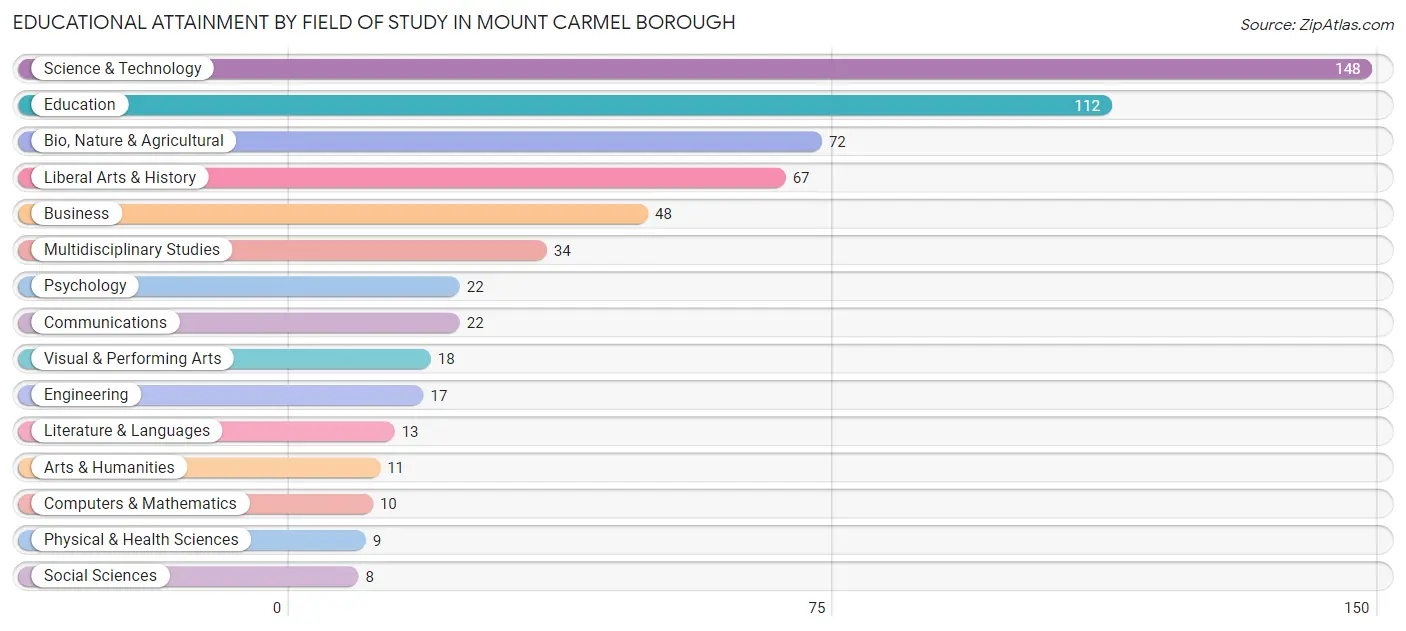
| Field of Study | # Graduates | % Graduates |
| Computers & Mathematics | 10 | 1.6% |
| Bio, Nature & Agricultural | 72 | 11.8% |
| Physical & Health Sciences | 9 | 1.5% |
| Psychology | 22 | 3.6% |
| Social Sciences | 8 | 1.3% |
| Engineering | 17 | 2.8% |
| Multidisciplinary Studies | 34 | 5.6% |
| Science & Technology | 148 | 24.2% |
| Business | 48 | 7.9% |
| Education | 112 | 18.3% |
| Literature & Languages | 13 | 2.1% |
| Liberal Arts & History | 67 | 11.0% |
| Visual & Performing Arts | 18 | 2.9% |
| Communications | 22 | 3.6% |
| Arts & Humanities | 11 | 1.8% |
| Total | 611 | 100.0% |
Transportation & Commute in Mount Carmel borough
Vehicle Availability by Sex in Mount Carmel borough
The most prevalent vehicle ownership categories in Mount Carmel borough are males with 3 vehicles (420, accounting for 32.9%) and females with 3 vehicles (337, making up 46.3%).
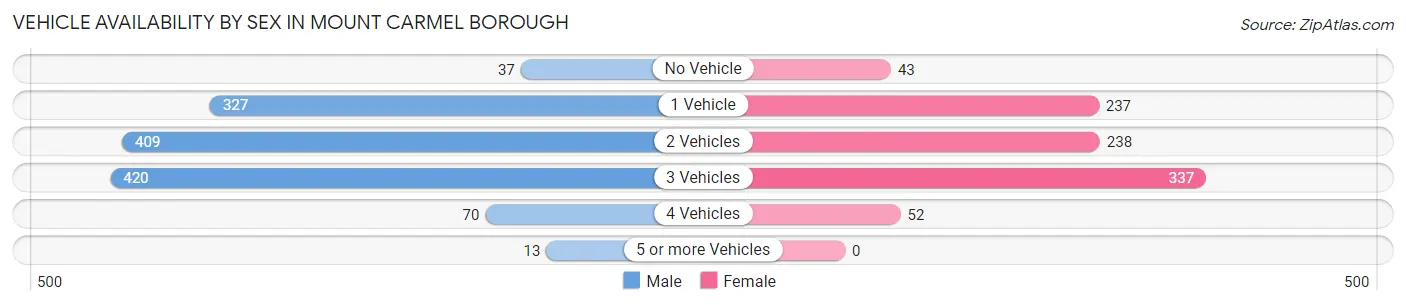
| Vehicles Available | Male | Female |
| No Vehicle | 37 (2.9%) | 43 (4.7%) |
| 1 Vehicle | 327 (25.6%) | 237 (26.1%) |
| 2 Vehicles | 409 (32.1%) | 238 (26.2%) |
| 3 Vehicles | 420 (32.9%) | 337 (37.2%) |
| 4 Vehicles | 70 (5.5%) | 52 (5.7%) |
| 5 or more Vehicles | 13 (1.0%) | 0 (0.0%) |
| Total | 1,276 (100.0%) | 907 (100.0%) |
Commute Time in Mount Carmel borough
The most frequently occuring commute durations in Mount Carmel borough are less than 5 minutes (313 commuters, 15.0%), 5 to 9 minutes (308 commuters, 14.8%), and 20 to 24 minutes (284 commuters, 13.6%).
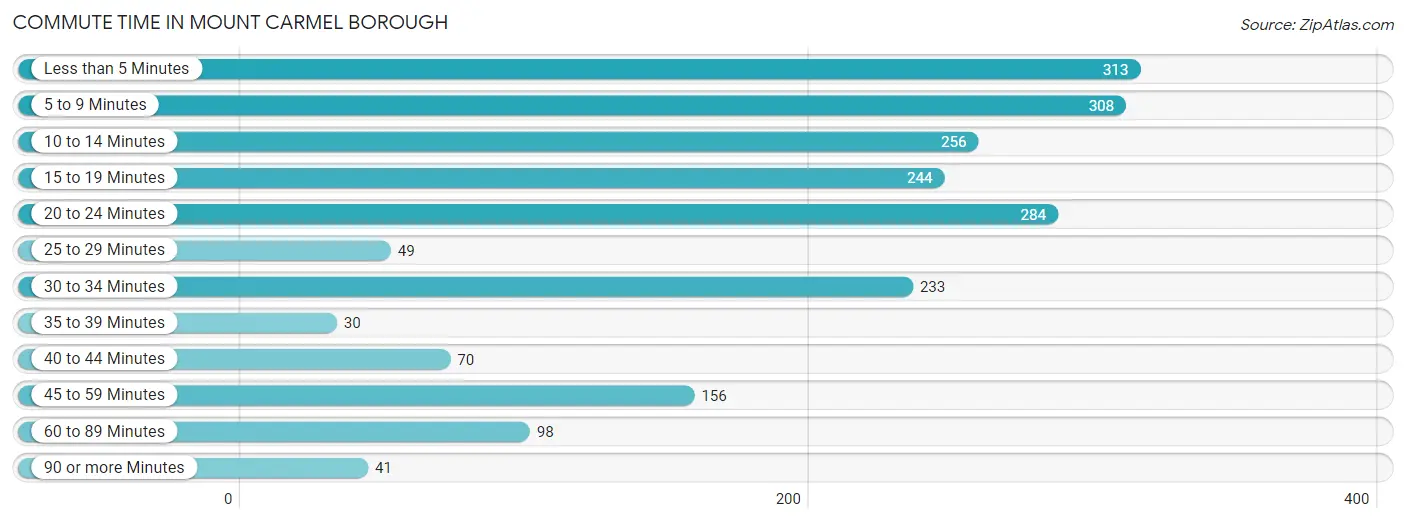
| Commute Time | # Commuters | % Commuters |
| Less than 5 Minutes | 313 | 15.0% |
| 5 to 9 Minutes | 308 | 14.8% |
| 10 to 14 Minutes | 256 | 12.3% |
| 15 to 19 Minutes | 244 | 11.7% |
| 20 to 24 Minutes | 284 | 13.6% |
| 25 to 29 Minutes | 49 | 2.4% |
| 30 to 34 Minutes | 233 | 11.2% |
| 35 to 39 Minutes | 30 | 1.4% |
| 40 to 44 Minutes | 70 | 3.4% |
| 45 to 59 Minutes | 156 | 7.5% |
| 60 to 89 Minutes | 98 | 4.7% |
| 90 or more Minutes | 41 | 2.0% |
Commute Time by Sex in Mount Carmel borough
The most common commute times in Mount Carmel borough are 30 to 34 minutes (189 commuters, 15.6%) for males and less than 5 minutes (160 commuters, 18.4%) for females.
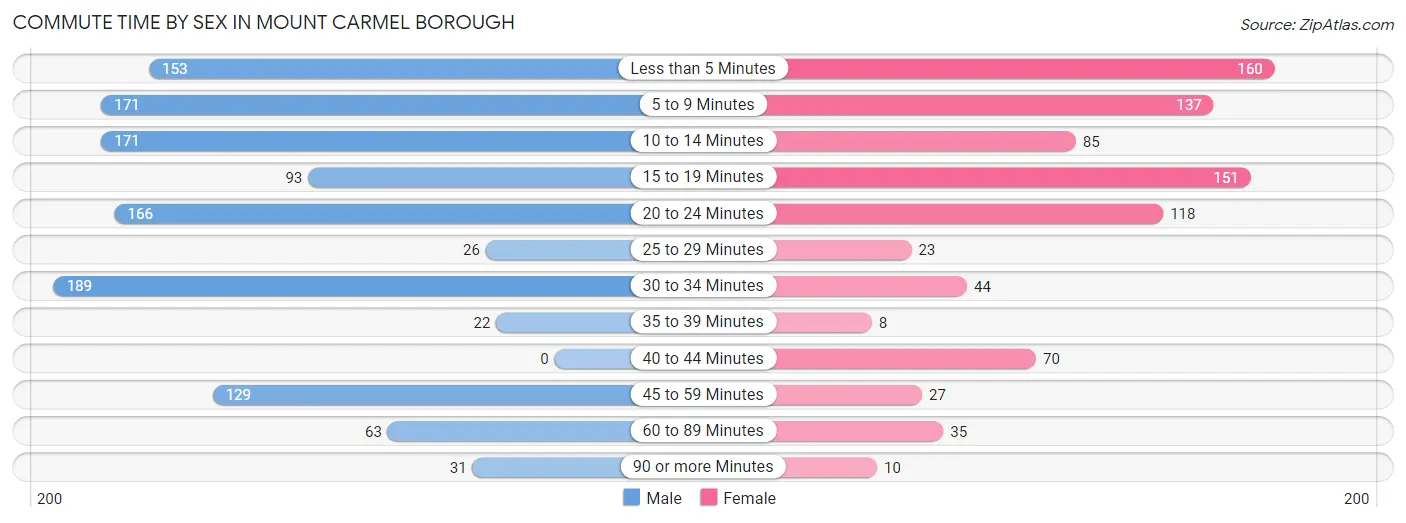
| Commute Time | Male | Female |
| Less than 5 Minutes | 153 (12.6%) | 160 (18.4%) |
| 5 to 9 Minutes | 171 (14.1%) | 137 (15.8%) |
| 10 to 14 Minutes | 171 (14.1%) | 85 (9.8%) |
| 15 to 19 Minutes | 93 (7.7%) | 151 (17.4%) |
| 20 to 24 Minutes | 166 (13.7%) | 118 (13.6%) |
| 25 to 29 Minutes | 26 (2.1%) | 23 (2.6%) |
| 30 to 34 Minutes | 189 (15.6%) | 44 (5.1%) |
| 35 to 39 Minutes | 22 (1.8%) | 8 (0.9%) |
| 40 to 44 Minutes | 0 (0.0%) | 70 (8.1%) |
| 45 to 59 Minutes | 129 (10.6%) | 27 (3.1%) |
| 60 to 89 Minutes | 63 (5.2%) | 35 (4.0%) |
| 90 or more Minutes | 31 (2.5%) | 10 (1.1%) |
Time of Departure to Work by Sex in Mount Carmel borough
The most frequent times of departure to work in Mount Carmel borough are 7:00 AM to 7:29 AM (201, 16.6%) for males and 6:30 AM to 6:59 AM (167, 19.2%) for females.
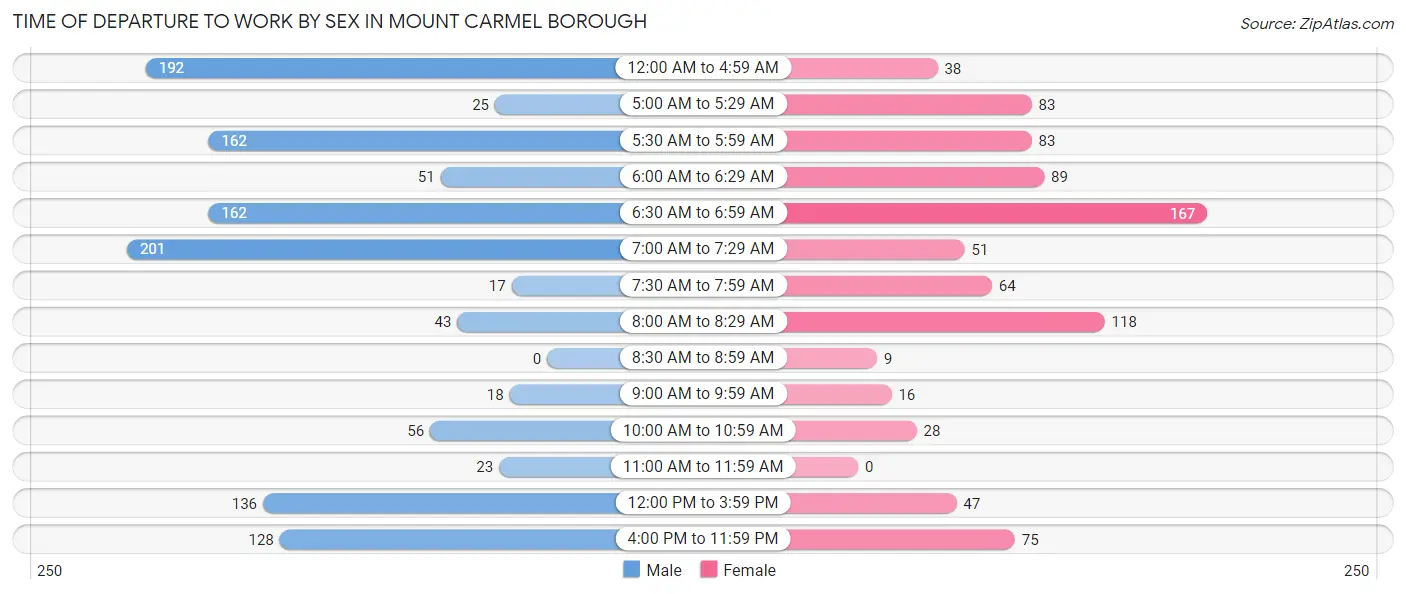
| Time of Departure | Male | Female |
| 12:00 AM to 4:59 AM | 192 (15.8%) | 38 (4.4%) |
| 5:00 AM to 5:29 AM | 25 (2.1%) | 83 (9.6%) |
| 5:30 AM to 5:59 AM | 162 (13.3%) | 83 (9.6%) |
| 6:00 AM to 6:29 AM | 51 (4.2%) | 89 (10.2%) |
| 6:30 AM to 6:59 AM | 162 (13.3%) | 167 (19.2%) |
| 7:00 AM to 7:29 AM | 201 (16.6%) | 51 (5.9%) |
| 7:30 AM to 7:59 AM | 17 (1.4%) | 64 (7.4%) |
| 8:00 AM to 8:29 AM | 43 (3.5%) | 118 (13.6%) |
| 8:30 AM to 8:59 AM | 0 (0.0%) | 9 (1.0%) |
| 9:00 AM to 9:59 AM | 18 (1.5%) | 16 (1.8%) |
| 10:00 AM to 10:59 AM | 56 (4.6%) | 28 (3.2%) |
| 11:00 AM to 11:59 AM | 23 (1.9%) | 0 (0.0%) |
| 12:00 PM to 3:59 PM | 136 (11.2%) | 47 (5.4%) |
| 4:00 PM to 11:59 PM | 128 (10.5%) | 75 (8.6%) |
| Total | 1,214 (100.0%) | 868 (100.0%) |
Housing Occupancy in Mount Carmel borough
Occupancy by Ownership in Mount Carmel borough
Of the total 2,438 dwellings in Mount Carmel borough, owner-occupied units account for 1,715 (70.3%), while renter-occupied units make up 723 (29.7%).
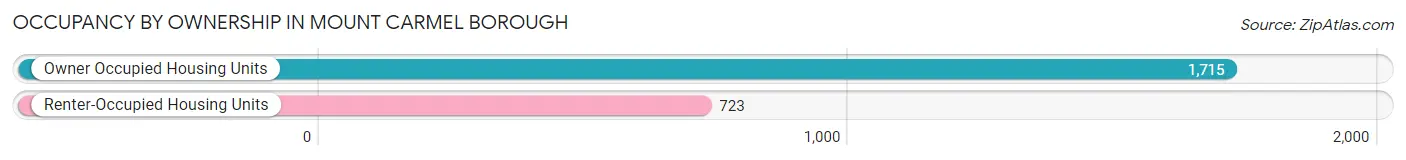
| Occupancy | # Housing Units | % Housing Units |
| Owner Occupied Housing Units | 1,715 | 70.3% |
| Renter-Occupied Housing Units | 723 | 29.7% |
| Total Occupied Housing Units | 2,438 | 100.0% |
Occupancy by Household Size in Mount Carmel borough

| Household Size | # Housing Units | % Housing Units |
| 1-Person Household | 856 | 35.1% |
| 2-Person Household | 757 | 31.0% |
| 3-Person Household | 360 | 14.8% |
| 4+ Person Household | 465 | 19.1% |
| Total Housing Units | 2,438 | 100.0% |
Occupancy by Ownership by Household Size in Mount Carmel borough
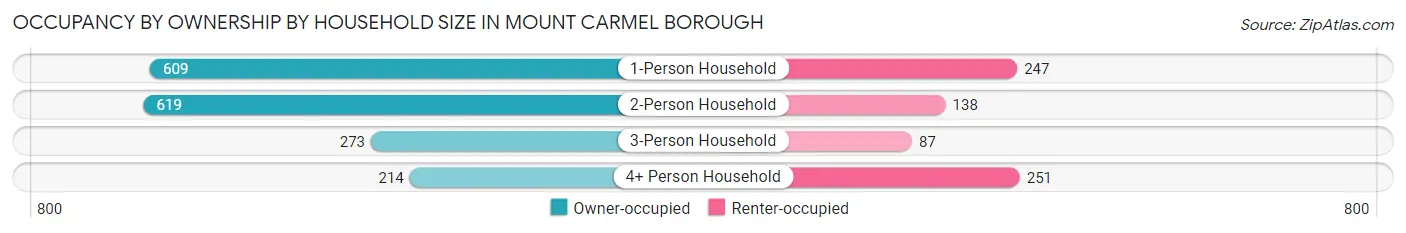
| Household Size | Owner-occupied | Renter-occupied |
| 1-Person Household | 609 (71.1%) | 247 (28.9%) |
| 2-Person Household | 619 (81.8%) | 138 (18.2%) |
| 3-Person Household | 273 (75.8%) | 87 (24.2%) |
| 4+ Person Household | 214 (46.0%) | 251 (54.0%) |
| Total Housing Units | 1,715 (70.3%) | 723 (29.7%) |
Occupancy by Educational Attainment in Mount Carmel borough
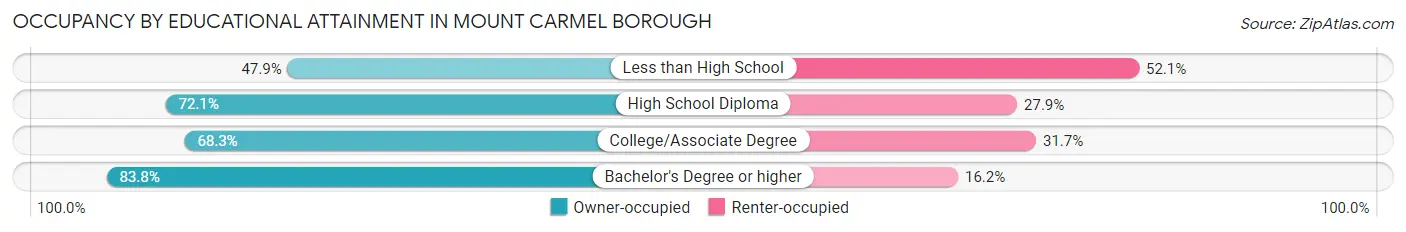
| Household Size | Owner-occupied | Renter-occupied |
| Less than High School | 124 (47.9%) | 135 (52.1%) |
| High School Diploma | 820 (72.1%) | 318 (27.9%) |
| College/Associate Degree | 446 (68.3%) | 207 (31.7%) |
| Bachelor's Degree or higher | 325 (83.8%) | 63 (16.2%) |
Occupancy by Age of Householder in Mount Carmel borough
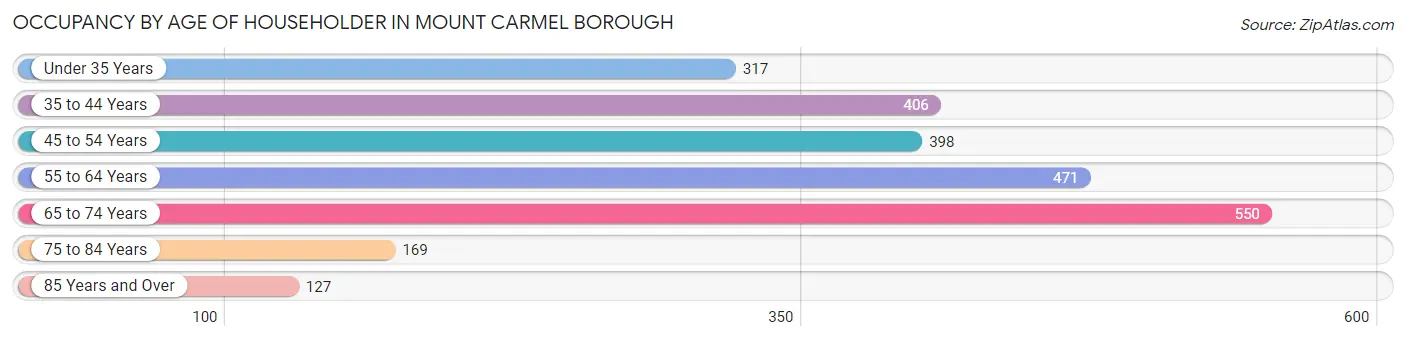
| Age Bracket | # Households | % Households |
| Under 35 Years | 317 | 13.0% |
| 35 to 44 Years | 406 | 16.7% |
| 45 to 54 Years | 398 | 16.3% |
| 55 to 64 Years | 471 | 19.3% |
| 65 to 74 Years | 550 | 22.6% |
| 75 to 84 Years | 169 | 6.9% |
| 85 Years and Over | 127 | 5.2% |
| Total | 2,438 | 100.0% |
Housing Finances in Mount Carmel borough
Median Income by Occupancy in Mount Carmel borough
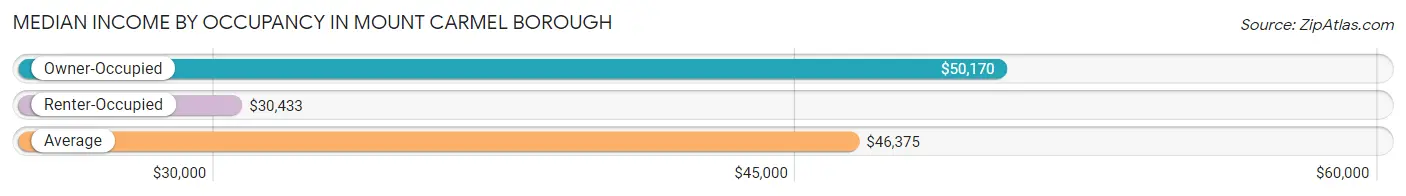
| Occupancy Type | # Households | Median Income |
| Owner-Occupied | 1,715 (70.3%) | $50,170 |
| Renter-Occupied | 723 (29.7%) | $30,433 |
| Average | 2,438 (100.0%) | $46,375 |
Occupancy by Householder Income Bracket in Mount Carmel borough
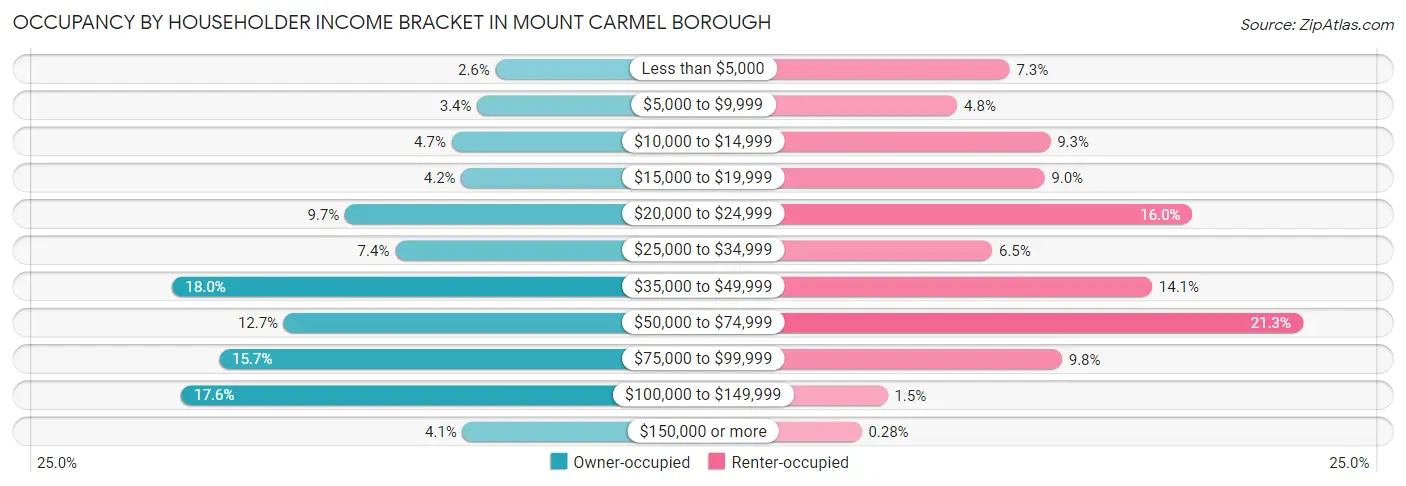
| Income Bracket | Owner-occupied | Renter-occupied |
| Less than $5,000 | 44 (2.6%) | 53 (7.3%) |
| $5,000 to $9,999 | 59 (3.4%) | 35 (4.8%) |
| $10,000 to $14,999 | 80 (4.7%) | 67 (9.3%) |
| $15,000 to $19,999 | 72 (4.2%) | 65 (9.0%) |
| $20,000 to $24,999 | 167 (9.7%) | 116 (16.0%) |
| $25,000 to $34,999 | 126 (7.3%) | 47 (6.5%) |
| $35,000 to $49,999 | 308 (18.0%) | 102 (14.1%) |
| $50,000 to $74,999 | 217 (12.7%) | 154 (21.3%) |
| $75,000 to $99,999 | 270 (15.7%) | 71 (9.8%) |
| $100,000 to $149,999 | 301 (17.5%) | 11 (1.5%) |
| $150,000 or more | 71 (4.1%) | 2 (0.3%) |
| Total | 1,715 (100.0%) | 723 (100.0%) |
Monthly Housing Cost Tiers in Mount Carmel borough
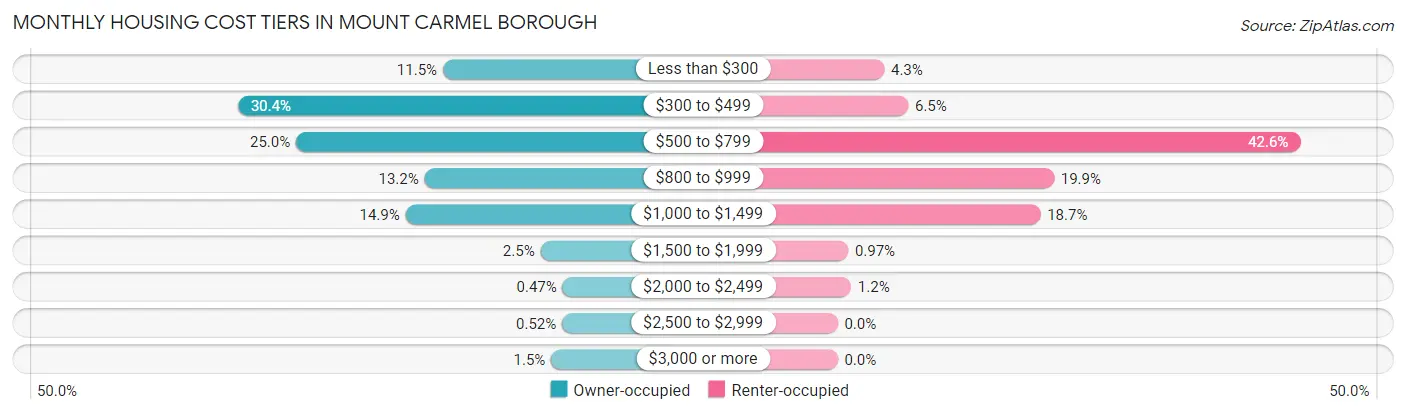
| Monthly Cost | Owner-occupied | Renter-occupied |
| Less than $300 | 197 (11.5%) | 31 (4.3%) |
| $300 to $499 | 521 (30.4%) | 47 (6.5%) |
| $500 to $799 | 429 (25.0%) | 308 (42.6%) |
| $800 to $999 | 226 (13.2%) | 144 (19.9%) |
| $1,000 to $1,499 | 256 (14.9%) | 135 (18.7%) |
| $1,500 to $1,999 | 43 (2.5%) | 7 (1.0%) |
| $2,000 to $2,499 | 8 (0.5%) | 9 (1.2%) |
| $2,500 to $2,999 | 9 (0.5%) | 0 (0.0%) |
| $3,000 or more | 26 (1.5%) | 0 (0.0%) |
| Total | 1,715 (100.0%) | 723 (100.0%) |
Physical Housing Characteristics in Mount Carmel borough
Housing Structures in Mount Carmel borough
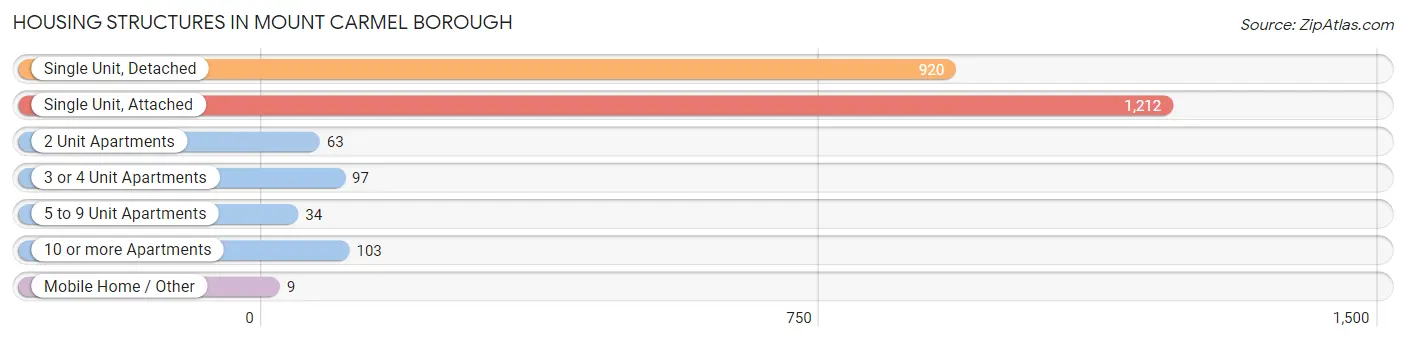
| Structure Type | # Housing Units | % Housing Units |
| Single Unit, Detached | 920 | 37.7% |
| Single Unit, Attached | 1,212 | 49.7% |
| 2 Unit Apartments | 63 | 2.6% |
| 3 or 4 Unit Apartments | 97 | 4.0% |
| 5 to 9 Unit Apartments | 34 | 1.4% |
| 10 or more Apartments | 103 | 4.2% |
| Mobile Home / Other | 9 | 0.4% |
| Total | 2,438 | 100.0% |
Housing Structures by Occupancy in Mount Carmel borough
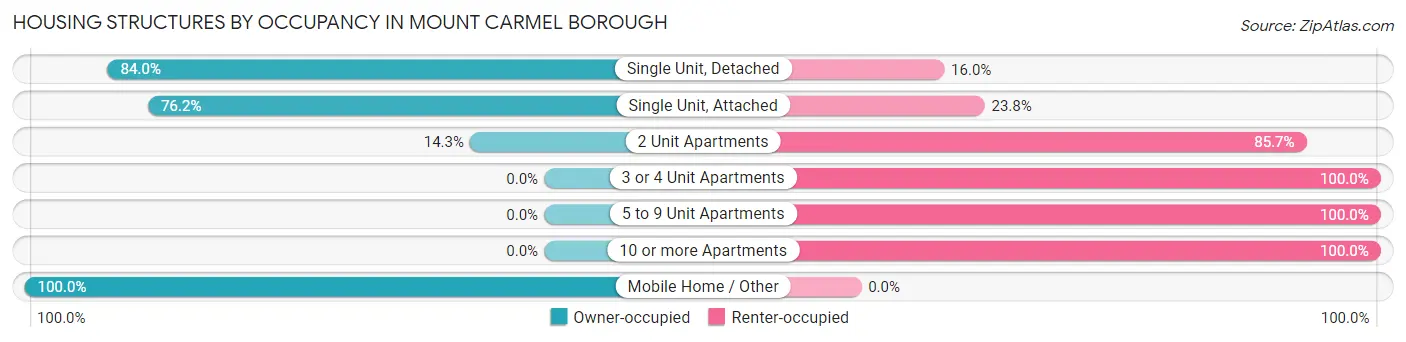
| Structure Type | Owner-occupied | Renter-occupied |
| Single Unit, Detached | 773 (84.0%) | 147 (16.0%) |
| Single Unit, Attached | 924 (76.2%) | 288 (23.8%) |
| 2 Unit Apartments | 9 (14.3%) | 54 (85.7%) |
| 3 or 4 Unit Apartments | 0 (0.0%) | 97 (100.0%) |
| 5 to 9 Unit Apartments | 0 (0.0%) | 34 (100.0%) |
| 10 or more Apartments | 0 (0.0%) | 103 (100.0%) |
| Mobile Home / Other | 9 (100.0%) | 0 (0.0%) |
| Total | 1,715 (70.3%) | 723 (29.7%) |
Housing Structures by Number of Rooms in Mount Carmel borough
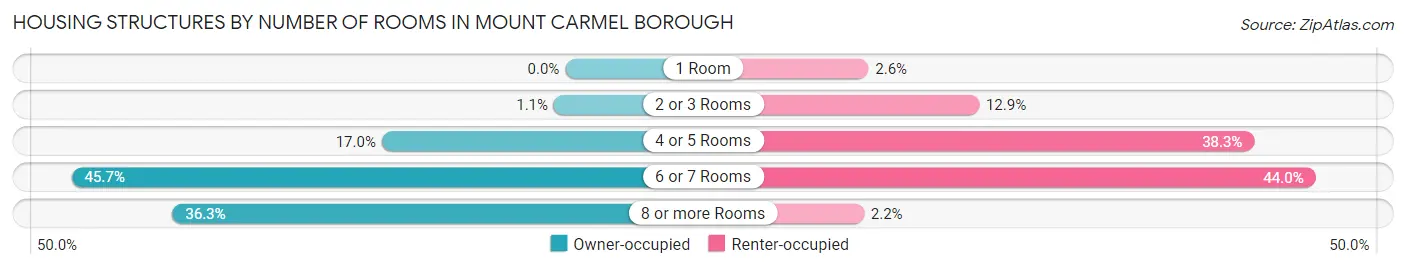
| Number of Rooms | Owner-occupied | Renter-occupied |
| 1 Room | 0 (0.0%) | 19 (2.6%) |
| 2 or 3 Rooms | 18 (1.1%) | 93 (12.9%) |
| 4 or 5 Rooms | 291 (17.0%) | 277 (38.3%) |
| 6 or 7 Rooms | 783 (45.7%) | 318 (44.0%) |
| 8 or more Rooms | 623 (36.3%) | 16 (2.2%) |
| Total | 1,715 (100.0%) | 723 (100.0%) |
Housing Structure by Heating Type in Mount Carmel borough
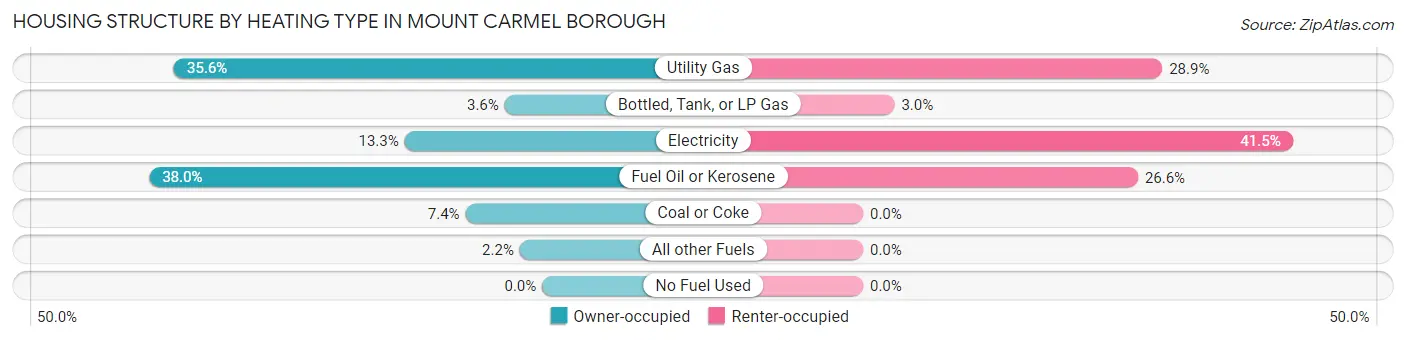
| Heating Type | Owner-occupied | Renter-occupied |
| Utility Gas | 610 (35.6%) | 209 (28.9%) |
| Bottled, Tank, or LP Gas | 62 (3.6%) | 22 (3.0%) |
| Electricity | 228 (13.3%) | 300 (41.5%) |
| Fuel Oil or Kerosene | 651 (38.0%) | 192 (26.6%) |
| Coal or Coke | 127 (7.4%) | 0 (0.0%) |
| All other Fuels | 37 (2.2%) | 0 (0.0%) |
| No Fuel Used | 0 (0.0%) | 0 (0.0%) |
| Total | 1,715 (100.0%) | 723 (100.0%) |
Household Vehicle Usage in Mount Carmel borough
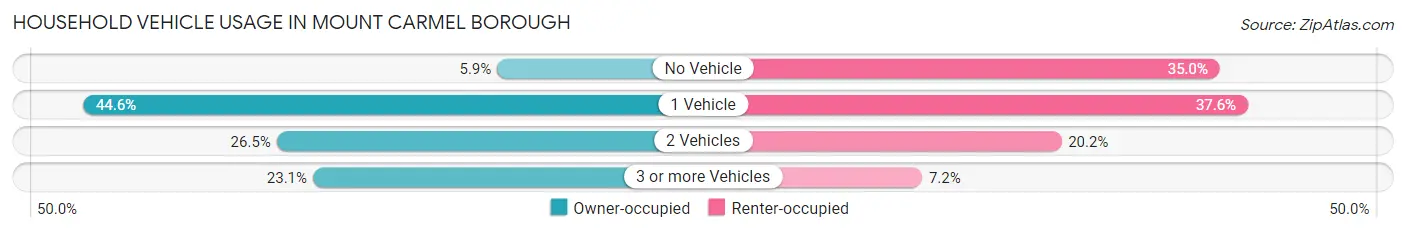
| Vehicles per Household | Owner-occupied | Renter-occupied |
| No Vehicle | 101 (5.9%) | 253 (35.0%) |
| 1 Vehicle | 764 (44.6%) | 272 (37.6%) |
| 2 Vehicles | 454 (26.5%) | 146 (20.2%) |
| 3 or more Vehicles | 396 (23.1%) | 52 (7.2%) |
| Total | 1,715 (100.0%) | 723 (100.0%) |
Real Estate & Mortgages in Mount Carmel borough
Real Estate and Mortgage Overview in Mount Carmel borough
| Characteristic | Without Mortgage | With Mortgage |
| Housing Units | 959 | 756 |
| Median Property Value | $51,500 | $65,500 |
| Median Household Income | $40,417 | $54 |
| Monthly Housing Costs | $433 | $17 |
| Real Estate Taxes | $673 | $0 |
Property Value by Mortgage Status in Mount Carmel borough
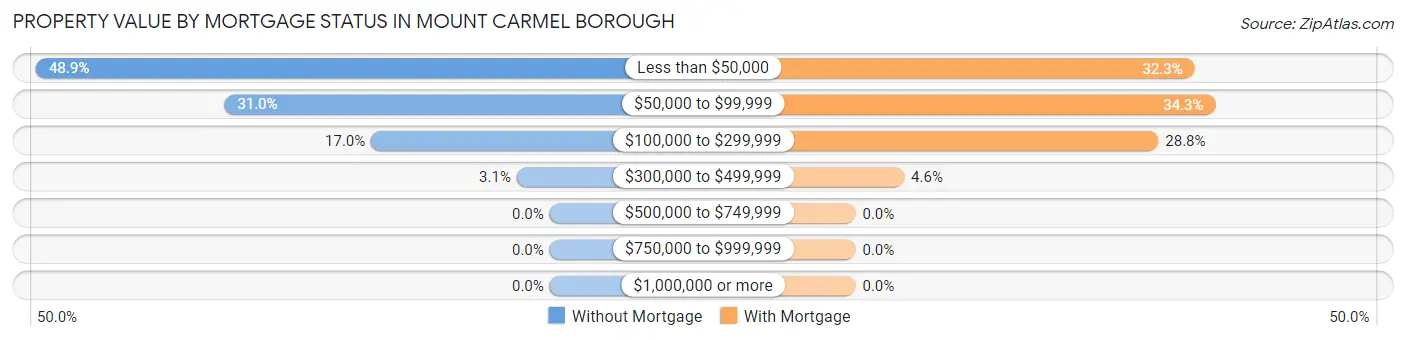
| Property Value | Without Mortgage | With Mortgage |
| Less than $50,000 | 469 (48.9%) | 244 (32.3%) |
| $50,000 to $99,999 | 297 (31.0%) | 259 (34.3%) |
| $100,000 to $299,999 | 163 (17.0%) | 218 (28.8%) |
| $300,000 to $499,999 | 30 (3.1%) | 35 (4.6%) |
| $500,000 to $749,999 | 0 (0.0%) | 0 (0.0%) |
| $750,000 to $999,999 | 0 (0.0%) | 0 (0.0%) |
| $1,000,000 or more | 0 (0.0%) | 0 (0.0%) |
| Total | 959 (100.0%) | 756 (100.0%) |
Household Income by Mortgage Status in Mount Carmel borough
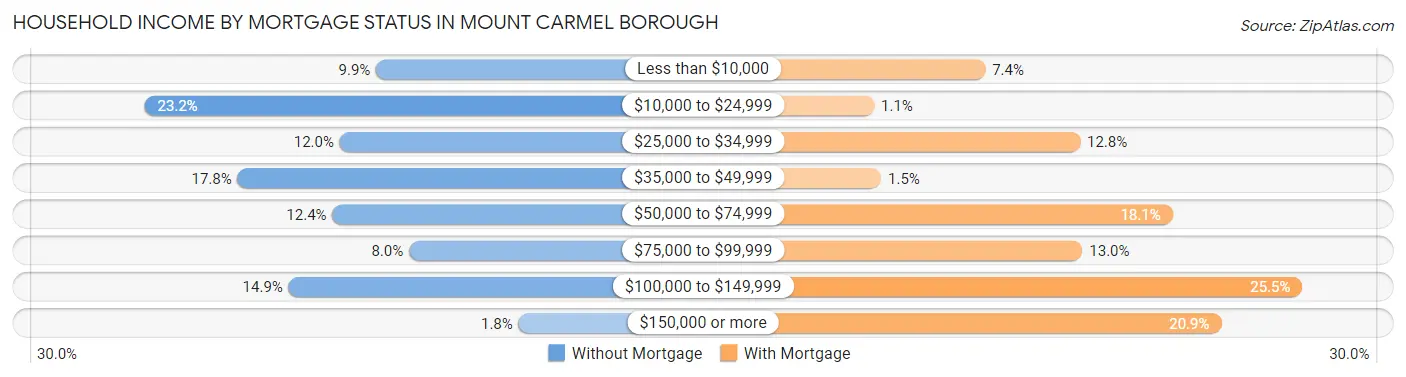
| Household Income | Without Mortgage | With Mortgage |
| Less than $10,000 | 95 (9.9%) | 56 (7.4%) |
| $10,000 to $24,999 | 222 (23.2%) | 8 (1.1%) |
| $25,000 to $34,999 | 115 (12.0%) | 97 (12.8%) |
| $35,000 to $49,999 | 171 (17.8%) | 11 (1.5%) |
| $50,000 to $74,999 | 119 (12.4%) | 137 (18.1%) |
| $75,000 to $99,999 | 77 (8.0%) | 98 (13.0%) |
| $100,000 to $149,999 | 143 (14.9%) | 193 (25.5%) |
| $150,000 or more | 17 (1.8%) | 158 (20.9%) |
| Total | 959 (100.0%) | 756 (100.0%) |
Property Value to Household Income Ratio in Mount Carmel borough
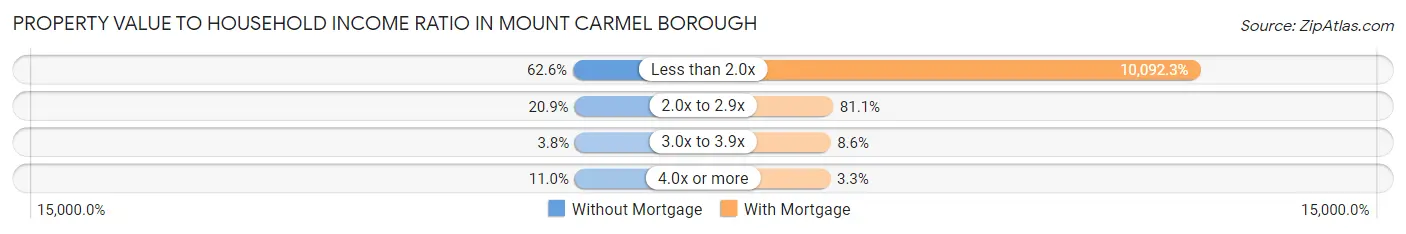
| Value-to-Income Ratio | Without Mortgage | With Mortgage |
| Less than 2.0x | 600 (62.6%) | 76,298 (10,092.3%) |
| 2.0x to 2.9x | 200 (20.9%) | 613 (81.1%) |
| 3.0x to 3.9x | 36 (3.7%) | 65 (8.6%) |
| 4.0x or more | 105 (11.0%) | 25 (3.3%) |
| Total | 959 (100.0%) | 756 (100.0%) |
Real Estate Taxes by Mortgage Status in Mount Carmel borough
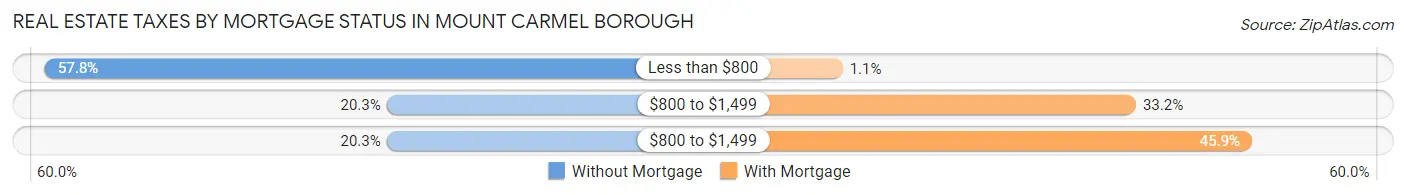
| Property Taxes | Without Mortgage | With Mortgage |
| Less than $800 | 554 (57.8%) | 8 (1.1%) |
| $800 to $1,499 | 195 (20.3%) | 251 (33.2%) |
| $800 to $1,499 | 195 (20.3%) | 347 (45.9%) |
| Total | 959 (100.0%) | 756 (100.0%) |
Health & Disability in Mount Carmel borough
Health Insurance Coverage by Age in Mount Carmel borough
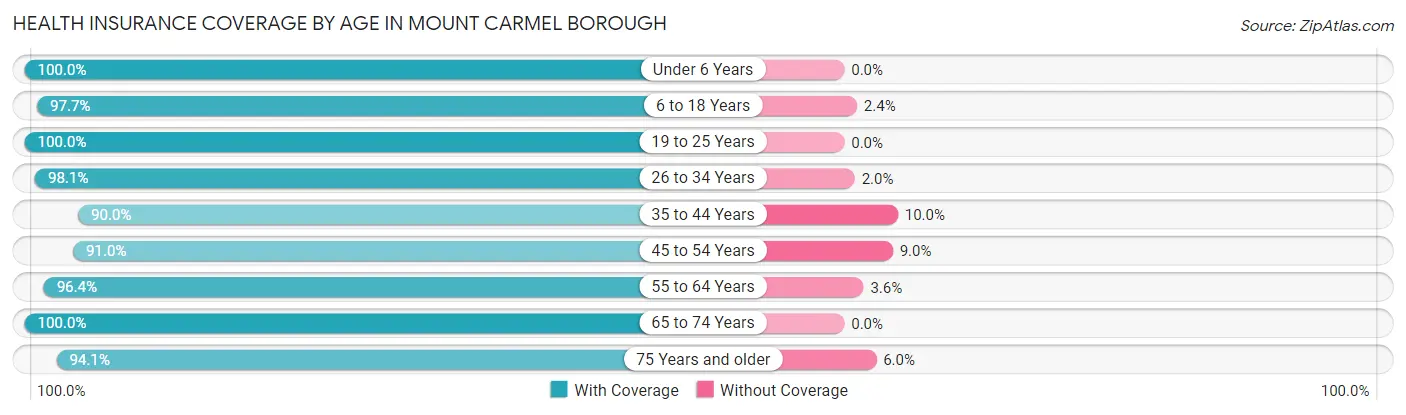
| Age Bracket | With Coverage | Without Coverage |
| Under 6 Years | 316 (100.0%) | 0 (0.0%) |
| 6 to 18 Years | 873 (97.7%) | 21 (2.4%) |
| 19 to 25 Years | 390 (100.0%) | 0 (0.0%) |
| 26 to 34 Years | 654 (98.1%) | 13 (1.9%) |
| 35 to 44 Years | 749 (90.0%) | 83 (10.0%) |
| 45 to 54 Years | 544 (91.0%) | 54 (9.0%) |
| 55 to 64 Years | 810 (96.4%) | 30 (3.6%) |
| 65 to 74 Years | 766 (100.0%) | 0 (0.0%) |
| 75 Years and older | 395 (94.1%) | 25 (5.9%) |
| Total | 5,497 (96.1%) | 226 (4.0%) |
Health Insurance Coverage by Citizenship Status in Mount Carmel borough
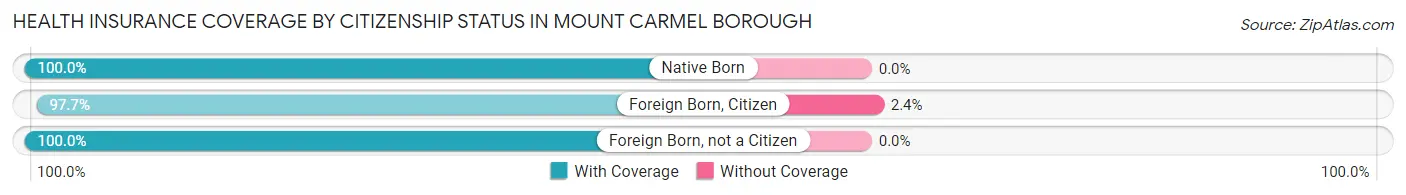
| Citizenship Status | With Coverage | Without Coverage |
| Native Born | 316 (100.0%) | 0 (0.0%) |
| Foreign Born, Citizen | 873 (97.7%) | 21 (2.4%) |
| Foreign Born, not a Citizen | 390 (100.0%) | 0 (0.0%) |
Health Insurance Coverage by Household Income in Mount Carmel borough
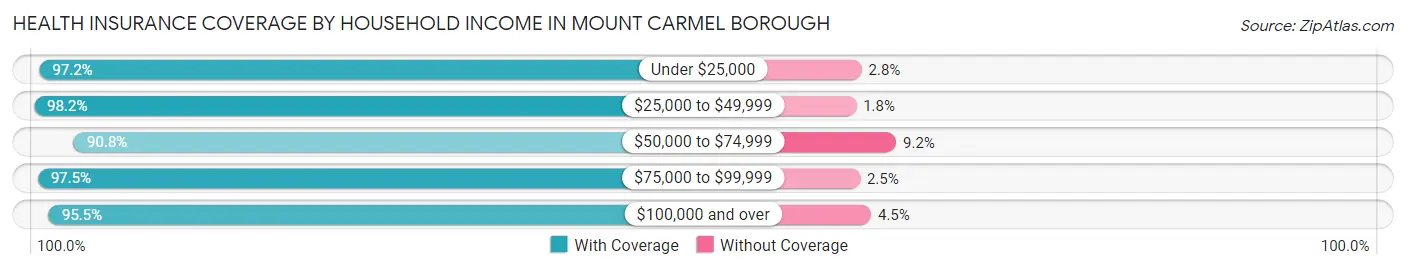
| Household Income | With Coverage | Without Coverage |
| Under $25,000 | 1,118 (97.2%) | 32 (2.8%) |
| $25,000 to $49,999 | 1,384 (98.2%) | 25 (1.8%) |
| $50,000 to $74,999 | 884 (90.8%) | 90 (9.2%) |
| $75,000 to $99,999 | 951 (97.5%) | 24 (2.5%) |
| $100,000 and over | 1,156 (95.5%) | 55 (4.5%) |
Public vs Private Health Insurance Coverage by Age in Mount Carmel borough
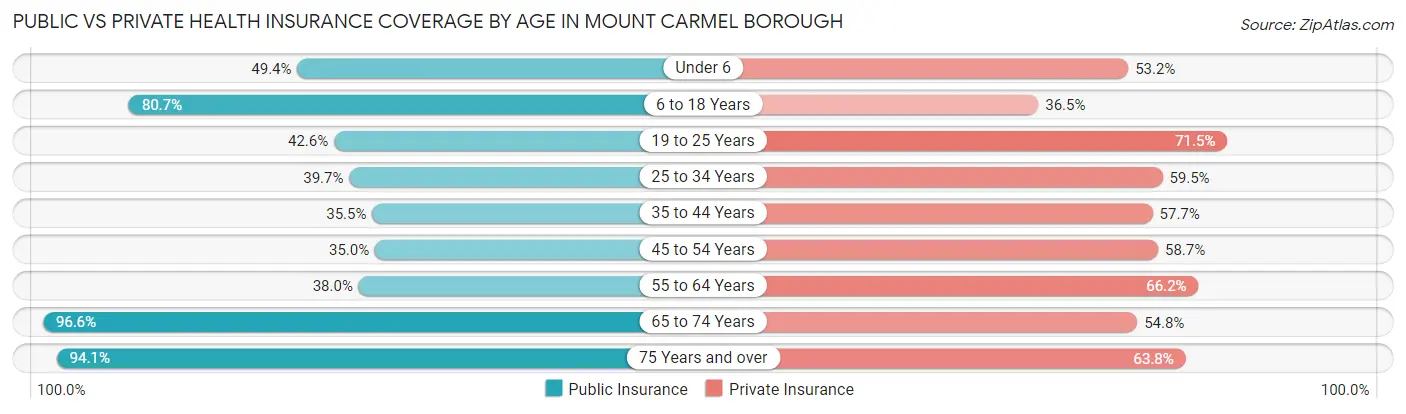
| Age Bracket | Public Insurance | Private Insurance |
| Under 6 | 156 (49.4%) | 168 (53.2%) |
| 6 to 18 Years | 721 (80.6%) | 326 (36.5%) |
| 19 to 25 Years | 166 (42.6%) | 279 (71.5%) |
| 25 to 34 Years | 265 (39.7%) | 397 (59.5%) |
| 35 to 44 Years | 295 (35.5%) | 480 (57.7%) |
| 45 to 54 Years | 209 (34.9%) | 351 (58.7%) |
| 55 to 64 Years | 319 (38.0%) | 556 (66.2%) |
| 65 to 74 Years | 740 (96.6%) | 420 (54.8%) |
| 75 Years and over | 395 (94.1%) | 268 (63.8%) |
| Total | 3,266 (57.1%) | 3,245 (56.7%) |
Disability Status by Sex by Age in Mount Carmel borough
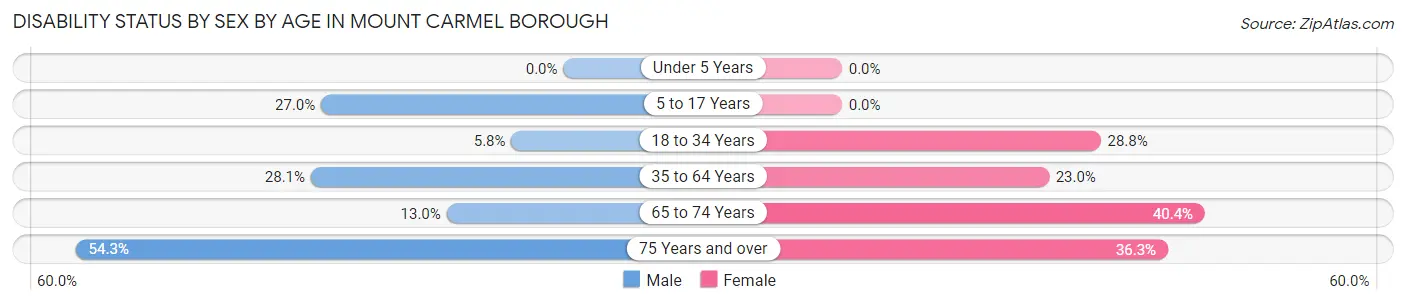
| Age Bracket | Male | Female |
| Under 5 Years | 0 (0.0%) | 0 (0.0%) |
| 5 to 17 Years | 116 (27.0%) | 0 (0.0%) |
| 18 to 34 Years | 30 (5.8%) | 185 (28.8%) |
| 35 to 64 Years | 327 (28.1%) | 255 (23.0%) |
| 65 to 74 Years | 52 (13.0%) | 148 (40.4%) |
| 75 Years and over | 107 (54.3%) | 81 (36.3%) |
Disability Class by Sex by Age in Mount Carmel borough
Disability Class: Hearing Difficulty
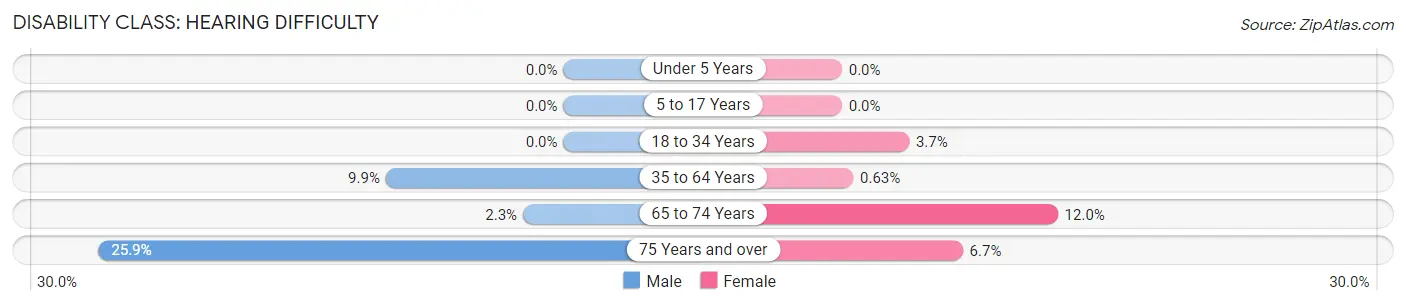
| Age Bracket | Male | Female |
| Under 5 Years | 0 (0.0%) | 0 (0.0%) |
| 5 to 17 Years | 0 (0.0%) | 0 (0.0%) |
| 18 to 34 Years | 0 (0.0%) | 24 (3.7%) |
| 35 to 64 Years | 115 (9.9%) | 7 (0.6%) |
| 65 to 74 Years | 9 (2.2%) | 44 (12.0%) |
| 75 Years and over | 51 (25.9%) | 15 (6.7%) |
Disability Class: Vision Difficulty
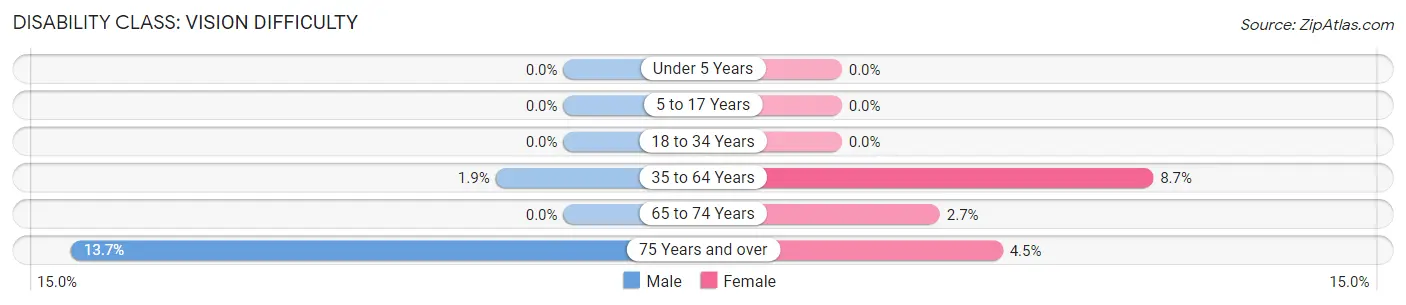
| Age Bracket | Male | Female |
| Under 5 Years | 0 (0.0%) | 0 (0.0%) |
| 5 to 17 Years | 0 (0.0%) | 0 (0.0%) |
| 18 to 34 Years | 0 (0.0%) | 0 (0.0%) |
| 35 to 64 Years | 22 (1.9%) | 96 (8.7%) |
| 65 to 74 Years | 0 (0.0%) | 10 (2.7%) |
| 75 Years and over | 27 (13.7%) | 10 (4.5%) |
Disability Class: Cognitive Difficulty
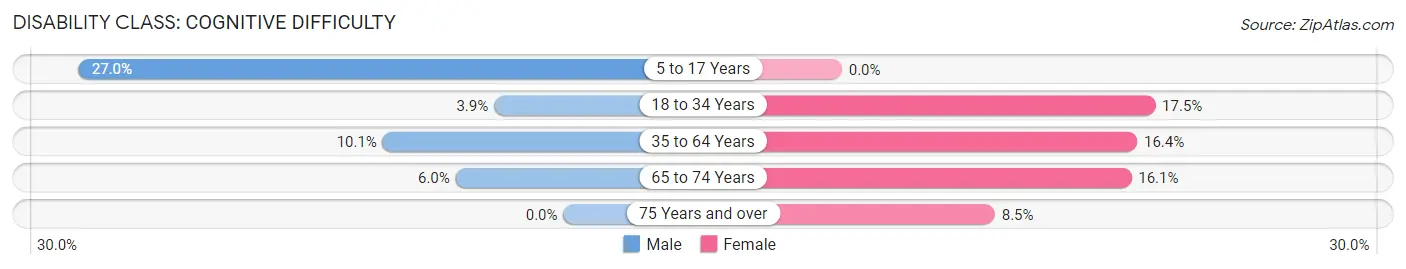
| Age Bracket | Male | Female |
| 5 to 17 Years | 116 (27.0%) | 0 (0.0%) |
| 18 to 34 Years | 20 (3.9%) | 112 (17.4%) |
| 35 to 64 Years | 117 (10.1%) | 182 (16.4%) |
| 65 to 74 Years | 24 (6.0%) | 59 (16.1%) |
| 75 Years and over | 0 (0.0%) | 19 (8.5%) |
Disability Class: Ambulatory Difficulty
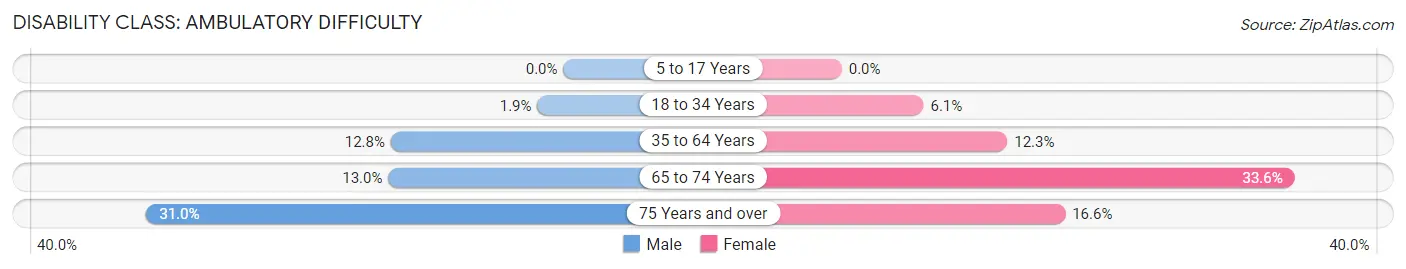
| Age Bracket | Male | Female |
| 5 to 17 Years | 0 (0.0%) | 0 (0.0%) |
| 18 to 34 Years | 10 (1.9%) | 39 (6.1%) |
| 35 to 64 Years | 149 (12.8%) | 136 (12.3%) |
| 65 to 74 Years | 52 (13.0%) | 123 (33.6%) |
| 75 Years and over | 61 (31.0%) | 37 (16.6%) |
Disability Class: Self-Care Difficulty
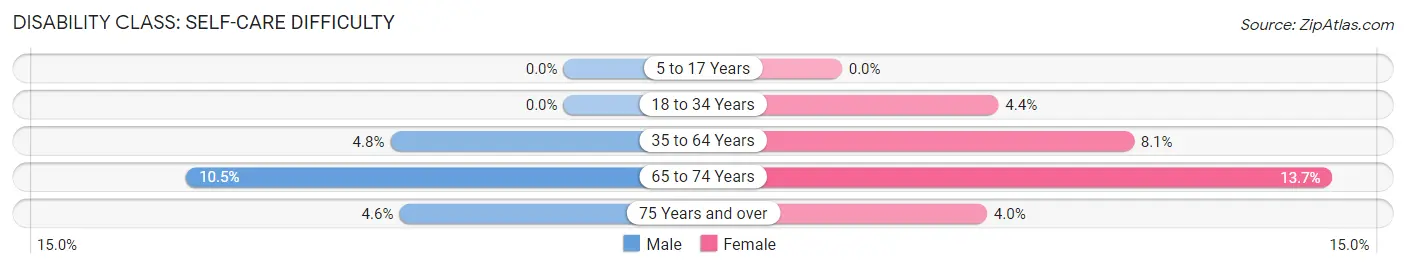
| Age Bracket | Male | Female |
| 5 to 17 Years | 0 (0.0%) | 0 (0.0%) |
| 18 to 34 Years | 0 (0.0%) | 28 (4.4%) |
| 35 to 64 Years | 56 (4.8%) | 90 (8.1%) |
| 65 to 74 Years | 42 (10.5%) | 50 (13.7%) |
| 75 Years and over | 9 (4.6%) | 9 (4.0%) |
Technology Access in Mount Carmel borough
Computing Device Access in Mount Carmel borough
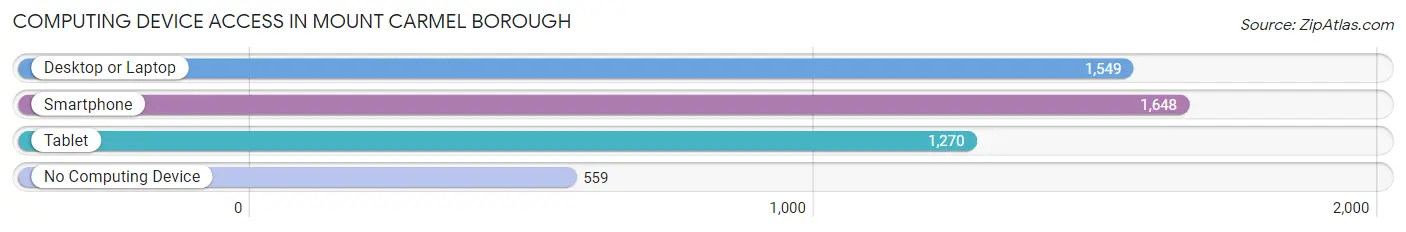
| Device Type | # Households | % Households |
| Desktop or Laptop | 1,549 | 63.5% |
| Smartphone | 1,648 | 67.6% |
| Tablet | 1,270 | 52.1% |
| No Computing Device | 559 | 22.9% |
| Total | 2,438 | 100.0% |
Internet Access in Mount Carmel borough
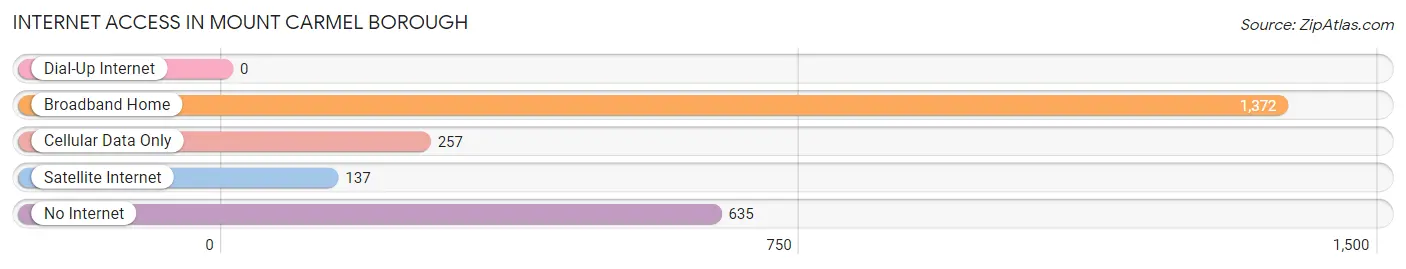
| Internet Type | # Households | % Households |
| Dial-Up Internet | 0 | 0.0% |
| Broadband Home | 1,372 | 56.3% |
| Cellular Data Only | 257 | 10.5% |
| Satellite Internet | 137 | 5.6% |
| No Internet | 635 | 26.1% |
| Total | 2,438 | 100.0% |
Mount Carmel borough Summary
Carmel Borough is a small borough located in Northumberland County, Pennsylvania. It is situated in the Susquehanna Valley, approximately 10 miles south of the city of Sunbury. The borough was incorporated in 1871 and has a population of approximately 1,400 people.
History
The area that is now known as Mount Carmel Borough was originally inhabited by the Susquehannock Indians. The first European settlers arrived in the area in the late 1700s and early 1800s. The first settler was John Miller, who arrived in 1790 and established a farm. The area was known as Miller’s Settlement until 1871, when it was incorporated as Mount Carmel Borough.
The borough was named after Mount Carmel, a mountain in the Holy Land. The name was chosen by the first settlers, who were of German and Irish descent. The borough was originally a farming community, but it soon developed into a small industrial center. The first industry in the area was a sawmill, which was established in 1820. Other industries soon followed, including a grist mill, a tannery, and a brickyard.
Geography
Mount Carmel Borough is located in Northumberland County, Pennsylvania. It is situated in the Susquehanna Valley, approximately 10 miles south of the city of Sunbury. The borough is bordered by the townships of Mount Carmel, Rush, and Upper Mahanoy. The borough covers an area of 0.7 square miles and has a population of approximately 1,400 people.
The terrain of the borough is mostly flat, with some rolling hills. The borough is located in the Appalachian Mountains, and the highest point in the borough is 1,000 feet above sea level. The climate of the borough is humid continental, with hot summers and cold winters.
Economy
The economy of Mount Carmel Borough is largely based on manufacturing and services. The borough is home to several manufacturing companies, including a paper mill, a printing company, and a plastics factory. The borough also has several retail stores, restaurants, and other businesses.
The borough is also home to several educational institutions, including a community college and a technical school. The borough is served by the Northumberland County School District, which operates several elementary and secondary schools in the area.
Demographics
As of the 2010 census, the population of Mount Carmel Borough was 1,400 people. The racial makeup of the borough was 97.3% White, 0.7% African American, 0.3% Native American, 0.3% Asian, and 1.3% from other races. The median household income in the borough was $37,500, and the median family income was $45,000.
The borough is home to a large number of churches, including Catholic, Lutheran, and Methodist churches. The borough also has a large number of parks and recreational facilities, including a public swimming pool, a skate park, and several playgrounds.
Conclusion
Mount Carmel Borough is a small borough located in Northumberland County, Pennsylvania. It is situated in the Susquehanna Valley, approximately 10 miles south of the city of Sunbury. The borough was incorporated in 1871 and has a population of approximately 1,400 people. The economy of the borough is largely based on manufacturing and services, and the borough is home to several educational institutions. The racial makeup of the borough is mostly White, with a small percentage of African American, Native American, and Asian residents. The borough is home to a large number of churches and recreational facilities.
Common Questions
What is Per Capita Income in Mount Carmel borough?
Per Capita income in Mount Carmel borough is $24,233.
What is the Median Family Income in Mount Carmel borough?
Median Family Income in Mount Carmel borough is $58,655.
What is the Median Household income in Mount Carmel borough?
Median Household Income in Mount Carmel borough is $46,375.
What is Income or Wage Gap in Mount Carmel borough?
Income or Wage Gap in Mount Carmel borough is 33.4%.
Women in Mount Carmel borough earn 66.6 cents for every dollar earned by a man.
What is Family Income Deficit in Mount Carmel borough?
Family Income Deficit in Mount Carmel borough is $11,284.
Families that are below poverty line in Mount Carmel borough earn $11,284 less on average than the poverty threshold level.
What is Inequality or Gini Index in Mount Carmel borough?
Inequality or Gini Index in Mount Carmel borough is 0.41.
What is the Total Population of Mount Carmel borough?
Total Population of Mount Carmel borough is 5,723.
What is the Total Male Population of Mount Carmel borough?
Total Male Population of Mount Carmel borough is 2,931.
What is the Total Female Population of Mount Carmel borough?
Total Female Population of Mount Carmel borough is 2,792.
What is the Ratio of Males per 100 Females in Mount Carmel borough?
There are 104.98 Males per 100 Females in Mount Carmel borough.
What is the Ratio of Females per 100 Males in Mount Carmel borough?
There are 95.26 Females per 100 Males in Mount Carmel borough.
What is the Median Population Age in Mount Carmel borough?
Median Population Age in Mount Carmel borough is 42.9 Years.
What is the Average Family Size in Mount Carmel borough
Average Family Size in Mount Carmel borough is 3.0 People.
What is the Average Household Size in Mount Carmel borough
Average Household Size in Mount Carmel borough is 2.4 People.
How Large is the Labor Force in Mount Carmel borough?
There are 2,388 People in the Labor Forcein in Mount Carmel borough.
What is the Percentage of People in the Labor Force in Mount Carmel borough?
49.2% of People are in the Labor Force in Mount Carmel borough.
What is the Unemployment Rate in Mount Carmel borough?
Unemployment Rate in Mount Carmel borough is 7.1%.