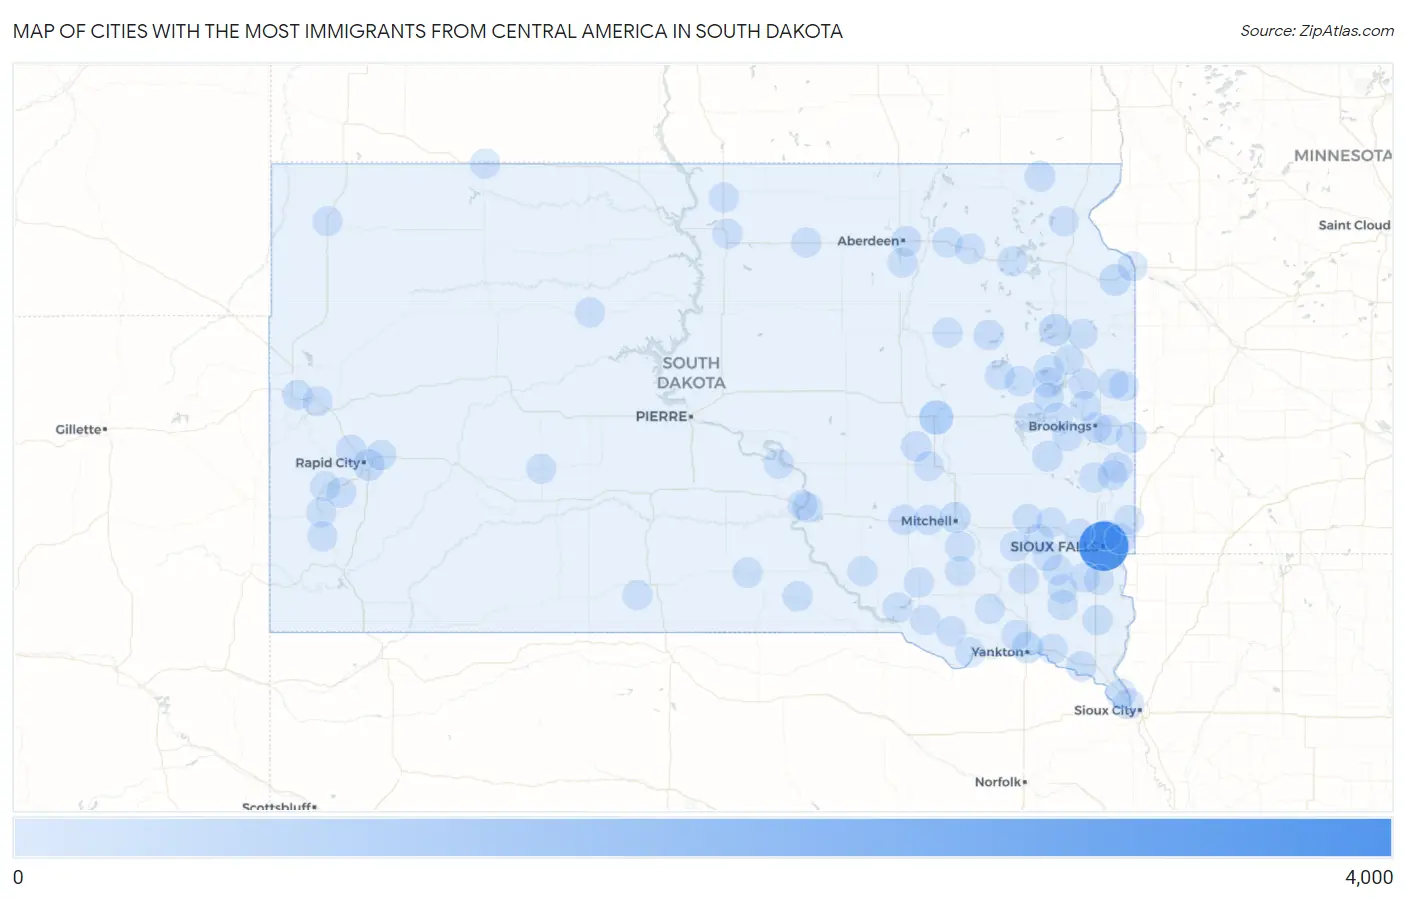
Cities with the Most Immigrants from Central America in South Dakota
RELATED REPORTS & OPTIONS
Central America
South Dakota
Compare Cities
Map of Cities with the Most Immigrants from Central America in South Dakota
0
4,000
Cities with the Most Immigrants from Central America in South Dakota
| City | Central America | vs State | vs National | |
| 1. | Sioux Falls | 3,345 | 7,870(42.50%)#1 | 14,469,050(0.02%)#627 |
| 2. | Huron | 636 | 7,870(8.08%)#2 | 14,469,050(0.00%)#2,140 |
| 3. | Watertown | 293 | 7,870(3.72%)#3 | 14,469,050(0.00%)#3,386 |
| 4. | Yankton | 242 | 7,870(3.07%)#4 | 14,469,050(0.00%)#3,764 |
| 5. | Rapid City | 227 | 7,870(2.88%)#5 | 14,469,050(0.00%)#3,874 |
| 6. | Milbank | 217 | 7,870(2.76%)#6 | 14,469,050(0.00%)#3,960 |
| 7. | Mitchell | 144 | 7,870(1.83%)#7 | 14,469,050(0.00%)#4,896 |
| 8. | Elkton | 136 | 7,870(1.73%)#8 | 14,469,050(0.00%)#5,021 |
| 9. | Veblen | 121 | 7,870(1.54%)#9 | 14,469,050(0.00%)#5,275 |
| 10. | Ramona | 95 | 7,870(1.21%)#10 | 14,469,050(0.00%)#5,853 |
| 11. | Meadow View Addition | 83 | 7,870(1.05%)#11 | 14,469,050(0.00%)#6,190 |
| 12. | Brookings | 72 | 7,870(0.91%)#12 | 14,469,050(0.00%)#6,487 |
| 13. | Beresford | 72 | 7,870(0.91%)#13 | 14,469,050(0.00%)#6,518 |
| 14. | Brandon | 70 | 7,870(0.89%)#14 | 14,469,050(0.00%)#6,568 |
| 15. | Aberdeen | 68 | 7,870(0.86%)#15 | 14,469,050(0.00%)#6,624 |
| 16. | Blackhawk | 68 | 7,870(0.86%)#16 | 14,469,050(0.00%)#6,641 |
| 17. | Flandreau | 67 | 7,870(0.85%)#17 | 14,469,050(0.00%)#6,676 |
| 18. | Plankinton | 65 | 7,870(0.83%)#18 | 14,469,050(0.00%)#6,781 |
| 19. | Estelline | 55 | 7,870(0.70%)#19 | 14,469,050(0.00%)#7,188 |
| 20. | North Sioux City | 52 | 7,870(0.66%)#20 | 14,469,050(0.00%)#7,321 |
| 21. | Lake Norden | 51 | 7,870(0.65%)#21 | 14,469,050(0.00%)#7,390 |
| 22. | Alpena | 50 | 7,870(0.64%)#22 | 14,469,050(0.00%)#7,454 |
| 23. | Freeman | 44 | 7,870(0.56%)#23 | 14,469,050(0.00%)#7,783 |
| 24. | Spearfish | 42 | 7,870(0.53%)#24 | 14,469,050(0.00%)#7,858 |
| 25. | Bryant | 37 | 7,870(0.47%)#25 | 14,469,050(0.00%)#8,218 |
| 26. | Clark | 35 | 7,870(0.44%)#26 | 14,469,050(0.00%)#8,344 |
| 27. | Gregory | 33 | 7,870(0.42%)#27 | 14,469,050(0.00%)#8,477 |
| 28. | Toronto | 32 | 7,870(0.41%)#28 | 14,469,050(0.00%)#8,572 |
| 29. | Vermillion | 30 | 7,870(0.38%)#29 | 14,469,050(0.00%)#8,656 |
| 30. | Viborg | 30 | 7,870(0.38%)#30 | 14,469,050(0.00%)#8,715 |
| 31. | Keystone | 29 | 7,870(0.37%)#31 | 14,469,050(0.00%)#8,803 |
| 32. | Box Elder | 28 | 7,870(0.36%)#32 | 14,469,050(0.00%)#8,818 |
| 33. | Bridgewater | 27 | 7,870(0.34%)#33 | 14,469,050(0.00%)#8,979 |
| 34. | Winner | 26 | 7,870(0.33%)#34 | 14,469,050(0.00%)#9,029 |
| 35. | Selby | 26 | 7,870(0.33%)#35 | 14,469,050(0.00%)#9,065 |
| 36. | Armour | 25 | 7,870(0.32%)#36 | 14,469,050(0.00%)#9,163 |
| 37. | Bruce | 24 | 7,870(0.30%)#37 | 14,469,050(0.00%)#9,293 |
| 38. | Parker | 21 | 7,870(0.27%)#38 | 14,469,050(0.00%)#9,621 |
| 39. | Groton | 20 | 7,870(0.25%)#39 | 14,469,050(0.00%)#9,747 |
| 40. | Gayville | 20 | 7,870(0.25%)#40 | 14,469,050(0.00%)#9,793 |
| 41. | Chamberlain | 19 | 7,870(0.24%)#41 | 14,469,050(0.00%)#9,846 |
| 42. | Ethan | 19 | 7,870(0.24%)#42 | 14,469,050(0.00%)#9,911 |
| 43. | Kranzburg | 19 | 7,870(0.24%)#43 | 14,469,050(0.00%)#9,915 |
| 44. | Custer | 18 | 7,870(0.23%)#44 | 14,469,050(0.00%)#9,986 |
| 45. | Colman | 18 | 7,870(0.23%)#45 | 14,469,050(0.00%)#10,024 |
| 46. | Willow Lake | 18 | 7,870(0.23%)#46 | 14,469,050(0.00%)#10,045 |
| 47. | Jefferson | 16 | 7,870(0.20%)#47 | 14,469,050(0.00%)#10,332 |
| 48. | Oacoma | 16 | 7,870(0.20%)#48 | 14,469,050(0.00%)#10,340 |
| 49. | Cherry Creek | 16 | 7,870(0.20%)#49 | 14,469,050(0.00%)#10,355 |
| 50. | Rosebud | 15 | 7,870(0.19%)#50 | 14,469,050(0.00%)#10,429 |
| 51. | Doland | 15 | 7,870(0.19%)#51 | 14,469,050(0.00%)#10,511 |
| 52. | Pringle | 15 | 7,870(0.19%)#52 | 14,469,050(0.00%)#10,513 |
| 53. | Lennox | 14 | 7,870(0.18%)#53 | 14,469,050(0.00%)#10,577 |
| 54. | Webster | 14 | 7,870(0.18%)#54 | 14,469,050(0.00%)#10,599 |
| 55. | Springfield | 13 | 7,870(0.17%)#55 | 14,469,050(0.00%)#10,739 |
| 56. | Hill City | 13 | 7,870(0.17%)#56 | 14,469,050(0.00%)#10,809 |
| 57. | Mount Vernon | 12 | 7,870(0.15%)#57 | 14,469,050(0.00%)#11,024 |
| 58. | Mound City | 12 | 7,870(0.15%)#58 | 14,469,050(0.00%)#11,064 |
| 59. | Parkston | 11 | 7,870(0.14%)#59 | 14,469,050(0.00%)#11,144 |
| 60. | North Eagle Butte | 11 | 7,870(0.14%)#60 | 14,469,050(0.00%)#11,152 |
| 61. | Hayti | 11 | 7,870(0.14%)#61 | 14,469,050(0.00%)#11,232 |
| 62. | Lower Brule | 10 | 7,870(0.13%)#62 | 14,469,050(0.00%)#11,379 |
| 63. | Hurley | 10 | 7,870(0.13%)#63 | 14,469,050(0.00%)#11,421 |
| 64. | Aurora | 8 | 7,870(0.10%)#64 | 14,469,050(0.00%)#11,785 |
| 65. | Scotland | 8 | 7,870(0.10%)#65 | 14,469,050(0.00%)#11,840 |
| 66. | Montrose | 8 | 7,870(0.10%)#66 | 14,469,050(0.00%)#11,870 |
| 67. | Canistota | 7 | 7,870(0.09%)#67 | 14,469,050(0.00%)#12,123 |
| 68. | Lake Andes | 6 | 7,870(0.08%)#68 | 14,469,050(0.00%)#12,374 |
| 69. | Monroe | 6 | 7,870(0.08%)#69 | 14,469,050(0.00%)#12,477 |
| 70. | Astoria | 6 | 7,870(0.08%)#70 | 14,469,050(0.00%)#12,485 |
| 71. | Andover | 6 | 7,870(0.08%)#71 | 14,469,050(0.00%)#12,503 |
| 72. | Lemmon | 5 | 7,870(0.06%)#72 | 14,469,050(0.00%)#12,621 |
| 73. | Castlewood | 5 | 7,870(0.06%)#73 | 14,469,050(0.00%)#12,675 |
| 74. | Lake Preston | 5 | 7,870(0.06%)#74 | 14,469,050(0.00%)#12,698 |
| 75. | Utica | 5 | 7,870(0.06%)#75 | 14,469,050(0.00%)#12,796 |
| 76. | Hartford | 4 | 7,870(0.05%)#76 | 14,469,050(0.00%)#12,833 |
| 77. | Agency Village | 4 | 7,870(0.05%)#77 | 14,469,050(0.00%)#12,952 |
| 78. | Roscoe | 4 | 7,870(0.05%)#78 | 14,469,050(0.00%)#13,074 |
| 79. | Buffalo | 4 | 7,870(0.05%)#79 | 14,469,050(0.00%)#13,075 |
| 80. | Badger | 4 | 7,870(0.05%)#80 | 14,469,050(0.00%)#13,115 |
| 81. | Worthing | 3 | 7,870(0.04%)#81 | 14,469,050(0.00%)#13,286 |
| 82. | Arlington | 3 | 7,870(0.04%)#82 | 14,469,050(0.00%)#13,303 |
| 83. | Kenel | 3 | 7,870(0.04%)#83 | 14,469,050(0.00%)#13,488 |
| 84. | Wagner | 2 | 7,870(0.03%)#84 | 14,469,050(0.00%)#13,598 |
| 85. | Platte | 2 | 7,870(0.03%)#85 | 14,469,050(0.00%)#13,616 |
| 86. | Garretson | 2 | 7,870(0.03%)#86 | 14,469,050(0.00%)#13,622 |
| 87. | Salem | 2 | 7,870(0.03%)#87 | 14,469,050(0.00%)#13,630 |
| 88. | Whitewood | 2 | 7,870(0.03%)#88 | 14,469,050(0.00%)#13,669 |
| 89. | Big Stone City | 2 | 7,870(0.03%)#89 | 14,469,050(0.00%)#13,683 |
| 90. | Avon | 2 | 7,870(0.03%)#90 | 14,469,050(0.00%)#13,690 |
| 91. | Warner | 2 | 7,870(0.03%)#91 | 14,469,050(0.00%)#13,754 |
| 92. | Egan | 2 | 7,870(0.03%)#92 | 14,469,050(0.00%)#13,859 |
| 93. | Sinai | 2 | 7,870(0.03%)#93 | 14,469,050(0.00%)#13,890 |
| 94. | Woonsocket | 1 | 7,870(0.01%)#94 | 14,469,050(0.00%)#14,104 |
| 95. | Philip | 1 | 7,870(0.01%)#95 | 14,469,050(0.00%)#14,138 |
1
2Common Questions
What are the Top 10 Cities with the Most Immigrants from Central America in South Dakota?
Top 10 Cities with the Most Immigrants from Central America in South Dakota are:
#1
3,345
#2
636
#3
293
#4
242
#5
227
#6
217
#7
144
#8
136
#9
121
#10
95
What city has the Most Immigrants from Central America in South Dakota?
Sioux Falls has the Most Immigrants from Central America in South Dakota with 3,345.
What is the Total Immigrants from Central America in the State of South Dakota?
Total Immigrants from Central America in South Dakota is 7,870.
What is the Total Immigrants from Central America in the United States?
Total Immigrants from Central America in the United States is 14,469,050.