Lehighton borough, PA Map & Demographics
Lehighton borough Overview
$29,253
PER CAPITA INCOME
$77,964
AVG FAMILY INCOME
$59,940
AVG HOUSEHOLD INCOME
16.4%
WAGE / INCOME GAP [ % ]
83.6¢/ $1
WAGE / INCOME GAP [ $ ]
0.40
INEQUALITY / GINI INDEX
5,279
TOTAL POPULATION
2,567
MALE POPULATION
2,712
FEMALE POPULATION
94.65
MALES / 100 FEMALES
105.65
FEMALES / 100 MALES
42.1
MEDIAN AGE
3.0
AVG FAMILY SIZE
2.5
AVG HOUSEHOLD SIZE
2,578
LABOR FORCE [ PEOPLE ]
61.2%
PERCENT IN LABOR FORCE
9.4%
UNEMPLOYMENT RATE
Income in Lehighton borough
Income Overview in Lehighton borough
Per Capita Income in Lehighton borough is $29,253, while median incomes of families and households are $77,964 and $59,940 respectively.
| Characteristic | Number | Measure |
| Per Capita Income | 5,279 | $29,253 |
| Median Family Income | 1,263 | $77,964 |
| Mean Family Income | 1,263 | $82,763 |
| Median Household Income | 2,056 | $59,940 |
| Mean Household Income | 2,056 | $73,466 |
| Income Deficit | 1,263 | $0 |
| Wage / Income Gap (%) | 5,279 | 16.45% |
| Wage / Income Gap ($) | 5,279 | 83.55¢ per $1 |
| Gini / Inequality Index | 5,279 | 0.40 |
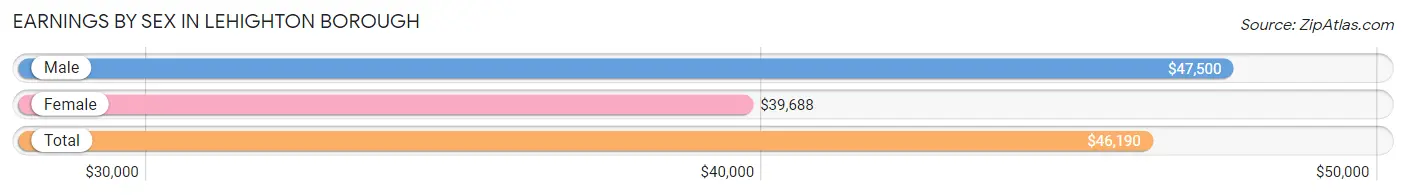
Earnings by Sex in Lehighton borough
Average Earnings in Lehighton borough are $46,190, $47,500 for men and $39,688 for women, a difference of 16.5%.
| Sex | Number | Average Earnings |
| Male | 1,254 (47.9%) | $47,500 |
| Female | 1,365 (52.1%) | $39,688 |
| Total | 2,619 (100.0%) | $46,190 |
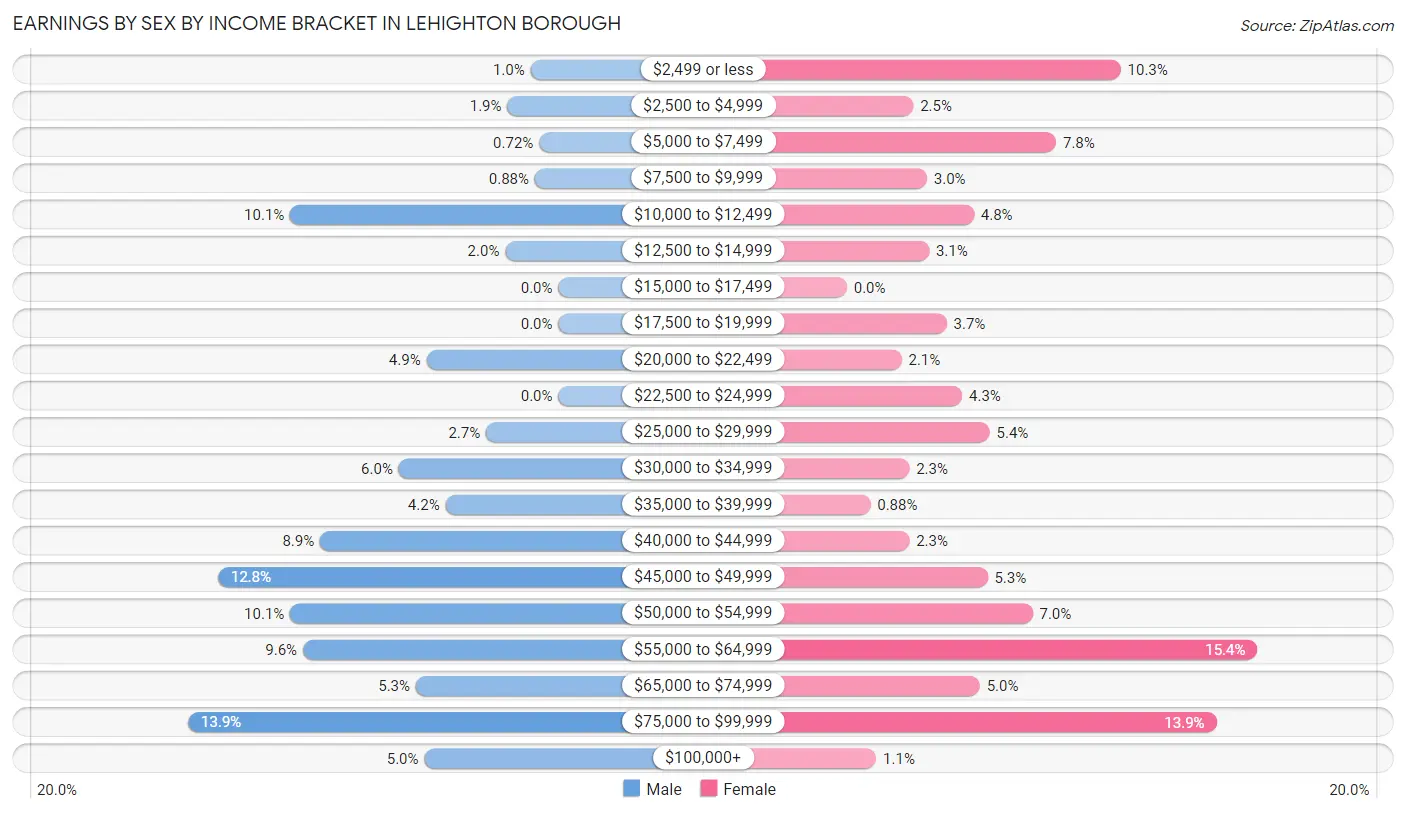
Earnings by Sex by Income Bracket in Lehighton borough
The most common earnings brackets in Lehighton borough are $75,000 to $99,999 for men (174 | 13.9%) and $55,000 to $64,999 for women (210 | 15.4%).
| Income | Male | Female |
| $2,499 or less | 13 (1.0%) | 140 (10.3%) |
| $2,500 to $4,999 | 24 (1.9%) | 34 (2.5%) |
| $5,000 to $7,499 | 9 (0.7%) | 107 (7.8%) |
| $7,500 to $9,999 | 11 (0.9%) | 41 (3.0%) |
| $10,000 to $12,499 | 126 (10.1%) | 65 (4.8%) |
| $12,500 to $14,999 | 25 (2.0%) | 42 (3.1%) |
| $15,000 to $17,499 | 0 (0.0%) | 0 (0.0%) |
| $17,500 to $19,999 | 0 (0.0%) | 51 (3.7%) |
| $20,000 to $22,499 | 62 (4.9%) | 28 (2.1%) |
| $22,500 to $24,999 | 0 (0.0%) | 59 (4.3%) |
| $25,000 to $29,999 | 34 (2.7%) | 73 (5.3%) |
| $30,000 to $34,999 | 75 (6.0%) | 32 (2.3%) |
| $35,000 to $39,999 | 53 (4.2%) | 12 (0.9%) |
| $40,000 to $44,999 | 112 (8.9%) | 32 (2.3%) |
| $45,000 to $49,999 | 160 (12.8%) | 72 (5.3%) |
| $50,000 to $54,999 | 126 (10.1%) | 95 (7.0%) |
| $55,000 to $64,999 | 120 (9.6%) | 210 (15.4%) |
| $65,000 to $74,999 | 67 (5.3%) | 68 (5.0%) |
| $75,000 to $99,999 | 174 (13.9%) | 189 (13.9%) |
| $100,000+ | 63 (5.0%) | 15 (1.1%) |
| Total | 1,254 (100.0%) | 1,365 (100.0%) |
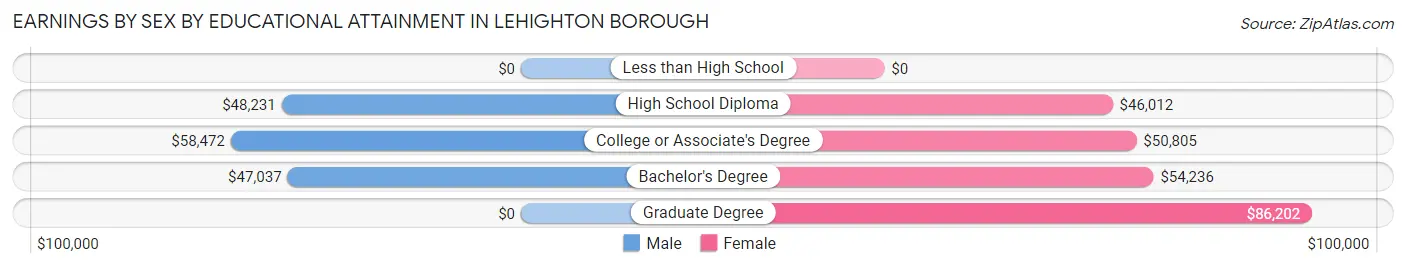
Earnings by Sex by Educational Attainment in Lehighton borough
Average earnings in Lehighton borough are $48,766 for men and $51,441 for women, a difference of 5.2%. Men with an educational attainment of college or associate's degree enjoy the highest average annual earnings of $58,472, while those with bachelor's degree education earn the least with $47,037. Women with an educational attainment of graduate degree earn the most with the average annual earnings of $86,202, while those with high school diploma education have the smallest earnings of $46,012.
| Educational Attainment | Male Income | Female Income |
| Less than High School | - | - |
| High School Diploma | $48,231 | $46,012 |
| College or Associate's Degree | $58,472 | $50,805 |
| Bachelor's Degree | $47,037 | $54,236 |
| Graduate Degree | - | - |
| Total | $48,766 | $51,441 |
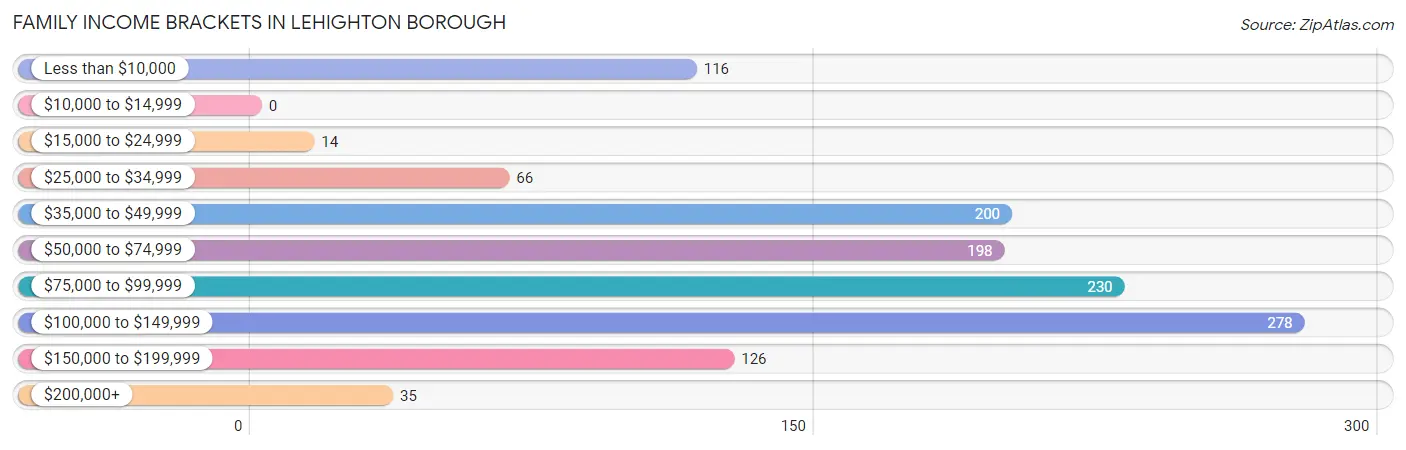
Family Income in Lehighton borough
Family Income Brackets in Lehighton borough
According to the Lehighton borough family income data, there are 278 families falling into the $100,000 to $149,999 income range, which is the most common income bracket and makes up 22.0% of all families.
| Income Bracket | # Families | % Families |
| Less than $10,000 | 116 | 9.2% |
| $10,000 to $14,999 | 0 | 0.0% |
| $15,000 to $24,999 | 14 | 1.1% |
| $25,000 to $34,999 | 66 | 5.2% |
| $35,000 to $49,999 | 200 | 15.8% |
| $50,000 to $74,999 | 198 | 15.7% |
| $75,000 to $99,999 | 230 | 18.2% |
| $100,000 to $149,999 | 278 | 22.0% |
| $150,000 to $199,999 | 126 | 10.0% |
| $200,000+ | 35 | 2.8% |
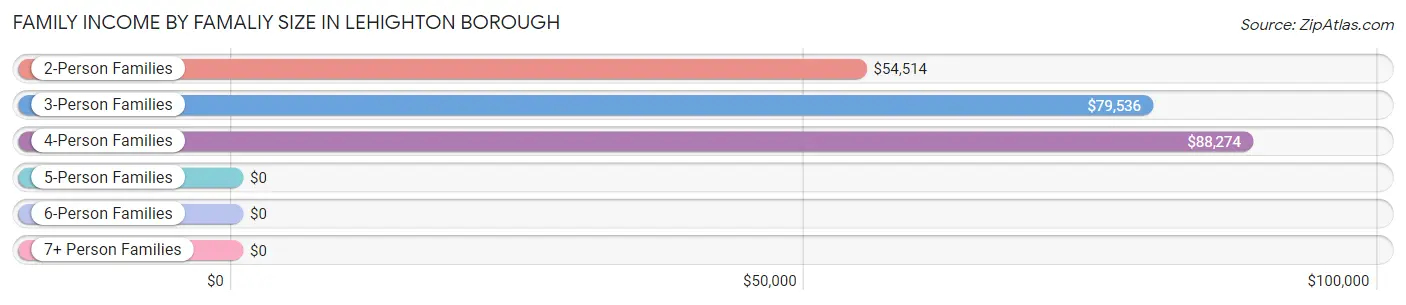
Family Income by Famaliy Size in Lehighton borough
4-person families (269 | 21.3%) account for the highest median family income in Lehighton borough with $88,274 per family, while 2-person families (613 | 48.5%) have the highest median income of $27,257 per family member.
| Income Bracket | # Families | Median Income |
| 2-Person Families | 613 (48.5%) | $54,514 |
| 3-Person Families | 289 (22.9%) | $79,536 |
| 4-Person Families | 269 (21.3%) | $88,274 |
| 5-Person Families | 92 (7.3%) | $0 |
| 6-Person Families | 0 (0.0%) | $0 |
| 7+ Person Families | 0 (0.0%) | $0 |
| Total | 1,263 (100.0%) | $77,964 |
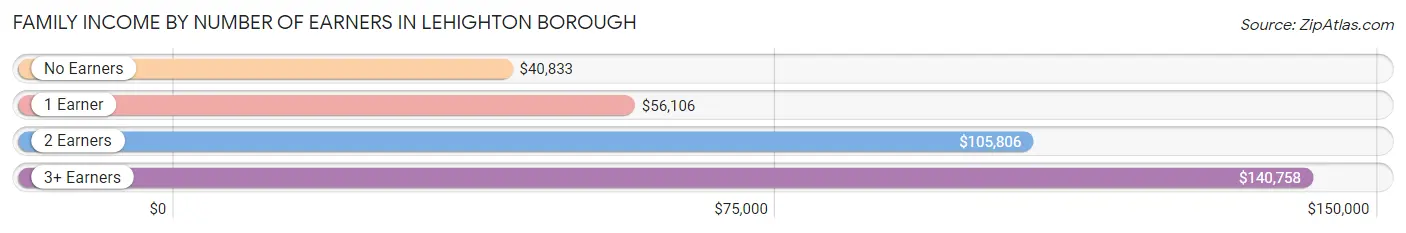
Family Income by Number of Earners in Lehighton borough
The median family income in Lehighton borough is $77,964, with families comprising 3+ earners (116) having the highest median family income of $140,758, while families with no earners (206) have the lowest median family income of $40,833, accounting for 9.2% and 16.3% of families, respectively.
| Number of Earners | # Families | Median Income |
| No Earners | 206 (16.3%) | $40,833 |
| 1 Earner | 527 (41.7%) | $56,106 |
| 2 Earners | 414 (32.8%) | $105,806 |
| 3+ Earners | 116 (9.2%) | $140,758 |
| Total | 1,263 (100.0%) | $77,964 |
Household Income in Lehighton borough
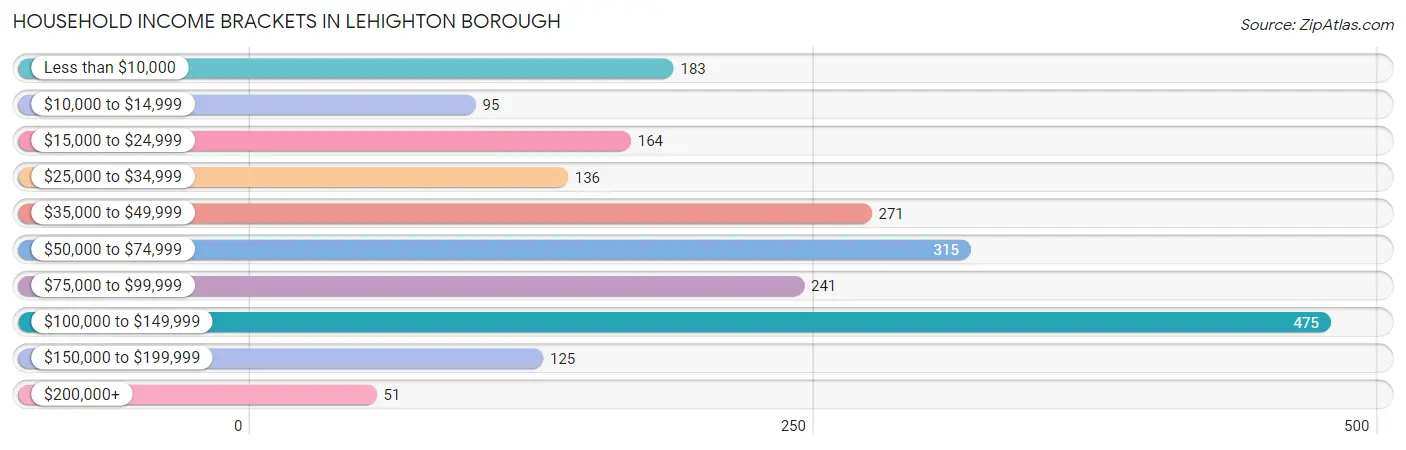
Household Income Brackets in Lehighton borough
With 475 households falling in the category, the $100,000 to $149,999 income range is the most frequent in Lehighton borough, accounting for 23.1% of all households. In contrast, only 51 households (2.5%) fall into the $200,000+ income bracket, making it the least populous group.
| Income Bracket | # Households | % Households |
| Less than $10,000 | 183 | 8.9% |
| $10,000 to $14,999 | 95 | 4.6% |
| $15,000 to $24,999 | 164 | 8.0% |
| $25,000 to $34,999 | 136 | 6.6% |
| $35,000 to $49,999 | 271 | 13.2% |
| $50,000 to $74,999 | 315 | 15.3% |
| $75,000 to $99,999 | 241 | 11.7% |
| $100,000 to $149,999 | 475 | 23.1% |
| $150,000 to $199,999 | 125 | 6.1% |
| $200,000+ | 51 | 2.5% |
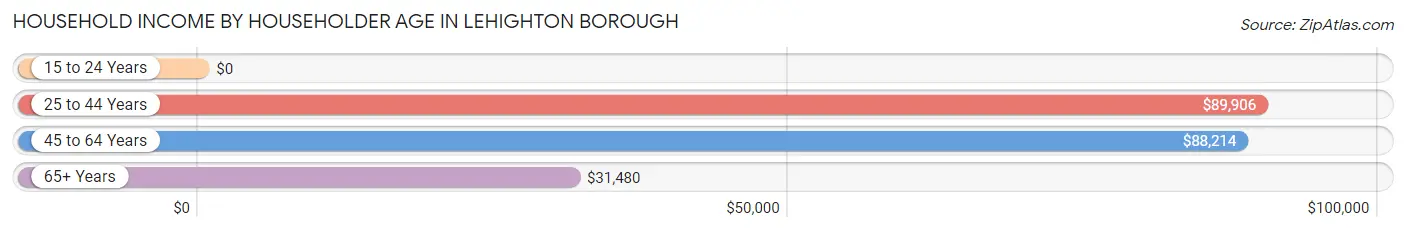
Household Income by Householder Age in Lehighton borough
The median household income in Lehighton borough is $59,940, with the highest median household income of $89,906 found in the 25 to 44 years age bracket for the primary householder. A total of 517 households (25.2%) fall into this category. Meanwhile, the 15 to 24 years age bracket for the primary householder has the lowest median household income of $0, with 162 households (7.9%) in this group.
| Income Bracket | # Households | Median Income |
| 15 to 24 Years | 162 (7.9%) | $0 |
| 25 to 44 Years | 517 (25.2%) | $89,906 |
| 45 to 64 Years | 792 (38.5%) | $88,214 |
| 65+ Years | 585 (28.4%) | $31,480 |
| Total | 2,056 (100.0%) | $59,940 |
Poverty in Lehighton borough
Income Below Poverty by Sex and Age in Lehighton borough
With 17.5% poverty level for males and 11.3% for females among the residents of Lehighton borough, 15 year old males and 18 to 24 year old females are the most vulnerable to poverty, with 22 males (100.0%) and 99 females (35.1%) in their respective age groups living below the poverty level.
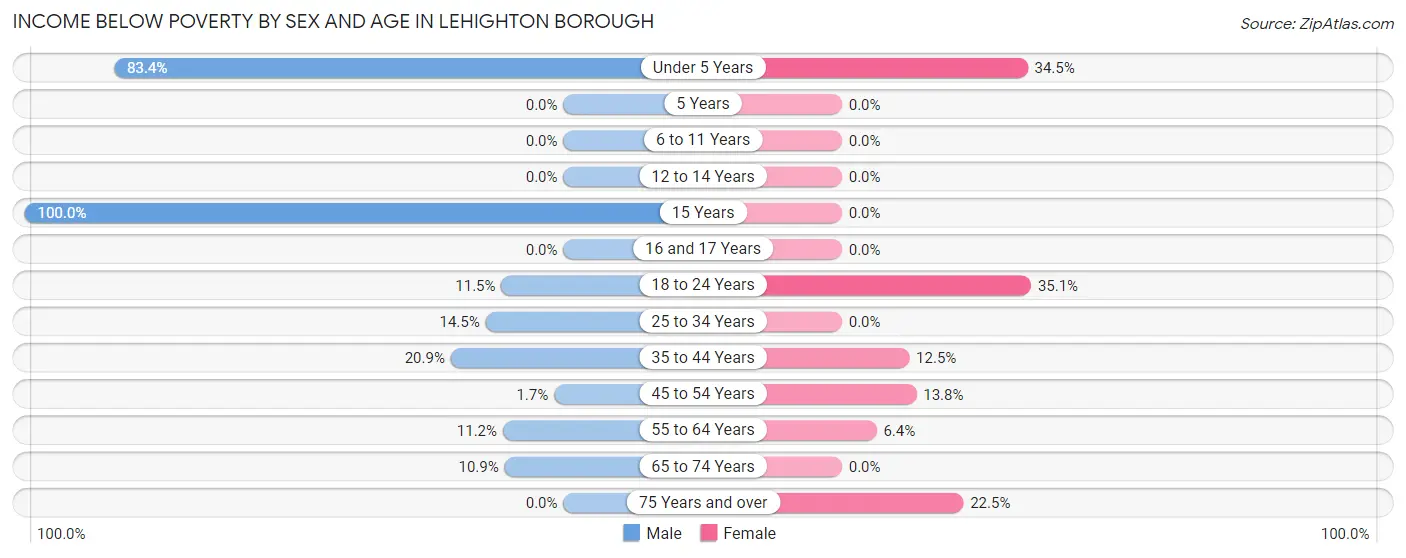
| Age Bracket | Male | Female |
| Under 5 Years | 196 (83.4%) | 20 (34.5%) |
| 5 Years | 0 (0.0%) | 0 (0.0%) |
| 6 to 11 Years | 0 (0.0%) | 0 (0.0%) |
| 12 to 14 Years | 0 (0.0%) | 0 (0.0%) |
| 15 Years | 22 (100.0%) | 0 (0.0%) |
| 16 and 17 Years | 0 (0.0%) | 0 (0.0%) |
| 18 to 24 Years | 16 (11.5%) | 99 (35.1%) |
| 25 to 34 Years | 49 (14.4%) | 0 (0.0%) |
| 35 to 44 Years | 93 (20.9%) | 32 (12.5%) |
| 45 to 54 Years | 4 (1.7%) | 59 (13.8%) |
| 55 to 64 Years | 31 (11.2%) | 17 (6.4%) |
| 65 to 74 Years | 36 (10.9%) | 0 (0.0%) |
| 75 Years and over | 0 (0.0%) | 71 (22.5%) |
| Total | 447 (17.5%) | 298 (11.3%) |
Income Above Poverty by Sex and Age in Lehighton borough
According to the poverty statistics in Lehighton borough, males aged 6 to 11 years and females aged 5 years are the age groups that are most secure financially, with 100.0% of males and 100.0% of females in these age groups living above the poverty line.
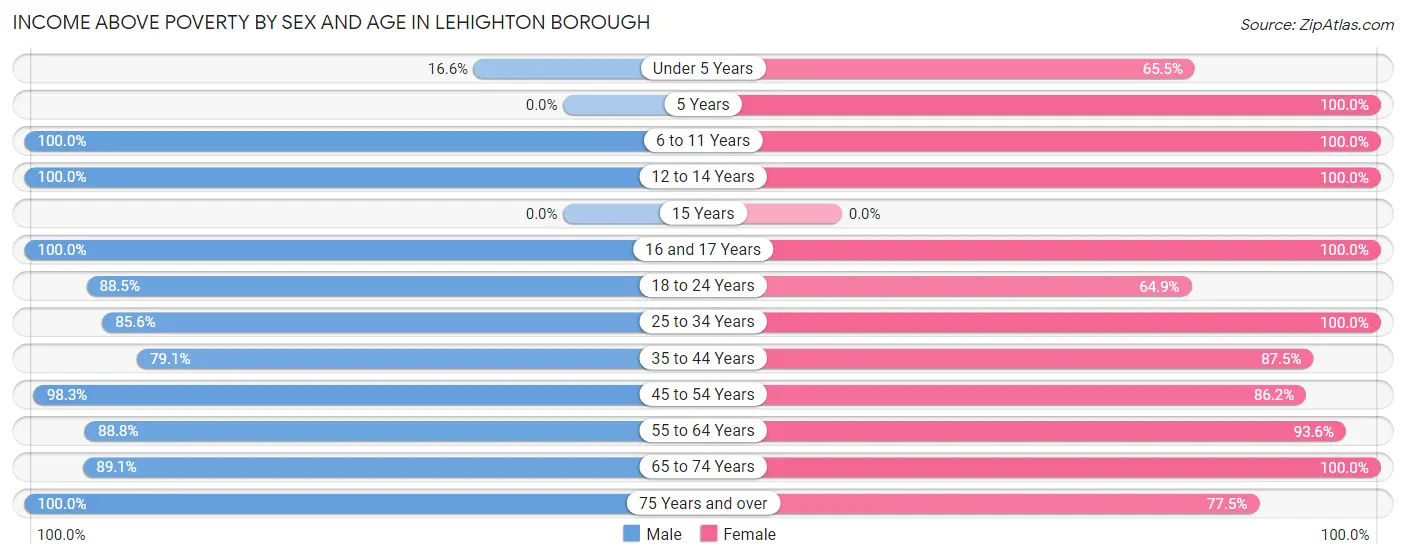
| Age Bracket | Male | Female |
| Under 5 Years | 39 (16.6%) | 38 (65.5%) |
| 5 Years | 0 (0.0%) | 26 (100.0%) |
| 6 to 11 Years | 72 (100.0%) | 244 (100.0%) |
| 12 to 14 Years | 276 (100.0%) | 133 (100.0%) |
| 15 Years | 0 (0.0%) | 0 (0.0%) |
| 16 and 17 Years | 31 (100.0%) | 109 (100.0%) |
| 18 to 24 Years | 123 (88.5%) | 183 (64.9%) |
| 25 to 34 Years | 290 (85.6%) | 294 (100.0%) |
| 35 to 44 Years | 352 (79.1%) | 224 (87.5%) |
| 45 to 54 Years | 227 (98.3%) | 368 (86.2%) |
| 55 to 64 Years | 245 (88.8%) | 247 (93.6%) |
| 65 to 74 Years | 294 (89.1%) | 227 (100.0%) |
| 75 Years and over | 157 (100.0%) | 244 (77.5%) |
| Total | 2,106 (82.5%) | 2,337 (88.7%) |
Income Below Poverty Among Married-Couple Families in Lehighton borough
The poverty statistics for married-couple families in Lehighton borough show that 2.1% or 17 of the total 818 families live below the poverty line. Families with no children have the highest poverty rate of 3.8%, comprising of 17 families. On the other hand, families with 1 or 2 children have the lowest poverty rate of 0.0%, which includes 0 families.
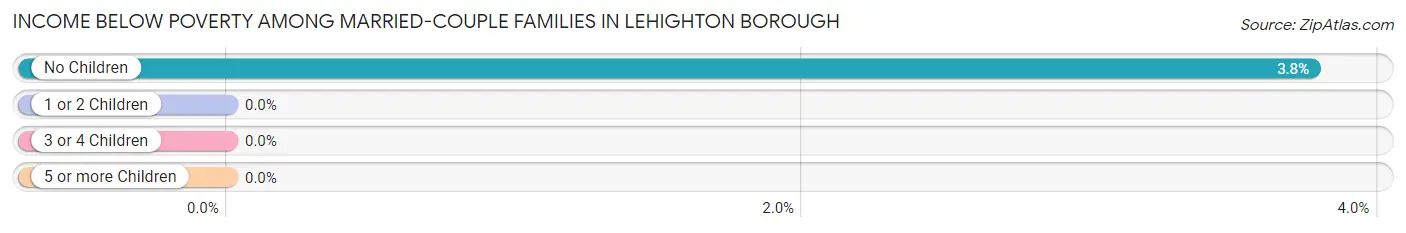
| Children | Above Poverty | Below Poverty |
| No Children | 434 (96.2%) | 17 (3.8%) |
| 1 or 2 Children | 286 (100.0%) | 0 (0.0%) |
| 3 or 4 Children | 81 (100.0%) | 0 (0.0%) |
| 5 or more Children | 0 (0.0%) | 0 (0.0%) |
| Total | 801 (97.9%) | 17 (2.1%) |
Income Below Poverty Among Single-Parent Households in Lehighton borough
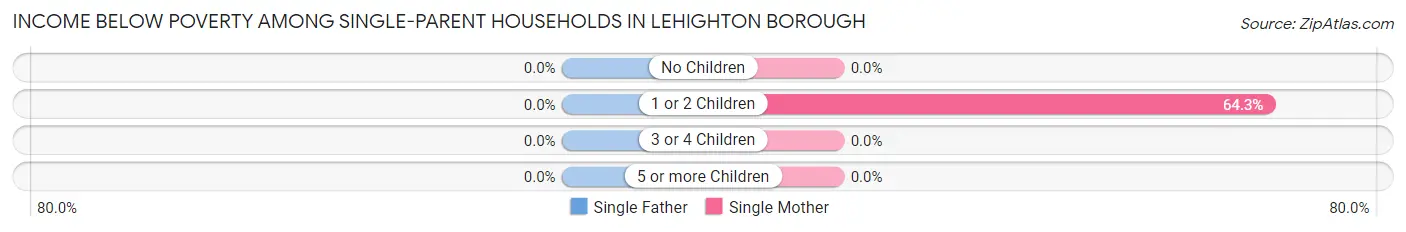
| Children | Single Father | Single Mother |
| No Children | 0 (0.0%) | 0 (0.0%) |
| 1 or 2 Children | 0 (0.0%) | 99 (64.3%) |
| 3 or 4 Children | 0 (0.0%) | 0 (0.0%) |
| 5 or more Children | 0 (0.0%) | 0 (0.0%) |
| Total | 0 (0.0%) | 99 (33.9%) |
Income Below Poverty Among Married-Couple vs Single-Parent Households in Lehighton borough
The poverty data for Lehighton borough shows that 17 of the married-couple family households (2.1%) and 99 of the single-parent households (22.3%) are living below the poverty level. Within the married-couple family households, those with no children have the highest poverty rate, with 17 households (3.8%) falling below the poverty line. Among the single-parent households, those with 1 or 2 children have the highest poverty rate, with 99 household (42.1%) living below poverty.
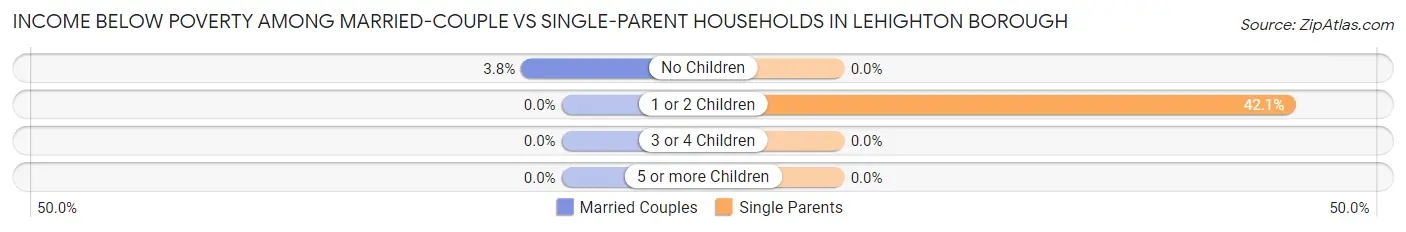
| Children | Married-Couple Families | Single-Parent Households |
| No Children | 17 (3.8%) | 0 (0.0%) |
| 1 or 2 Children | 0 (0.0%) | 99 (42.1%) |
| 3 or 4 Children | 0 (0.0%) | 0 (0.0%) |
| 5 or more Children | 0 (0.0%) | 0 (0.0%) |
| Total | 17 (2.1%) | 99 (22.3%) |
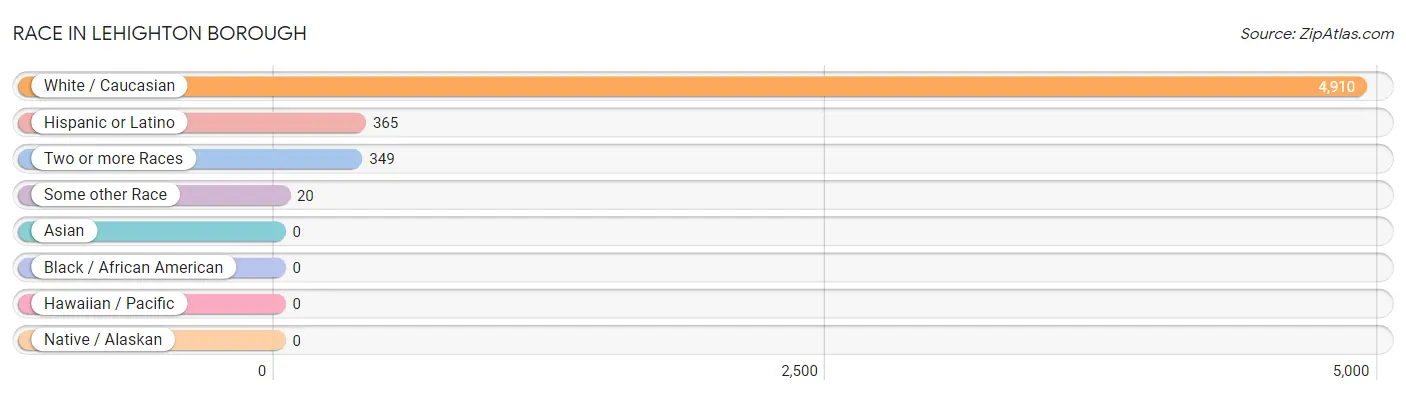
Race in Lehighton borough
The most populous races in Lehighton borough are White / Caucasian (4,910 | 93.0%), Hispanic or Latino (365 | 6.9%), and Two or more Races (349 | 6.6%).
| Race | # Population | % Population |
| Asian | 0 | 0.0% |
| Black / African American | 0 | 0.0% |
| Hawaiian / Pacific | 0 | 0.0% |
| Hispanic or Latino | 365 | 6.9% |
| Native / Alaskan | 0 | 0.0% |
| White / Caucasian | 4,910 | 93.0% |
| Two or more Races | 349 | 6.6% |
| Some other Race | 20 | 0.4% |
| Total | 5,279 | 100.0% |
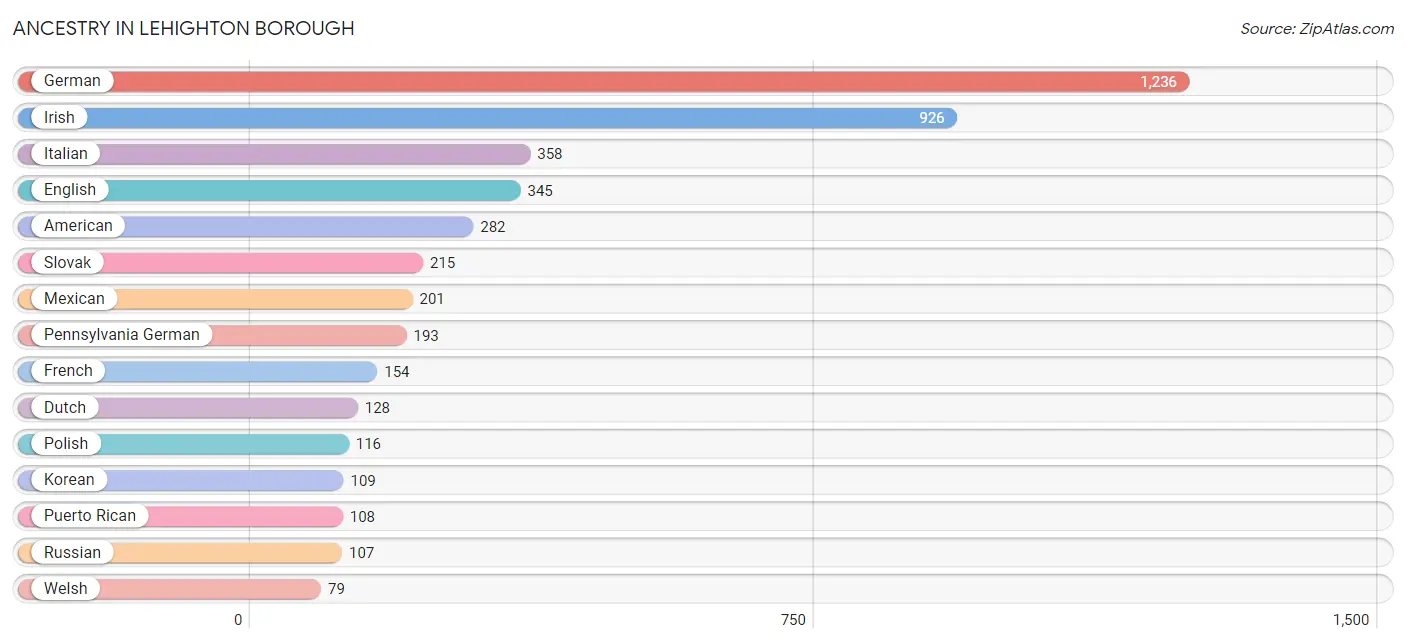
Ancestry in Lehighton borough
The most populous ancestries reported in Lehighton borough are German (1,236 | 23.4%), Irish (926 | 17.5%), Italian (358 | 6.8%), English (345 | 6.5%), and American (282 | 5.3%), together accounting for 59.6% of all Lehighton borough residents.
| Ancestry | # Population | % Population |
| American | 282 | 5.3% |
| Austrian | 70 | 1.3% |
| Central American | 34 | 0.6% |
| Cherokee | 72 | 1.4% |
| Dutch | 128 | 2.4% |
| Eastern European | 18 | 0.3% |
| English | 345 | 6.5% |
| European | 62 | 1.2% |
| Finnish | 12 | 0.2% |
| French | 154 | 2.9% |
| German | 1,236 | 23.4% |
| Greek | 43 | 0.8% |
| Hungarian | 18 | 0.3% |
| Irish | 926 | 17.5% |
| Italian | 358 | 6.8% |
| Korean | 109 | 2.1% |
| Lithuanian | 32 | 0.6% |
| Mexican | 201 | 3.8% |
| Nicaraguan | 34 | 0.6% |
| Pennsylvania German | 193 | 3.7% |
| Polish | 116 | 2.2% |
| Puerto Rican | 108 | 2.1% |
| Romanian | 16 | 0.3% |
| Russian | 107 | 2.0% |
| Scotch-Irish | 77 | 1.5% |
| Scottish | 28 | 0.5% |
| Sioux | 68 | 1.3% |
| Slavic | 75 | 1.4% |
| Slovak | 215 | 4.1% |
| Spaniard | 22 | 0.4% |
| Ukrainian | 42 | 0.8% |
| Welsh | 79 | 1.5% | View All 32 Rows |
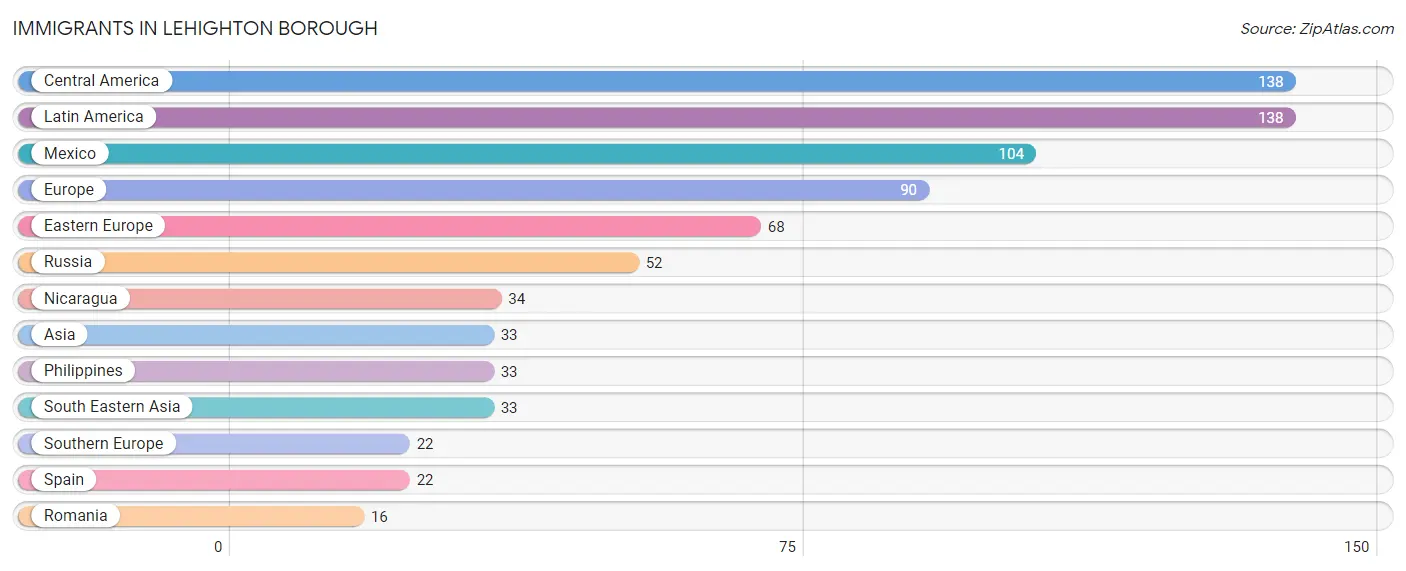
Immigrants in Lehighton borough
The most numerous immigrant groups reported in Lehighton borough came from Central America (138 | 2.6%), Latin America (138 | 2.6%), Mexico (104 | 2.0%), Europe (90 | 1.7%), and Eastern Europe (68 | 1.3%), together accounting for 10.2% of all Lehighton borough residents.
| Immigration Origin | # Population | % Population |
| Asia | 33 | 0.6% |
| Central America | 138 | 2.6% |
| Eastern Europe | 68 | 1.3% |
| Europe | 90 | 1.7% |
| Latin America | 138 | 2.6% |
| Mexico | 104 | 2.0% |
| Nicaragua | 34 | 0.6% |
| Philippines | 33 | 0.6% |
| Romania | 16 | 0.3% |
| Russia | 52 | 1.0% |
| South Eastern Asia | 33 | 0.6% |
| Southern Europe | 22 | 0.4% |
| Spain | 22 | 0.4% | View All 13 Rows |
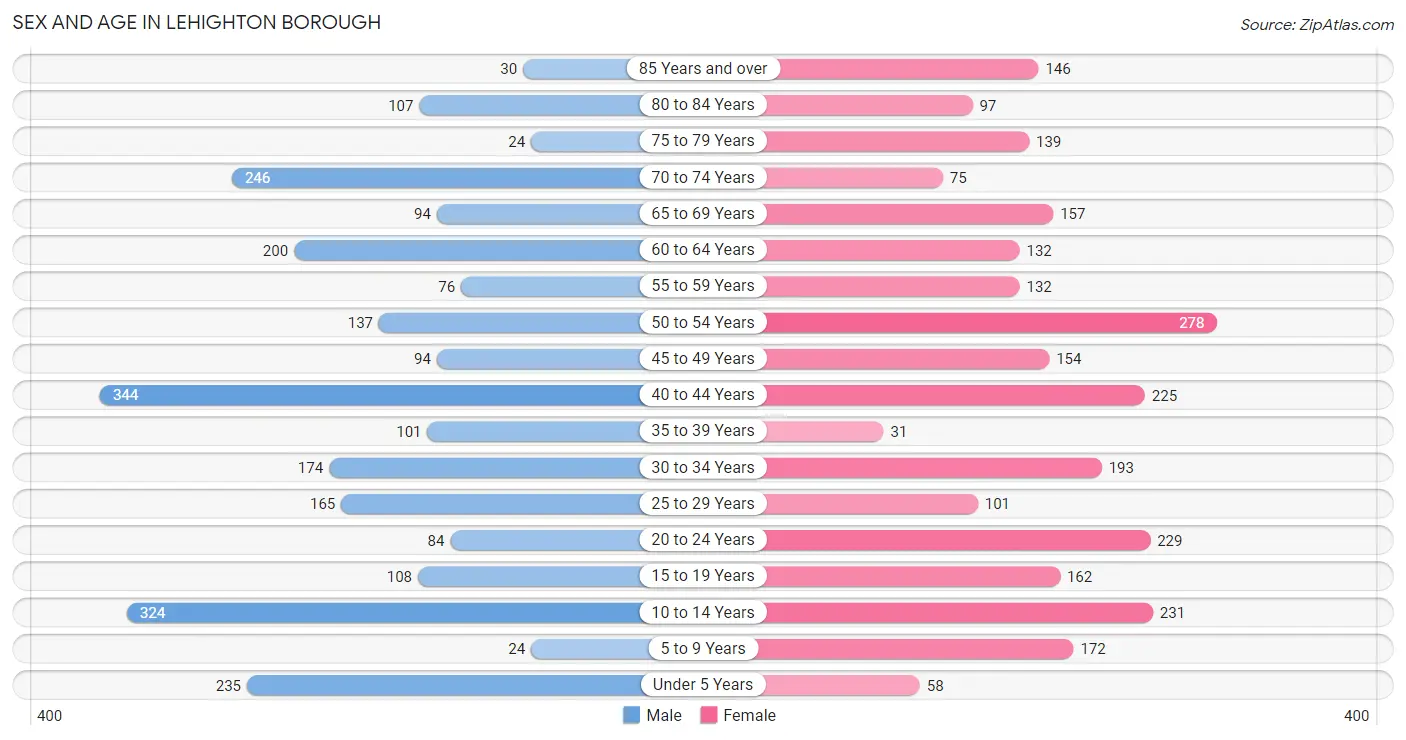
Sex and Age in Lehighton borough
Sex and Age in Lehighton borough
The most populous age groups in Lehighton borough are 40 to 44 Years (344 | 13.4%) for men and 50 to 54 Years (278 | 10.2%) for women.
| Age Bracket | Male | Female |
| Under 5 Years | 235 (9.1%) | 58 (2.1%) |
| 5 to 9 Years | 24 (0.9%) | 172 (6.3%) |
| 10 to 14 Years | 324 (12.6%) | 231 (8.5%) |
| 15 to 19 Years | 108 (4.2%) | 162 (6.0%) |
| 20 to 24 Years | 84 (3.3%) | 229 (8.4%) |
| 25 to 29 Years | 165 (6.4%) | 101 (3.7%) |
| 30 to 34 Years | 174 (6.8%) | 193 (7.1%) |
| 35 to 39 Years | 101 (3.9%) | 31 (1.1%) |
| 40 to 44 Years | 344 (13.4%) | 225 (8.3%) |
| 45 to 49 Years | 94 (3.7%) | 154 (5.7%) |
| 50 to 54 Years | 137 (5.3%) | 278 (10.2%) |
| 55 to 59 Years | 76 (3.0%) | 132 (4.9%) |
| 60 to 64 Years | 200 (7.8%) | 132 (4.9%) |
| 65 to 69 Years | 94 (3.7%) | 157 (5.8%) |
| 70 to 74 Years | 246 (9.6%) | 75 (2.8%) |
| 75 to 79 Years | 24 (0.9%) | 139 (5.1%) |
| 80 to 84 Years | 107 (4.2%) | 97 (3.6%) |
| 85 Years and over | 30 (1.2%) | 146 (5.4%) |
| Total | 2,567 (100.0%) | 2,712 (100.0%) |
Families and Households in Lehighton borough
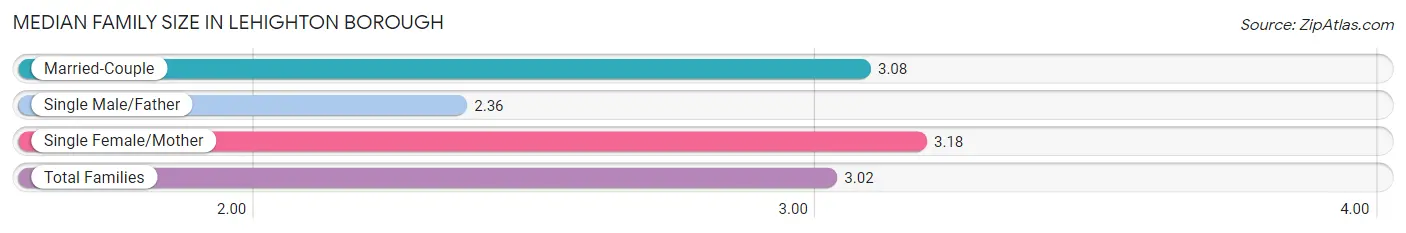
Median Family Size in Lehighton borough
The median family size in Lehighton borough is 3.02 persons per family, with single female/mother families (292 | 23.1%) accounting for the largest median family size of 3.18 persons per family. On the other hand, single male/father families (153 | 12.1%) represent the smallest median family size with 2.36 persons per family.
| Family Type | # Families | Family Size |
| Married-Couple | 818 (64.8%) | 3.08 |
| Single Male/Father | 153 (12.1%) | 2.36 |
| Single Female/Mother | 292 (23.1%) | 3.18 |
| Total Families | 1,263 (100.0%) | 3.02 |
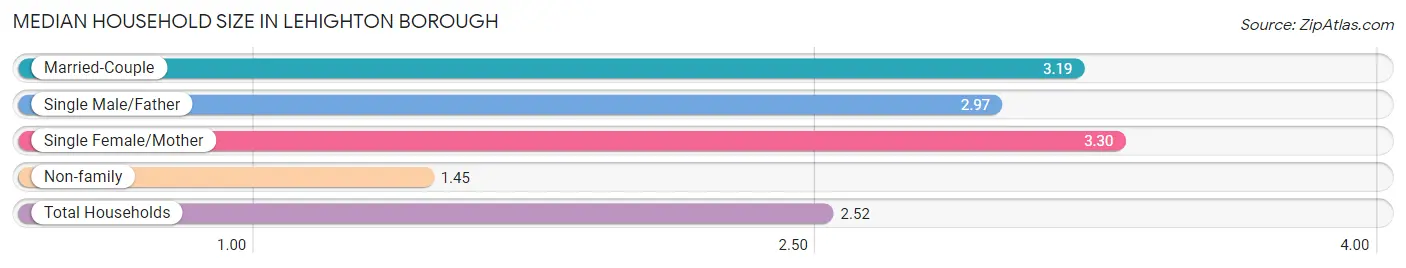
Median Household Size in Lehighton borough
The median household size in Lehighton borough is 2.52 persons per household, with single female/mother households (292 | 14.2%) accounting for the largest median household size of 3.3 persons per household. non-family households (793 | 38.6%) represent the smallest median household size with 1.45 persons per household.
| Household Type | # Households | Household Size |
| Married-Couple | 818 (39.8%) | 3.19 |
| Single Male/Father | 153 (7.4%) | 2.97 |
| Single Female/Mother | 292 (14.2%) | 3.30 |
| Non-family | 793 (38.6%) | 1.45 |
| Total Households | 2,056 (100.0%) | 2.52 |
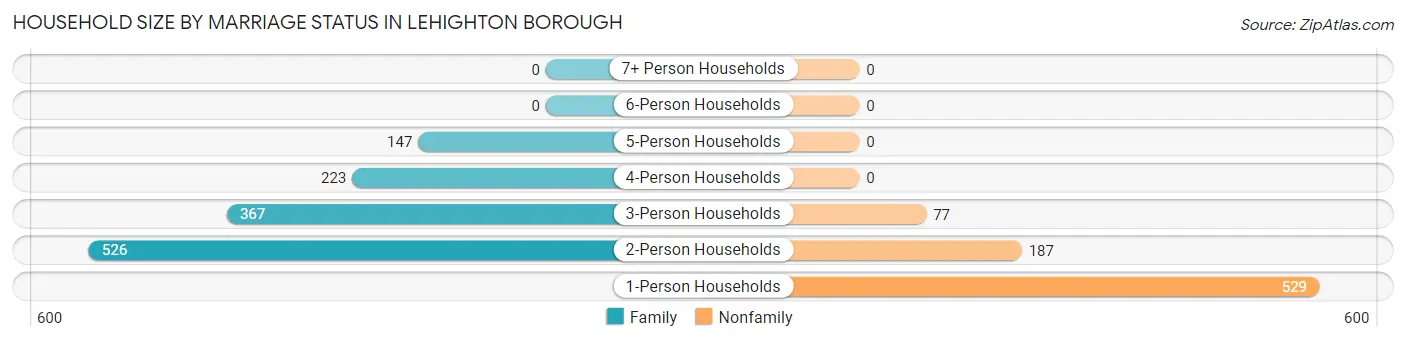
Household Size by Marriage Status in Lehighton borough
Out of a total of 2,056 households in Lehighton borough, 1,263 (61.4%) are family households, while 793 (38.6%) are nonfamily households. The most numerous type of family households are 2-person households, comprising 526, and the most common type of nonfamily households are 1-person households, comprising 529.
| Household Size | Family Households | Nonfamily Households |
| 1-Person Households | - | 529 (25.7%) |
| 2-Person Households | 526 (25.6%) | 187 (9.1%) |
| 3-Person Households | 367 (17.8%) | 77 (3.7%) |
| 4-Person Households | 223 (10.8%) | 0 (0.0%) |
| 5-Person Households | 147 (7.1%) | 0 (0.0%) |
| 6-Person Households | 0 (0.0%) | 0 (0.0%) |
| 7+ Person Households | 0 (0.0%) | 0 (0.0%) |
| Total | 1,263 (61.4%) | 793 (38.6%) |
Female Fertility in Lehighton borough
Fertility by Age in Lehighton borough
| Age Bracket | Women with Births | Births / 1,000 Women |
| 15 to 19 years | 0 (0.0%) | 0.0 |
| 20 to 34 years | 0 (0.0%) | 0.0 |
| 35 to 50 years | 0 (0.0%) | 0.0 |
| Total | 0 (0.0%) | 0.0 |
Fertility by Age by Marriage Status in Lehighton borough
| Age Bracket | Married | Unmarried |
| 15 to 19 years | 0 (0.0%) | 0 (0.0%) |
| 20 to 34 years | 0 (0.0%) | 0 (0.0%) |
| 35 to 50 years | 0 (0.0%) | 0 (0.0%) |
| Total | 0 (0.0%) | 0 (0.0%) |
Fertility by Education in Lehighton borough
| Educational Attainment | Women with Births | Births / 1,000 Women |
| Less than High School | 0 (0.0%) | 0.0 |
| High School Diploma | 0 (0.0%) | 0.0 |
| College or Associate's Degree | 0 (0.0%) | 0.0 |
| Bachelor's Degree | 0 (0.0%) | 0.0 |
| Graduate Degree | 0 (0.0%) | 0.0 |
| Total | 0 (0.0%) | 0.0 |
Fertility by Education by Marriage Status in Lehighton borough
| Educational Attainment | Married | Unmarried |
| Less than High School | 0 (0.0%) | 0 (0.0%) |
| High School Diploma | 0 (0.0%) | 0 (0.0%) |
| College or Associate's Degree | 0 (0.0%) | 0 (0.0%) |
| Bachelor's Degree | 0 (0.0%) | 0 (0.0%) |
| Graduate Degree | 0 (0.0%) | 0 (0.0%) |
| Total | 0 (0.0%) | 0 (0.0%) |
Employment Characteristics in Lehighton borough
Employment by Class of Employer in Lehighton borough
Among the 2,315 employed individuals in Lehighton borough, private company employees (1,773 | 76.6%), not-for-profit organizations (208 | 9.0%), and local government employees (177 | 7.6%) make up the most common classes of employment.
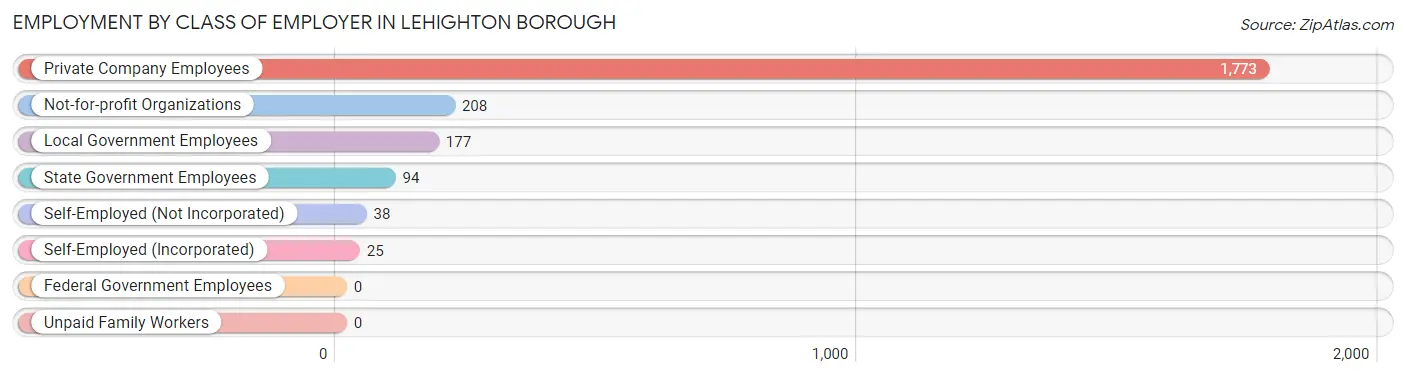
| Employer Class | # Employees | % Employees |
| Private Company Employees | 1,773 | 76.6% |
| Self-Employed (Incorporated) | 25 | 1.1% |
| Self-Employed (Not Incorporated) | 38 | 1.6% |
| Not-for-profit Organizations | 208 | 9.0% |
| Local Government Employees | 177 | 7.6% |
| State Government Employees | 94 | 4.1% |
| Federal Government Employees | 0 | 0.0% |
| Unpaid Family Workers | 0 | 0.0% |
| Total | 2,315 | 100.0% |
Employment Status by Age in Lehighton borough
According to the labor force statistics for Lehighton borough, out of the total population over 16 years of age (4,213), 61.2% or 2,578 individuals are in the labor force, with 9.4% or 242 of them unemployed. The age group with the highest labor force participation rate is 30 to 34 years, with 100.0% or 367 individuals in the labor force. Within the labor force, the 16 to 19 years age range has the highest percentage of unemployed individuals, with 45.9% or 17 of them being unemployed.
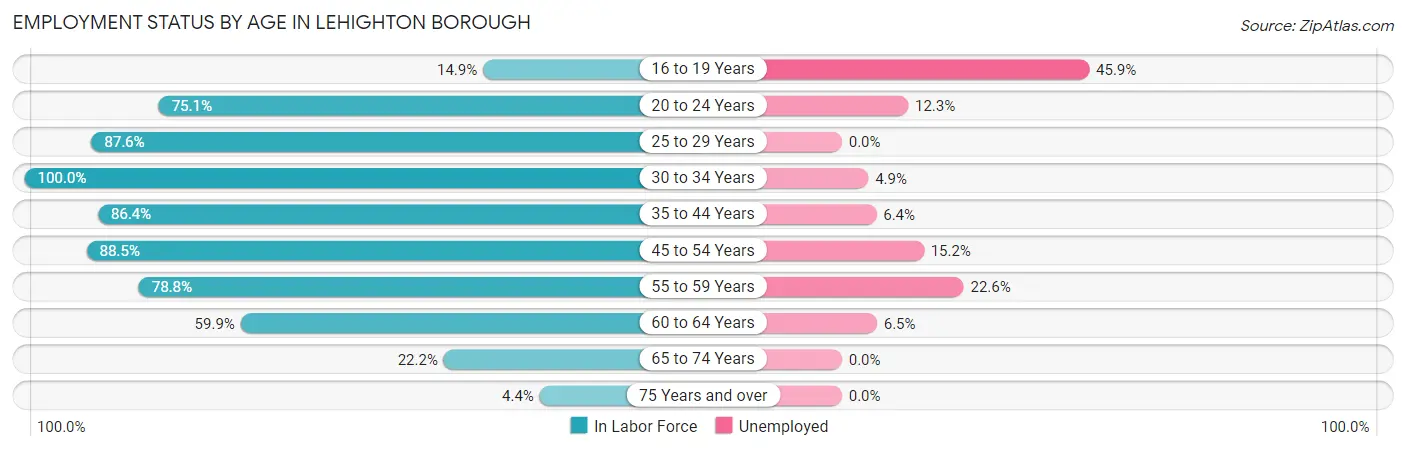
| Age Bracket | In Labor Force | Unemployed |
| 16 to 19 Years | 37 (14.9%) | 17 (45.9%) |
| 20 to 24 Years | 235 (75.1%) | 29 (12.3%) |
| 25 to 29 Years | 233 (87.6%) | 0 (0.0%) |
| 30 to 34 Years | 367 (100.0%) | 18 (4.9%) |
| 35 to 44 Years | 606 (86.4%) | 39 (6.4%) |
| 45 to 54 Years | 587 (88.5%) | 89 (15.2%) |
| 55 to 59 Years | 164 (78.8%) | 37 (22.6%) |
| 60 to 64 Years | 199 (59.9%) | 13 (6.5%) |
| 65 to 74 Years | 127 (22.2%) | 0 (0.0%) |
| 75 Years and over | 24 (4.4%) | 0 (0.0%) |
| Total | 2,578 (61.2%) | 242 (9.4%) |
Employment Status by Educational Attainment in Lehighton borough
According to labor force statistics for Lehighton borough, 85.0% of individuals (2,156) out of the total population between 25 and 64 years of age (2,537) are in the labor force, with 9.1% or 196 of them being unemployed. The group with the highest labor force participation rate are those with the educational attainment of college / associate degree, with 87.7% or 651 individuals in the labor force. Within the labor force, individuals with less than high school education have the highest percentage of unemployment, with 34.3% or 23 of them being unemployed.
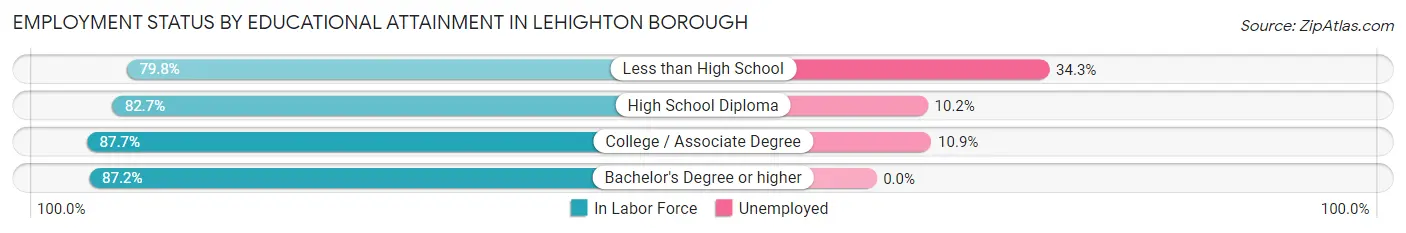
| Educational Attainment | In Labor Force | Unemployed |
| Less than High School | 67 (79.8%) | 29 (34.3%) |
| High School Diploma | 997 (82.7%) | 123 (10.2%) |
| College / Associate Degree | 651 (87.7%) | 81 (10.9%) |
| Bachelor's Degree or higher | 441 (87.2%) | 0 (0.0%) |
| Total | 2,156 (85.0%) | 231 (9.1%) |
Employment Occupations by Sex in Lehighton borough
Management, Business, Science and Arts Occupations
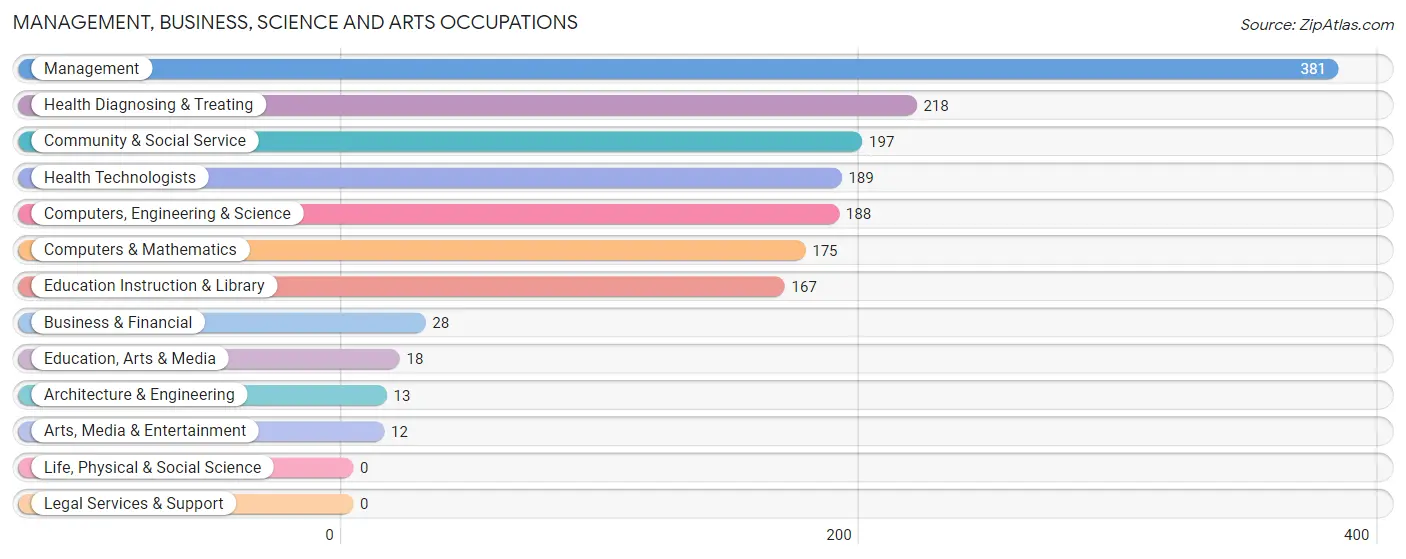
The most common Management, Business, Science and Arts occupations in Lehighton borough are Management (381 | 16.3%), Health Diagnosing & Treating (218 | 9.3%), Community & Social Service (197 | 8.4%), Health Technologists (189 | 8.1%), and Computers, Engineering & Science (188 | 8.0%).
Management, Business, Science and Arts Occupations by Sex
Within the Management, Business, Science and Arts occupations in Lehighton borough, the most male-oriented occupations are Architecture & Engineering (100.0%), Arts, Media & Entertainment (100.0%), and Computers, Engineering & Science (81.4%), while the most female-oriented occupations are Business & Financial (100.0%), Education, Arts & Media (100.0%), and Health Technologists (80.4%).
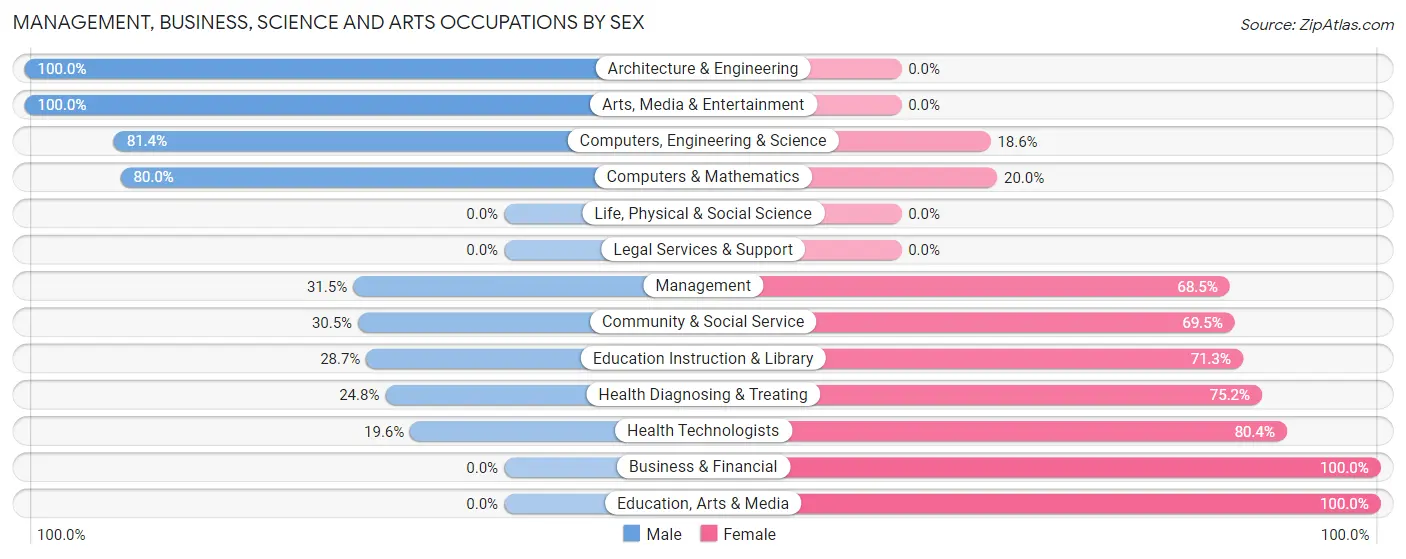
| Occupation | Male | Female |
| Management | 120 (31.5%) | 261 (68.5%) |
| Business & Financial | 0 (0.0%) | 28 (100.0%) |
| Computers, Engineering & Science | 153 (81.4%) | 35 (18.6%) |
| Computers & Mathematics | 140 (80.0%) | 35 (20.0%) |
| Architecture & Engineering | 13 (100.0%) | 0 (0.0%) |
| Life, Physical & Social Science | 0 (0.0%) | 0 (0.0%) |
| Community & Social Service | 60 (30.5%) | 137 (69.5%) |
| Education, Arts & Media | 0 (0.0%) | 18 (100.0%) |
| Legal Services & Support | 0 (0.0%) | 0 (0.0%) |
| Education Instruction & Library | 48 (28.7%) | 119 (71.3%) |
| Arts, Media & Entertainment | 12 (100.0%) | 0 (0.0%) |
| Health Diagnosing & Treating | 54 (24.8%) | 164 (75.2%) |
| Health Technologists | 37 (19.6%) | 152 (80.4%) |
| Total (Category) | 387 (38.2%) | 625 (61.8%) |
| Total (Overall) | 1,188 (50.8%) | 1,149 (49.2%) |
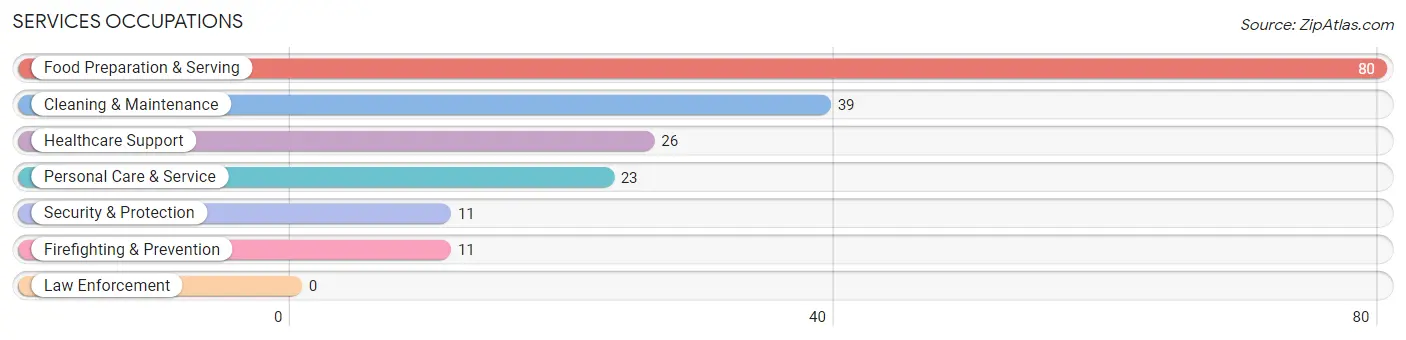
Services Occupations
The most common Services occupations in Lehighton borough are Food Preparation & Serving (80 | 3.4%), Cleaning & Maintenance (39 | 1.7%), Healthcare Support (26 | 1.1%), Personal Care & Service (23 | 1.0%), and Security & Protection (11 | 0.5%).
Services Occupations by Sex
Within the Services occupations in Lehighton borough, the most male-oriented occupations are Healthcare Support (100.0%), Cleaning & Maintenance (61.5%), and Food Preparation & Serving (25.0%), while the most female-oriented occupations are Security & Protection (100.0%), Firefighting & Prevention (100.0%), and Personal Care & Service (100.0%).
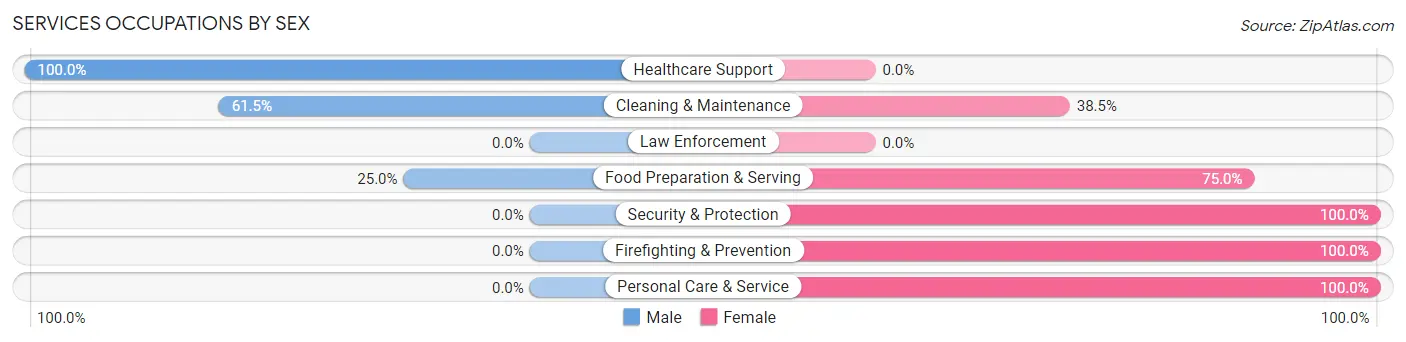
| Occupation | Male | Female |
| Healthcare Support | 26 (100.0%) | 0 (0.0%) |
| Security & Protection | 0 (0.0%) | 11 (100.0%) |
| Firefighting & Prevention | 0 (0.0%) | 11 (100.0%) |
| Law Enforcement | 0 (0.0%) | 0 (0.0%) |
| Food Preparation & Serving | 20 (25.0%) | 60 (75.0%) |
| Cleaning & Maintenance | 24 (61.5%) | 15 (38.5%) |
| Personal Care & Service | 0 (0.0%) | 23 (100.0%) |
| Total (Category) | 70 (39.1%) | 109 (60.9%) |
| Total (Overall) | 1,188 (50.8%) | 1,149 (49.2%) |
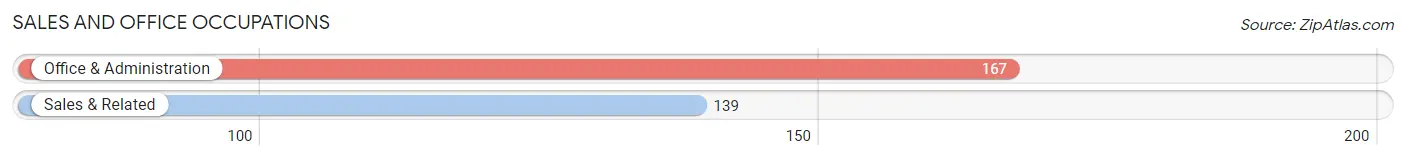
Sales and Office Occupations
The most common Sales and Office occupations in Lehighton borough are Office & Administration (167 | 7.1%), and Sales & Related (139 | 5.9%).
Sales and Office Occupations by Sex
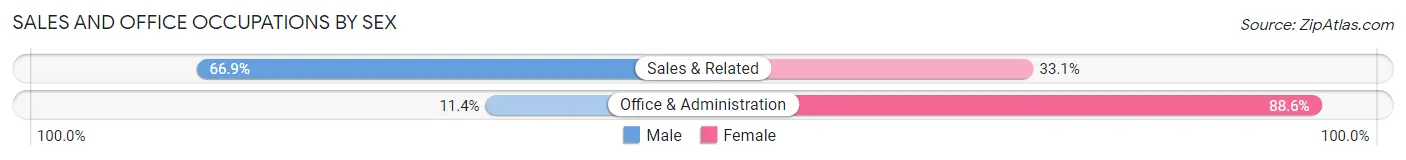
| Occupation | Male | Female |
| Sales & Related | 93 (66.9%) | 46 (33.1%) |
| Office & Administration | 19 (11.4%) | 148 (88.6%) |
| Total (Category) | 112 (36.6%) | 194 (63.4%) |
| Total (Overall) | 1,188 (50.8%) | 1,149 (49.2%) |
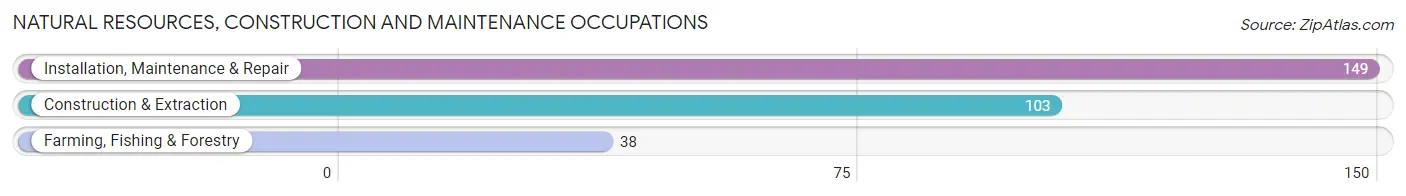
Natural Resources, Construction and Maintenance Occupations
The most common Natural Resources, Construction and Maintenance occupations in Lehighton borough are Installation, Maintenance & Repair (149 | 6.4%), Construction & Extraction (103 | 4.4%), and Farming, Fishing & Forestry (38 | 1.6%).
Natural Resources, Construction and Maintenance Occupations by Sex
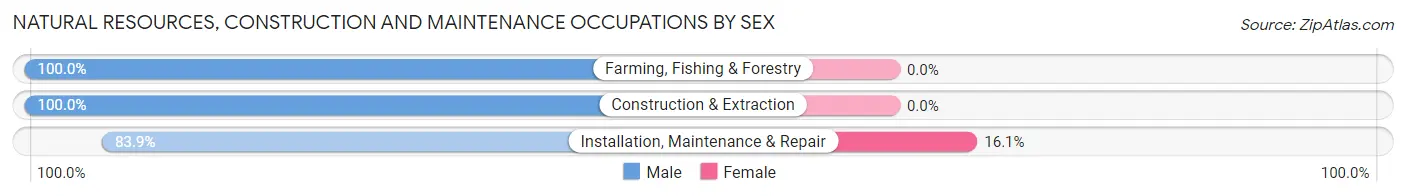
| Occupation | Male | Female |
| Farming, Fishing & Forestry | 38 (100.0%) | 0 (0.0%) |
| Construction & Extraction | 103 (100.0%) | 0 (0.0%) |
| Installation, Maintenance & Repair | 125 (83.9%) | 24 (16.1%) |
| Total (Category) | 266 (91.7%) | 24 (8.3%) |
| Total (Overall) | 1,188 (50.8%) | 1,149 (49.2%) |
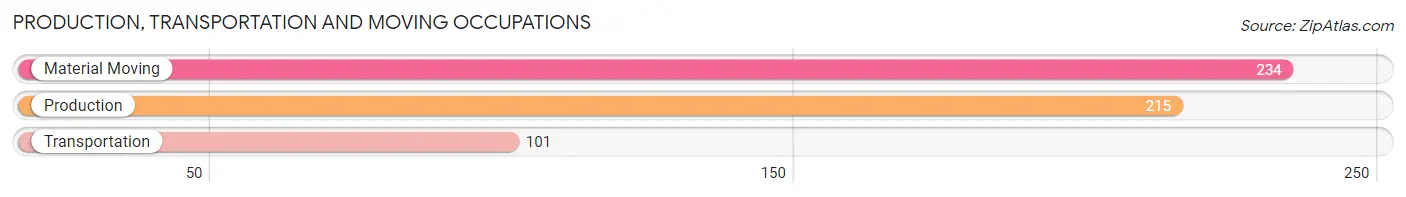
Production, Transportation and Moving Occupations
The most common Production, Transportation and Moving occupations in Lehighton borough are Material Moving (234 | 10.0%), Production (215 | 9.2%), and Transportation (101 | 4.3%).
Production, Transportation and Moving Occupations by Sex
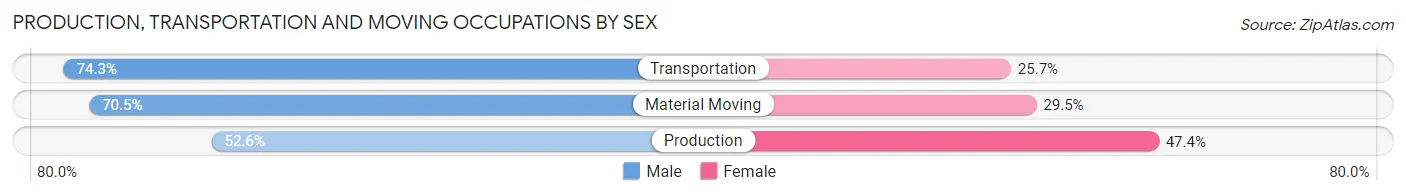
| Occupation | Male | Female |
| Production | 113 (52.6%) | 102 (47.4%) |
| Transportation | 75 (74.3%) | 26 (25.7%) |
| Material Moving | 165 (70.5%) | 69 (29.5%) |
| Total (Category) | 353 (64.2%) | 197 (35.8%) |
| Total (Overall) | 1,188 (50.8%) | 1,149 (49.2%) |
Employment Industries by Sex in Lehighton borough
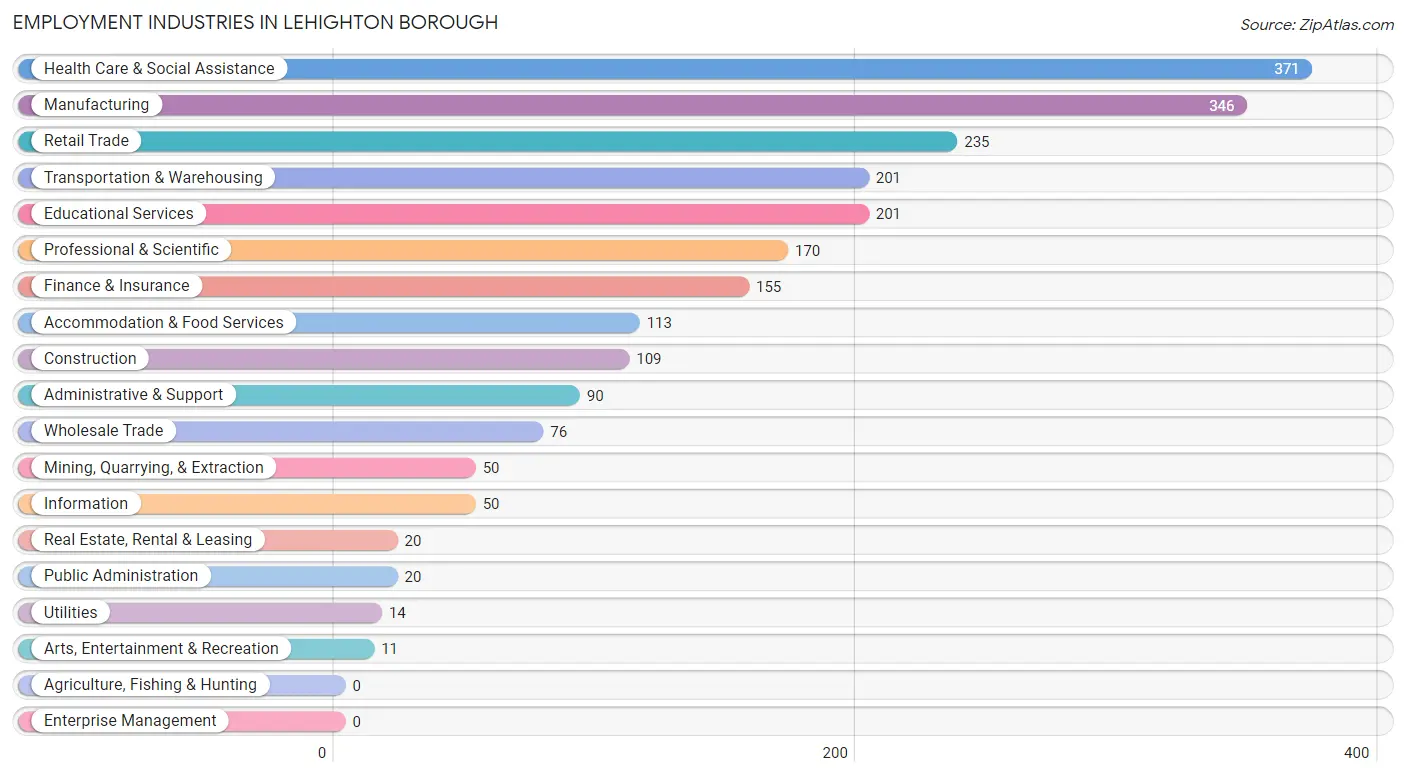
Employment Industries in Lehighton borough
The major employment industries in Lehighton borough include Health Care & Social Assistance (371 | 15.9%), Manufacturing (346 | 14.8%), Retail Trade (235 | 10.1%), Transportation & Warehousing (201 | 8.6%), and Educational Services (201 | 8.6%).
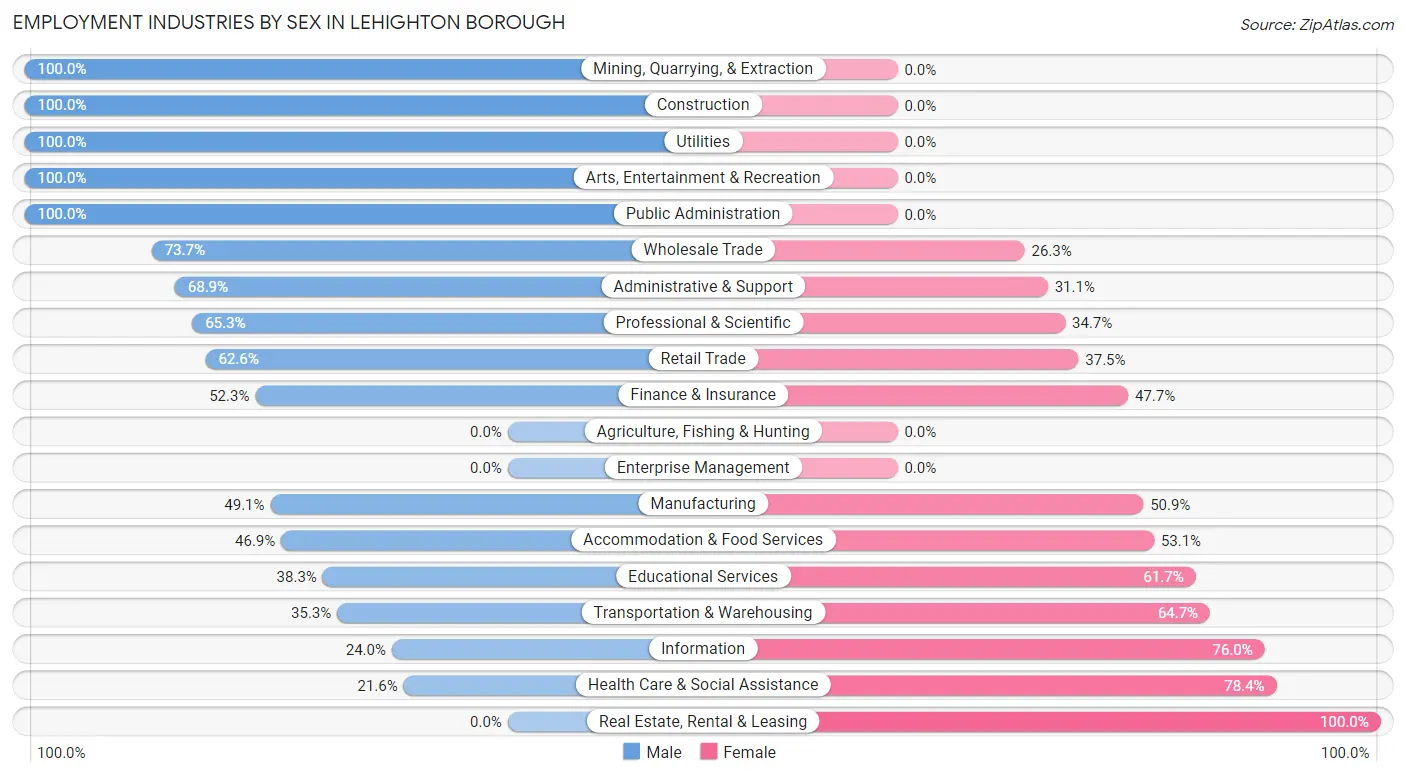
Employment Industries by Sex in Lehighton borough
The Lehighton borough industries that see more men than women are Mining, Quarrying, & Extraction (100.0%), Construction (100.0%), and Utilities (100.0%), whereas the industries that tend to have a higher number of women are Real Estate, Rental & Leasing (100.0%), Health Care & Social Assistance (78.4%), and Information (76.0%).
| Industry | Male | Female |
| Agriculture, Fishing & Hunting | 0 (0.0%) | 0 (0.0%) |
| Mining, Quarrying, & Extraction | 50 (100.0%) | 0 (0.0%) |
| Construction | 109 (100.0%) | 0 (0.0%) |
| Manufacturing | 170 (49.1%) | 176 (50.9%) |
| Wholesale Trade | 56 (73.7%) | 20 (26.3%) |
| Retail Trade | 147 (62.5%) | 88 (37.4%) |
| Transportation & Warehousing | 71 (35.3%) | 130 (64.7%) |
| Utilities | 14 (100.0%) | 0 (0.0%) |
| Information | 12 (24.0%) | 38 (76.0%) |
| Finance & Insurance | 81 (52.3%) | 74 (47.7%) |
| Real Estate, Rental & Leasing | 0 (0.0%) | 20 (100.0%) |
| Professional & Scientific | 111 (65.3%) | 59 (34.7%) |
| Enterprise Management | 0 (0.0%) | 0 (0.0%) |
| Administrative & Support | 62 (68.9%) | 28 (31.1%) |
| Educational Services | 77 (38.3%) | 124 (61.7%) |
| Health Care & Social Assistance | 80 (21.6%) | 291 (78.4%) |
| Arts, Entertainment & Recreation | 11 (100.0%) | 0 (0.0%) |
| Accommodation & Food Services | 53 (46.9%) | 60 (53.1%) |
| Public Administration | 20 (100.0%) | 0 (0.0%) |
| Total | 1,188 (50.8%) | 1,149 (49.2%) |
Education in Lehighton borough
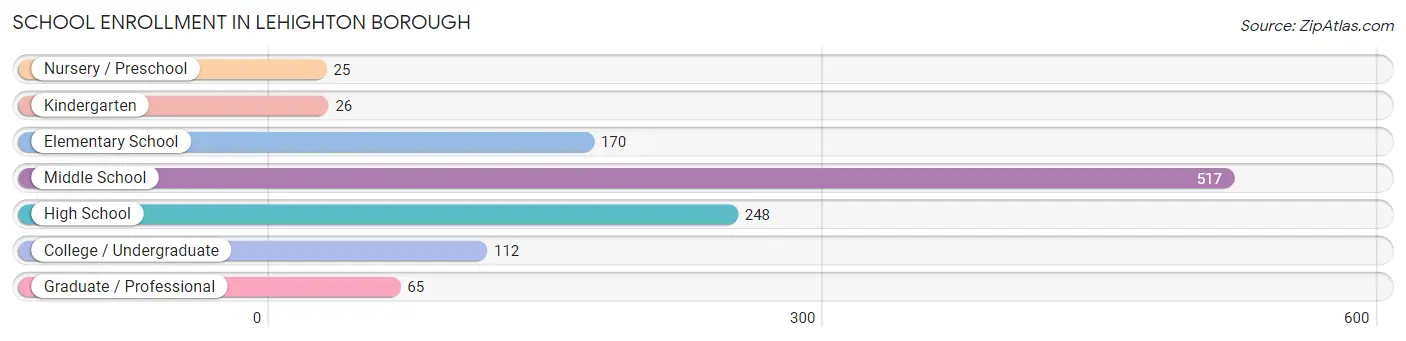
School Enrollment in Lehighton borough
The most common levels of schooling among the 1,163 students in Lehighton borough are middle school (517 | 44.5%), high school (248 | 21.3%), and elementary school (170 | 14.6%).
| School Level | # Students | % Students |
| Nursery / Preschool | 25 | 2.1% |
| Kindergarten | 26 | 2.2% |
| Elementary School | 170 | 14.6% |
| Middle School | 517 | 44.5% |
| High School | 248 | 21.3% |
| College / Undergraduate | 112 | 9.6% |
| Graduate / Professional | 65 | 5.6% |
| Total | 1,163 | 100.0% |
School Enrollment by Age by Funding Source in Lehighton borough
Out of a total of 1,163 students who are enrolled in schools in Lehighton borough, 91 (7.8%) attend a private institution, while the remaining 1,072 (92.2%) are enrolled in public schools. The age group of 3 to 4 year olds has the highest likelihood of being enrolled in private schools, with 25 (100.0% in the age bracket) enrolled. Conversely, the age group of 5 to 9 year old has the lowest likelihood of being enrolled in a private school, with 196 (100.0% in the age bracket) attending a public institution.
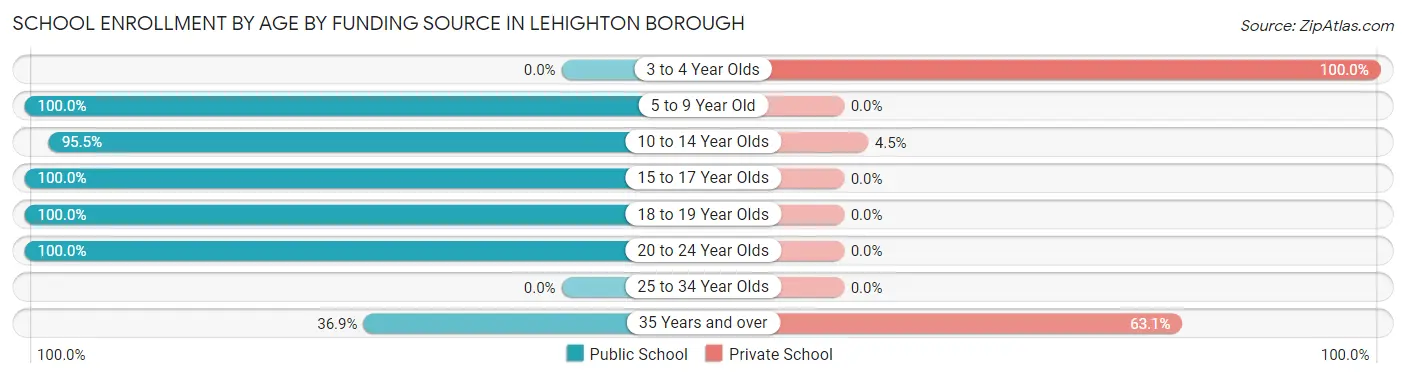
| Age Bracket | Public School | Private School |
| 3 to 4 Year Olds | 0 (0.0%) | 25 (100.0%) |
| 5 to 9 Year Old | 196 (100.0%) | 0 (0.0%) |
| 10 to 14 Year Olds | 530 (95.5%) | 25 (4.5%) |
| 15 to 17 Year Olds | 144 (100.0%) | 0 (0.0%) |
| 18 to 19 Year Olds | 91 (100.0%) | 0 (0.0%) |
| 20 to 24 Year Olds | 87 (100.0%) | 0 (0.0%) |
| 25 to 34 Year Olds | 0 (0.0%) | 0 (0.0%) |
| 35 Years and over | 24 (36.9%) | 41 (63.1%) |
| Total | 1,072 (92.2%) | 91 (7.8%) |
Educational Attainment by Field of Study in Lehighton borough
Business (166 | 24.7%), education (110 | 16.4%), computers & mathematics (82 | 12.2%), literature & languages (72 | 10.7%), and science & technology (64 | 9.5%) are the most common fields of study among 672 individuals in Lehighton borough who have obtained a bachelor's degree or higher.
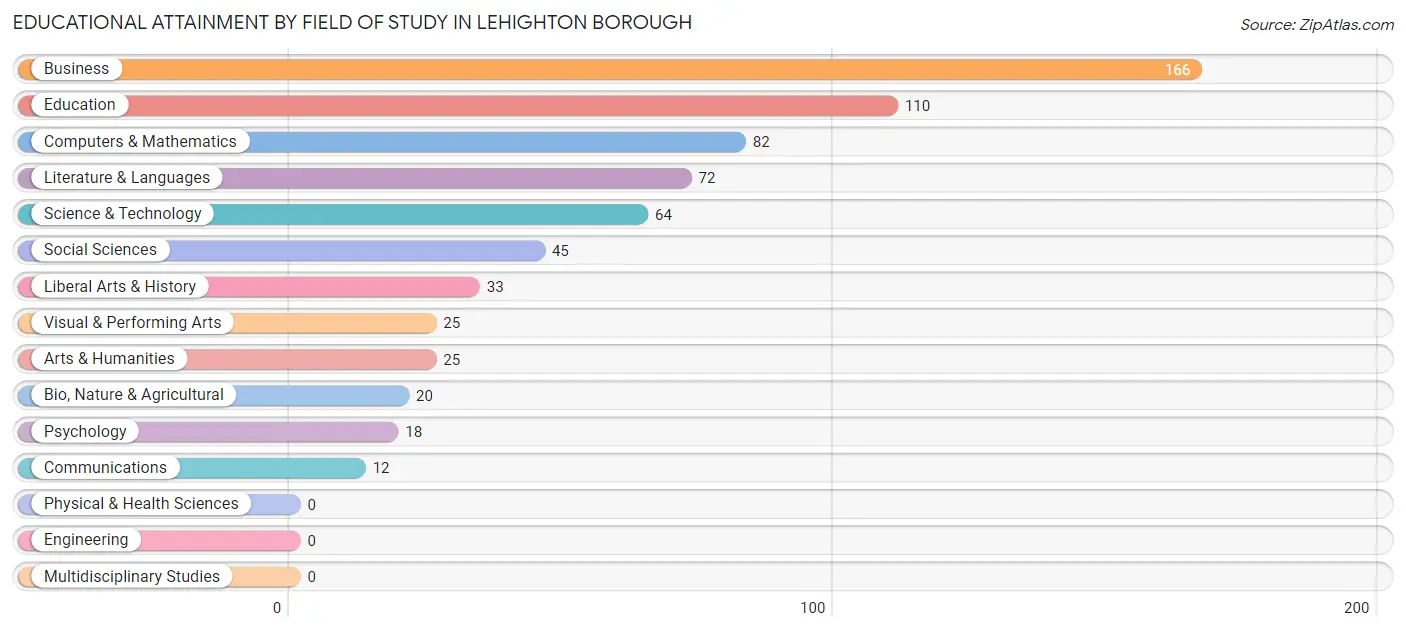
| Field of Study | # Graduates | % Graduates |
| Computers & Mathematics | 82 | 12.2% |
| Bio, Nature & Agricultural | 20 | 3.0% |
| Physical & Health Sciences | 0 | 0.0% |
| Psychology | 18 | 2.7% |
| Social Sciences | 45 | 6.7% |
| Engineering | 0 | 0.0% |
| Multidisciplinary Studies | 0 | 0.0% |
| Science & Technology | 64 | 9.5% |
| Business | 166 | 24.7% |
| Education | 110 | 16.4% |
| Literature & Languages | 72 | 10.7% |
| Liberal Arts & History | 33 | 4.9% |
| Visual & Performing Arts | 25 | 3.7% |
| Communications | 12 | 1.8% |
| Arts & Humanities | 25 | 3.7% |
| Total | 672 | 100.0% |
Transportation & Commute in Lehighton borough
Vehicle Availability by Sex in Lehighton borough
The most prevalent vehicle ownership categories in Lehighton borough are males with 2 vehicles (663, accounting for 56.9%) and females with 2 vehicles (659, making up 57.7%).
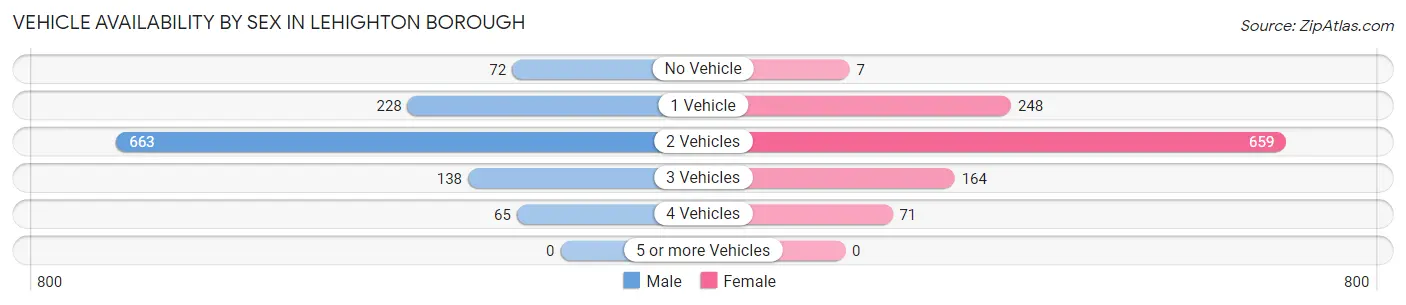
| Vehicles Available | Male | Female |
| No Vehicle | 72 (6.2%) | 7 (0.6%) |
| 1 Vehicle | 228 (19.6%) | 248 (21.6%) |
| 2 Vehicles | 663 (56.9%) | 659 (57.4%) |
| 3 Vehicles | 138 (11.8%) | 164 (14.3%) |
| 4 Vehicles | 65 (5.6%) | 71 (6.2%) |
| 5 or more Vehicles | 0 (0.0%) | 0 (0.0%) |
| Total | 1,166 (100.0%) | 1,149 (100.0%) |
Commute Time in Lehighton borough
The most frequently occuring commute durations in Lehighton borough are less than 5 minutes (334 commuters, 15.4%), 10 to 14 minutes (287 commuters, 13.3%), and 5 to 9 minutes (235 commuters, 10.9%).
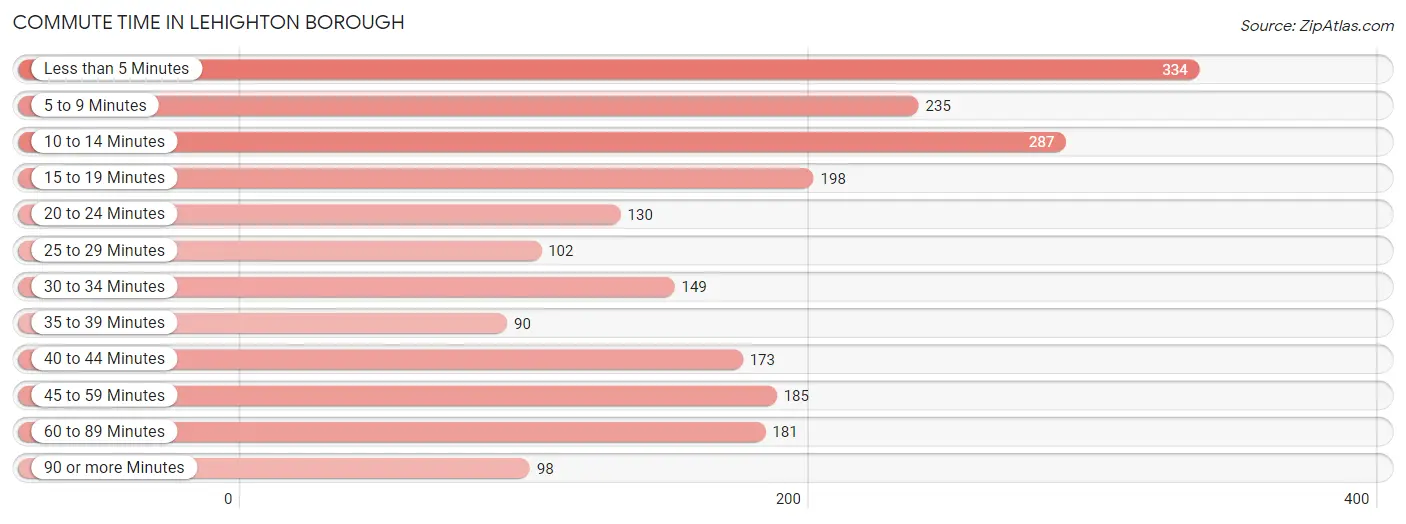
| Commute Time | # Commuters | % Commuters |
| Less than 5 Minutes | 334 | 15.4% |
| 5 to 9 Minutes | 235 | 10.9% |
| 10 to 14 Minutes | 287 | 13.3% |
| 15 to 19 Minutes | 198 | 9.2% |
| 20 to 24 Minutes | 130 | 6.0% |
| 25 to 29 Minutes | 102 | 4.7% |
| 30 to 34 Minutes | 149 | 6.9% |
| 35 to 39 Minutes | 90 | 4.2% |
| 40 to 44 Minutes | 173 | 8.0% |
| 45 to 59 Minutes | 185 | 8.6% |
| 60 to 89 Minutes | 181 | 8.4% |
| 90 or more Minutes | 98 | 4.5% |
Commute Time by Sex in Lehighton borough
The most common commute times in Lehighton borough are 15 to 19 minutes (198 commuters, 18.2%) for males and less than 5 minutes (237 commuters, 22.0%) for females.
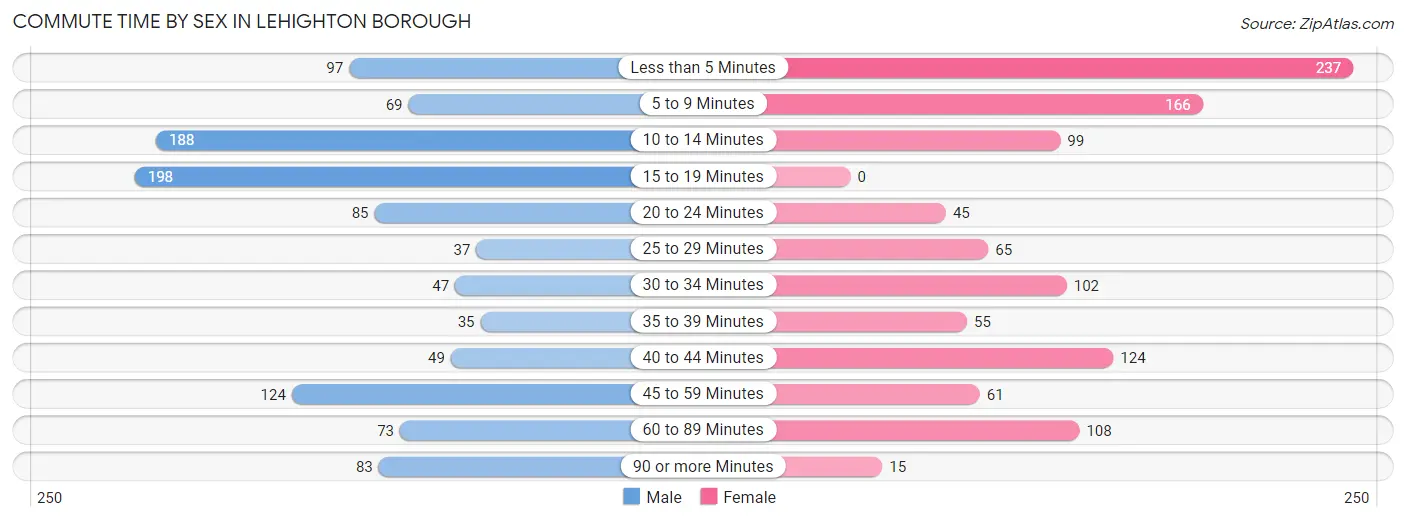
| Commute Time | Male | Female |
| Less than 5 Minutes | 97 (8.9%) | 237 (22.0%) |
| 5 to 9 Minutes | 69 (6.4%) | 166 (15.4%) |
| 10 to 14 Minutes | 188 (17.3%) | 99 (9.2%) |
| 15 to 19 Minutes | 198 (18.2%) | 0 (0.0%) |
| 20 to 24 Minutes | 85 (7.8%) | 45 (4.2%) |
| 25 to 29 Minutes | 37 (3.4%) | 65 (6.0%) |
| 30 to 34 Minutes | 47 (4.3%) | 102 (9.5%) |
| 35 to 39 Minutes | 35 (3.2%) | 55 (5.1%) |
| 40 to 44 Minutes | 49 (4.5%) | 124 (11.5%) |
| 45 to 59 Minutes | 124 (11.4%) | 61 (5.7%) |
| 60 to 89 Minutes | 73 (6.7%) | 108 (10.0%) |
| 90 or more Minutes | 83 (7.6%) | 15 (1.4%) |
Time of Departure to Work by Sex in Lehighton borough
The most frequent times of departure to work in Lehighton borough are 5:00 AM to 5:29 AM (193, 17.8%) for males and 7:00 AM to 7:29 AM (296, 27.5%) for females.
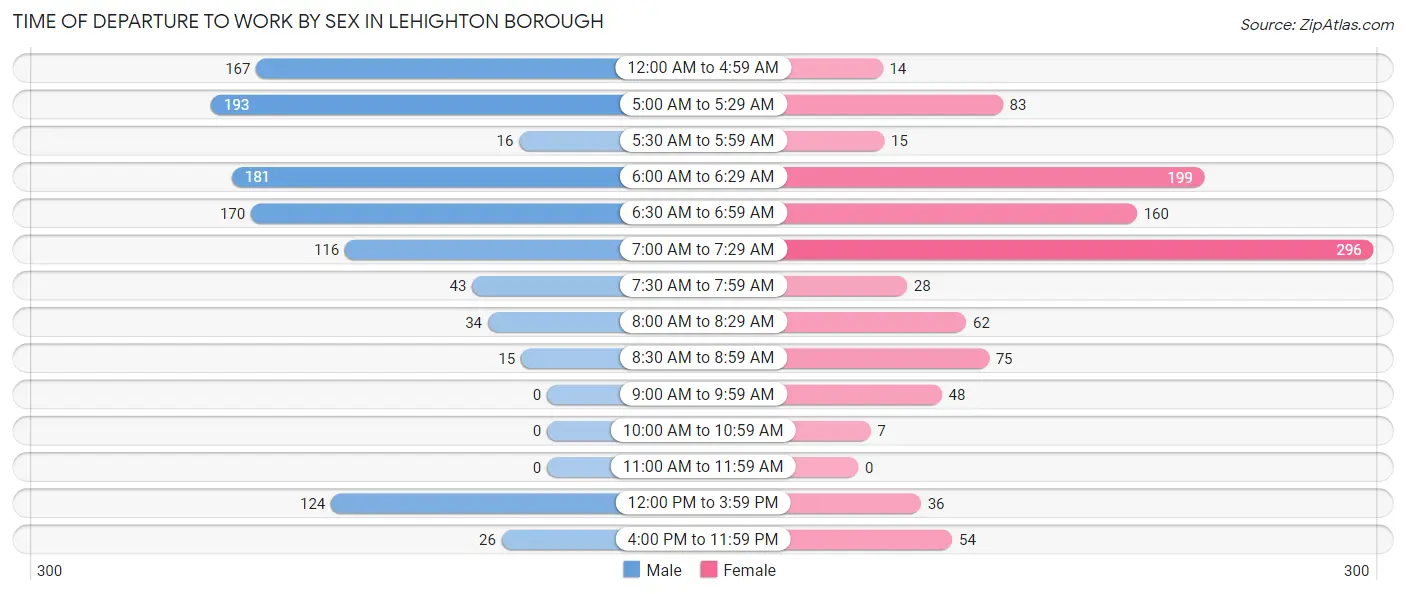
| Time of Departure | Male | Female |
| 12:00 AM to 4:59 AM | 167 (15.4%) | 14 (1.3%) |
| 5:00 AM to 5:29 AM | 193 (17.8%) | 83 (7.7%) |
| 5:30 AM to 5:59 AM | 16 (1.5%) | 15 (1.4%) |
| 6:00 AM to 6:29 AM | 181 (16.7%) | 199 (18.5%) |
| 6:30 AM to 6:59 AM | 170 (15.7%) | 160 (14.9%) |
| 7:00 AM to 7:29 AM | 116 (10.7%) | 296 (27.5%) |
| 7:30 AM to 7:59 AM | 43 (4.0%) | 28 (2.6%) |
| 8:00 AM to 8:29 AM | 34 (3.1%) | 62 (5.8%) |
| 8:30 AM to 8:59 AM | 15 (1.4%) | 75 (7.0%) |
| 9:00 AM to 9:59 AM | 0 (0.0%) | 48 (4.5%) |
| 10:00 AM to 10:59 AM | 0 (0.0%) | 7 (0.6%) |
| 11:00 AM to 11:59 AM | 0 (0.0%) | 0 (0.0%) |
| 12:00 PM to 3:59 PM | 124 (11.4%) | 36 (3.3%) |
| 4:00 PM to 11:59 PM | 26 (2.4%) | 54 (5.0%) |
| Total | 1,085 (100.0%) | 1,077 (100.0%) |
Housing Occupancy in Lehighton borough
Occupancy by Ownership in Lehighton borough
Of the total 2,056 dwellings in Lehighton borough, owner-occupied units account for 1,077 (52.4%), while renter-occupied units make up 979 (47.6%).
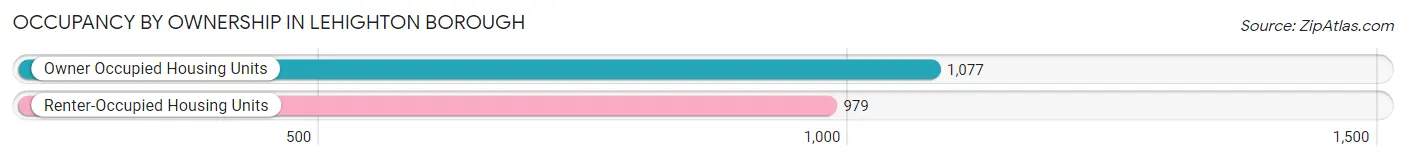
| Occupancy | # Housing Units | % Housing Units |
| Owner Occupied Housing Units | 1,077 | 52.4% |
| Renter-Occupied Housing Units | 979 | 47.6% |
| Total Occupied Housing Units | 2,056 | 100.0% |
Occupancy by Household Size in Lehighton borough
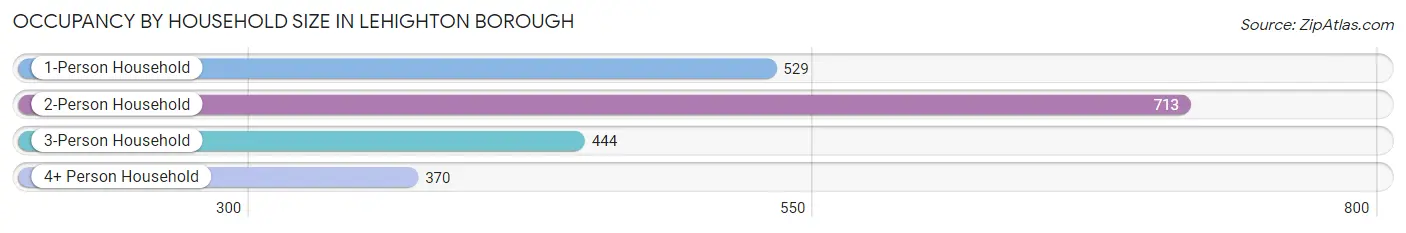
| Household Size | # Housing Units | % Housing Units |
| 1-Person Household | 529 | 25.7% |
| 2-Person Household | 713 | 34.7% |
| 3-Person Household | 444 | 21.6% |
| 4+ Person Household | 370 | 18.0% |
| Total Housing Units | 2,056 | 100.0% |
Occupancy by Ownership by Household Size in Lehighton borough
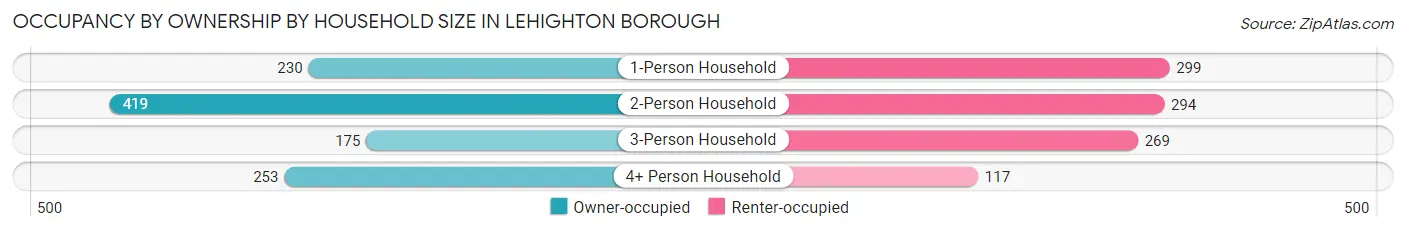
| Household Size | Owner-occupied | Renter-occupied |
| 1-Person Household | 230 (43.5%) | 299 (56.5%) |
| 2-Person Household | 419 (58.8%) | 294 (41.2%) |
| 3-Person Household | 175 (39.4%) | 269 (60.6%) |
| 4+ Person Household | 253 (68.4%) | 117 (31.6%) |
| Total Housing Units | 1,077 (52.4%) | 979 (47.6%) |
Occupancy by Educational Attainment in Lehighton borough
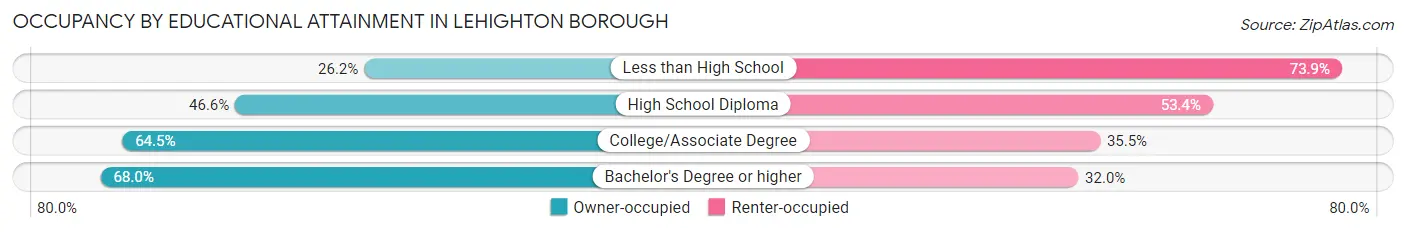
| Household Size | Owner-occupied | Renter-occupied |
| Less than High School | 74 (26.2%) | 209 (73.9%) |
| High School Diploma | 392 (46.6%) | 449 (53.4%) |
| College/Associate Degree | 418 (64.5%) | 230 (35.5%) |
| Bachelor's Degree or higher | 193 (68.0%) | 91 (32.0%) |
Occupancy by Age of Householder in Lehighton borough
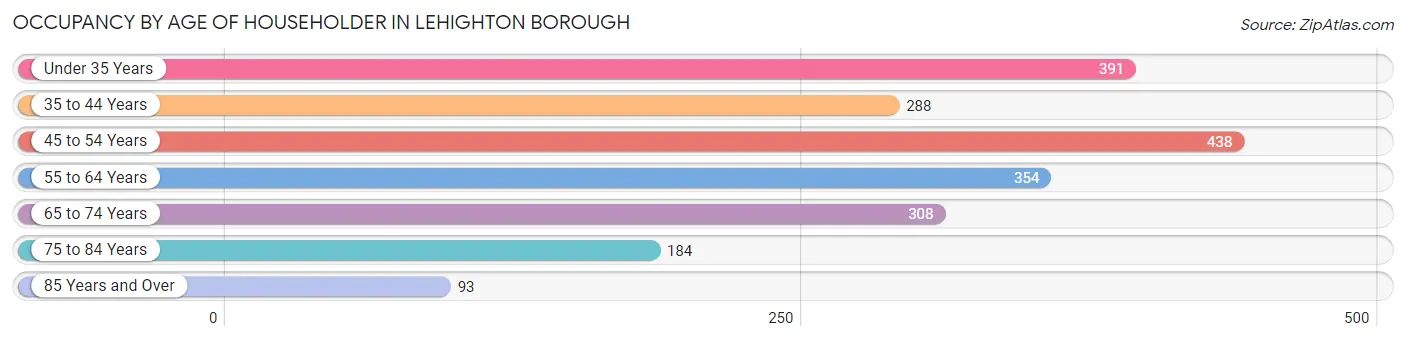
| Age Bracket | # Households | % Households |
| Under 35 Years | 391 | 19.0% |
| 35 to 44 Years | 288 | 14.0% |
| 45 to 54 Years | 438 | 21.3% |
| 55 to 64 Years | 354 | 17.2% |
| 65 to 74 Years | 308 | 15.0% |
| 75 to 84 Years | 184 | 8.9% |
| 85 Years and Over | 93 | 4.5% |
| Total | 2,056 | 100.0% |
Housing Finances in Lehighton borough
Median Income by Occupancy in Lehighton borough
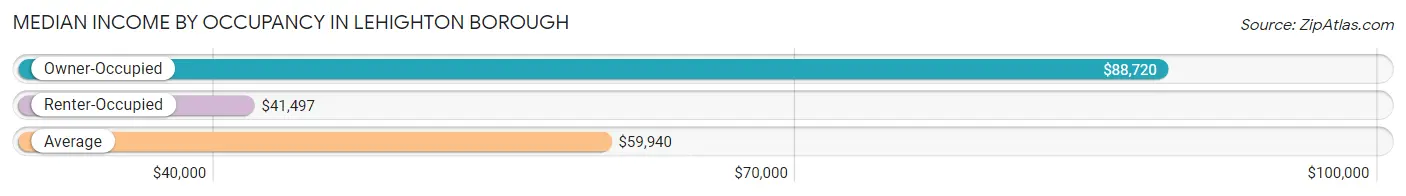
| Occupancy Type | # Households | Median Income |
| Owner-Occupied | 1,077 (52.4%) | $88,720 |
| Renter-Occupied | 979 (47.6%) | $41,497 |
| Average | 2,056 (100.0%) | $59,940 |
Occupancy by Householder Income Bracket in Lehighton borough
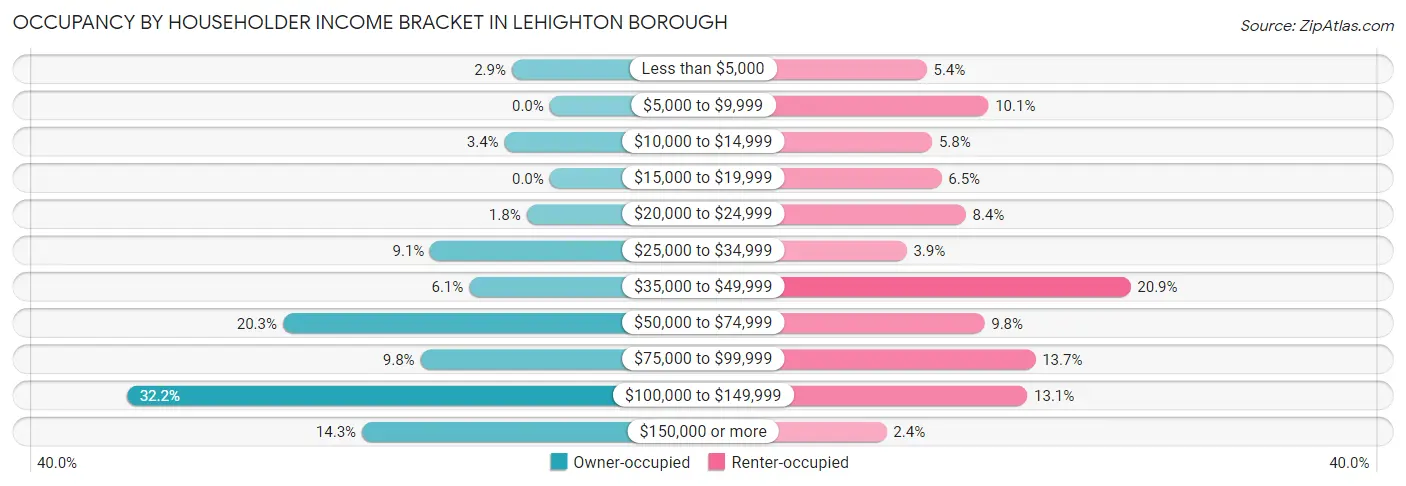
| Income Bracket | Owner-occupied | Renter-occupied |
| Less than $5,000 | 31 (2.9%) | 53 (5.4%) |
| $5,000 to $9,999 | 0 (0.0%) | 99 (10.1%) |
| $10,000 to $14,999 | 37 (3.4%) | 57 (5.8%) |
| $15,000 to $19,999 | 0 (0.0%) | 64 (6.5%) |
| $20,000 to $24,999 | 19 (1.8%) | 82 (8.4%) |
| $25,000 to $34,999 | 98 (9.1%) | 38 (3.9%) |
| $35,000 to $49,999 | 66 (6.1%) | 205 (20.9%) |
| $50,000 to $74,999 | 219 (20.3%) | 96 (9.8%) |
| $75,000 to $99,999 | 106 (9.8%) | 134 (13.7%) |
| $100,000 to $149,999 | 347 (32.2%) | 128 (13.1%) |
| $150,000 or more | 154 (14.3%) | 23 (2.4%) |
| Total | 1,077 (100.0%) | 979 (100.0%) |
Monthly Housing Cost Tiers in Lehighton borough
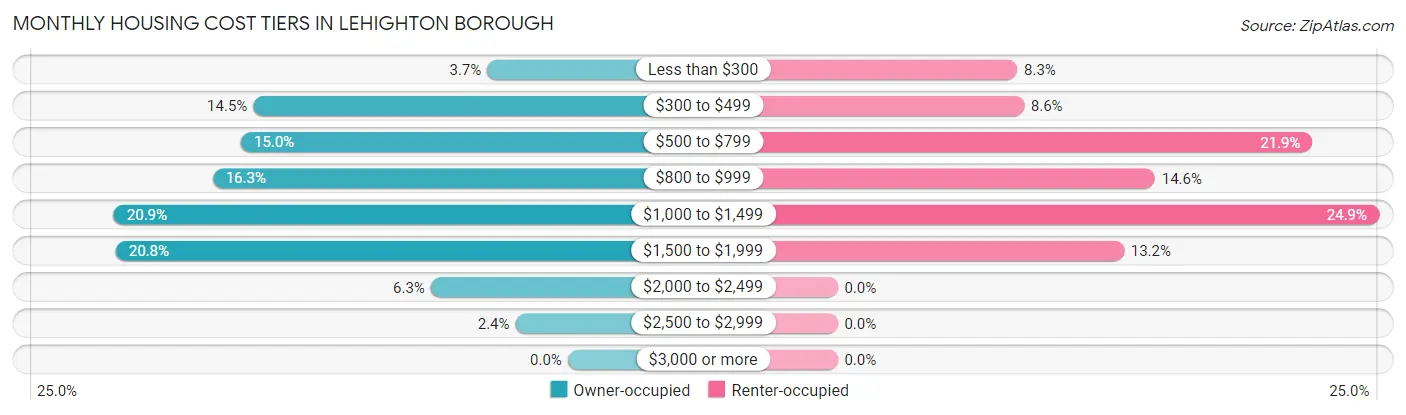
| Monthly Cost | Owner-occupied | Renter-occupied |
| Less than $300 | 40 (3.7%) | 81 (8.3%) |
| $300 to $499 | 156 (14.5%) | 84 (8.6%) |
| $500 to $799 | 162 (15.0%) | 214 (21.9%) |
| $800 to $999 | 176 (16.3%) | 143 (14.6%) |
| $1,000 to $1,499 | 225 (20.9%) | 244 (24.9%) |
| $1,500 to $1,999 | 224 (20.8%) | 129 (13.2%) |
| $2,000 to $2,499 | 68 (6.3%) | 0 (0.0%) |
| $2,500 to $2,999 | 26 (2.4%) | 0 (0.0%) |
| $3,000 or more | 0 (0.0%) | 0 (0.0%) |
| Total | 1,077 (100.0%) | 979 (100.0%) |
Physical Housing Characteristics in Lehighton borough
Housing Structures in Lehighton borough
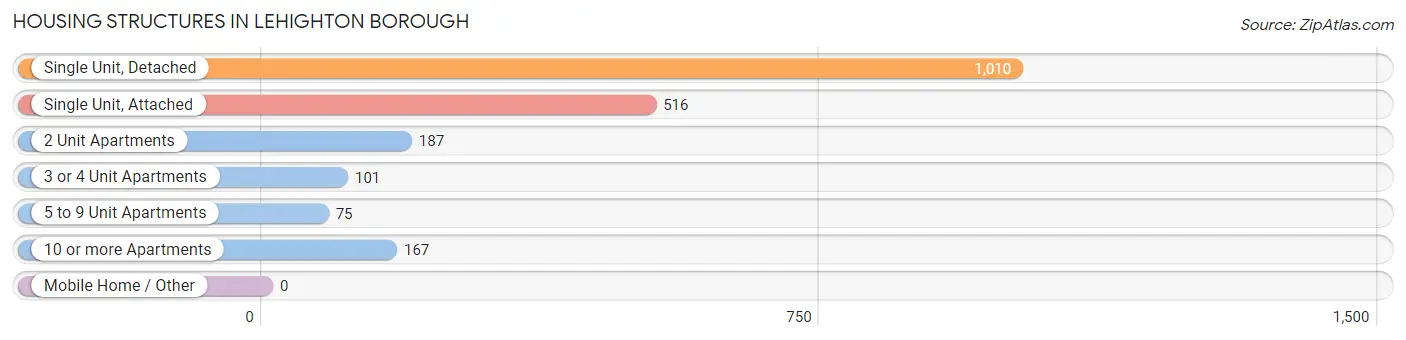
| Structure Type | # Housing Units | % Housing Units |
| Single Unit, Detached | 1,010 | 49.1% |
| Single Unit, Attached | 516 | 25.1% |
| 2 Unit Apartments | 187 | 9.1% |
| 3 or 4 Unit Apartments | 101 | 4.9% |
| 5 to 9 Unit Apartments | 75 | 3.6% |
| 10 or more Apartments | 167 | 8.1% |
| Mobile Home / Other | 0 | 0.0% |
| Total | 2,056 | 100.0% |
Housing Structures by Occupancy in Lehighton borough
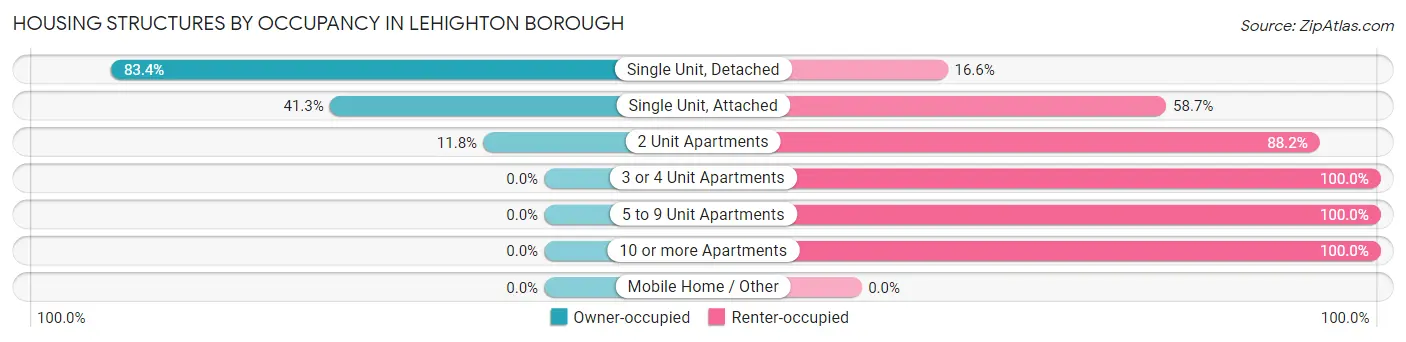
| Structure Type | Owner-occupied | Renter-occupied |
| Single Unit, Detached | 842 (83.4%) | 168 (16.6%) |
| Single Unit, Attached | 213 (41.3%) | 303 (58.7%) |
| 2 Unit Apartments | 22 (11.8%) | 165 (88.2%) |
| 3 or 4 Unit Apartments | 0 (0.0%) | 101 (100.0%) |
| 5 to 9 Unit Apartments | 0 (0.0%) | 75 (100.0%) |
| 10 or more Apartments | 0 (0.0%) | 167 (100.0%) |
| Mobile Home / Other | 0 (0.0%) | 0 (0.0%) |
| Total | 1,077 (52.4%) | 979 (47.6%) |
Housing Structures by Number of Rooms in Lehighton borough
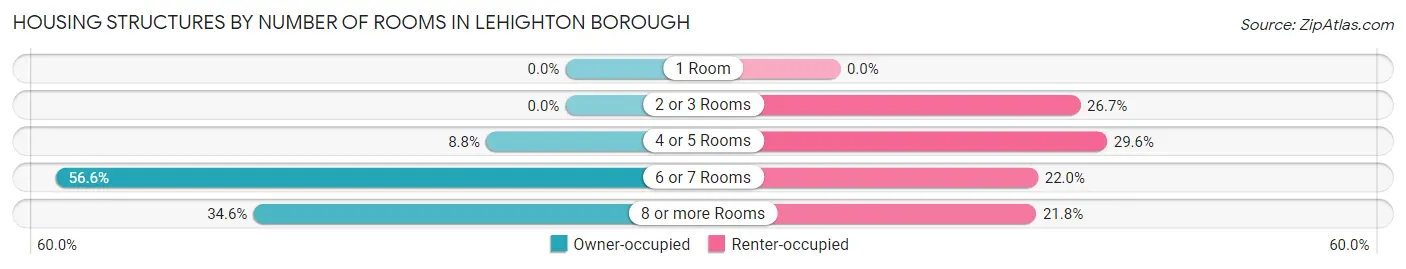
| Number of Rooms | Owner-occupied | Renter-occupied |
| 1 Room | 0 (0.0%) | 0 (0.0%) |
| 2 or 3 Rooms | 0 (0.0%) | 261 (26.7%) |
| 4 or 5 Rooms | 95 (8.8%) | 290 (29.6%) |
| 6 or 7 Rooms | 609 (56.6%) | 215 (22.0%) |
| 8 or more Rooms | 373 (34.6%) | 213 (21.8%) |
| Total | 1,077 (100.0%) | 979 (100.0%) |
Housing Structure by Heating Type in Lehighton borough
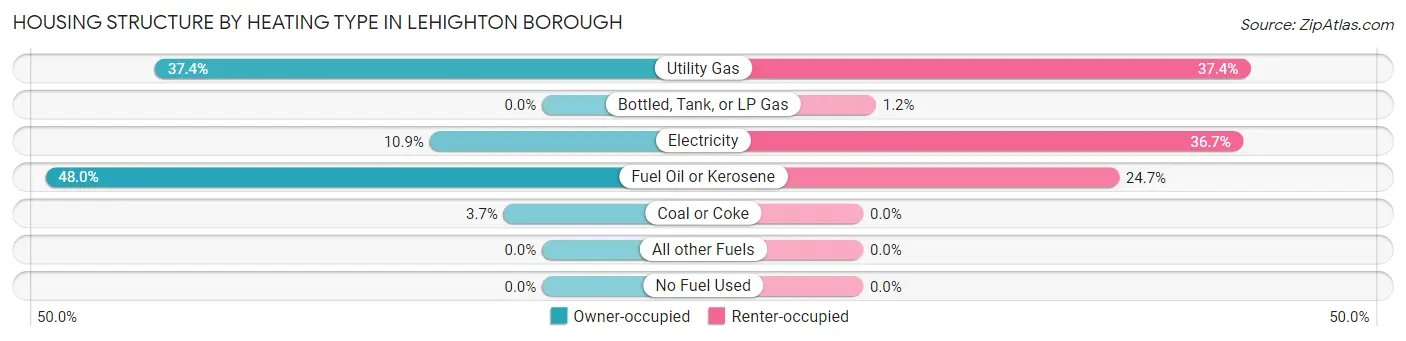
| Heating Type | Owner-occupied | Renter-occupied |
| Utility Gas | 403 (37.4%) | 366 (37.4%) |
| Bottled, Tank, or LP Gas | 0 (0.0%) | 12 (1.2%) |
| Electricity | 117 (10.9%) | 359 (36.7%) |
| Fuel Oil or Kerosene | 517 (48.0%) | 242 (24.7%) |
| Coal or Coke | 40 (3.7%) | 0 (0.0%) |
| All other Fuels | 0 (0.0%) | 0 (0.0%) |
| No Fuel Used | 0 (0.0%) | 0 (0.0%) |
| Total | 1,077 (100.0%) | 979 (100.0%) |
Household Vehicle Usage in Lehighton borough
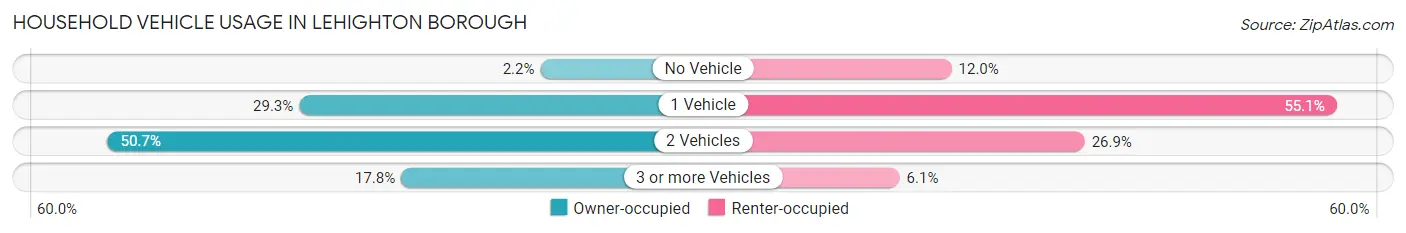
| Vehicles per Household | Owner-occupied | Renter-occupied |
| No Vehicle | 24 (2.2%) | 117 (11.9%) |
| 1 Vehicle | 315 (29.2%) | 539 (55.1%) |
| 2 Vehicles | 546 (50.7%) | 263 (26.9%) |
| 3 or more Vehicles | 192 (17.8%) | 60 (6.1%) |
| Total | 1,077 (100.0%) | 979 (100.0%) |
Real Estate & Mortgages in Lehighton borough
Real Estate and Mortgage Overview in Lehighton borough
| Characteristic | Without Mortgage | With Mortgage |
| Housing Units | 423 | 654 |
| Median Property Value | $153,000 | $177,400 |
| Median Household Income | $68,092 | $134 |
| Monthly Housing Costs | $538 | $0 |
| Real Estate Taxes | $3,039 | $0 |
Property Value by Mortgage Status in Lehighton borough
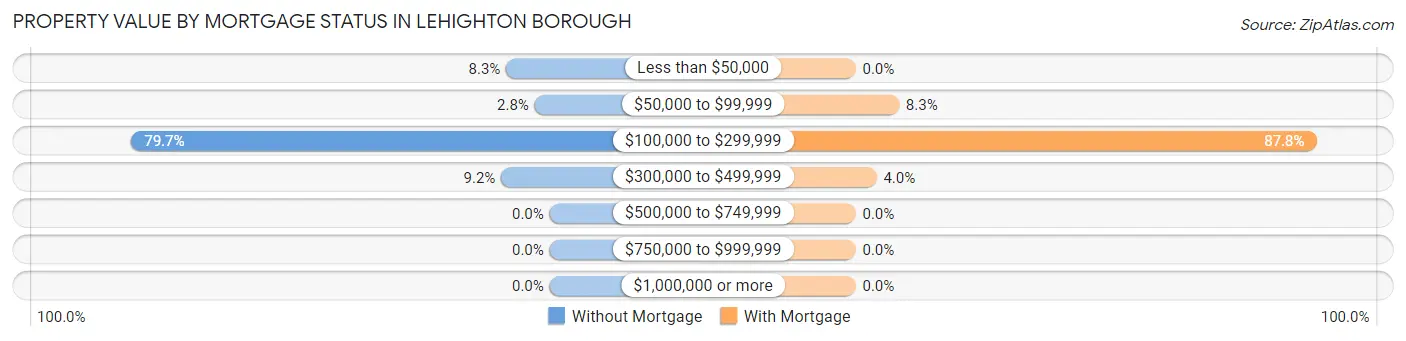
| Property Value | Without Mortgage | With Mortgage |
| Less than $50,000 | 35 (8.3%) | 0 (0.0%) |
| $50,000 to $99,999 | 12 (2.8%) | 54 (8.3%) |
| $100,000 to $299,999 | 337 (79.7%) | 574 (87.8%) |
| $300,000 to $499,999 | 39 (9.2%) | 26 (4.0%) |
| $500,000 to $749,999 | 0 (0.0%) | 0 (0.0%) |
| $750,000 to $999,999 | 0 (0.0%) | 0 (0.0%) |
| $1,000,000 or more | 0 (0.0%) | 0 (0.0%) |
| Total | 423 (100.0%) | 654 (100.0%) |
Household Income by Mortgage Status in Lehighton borough
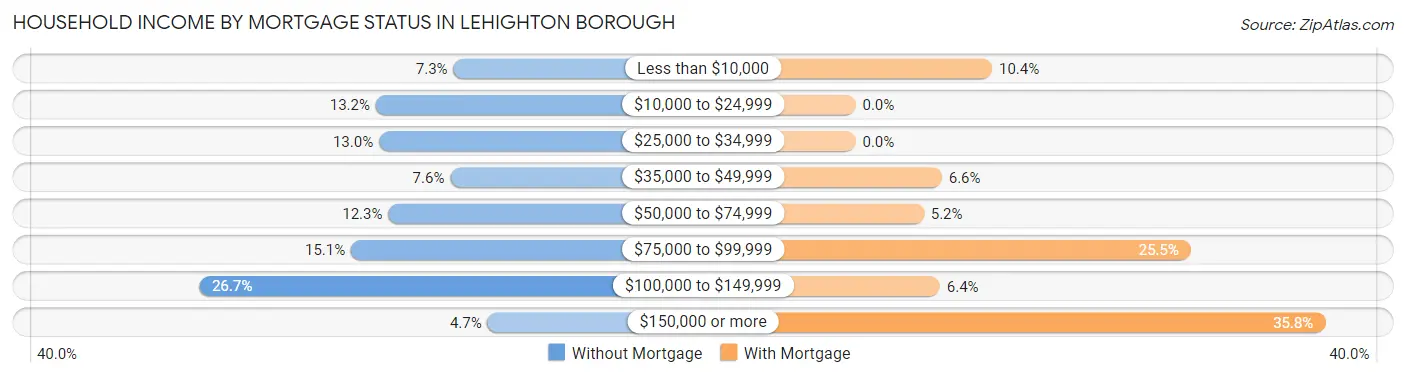
| Household Income | Without Mortgage | With Mortgage |
| Less than $10,000 | 31 (7.3%) | 68 (10.4%) |
| $10,000 to $24,999 | 56 (13.2%) | 0 (0.0%) |
| $25,000 to $34,999 | 55 (13.0%) | 0 (0.0%) |
| $35,000 to $49,999 | 32 (7.6%) | 43 (6.6%) |
| $50,000 to $74,999 | 52 (12.3%) | 34 (5.2%) |
| $75,000 to $99,999 | 64 (15.1%) | 167 (25.5%) |
| $100,000 to $149,999 | 113 (26.7%) | 42 (6.4%) |
| $150,000 or more | 20 (4.7%) | 234 (35.8%) |
| Total | 423 (100.0%) | 654 (100.0%) |
Property Value to Household Income Ratio in Lehighton borough
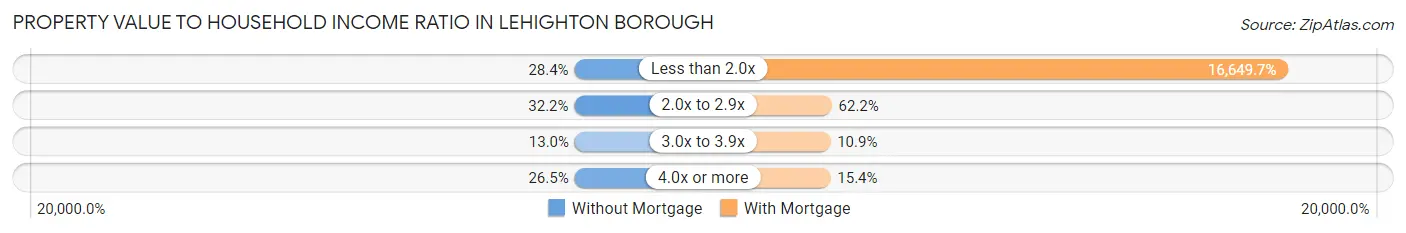
| Value-to-Income Ratio | Without Mortgage | With Mortgage |
| Less than 2.0x | 120 (28.4%) | 108,889 (16,649.7%) |
| 2.0x to 2.9x | 136 (32.2%) | 407 (62.2%) |
| 3.0x to 3.9x | 55 (13.0%) | 71 (10.9%) |
| 4.0x or more | 112 (26.5%) | 101 (15.4%) |
| Total | 423 (100.0%) | 654 (100.0%) |
Real Estate Taxes by Mortgage Status in Lehighton borough
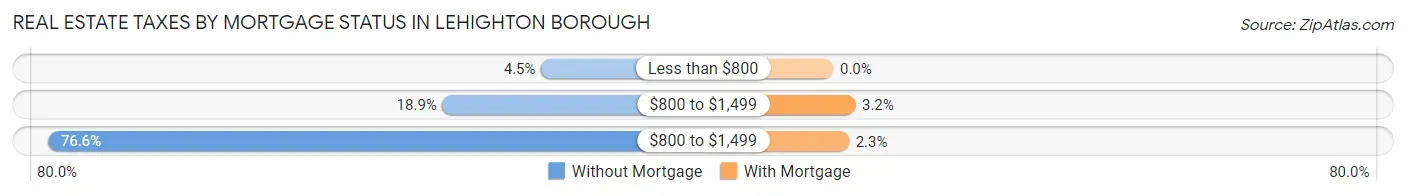
| Property Taxes | Without Mortgage | With Mortgage |
| Less than $800 | 19 (4.5%) | 0 (0.0%) |
| $800 to $1,499 | 80 (18.9%) | 21 (3.2%) |
| $800 to $1,499 | 324 (76.6%) | 15 (2.3%) |
| Total | 423 (100.0%) | 654 (100.0%) |
Health & Disability in Lehighton borough
Health Insurance Coverage by Age in Lehighton borough
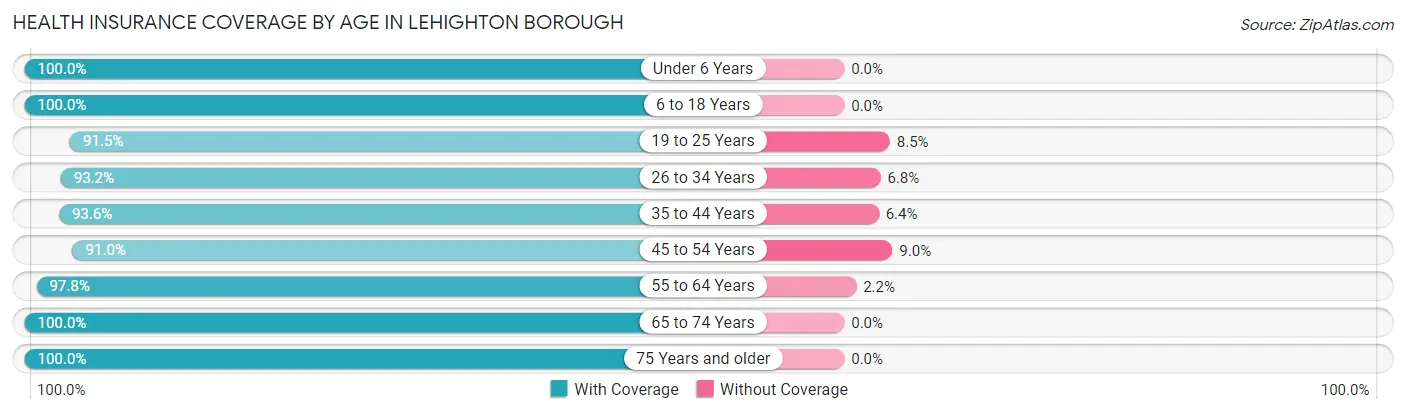
| Age Bracket | With Coverage | Without Coverage |
| Under 6 Years | 319 (100.0%) | 0 (0.0%) |
| 6 to 18 Years | 937 (100.0%) | 0 (0.0%) |
| 19 to 25 Years | 377 (91.5%) | 35 (8.5%) |
| 26 to 34 Years | 552 (93.2%) | 40 (6.8%) |
| 35 to 44 Years | 656 (93.6%) | 45 (6.4%) |
| 45 to 54 Years | 599 (91.0%) | 59 (9.0%) |
| 55 to 64 Years | 528 (97.8%) | 12 (2.2%) |
| 65 to 74 Years | 557 (100.0%) | 0 (0.0%) |
| 75 Years and older | 472 (100.0%) | 0 (0.0%) |
| Total | 4,997 (96.3%) | 191 (3.7%) |
Health Insurance Coverage by Citizenship Status in Lehighton borough
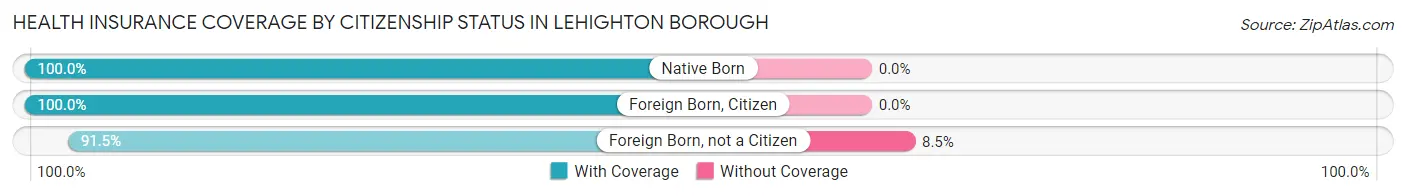
| Citizenship Status | With Coverage | Without Coverage |
| Native Born | 319 (100.0%) | 0 (0.0%) |
| Foreign Born, Citizen | 937 (100.0%) | 0 (0.0%) |
| Foreign Born, not a Citizen | 377 (91.5%) | 35 (8.5%) |
Health Insurance Coverage by Household Income in Lehighton borough
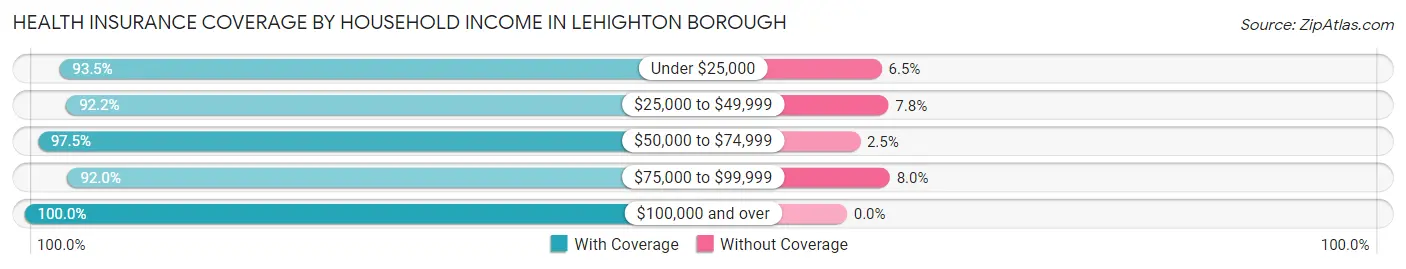
| Household Income | With Coverage | Without Coverage |
| Under $25,000 | 645 (93.5%) | 45 (6.5%) |
| $25,000 to $49,999 | 875 (92.2%) | 74 (7.8%) |
| $50,000 to $74,999 | 715 (97.5%) | 18 (2.5%) |
| $75,000 to $99,999 | 618 (92.0%) | 54 (8.0%) |
| $100,000 and over | 2,135 (100.0%) | 0 (0.0%) |
Public vs Private Health Insurance Coverage by Age in Lehighton borough
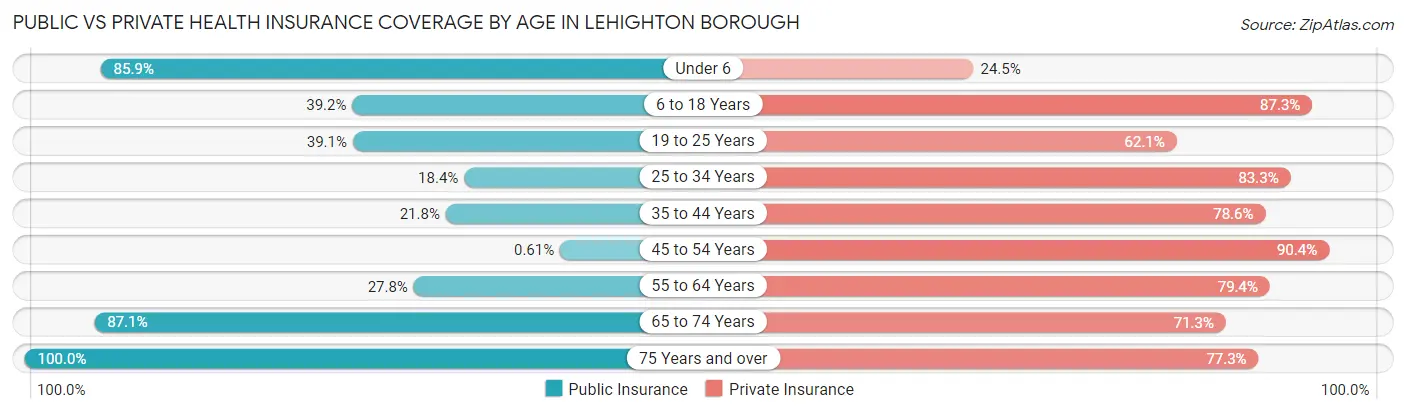
| Age Bracket | Public Insurance | Private Insurance |
| Under 6 | 274 (85.9%) | 78 (24.4%) |
| 6 to 18 Years | 367 (39.2%) | 818 (87.3%) |
| 19 to 25 Years | 161 (39.1%) | 256 (62.1%) |
| 25 to 34 Years | 109 (18.4%) | 493 (83.3%) |
| 35 to 44 Years | 153 (21.8%) | 551 (78.6%) |
| 45 to 54 Years | 4 (0.6%) | 595 (90.4%) |
| 55 to 64 Years | 150 (27.8%) | 429 (79.4%) |
| 65 to 74 Years | 485 (87.1%) | 397 (71.3%) |
| 75 Years and over | 472 (100.0%) | 365 (77.3%) |
| Total | 2,175 (41.9%) | 3,982 (76.7%) |
Disability Status by Sex by Age in Lehighton borough
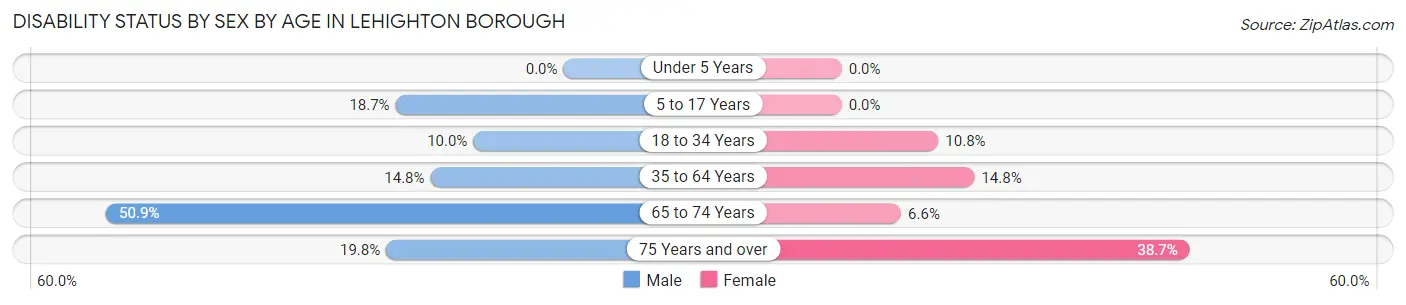
| Age Bracket | Male | Female |
| Under 5 Years | 0 (0.0%) | 0 (0.0%) |
| 5 to 17 Years | 75 (18.7%) | 0 (0.0%) |
| 18 to 34 Years | 48 (10.0%) | 62 (10.8%) |
| 35 to 64 Years | 141 (14.8%) | 140 (14.8%) |
| 65 to 74 Years | 168 (50.9%) | 15 (6.6%) |
| 75 Years and over | 31 (19.8%) | 122 (38.7%) |
Disability Class by Sex by Age in Lehighton borough
Disability Class: Hearing Difficulty
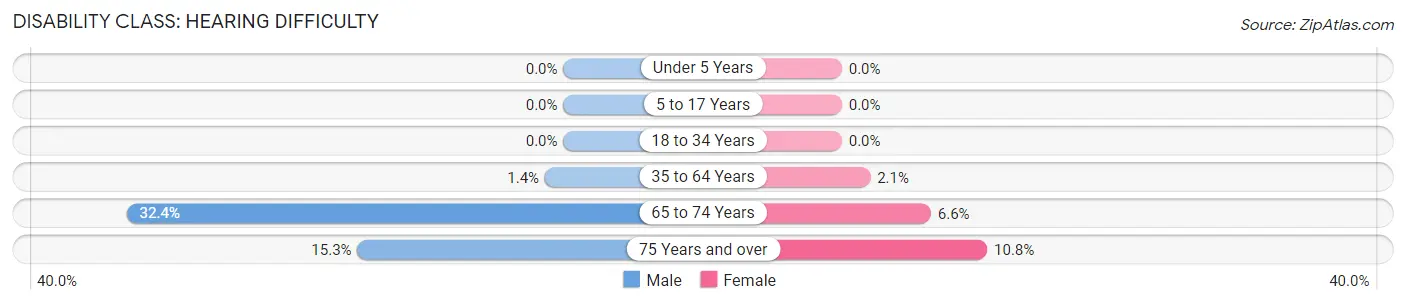
| Age Bracket | Male | Female |
| Under 5 Years | 0 (0.0%) | 0 (0.0%) |
| 5 to 17 Years | 0 (0.0%) | 0 (0.0%) |
| 18 to 34 Years | 0 (0.0%) | 0 (0.0%) |
| 35 to 64 Years | 13 (1.4%) | 20 (2.1%) |
| 65 to 74 Years | 107 (32.4%) | 15 (6.6%) |
| 75 Years and over | 24 (15.3%) | 34 (10.8%) |
Disability Class: Vision Difficulty
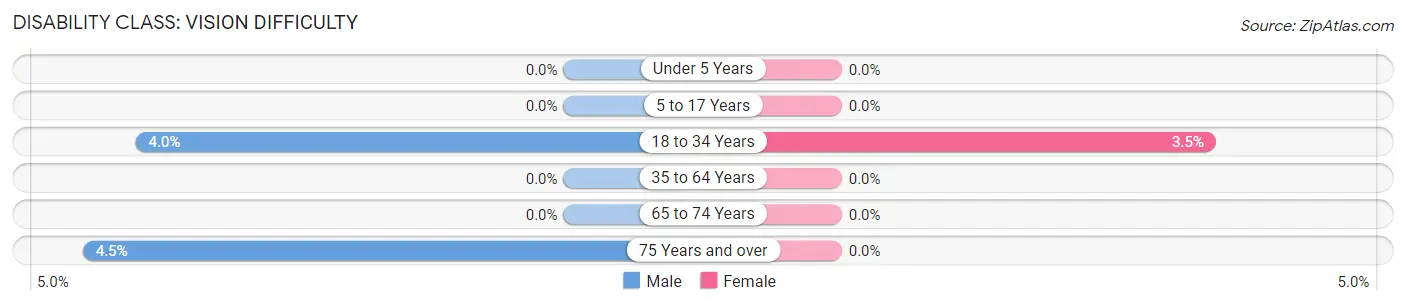
| Age Bracket | Male | Female |
| Under 5 Years | 0 (0.0%) | 0 (0.0%) |
| 5 to 17 Years | 0 (0.0%) | 0 (0.0%) |
| 18 to 34 Years | 19 (4.0%) | 20 (3.5%) |
| 35 to 64 Years | 0 (0.0%) | 0 (0.0%) |
| 65 to 74 Years | 0 (0.0%) | 0 (0.0%) |
| 75 Years and over | 7 (4.5%) | 0 (0.0%) |
Disability Class: Cognitive Difficulty
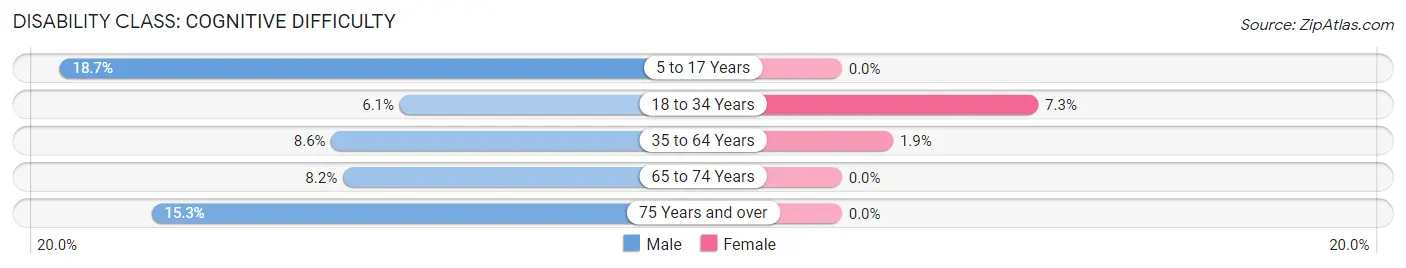
| Age Bracket | Male | Female |
| 5 to 17 Years | 75 (18.7%) | 0 (0.0%) |
| 18 to 34 Years | 29 (6.1%) | 42 (7.3%) |
| 35 to 64 Years | 82 (8.6%) | 18 (1.9%) |
| 65 to 74 Years | 27 (8.2%) | 0 (0.0%) |
| 75 Years and over | 24 (15.3%) | 0 (0.0%) |
Disability Class: Ambulatory Difficulty
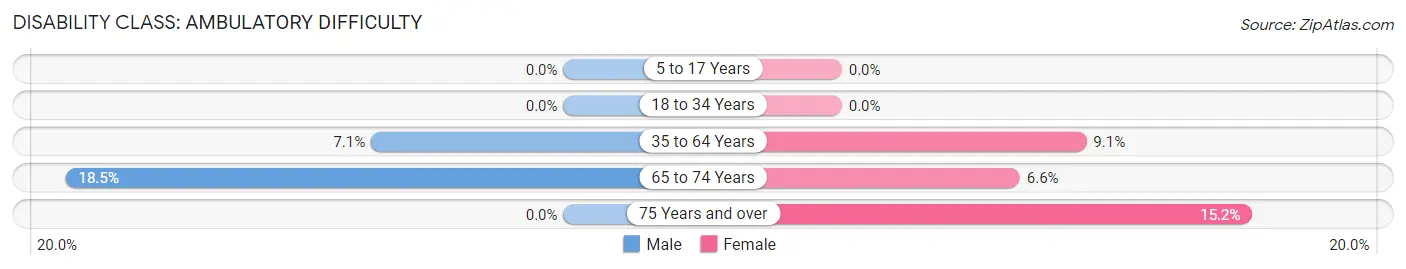
| Age Bracket | Male | Female |
| 5 to 17 Years | 0 (0.0%) | 0 (0.0%) |
| 18 to 34 Years | 0 (0.0%) | 0 (0.0%) |
| 35 to 64 Years | 68 (7.1%) | 86 (9.1%) |
| 65 to 74 Years | 61 (18.5%) | 15 (6.6%) |
| 75 Years and over | 0 (0.0%) | 48 (15.2%) |
Disability Class: Self-Care Difficulty
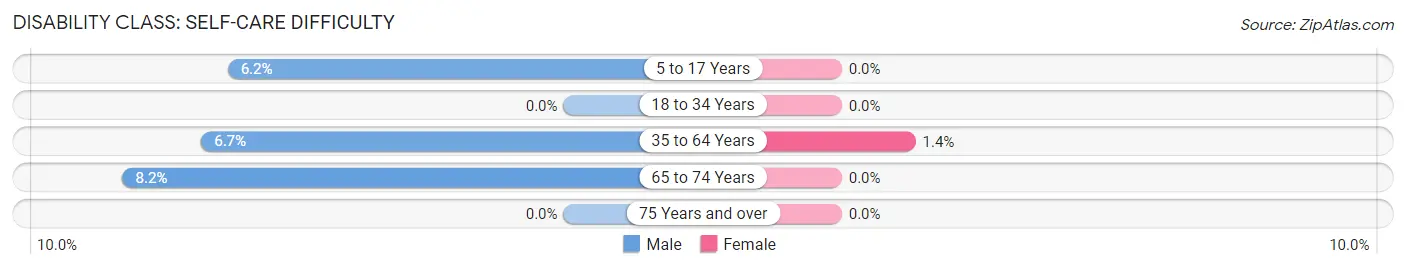
| Age Bracket | Male | Female |
| 5 to 17 Years | 25 (6.2%) | 0 (0.0%) |
| 18 to 34 Years | 0 (0.0%) | 0 (0.0%) |
| 35 to 64 Years | 64 (6.7%) | 13 (1.4%) |
| 65 to 74 Years | 27 (8.2%) | 0 (0.0%) |
| 75 Years and over | 0 (0.0%) | 0 (0.0%) |
Technology Access in Lehighton borough
Computing Device Access in Lehighton borough
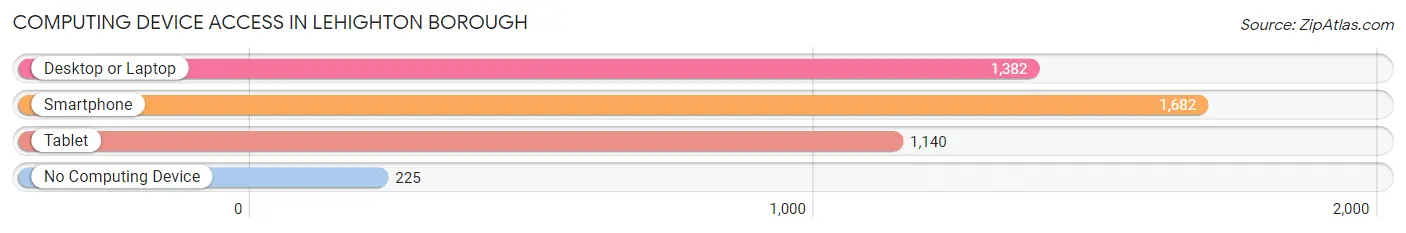
| Device Type | # Households | % Households |
| Desktop or Laptop | 1,382 | 67.2% |
| Smartphone | 1,682 | 81.8% |
| Tablet | 1,140 | 55.4% |
| No Computing Device | 225 | 10.9% |
| Total | 2,056 | 100.0% |
Internet Access in Lehighton borough
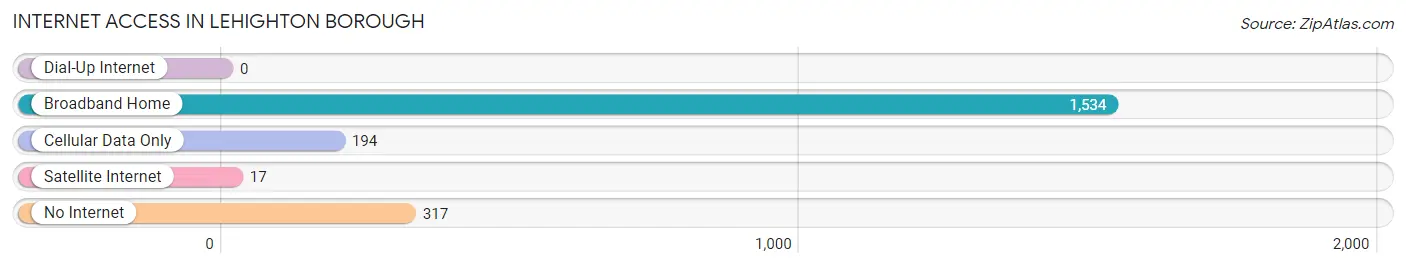
| Internet Type | # Households | % Households |
| Dial-Up Internet | 0 | 0.0% |
| Broadband Home | 1,534 | 74.6% |
| Cellular Data Only | 194 | 9.4% |
| Satellite Internet | 17 | 0.8% |
| No Internet | 317 | 15.4% |
| Total | 2,056 | 100.0% |
Lehighton borough Summary
Lehighton Borough is a small borough located in Carbon County, Pennsylvania. It is situated in the Lehigh Valley region of the state, and is part of the Allentown-Bethlehem-Easton metropolitan area. The borough has a population of 5,072 as of the 2010 census, and is the county seat of Carbon County.
History
Lehighton was founded in 1818 by a group of settlers from Northampton County. The town was named after the Lehigh River, which runs through the area. The town was originally known as Lehigh Town, but the name was changed to Lehighton in 1824.
The town was an important stop on the Lehigh Canal, which was built in the early 19th century to transport coal from the Lehigh Valley to Philadelphia. The canal was a major factor in the growth of the town, and it was the site of the first railroad station in Carbon County.
The town was also an important stop on the Lehigh Valley Railroad, which was built in the late 19th century. The railroad was a major factor in the growth of the town, and it was the site of the first railroad station in Carbon County.
The town was incorporated as a borough in 1851. The borough was originally part of Lehigh Township, but was separated in 1866.
Geography
Lehighton is located in Carbon County, Pennsylvania, in the Lehigh Valley region of the state. It is situated in the foothills of the Pocono Mountains, and is bordered by Lehigh Township to the north, East Penn Township to the east, Mahoning Township to the south, and Franklin Township to the west.
The borough has a total area of 1.3 square miles, all of which is land. The Lehigh River runs through the borough, and the borough is home to several parks, including the Lehighton Recreation Park and the Lehighton Memorial Park.
Economy
The economy of Lehighton is largely based on manufacturing and retail. The borough is home to several manufacturing companies, including the Lehighton Manufacturing Company, which produces industrial equipment, and the Lehighton Foundry, which produces cast iron products.
The borough is also home to several retail stores, including the Lehighton Shopping Center, which is the largest shopping center in the borough. The borough is also home to several restaurants, including the Lehighton Diner, which is a popular local eatery.
Demographics
As of the 2010 census, the population of Lehighton was 5,072. The racial makeup of the borough was 95.3% White, 1.2% African American, 0.3% Native American, 0.7% Asian, 0.1% Pacific Islander, 0.7% from other races, and 1.9% from two or more races. Hispanic or Latino of any race were 2.7% of the population.
The median household income in the borough was $41,944, and the median family income was $50,938. The per capita income in the borough was $20,945. About 11.2% of families and 14.2% of the population were below the poverty line, including 22.2% of those under age 18 and 8.2% of those age 65 or over.
Common Questions
What is Per Capita Income in Lehighton borough?
Per Capita income in Lehighton borough is $29,253.
What is the Median Family Income in Lehighton borough?
Median Family Income in Lehighton borough is $77,964.
What is the Median Household income in Lehighton borough?
Median Household Income in Lehighton borough is $59,940.
What is Income or Wage Gap in Lehighton borough?
Income or Wage Gap in Lehighton borough is 16.4%.
Women in Lehighton borough earn 83.6 cents for every dollar earned by a man.
What is Inequality or Gini Index in Lehighton borough?
Inequality or Gini Index in Lehighton borough is 0.40.
What is the Total Population of Lehighton borough?
Total Population of Lehighton borough is 5,279.
What is the Total Male Population of Lehighton borough?
Total Male Population of Lehighton borough is 2,567.
What is the Total Female Population of Lehighton borough?
Total Female Population of Lehighton borough is 2,712.
What is the Ratio of Males per 100 Females in Lehighton borough?
There are 94.65 Males per 100 Females in Lehighton borough.
What is the Ratio of Females per 100 Males in Lehighton borough?
There are 105.65 Females per 100 Males in Lehighton borough.
What is the Median Population Age in Lehighton borough?
Median Population Age in Lehighton borough is 42.1 Years.
What is the Average Family Size in Lehighton borough
Average Family Size in Lehighton borough is 3.0 People.
What is the Average Household Size in Lehighton borough
Average Household Size in Lehighton borough is 2.5 People.
How Large is the Labor Force in Lehighton borough?
There are 2,578 People in the Labor Forcein in Lehighton borough.
What is the Percentage of People in the Labor Force in Lehighton borough?
61.2% of People are in the Labor Force in Lehighton borough.
What is the Unemployment Rate in Lehighton borough?
Unemployment Rate in Lehighton borough is 9.4%.