Cities with the Most Immigrants from Central America in Nebraska
RELATED REPORTS & OPTIONS
Central America
Nebraska
Compare Cities
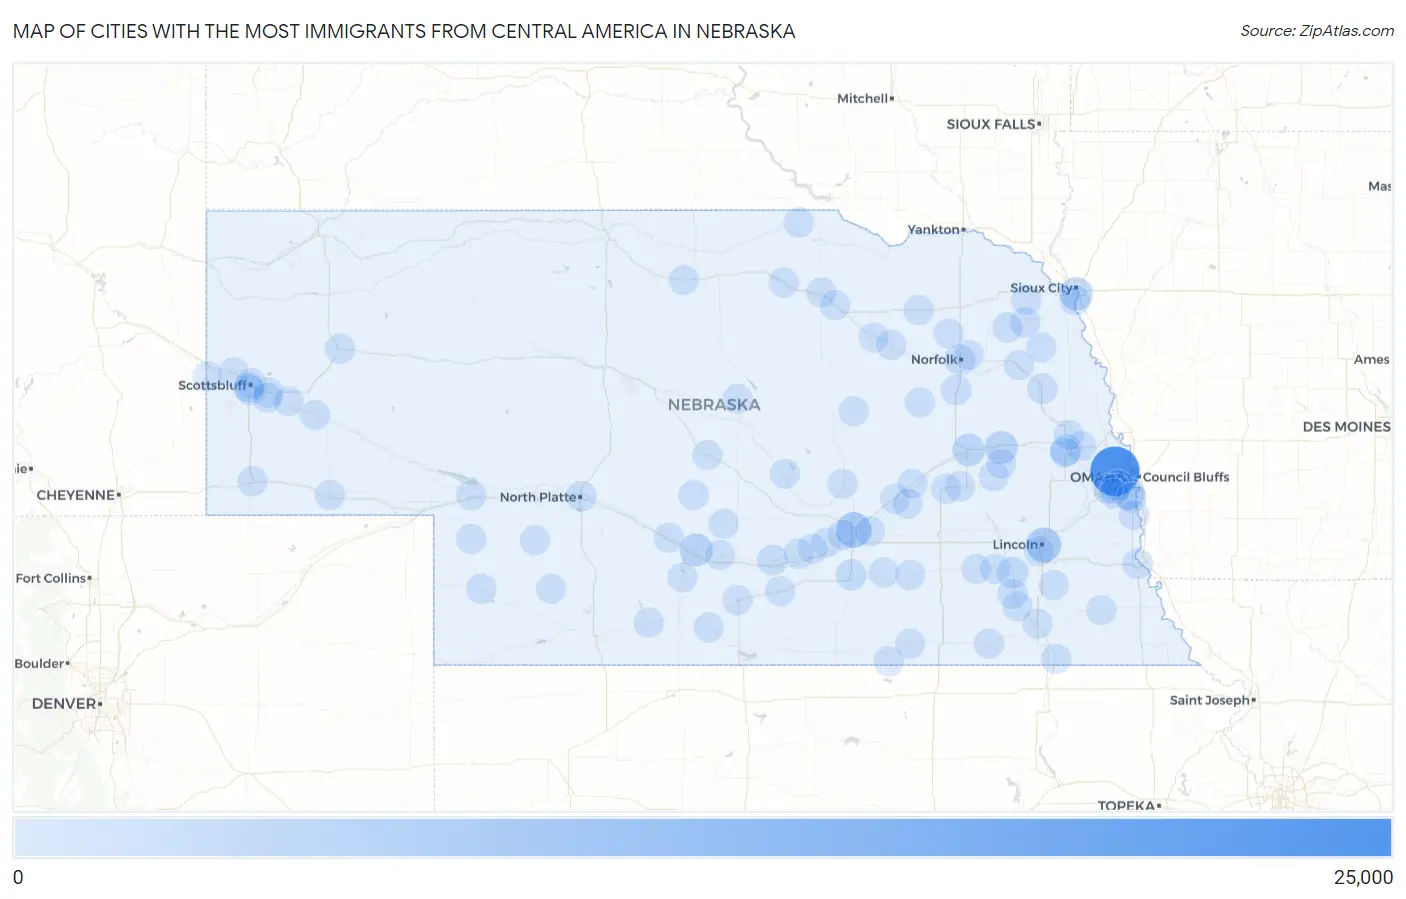
Map of Cities with the Most Immigrants from Central America in Nebraska
0
25,000
Cities with the Most Immigrants from Central America in Nebraska
| City | Central America | vs State | vs National | |
| 1. | Omaha | 22,290 | 66,363(33.59%)#1 | 14,469,050(0.15%)#75 |
| 2. | Grand Island | 6,025 | 66,363(9.08%)#2 | 14,469,050(0.04%)#352 |
| 3. | Lincoln | 5,253 | 66,363(7.92%)#3 | 14,469,050(0.04%)#415 |
| 4. | South Sioux City | 3,164 | 66,363(4.77%)#4 | 14,469,050(0.02%)#660 |
| 5. | Lexington | 3,149 | 66,363(4.75%)#5 | 14,469,050(0.02%)#666 |
| 6. | Schuyler | 2,963 | 66,363(4.46%)#6 | 14,469,050(0.02%)#706 |
| 7. | Columbus | 2,559 | 66,363(3.86%)#7 | 14,469,050(0.02%)#791 |
| 8. | Bellevue | 2,454 | 66,363(3.70%)#8 | 14,469,050(0.02%)#820 |
| 9. | Fremont | 1,467 | 66,363(2.21%)#9 | 14,469,050(0.01%)#1,202 |
| 10. | Crete | 1,353 | 66,363(2.04%)#10 | 14,469,050(0.01%)#1,267 |
| 11. | Hastings | 1,066 | 66,363(1.61%)#11 | 14,469,050(0.01%)#1,509 |
| 12. | Norfolk | 865 | 66,363(1.30%)#12 | 14,469,050(0.01%)#1,756 |
| 13. | Kearney | 723 | 66,363(1.09%)#13 | 14,469,050(0.00%)#1,968 |
| 14. | Scottsbluff | 535 | 66,363(0.81%)#14 | 14,469,050(0.00%)#2,405 |
| 15. | Madison | 486 | 66,363(0.73%)#15 | 14,469,050(0.00%)#2,544 |
| 16. | Ralston | 451 | 66,363(0.68%)#16 | 14,469,050(0.00%)#2,664 |
| 17. | Nebraska City | 417 | 66,363(0.63%)#17 | 14,469,050(0.00%)#2,782 |
| 18. | West Point | 415 | 66,363(0.63%)#18 | 14,469,050(0.00%)#2,792 |
| 19. | North Platte | 354 | 66,363(0.53%)#19 | 14,469,050(0.00%)#3,061 |
| 20. | La Vista | 352 | 66,363(0.53%)#20 | 14,469,050(0.00%)#3,068 |
| 21. | Gering | 346 | 66,363(0.52%)#21 | 14,469,050(0.00%)#3,100 |
| 22. | Wakefield | 344 | 66,363(0.52%)#22 | 14,469,050(0.00%)#3,109 |
| 23. | Dakota City | 342 | 66,363(0.52%)#23 | 14,469,050(0.00%)#3,120 |
| 24. | Wilber | 259 | 66,363(0.39%)#24 | 14,469,050(0.00%)#3,635 |
| 25. | Gibbon | 254 | 66,363(0.38%)#25 | 14,469,050(0.00%)#3,677 |
| 26. | Papillion | 175 | 66,363(0.26%)#26 | 14,469,050(0.00%)#4,469 |
| 27. | Wayne | 170 | 66,363(0.26%)#27 | 14,469,050(0.00%)#4,540 |
| 28. | Imperial | 150 | 66,363(0.23%)#28 | 14,469,050(0.00%)#4,817 |
| 29. | Mitchell | 136 | 66,363(0.20%)#29 | 14,469,050(0.00%)#5,018 |
| 30. | Harvard | 131 | 66,363(0.20%)#30 | 14,469,050(0.00%)#5,087 |
| 31. | Holdrege | 127 | 66,363(0.19%)#31 | 14,469,050(0.00%)#5,149 |
| 32. | Cozad | 124 | 66,363(0.19%)#32 | 14,469,050(0.00%)#5,209 |
| 33. | Minden | 123 | 66,363(0.19%)#33 | 14,469,050(0.00%)#5,223 |
| 34. | Arlington | 117 | 66,363(0.18%)#34 | 14,469,050(0.00%)#5,357 |
| 35. | Nickerson | 116 | 66,363(0.17%)#35 | 14,469,050(0.00%)#5,381 |
| 36. | Ogallala | 110 | 66,363(0.17%)#36 | 14,469,050(0.00%)#5,499 |
| 37. | Woodland Park | 97 | 66,363(0.15%)#37 | 14,469,050(0.00%)#5,809 |
| 38. | Minatare | 96 | 66,363(0.14%)#38 | 14,469,050(0.00%)#5,831 |
| 39. | Central City | 89 | 66,363(0.13%)#39 | 14,469,050(0.00%)#6,022 |
| 40. | Broken Bow | 88 | 66,363(0.13%)#40 | 14,469,050(0.00%)#6,048 |
| 41. | Lyman | 87 | 66,363(0.13%)#41 | 14,469,050(0.00%)#6,079 |
| 42. | St Paul | 75 | 66,363(0.11%)#42 | 14,469,050(0.00%)#6,410 |
| 43. | Wood River | 74 | 66,363(0.11%)#43 | 14,469,050(0.00%)#6,451 |
| 44. | Alda | 69 | 66,363(0.10%)#44 | 14,469,050(0.00%)#6,620 |
| 45. | Dorchester | 69 | 66,363(0.10%)#45 | 14,469,050(0.00%)#6,621 |
| 46. | David City | 63 | 66,363(0.09%)#46 | 14,469,050(0.00%)#6,839 |
| 47. | Terrytown | 63 | 66,363(0.09%)#47 | 14,469,050(0.00%)#6,852 |
| 48. | Barneston | 62 | 66,363(0.09%)#48 | 14,469,050(0.00%)#6,896 |
| 49. | Shelton | 61 | 66,363(0.09%)#49 | 14,469,050(0.00%)#6,928 |
| 50. | Fairbury | 59 | 66,363(0.09%)#50 | 14,469,050(0.00%)#7,001 |
| 51. | Inglewood | 56 | 66,363(0.08%)#51 | 14,469,050(0.00%)#7,142 |
| 52. | Newman Grove | 55 | 66,363(0.08%)#52 | 14,469,050(0.00%)#7,189 |
| 53. | Offutt Afb | 52 | 66,363(0.08%)#53 | 14,469,050(0.00%)#7,310 |
| 54. | Plainview | 52 | 66,363(0.08%)#54 | 14,469,050(0.00%)#7,338 |
| 55. | Hordville | 51 | 66,363(0.08%)#55 | 14,469,050(0.00%)#7,394 |
| 56. | Beatrice | 50 | 66,363(0.08%)#56 | 14,469,050(0.00%)#7,406 |
| 57. | O Neill | 50 | 66,363(0.08%)#57 | 14,469,050(0.00%)#7,427 |
| 58. | Grant | 50 | 66,363(0.08%)#58 | 14,469,050(0.00%)#7,443 |
| 59. | Chalco | 49 | 66,363(0.07%)#59 | 14,469,050(0.00%)#7,472 |
| 60. | Overton | 49 | 66,363(0.07%)#60 | 14,469,050(0.00%)#7,506 |
| 61. | Ainsworth | 47 | 66,363(0.07%)#61 | 14,469,050(0.00%)#7,612 |
| 62. | Friend | 46 | 66,363(0.07%)#62 | 14,469,050(0.00%)#7,668 |
| 63. | Bridgeport | 41 | 66,363(0.06%)#63 | 14,469,050(0.00%)#7,963 |
| 64. | Firth | 41 | 66,363(0.06%)#64 | 14,469,050(0.00%)#7,980 |
| 65. | Hayes Center | 40 | 66,363(0.06%)#65 | 14,469,050(0.00%)#8,040 |
| 66. | Shelby | 39 | 66,363(0.06%)#66 | 14,469,050(0.00%)#8,098 |
| 67. | Neligh | 35 | 66,363(0.05%)#67 | 14,469,050(0.00%)#8,336 |
| 68. | Allen | 35 | 66,363(0.05%)#68 | 14,469,050(0.00%)#8,361 |
| 69. | Cambridge | 33 | 66,363(0.05%)#69 | 14,469,050(0.00%)#8,484 |
| 70. | Oxford | 32 | 66,363(0.05%)#70 | 14,469,050(0.00%)#8,564 |
| 71. | Bayard | 30 | 66,363(0.05%)#71 | 14,469,050(0.00%)#8,698 |
| 72. | Tecumseh | 29 | 66,363(0.04%)#72 | 14,469,050(0.00%)#8,775 |
| 73. | Sutton | 29 | 66,363(0.04%)#73 | 14,469,050(0.00%)#8,782 |
| 74. | Sumner | 28 | 66,363(0.04%)#74 | 14,469,050(0.00%)#8,889 |
| 75. | Yankee Hill | 28 | 66,363(0.04%)#75 | 14,469,050(0.00%)#8,890 |
| 76. | Kimball | 25 | 66,363(0.04%)#76 | 14,469,050(0.00%)#9,136 |
| 77. | Elwood | 25 | 66,363(0.04%)#77 | 14,469,050(0.00%)#9,170 |
| 78. | Loup City | 24 | 66,363(0.04%)#78 | 14,469,050(0.00%)#9,266 |
| 79. | Osceola | 24 | 66,363(0.04%)#79 | 14,469,050(0.00%)#9,272 |
| 80. | De Witt | 24 | 66,363(0.04%)#80 | 14,469,050(0.00%)#9,284 |
| 81. | Octavia | 24 | 66,363(0.04%)#81 | 14,469,050(0.00%)#9,296 |
| 82. | Pender | 23 | 66,363(0.03%)#82 | 14,469,050(0.00%)#9,378 |
| 83. | Sidney | 22 | 66,363(0.03%)#83 | 14,469,050(0.00%)#9,440 |
| 84. | Wisner | 21 | 66,363(0.03%)#84 | 14,469,050(0.00%)#9,618 |
| 85. | Clarks | 21 | 66,363(0.03%)#85 | 14,469,050(0.00%)#9,647 |
| 86. | Butte | 21 | 66,363(0.03%)#86 | 14,469,050(0.00%)#9,648 |
| 87. | Alliance | 20 | 66,363(0.03%)#87 | 14,469,050(0.00%)#9,675 |
| 88. | Atkinson | 20 | 66,363(0.03%)#88 | 14,469,050(0.00%)#9,753 |
| 89. | Plattsmouth | 17 | 66,363(0.03%)#89 | 14,469,050(0.00%)#10,079 |
| 90. | Superior | 17 | 66,363(0.03%)#90 | 14,469,050(0.00%)#10,118 |
| 91. | Phillips | 17 | 66,363(0.03%)#91 | 14,469,050(0.00%)#10,190 |
| 92. | Taylor | 17 | 66,363(0.03%)#92 | 14,469,050(0.00%)#10,204 |
| 93. | Inman | 17 | 66,363(0.03%)#93 | 14,469,050(0.00%)#10,206 |
| 94. | Wallace | 16 | 66,363(0.02%)#94 | 14,469,050(0.00%)#10,348 |
| 95. | Clearwater | 16 | 66,363(0.02%)#95 | 14,469,050(0.00%)#10,351 |
| 96. | Melbeta | 16 | 66,363(0.02%)#96 | 14,469,050(0.00%)#10,360 |
| 97. | Pierce | 15 | 66,363(0.02%)#97 | 14,469,050(0.00%)#10,431 |
| 98. | Spalding | 15 | 66,363(0.02%)#98 | 14,469,050(0.00%)#10,503 |
| 99. | Oconto | 15 | 66,363(0.02%)#99 | 14,469,050(0.00%)#10,518 |
| 100. | Ruskin | 14 | 66,363(0.02%)#100 | 14,469,050(0.00%)#10,669 |
Common Questions
What are the Top 10 Cities with the Most Immigrants from Central America in Nebraska?
Top 10 Cities with the Most Immigrants from Central America in Nebraska are:
#1
22,290
#2
6,025
#3
5,253
#4
3,164
#5
3,149
#6
2,963
#7
2,559
#8
2,454
#9
1,467
#10
1,353
What city has the Most Immigrants from Central America in Nebraska?
Omaha has the Most Immigrants from Central America in Nebraska with 22,290.
What is the Total Immigrants from Central America in the State of Nebraska?
Total Immigrants from Central America in Nebraska is 66,363.
What is the Total Immigrants from Central America in the United States?
Total Immigrants from Central America in the United States is 14,469,050.