Cities with the Most Immigrants from Central America in Kentucky
RELATED REPORTS & OPTIONS
Central America
Kentucky
Compare Cities
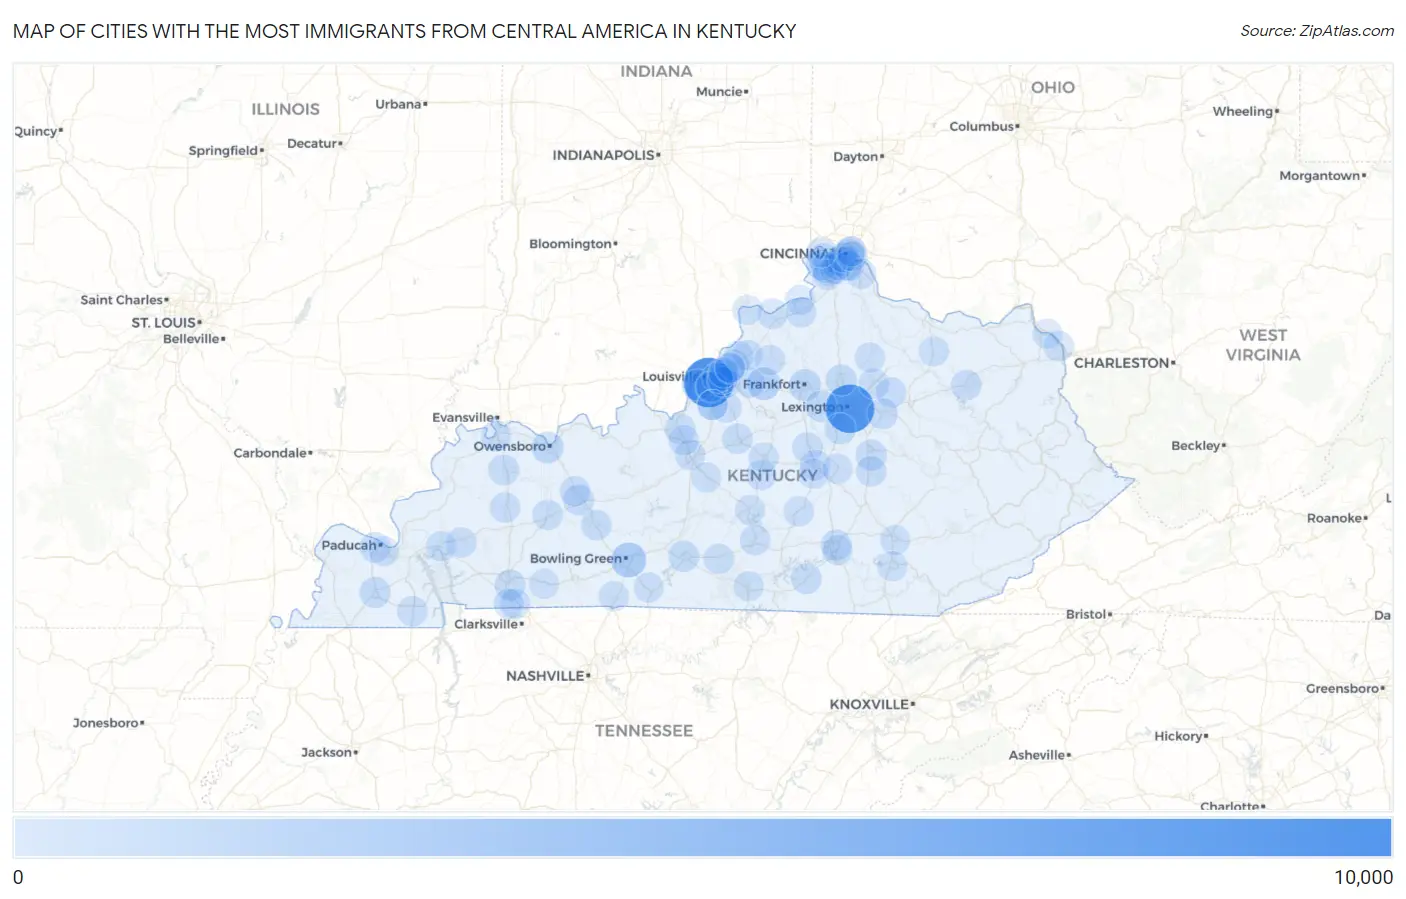
Map of Cities with the Most Immigrants from Central America in Kentucky
0
10,000
Cities with the Most Immigrants from Central America in Kentucky
| City | Central America | vs State | vs National | |
| 1. | Louisville | 8,685 | 43,760(19.85%)#1 | 14,469,050(0.06%)#235 |
| 2. | Lexington | 8,202 | 43,760(18.74%)#2 | 14,469,050(0.06%)#253 |
| 3. | Bowling Green | 1,961 | 43,760(4.48%)#3 | 14,469,050(0.01%)#965 |
| 4. | Covington | 1,318 | 43,760(3.01%)#4 | 14,469,050(0.01%)#1,291 |
| 5. | Shelbyville | 1,160 | 43,760(2.65%)#5 | 14,469,050(0.01%)#1,423 |
| 6. | Frankfort | 750 | 43,760(1.71%)#6 | 14,469,050(0.01%)#1,924 |
| 7. | Owensboro | 678 | 43,760(1.55%)#7 | 14,469,050(0.00%)#2,062 |
| 8. | Versailles | 594 | 43,760(1.36%)#8 | 14,469,050(0.00%)#2,248 |
| 9. | Florence | 593 | 43,760(1.36%)#9 | 14,469,050(0.00%)#2,250 |
| 10. | Nicholasville | 442 | 43,760(1.01%)#10 | 14,469,050(0.00%)#2,693 |
| 11. | Mayfield | 441 | 43,760(1.01%)#11 | 14,469,050(0.00%)#2,699 |
| 12. | Georgetown | 432 | 43,760(0.99%)#12 | 14,469,050(0.00%)#2,728 |
| 13. | Shively | 429 | 43,760(0.98%)#13 | 14,469,050(0.00%)#2,738 |
| 14. | Glasgow | 425 | 43,760(0.97%)#14 | 14,469,050(0.00%)#2,751 |
| 15. | Richmond | 350 | 43,760(0.80%)#15 | 14,469,050(0.00%)#3,076 |
| 16. | Hopkinsville | 350 | 43,760(0.80%)#16 | 14,469,050(0.00%)#3,077 |
| 17. | Hebron | 342 | 43,760(0.78%)#17 | 14,469,050(0.00%)#3,119 |
| 18. | Beaver Dam | 303 | 43,760(0.69%)#18 | 14,469,050(0.00%)#3,328 |
| 19. | Jeffersontown | 292 | 43,760(0.67%)#19 | 14,469,050(0.00%)#3,392 |
| 20. | Sebree | 282 | 43,760(0.64%)#20 | 14,469,050(0.00%)#3,467 |
| 21. | Somerset | 274 | 43,760(0.63%)#21 | 14,469,050(0.00%)#3,522 |
| 22. | Winchester | 270 | 43,760(0.62%)#22 | 14,469,050(0.00%)#3,554 |
| 23. | Morgantown | 245 | 43,760(0.56%)#23 | 14,469,050(0.00%)#3,746 |
| 24. | Bardstown | 236 | 43,760(0.54%)#24 | 14,469,050(0.00%)#3,813 |
| 25. | Oakbrook | 234 | 43,760(0.53%)#25 | 14,469,050(0.00%)#3,832 |
| 26. | Monticello | 225 | 43,760(0.51%)#26 | 14,469,050(0.00%)#3,891 |
| 27. | Harrodsburg | 214 | 43,760(0.49%)#27 | 14,469,050(0.00%)#3,976 |
| 28. | Fort Knox | 209 | 43,760(0.48%)#28 | 14,469,050(0.00%)#4,028 |
| 29. | Burlington | 207 | 43,760(0.47%)#29 | 14,469,050(0.00%)#4,045 |
| 30. | Lyndon | 197 | 43,760(0.45%)#30 | 14,469,050(0.00%)#4,166 |
| 31. | Paris | 194 | 43,760(0.44%)#31 | 14,469,050(0.00%)#4,206 |
| 32. | Henderson | 184 | 43,760(0.42%)#32 | 14,469,050(0.00%)#4,327 |
| 33. | Columbia | 184 | 43,760(0.42%)#33 | 14,469,050(0.00%)#4,334 |
| 34. | Morehead | 182 | 43,760(0.42%)#34 | 14,469,050(0.00%)#4,362 |
| 35. | Berea | 181 | 43,760(0.41%)#35 | 14,469,050(0.00%)#4,369 |
| 36. | Danville | 179 | 43,760(0.41%)#36 | 14,469,050(0.00%)#4,397 |
| 37. | Madisonville | 166 | 43,760(0.38%)#37 | 14,469,050(0.00%)#4,582 |
| 38. | Lebanon | 163 | 43,760(0.37%)#38 | 14,469,050(0.00%)#4,637 |
| 39. | Elizabethtown | 158 | 43,760(0.36%)#39 | 14,469,050(0.00%)#4,695 |
| 40. | Murray | 157 | 43,760(0.36%)#40 | 14,469,050(0.00%)#4,704 |
| 41. | Elsmere | 157 | 43,760(0.36%)#41 | 14,469,050(0.00%)#4,707 |
| 42. | Paducah | 154 | 43,760(0.35%)#42 | 14,469,050(0.00%)#4,756 |
| 43. | Radcliff | 152 | 43,760(0.35%)#43 | 14,469,050(0.00%)#4,784 |
| 44. | Simpsonville | 149 | 43,760(0.34%)#44 | 14,469,050(0.00%)#4,834 |
| 45. | Newport | 144 | 43,760(0.33%)#45 | 14,469,050(0.00%)#4,898 |
| 46. | Crestwood | 143 | 43,760(0.33%)#46 | 14,469,050(0.00%)#4,916 |
| 47. | Mount Washington | 139 | 43,760(0.32%)#47 | 14,469,050(0.00%)#4,970 |
| 48. | Poplar Hills | 123 | 43,760(0.28%)#48 | 14,469,050(0.00%)#5,231 |
| 49. | Fort Mitchell | 120 | 43,760(0.27%)#49 | 14,469,050(0.00%)#5,288 |
| 50. | Central City | 117 | 43,760(0.27%)#50 | 14,469,050(0.00%)#5,351 |
| 51. | Ashland | 116 | 43,760(0.27%)#51 | 14,469,050(0.00%)#5,362 |
| 52. | Eminence | 114 | 43,760(0.26%)#52 | 14,469,050(0.00%)#5,419 |
| 53. | Oak Grove | 112 | 43,760(0.26%)#53 | 14,469,050(0.00%)#5,455 |
| 54. | Carrollton | 112 | 43,760(0.26%)#54 | 14,469,050(0.00%)#5,459 |
| 55. | Hartford | 112 | 43,760(0.26%)#55 | 14,469,050(0.00%)#5,461 |
| 56. | Erlanger | 104 | 43,760(0.24%)#56 | 14,469,050(0.00%)#5,618 |
| 57. | Hillview | 101 | 43,760(0.23%)#57 | 14,469,050(0.00%)#5,705 |
| 58. | Edmonton | 99 | 43,760(0.23%)#58 | 14,469,050(0.00%)#5,759 |
| 59. | Princeton | 96 | 43,760(0.22%)#59 | 14,469,050(0.00%)#5,822 |
| 60. | Eddyville | 88 | 43,760(0.20%)#60 | 14,469,050(0.00%)#6,050 |
| 61. | North Middletown | 88 | 43,760(0.20%)#61 | 14,469,050(0.00%)#6,056 |
| 62. | La Grange | 87 | 43,760(0.20%)#62 | 14,469,050(0.00%)#6,067 |
| 63. | Fort Campbell North | 85 | 43,760(0.19%)#63 | 14,469,050(0.00%)#6,111 |
| 64. | Watterson Park | 75 | 43,760(0.17%)#64 | 14,469,050(0.00%)#6,425 |
| 65. | Bellevue | 69 | 43,760(0.16%)#65 | 14,469,050(0.00%)#6,607 |
| 66. | Junction City | 69 | 43,760(0.16%)#66 | 14,469,050(0.00%)#6,616 |
| 67. | Liberty | 69 | 43,760(0.16%)#67 | 14,469,050(0.00%)#6,617 |
| 68. | Hurstbourne Acres | 62 | 43,760(0.14%)#68 | 14,469,050(0.00%)#6,884 |
| 69. | Union | 57 | 43,760(0.13%)#69 | 14,469,050(0.00%)#7,069 |
| 70. | Warsaw | 52 | 43,760(0.12%)#70 | 14,469,050(0.00%)#7,325 |
| 71. | Elkton | 50 | 43,760(0.11%)#71 | 14,469,050(0.00%)#7,437 |
| 72. | London | 47 | 43,760(0.11%)#72 | 14,469,050(0.00%)#7,587 |
| 73. | Hurstbourne | 45 | 43,760(0.10%)#73 | 14,469,050(0.00%)#7,704 |
| 74. | Springfield | 45 | 43,760(0.10%)#74 | 14,469,050(0.00%)#7,717 |
| 75. | Scottsville | 44 | 43,760(0.10%)#75 | 14,469,050(0.00%)#7,763 |
| 76. | Flemingsburg | 44 | 43,760(0.10%)#76 | 14,469,050(0.00%)#7,770 |
| 77. | Farley | 42 | 43,760(0.10%)#77 | 14,469,050(0.00%)#7,872 |
| 78. | Hodgenville | 42 | 43,760(0.10%)#78 | 14,469,050(0.00%)#7,882 |
| 79. | Cynthiana | 39 | 43,760(0.09%)#79 | 14,469,050(0.00%)#8,062 |
| 80. | Taylor Mill | 36 | 43,760(0.08%)#80 | 14,469,050(0.00%)#8,246 |
| 81. | Ferguson | 35 | 43,760(0.08%)#81 | 14,469,050(0.00%)#8,350 |
| 82. | Alexandria | 33 | 43,760(0.08%)#82 | 14,469,050(0.00%)#8,437 |
| 83. | Lancaster | 32 | 43,760(0.07%)#83 | 14,469,050(0.00%)#8,539 |
| 84. | Milton | 31 | 43,760(0.07%)#84 | 14,469,050(0.00%)#8,628 |
| 85. | Corbin | 30 | 43,760(0.07%)#85 | 14,469,050(0.00%)#8,662 |
| 86. | St Matthews | 29 | 43,760(0.07%)#86 | 14,469,050(0.00%)#8,736 |
| 87. | Franklin | 23 | 43,760(0.05%)#87 | 14,469,050(0.00%)#9,309 |
| 88. | Francisville | 23 | 43,760(0.05%)#88 | 14,469,050(0.00%)#9,310 |
| 89. | Burkesville | 23 | 43,760(0.05%)#89 | 14,469,050(0.00%)#9,374 |
| 90. | Worthington Hills | 22 | 43,760(0.05%)#90 | 14,469,050(0.00%)#9,483 |
| 91. | Buckner | 21 | 43,760(0.05%)#91 | 14,469,050(0.00%)#9,583 |
| 92. | Rolling Hills | 21 | 43,760(0.05%)#92 | 14,469,050(0.00%)#9,624 |
| 93. | Campbellsville | 20 | 43,760(0.05%)#93 | 14,469,050(0.00%)#9,668 |
| 94. | Park Hills | 20 | 43,760(0.05%)#94 | 14,469,050(0.00%)#9,711 |
| 95. | Pioneer Village | 20 | 43,760(0.05%)#95 | 14,469,050(0.00%)#9,720 |
| 96. | Coldstream | 19 | 43,760(0.04%)#96 | 14,469,050(0.00%)#9,875 |
| 97. | Dayton | 16 | 43,760(0.04%)#97 | 14,469,050(0.00%)#10,241 |
| 98. | Sparta | 16 | 43,760(0.04%)#98 | 14,469,050(0.00%)#10,349 |
| 99. | Worthington | 15 | 43,760(0.03%)#99 | 14,469,050(0.00%)#10,444 |
| 100. | Fort Thomas | 14 | 43,760(0.03%)#100 | 14,469,050(0.00%)#10,525 |
Common Questions
What are the Top 10 Cities with the Most Immigrants from Central America in Kentucky?
Top 10 Cities with the Most Immigrants from Central America in Kentucky are:
#1
8,685
#2
8,202
#3
1,961
#4
1,318
#5
1,160
#6
750
#7
678
#8
594
#9
593
#10
442
What city has the Most Immigrants from Central America in Kentucky?
Louisville has the Most Immigrants from Central America in Kentucky with 8,685.
What is the Total Immigrants from Central America in the State of Kentucky?
Total Immigrants from Central America in Kentucky is 43,760.
What is the Total Immigrants from Central America in the United States?
Total Immigrants from Central America in the United States is 14,469,050.