Belmont, PA Map & Demographics
Belmont Map
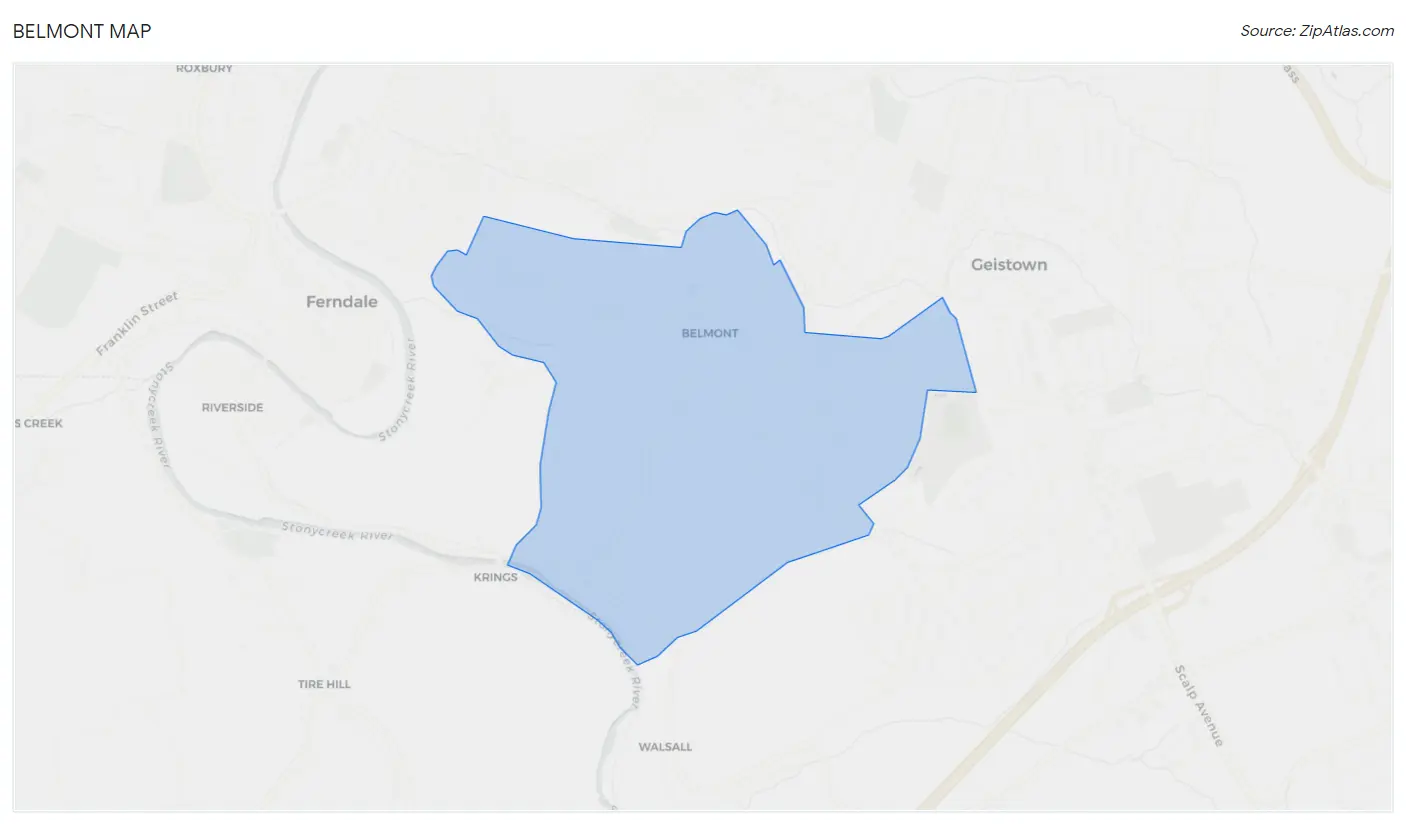
Belmont Overview
$36,426
PER CAPITA INCOME
$118,026
AVG FAMILY INCOME
$71,635
AVG HOUSEHOLD INCOME
27.6%
WAGE / INCOME GAP [ % ]
72.4¢/ $1
WAGE / INCOME GAP [ $ ]
0.41
INEQUALITY / GINI INDEX
2,743
TOTAL POPULATION
1,271
MALE POPULATION
1,472
FEMALE POPULATION
86.35
MALES / 100 FEMALES
115.81
FEMALES / 100 MALES
46.5
MEDIAN AGE
3.1
AVG FAMILY SIZE
2.1
AVG HOUSEHOLD SIZE
1,305
LABOR FORCE [ PEOPLE ]
54.4%
PERCENT IN LABOR FORCE
2.4%
UNEMPLOYMENT RATE
Income in Belmont
Income Overview in Belmont
Per Capita Income in Belmont is $36,426, while median incomes of families and households are $118,026 and $71,635 respectively.
| Characteristic | Number | Measure |
| Per Capita Income | 2,743 | $36,426 |
| Median Family Income | 600 | $118,026 |
| Mean Family Income | 600 | $115,649 |
| Median Household Income | 1,221 | $71,635 |
| Mean Household Income | 1,221 | $78,011 |
| Income Deficit | 600 | $0 |
| Wage / Income Gap (%) | 2,743 | 27.63% |
| Wage / Income Gap ($) | 2,743 | 72.37¢ per $1 |
| Gini / Inequality Index | 2,743 | 0.41 |
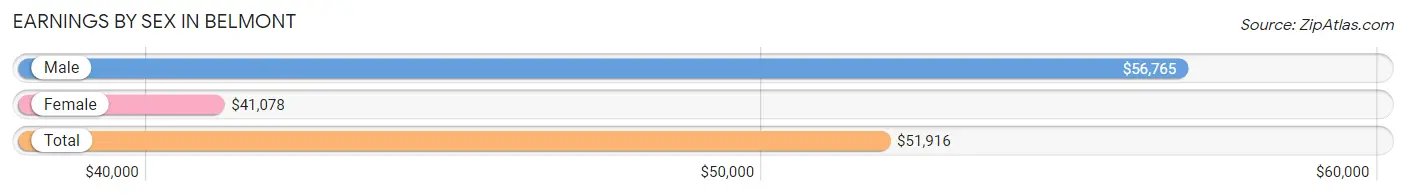
Earnings by Sex in Belmont
Average Earnings in Belmont are $51,916, $56,765 for men and $41,078 for women, a difference of 27.6%.
| Sex | Number | Average Earnings |
| Male | 706 (50.2%) | $56,765 |
| Female | 700 (49.8%) | $41,078 |
| Total | 1,406 (100.0%) | $51,916 |
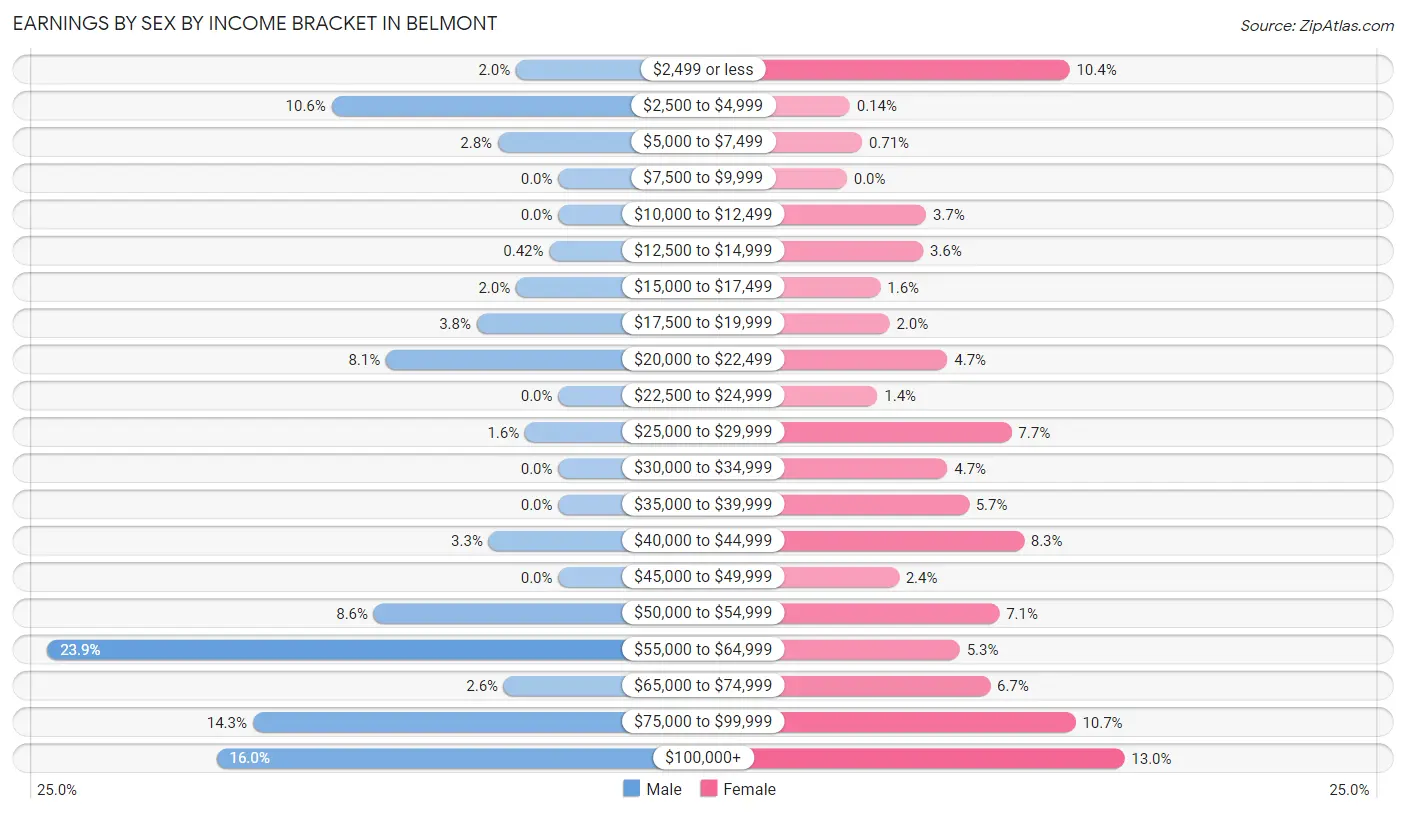
Earnings by Sex by Income Bracket in Belmont
The most common earnings brackets in Belmont are $55,000 to $64,999 for men (169 | 23.9%) and $100,000+ for women (91 | 13.0%).
| Income | Male | Female |
| $2,499 or less | 14 (2.0%) | 73 (10.4%) |
| $2,500 to $4,999 | 75 (10.6%) | 1 (0.1%) |
| $5,000 to $7,499 | 20 (2.8%) | 5 (0.7%) |
| $7,500 to $9,999 | 0 (0.0%) | 0 (0.0%) |
| $10,000 to $12,499 | 0 (0.0%) | 26 (3.7%) |
| $12,500 to $14,999 | 3 (0.4%) | 25 (3.6%) |
| $15,000 to $17,499 | 14 (2.0%) | 11 (1.6%) |
| $17,500 to $19,999 | 27 (3.8%) | 14 (2.0%) |
| $20,000 to $22,499 | 57 (8.1%) | 33 (4.7%) |
| $22,500 to $24,999 | 0 (0.0%) | 10 (1.4%) |
| $25,000 to $29,999 | 11 (1.6%) | 54 (7.7%) |
| $30,000 to $34,999 | 0 (0.0%) | 33 (4.7%) |
| $35,000 to $39,999 | 0 (0.0%) | 40 (5.7%) |
| $40,000 to $44,999 | 23 (3.3%) | 58 (8.3%) |
| $45,000 to $49,999 | 0 (0.0%) | 17 (2.4%) |
| $50,000 to $54,999 | 61 (8.6%) | 50 (7.1%) |
| $55,000 to $64,999 | 169 (23.9%) | 37 (5.3%) |
| $65,000 to $74,999 | 18 (2.5%) | 47 (6.7%) |
| $75,000 to $99,999 | 101 (14.3%) | 75 (10.7%) |
| $100,000+ | 113 (16.0%) | 91 (13.0%) |
| Total | 706 (100.0%) | 700 (100.0%) |
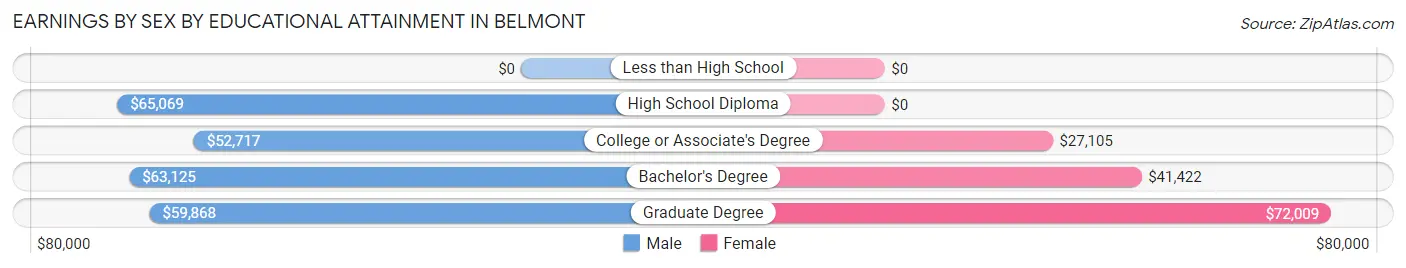
Earnings by Sex by Educational Attainment in Belmont
Average earnings in Belmont are $59,083 for men and $50,625 for women, a difference of 14.3%. Men with an educational attainment of high school diploma enjoy the highest average annual earnings of $65,069, while those with college or associate's degree education earn the least with $52,717. Women with an educational attainment of graduate degree earn the most with the average annual earnings of $72,009, while those with college or associate's degree education have the smallest earnings of $27,105.
| Educational Attainment | Male Income | Female Income |
| Less than High School | - | - |
| High School Diploma | $65,069 | $0 |
| College or Associate's Degree | $52,717 | $27,105 |
| Bachelor's Degree | $63,125 | $41,422 |
| Graduate Degree | $59,868 | $72,009 |
| Total | $59,083 | $50,625 |
Family Income in Belmont
Family Income Brackets in Belmont
According to the Belmont family income data, there are 204 families falling into the $100,000 to $149,999 income range, which is the most common income bracket and makes up 34.0% of all families.
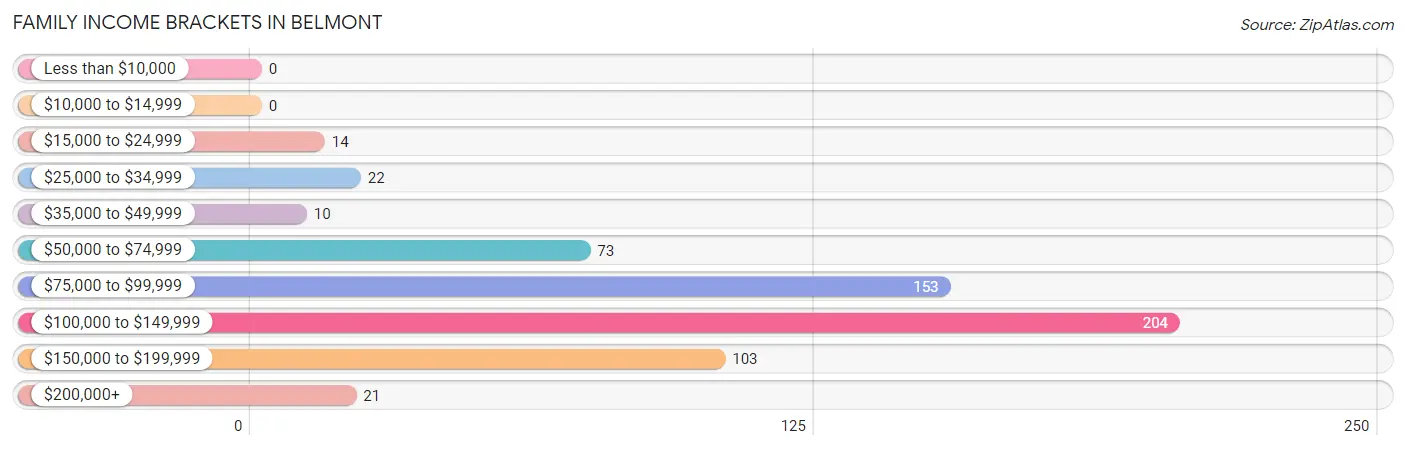
| Income Bracket | # Families | % Families |
| Less than $10,000 | 0 | 0.0% |
| $10,000 to $14,999 | 0 | 0.0% |
| $15,000 to $24,999 | 14 | 2.3% |
| $25,000 to $34,999 | 22 | 3.7% |
| $35,000 to $49,999 | 10 | 1.7% |
| $50,000 to $74,999 | 73 | 12.2% |
| $75,000 to $99,999 | 153 | 25.5% |
| $100,000 to $149,999 | 204 | 34.0% |
| $150,000 to $199,999 | 103 | 17.2% |
| $200,000+ | 21 | 3.5% |
Family Income by Famaliy Size in Belmont
4-person families (180 | 30.0%) account for the highest median family income in Belmont with $143,362 per family, while 3-person families (133 | 22.2%) have the highest median income of $43,662 per family member.
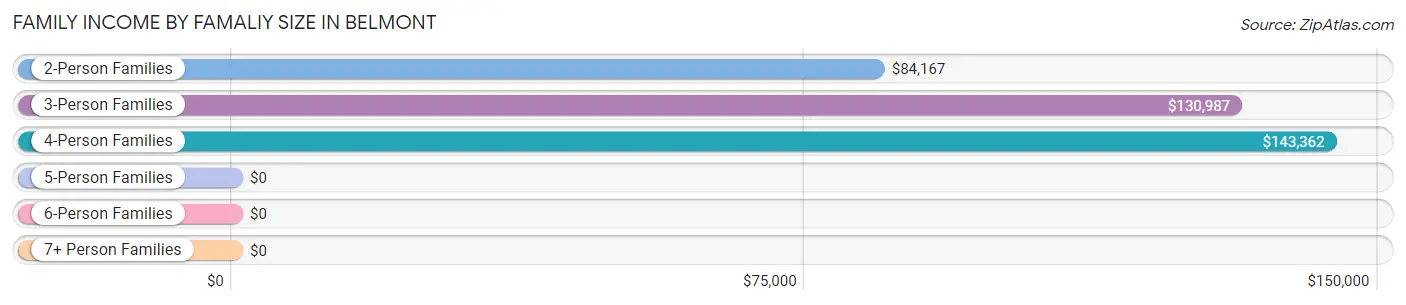
| Income Bracket | # Families | Median Income |
| 2-Person Families | 272 (45.3%) | $84,167 |
| 3-Person Families | 133 (22.2%) | $130,987 |
| 4-Person Families | 180 (30.0%) | $143,362 |
| 5-Person Families | 15 (2.5%) | $0 |
| 6-Person Families | 0 (0.0%) | $0 |
| 7+ Person Families | 0 (0.0%) | $0 |
| Total | 600 (100.0%) | $118,026 |
Family Income by Number of Earners in Belmont
The median family income in Belmont is $118,026, with families comprising 3+ earners (106) having the highest median family income of $142,716, while families with no earners (89) have the lowest median family income of $71,979, accounting for 17.7% and 14.8% of families, respectively.
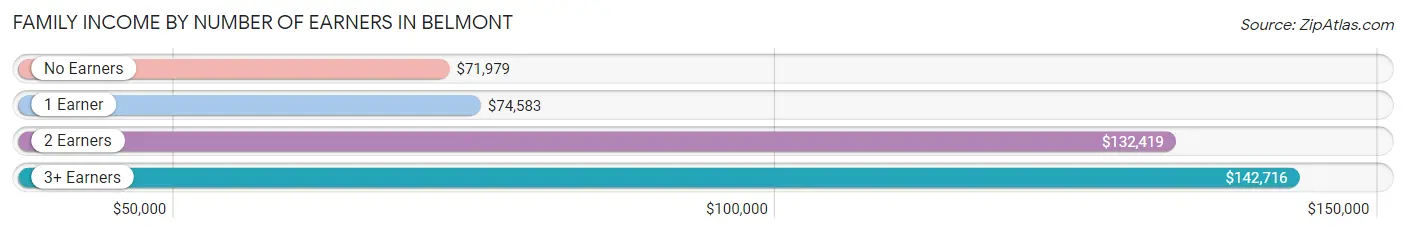
| Number of Earners | # Families | Median Income |
| No Earners | 89 (14.8%) | $71,979 |
| 1 Earner | 113 (18.8%) | $74,583 |
| 2 Earners | 292 (48.7%) | $132,419 |
| 3+ Earners | 106 (17.7%) | $142,716 |
| Total | 600 (100.0%) | $118,026 |
Household Income in Belmont
Household Income Brackets in Belmont
With 228 households falling in the category, the $75,000 to $99,999 income range is the most frequent in Belmont, accounting for 18.7% of all households. In contrast, only 40 households (3.3%) fall into the $200,000+ income bracket, making it the least populous group.
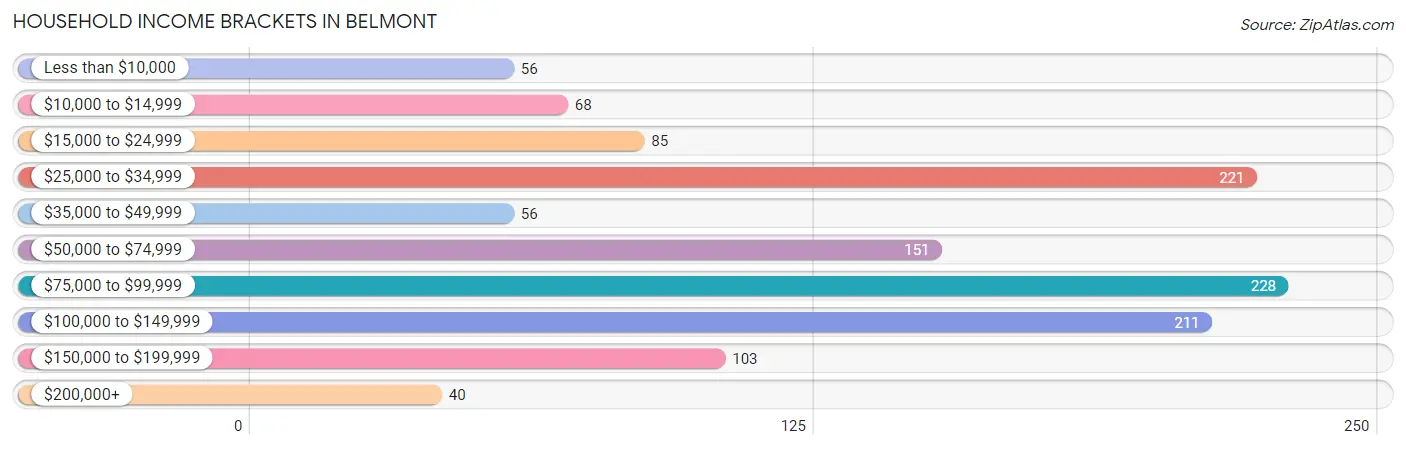
| Income Bracket | # Households | % Households |
| Less than $10,000 | 56 | 4.6% |
| $10,000 to $14,999 | 68 | 5.6% |
| $15,000 to $24,999 | 85 | 7.0% |
| $25,000 to $34,999 | 221 | 18.1% |
| $35,000 to $49,999 | 56 | 4.6% |
| $50,000 to $74,999 | 151 | 12.4% |
| $75,000 to $99,999 | 228 | 18.7% |
| $100,000 to $149,999 | 211 | 17.3% |
| $150,000 to $199,999 | 103 | 8.4% |
| $200,000+ | 40 | 3.3% |
Household Income by Householder Age in Belmont
The median household income in Belmont is $71,635, with the highest median household income of $131,066 found in the 45 to 64 years age bracket for the primary householder. A total of 345 households (28.3%) fall into this category. Meanwhile, the 15 to 24 years age bracket for the primary householder has the lowest median household income of $29,100, with 58 households (4.8%) in this group.
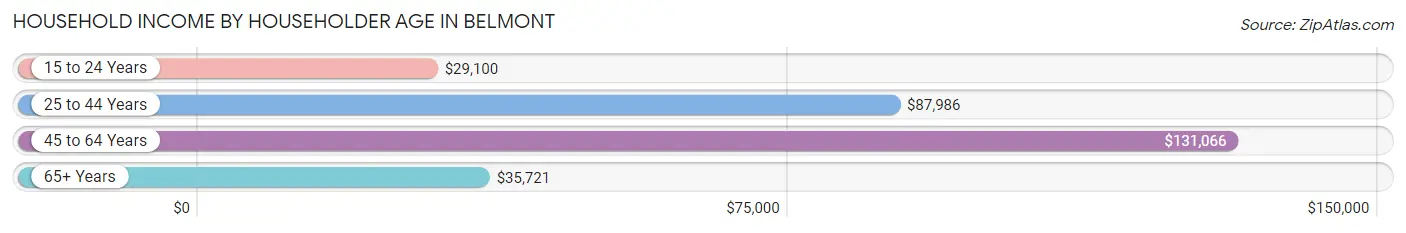
| Income Bracket | # Households | Median Income |
| 15 to 24 Years | 58 (4.8%) | $29,100 |
| 25 to 44 Years | 297 (24.3%) | $87,986 |
| 45 to 64 Years | 345 (28.3%) | $131,066 |
| 65+ Years | 521 (42.7%) | $35,721 |
| Total | 1,221 (100.0%) | $71,635 |
Poverty in Belmont
Income Below Poverty by Sex and Age in Belmont
With 9.5% poverty level for males and 10.2% for females among the residents of Belmont, 12 to 14 year old males and 16 and 17 year old females are the most vulnerable to poverty, with 20 males (100.0%) and 35 females (53.0%) in their respective age groups living below the poverty level.
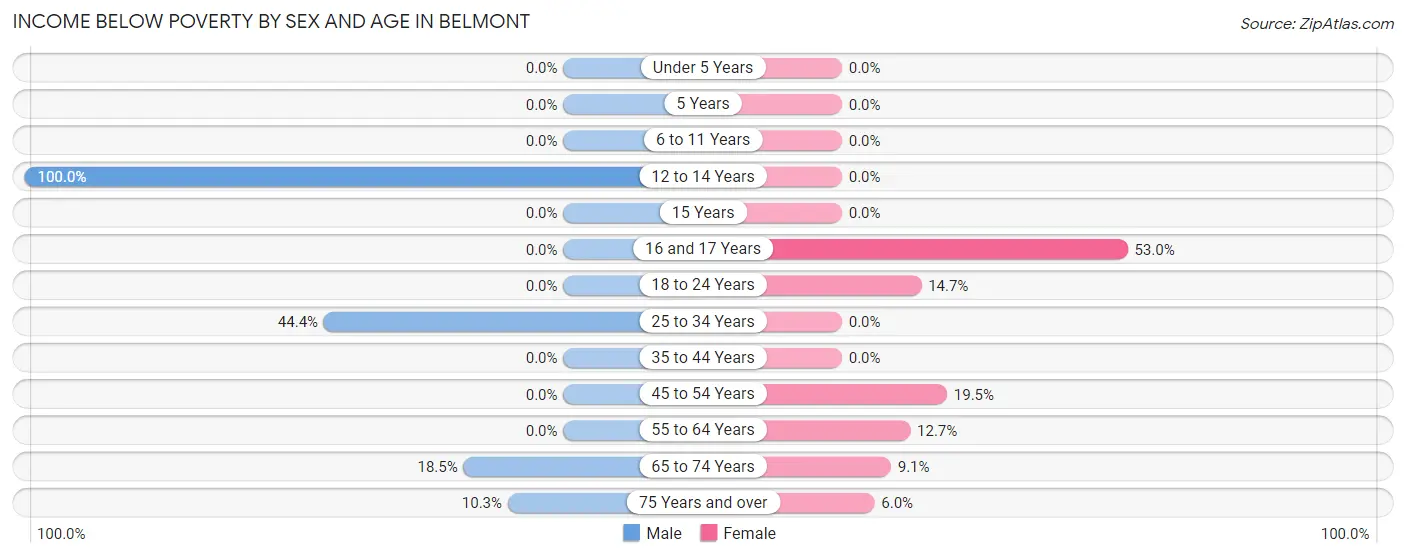
| Age Bracket | Male | Female |
| Under 5 Years | 0 (0.0%) | 0 (0.0%) |
| 5 Years | 0 (0.0%) | 0 (0.0%) |
| 6 to 11 Years | 0 (0.0%) | 0 (0.0%) |
| 12 to 14 Years | 20 (100.0%) | 0 (0.0%) |
| 15 Years | 0 (0.0%) | 0 (0.0%) |
| 16 and 17 Years | 0 (0.0%) | 35 (53.0%) |
| 18 to 24 Years | 0 (0.0%) | 28 (14.7%) |
| 25 to 34 Years | 60 (44.4%) | 0 (0.0%) |
| 35 to 44 Years | 0 (0.0%) | 0 (0.0%) |
| 45 to 54 Years | 0 (0.0%) | 31 (19.5%) |
| 55 to 64 Years | 0 (0.0%) | 18 (12.7%) |
| 65 to 74 Years | 20 (18.5%) | 13 (9.1%) |
| 75 Years and over | 17 (10.3%) | 16 (6.0%) |
| Total | 117 (9.5%) | 141 (10.2%) |
Income Above Poverty by Sex and Age in Belmont
According to the poverty statistics in Belmont, males aged under 5 years and females aged under 5 years are the age groups that are most secure financially, with 100.0% of males and 100.0% of females in these age groups living above the poverty line.
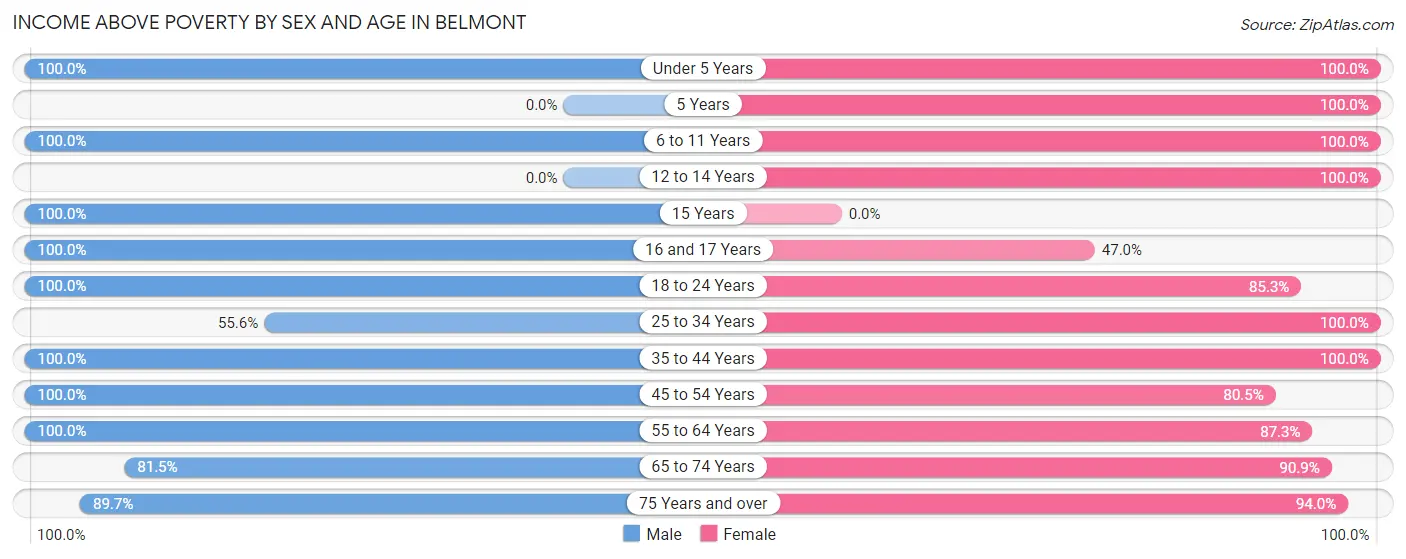
| Age Bracket | Male | Female |
| Under 5 Years | 117 (100.0%) | 44 (100.0%) |
| 5 Years | 0 (0.0%) | 22 (100.0%) |
| 6 to 11 Years | 83 (100.0%) | 16 (100.0%) |
| 12 to 14 Years | 0 (0.0%) | 23 (100.0%) |
| 15 Years | 19 (100.0%) | 0 (0.0%) |
| 16 and 17 Years | 40 (100.0%) | 31 (47.0%) |
| 18 to 24 Years | 76 (100.0%) | 162 (85.3%) |
| 25 to 34 Years | 75 (55.6%) | 146 (100.0%) |
| 35 to 44 Years | 139 (100.0%) | 161 (100.0%) |
| 45 to 54 Years | 145 (100.0%) | 128 (80.5%) |
| 55 to 64 Years | 181 (100.0%) | 124 (87.3%) |
| 65 to 74 Years | 88 (81.5%) | 130 (90.9%) |
| 75 Years and over | 148 (89.7%) | 249 (94.0%) |
| Total | 1,111 (90.5%) | 1,236 (89.8%) |
Income Below Poverty Among Married-Couple Families in Belmont
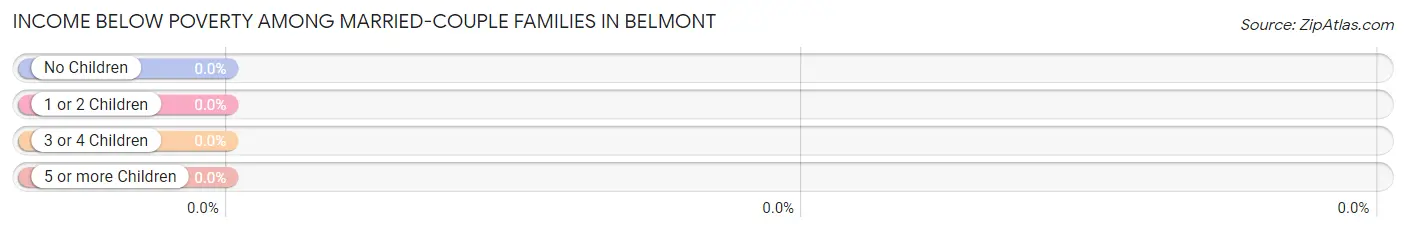
| Children | Above Poverty | Below Poverty |
| No Children | 304 (100.0%) | 0 (0.0%) |
| 1 or 2 Children | 231 (100.0%) | 0 (0.0%) |
| 3 or 4 Children | 0 (0.0%) | 0 (0.0%) |
| 5 or more Children | 0 (0.0%) | 0 (0.0%) |
| Total | 535 (100.0%) | 0 (0.0%) |
Income Below Poverty Among Single-Parent Households in Belmont
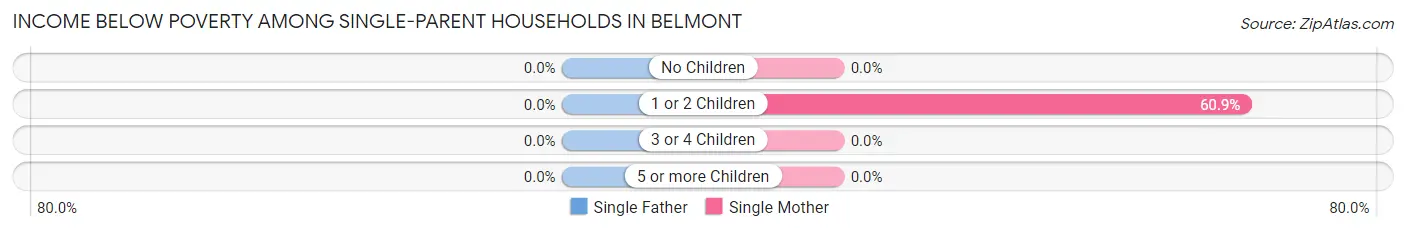
| Children | Single Father | Single Mother |
| No Children | 0 (0.0%) | 0 (0.0%) |
| 1 or 2 Children | 0 (0.0%) | 14 (60.9%) |
| 3 or 4 Children | 0 (0.0%) | 0 (0.0%) |
| 5 or more Children | 0 (0.0%) | 0 (0.0%) |
| Total | 0 (0.0%) | 14 (21.5%) |
Income Below Poverty Among Married-Couple vs Single-Parent Households in Belmont
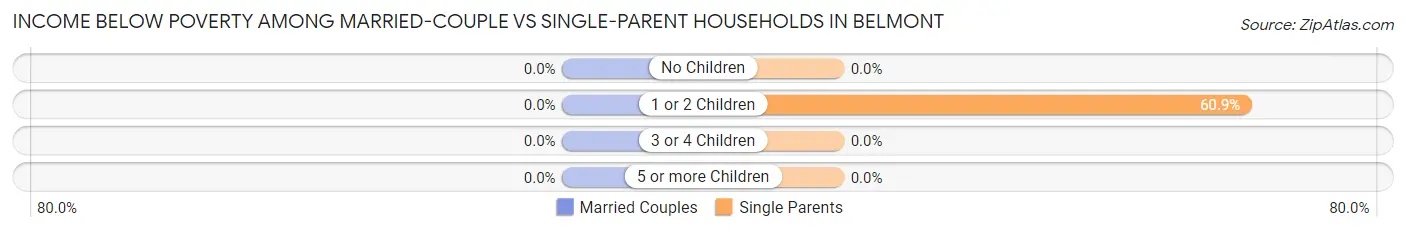
| Children | Married-Couple Families | Single-Parent Households |
| No Children | 0 (0.0%) | 0 (0.0%) |
| 1 or 2 Children | 0 (0.0%) | 14 (60.9%) |
| 3 or 4 Children | 0 (0.0%) | 0 (0.0%) |
| 5 or more Children | 0 (0.0%) | 0 (0.0%) |
| Total | 0 (0.0%) | 14 (21.5%) |
Race in Belmont
The most populous races in Belmont are White / Caucasian (2,606 | 95.0%), Hispanic or Latino (170 | 6.2%), and Black / African American (61 | 2.2%).
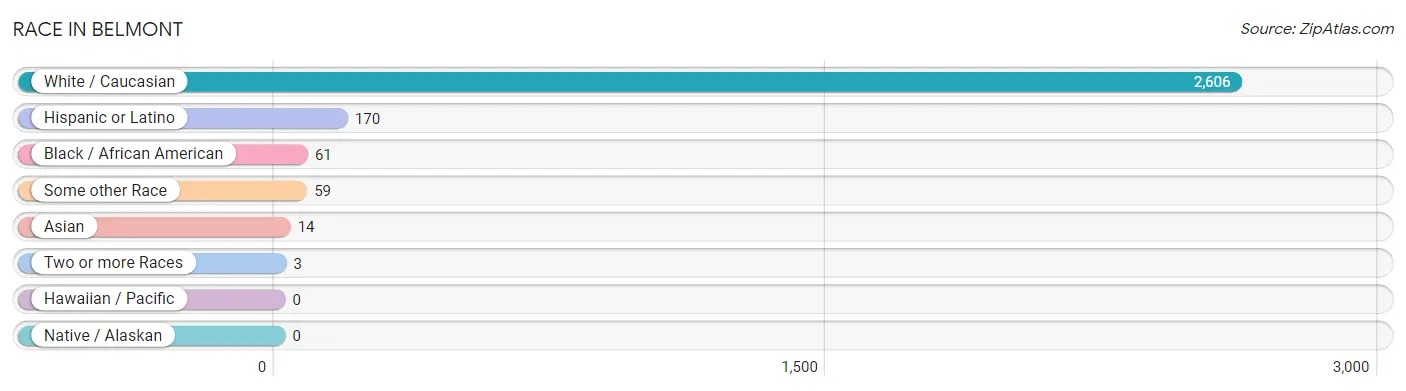
| Race | # Population | % Population |
| Asian | 14 | 0.5% |
| Black / African American | 61 | 2.2% |
| Hawaiian / Pacific | 0 | 0.0% |
| Hispanic or Latino | 170 | 6.2% |
| Native / Alaskan | 0 | 0.0% |
| White / Caucasian | 2,606 | 95.0% |
| Two or more Races | 3 | 0.1% |
| Some other Race | 59 | 2.1% |
| Total | 2,743 | 100.0% |
Ancestry in Belmont
The most populous ancestries reported in Belmont are German (947 | 34.5%), Italian (465 | 17.0%), Irish (442 | 16.1%), English (374 | 13.6%), and Polish (338 | 12.3%), together accounting for 93.5% of all Belmont residents.
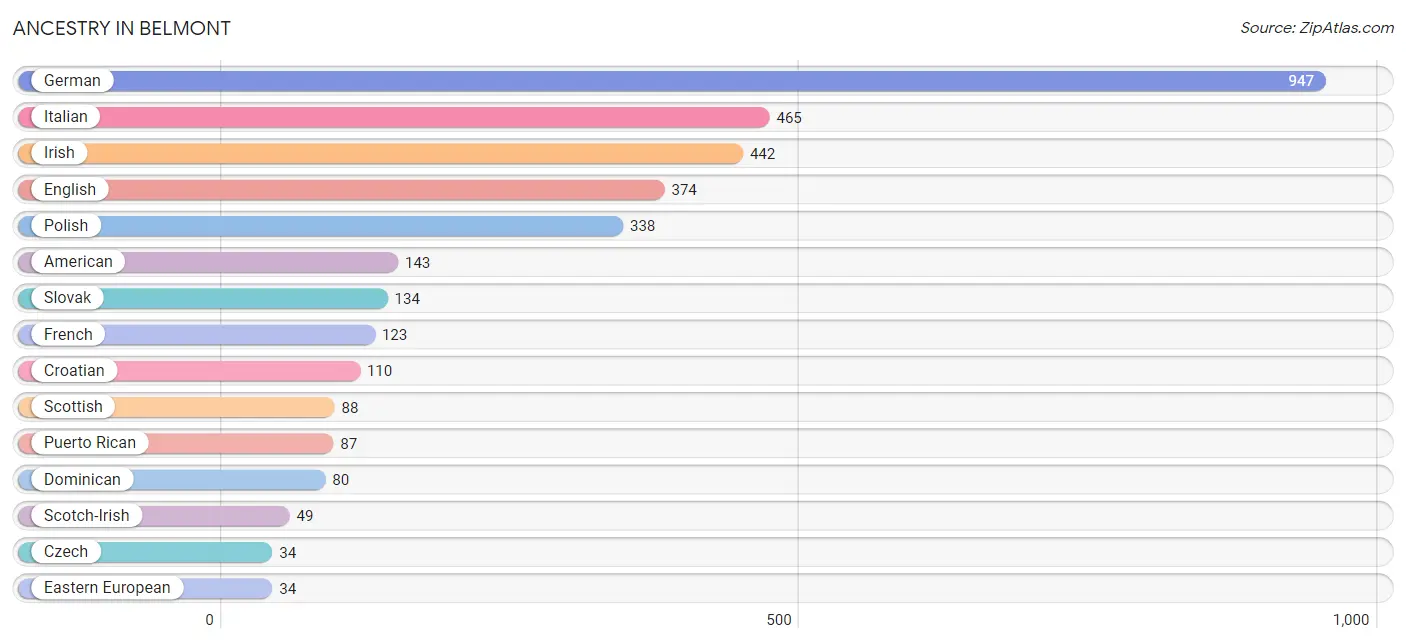
| Ancestry | # Population | % Population |
| American | 143 | 5.2% |
| Austrian | 27 | 1.0% |
| Cherokee | 3 | 0.1% |
| Croatian | 110 | 4.0% |
| Cuban | 3 | 0.1% |
| Czech | 34 | 1.2% |
| Czechoslovakian | 18 | 0.7% |
| Dominican | 80 | 2.9% |
| Dutch | 13 | 0.5% |
| Eastern European | 34 | 1.2% |
| English | 374 | 13.6% |
| French | 123 | 4.5% |
| German | 947 | 34.5% |
| Greek | 3 | 0.1% |
| Hungarian | 11 | 0.4% |
| Irish | 442 | 16.1% |
| Italian | 465 | 17.0% |
| Korean | 14 | 0.5% |
| Lithuanian | 26 | 0.9% |
| Pennsylvania German | 13 | 0.5% |
| Polish | 338 | 12.3% |
| Puerto Rican | 87 | 3.2% |
| Russian | 26 | 0.9% |
| Scandinavian | 14 | 0.5% |
| Scotch-Irish | 49 | 1.8% |
| Scottish | 88 | 3.2% |
| Slovak | 134 | 4.9% |
| Slovene | 20 | 0.7% |
| Trinidadian and Tobagonian | 1 | 0.0% |
| Ukrainian | 16 | 0.6% |
| Welsh | 23 | 0.8% | View All 31 Rows |
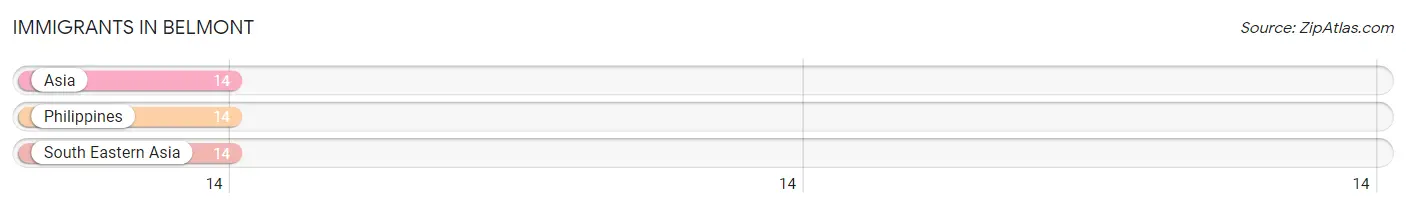
Immigrants in Belmont
The most numerous immigrant groups reported in Belmont came from Asia (14 | 0.5%), Philippines (14 | 0.5%), and South Eastern Asia (14 | 0.5%), together accounting for 1.5% of all Belmont residents.
| Immigration Origin | # Population | % Population |
| Asia | 14 | 0.5% |
| Philippines | 14 | 0.5% |
| South Eastern Asia | 14 | 0.5% | View All 3 Rows |
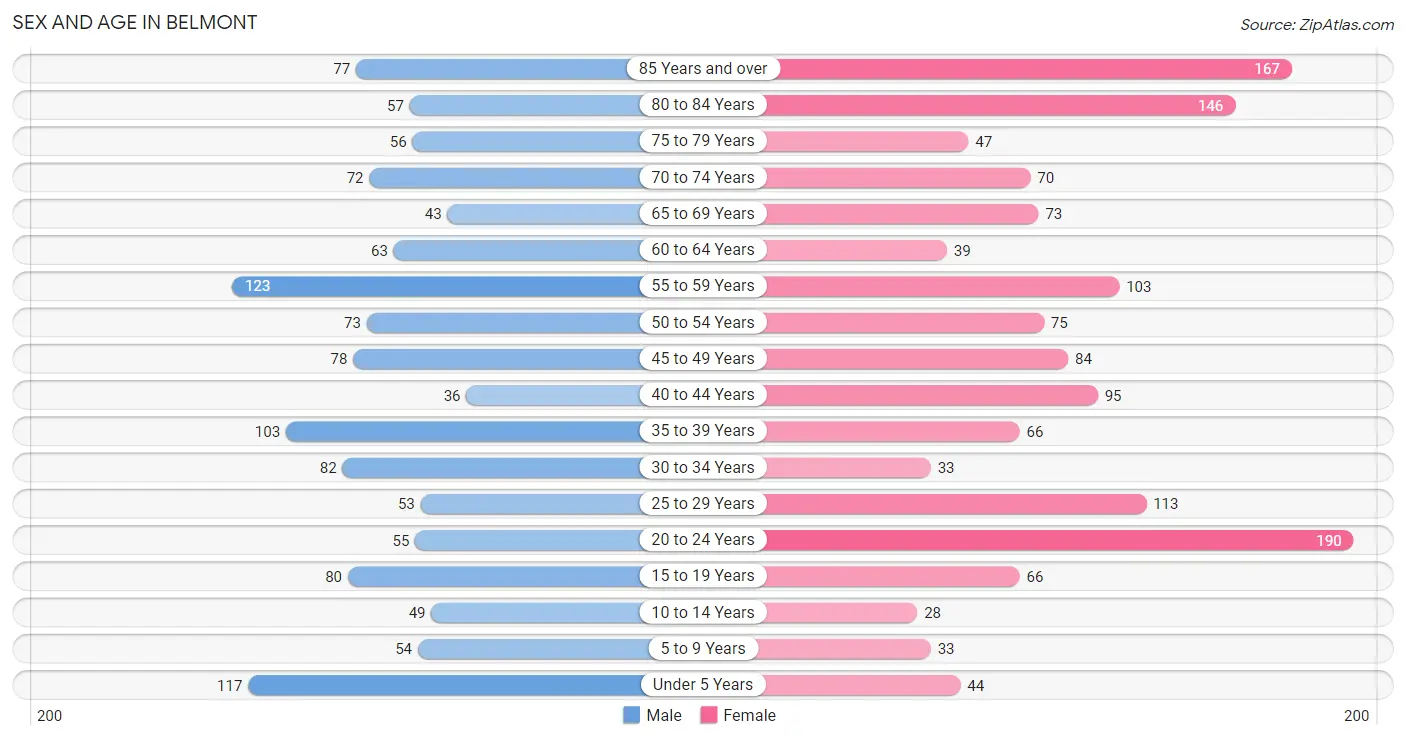
Sex and Age in Belmont
Sex and Age in Belmont
The most populous age groups in Belmont are 55 to 59 Years (123 | 9.7%) for men and 20 to 24 Years (190 | 12.9%) for women.
| Age Bracket | Male | Female |
| Under 5 Years | 117 (9.2%) | 44 (3.0%) |
| 5 to 9 Years | 54 (4.3%) | 33 (2.2%) |
| 10 to 14 Years | 49 (3.9%) | 28 (1.9%) |
| 15 to 19 Years | 80 (6.3%) | 66 (4.5%) |
| 20 to 24 Years | 55 (4.3%) | 190 (12.9%) |
| 25 to 29 Years | 53 (4.2%) | 113 (7.7%) |
| 30 to 34 Years | 82 (6.5%) | 33 (2.2%) |
| 35 to 39 Years | 103 (8.1%) | 66 (4.5%) |
| 40 to 44 Years | 36 (2.8%) | 95 (6.5%) |
| 45 to 49 Years | 78 (6.1%) | 84 (5.7%) |
| 50 to 54 Years | 73 (5.7%) | 75 (5.1%) |
| 55 to 59 Years | 123 (9.7%) | 103 (7.0%) |
| 60 to 64 Years | 63 (5.0%) | 39 (2.6%) |
| 65 to 69 Years | 43 (3.4%) | 73 (5.0%) |
| 70 to 74 Years | 72 (5.7%) | 70 (4.8%) |
| 75 to 79 Years | 56 (4.4%) | 47 (3.2%) |
| 80 to 84 Years | 57 (4.5%) | 146 (9.9%) |
| 85 Years and over | 77 (6.1%) | 167 (11.4%) |
| Total | 1,271 (100.0%) | 1,472 (100.0%) |
Families and Households in Belmont
Median Family Size in Belmont
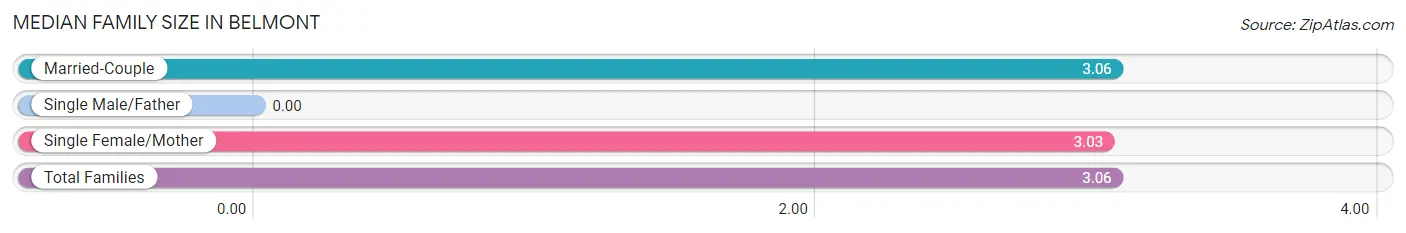
| Family Type | # Families | Family Size |
| Married-Couple | 535 (89.2%) | 3.06 |
| Single Male/Father | 0 (0.0%) | - |
| Single Female/Mother | 65 (10.8%) | 3.03 |
| Total Families | 600 (100.0%) | 3.06 |
Median Household Size in Belmont
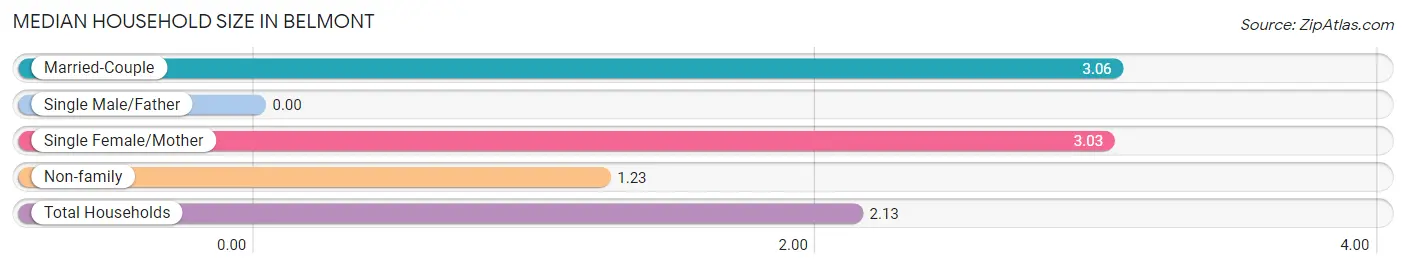
| Household Type | # Households | Household Size |
| Married-Couple | 535 (43.8%) | 3.06 |
| Single Male/Father | 0 (0.0%) | - |
| Single Female/Mother | 65 (5.3%) | 3.03 |
| Non-family | 621 (50.9%) | 1.23 |
| Total Households | 1,221 (100.0%) | 2.13 |
Household Size by Marriage Status in Belmont
Out of a total of 1,221 households in Belmont, 600 (49.1%) are family households, while 621 (50.9%) are nonfamily households. The most numerous type of family households are 2-person households, comprising 272, and the most common type of nonfamily households are 1-person households, comprising 513.
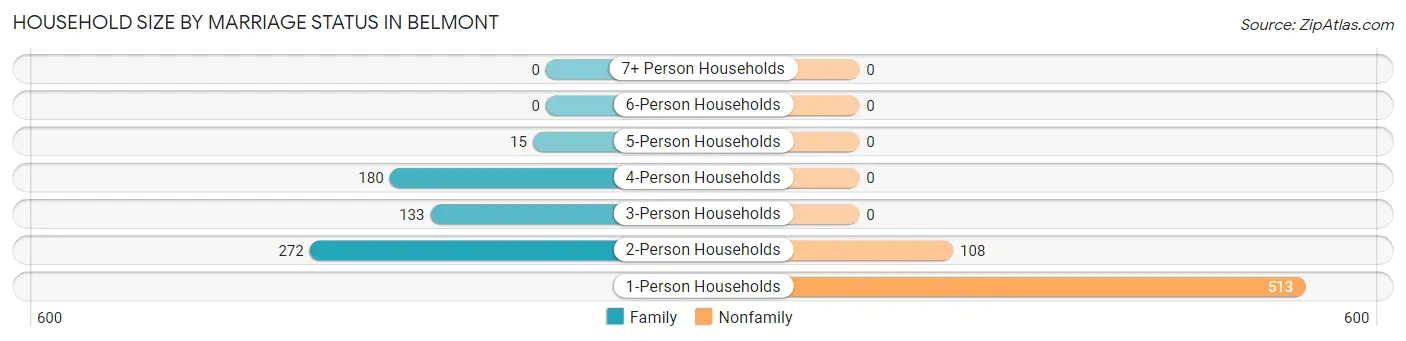
| Household Size | Family Households | Nonfamily Households |
| 1-Person Households | - | 513 (42.0%) |
| 2-Person Households | 272 (22.3%) | 108 (8.8%) |
| 3-Person Households | 133 (10.9%) | 0 (0.0%) |
| 4-Person Households | 180 (14.7%) | 0 (0.0%) |
| 5-Person Households | 15 (1.2%) | 0 (0.0%) |
| 6-Person Households | 0 (0.0%) | 0 (0.0%) |
| 7+ Person Households | 0 (0.0%) | 0 (0.0%) |
| Total | 600 (49.1%) | 621 (50.9%) |
Female Fertility in Belmont
Fertility by Age in Belmont
Average fertility rate in Belmont is 46.0 births per 1,000 women. Women in the age bracket of 20 to 34 years have the highest fertility rate with 89.0 births per 1,000 women. Women in the age bracket of 20 to 34 years acount for 100.0% of all women with births.
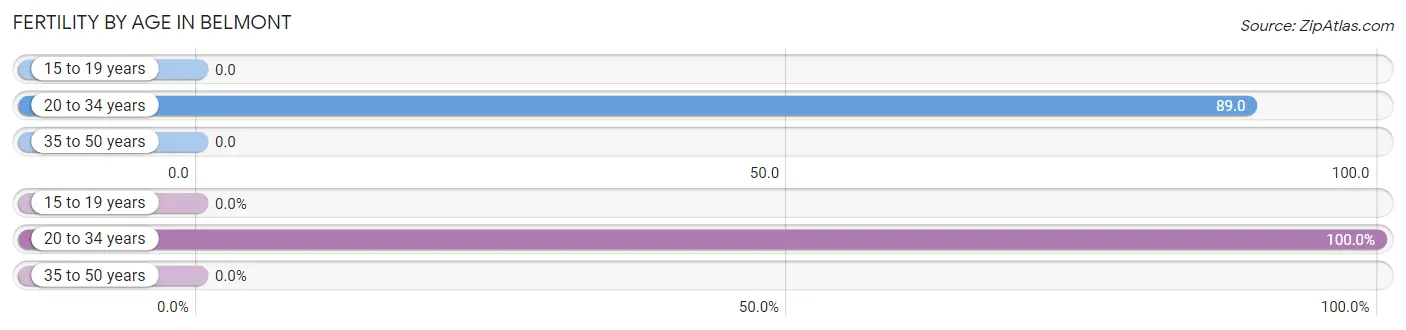
| Age Bracket | Women with Births | Births / 1,000 Women |
| 15 to 19 years | 0 (0.0%) | 0.0 |
| 20 to 34 years | 30 (100.0%) | 89.0 |
| 35 to 50 years | 0 (0.0%) | 0.0 |
| Total | 30 (100.0%) | 46.0 |
Fertility by Age by Marriage Status in Belmont
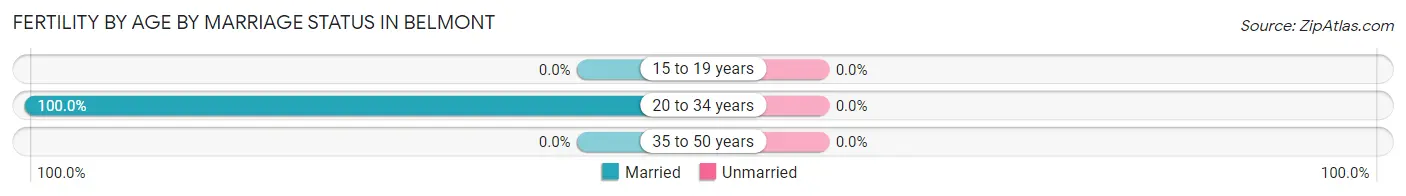
| Age Bracket | Married | Unmarried |
| 15 to 19 years | 0 (0.0%) | 0 (0.0%) |
| 20 to 34 years | 30 (100.0%) | 0 (0.0%) |
| 35 to 50 years | 0 (0.0%) | 0 (0.0%) |
| Total | 30 (100.0%) | 0 (0.0%) |
Fertility by Education in Belmont
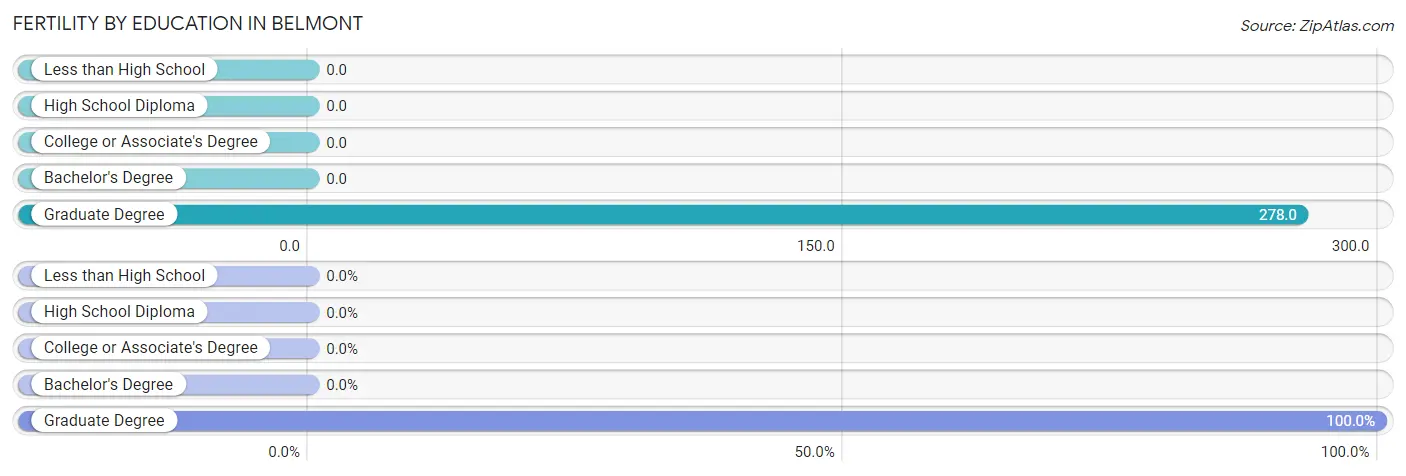
| Educational Attainment | Women with Births | Births / 1,000 Women |
| Less than High School | 0 (0.0%) | 0.0 |
| High School Diploma | 0 (0.0%) | 0.0 |
| College or Associate's Degree | 0 (0.0%) | 0.0 |
| Bachelor's Degree | 0 (0.0%) | 0.0 |
| Graduate Degree | 30 (100.0%) | 278.0 |
| Total | 30 (100.0%) | 46.0 |
Fertility by Education by Marriage Status in Belmont
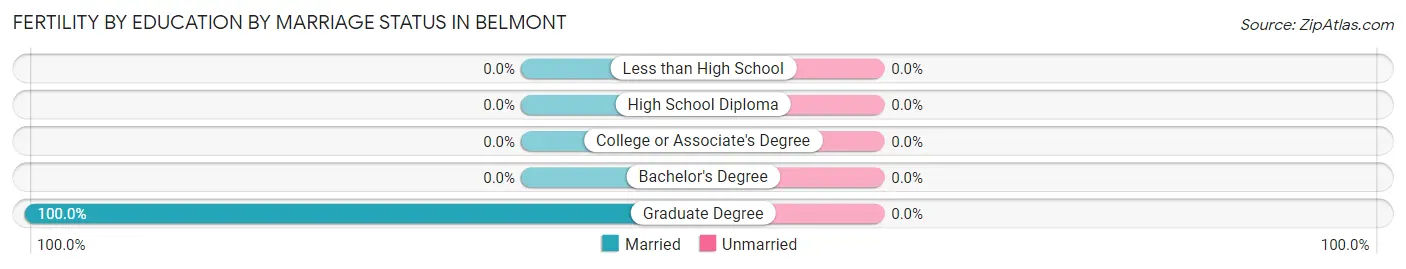
| Educational Attainment | Married | Unmarried |
| Less than High School | 0 (0.0%) | 0 (0.0%) |
| High School Diploma | 0 (0.0%) | 0 (0.0%) |
| College or Associate's Degree | 0 (0.0%) | 0 (0.0%) |
| Bachelor's Degree | 0 (0.0%) | 0 (0.0%) |
| Graduate Degree | 30 (100.0%) | 0 (0.0%) |
| Total | 30 (100.0%) | 0 (0.0%) |
Employment Characteristics in Belmont
Employment by Class of Employer in Belmont
Among the 1,273 employed individuals in Belmont, private company employees (789 | 62.0%), not-for-profit organizations (180 | 14.1%), and federal government employees (116 | 9.1%) make up the most common classes of employment.
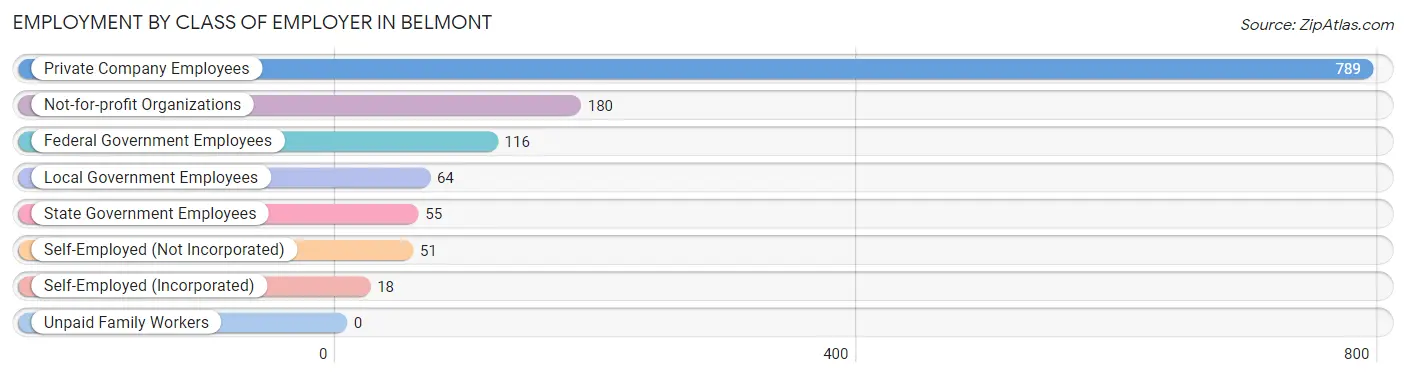
| Employer Class | # Employees | % Employees |
| Private Company Employees | 789 | 62.0% |
| Self-Employed (Incorporated) | 18 | 1.4% |
| Self-Employed (Not Incorporated) | 51 | 4.0% |
| Not-for-profit Organizations | 180 | 14.1% |
| Local Government Employees | 64 | 5.0% |
| State Government Employees | 55 | 4.3% |
| Federal Government Employees | 116 | 9.1% |
| Unpaid Family Workers | 0 | 0.0% |
| Total | 1,273 | 100.0% |
Employment Status by Age in Belmont
According to the labor force statistics for Belmont, out of the total population over 16 years of age (2,399), 54.4% or 1,305 individuals are in the labor force, with 2.4% or 31 of them unemployed. The age group with the highest labor force participation rate is 35 to 44 years, with 97.0% or 291 individuals in the labor force. Within the labor force, the 16 to 19 years age range has the highest percentage of unemployed individuals, with 32.8% or 20 of them being unemployed.
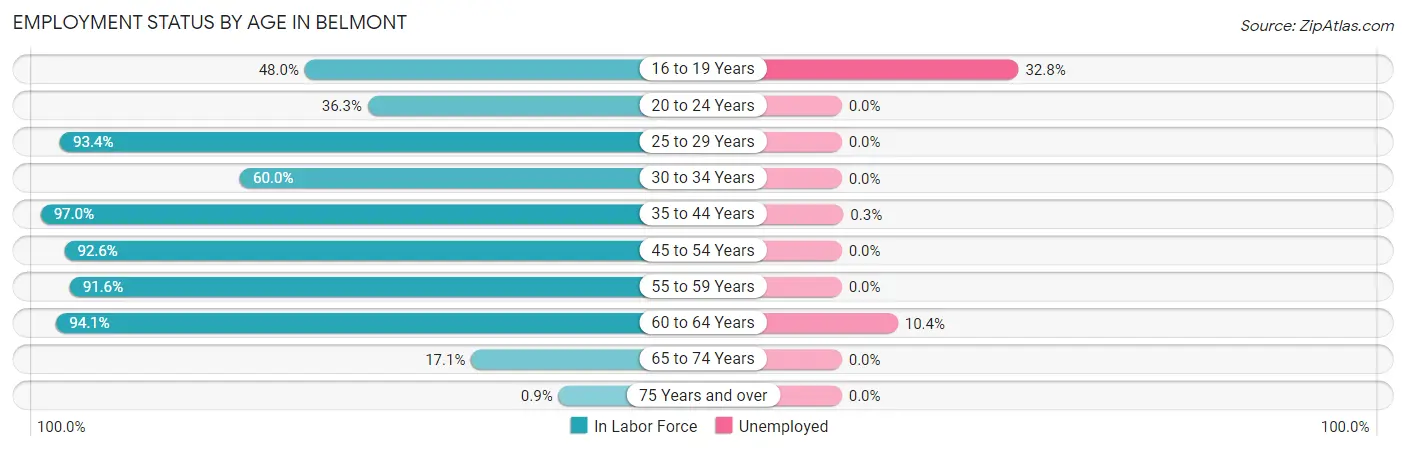
| Age Bracket | In Labor Force | Unemployed |
| 16 to 19 Years | 61 (48.0%) | 20 (32.8%) |
| 20 to 24 Years | 89 (36.3%) | 0 (0.0%) |
| 25 to 29 Years | 155 (93.4%) | 0 (0.0%) |
| 30 to 34 Years | 69 (60.0%) | 0 (0.0%) |
| 35 to 44 Years | 291 (97.0%) | 1 (0.3%) |
| 45 to 54 Years | 287 (92.6%) | 0 (0.0%) |
| 55 to 59 Years | 207 (91.6%) | 0 (0.0%) |
| 60 to 64 Years | 96 (94.1%) | 10 (10.4%) |
| 65 to 74 Years | 44 (17.1%) | 0 (0.0%) |
| 75 Years and over | 5 (0.9%) | 0 (0.0%) |
| Total | 1,305 (54.4%) | 31 (2.4%) |
Employment Status by Educational Attainment in Belmont
According to labor force statistics for Belmont, 90.6% of individuals (1,104) out of the total population between 25 and 64 years of age (1,219) are in the labor force, with 1.0% or 11 of them being unemployed. The group with the highest labor force participation rate are those with the educational attainment of bachelor's degree or higher, with 100.0% or 728 individuals in the labor force. Within the labor force, individuals with high school diploma education have the highest percentage of unemployment, with 4.3% or 10 of them being unemployed.
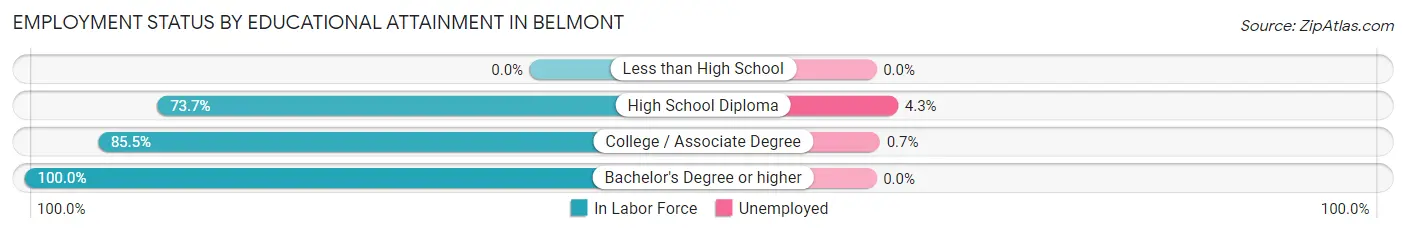
| Educational Attainment | In Labor Force | Unemployed |
| Less than High School | 0 (0.0%) | 0 (0.0%) |
| High School Diploma | 230 (73.7%) | 13 (4.3%) |
| College / Associate Degree | 147 (85.5%) | 1 (0.7%) |
| Bachelor's Degree or higher | 728 (100.0%) | 0 (0.0%) |
| Total | 1,104 (90.6%) | 12 (1.0%) |
Employment Occupations by Sex in Belmont
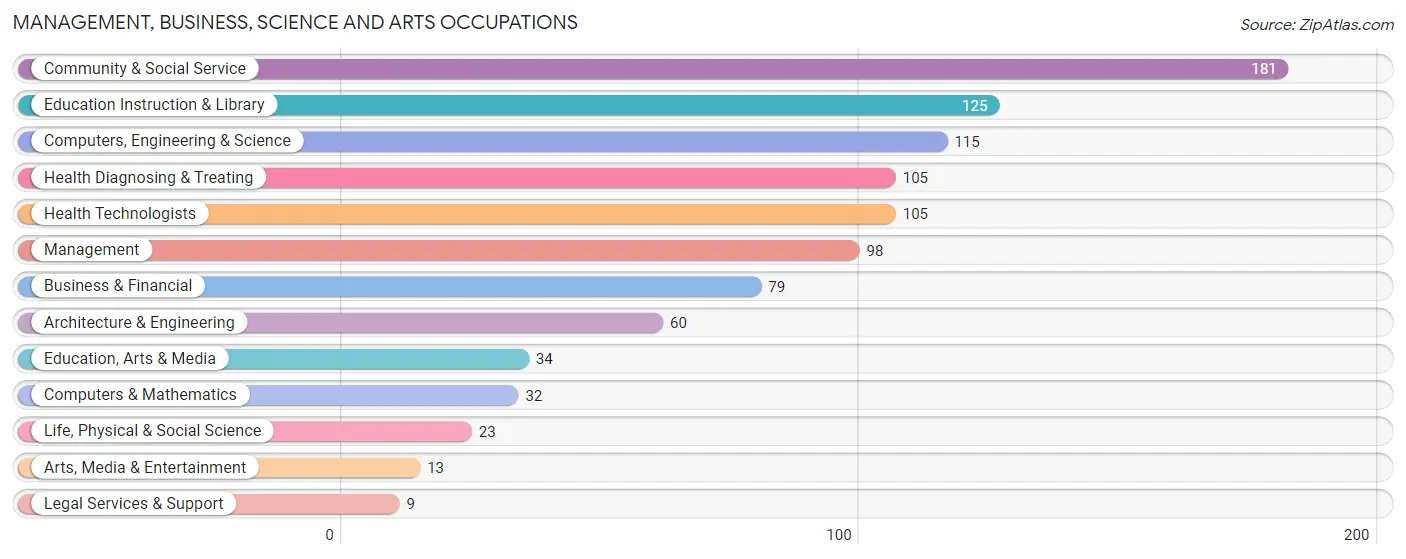
Management, Business, Science and Arts Occupations
The most common Management, Business, Science and Arts occupations in Belmont are Community & Social Service (181 | 14.2%), Education Instruction & Library (125 | 9.8%), Computers, Engineering & Science (115 | 9.0%), Health Diagnosing & Treating (105 | 8.3%), and Health Technologists (105 | 8.3%).
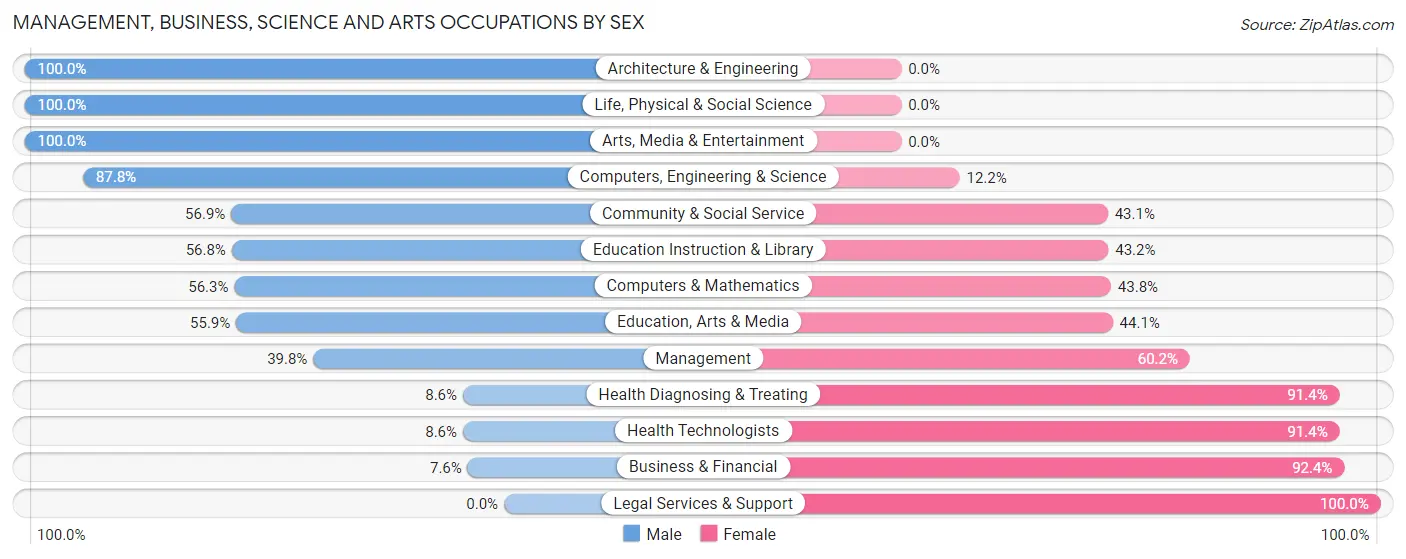
Management, Business, Science and Arts Occupations by Sex
Within the Management, Business, Science and Arts occupations in Belmont, the most male-oriented occupations are Architecture & Engineering (100.0%), Life, Physical & Social Science (100.0%), and Arts, Media & Entertainment (100.0%), while the most female-oriented occupations are Legal Services & Support (100.0%), Business & Financial (92.4%), and Health Diagnosing & Treating (91.4%).
| Occupation | Male | Female |
| Management | 39 (39.8%) | 59 (60.2%) |
| Business & Financial | 6 (7.6%) | 73 (92.4%) |
| Computers, Engineering & Science | 101 (87.8%) | 14 (12.2%) |
| Computers & Mathematics | 18 (56.2%) | 14 (43.8%) |
| Architecture & Engineering | 60 (100.0%) | 0 (0.0%) |
| Life, Physical & Social Science | 23 (100.0%) | 0 (0.0%) |
| Community & Social Service | 103 (56.9%) | 78 (43.1%) |
| Education, Arts & Media | 19 (55.9%) | 15 (44.1%) |
| Legal Services & Support | 0 (0.0%) | 9 (100.0%) |
| Education Instruction & Library | 71 (56.8%) | 54 (43.2%) |
| Arts, Media & Entertainment | 13 (100.0%) | 0 (0.0%) |
| Health Diagnosing & Treating | 9 (8.6%) | 96 (91.4%) |
| Health Technologists | 9 (8.6%) | 96 (91.4%) |
| Total (Category) | 258 (44.6%) | 320 (55.4%) |
| Total (Overall) | 654 (51.4%) | 619 (48.6%) |
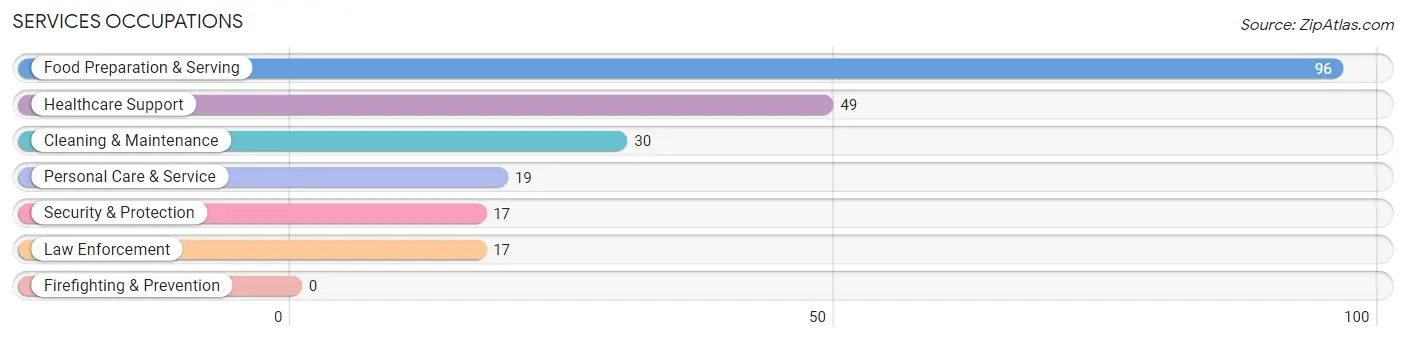
Services Occupations
The most common Services occupations in Belmont are Food Preparation & Serving (96 | 7.5%), Healthcare Support (49 | 3.8%), Cleaning & Maintenance (30 | 2.4%), Personal Care & Service (19 | 1.5%), and Security & Protection (17 | 1.3%).
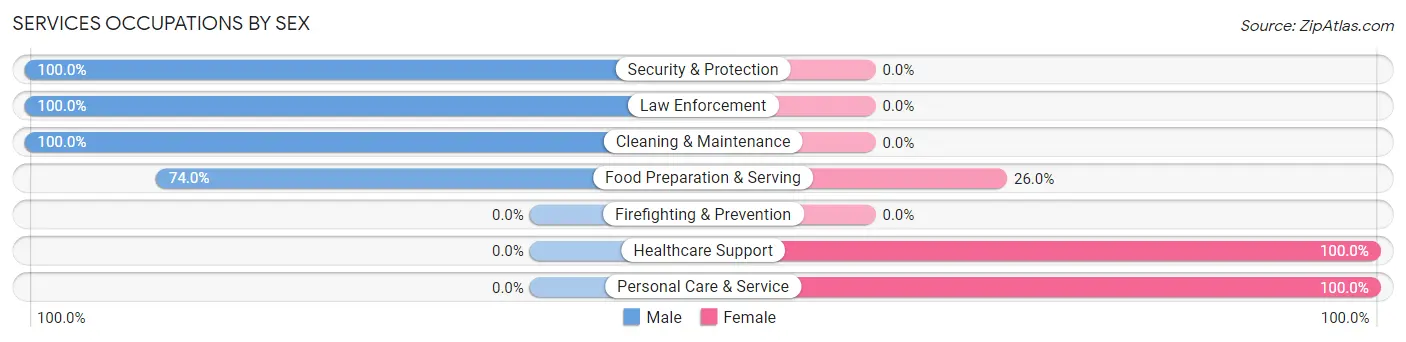
Services Occupations by Sex
Within the Services occupations in Belmont, the most male-oriented occupations are Security & Protection (100.0%), Law Enforcement (100.0%), and Cleaning & Maintenance (100.0%), while the most female-oriented occupations are Healthcare Support (100.0%), Personal Care & Service (100.0%), and Food Preparation & Serving (26.0%).
| Occupation | Male | Female |
| Healthcare Support | 0 (0.0%) | 49 (100.0%) |
| Security & Protection | 17 (100.0%) | 0 (0.0%) |
| Firefighting & Prevention | 0 (0.0%) | 0 (0.0%) |
| Law Enforcement | 17 (100.0%) | 0 (0.0%) |
| Food Preparation & Serving | 71 (74.0%) | 25 (26.0%) |
| Cleaning & Maintenance | 30 (100.0%) | 0 (0.0%) |
| Personal Care & Service | 0 (0.0%) | 19 (100.0%) |
| Total (Category) | 118 (55.9%) | 93 (44.1%) |
| Total (Overall) | 654 (51.4%) | 619 (48.6%) |
Sales and Office Occupations
The most common Sales and Office occupations in Belmont are Office & Administration (204 | 16.0%), and Sales & Related (143 | 11.2%).
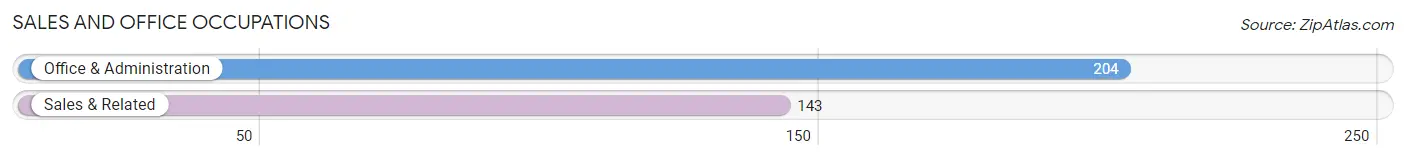
Sales and Office Occupations by Sex

| Occupation | Male | Female |
| Sales & Related | 106 (74.1%) | 37 (25.9%) |
| Office & Administration | 35 (17.2%) | 169 (82.8%) |
| Total (Category) | 141 (40.6%) | 206 (59.4%) |
| Total (Overall) | 654 (51.4%) | 619 (48.6%) |
Natural Resources, Construction and Maintenance Occupations
The most common Natural Resources, Construction and Maintenance occupations in Belmont are , and Installation, Maintenance & Repair (25 | 2.0%).
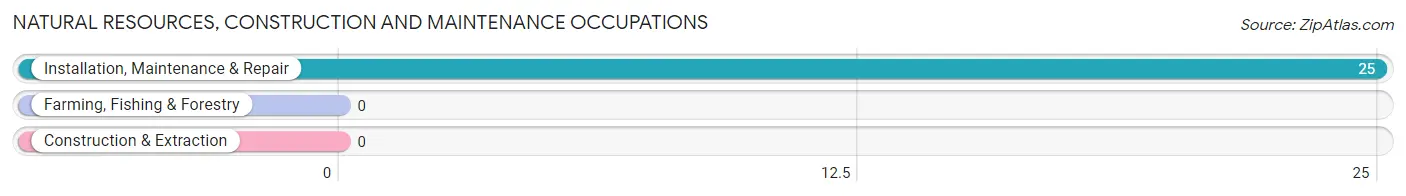
Natural Resources, Construction and Maintenance Occupations by Sex
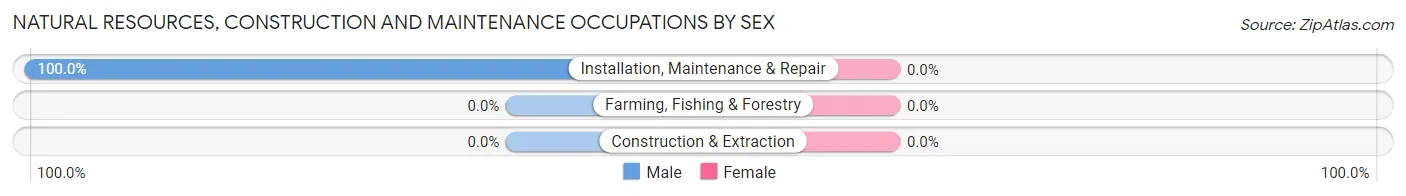
| Occupation | Male | Female |
| Farming, Fishing & Forestry | 0 (0.0%) | 0 (0.0%) |
| Construction & Extraction | 0 (0.0%) | 0 (0.0%) |
| Installation, Maintenance & Repair | 25 (100.0%) | 0 (0.0%) |
| Total (Category) | 25 (100.0%) | 0 (0.0%) |
| Total (Overall) | 654 (51.4%) | 619 (48.6%) |
Production, Transportation and Moving Occupations
The most common Production, Transportation and Moving occupations in Belmont are Transportation (44 | 3.5%), Material Moving (40 | 3.1%), and Production (28 | 2.2%).
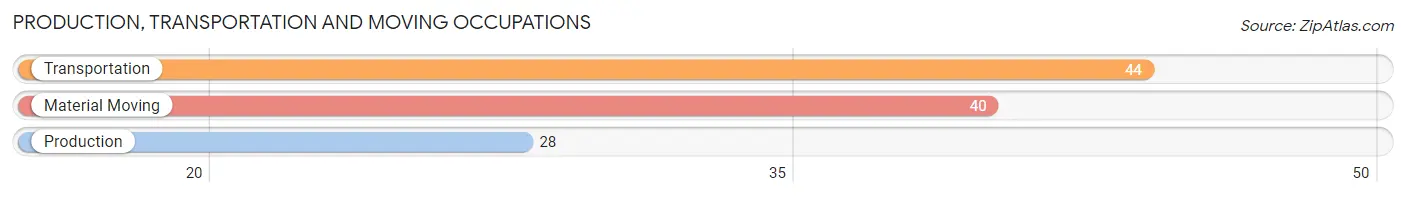
Production, Transportation and Moving Occupations by Sex
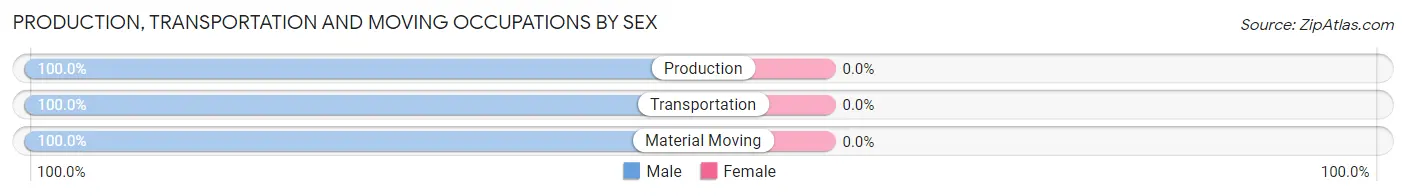
| Occupation | Male | Female |
| Production | 28 (100.0%) | 0 (0.0%) |
| Transportation | 44 (100.0%) | 0 (0.0%) |
| Material Moving | 40 (100.0%) | 0 (0.0%) |
| Total (Category) | 112 (100.0%) | 0 (0.0%) |
| Total (Overall) | 654 (51.4%) | 619 (48.6%) |
Employment Industries by Sex in Belmont
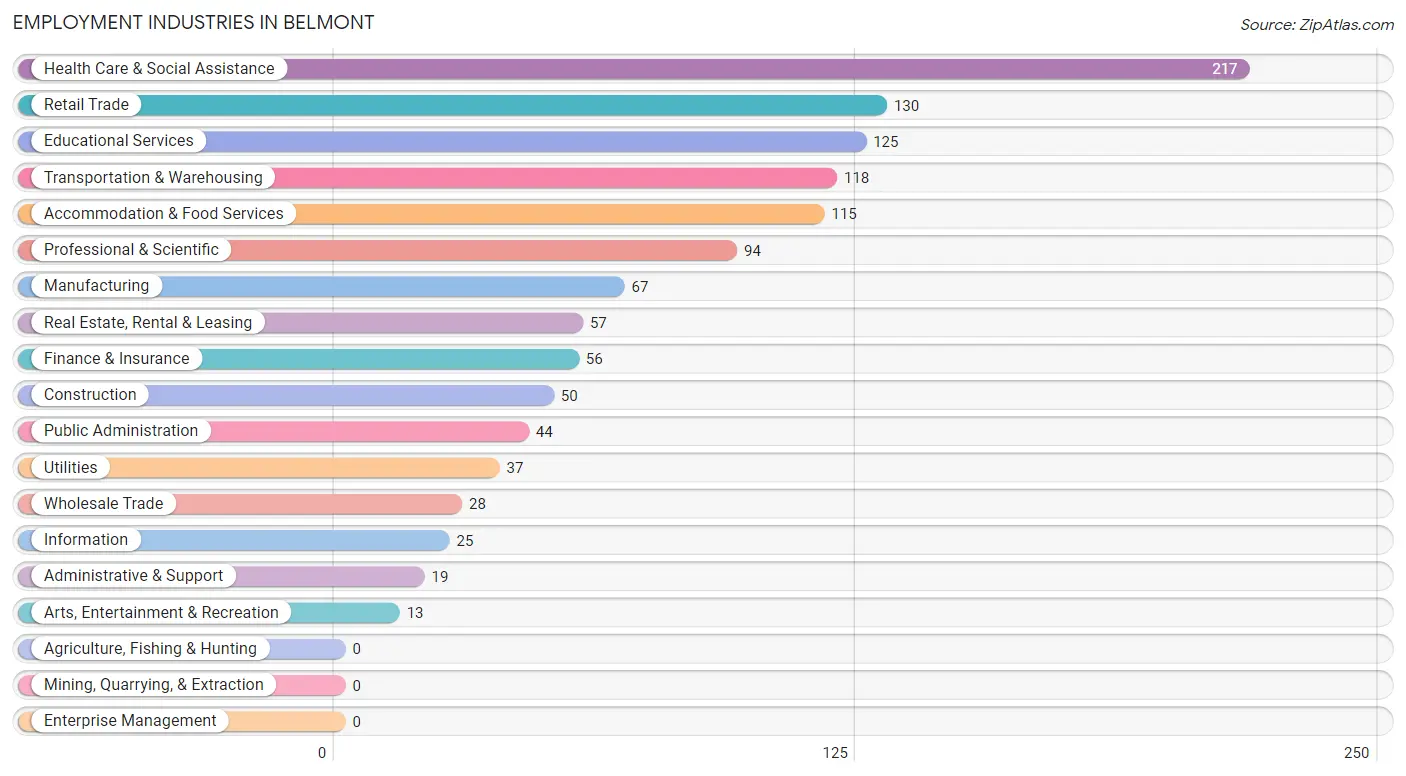
Employment Industries in Belmont
The major employment industries in Belmont include Health Care & Social Assistance (217 | 17.1%), Retail Trade (130 | 10.2%), Educational Services (125 | 9.8%), Transportation & Warehousing (118 | 9.3%), and Accommodation & Food Services (115 | 9.0%).
Employment Industries by Sex in Belmont
The Belmont industries that see more men than women are Wholesale Trade (100.0%), Utilities (100.0%), and Information (100.0%), whereas the industries that tend to have a higher number of women are Construction (100.0%), Finance & Insurance (100.0%), and Health Care & Social Assistance (80.6%).
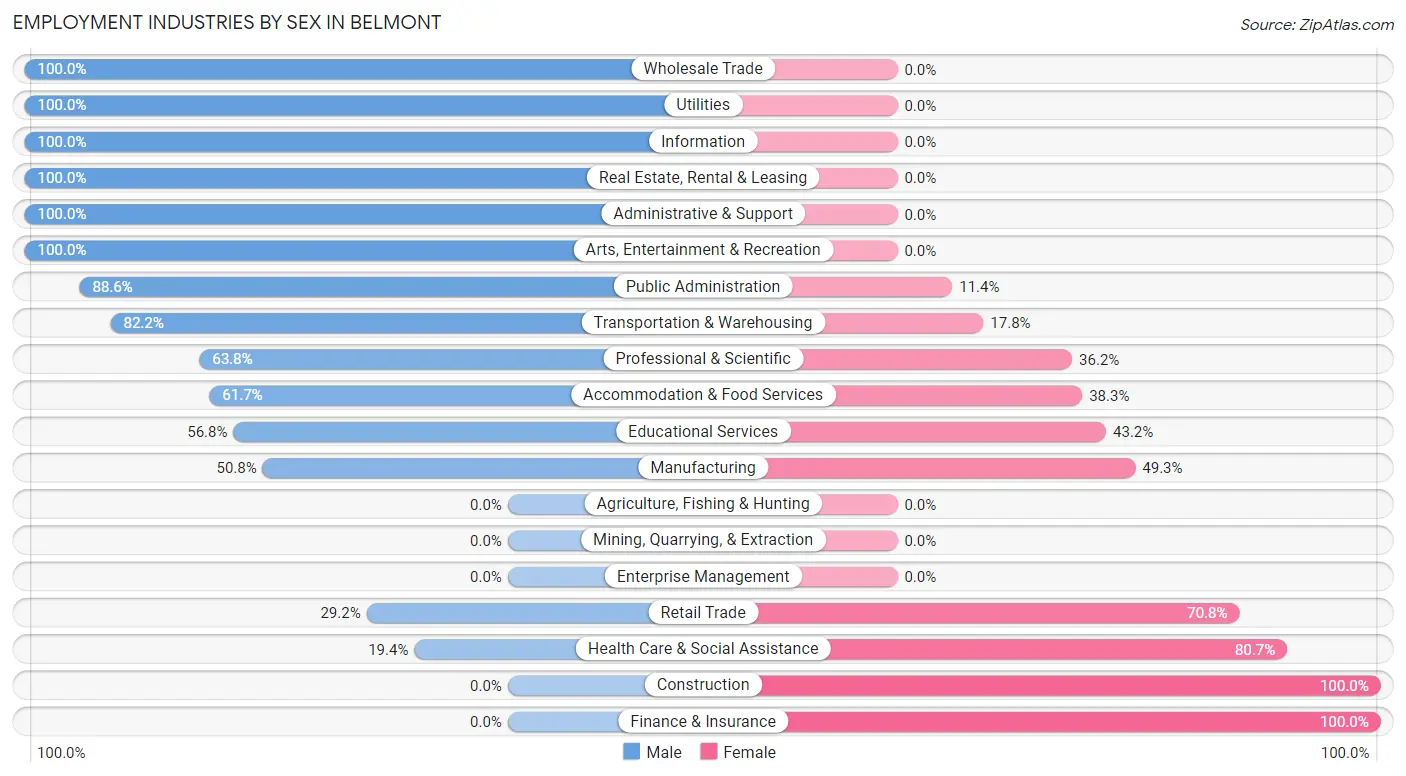
| Industry | Male | Female |
| Agriculture, Fishing & Hunting | 0 (0.0%) | 0 (0.0%) |
| Mining, Quarrying, & Extraction | 0 (0.0%) | 0 (0.0%) |
| Construction | 0 (0.0%) | 50 (100.0%) |
| Manufacturing | 34 (50.7%) | 33 (49.2%) |
| Wholesale Trade | 28 (100.0%) | 0 (0.0%) |
| Retail Trade | 38 (29.2%) | 92 (70.8%) |
| Transportation & Warehousing | 97 (82.2%) | 21 (17.8%) |
| Utilities | 37 (100.0%) | 0 (0.0%) |
| Information | 25 (100.0%) | 0 (0.0%) |
| Finance & Insurance | 0 (0.0%) | 56 (100.0%) |
| Real Estate, Rental & Leasing | 57 (100.0%) | 0 (0.0%) |
| Professional & Scientific | 60 (63.8%) | 34 (36.2%) |
| Enterprise Management | 0 (0.0%) | 0 (0.0%) |
| Administrative & Support | 19 (100.0%) | 0 (0.0%) |
| Educational Services | 71 (56.8%) | 54 (43.2%) |
| Health Care & Social Assistance | 42 (19.4%) | 175 (80.6%) |
| Arts, Entertainment & Recreation | 13 (100.0%) | 0 (0.0%) |
| Accommodation & Food Services | 71 (61.7%) | 44 (38.3%) |
| Public Administration | 39 (88.6%) | 5 (11.4%) |
| Total | 654 (51.4%) | 619 (48.6%) |
Education in Belmont
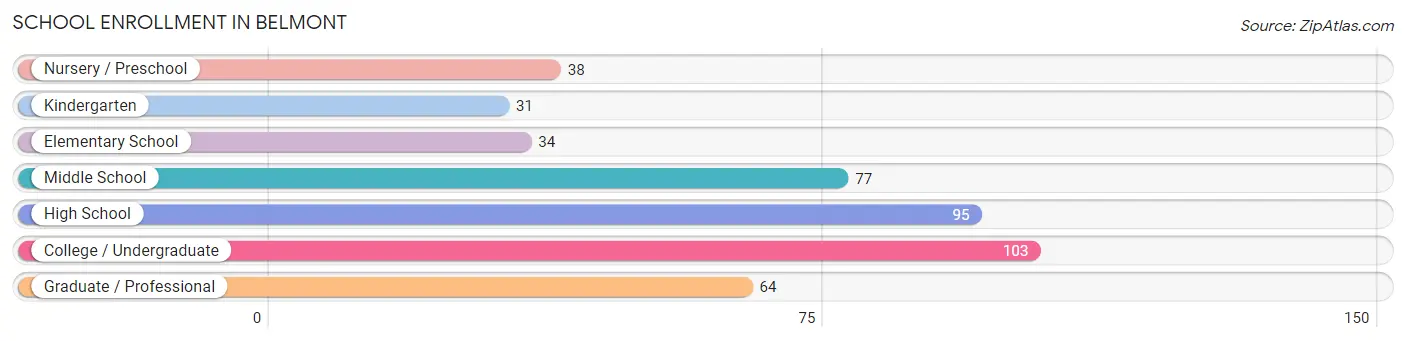
School Enrollment in Belmont
The most common levels of schooling among the 442 students in Belmont are college / undergraduate (103 | 23.3%), high school (95 | 21.5%), and middle school (77 | 17.4%).
| School Level | # Students | % Students |
| Nursery / Preschool | 38 | 8.6% |
| Kindergarten | 31 | 7.0% |
| Elementary School | 34 | 7.7% |
| Middle School | 77 | 17.4% |
| High School | 95 | 21.5% |
| College / Undergraduate | 103 | 23.3% |
| Graduate / Professional | 64 | 14.5% |
| Total | 442 | 100.0% |
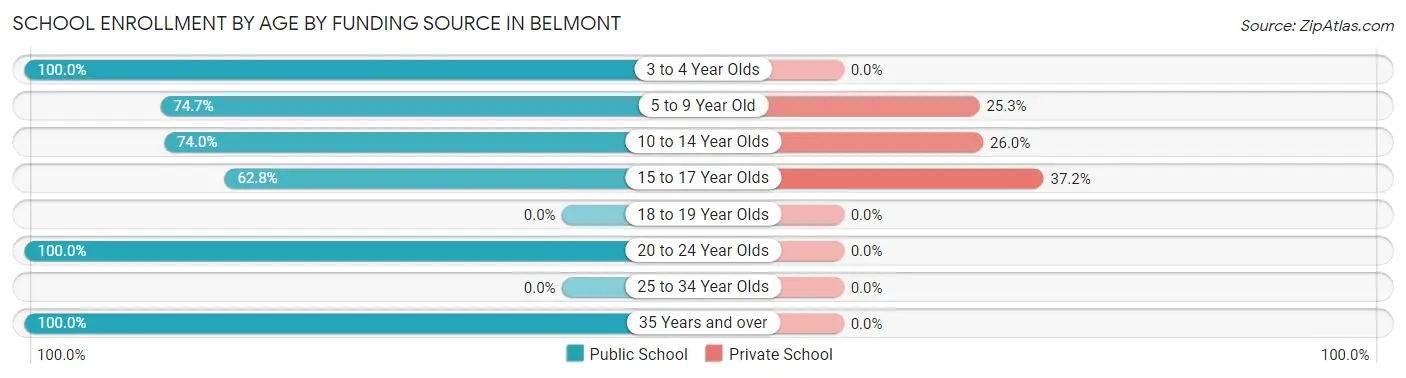
School Enrollment by Age by Funding Source in Belmont
Out of a total of 442 students who are enrolled in schools in Belmont, 77 (17.4%) attend a private institution, while the remaining 365 (82.6%) are enrolled in public schools. The age group of 15 to 17 year olds has the highest likelihood of being enrolled in private schools, with 35 (37.2% in the age bracket) enrolled. Conversely, the age group of 3 to 4 year olds has the lowest likelihood of being enrolled in a private school, with 16 (100.0% in the age bracket) attending a public institution.
| Age Bracket | Public School | Private School |
| 3 to 4 Year Olds | 16 (100.0%) | 0 (0.0%) |
| 5 to 9 Year Old | 65 (74.7%) | 22 (25.3%) |
| 10 to 14 Year Olds | 57 (74.0%) | 20 (26.0%) |
| 15 to 17 Year Olds | 59 (62.8%) | 35 (37.2%) |
| 18 to 19 Year Olds | 0 (0.0%) | 0 (0.0%) |
| 20 to 24 Year Olds | 156 (100.0%) | 0 (0.0%) |
| 25 to 34 Year Olds | 0 (0.0%) | 0 (0.0%) |
| 35 Years and over | 12 (100.0%) | 0 (0.0%) |
| Total | 365 (82.6%) | 77 (17.4%) |
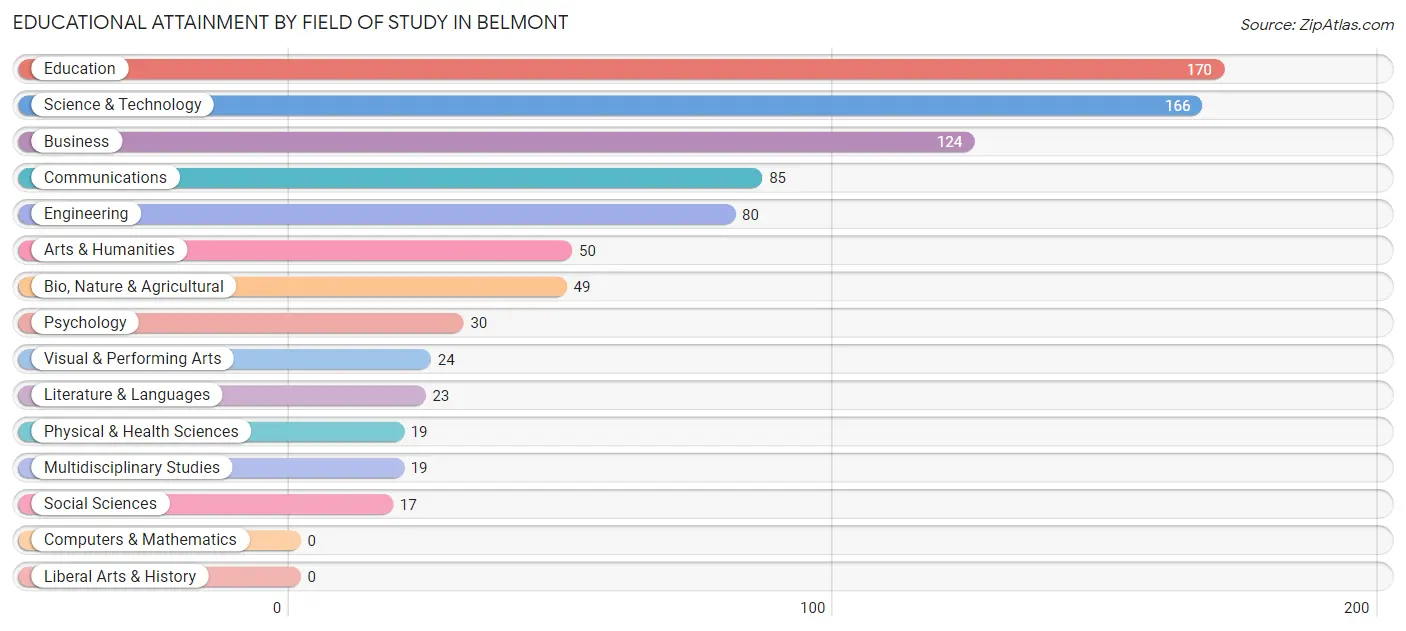
Educational Attainment by Field of Study in Belmont
Education (170 | 19.9%), science & technology (166 | 19.4%), business (124 | 14.5%), communications (85 | 9.9%), and engineering (80 | 9.3%) are the most common fields of study among 856 individuals in Belmont who have obtained a bachelor's degree or higher.
| Field of Study | # Graduates | % Graduates |
| Computers & Mathematics | 0 | 0.0% |
| Bio, Nature & Agricultural | 49 | 5.7% |
| Physical & Health Sciences | 19 | 2.2% |
| Psychology | 30 | 3.5% |
| Social Sciences | 17 | 2.0% |
| Engineering | 80 | 9.3% |
| Multidisciplinary Studies | 19 | 2.2% |
| Science & Technology | 166 | 19.4% |
| Business | 124 | 14.5% |
| Education | 170 | 19.9% |
| Literature & Languages | 23 | 2.7% |
| Liberal Arts & History | 0 | 0.0% |
| Visual & Performing Arts | 24 | 2.8% |
| Communications | 85 | 9.9% |
| Arts & Humanities | 50 | 5.8% |
| Total | 856 | 100.0% |
Transportation & Commute in Belmont
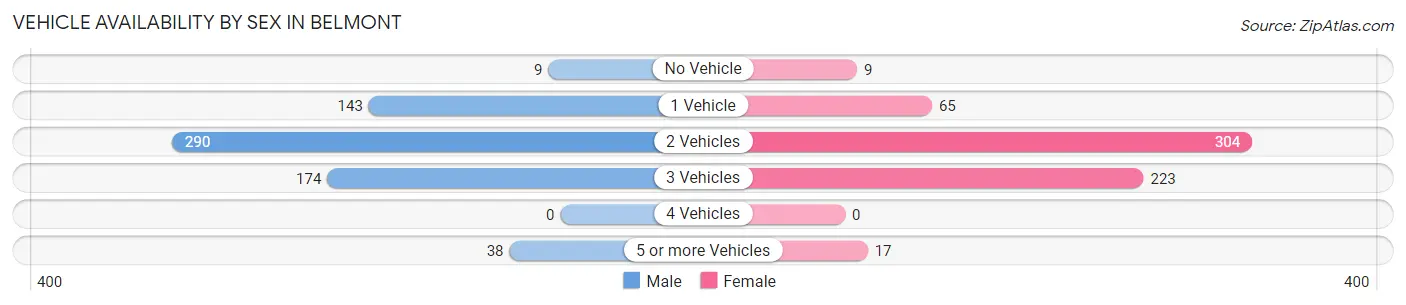
Vehicle Availability by Sex in Belmont
The most prevalent vehicle ownership categories in Belmont are males with 2 vehicles (290, accounting for 44.3%) and females with 2 vehicles (304, making up 46.9%).
| Vehicles Available | Male | Female |
| No Vehicle | 9 (1.4%) | 9 (1.5%) |
| 1 Vehicle | 143 (21.9%) | 65 (10.5%) |
| 2 Vehicles | 290 (44.3%) | 304 (49.2%) |
| 3 Vehicles | 174 (26.6%) | 223 (36.1%) |
| 4 Vehicles | 0 (0.0%) | 0 (0.0%) |
| 5 or more Vehicles | 38 (5.8%) | 17 (2.8%) |
| Total | 654 (100.0%) | 618 (100.0%) |
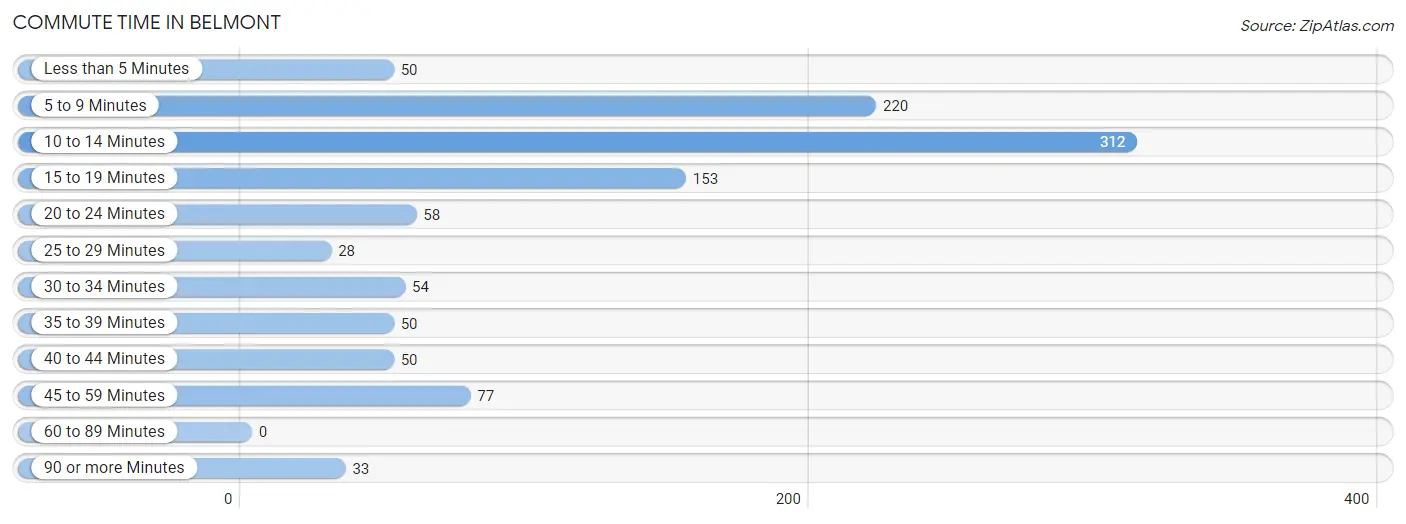
Commute Time in Belmont
The most frequently occuring commute durations in Belmont are 10 to 14 minutes (312 commuters, 28.8%), 5 to 9 minutes (220 commuters, 20.3%), and 15 to 19 minutes (153 commuters, 14.1%).
| Commute Time | # Commuters | % Commuters |
| Less than 5 Minutes | 50 | 4.6% |
| 5 to 9 Minutes | 220 | 20.3% |
| 10 to 14 Minutes | 312 | 28.8% |
| 15 to 19 Minutes | 153 | 14.1% |
| 20 to 24 Minutes | 58 | 5.3% |
| 25 to 29 Minutes | 28 | 2.6% |
| 30 to 34 Minutes | 54 | 5.0% |
| 35 to 39 Minutes | 50 | 4.6% |
| 40 to 44 Minutes | 50 | 4.6% |
| 45 to 59 Minutes | 77 | 7.1% |
| 60 to 89 Minutes | 0 | 0.0% |
| 90 or more Minutes | 33 | 3.0% |
Commute Time by Sex in Belmont
The most common commute times in Belmont are 5 to 9 minutes (138 commuters, 23.5%) for males and 10 to 14 minutes (174 commuters, 34.9%) for females.
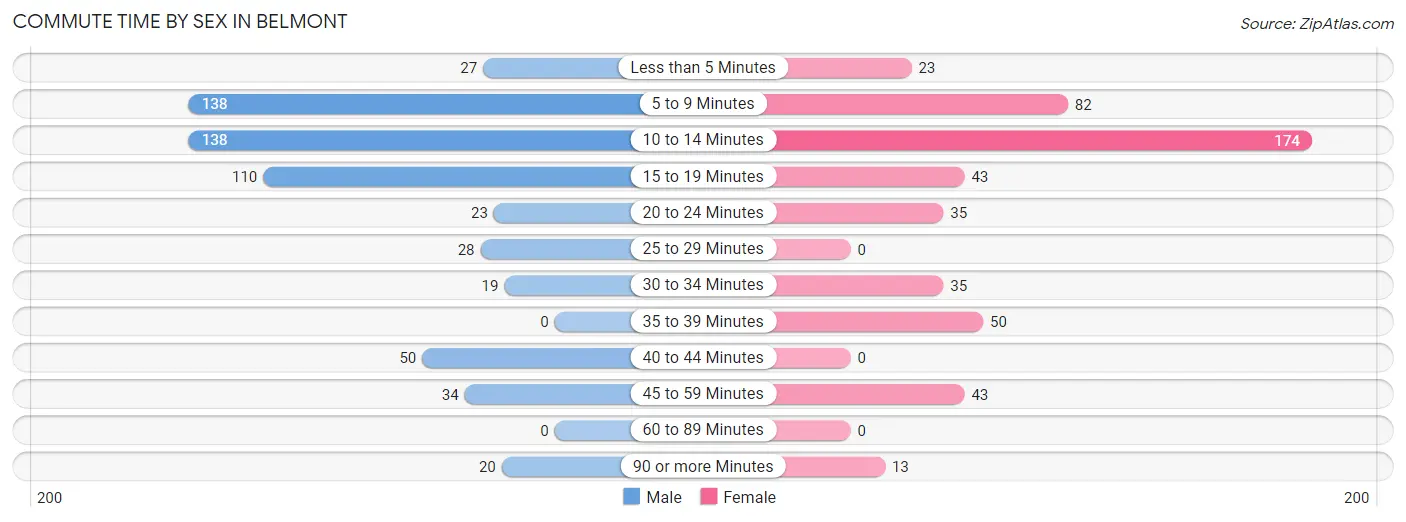
| Commute Time | Male | Female |
| Less than 5 Minutes | 27 (4.6%) | 23 (4.6%) |
| 5 to 9 Minutes | 138 (23.5%) | 82 (16.5%) |
| 10 to 14 Minutes | 138 (23.5%) | 174 (34.9%) |
| 15 to 19 Minutes | 110 (18.7%) | 43 (8.6%) |
| 20 to 24 Minutes | 23 (3.9%) | 35 (7.0%) |
| 25 to 29 Minutes | 28 (4.8%) | 0 (0.0%) |
| 30 to 34 Minutes | 19 (3.2%) | 35 (7.0%) |
| 35 to 39 Minutes | 0 (0.0%) | 50 (10.0%) |
| 40 to 44 Minutes | 50 (8.5%) | 0 (0.0%) |
| 45 to 59 Minutes | 34 (5.8%) | 43 (8.6%) |
| 60 to 89 Minutes | 0 (0.0%) | 0 (0.0%) |
| 90 or more Minutes | 20 (3.4%) | 13 (2.6%) |
Time of Departure to Work by Sex in Belmont
The most frequent times of departure to work in Belmont are 12:00 PM to 3:59 PM (137, 23.3%) for males and 9:00 AM to 9:59 AM (103, 20.7%) for females.
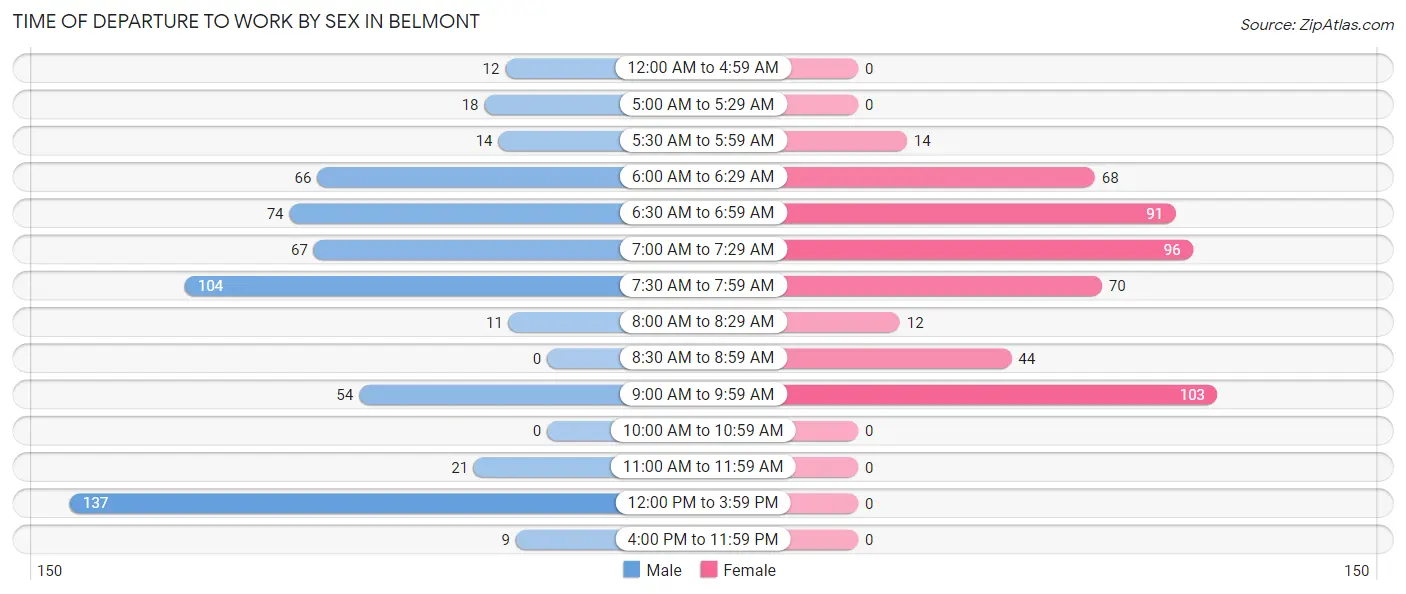
| Time of Departure | Male | Female |
| 12:00 AM to 4:59 AM | 12 (2.0%) | 0 (0.0%) |
| 5:00 AM to 5:29 AM | 18 (3.1%) | 0 (0.0%) |
| 5:30 AM to 5:59 AM | 14 (2.4%) | 14 (2.8%) |
| 6:00 AM to 6:29 AM | 66 (11.2%) | 68 (13.7%) |
| 6:30 AM to 6:59 AM | 74 (12.6%) | 91 (18.3%) |
| 7:00 AM to 7:29 AM | 67 (11.4%) | 96 (19.3%) |
| 7:30 AM to 7:59 AM | 104 (17.7%) | 70 (14.1%) |
| 8:00 AM to 8:29 AM | 11 (1.9%) | 12 (2.4%) |
| 8:30 AM to 8:59 AM | 0 (0.0%) | 44 (8.8%) |
| 9:00 AM to 9:59 AM | 54 (9.2%) | 103 (20.7%) |
| 10:00 AM to 10:59 AM | 0 (0.0%) | 0 (0.0%) |
| 11:00 AM to 11:59 AM | 21 (3.6%) | 0 (0.0%) |
| 12:00 PM to 3:59 PM | 137 (23.3%) | 0 (0.0%) |
| 4:00 PM to 11:59 PM | 9 (1.5%) | 0 (0.0%) |
| Total | 587 (100.0%) | 498 (100.0%) |
Housing Occupancy in Belmont
Occupancy by Ownership in Belmont
Of the total 1,221 dwellings in Belmont, owner-occupied units account for 848 (69.5%), while renter-occupied units make up 373 (30.5%).
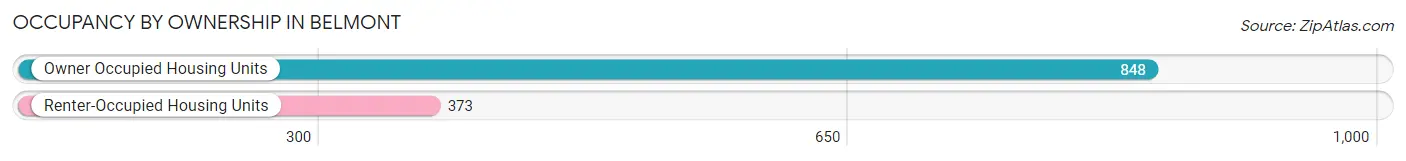
| Occupancy | # Housing Units | % Housing Units |
| Owner Occupied Housing Units | 848 | 69.5% |
| Renter-Occupied Housing Units | 373 | 30.5% |
| Total Occupied Housing Units | 1,221 | 100.0% |
Occupancy by Household Size in Belmont
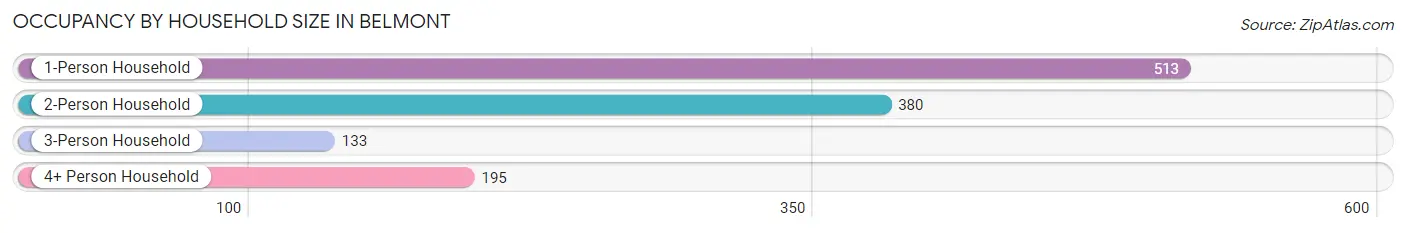
| Household Size | # Housing Units | % Housing Units |
| 1-Person Household | 513 | 42.0% |
| 2-Person Household | 380 | 31.1% |
| 3-Person Household | 133 | 10.9% |
| 4+ Person Household | 195 | 16.0% |
| Total Housing Units | 1,221 | 100.0% |
Occupancy by Ownership by Household Size in Belmont
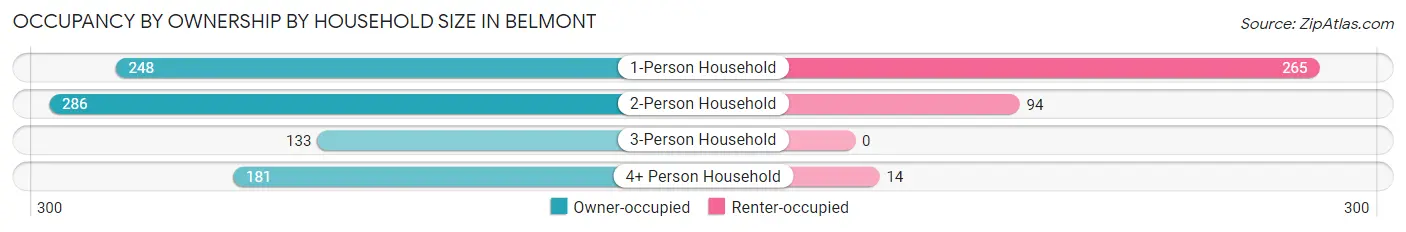
| Household Size | Owner-occupied | Renter-occupied |
| 1-Person Household | 248 (48.3%) | 265 (51.7%) |
| 2-Person Household | 286 (75.3%) | 94 (24.7%) |
| 3-Person Household | 133 (100.0%) | 0 (0.0%) |
| 4+ Person Household | 181 (92.8%) | 14 (7.2%) |
| Total Housing Units | 848 (69.5%) | 373 (30.5%) |
Occupancy by Educational Attainment in Belmont
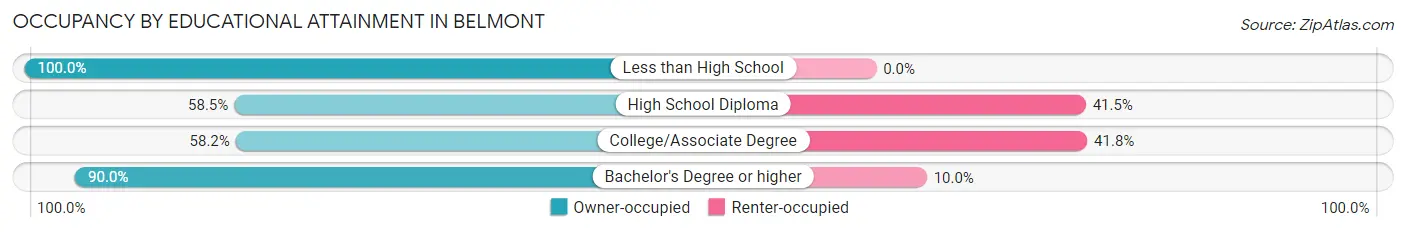
| Household Size | Owner-occupied | Renter-occupied |
| Less than High School | 7 (100.0%) | 0 (0.0%) |
| High School Diploma | 311 (58.5%) | 221 (41.5%) |
| College/Associate Degree | 153 (58.2%) | 110 (41.8%) |
| Bachelor's Degree or higher | 377 (90.0%) | 42 (10.0%) |
Occupancy by Age of Householder in Belmont
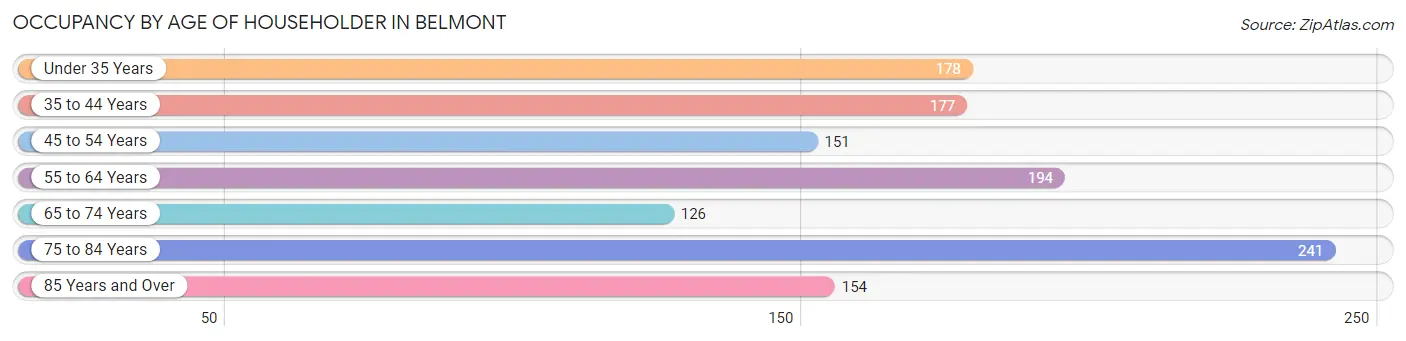
| Age Bracket | # Households | % Households |
| Under 35 Years | 178 | 14.6% |
| 35 to 44 Years | 177 | 14.5% |
| 45 to 54 Years | 151 | 12.4% |
| 55 to 64 Years | 194 | 15.9% |
| 65 to 74 Years | 126 | 10.3% |
| 75 to 84 Years | 241 | 19.7% |
| 85 Years and Over | 154 | 12.6% |
| Total | 1,221 | 100.0% |
Housing Finances in Belmont
Median Income by Occupancy in Belmont
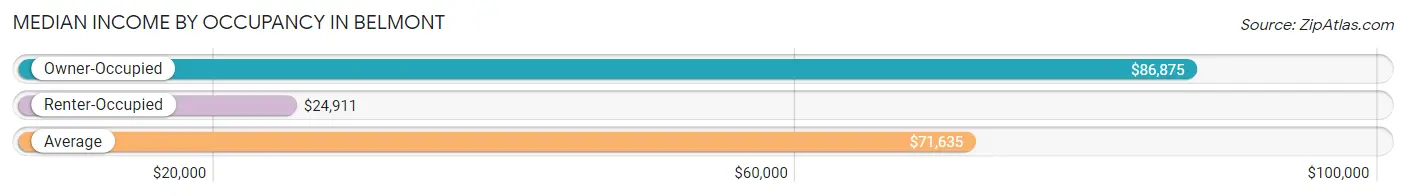
| Occupancy Type | # Households | Median Income |
| Owner-Occupied | 848 (69.5%) | $86,875 |
| Renter-Occupied | 373 (30.5%) | $24,911 |
| Average | 1,221 (100.0%) | $71,635 |
Occupancy by Householder Income Bracket in Belmont
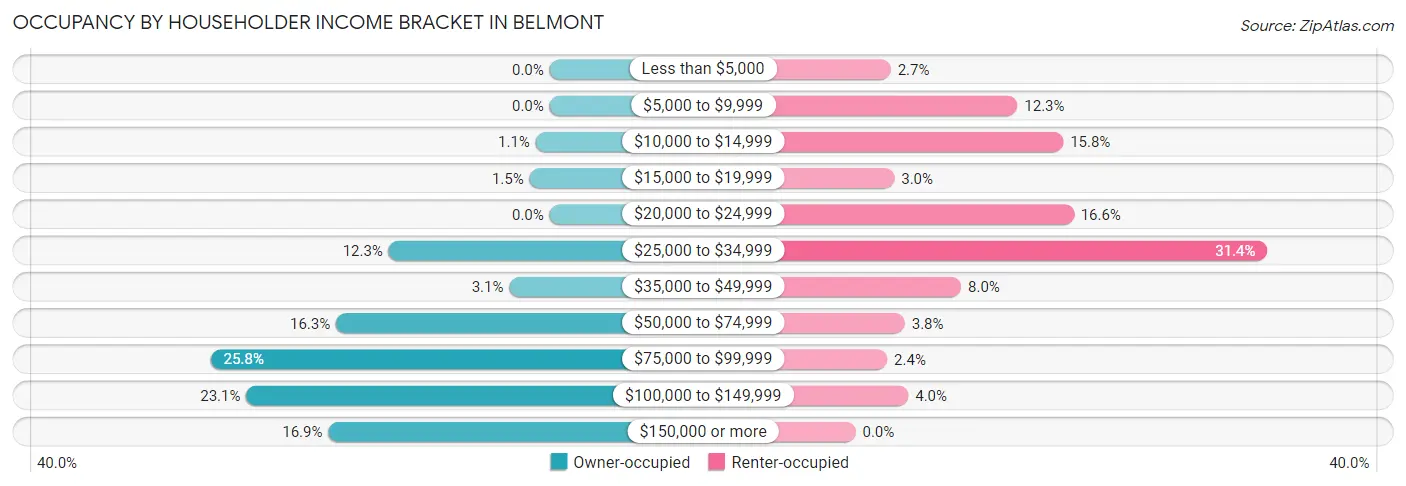
| Income Bracket | Owner-occupied | Renter-occupied |
| Less than $5,000 | 0 (0.0%) | 10 (2.7%) |
| $5,000 to $9,999 | 0 (0.0%) | 46 (12.3%) |
| $10,000 to $14,999 | 9 (1.1%) | 59 (15.8%) |
| $15,000 to $19,999 | 13 (1.5%) | 11 (2.9%) |
| $20,000 to $24,999 | 0 (0.0%) | 62 (16.6%) |
| $25,000 to $34,999 | 104 (12.3%) | 117 (31.4%) |
| $35,000 to $49,999 | 26 (3.1%) | 30 (8.0%) |
| $50,000 to $74,999 | 138 (16.3%) | 14 (3.7%) |
| $75,000 to $99,999 | 219 (25.8%) | 9 (2.4%) |
| $100,000 to $149,999 | 196 (23.1%) | 15 (4.0%) |
| $150,000 or more | 143 (16.9%) | 0 (0.0%) |
| Total | 848 (100.0%) | 373 (100.0%) |
Monthly Housing Cost Tiers in Belmont
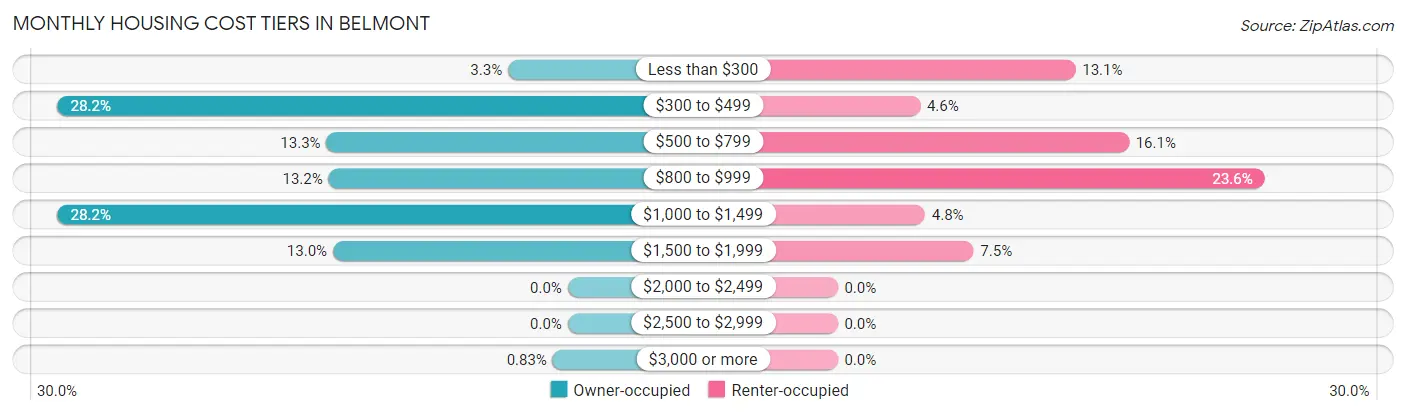
| Monthly Cost | Owner-occupied | Renter-occupied |
| Less than $300 | 28 (3.3%) | 49 (13.1%) |
| $300 to $499 | 239 (28.2%) | 17 (4.6%) |
| $500 to $799 | 113 (13.3%) | 60 (16.1%) |
| $800 to $999 | 112 (13.2%) | 88 (23.6%) |
| $1,000 to $1,499 | 239 (28.2%) | 18 (4.8%) |
| $1,500 to $1,999 | 110 (13.0%) | 28 (7.5%) |
| $2,000 to $2,499 | 0 (0.0%) | 0 (0.0%) |
| $2,500 to $2,999 | 0 (0.0%) | 0 (0.0%) |
| $3,000 or more | 7 (0.8%) | 0 (0.0%) |
| Total | 848 (100.0%) | 373 (100.0%) |
Physical Housing Characteristics in Belmont
Housing Structures in Belmont
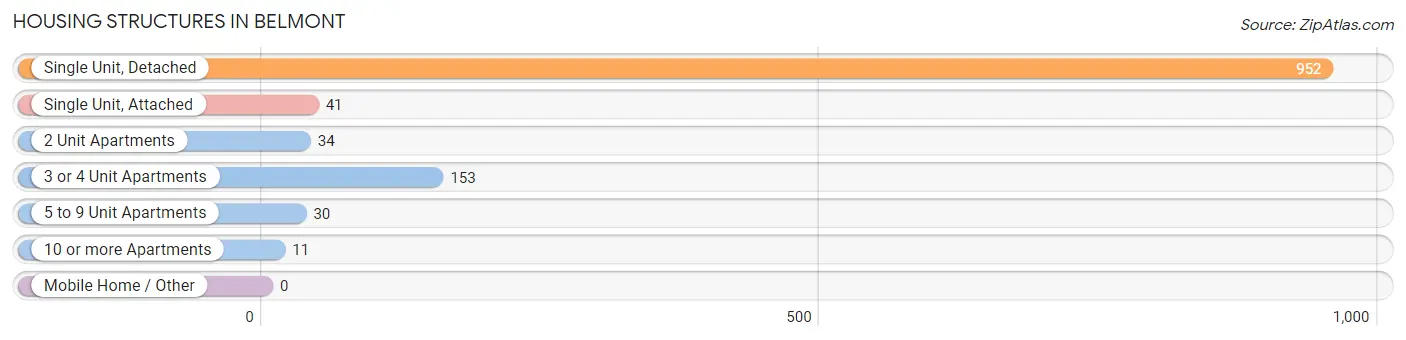
| Structure Type | # Housing Units | % Housing Units |
| Single Unit, Detached | 952 | 78.0% |
| Single Unit, Attached | 41 | 3.4% |
| 2 Unit Apartments | 34 | 2.8% |
| 3 or 4 Unit Apartments | 153 | 12.5% |
| 5 to 9 Unit Apartments | 30 | 2.5% |
| 10 or more Apartments | 11 | 0.9% |
| Mobile Home / Other | 0 | 0.0% |
| Total | 1,221 | 100.0% |
Housing Structures by Occupancy in Belmont
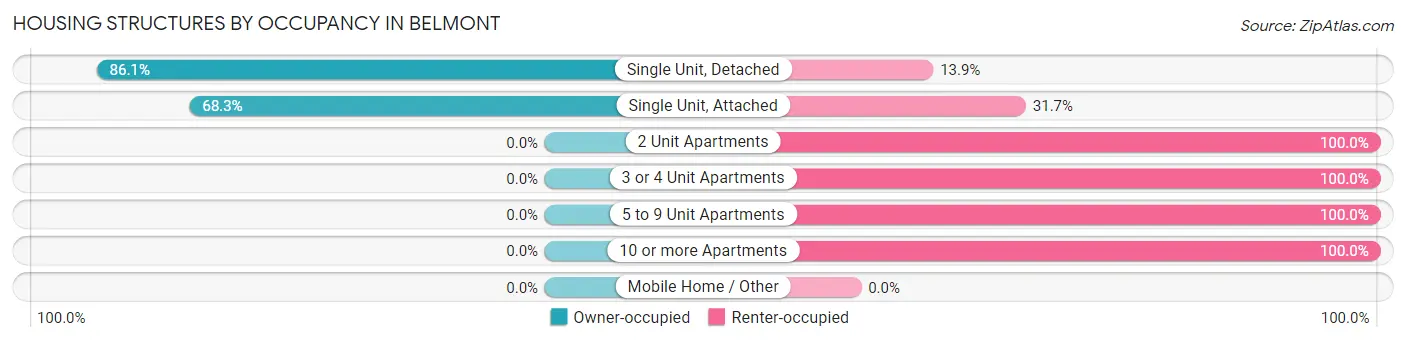
| Structure Type | Owner-occupied | Renter-occupied |
| Single Unit, Detached | 820 (86.1%) | 132 (13.9%) |
| Single Unit, Attached | 28 (68.3%) | 13 (31.7%) |
| 2 Unit Apartments | 0 (0.0%) | 34 (100.0%) |
| 3 or 4 Unit Apartments | 0 (0.0%) | 153 (100.0%) |
| 5 to 9 Unit Apartments | 0 (0.0%) | 30 (100.0%) |
| 10 or more Apartments | 0 (0.0%) | 11 (100.0%) |
| Mobile Home / Other | 0 (0.0%) | 0 (0.0%) |
| Total | 848 (69.5%) | 373 (30.5%) |
Housing Structures by Number of Rooms in Belmont
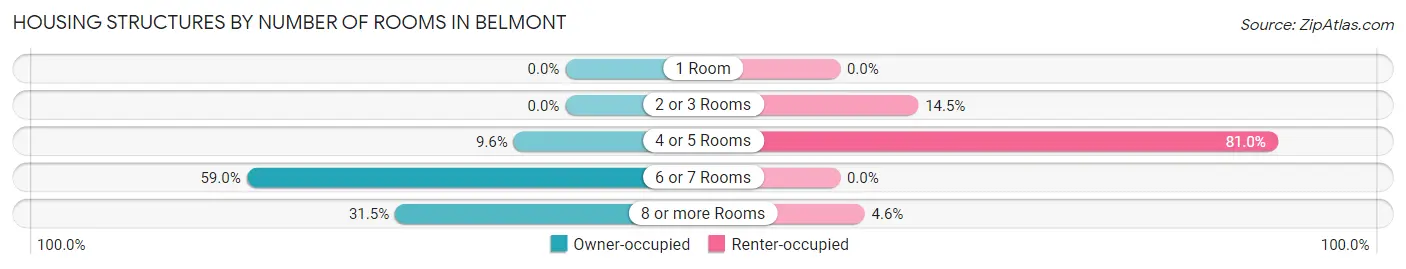
| Number of Rooms | Owner-occupied | Renter-occupied |
| 1 Room | 0 (0.0%) | 0 (0.0%) |
| 2 or 3 Rooms | 0 (0.0%) | 54 (14.5%) |
| 4 or 5 Rooms | 81 (9.6%) | 302 (81.0%) |
| 6 or 7 Rooms | 500 (59.0%) | 0 (0.0%) |
| 8 or more Rooms | 267 (31.5%) | 17 (4.6%) |
| Total | 848 (100.0%) | 373 (100.0%) |
Housing Structure by Heating Type in Belmont
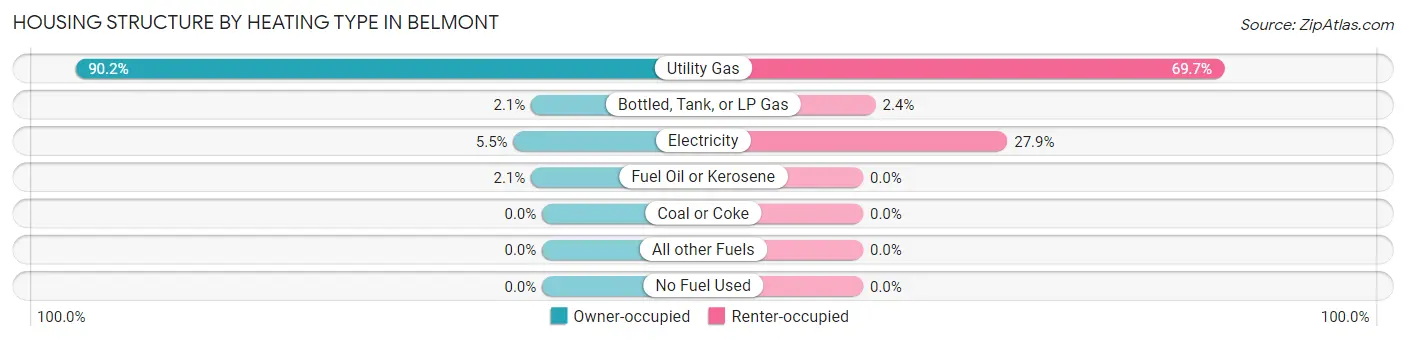
| Heating Type | Owner-occupied | Renter-occupied |
| Utility Gas | 765 (90.2%) | 260 (69.7%) |
| Bottled, Tank, or LP Gas | 18 (2.1%) | 9 (2.4%) |
| Electricity | 47 (5.5%) | 104 (27.9%) |
| Fuel Oil or Kerosene | 18 (2.1%) | 0 (0.0%) |
| Coal or Coke | 0 (0.0%) | 0 (0.0%) |
| All other Fuels | 0 (0.0%) | 0 (0.0%) |
| No Fuel Used | 0 (0.0%) | 0 (0.0%) |
| Total | 848 (100.0%) | 373 (100.0%) |
Household Vehicle Usage in Belmont
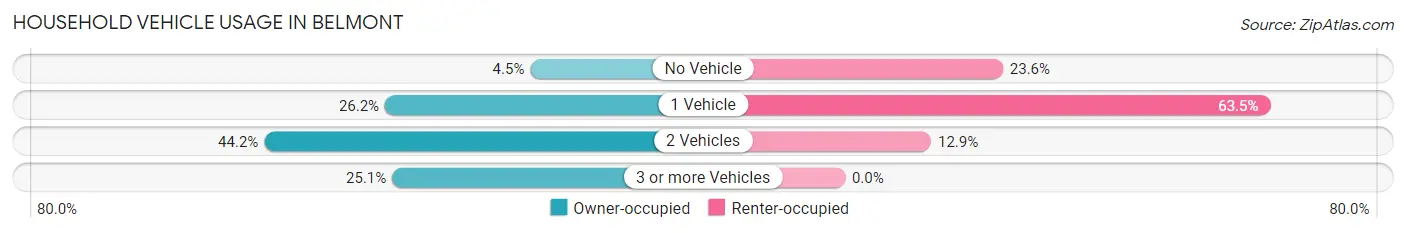
| Vehicles per Household | Owner-occupied | Renter-occupied |
| No Vehicle | 38 (4.5%) | 88 (23.6%) |
| 1 Vehicle | 222 (26.2%) | 237 (63.5%) |
| 2 Vehicles | 375 (44.2%) | 48 (12.9%) |
| 3 or more Vehicles | 213 (25.1%) | 0 (0.0%) |
| Total | 848 (100.0%) | 373 (100.0%) |
Real Estate & Mortgages in Belmont
Real Estate and Mortgage Overview in Belmont
| Characteristic | Without Mortgage | With Mortgage |
| Housing Units | 350 | 498 |
| Median Property Value | $144,400 | $150,200 |
| Median Household Income | $54,766 | $113 |
| Monthly Housing Costs | $418 | $0 |
| Real Estate Taxes | $1,691 | $0 |
Property Value by Mortgage Status in Belmont
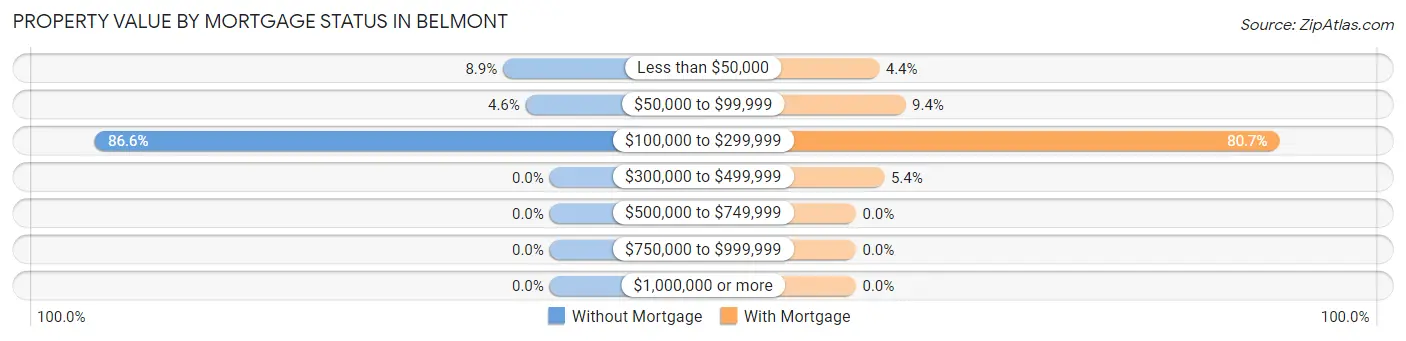
| Property Value | Without Mortgage | With Mortgage |
| Less than $50,000 | 31 (8.9%) | 22 (4.4%) |
| $50,000 to $99,999 | 16 (4.6%) | 47 (9.4%) |
| $100,000 to $299,999 | 303 (86.6%) | 402 (80.7%) |
| $300,000 to $499,999 | 0 (0.0%) | 27 (5.4%) |
| $500,000 to $749,999 | 0 (0.0%) | 0 (0.0%) |
| $750,000 to $999,999 | 0 (0.0%) | 0 (0.0%) |
| $1,000,000 or more | 0 (0.0%) | 0 (0.0%) |
| Total | 350 (100.0%) | 498 (100.0%) |
Household Income by Mortgage Status in Belmont
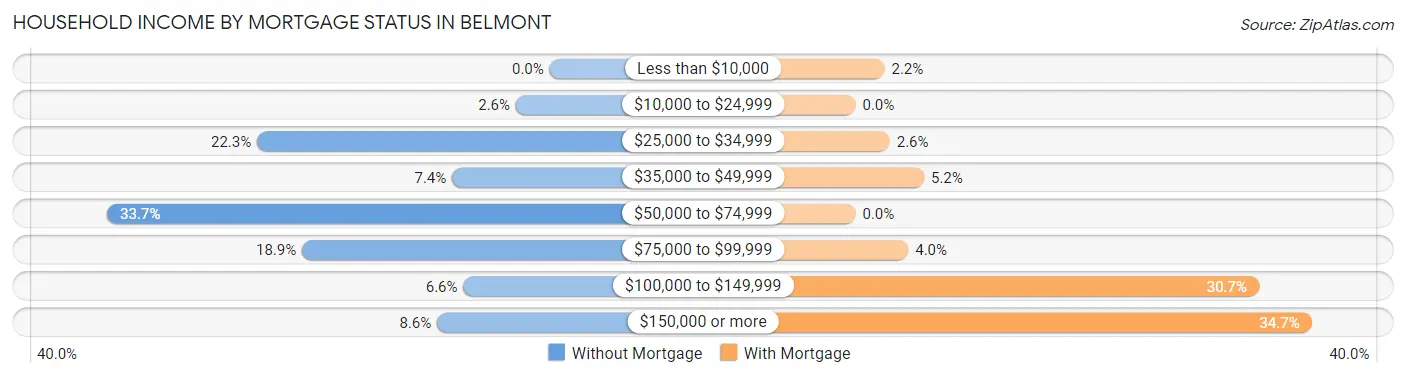
| Household Income | Without Mortgage | With Mortgage |
| Less than $10,000 | 0 (0.0%) | 11 (2.2%) |
| $10,000 to $24,999 | 9 (2.6%) | 0 (0.0%) |
| $25,000 to $34,999 | 78 (22.3%) | 13 (2.6%) |
| $35,000 to $49,999 | 26 (7.4%) | 26 (5.2%) |
| $50,000 to $74,999 | 118 (33.7%) | 0 (0.0%) |
| $75,000 to $99,999 | 66 (18.9%) | 20 (4.0%) |
| $100,000 to $149,999 | 23 (6.6%) | 153 (30.7%) |
| $150,000 or more | 30 (8.6%) | 173 (34.7%) |
| Total | 350 (100.0%) | 498 (100.0%) |
Property Value to Household Income Ratio in Belmont
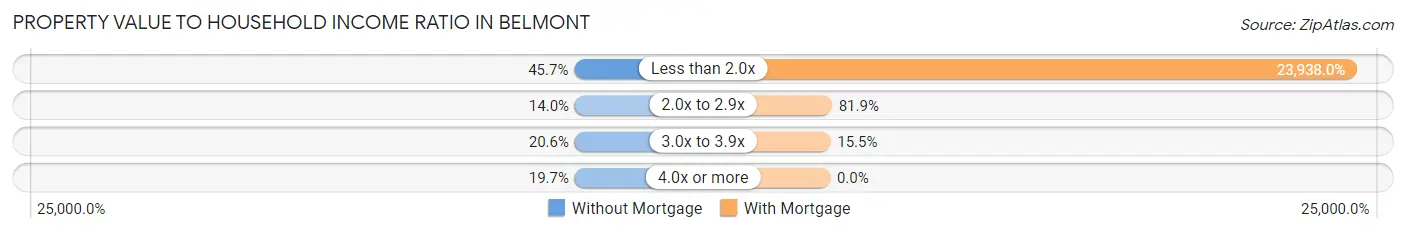
| Value-to-Income Ratio | Without Mortgage | With Mortgage |
| Less than 2.0x | 160 (45.7%) | 119,211 (23,938.0%) |
| 2.0x to 2.9x | 49 (14.0%) | 408 (81.9%) |
| 3.0x to 3.9x | 72 (20.6%) | 77 (15.5%) |
| 4.0x or more | 69 (19.7%) | 0 (0.0%) |
| Total | 350 (100.0%) | 498 (100.0%) |
Real Estate Taxes by Mortgage Status in Belmont
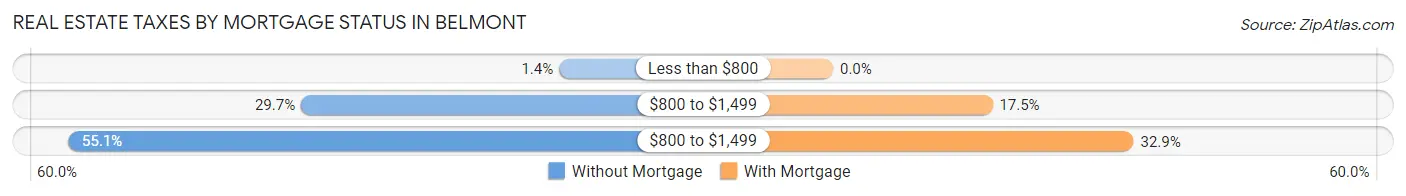
| Property Taxes | Without Mortgage | With Mortgage |
| Less than $800 | 5 (1.4%) | 0 (0.0%) |
| $800 to $1,499 | 104 (29.7%) | 87 (17.5%) |
| $800 to $1,499 | 193 (55.1%) | 164 (32.9%) |
| Total | 350 (100.0%) | 498 (100.0%) |
Health & Disability in Belmont
Health Insurance Coverage by Age in Belmont
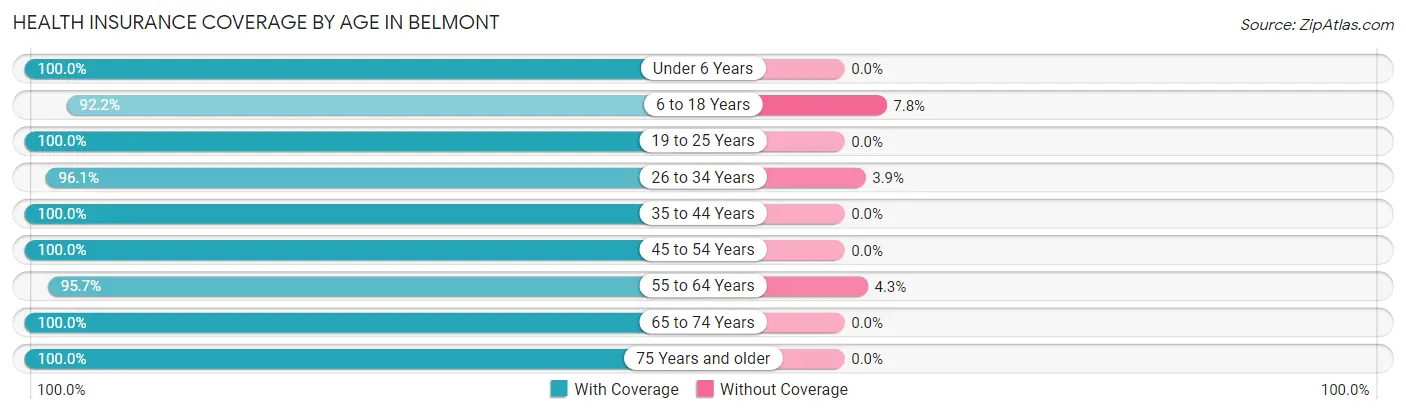
| Age Bracket | With Coverage | Without Coverage |
| Under 6 Years | 183 (100.0%) | 0 (0.0%) |
| 6 to 18 Years | 247 (92.2%) | 21 (7.8%) |
| 19 to 25 Years | 265 (100.0%) | 0 (0.0%) |
| 26 to 34 Years | 270 (96.1%) | 11 (3.9%) |
| 35 to 44 Years | 300 (100.0%) | 0 (0.0%) |
| 45 to 54 Years | 304 (100.0%) | 0 (0.0%) |
| 55 to 64 Years | 309 (95.7%) | 14 (4.3%) |
| 65 to 74 Years | 251 (100.0%) | 0 (0.0%) |
| 75 Years and older | 430 (100.0%) | 0 (0.0%) |
| Total | 2,559 (98.2%) | 46 (1.8%) |
Health Insurance Coverage by Citizenship Status in Belmont
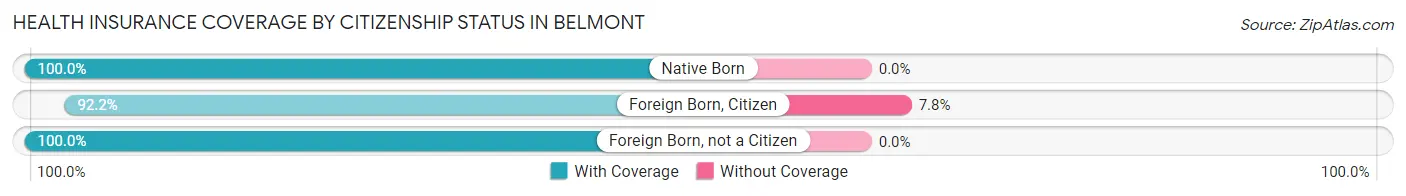
| Citizenship Status | With Coverage | Without Coverage |
| Native Born | 183 (100.0%) | 0 (0.0%) |
| Foreign Born, Citizen | 247 (92.2%) | 21 (7.8%) |
| Foreign Born, not a Citizen | 265 (100.0%) | 0 (0.0%) |
Health Insurance Coverage by Household Income in Belmont
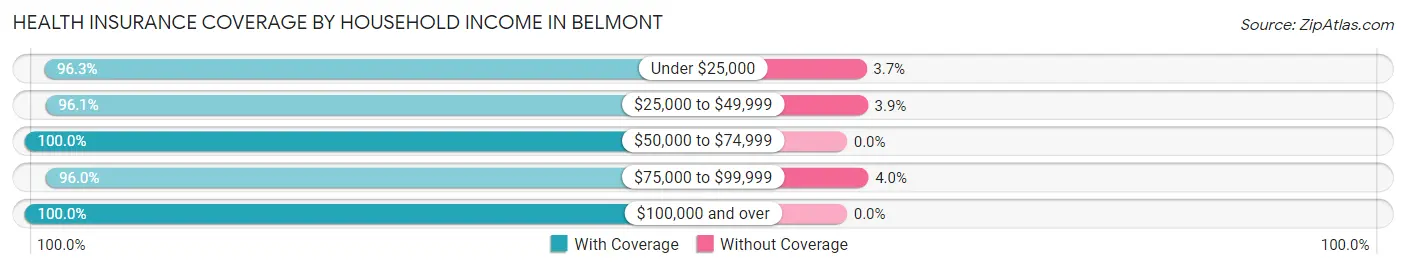
| Household Income | With Coverage | Without Coverage |
| Under $25,000 | 289 (96.3%) | 11 (3.7%) |
| $25,000 to $49,999 | 345 (96.1%) | 14 (3.9%) |
| $50,000 to $74,999 | 338 (100.0%) | 0 (0.0%) |
| $75,000 to $99,999 | 502 (96.0%) | 21 (4.0%) |
| $100,000 and over | 1,080 (100.0%) | 0 (0.0%) |
Public vs Private Health Insurance Coverage by Age in Belmont
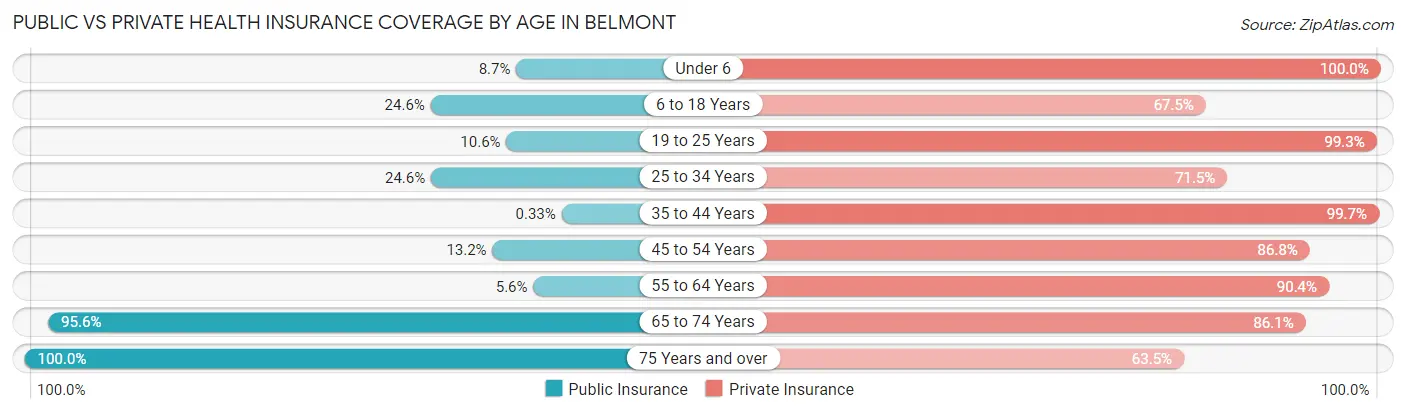
| Age Bracket | Public Insurance | Private Insurance |
| Under 6 | 16 (8.7%) | 183 (100.0%) |
| 6 to 18 Years | 66 (24.6%) | 181 (67.5%) |
| 19 to 25 Years | 28 (10.6%) | 263 (99.3%) |
| 25 to 34 Years | 69 (24.6%) | 201 (71.5%) |
| 35 to 44 Years | 1 (0.3%) | 299 (99.7%) |
| 45 to 54 Years | 40 (13.2%) | 264 (86.8%) |
| 55 to 64 Years | 18 (5.6%) | 292 (90.4%) |
| 65 to 74 Years | 240 (95.6%) | 216 (86.1%) |
| 75 Years and over | 430 (100.0%) | 273 (63.5%) |
| Total | 908 (34.9%) | 2,172 (83.4%) |
Disability Status by Sex by Age in Belmont
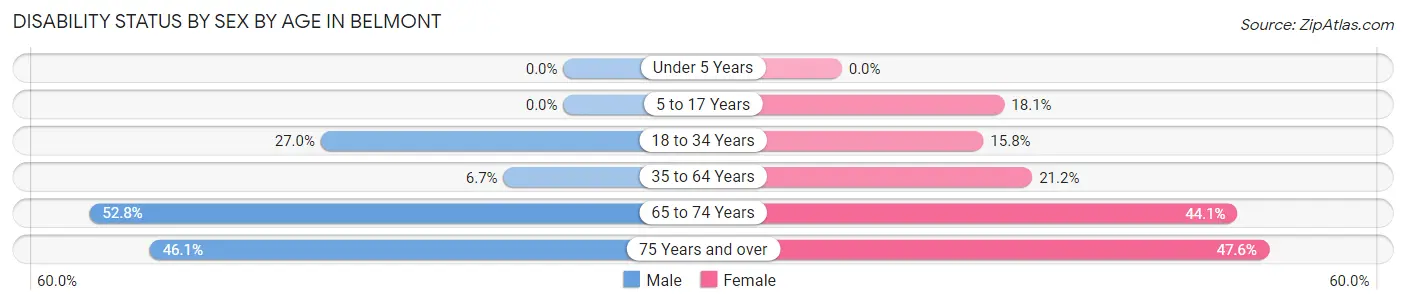
| Age Bracket | Male | Female |
| Under 5 Years | 0 (0.0%) | 0 (0.0%) |
| 5 to 17 Years | 0 (0.0%) | 23 (18.1%) |
| 18 to 34 Years | 57 (27.0%) | 53 (15.8%) |
| 35 to 64 Years | 31 (6.7%) | 98 (21.2%) |
| 65 to 74 Years | 57 (52.8%) | 63 (44.1%) |
| 75 Years and over | 76 (46.1%) | 126 (47.5%) |
Disability Class by Sex by Age in Belmont
Disability Class: Hearing Difficulty
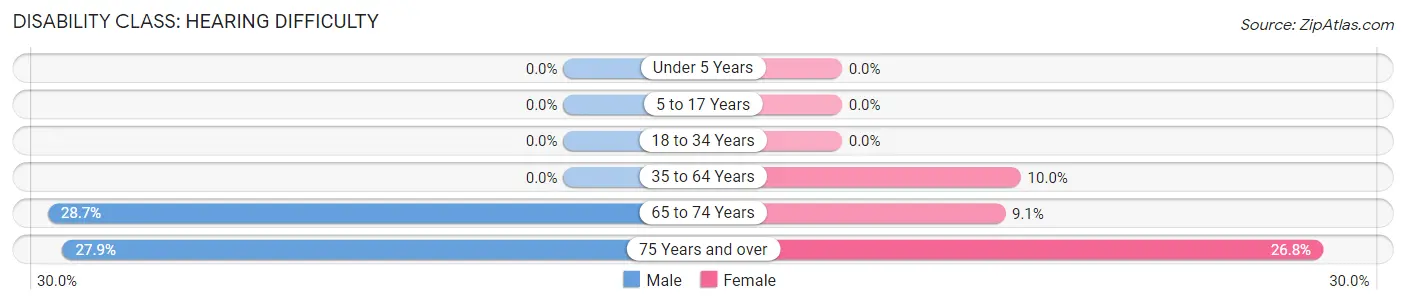
| Age Bracket | Male | Female |
| Under 5 Years | 0 (0.0%) | 0 (0.0%) |
| 5 to 17 Years | 0 (0.0%) | 0 (0.0%) |
| 18 to 34 Years | 0 (0.0%) | 0 (0.0%) |
| 35 to 64 Years | 0 (0.0%) | 46 (10.0%) |
| 65 to 74 Years | 31 (28.7%) | 13 (9.1%) |
| 75 Years and over | 46 (27.9%) | 71 (26.8%) |
Disability Class: Vision Difficulty
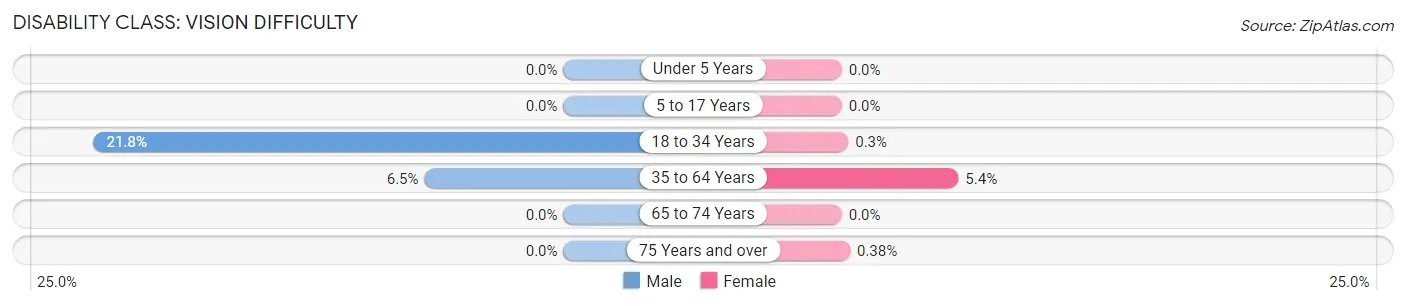
| Age Bracket | Male | Female |
| Under 5 Years | 0 (0.0%) | 0 (0.0%) |
| 5 to 17 Years | 0 (0.0%) | 0 (0.0%) |
| 18 to 34 Years | 46 (21.8%) | 1 (0.3%) |
| 35 to 64 Years | 30 (6.5%) | 25 (5.4%) |
| 65 to 74 Years | 0 (0.0%) | 0 (0.0%) |
| 75 Years and over | 0 (0.0%) | 1 (0.4%) |
Disability Class: Cognitive Difficulty
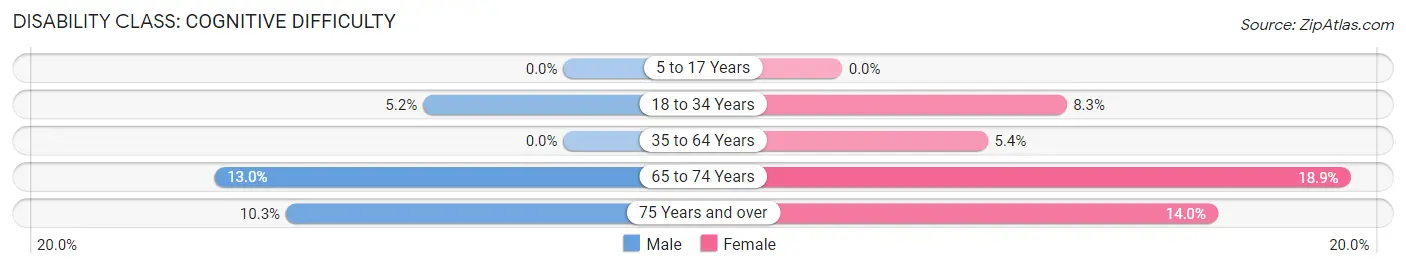
| Age Bracket | Male | Female |
| 5 to 17 Years | 0 (0.0%) | 0 (0.0%) |
| 18 to 34 Years | 11 (5.2%) | 28 (8.3%) |
| 35 to 64 Years | 0 (0.0%) | 25 (5.4%) |
| 65 to 74 Years | 14 (13.0%) | 27 (18.9%) |
| 75 Years and over | 17 (10.3%) | 37 (14.0%) |
Disability Class: Ambulatory Difficulty
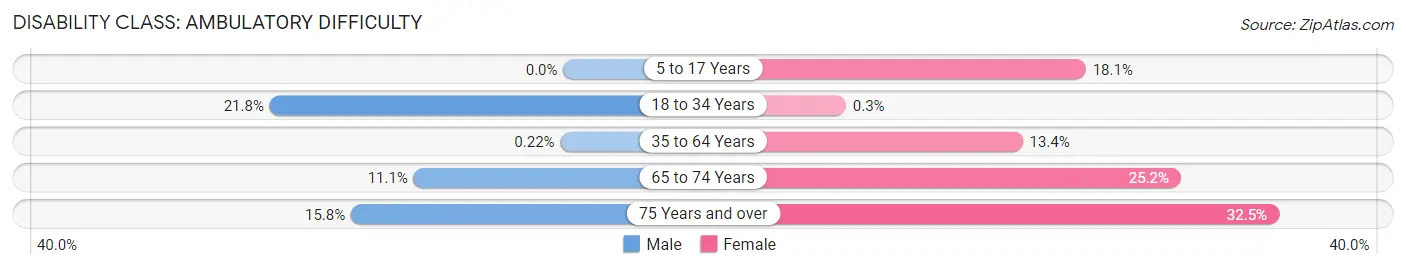
| Age Bracket | Male | Female |
| 5 to 17 Years | 0 (0.0%) | 23 (18.1%) |
| 18 to 34 Years | 46 (21.8%) | 1 (0.3%) |
| 35 to 64 Years | 1 (0.2%) | 62 (13.4%) |
| 65 to 74 Years | 12 (11.1%) | 36 (25.2%) |
| 75 Years and over | 26 (15.8%) | 86 (32.5%) |
Disability Class: Self-Care Difficulty
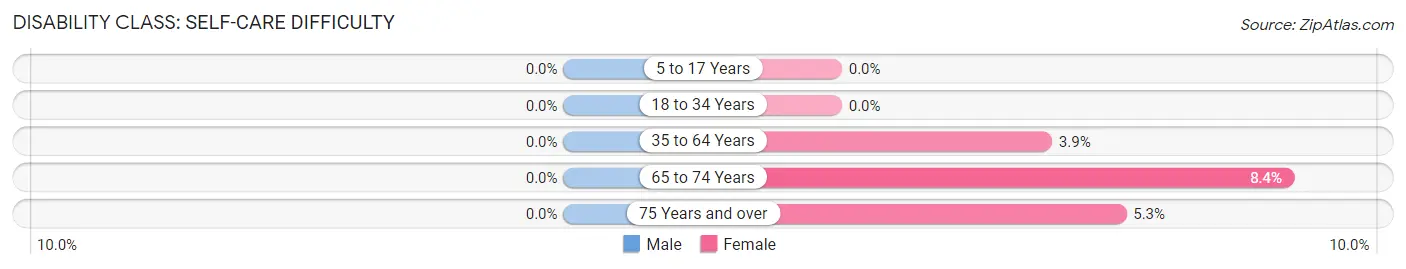
| Age Bracket | Male | Female |
| 5 to 17 Years | 0 (0.0%) | 0 (0.0%) |
| 18 to 34 Years | 0 (0.0%) | 0 (0.0%) |
| 35 to 64 Years | 0 (0.0%) | 18 (3.9%) |
| 65 to 74 Years | 0 (0.0%) | 12 (8.4%) |
| 75 Years and over | 0 (0.0%) | 14 (5.3%) |
Technology Access in Belmont
Computing Device Access in Belmont
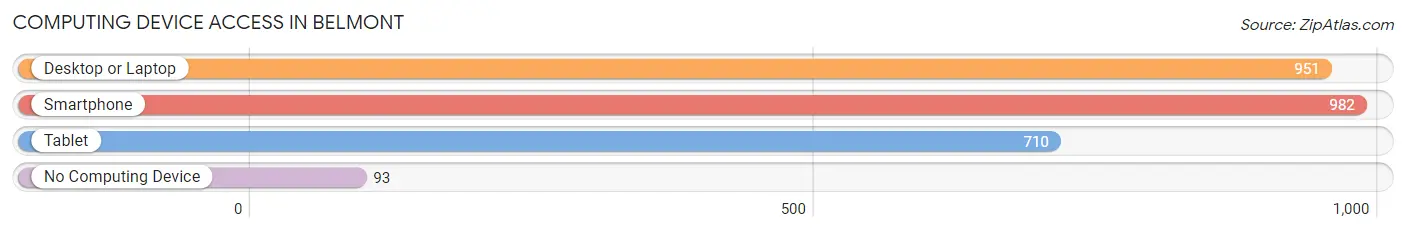
| Device Type | # Households | % Households |
| Desktop or Laptop | 951 | 77.9% |
| Smartphone | 982 | 80.4% |
| Tablet | 710 | 58.2% |
| No Computing Device | 93 | 7.6% |
| Total | 1,221 | 100.0% |
Internet Access in Belmont
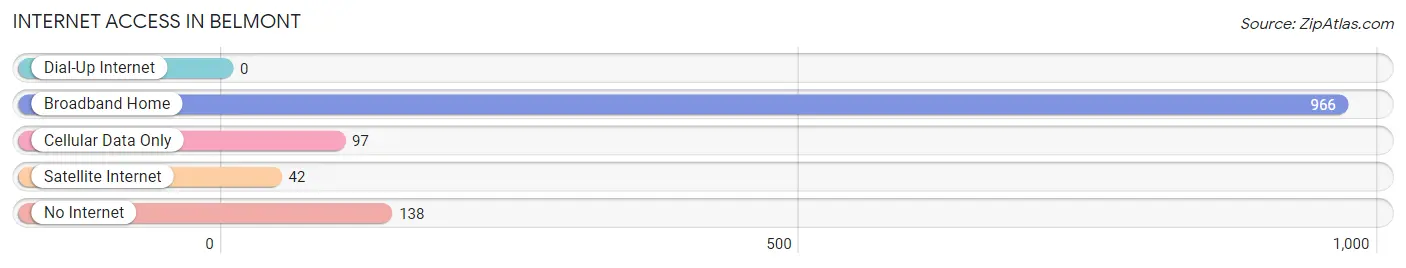
| Internet Type | # Households | % Households |
| Dial-Up Internet | 0 | 0.0% |
| Broadband Home | 966 | 79.1% |
| Cellular Data Only | 97 | 7.9% |
| Satellite Internet | 42 | 3.4% |
| No Internet | 138 | 11.3% |
| Total | 1,221 | 100.0% |
Belmont Summary
Belmont, Pennsylvania is a small borough located in the Allegheny Mountains of western Pennsylvania. It is situated in the northern part of Armstrong County, approximately 30 miles northeast of Pittsburgh. The borough was founded in 1845 and is home to a population of approximately 1,400 people.
History
Belmont was founded in 1845 by a group of settlers from the nearby town of Kittanning. The settlers were looking for a place to build a new town and chose the area due to its proximity to the Allegheny River. The town was named after the nearby Belmont Iron Works, which was established in 1837. The iron works was a major employer in the area and provided jobs for many of the town’s residents.
The town grew steadily throughout the 19th century and by the turn of the century, it had become a thriving community. The town was home to several businesses, including a sawmill, a gristmill, a tannery, and a brickyard. The town also had a post office, a bank, and several churches.
In the early 20th century, the town’s economy began to decline as the iron works closed and the population began to decline. The town was hit hard by the Great Depression and many of the businesses closed. The population continued to decline until the 1950s when the town began to experience a resurgence. The town was revitalized by the construction of the Allegheny Valley Expressway, which provided easy access to Pittsburgh.
Geography
Belmont is located in the northern part of Armstrong County, approximately 30 miles northeast of Pittsburgh. The borough is situated in the Allegheny Mountains and is surrounded by rolling hills and forests. The borough is located along the Allegheny River and is home to several small creeks and streams.
The borough has a total area of 0.7 square miles, all of which is land. The borough is located at an elevation of 1,068 feet above sea level. The climate in Belmont is classified as humid continental, with cold winters and hot, humid summers.
Economy
Belmont’s economy is largely based on tourism and the service industry. The town is home to several small businesses, including restaurants, shops, and a bed and breakfast. The town is also home to a small manufacturing plant that produces plastic products.
The town is also home to several small farms, which produce a variety of crops, including corn, soybeans, and hay. The town is also home to several wineries, which produce a variety of wines.
Demographics
As of the 2010 census, Belmont had a population of 1,400 people. The racial makeup of the town was 97.6% White, 0.6% African American, 0.3% Native American, 0.3% Asian, and 0.9% from other races. Hispanic or Latino of any race were 1.1% of the population.
The median household income in Belmont was $37,500, and the median family income was $45,000. The per capita income for the town was $19,000. About 11.3% of families and 14.2% of the population were below the poverty line, including 18.2% of those under age 18 and 8.3% of those age 65 or over.
Common Questions
What is Per Capita Income in Belmont?
Per Capita income in Belmont is $36,426.
What is the Median Family Income in Belmont?
Median Family Income in Belmont is $118,026.
What is the Median Household income in Belmont?
Median Household Income in Belmont is $71,635.
What is Income or Wage Gap in Belmont?
Income or Wage Gap in Belmont is 27.6%.
Women in Belmont earn 72.4 cents for every dollar earned by a man.
What is Inequality or Gini Index in Belmont?
Inequality or Gini Index in Belmont is 0.41.
What is the Total Population of Belmont?
Total Population of Belmont is 2,743.
What is the Total Male Population of Belmont?
Total Male Population of Belmont is 1,271.
What is the Total Female Population of Belmont?
Total Female Population of Belmont is 1,472.
What is the Ratio of Males per 100 Females in Belmont?
There are 86.35 Males per 100 Females in Belmont.
What is the Ratio of Females per 100 Males in Belmont?
There are 115.81 Females per 100 Males in Belmont.
What is the Median Population Age in Belmont?
Median Population Age in Belmont is 46.5 Years.
What is the Average Family Size in Belmont
Average Family Size in Belmont is 3.1 People.
What is the Average Household Size in Belmont
Average Household Size in Belmont is 2.1 People.
How Large is the Labor Force in Belmont?
There are 1,305 People in the Labor Forcein in Belmont.
What is the Percentage of People in the Labor Force in Belmont?
54.4% of People are in the Labor Force in Belmont.
What is the Unemployment Rate in Belmont?
Unemployment Rate in Belmont is 2.4%.