Dupont borough, PA Map & Demographics
Dupont borough Overview
$33,328
PER CAPITA INCOME
$88,107
AVG FAMILY INCOME
$61,224
AVG HOUSEHOLD INCOME
31.3%
WAGE / INCOME GAP [ % ]
68.7¢/ $1
WAGE / INCOME GAP [ $ ]
0.34
INEQUALITY / GINI INDEX
2,544
TOTAL POPULATION
1,216
MALE POPULATION
1,328
FEMALE POPULATION
91.57
MALES / 100 FEMALES
109.21
FEMALES / 100 MALES
47.5
MEDIAN AGE
2.5
AVG FAMILY SIZE
2.1
AVG HOUSEHOLD SIZE
1,534
LABOR FORCE [ PEOPLE ]
67.7%
PERCENT IN LABOR FORCE
9.7%
UNEMPLOYMENT RATE
Income in Dupont borough
Income Overview in Dupont borough
Per Capita Income in Dupont borough is $33,328, while median incomes of families and households are $88,107 and $61,224 respectively.
| Characteristic | Number | Measure |
| Per Capita Income | 2,544 | $33,328 |
| Median Family Income | 843 | $88,107 |
| Mean Family Income | 843 | $82,473 |
| Median Household Income | 1,195 | $61,224 |
| Mean Household Income | 1,195 | $71,654 |
| Income Deficit | 843 | $0 |
| Wage / Income Gap (%) | 2,544 | 31.29% |
| Wage / Income Gap ($) | 2,544 | 68.71¢ per $1 |
| Gini / Inequality Index | 2,544 | 0.34 |
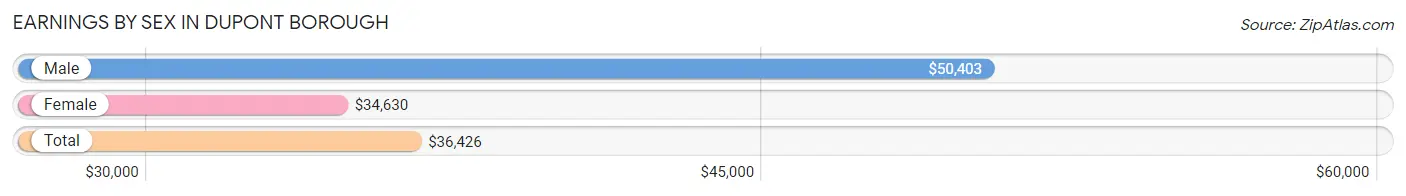
Earnings by Sex in Dupont borough
Average Earnings in Dupont borough are $36,426, $50,403 for men and $34,630 for women, a difference of 31.3%.
| Sex | Number | Average Earnings |
| Male | 718 (46.4%) | $50,403 |
| Female | 828 (53.6%) | $34,630 |
| Total | 1,546 (100.0%) | $36,426 |
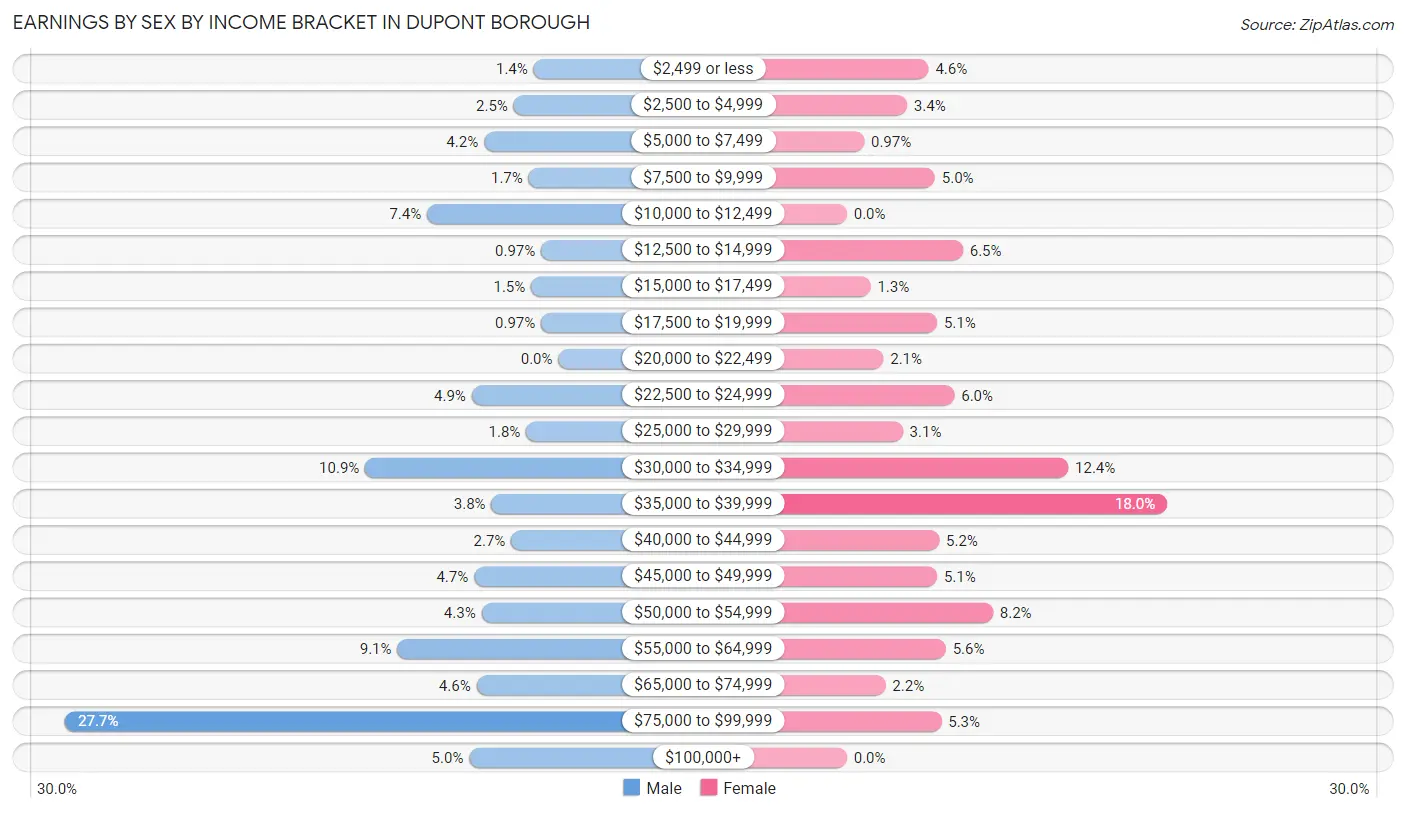
Earnings by Sex by Income Bracket in Dupont borough
The most common earnings brackets in Dupont borough are $75,000 to $99,999 for men (199 | 27.7%) and $35,000 to $39,999 for women (149 | 18.0%).
| Income | Male | Female |
| $2,499 or less | 10 (1.4%) | 38 (4.6%) |
| $2,500 to $4,999 | 18 (2.5%) | 28 (3.4%) |
| $5,000 to $7,499 | 30 (4.2%) | 8 (1.0%) |
| $7,500 to $9,999 | 12 (1.7%) | 41 (5.0%) |
| $10,000 to $12,499 | 53 (7.4%) | 0 (0.0%) |
| $12,500 to $14,999 | 7 (1.0%) | 54 (6.5%) |
| $15,000 to $17,499 | 11 (1.5%) | 11 (1.3%) |
| $17,500 to $19,999 | 7 (1.0%) | 42 (5.1%) |
| $20,000 to $22,499 | 0 (0.0%) | 17 (2.1%) |
| $22,500 to $24,999 | 35 (4.9%) | 50 (6.0%) |
| $25,000 to $29,999 | 13 (1.8%) | 26 (3.1%) |
| $30,000 to $34,999 | 78 (10.9%) | 103 (12.4%) |
| $35,000 to $39,999 | 27 (3.8%) | 149 (18.0%) |
| $40,000 to $44,999 | 19 (2.6%) | 43 (5.2%) |
| $45,000 to $49,999 | 34 (4.7%) | 42 (5.1%) |
| $50,000 to $54,999 | 31 (4.3%) | 68 (8.2%) |
| $55,000 to $64,999 | 65 (9.0%) | 46 (5.6%) |
| $65,000 to $74,999 | 33 (4.6%) | 18 (2.2%) |
| $75,000 to $99,999 | 199 (27.7%) | 44 (5.3%) |
| $100,000+ | 36 (5.0%) | 0 (0.0%) |
| Total | 718 (100.0%) | 828 (100.0%) |
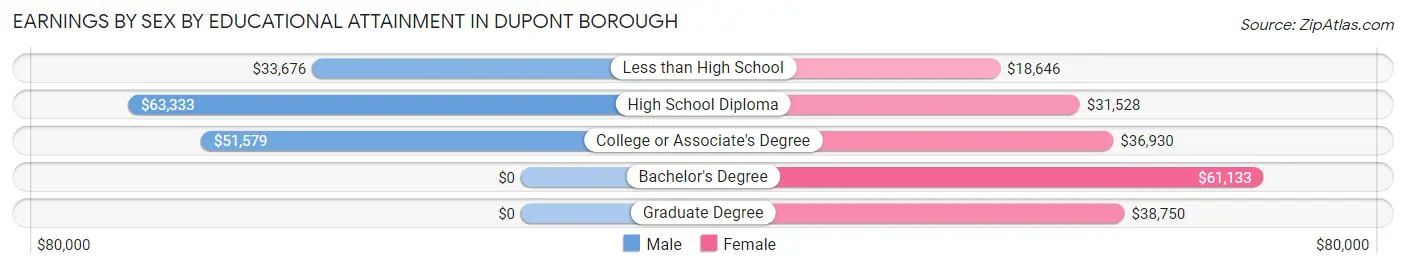
Earnings by Sex by Educational Attainment in Dupont borough
Average earnings in Dupont borough are $51,411 for men and $35,611 for women, a difference of 30.7%. Men with an educational attainment of high school diploma enjoy the highest average annual earnings of $63,333, while those with less than high school education earn the least with $33,676. Women with an educational attainment of bachelor's degree earn the most with the average annual earnings of $61,133, while those with less than high school education have the smallest earnings of $18,646.
| Educational Attainment | Male Income | Female Income |
| Less than High School | $33,676 | $18,646 |
| High School Diploma | $63,333 | $31,528 |
| College or Associate's Degree | $51,579 | $36,930 |
| Bachelor's Degree | - | - |
| Graduate Degree | - | - |
| Total | $51,411 | $35,611 |
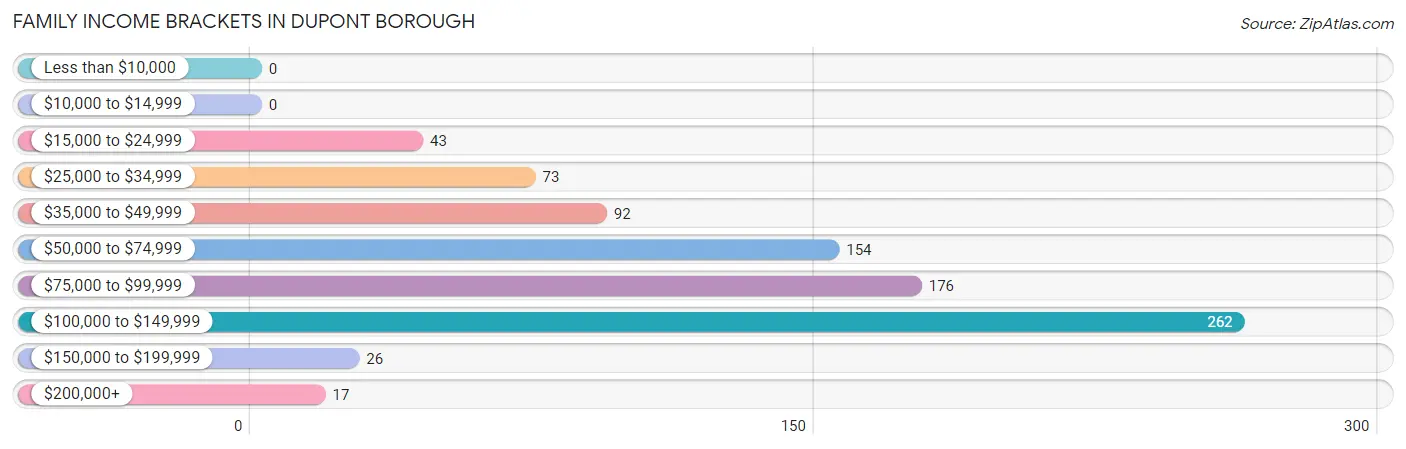
Family Income in Dupont borough
Family Income Brackets in Dupont borough
According to the Dupont borough family income data, there are 262 families falling into the $100,000 to $149,999 income range, which is the most common income bracket and makes up 31.1% of all families.
| Income Bracket | # Families | % Families |
| Less than $10,000 | 0 | 0.0% |
| $10,000 to $14,999 | 0 | 0.0% |
| $15,000 to $24,999 | 43 | 5.1% |
| $25,000 to $34,999 | 73 | 8.7% |
| $35,000 to $49,999 | 92 | 10.9% |
| $50,000 to $74,999 | 154 | 18.3% |
| $75,000 to $99,999 | 176 | 20.9% |
| $100,000 to $149,999 | 262 | 31.1% |
| $150,000 to $199,999 | 26 | 3.1% |
| $200,000+ | 17 | 2.0% |
Family Income by Famaliy Size in Dupont borough
4-person families (118 | 14.0%) account for the highest median family income in Dupont borough with $101,786 per family, while 2-person families (552 | 65.5%) have the highest median income of $30,938 per family member.
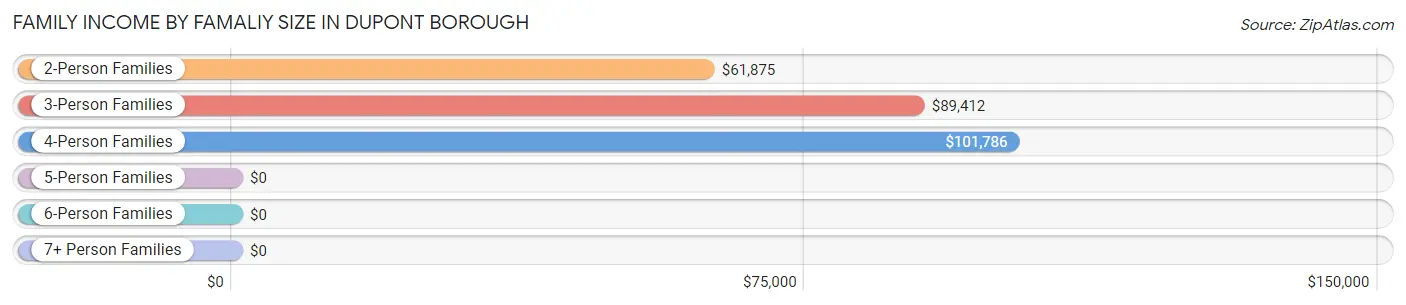
| Income Bracket | # Families | Median Income |
| 2-Person Families | 552 (65.5%) | $61,875 |
| 3-Person Families | 164 (19.5%) | $89,412 |
| 4-Person Families | 118 (14.0%) | $101,786 |
| 5-Person Families | 6 (0.7%) | $0 |
| 6-Person Families | 3 (0.4%) | $0 |
| 7+ Person Families | 0 (0.0%) | $0 |
| Total | 843 (100.0%) | $88,107 |
Family Income by Number of Earners in Dupont borough
The median family income in Dupont borough is $88,107, with families comprising 3+ earners (43) having the highest median family income of $147,361, while families with no earners (88) have the lowest median family income of $47,750, accounting for 5.1% and 10.4% of families, respectively.
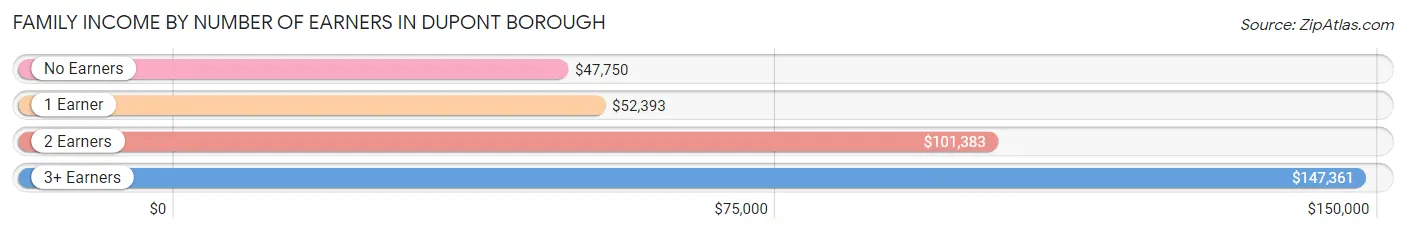
| Number of Earners | # Families | Median Income |
| No Earners | 88 (10.4%) | $47,750 |
| 1 Earner | 299 (35.5%) | $52,393 |
| 2 Earners | 413 (49.0%) | $101,383 |
| 3+ Earners | 43 (5.1%) | $147,361 |
| Total | 843 (100.0%) | $88,107 |
Household Income in Dupont borough
Household Income Brackets in Dupont borough
With 342 households falling in the category, the $100,000 to $149,999 income range is the most frequent in Dupont borough, accounting for 28.6% of all households. In contrast, only 14 households (1.2%) fall into the less than $10,000 income bracket, making it the least populous group.
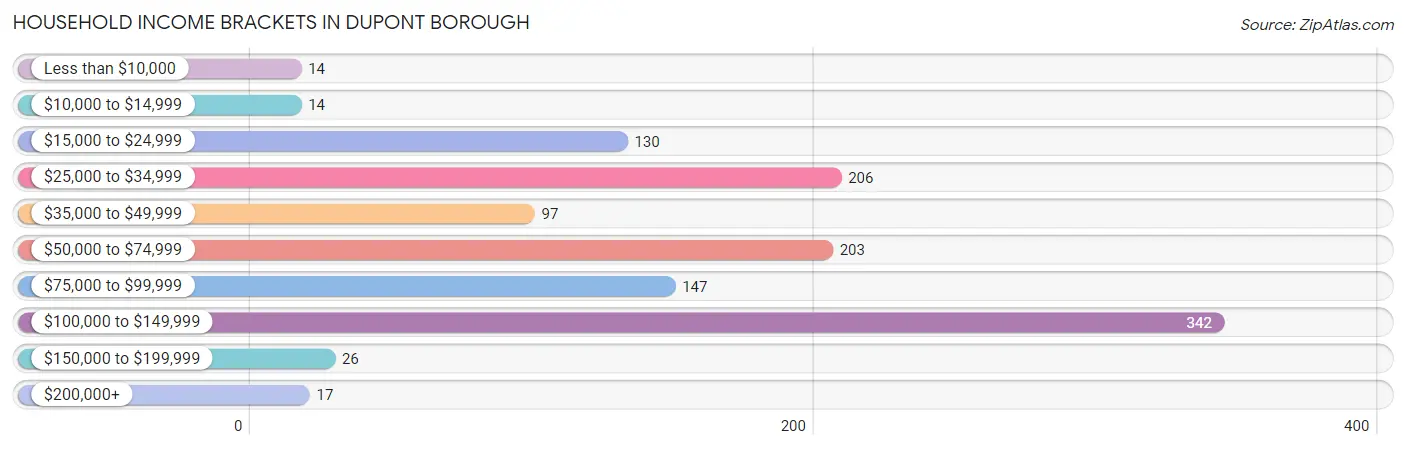
| Income Bracket | # Households | % Households |
| Less than $10,000 | 14 | 1.2% |
| $10,000 to $14,999 | 14 | 1.2% |
| $15,000 to $24,999 | 130 | 10.9% |
| $25,000 to $34,999 | 206 | 17.2% |
| $35,000 to $49,999 | 97 | 8.1% |
| $50,000 to $74,999 | 203 | 17.0% |
| $75,000 to $99,999 | 147 | 12.3% |
| $100,000 to $149,999 | 342 | 28.6% |
| $150,000 to $199,999 | 26 | 2.2% |
| $200,000+ | 17 | 1.4% |
Household Income by Householder Age in Dupont borough
The median household income in Dupont borough is $61,224, with the highest median household income of $81,042 found in the 25 to 44 years age bracket for the primary householder. A total of 286 households (23.9%) fall into this category. Meanwhile, the 15 to 24 years age bracket for the primary householder has the lowest median household income of $0, with 17 households (1.4%) in this group.
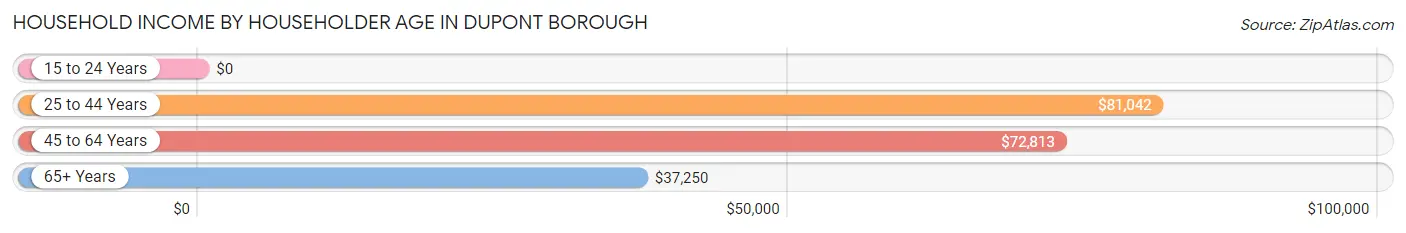
| Income Bracket | # Households | Median Income |
| 15 to 24 Years | 17 (1.4%) | $0 |
| 25 to 44 Years | 286 (23.9%) | $81,042 |
| 45 to 64 Years | 557 (46.6%) | $72,813 |
| 65+ Years | 335 (28.0%) | $37,250 |
| Total | 1,195 (100.0%) | $61,224 |
Poverty in Dupont borough
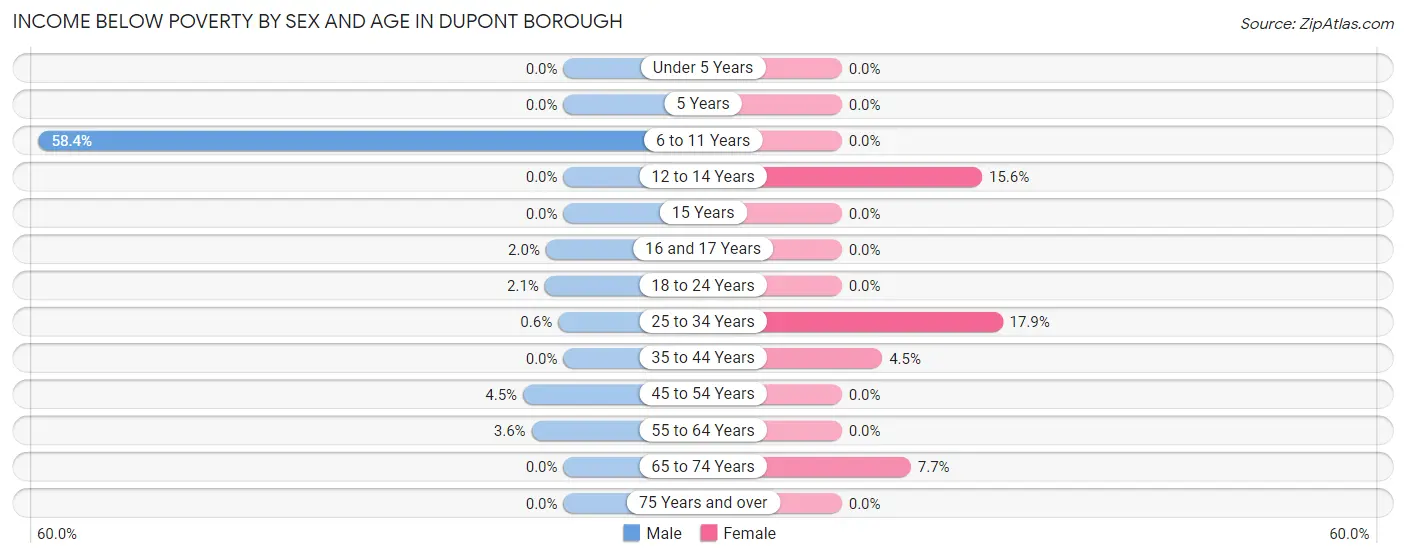
Income Below Poverty by Sex and Age in Dupont borough
With 5.8% poverty level for males and 5.3% for females among the residents of Dupont borough, 6 to 11 year old males and 25 to 34 year old females are the most vulnerable to poverty, with 52 males (58.4%) and 41 females (17.9%) in their respective age groups living below the poverty level.
| Age Bracket | Male | Female |
| Under 5 Years | 0 (0.0%) | 0 (0.0%) |
| 5 Years | 0 (0.0%) | 0 (0.0%) |
| 6 to 11 Years | 52 (58.4%) | 0 (0.0%) |
| 12 to 14 Years | 0 (0.0%) | 10 (15.6%) |
| 15 Years | 0 (0.0%) | 0 (0.0%) |
| 16 and 17 Years | 1 (2.0%) | 0 (0.0%) |
| 18 to 24 Years | 1 (2.1%) | 0 (0.0%) |
| 25 to 34 Years | 1 (0.6%) | 41 (17.9%) |
| 35 to 44 Years | 0 (0.0%) | 5 (4.5%) |
| 45 to 54 Years | 10 (4.5%) | 0 (0.0%) |
| 55 to 64 Years | 6 (3.5%) | 0 (0.0%) |
| 65 to 74 Years | 0 (0.0%) | 14 (7.7%) |
| 75 Years and over | 0 (0.0%) | 0 (0.0%) |
| Total | 71 (5.8%) | 70 (5.3%) |
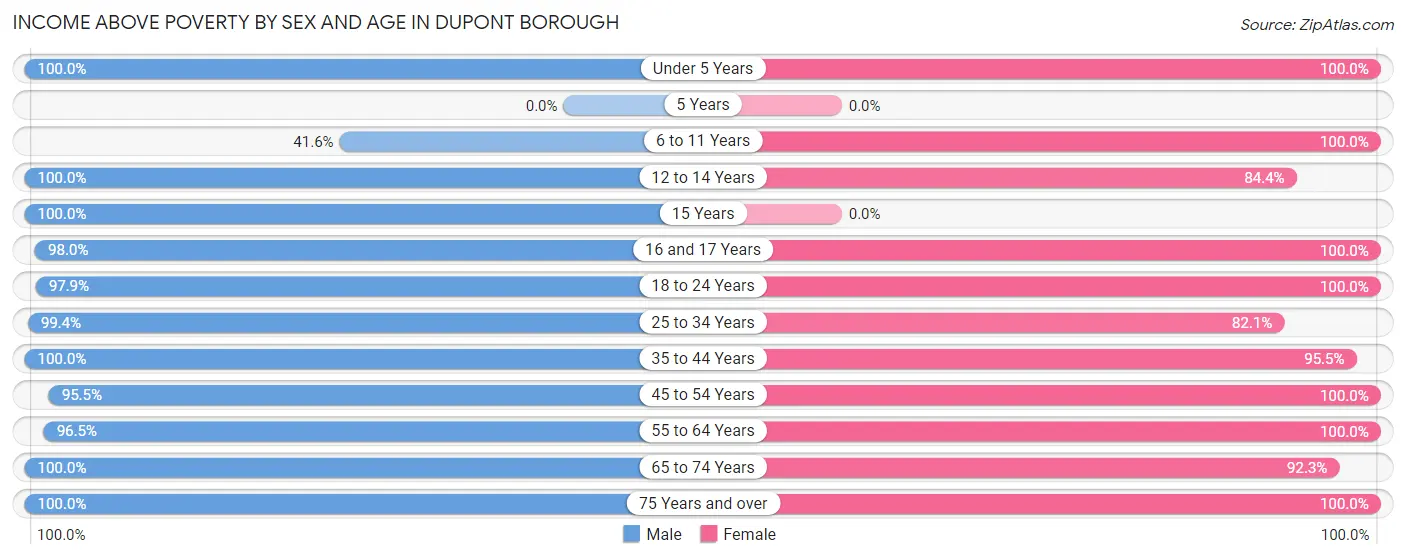
Income Above Poverty by Sex and Age in Dupont borough
According to the poverty statistics in Dupont borough, males aged under 5 years and females aged under 5 years are the age groups that are most secure financially, with 100.0% of males and 100.0% of females in these age groups living above the poverty line.
| Age Bracket | Male | Female |
| Under 5 Years | 7 (100.0%) | 16 (100.0%) |
| 5 Years | 0 (0.0%) | 0 (0.0%) |
| 6 to 11 Years | 37 (41.6%) | 42 (100.0%) |
| 12 to 14 Years | 57 (100.0%) | 54 (84.4%) |
| 15 Years | 3 (100.0%) | 0 (0.0%) |
| 16 and 17 Years | 50 (98.0%) | 38 (100.0%) |
| 18 to 24 Years | 47 (97.9%) | 113 (100.0%) |
| 25 to 34 Years | 166 (99.4%) | 188 (82.1%) |
| 35 to 44 Years | 125 (100.0%) | 106 (95.5%) |
| 45 to 54 Years | 212 (95.5%) | 253 (100.0%) |
| 55 to 64 Years | 163 (96.5%) | 177 (100.0%) |
| 65 to 74 Years | 160 (100.0%) | 168 (92.3%) |
| 75 Years and over | 118 (100.0%) | 103 (100.0%) |
| Total | 1,145 (94.2%) | 1,258 (94.7%) |
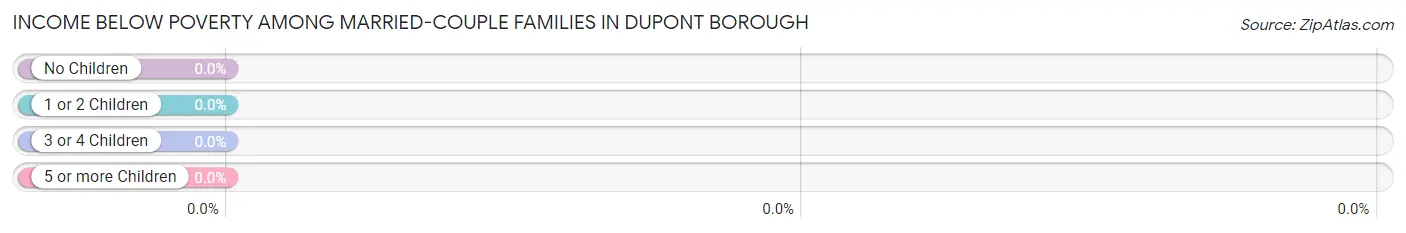
Income Below Poverty Among Married-Couple Families in Dupont borough
| Children | Above Poverty | Below Poverty |
| No Children | 437 (100.0%) | 0 (0.0%) |
| 1 or 2 Children | 89 (100.0%) | 0 (0.0%) |
| 3 or 4 Children | 3 (100.0%) | 0 (0.0%) |
| 5 or more Children | 0 (0.0%) | 0 (0.0%) |
| Total | 529 (100.0%) | 0 (0.0%) |
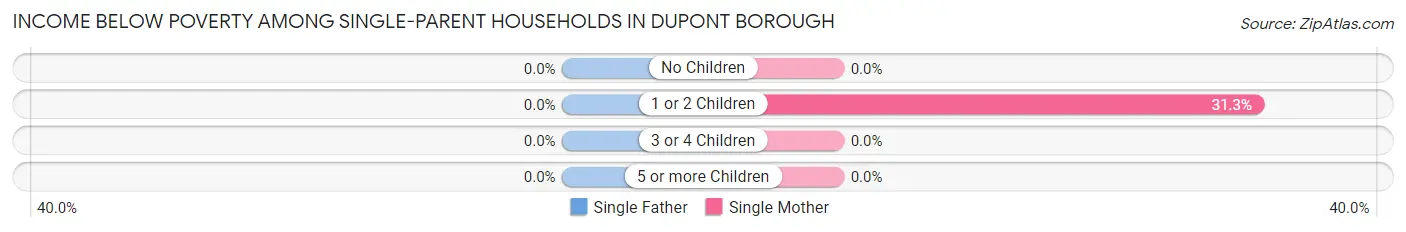
Income Below Poverty Among Single-Parent Households in Dupont borough
| Children | Single Father | Single Mother |
| No Children | 0 (0.0%) | 0 (0.0%) |
| 1 or 2 Children | 0 (0.0%) | 41 (31.3%) |
| 3 or 4 Children | 0 (0.0%) | 0 (0.0%) |
| 5 or more Children | 0 (0.0%) | 0 (0.0%) |
| Total | 0 (0.0%) | 41 (19.5%) |
Income Below Poverty Among Married-Couple vs Single-Parent Households in Dupont borough
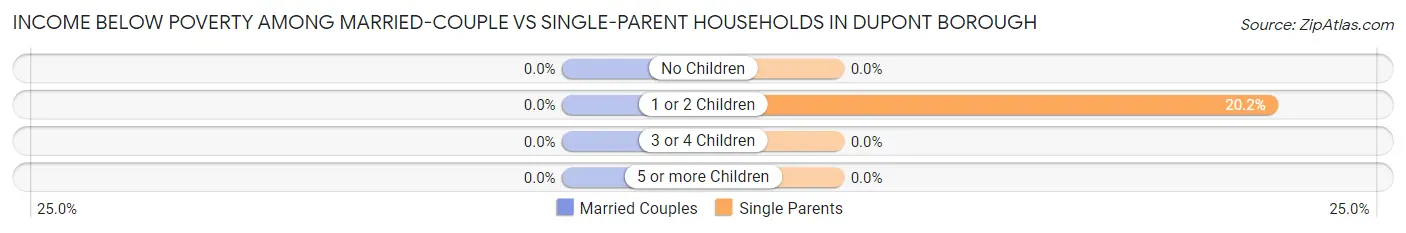
| Children | Married-Couple Families | Single-Parent Households |
| No Children | 0 (0.0%) | 0 (0.0%) |
| 1 or 2 Children | 0 (0.0%) | 41 (20.2%) |
| 3 or 4 Children | 0 (0.0%) | 0 (0.0%) |
| 5 or more Children | 0 (0.0%) | 0 (0.0%) |
| Total | 0 (0.0%) | 41 (13.1%) |
Race in Dupont borough
The most populous races in Dupont borough are White / Caucasian (2,307 | 90.7%), Two or more Races (146 | 5.7%), and Asian (55 | 2.2%).
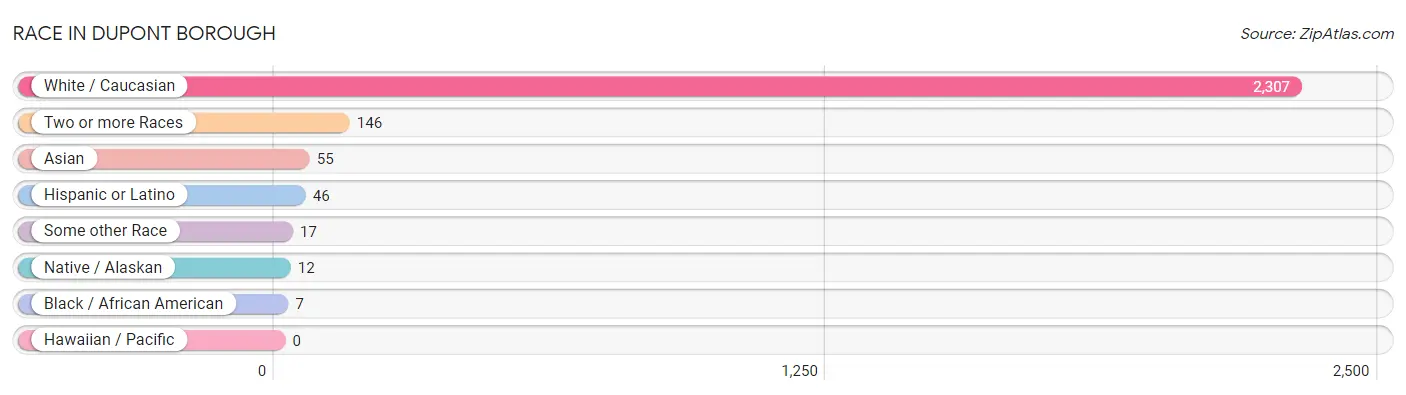
| Race | # Population | % Population |
| Asian | 55 | 2.2% |
| Black / African American | 7 | 0.3% |
| Hawaiian / Pacific | 0 | 0.0% |
| Hispanic or Latino | 46 | 1.8% |
| Native / Alaskan | 12 | 0.5% |
| White / Caucasian | 2,307 | 90.7% |
| Two or more Races | 146 | 5.7% |
| Some other Race | 17 | 0.7% |
| Total | 2,544 | 100.0% |
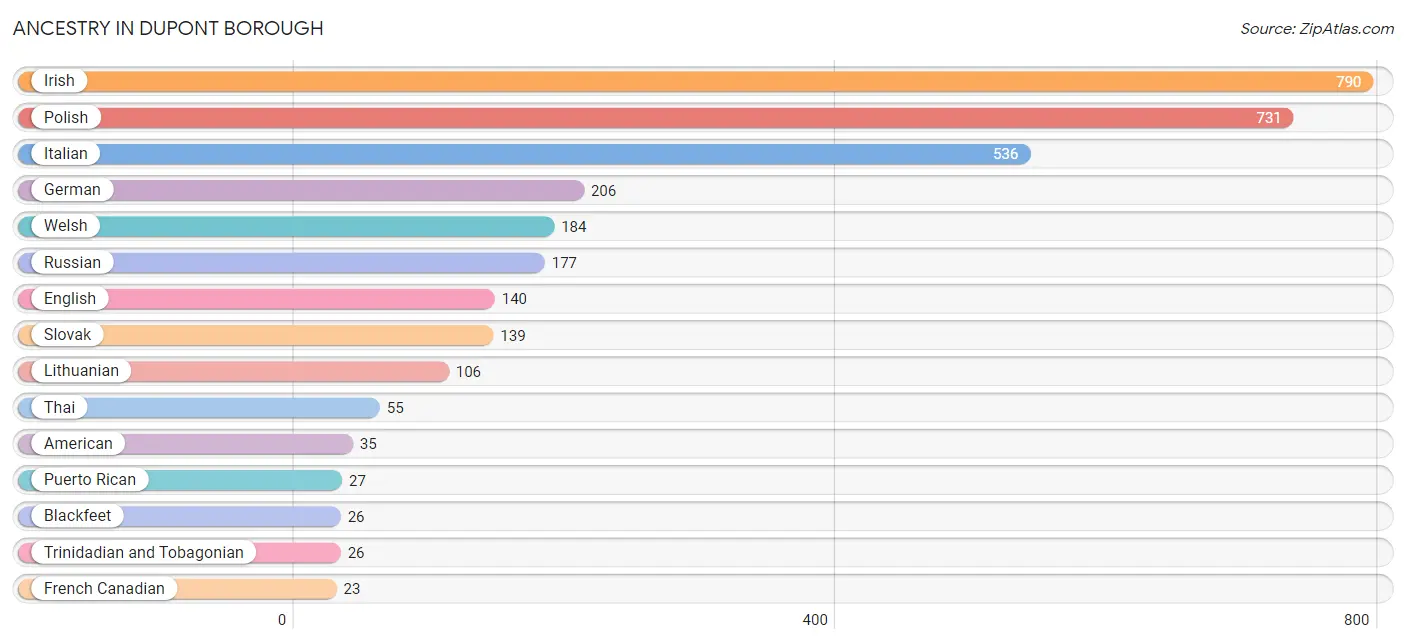
Ancestry in Dupont borough
The most populous ancestries reported in Dupont borough are Irish (790 | 31.0%), Polish (731 | 28.7%), Italian (536 | 21.1%), German (206 | 8.1%), and Welsh (184 | 7.2%), together accounting for 96.2% of all Dupont borough residents.
| Ancestry | # Population | % Population |
| American | 35 | 1.4% |
| Austrian | 14 | 0.5% |
| Blackfeet | 26 | 1.0% |
| Carpatho Rusyn | 9 | 0.4% |
| Central American | 17 | 0.7% |
| Cherokee | 12 | 0.5% |
| Chippewa | 13 | 0.5% |
| Cuban | 2 | 0.1% |
| Dutch | 21 | 0.8% |
| English | 140 | 5.5% |
| French Canadian | 23 | 0.9% |
| German | 206 | 8.1% |
| Haitian | 1 | 0.0% |
| Irish | 790 | 31.0% |
| Italian | 536 | 21.1% |
| Lithuanian | 106 | 4.2% |
| Pennsylvania German | 6 | 0.2% |
| Polish | 731 | 28.7% |
| Portuguese | 2 | 0.1% |
| Puerto Rican | 27 | 1.1% |
| Romanian | 1 | 0.0% |
| Russian | 177 | 7.0% |
| Salvadoran | 17 | 0.7% |
| Scandinavian | 10 | 0.4% |
| Slovak | 139 | 5.5% |
| Thai | 55 | 2.2% |
| Trinidadian and Tobagonian | 26 | 1.0% |
| Ukrainian | 1 | 0.0% |
| Welsh | 184 | 7.2% | View All 29 Rows |
Immigrants in Dupont borough
The most numerous immigrant groups reported in Dupont borough came from Asia (55 | 2.2%), India (55 | 2.2%), South Central Asia (55 | 2.2%), Caribbean (1 | 0.0%), and Haiti (1 | 0.0%), together accounting for 6.6% of all Dupont borough residents.
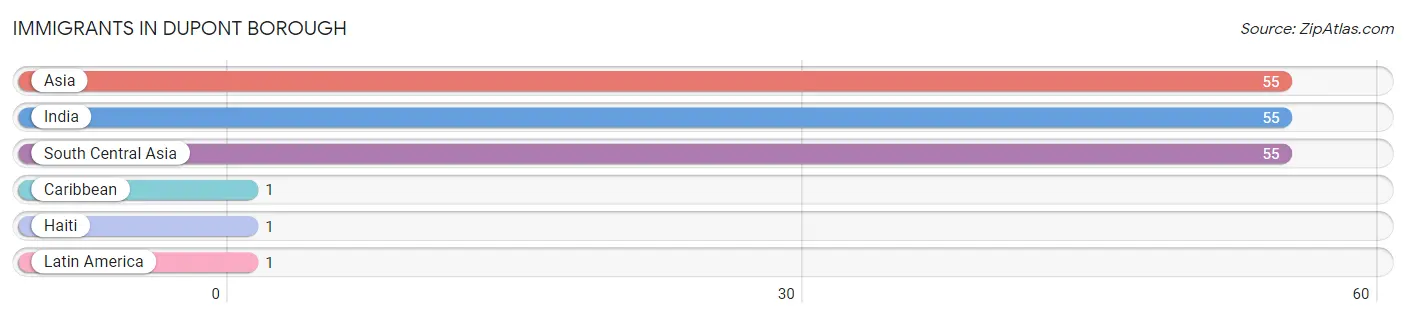
| Immigration Origin | # Population | % Population |
| Asia | 55 | 2.2% |
| Caribbean | 1 | 0.0% |
| Haiti | 1 | 0.0% |
| India | 55 | 2.2% |
| Latin America | 1 | 0.0% |
| South Central Asia | 55 | 2.2% | View All 6 Rows |
Sex and Age in Dupont borough
Sex and Age in Dupont borough
The most populous age groups in Dupont borough are 45 to 49 Years (161 | 13.2%) for men and 45 to 49 Years (161 | 12.1%) for women.
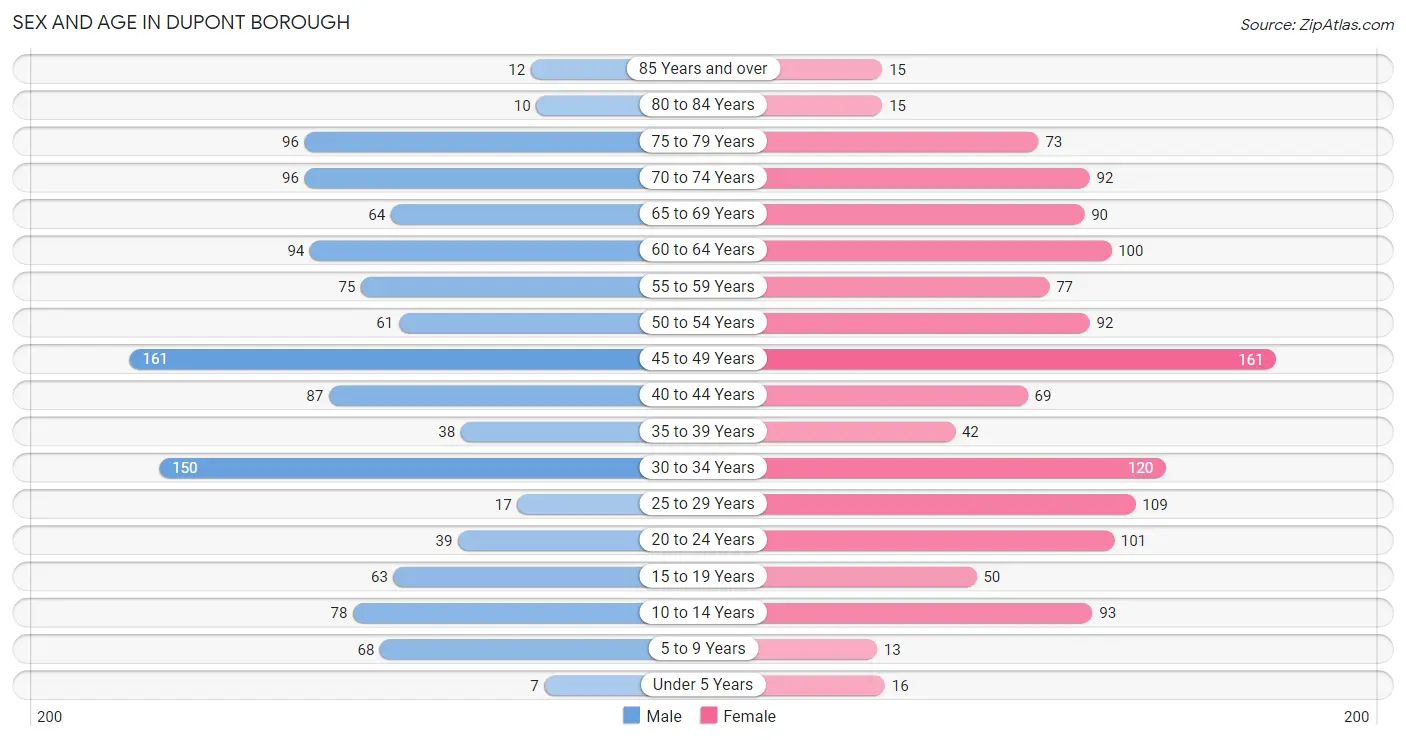
| Age Bracket | Male | Female |
| Under 5 Years | 7 (0.6%) | 16 (1.2%) |
| 5 to 9 Years | 68 (5.6%) | 13 (1.0%) |
| 10 to 14 Years | 78 (6.4%) | 93 (7.0%) |
| 15 to 19 Years | 63 (5.2%) | 50 (3.8%) |
| 20 to 24 Years | 39 (3.2%) | 101 (7.6%) |
| 25 to 29 Years | 17 (1.4%) | 109 (8.2%) |
| 30 to 34 Years | 150 (12.3%) | 120 (9.0%) |
| 35 to 39 Years | 38 (3.1%) | 42 (3.2%) |
| 40 to 44 Years | 87 (7.1%) | 69 (5.2%) |
| 45 to 49 Years | 161 (13.2%) | 161 (12.1%) |
| 50 to 54 Years | 61 (5.0%) | 92 (6.9%) |
| 55 to 59 Years | 75 (6.2%) | 77 (5.8%) |
| 60 to 64 Years | 94 (7.7%) | 100 (7.5%) |
| 65 to 69 Years | 64 (5.3%) | 90 (6.8%) |
| 70 to 74 Years | 96 (7.9%) | 92 (6.9%) |
| 75 to 79 Years | 96 (7.9%) | 73 (5.5%) |
| 80 to 84 Years | 10 (0.8%) | 15 (1.1%) |
| 85 Years and over | 12 (1.0%) | 15 (1.1%) |
| Total | 1,216 (100.0%) | 1,328 (100.0%) |
Families and Households in Dupont borough
Median Family Size in Dupont borough
The median family size in Dupont borough is 2.49 persons per family, with single female/mother families (210 | 24.9%) accounting for the largest median family size of 2.57 persons per family. On the other hand, single male/father families (104 | 12.3%) represent the smallest median family size with 2.06 persons per family.
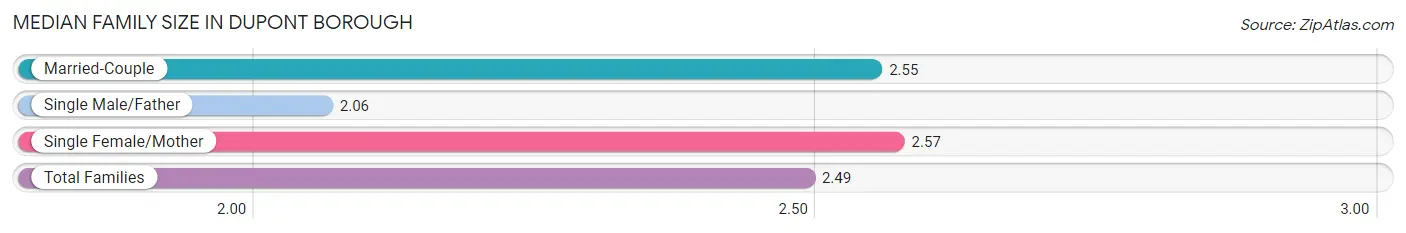
| Family Type | # Families | Family Size |
| Married-Couple | 529 (62.7%) | 2.55 |
| Single Male/Father | 104 (12.3%) | 2.06 |
| Single Female/Mother | 210 (24.9%) | 2.57 |
| Total Families | 843 (100.0%) | 2.49 |
Median Household Size in Dupont borough
The median household size in Dupont borough is 2.12 persons per household, with single female/mother households (210 | 17.6%) accounting for the largest median household size of 2.61 persons per household. non-family households (352 | 29.5%) represent the smallest median household size with 1.03 persons per household.
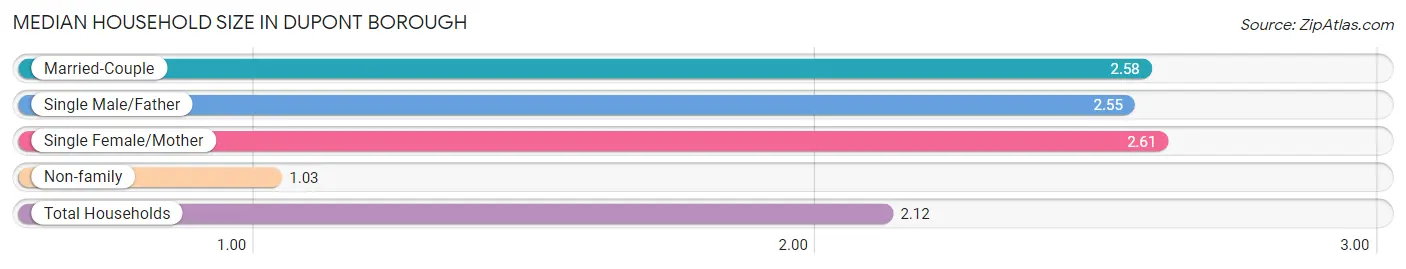
| Household Type | # Households | Household Size |
| Married-Couple | 529 (44.3%) | 2.58 |
| Single Male/Father | 104 (8.7%) | 2.55 |
| Single Female/Mother | 210 (17.6%) | 2.61 |
| Non-family | 352 (29.5%) | 1.03 |
| Total Households | 1,195 (100.0%) | 2.12 |
Household Size by Marriage Status in Dupont borough
Out of a total of 1,195 households in Dupont borough, 843 (70.5%) are family households, while 352 (29.5%) are nonfamily households. The most numerous type of family households are 2-person households, comprising 503, and the most common type of nonfamily households are 1-person households, comprising 342.
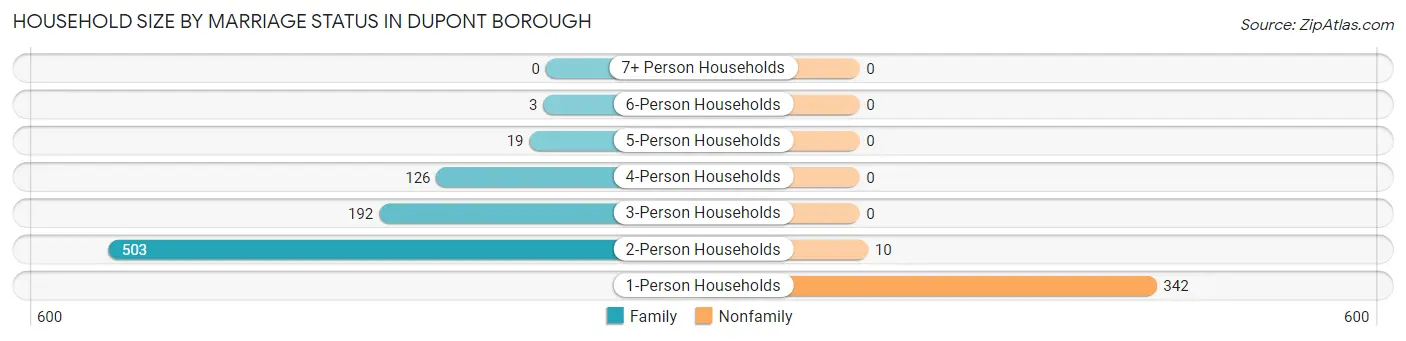
| Household Size | Family Households | Nonfamily Households |
| 1-Person Households | - | 342 (28.6%) |
| 2-Person Households | 503 (42.1%) | 10 (0.8%) |
| 3-Person Households | 192 (16.1%) | 0 (0.0%) |
| 4-Person Households | 126 (10.5%) | 0 (0.0%) |
| 5-Person Households | 19 (1.6%) | 0 (0.0%) |
| 6-Person Households | 3 (0.3%) | 0 (0.0%) |
| 7+ Person Households | 0 (0.0%) | 0 (0.0%) |
| Total | 843 (70.5%) | 352 (29.5%) |
Female Fertility in Dupont borough
Fertility by Age in Dupont borough
| Age Bracket | Women with Births | Births / 1,000 Women |
| 15 to 19 years | 0 (0.0%) | 0.0 |
| 20 to 34 years | 0 (0.0%) | 0.0 |
| 35 to 50 years | 0 (0.0%) | 0.0 |
| Total | 0 (0.0%) | 0.0 |
Fertility by Age by Marriage Status in Dupont borough
| Age Bracket | Married | Unmarried |
| 15 to 19 years | 0 (0.0%) | 0 (0.0%) |
| 20 to 34 years | 0 (0.0%) | 0 (0.0%) |
| 35 to 50 years | 0 (0.0%) | 0 (0.0%) |
| Total | 0 (0.0%) | 0 (0.0%) |
Fertility by Education in Dupont borough
| Educational Attainment | Women with Births | Births / 1,000 Women |
| Less than High School | 0 (0.0%) | 0.0 |
| High School Diploma | 0 (0.0%) | 0.0 |
| College or Associate's Degree | 0 (0.0%) | 0.0 |
| Bachelor's Degree | 0 (0.0%) | 0.0 |
| Graduate Degree | 0 (0.0%) | 0.0 |
| Total | 0 (0.0%) | 0.0 |
Fertility by Education by Marriage Status in Dupont borough
| Educational Attainment | Married | Unmarried |
| Less than High School | 0 (0.0%) | 0 (0.0%) |
| High School Diploma | 0 (0.0%) | 0 (0.0%) |
| College or Associate's Degree | 0 (0.0%) | 0 (0.0%) |
| Bachelor's Degree | 0 (0.0%) | 0 (0.0%) |
| Graduate Degree | 0 (0.0%) | 0 (0.0%) |
| Total | 0 (0.0%) | 0 (0.0%) |
Employment Characteristics in Dupont borough
Employment by Class of Employer in Dupont borough
Among the 1,368 employed individuals in Dupont borough, private company employees (1,059 | 77.4%), not-for-profit organizations (129 | 9.4%), and federal government employees (93 | 6.8%) make up the most common classes of employment.
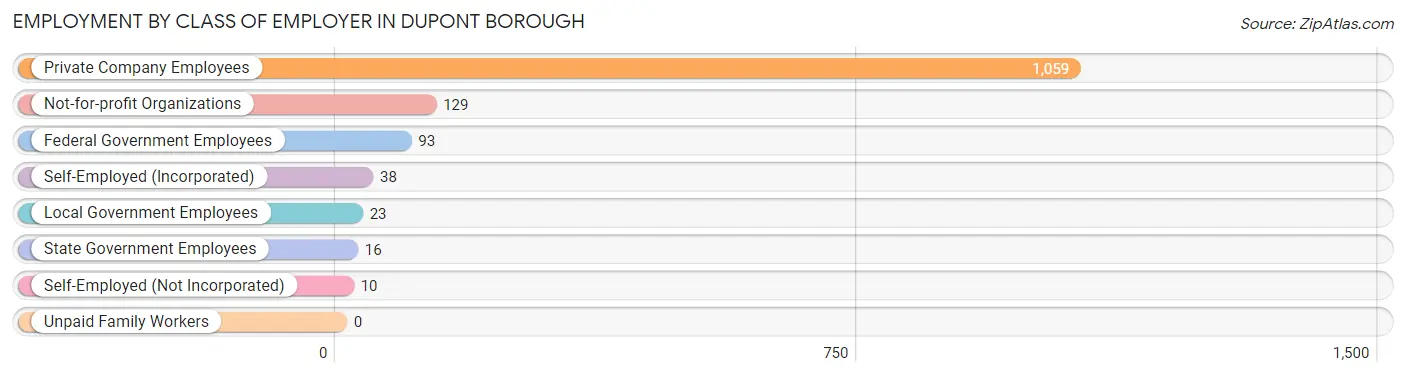
| Employer Class | # Employees | % Employees |
| Private Company Employees | 1,059 | 77.4% |
| Self-Employed (Incorporated) | 38 | 2.8% |
| Self-Employed (Not Incorporated) | 10 | 0.7% |
| Not-for-profit Organizations | 129 | 9.4% |
| Local Government Employees | 23 | 1.7% |
| State Government Employees | 16 | 1.2% |
| Federal Government Employees | 93 | 6.8% |
| Unpaid Family Workers | 0 | 0.0% |
| Total | 1,368 | 100.0% |
Employment Status by Age in Dupont borough
According to the labor force statistics for Dupont borough, out of the total population over 16 years of age (2,266), 67.7% or 1,534 individuals are in the labor force, with 9.7% or 149 of them unemployed. The age group with the highest labor force participation rate is 25 to 29 years, with 100.0% or 126 individuals in the labor force. Within the labor force, the 16 to 19 years age range has the highest percentage of unemployed individuals, with 25.5% or 12 of them being unemployed.
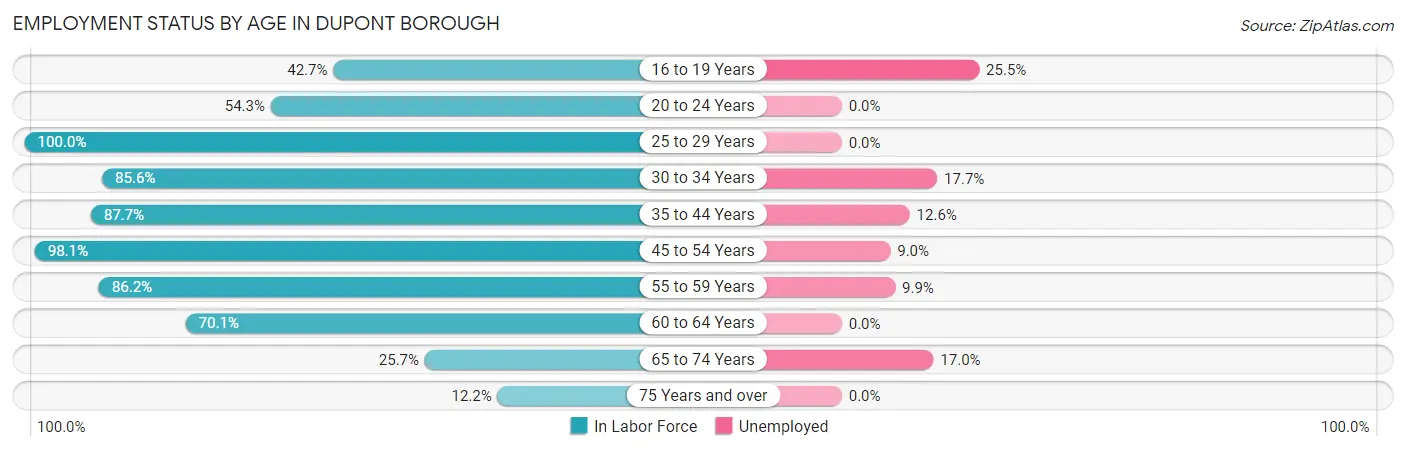
| Age Bracket | In Labor Force | Unemployed |
| 16 to 19 Years | 47 (42.7%) | 12 (25.5%) |
| 20 to 24 Years | 76 (54.3%) | 0 (0.0%) |
| 25 to 29 Years | 126 (100.0%) | 0 (0.0%) |
| 30 to 34 Years | 231 (85.6%) | 41 (17.7%) |
| 35 to 44 Years | 207 (87.7%) | 26 (12.6%) |
| 45 to 54 Years | 466 (98.1%) | 42 (9.0%) |
| 55 to 59 Years | 131 (86.2%) | 13 (9.9%) |
| 60 to 64 Years | 136 (70.1%) | 0 (0.0%) |
| 65 to 74 Years | 88 (25.7%) | 15 (17.0%) |
| 75 Years and over | 27 (12.2%) | 0 (0.0%) |
| Total | 1,534 (67.7%) | 149 (9.7%) |
Employment Status by Educational Attainment in Dupont borough
According to labor force statistics for Dupont borough, 89.3% of individuals (1,298) out of the total population between 25 and 64 years of age (1,453) are in the labor force, with 9.4% or 122 of them being unemployed. The group with the highest labor force participation rate are those with the educational attainment of college / associate degree, with 96.7% or 565 individuals in the labor force. Within the labor force, individuals with bachelor's degree or higher education have the highest percentage of unemployment, with 15.3% or 36 of them being unemployed.
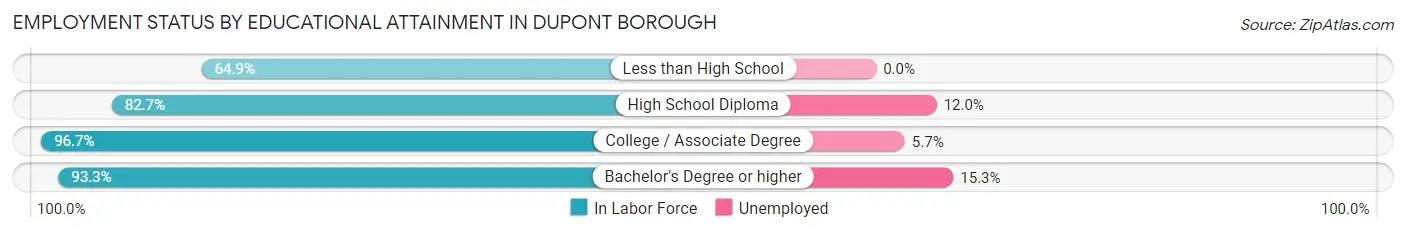
| Educational Attainment | In Labor Force | Unemployed |
| Less than High School | 48 (64.9%) | 0 (0.0%) |
| High School Diploma | 449 (82.7%) | 65 (12.0%) |
| College / Associate Degree | 565 (96.7%) | 33 (5.7%) |
| Bachelor's Degree or higher | 235 (93.3%) | 39 (15.3%) |
| Total | 1,298 (89.3%) | 137 (9.4%) |
Employment Occupations by Sex in Dupont borough
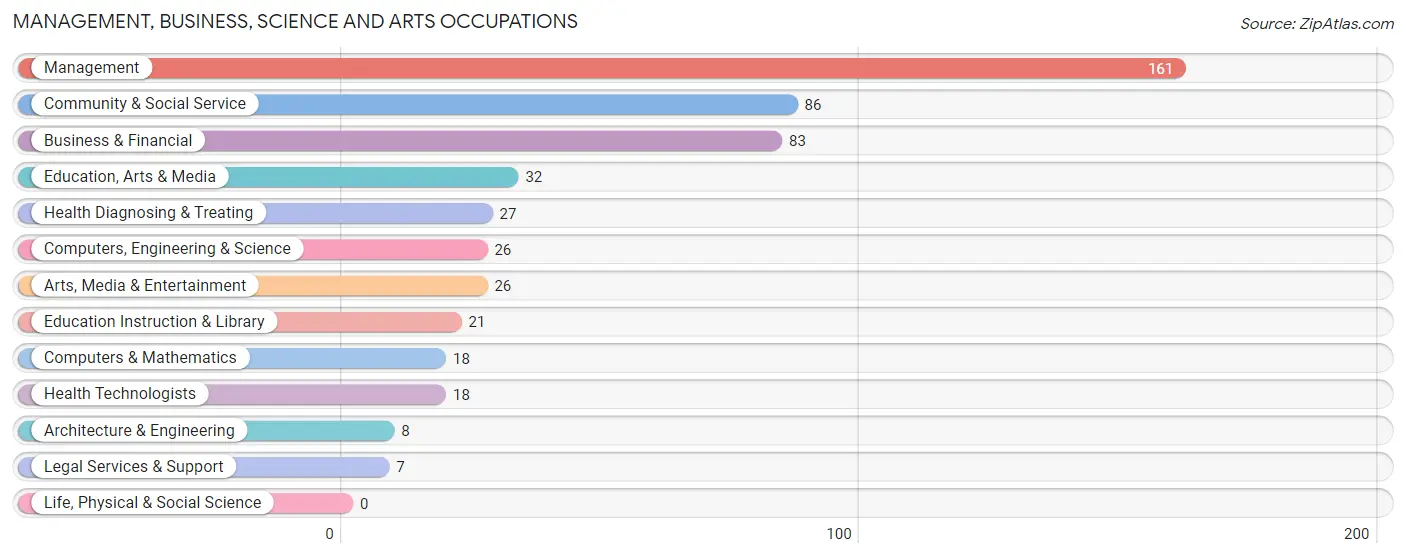
Management, Business, Science and Arts Occupations
The most common Management, Business, Science and Arts occupations in Dupont borough are Management (161 | 11.6%), Community & Social Service (86 | 6.2%), Business & Financial (83 | 6.0%), Education, Arts & Media (32 | 2.3%), and Health Diagnosing & Treating (27 | 1.9%).
Management, Business, Science and Arts Occupations by Sex
Within the Management, Business, Science and Arts occupations in Dupont borough, the most male-oriented occupations are Architecture & Engineering (100.0%), Legal Services & Support (100.0%), and Arts, Media & Entertainment (100.0%), while the most female-oriented occupations are Computers & Mathematics (100.0%), Education Instruction & Library (100.0%), and Health Technologists (100.0%).
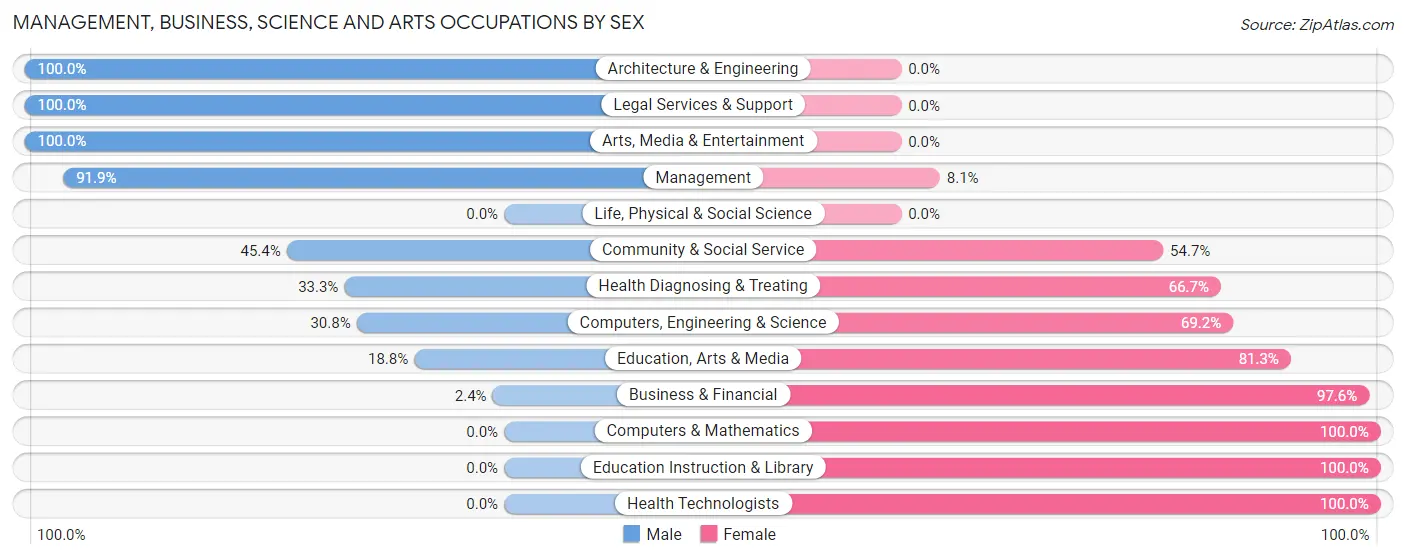
| Occupation | Male | Female |
| Management | 148 (91.9%) | 13 (8.1%) |
| Business & Financial | 2 (2.4%) | 81 (97.6%) |
| Computers, Engineering & Science | 8 (30.8%) | 18 (69.2%) |
| Computers & Mathematics | 0 (0.0%) | 18 (100.0%) |
| Architecture & Engineering | 8 (100.0%) | 0 (0.0%) |
| Life, Physical & Social Science | 0 (0.0%) | 0 (0.0%) |
| Community & Social Service | 39 (45.4%) | 47 (54.6%) |
| Education, Arts & Media | 6 (18.8%) | 26 (81.2%) |
| Legal Services & Support | 7 (100.0%) | 0 (0.0%) |
| Education Instruction & Library | 0 (0.0%) | 21 (100.0%) |
| Arts, Media & Entertainment | 26 (100.0%) | 0 (0.0%) |
| Health Diagnosing & Treating | 9 (33.3%) | 18 (66.7%) |
| Health Technologists | 0 (0.0%) | 18 (100.0%) |
| Total (Category) | 206 (53.8%) | 177 (46.2%) |
| Total (Overall) | 629 (45.4%) | 757 (54.6%) |
Services Occupations
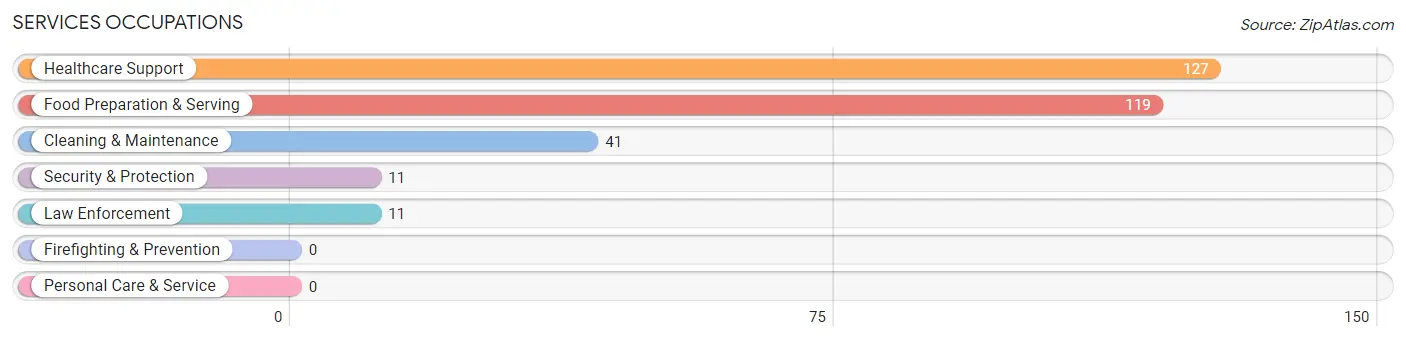
The most common Services occupations in Dupont borough are Healthcare Support (127 | 9.2%), Food Preparation & Serving (119 | 8.6%), Cleaning & Maintenance (41 | 3.0%), Security & Protection (11 | 0.8%), and Law Enforcement (11 | 0.8%).
Services Occupations by Sex
Within the Services occupations in Dupont borough, the most male-oriented occupations are Security & Protection (100.0%), Law Enforcement (100.0%), and Cleaning & Maintenance (53.7%), while the most female-oriented occupations are Healthcare Support (100.0%), Food Preparation & Serving (69.8%), and Cleaning & Maintenance (46.3%).
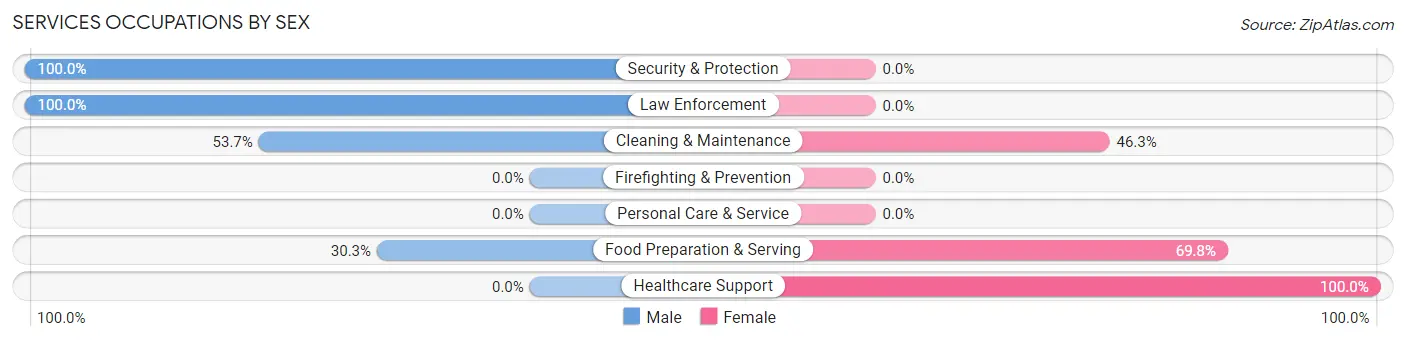
| Occupation | Male | Female |
| Healthcare Support | 0 (0.0%) | 127 (100.0%) |
| Security & Protection | 11 (100.0%) | 0 (0.0%) |
| Firefighting & Prevention | 0 (0.0%) | 0 (0.0%) |
| Law Enforcement | 11 (100.0%) | 0 (0.0%) |
| Food Preparation & Serving | 36 (30.2%) | 83 (69.8%) |
| Cleaning & Maintenance | 22 (53.7%) | 19 (46.3%) |
| Personal Care & Service | 0 (0.0%) | 0 (0.0%) |
| Total (Category) | 69 (23.2%) | 229 (76.8%) |
| Total (Overall) | 629 (45.4%) | 757 (54.6%) |
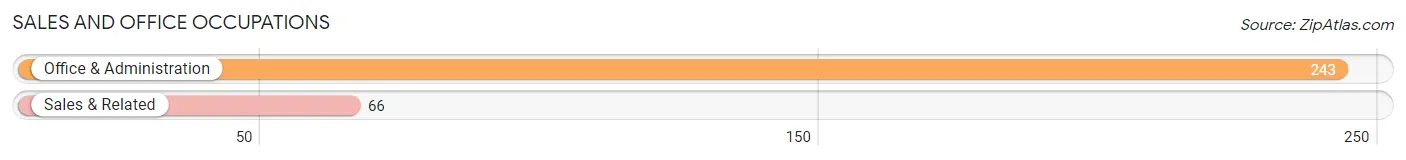
Sales and Office Occupations
The most common Sales and Office occupations in Dupont borough are Office & Administration (243 | 17.5%), and Sales & Related (66 | 4.8%).
Sales and Office Occupations by Sex

| Occupation | Male | Female |
| Sales & Related | 12 (18.2%) | 54 (81.8%) |
| Office & Administration | 108 (44.4%) | 135 (55.6%) |
| Total (Category) | 120 (38.8%) | 189 (61.2%) |
| Total (Overall) | 629 (45.4%) | 757 (54.6%) |
Natural Resources, Construction and Maintenance Occupations
The most common Natural Resources, Construction and Maintenance occupations in Dupont borough are Installation, Maintenance & Repair (28 | 2.0%), and Construction & Extraction (20 | 1.4%).
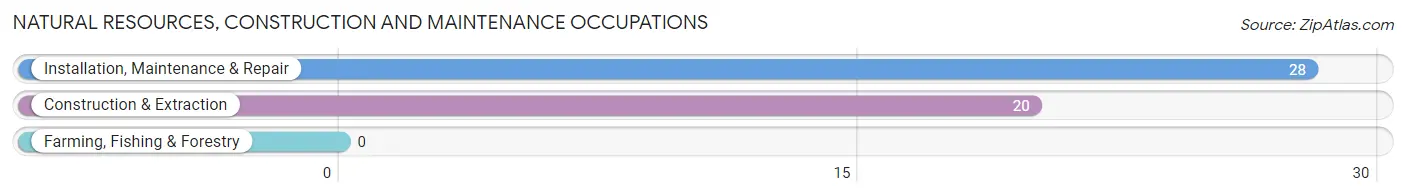
Natural Resources, Construction and Maintenance Occupations by Sex

| Occupation | Male | Female |
| Farming, Fishing & Forestry | 0 (0.0%) | 0 (0.0%) |
| Construction & Extraction | 20 (100.0%) | 0 (0.0%) |
| Installation, Maintenance & Repair | 21 (75.0%) | 7 (25.0%) |
| Total (Category) | 41 (85.4%) | 7 (14.6%) |
| Total (Overall) | 629 (45.4%) | 757 (54.6%) |
Production, Transportation and Moving Occupations
The most common Production, Transportation and Moving occupations in Dupont borough are Transportation (145 | 10.5%), Material Moving (132 | 9.5%), and Production (71 | 5.1%).
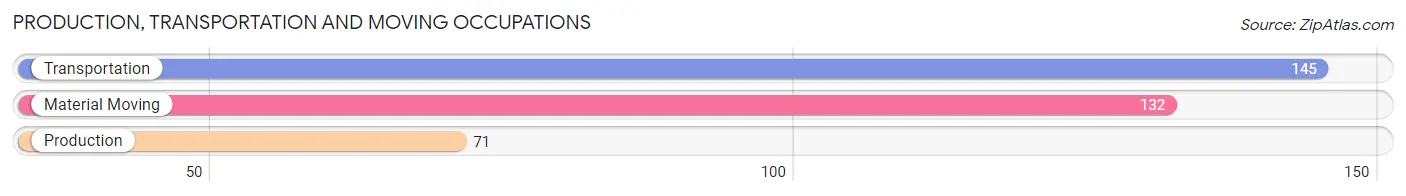
Production, Transportation and Moving Occupations by Sex
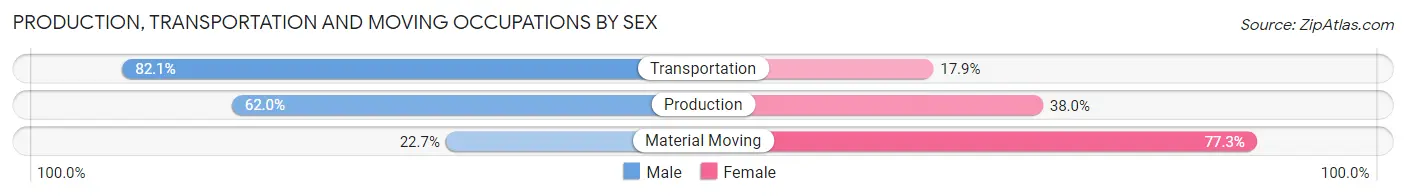
| Occupation | Male | Female |
| Production | 44 (62.0%) | 27 (38.0%) |
| Transportation | 119 (82.1%) | 26 (17.9%) |
| Material Moving | 30 (22.7%) | 102 (77.3%) |
| Total (Category) | 193 (55.5%) | 155 (44.5%) |
| Total (Overall) | 629 (45.4%) | 757 (54.6%) |
Employment Industries by Sex in Dupont borough
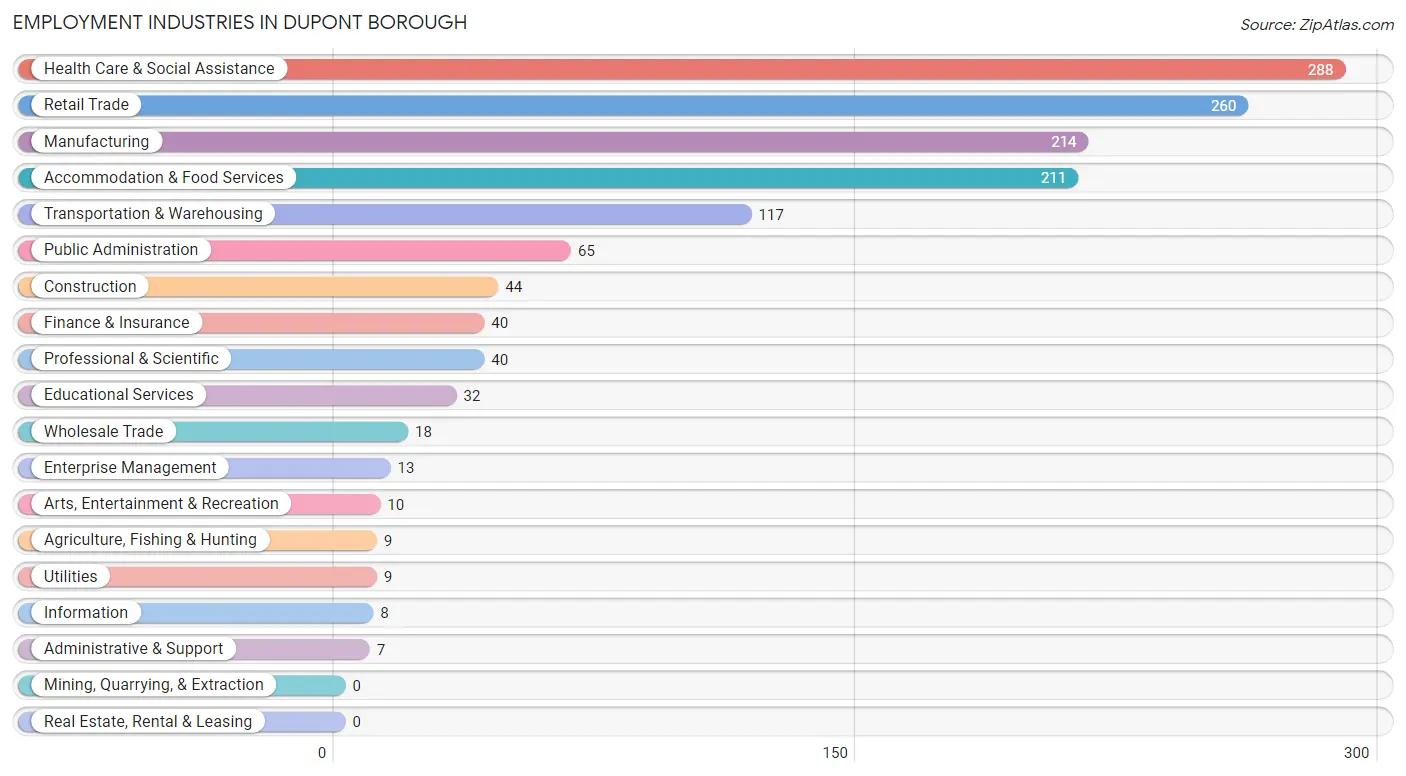
Employment Industries in Dupont borough
The major employment industries in Dupont borough include Health Care & Social Assistance (288 | 20.8%), Retail Trade (260 | 18.8%), Manufacturing (214 | 15.4%), Accommodation & Food Services (211 | 15.2%), and Transportation & Warehousing (117 | 8.4%).
Employment Industries by Sex in Dupont borough
The Dupont borough industries that see more men than women are Construction (100.0%), Wholesale Trade (100.0%), and Utilities (100.0%), whereas the industries that tend to have a higher number of women are Agriculture, Fishing & Hunting (100.0%), Finance & Insurance (100.0%), and Enterprise Management (100.0%).
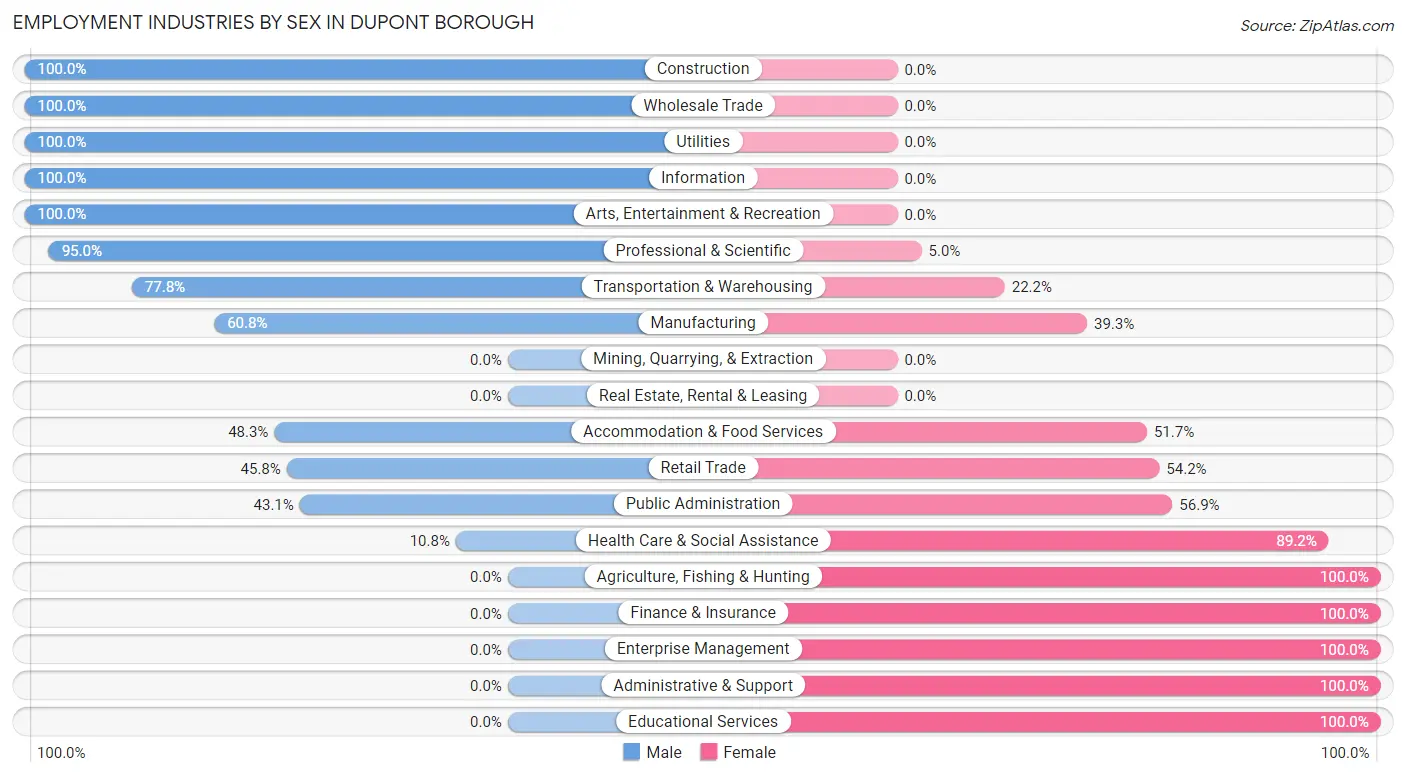
| Industry | Male | Female |
| Agriculture, Fishing & Hunting | 0 (0.0%) | 9 (100.0%) |
| Mining, Quarrying, & Extraction | 0 (0.0%) | 0 (0.0%) |
| Construction | 44 (100.0%) | 0 (0.0%) |
| Manufacturing | 130 (60.8%) | 84 (39.3%) |
| Wholesale Trade | 18 (100.0%) | 0 (0.0%) |
| Retail Trade | 119 (45.8%) | 141 (54.2%) |
| Transportation & Warehousing | 91 (77.8%) | 26 (22.2%) |
| Utilities | 9 (100.0%) | 0 (0.0%) |
| Information | 8 (100.0%) | 0 (0.0%) |
| Finance & Insurance | 0 (0.0%) | 40 (100.0%) |
| Real Estate, Rental & Leasing | 0 (0.0%) | 0 (0.0%) |
| Professional & Scientific | 38 (95.0%) | 2 (5.0%) |
| Enterprise Management | 0 (0.0%) | 13 (100.0%) |
| Administrative & Support | 0 (0.0%) | 7 (100.0%) |
| Educational Services | 0 (0.0%) | 32 (100.0%) |
| Health Care & Social Assistance | 31 (10.8%) | 257 (89.2%) |
| Arts, Entertainment & Recreation | 10 (100.0%) | 0 (0.0%) |
| Accommodation & Food Services | 102 (48.3%) | 109 (51.7%) |
| Public Administration | 28 (43.1%) | 37 (56.9%) |
| Total | 629 (45.4%) | 757 (54.6%) |
Education in Dupont borough
School Enrollment in Dupont borough
The most common levels of schooling among the 401 students in Dupont borough are middle school (161 | 40.2%), high school (109 | 27.2%), and college / undergraduate (76 | 19.0%).
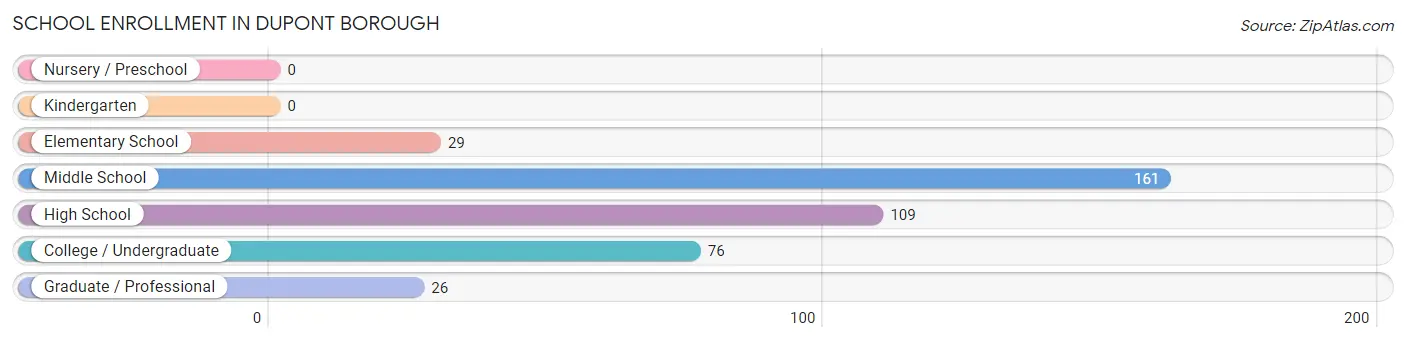
| School Level | # Students | % Students |
| Nursery / Preschool | 0 | 0.0% |
| Kindergarten | 0 | 0.0% |
| Elementary School | 29 | 7.2% |
| Middle School | 161 | 40.2% |
| High School | 109 | 27.2% |
| College / Undergraduate | 76 | 19.0% |
| Graduate / Professional | 26 | 6.5% |
| Total | 401 | 100.0% |
School Enrollment by Age by Funding Source in Dupont borough
Out of a total of 401 students who are enrolled in schools in Dupont borough, 111 (27.7%) attend a private institution, while the remaining 290 (72.3%) are enrolled in public schools. The age group of 20 to 24 year olds has the highest likelihood of being enrolled in private schools, with 46 (92.0% in the age bracket) enrolled. Conversely, the age group of 5 to 9 year old has the lowest likelihood of being enrolled in a private school, with 29 (100.0% in the age bracket) attending a public institution.
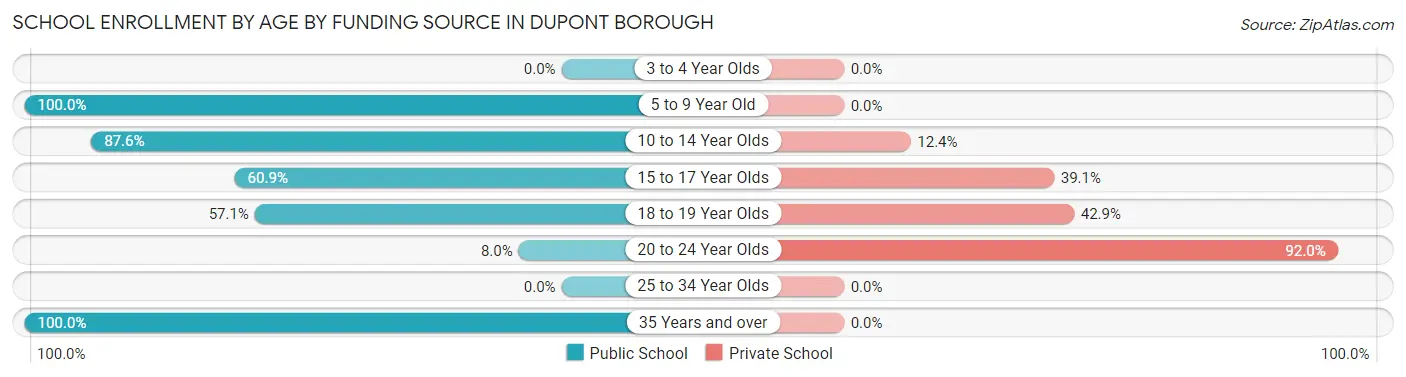
| Age Bracket | Public School | Private School |
| 3 to 4 Year Olds | 0 (0.0%) | 0 (0.0%) |
| 5 to 9 Year Old | 29 (100.0%) | 0 (0.0%) |
| 10 to 14 Year Olds | 141 (87.6%) | 20 (12.4%) |
| 15 to 17 Year Olds | 56 (60.9%) | 36 (39.1%) |
| 18 to 19 Year Olds | 12 (57.1%) | 9 (42.9%) |
| 20 to 24 Year Olds | 4 (8.0%) | 46 (92.0%) |
| 25 to 34 Year Olds | 0 (0.0%) | 0 (0.0%) |
| 35 Years and over | 48 (100.0%) | 0 (0.0%) |
| Total | 290 (72.3%) | 111 (27.7%) |
Educational Attainment by Field of Study in Dupont borough
Business (64 | 17.9%), psychology (46 | 12.9%), education (35 | 9.8%), science & technology (33 | 9.2%), and liberal arts & history (32 | 9.0%) are the most common fields of study among 357 individuals in Dupont borough who have obtained a bachelor's degree or higher.
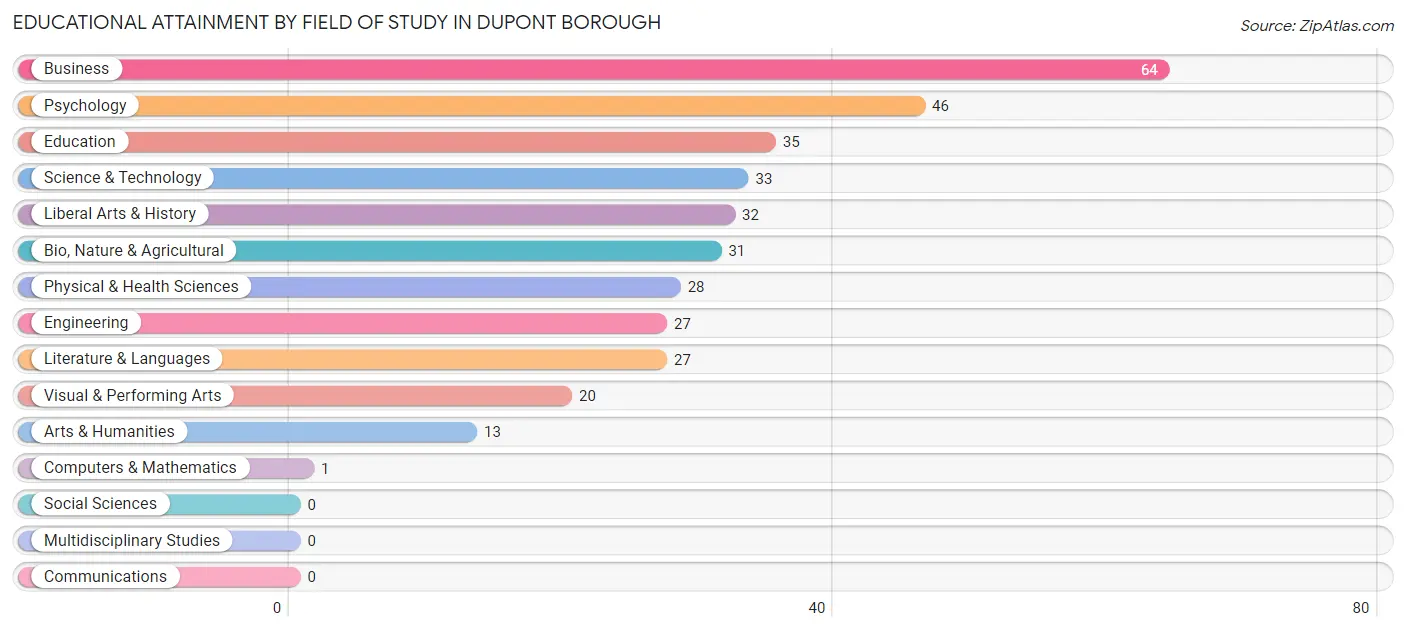
| Field of Study | # Graduates | % Graduates |
| Computers & Mathematics | 1 | 0.3% |
| Bio, Nature & Agricultural | 31 | 8.7% |
| Physical & Health Sciences | 28 | 7.8% |
| Psychology | 46 | 12.9% |
| Social Sciences | 0 | 0.0% |
| Engineering | 27 | 7.6% |
| Multidisciplinary Studies | 0 | 0.0% |
| Science & Technology | 33 | 9.2% |
| Business | 64 | 17.9% |
| Education | 35 | 9.8% |
| Literature & Languages | 27 | 7.6% |
| Liberal Arts & History | 32 | 9.0% |
| Visual & Performing Arts | 20 | 5.6% |
| Communications | 0 | 0.0% |
| Arts & Humanities | 13 | 3.6% |
| Total | 357 | 100.0% |
Transportation & Commute in Dupont borough
Vehicle Availability by Sex in Dupont borough
The most prevalent vehicle ownership categories in Dupont borough are males with 2 vehicles (237, accounting for 38.9%) and females with 2 vehicles (347, making up 31.3%).
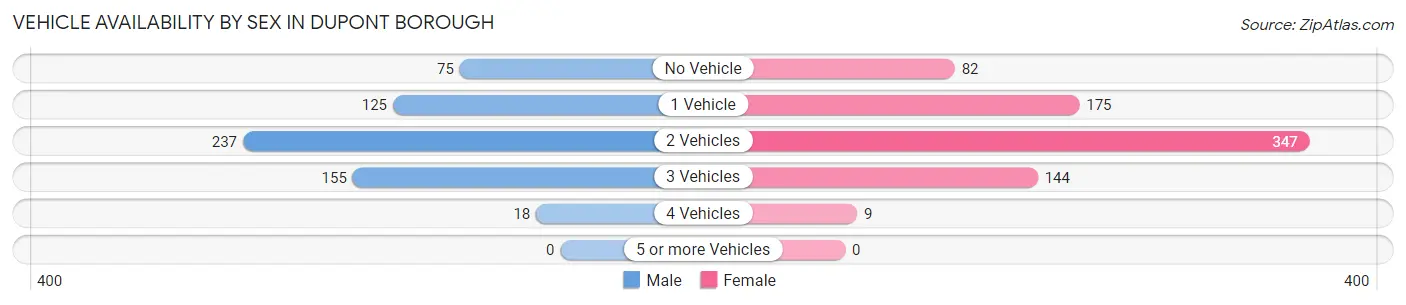
| Vehicles Available | Male | Female |
| No Vehicle | 75 (12.3%) | 82 (10.8%) |
| 1 Vehicle | 125 (20.5%) | 175 (23.1%) |
| 2 Vehicles | 237 (38.9%) | 347 (45.8%) |
| 3 Vehicles | 155 (25.4%) | 144 (19.0%) |
| 4 Vehicles | 18 (2.9%) | 9 (1.2%) |
| 5 or more Vehicles | 0 (0.0%) | 0 (0.0%) |
| Total | 610 (100.0%) | 757 (100.0%) |
Commute Time in Dupont borough
The most frequently occuring commute durations in Dupont borough are 5 to 9 minutes (356 commuters, 27.1%), 15 to 19 minutes (232 commuters, 17.7%), and 20 to 24 minutes (224 commuters, 17.1%).
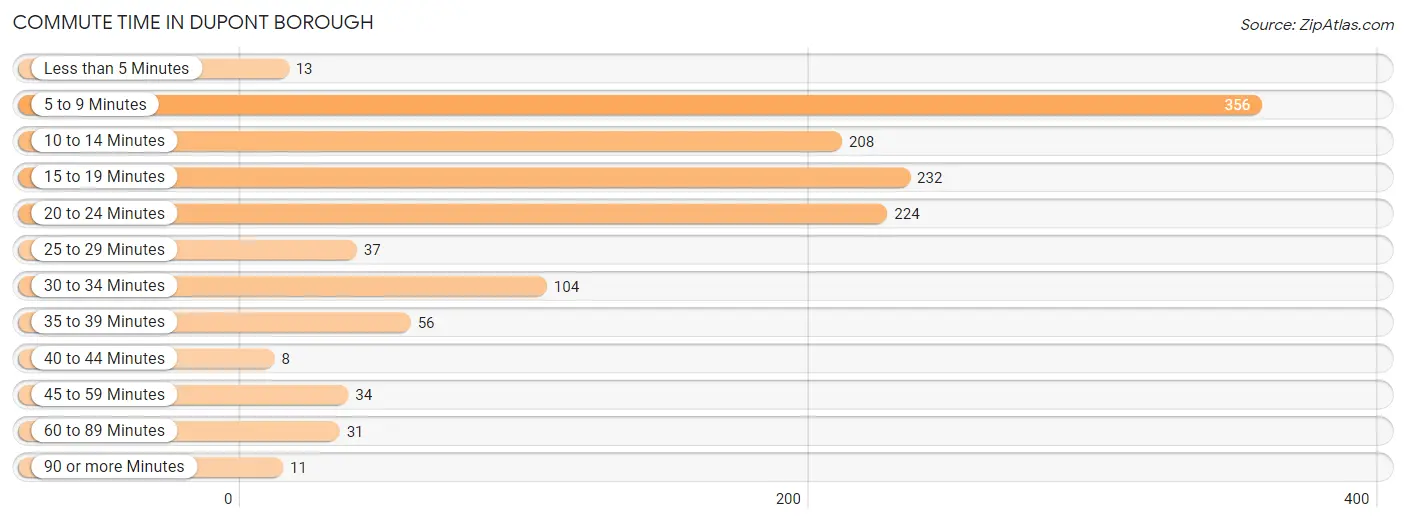
| Commute Time | # Commuters | % Commuters |
| Less than 5 Minutes | 13 | 1.0% |
| 5 to 9 Minutes | 356 | 27.1% |
| 10 to 14 Minutes | 208 | 15.8% |
| 15 to 19 Minutes | 232 | 17.7% |
| 20 to 24 Minutes | 224 | 17.1% |
| 25 to 29 Minutes | 37 | 2.8% |
| 30 to 34 Minutes | 104 | 7.9% |
| 35 to 39 Minutes | 56 | 4.3% |
| 40 to 44 Minutes | 8 | 0.6% |
| 45 to 59 Minutes | 34 | 2.6% |
| 60 to 89 Minutes | 31 | 2.4% |
| 90 or more Minutes | 11 | 0.8% |
Commute Time by Sex in Dupont borough
The most common commute times in Dupont borough are 5 to 9 minutes (189 commuters, 31.7%) for males and 15 to 19 minutes (188 commuters, 26.2%) for females.
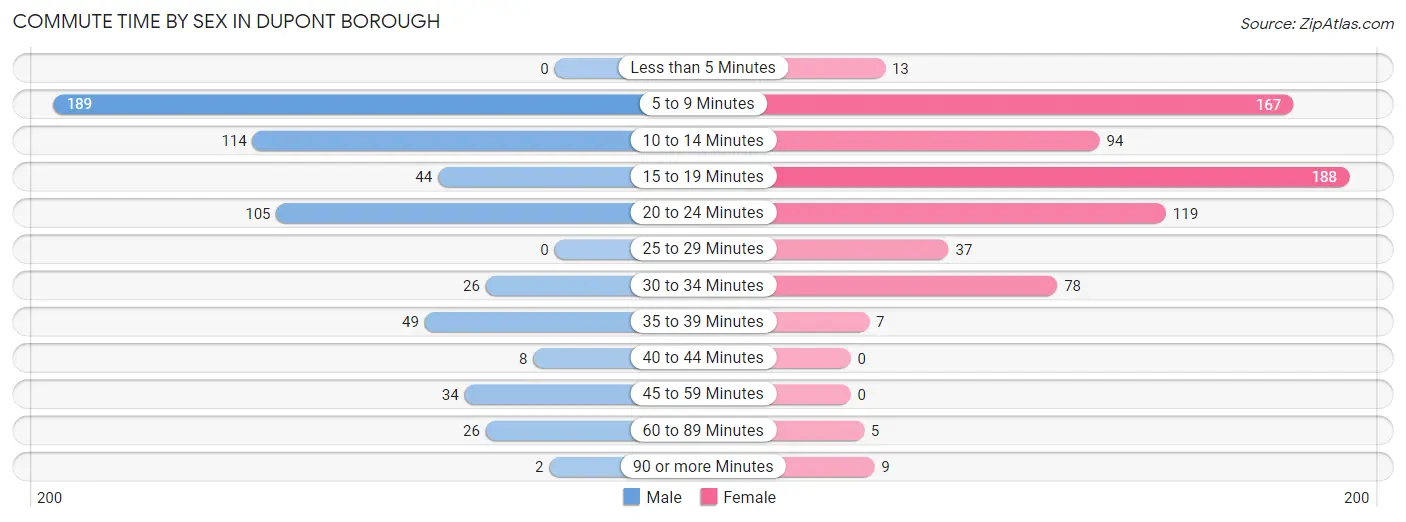
| Commute Time | Male | Female |
| Less than 5 Minutes | 0 (0.0%) | 13 (1.8%) |
| 5 to 9 Minutes | 189 (31.7%) | 167 (23.3%) |
| 10 to 14 Minutes | 114 (19.1%) | 94 (13.1%) |
| 15 to 19 Minutes | 44 (7.4%) | 188 (26.2%) |
| 20 to 24 Minutes | 105 (17.6%) | 119 (16.6%) |
| 25 to 29 Minutes | 0 (0.0%) | 37 (5.2%) |
| 30 to 34 Minutes | 26 (4.4%) | 78 (10.9%) |
| 35 to 39 Minutes | 49 (8.2%) | 7 (1.0%) |
| 40 to 44 Minutes | 8 (1.3%) | 0 (0.0%) |
| 45 to 59 Minutes | 34 (5.7%) | 0 (0.0%) |
| 60 to 89 Minutes | 26 (4.4%) | 5 (0.7%) |
| 90 or more Minutes | 2 (0.3%) | 9 (1.3%) |
Time of Departure to Work by Sex in Dupont borough
The most frequent times of departure to work in Dupont borough are 12:00 PM to 3:59 PM (137, 23.0%) for males and 6:30 AM to 6:59 AM (199, 27.8%) for females.
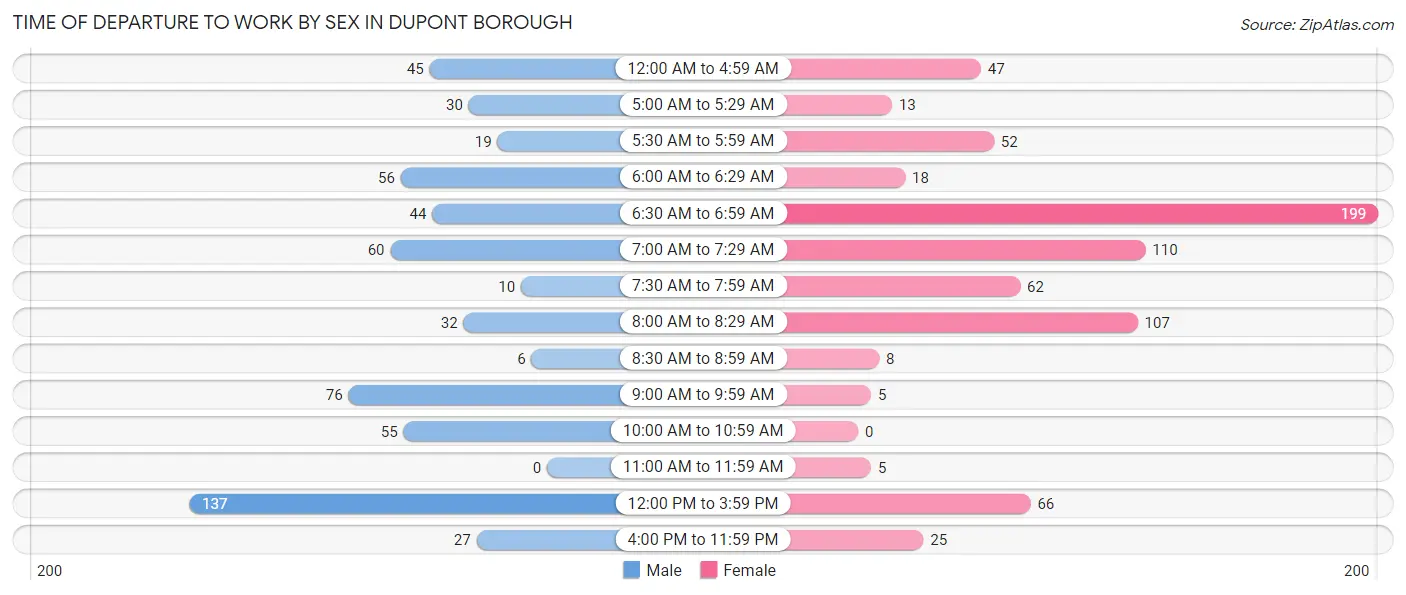
| Time of Departure | Male | Female |
| 12:00 AM to 4:59 AM | 45 (7.5%) | 47 (6.6%) |
| 5:00 AM to 5:29 AM | 30 (5.0%) | 13 (1.8%) |
| 5:30 AM to 5:59 AM | 19 (3.2%) | 52 (7.2%) |
| 6:00 AM to 6:29 AM | 56 (9.4%) | 18 (2.5%) |
| 6:30 AM to 6:59 AM | 44 (7.4%) | 199 (27.8%) |
| 7:00 AM to 7:29 AM | 60 (10.1%) | 110 (15.3%) |
| 7:30 AM to 7:59 AM | 10 (1.7%) | 62 (8.6%) |
| 8:00 AM to 8:29 AM | 32 (5.4%) | 107 (14.9%) |
| 8:30 AM to 8:59 AM | 6 (1.0%) | 8 (1.1%) |
| 9:00 AM to 9:59 AM | 76 (12.7%) | 5 (0.7%) |
| 10:00 AM to 10:59 AM | 55 (9.2%) | 0 (0.0%) |
| 11:00 AM to 11:59 AM | 0 (0.0%) | 5 (0.7%) |
| 12:00 PM to 3:59 PM | 137 (23.0%) | 66 (9.2%) |
| 4:00 PM to 11:59 PM | 27 (4.5%) | 25 (3.5%) |
| Total | 597 (100.0%) | 717 (100.0%) |
Housing Occupancy in Dupont borough
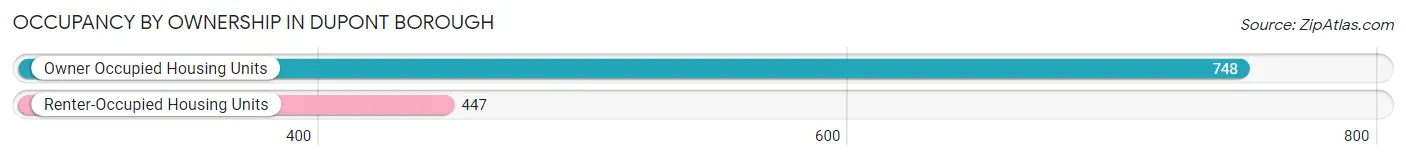
Occupancy by Ownership in Dupont borough
Of the total 1,195 dwellings in Dupont borough, owner-occupied units account for 748 (62.6%), while renter-occupied units make up 447 (37.4%).
| Occupancy | # Housing Units | % Housing Units |
| Owner Occupied Housing Units | 748 | 62.6% |
| Renter-Occupied Housing Units | 447 | 37.4% |
| Total Occupied Housing Units | 1,195 | 100.0% |
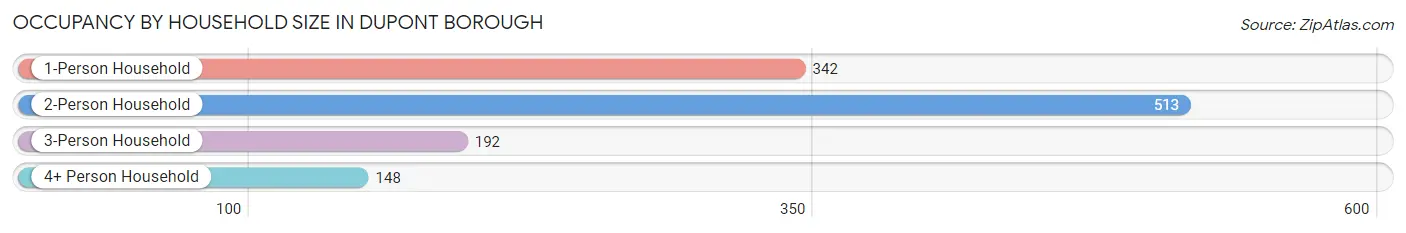
Occupancy by Household Size in Dupont borough
| Household Size | # Housing Units | % Housing Units |
| 1-Person Household | 342 | 28.6% |
| 2-Person Household | 513 | 42.9% |
| 3-Person Household | 192 | 16.1% |
| 4+ Person Household | 148 | 12.4% |
| Total Housing Units | 1,195 | 100.0% |
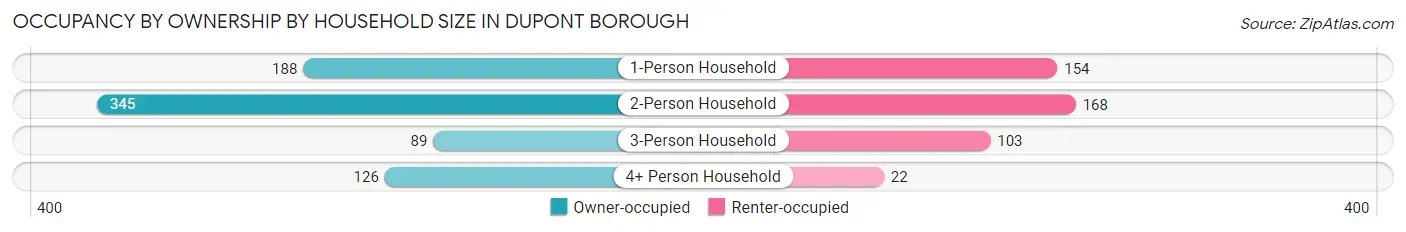
Occupancy by Ownership by Household Size in Dupont borough
| Household Size | Owner-occupied | Renter-occupied |
| 1-Person Household | 188 (55.0%) | 154 (45.0%) |
| 2-Person Household | 345 (67.2%) | 168 (32.8%) |
| 3-Person Household | 89 (46.4%) | 103 (53.6%) |
| 4+ Person Household | 126 (85.1%) | 22 (14.9%) |
| Total Housing Units | 748 (62.6%) | 447 (37.4%) |
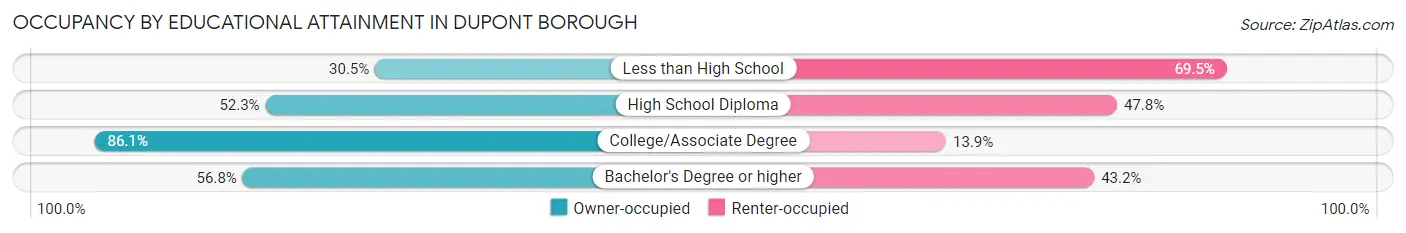
Occupancy by Educational Attainment in Dupont borough
| Household Size | Owner-occupied | Renter-occupied |
| Less than High School | 18 (30.5%) | 41 (69.5%) |
| High School Diploma | 313 (52.2%) | 286 (47.7%) |
| College/Associate Degree | 329 (86.1%) | 53 (13.9%) |
| Bachelor's Degree or higher | 88 (56.8%) | 67 (43.2%) |
Occupancy by Age of Householder in Dupont borough
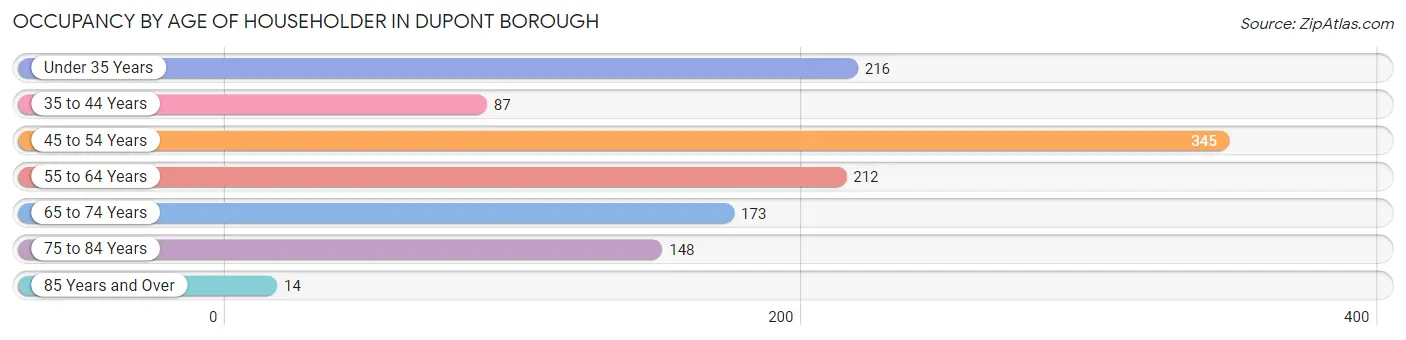
| Age Bracket | # Households | % Households |
| Under 35 Years | 216 | 18.1% |
| 35 to 44 Years | 87 | 7.3% |
| 45 to 54 Years | 345 | 28.9% |
| 55 to 64 Years | 212 | 17.7% |
| 65 to 74 Years | 173 | 14.5% |
| 75 to 84 Years | 148 | 12.4% |
| 85 Years and Over | 14 | 1.2% |
| Total | 1,195 | 100.0% |
Housing Finances in Dupont borough
Median Income by Occupancy in Dupont borough
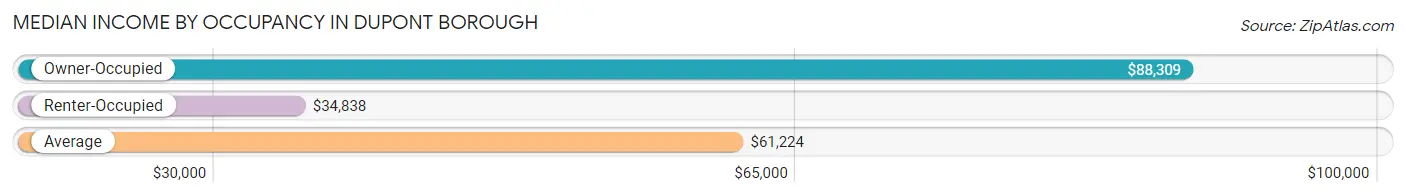
| Occupancy Type | # Households | Median Income |
| Owner-Occupied | 748 (62.6%) | $88,309 |
| Renter-Occupied | 447 (37.4%) | $34,838 |
| Average | 1,195 (100.0%) | $61,224 |
Occupancy by Householder Income Bracket in Dupont borough
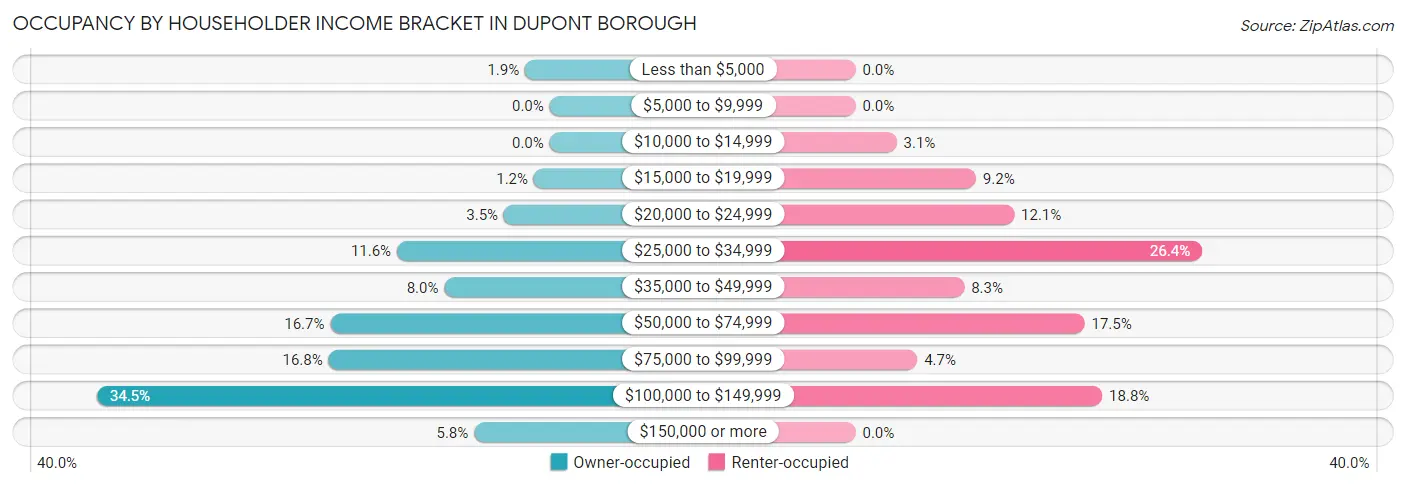
| Income Bracket | Owner-occupied | Renter-occupied |
| Less than $5,000 | 14 (1.9%) | 0 (0.0%) |
| $5,000 to $9,999 | 0 (0.0%) | 0 (0.0%) |
| $10,000 to $14,999 | 0 (0.0%) | 14 (3.1%) |
| $15,000 to $19,999 | 9 (1.2%) | 41 (9.2%) |
| $20,000 to $24,999 | 26 (3.5%) | 54 (12.1%) |
| $25,000 to $34,999 | 87 (11.6%) | 118 (26.4%) |
| $35,000 to $49,999 | 60 (8.0%) | 37 (8.3%) |
| $50,000 to $74,999 | 125 (16.7%) | 78 (17.4%) |
| $75,000 to $99,999 | 126 (16.8%) | 21 (4.7%) |
| $100,000 to $149,999 | 258 (34.5%) | 84 (18.8%) |
| $150,000 or more | 43 (5.8%) | 0 (0.0%) |
| Total | 748 (100.0%) | 447 (100.0%) |
Monthly Housing Cost Tiers in Dupont borough
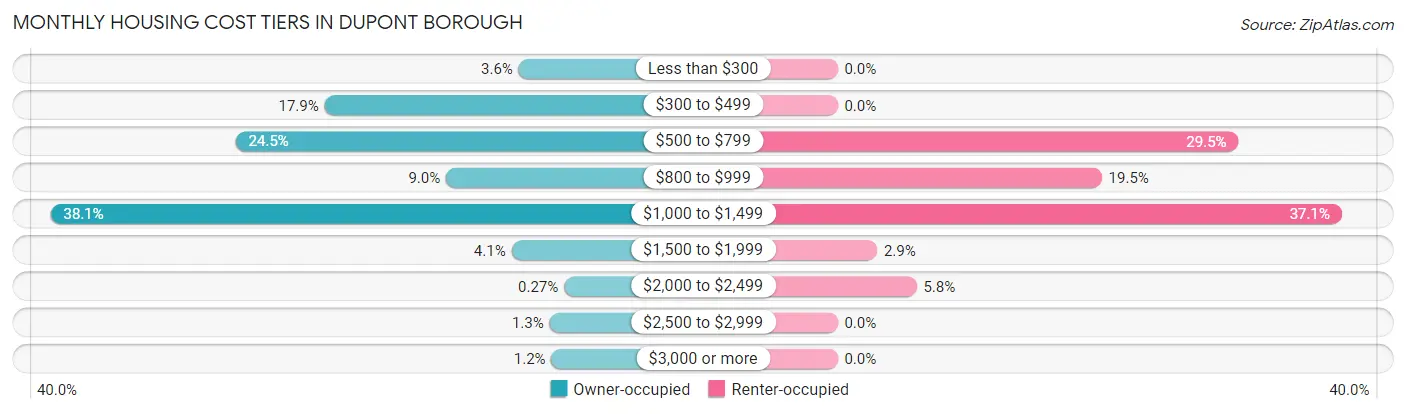
| Monthly Cost | Owner-occupied | Renter-occupied |
| Less than $300 | 27 (3.6%) | 0 (0.0%) |
| $300 to $499 | 134 (17.9%) | 0 (0.0%) |
| $500 to $799 | 183 (24.5%) | 132 (29.5%) |
| $800 to $999 | 67 (9.0%) | 87 (19.5%) |
| $1,000 to $1,499 | 285 (38.1%) | 166 (37.1%) |
| $1,500 to $1,999 | 31 (4.1%) | 13 (2.9%) |
| $2,000 to $2,499 | 2 (0.3%) | 26 (5.8%) |
| $2,500 to $2,999 | 10 (1.3%) | 0 (0.0%) |
| $3,000 or more | 9 (1.2%) | 0 (0.0%) |
| Total | 748 (100.0%) | 447 (100.0%) |
Physical Housing Characteristics in Dupont borough
Housing Structures in Dupont borough
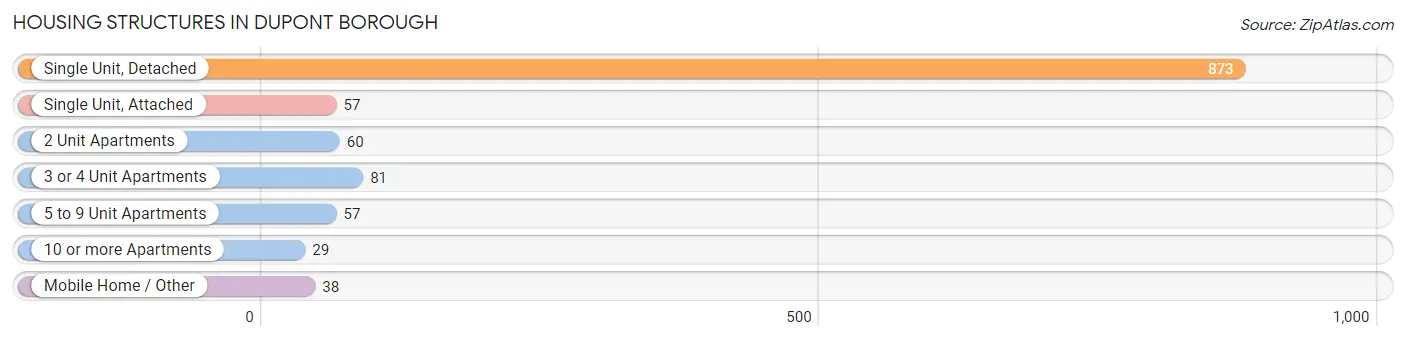
| Structure Type | # Housing Units | % Housing Units |
| Single Unit, Detached | 873 | 73.1% |
| Single Unit, Attached | 57 | 4.8% |
| 2 Unit Apartments | 60 | 5.0% |
| 3 or 4 Unit Apartments | 81 | 6.8% |
| 5 to 9 Unit Apartments | 57 | 4.8% |
| 10 or more Apartments | 29 | 2.4% |
| Mobile Home / Other | 38 | 3.2% |
| Total | 1,195 | 100.0% |
Housing Structures by Occupancy in Dupont borough
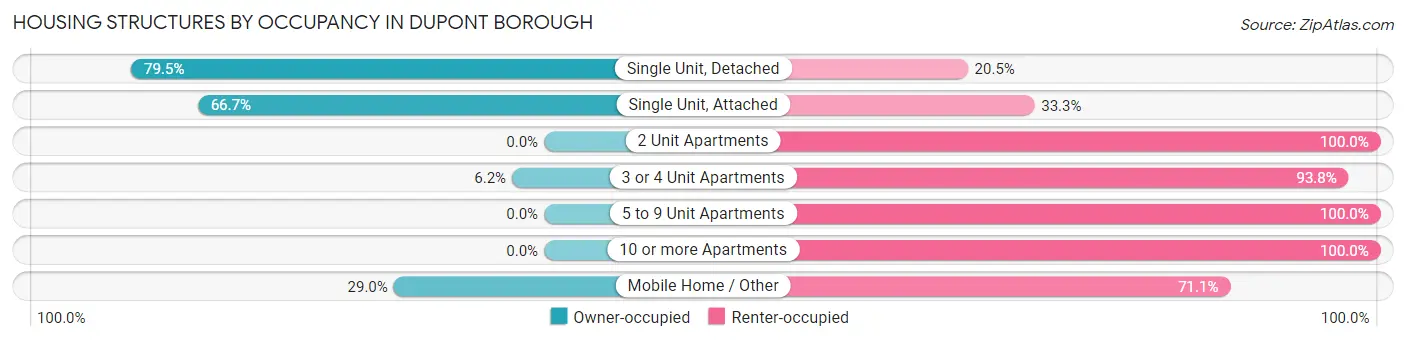
| Structure Type | Owner-occupied | Renter-occupied |
| Single Unit, Detached | 694 (79.5%) | 179 (20.5%) |
| Single Unit, Attached | 38 (66.7%) | 19 (33.3%) |
| 2 Unit Apartments | 0 (0.0%) | 60 (100.0%) |
| 3 or 4 Unit Apartments | 5 (6.2%) | 76 (93.8%) |
| 5 to 9 Unit Apartments | 0 (0.0%) | 57 (100.0%) |
| 10 or more Apartments | 0 (0.0%) | 29 (100.0%) |
| Mobile Home / Other | 11 (28.9%) | 27 (71.1%) |
| Total | 748 (62.6%) | 447 (37.4%) |
Housing Structures by Number of Rooms in Dupont borough
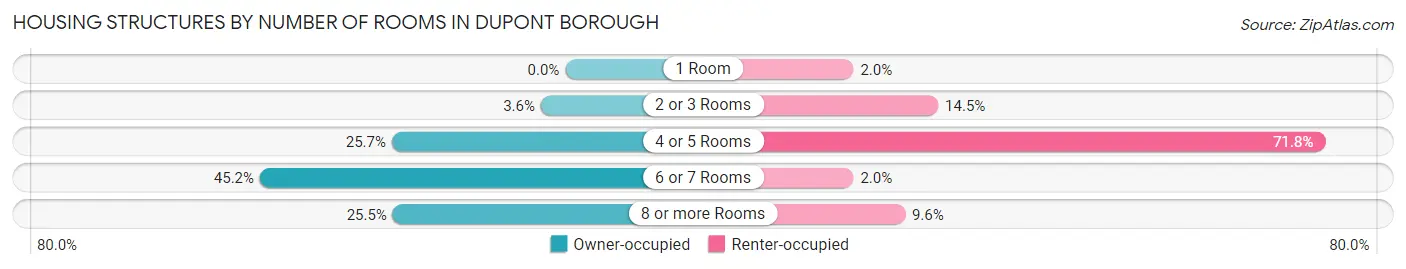
| Number of Rooms | Owner-occupied | Renter-occupied |
| 1 Room | 0 (0.0%) | 9 (2.0%) |
| 2 or 3 Rooms | 27 (3.6%) | 65 (14.5%) |
| 4 or 5 Rooms | 192 (25.7%) | 321 (71.8%) |
| 6 or 7 Rooms | 338 (45.2%) | 9 (2.0%) |
| 8 or more Rooms | 191 (25.5%) | 43 (9.6%) |
| Total | 748 (100.0%) | 447 (100.0%) |
Housing Structure by Heating Type in Dupont borough
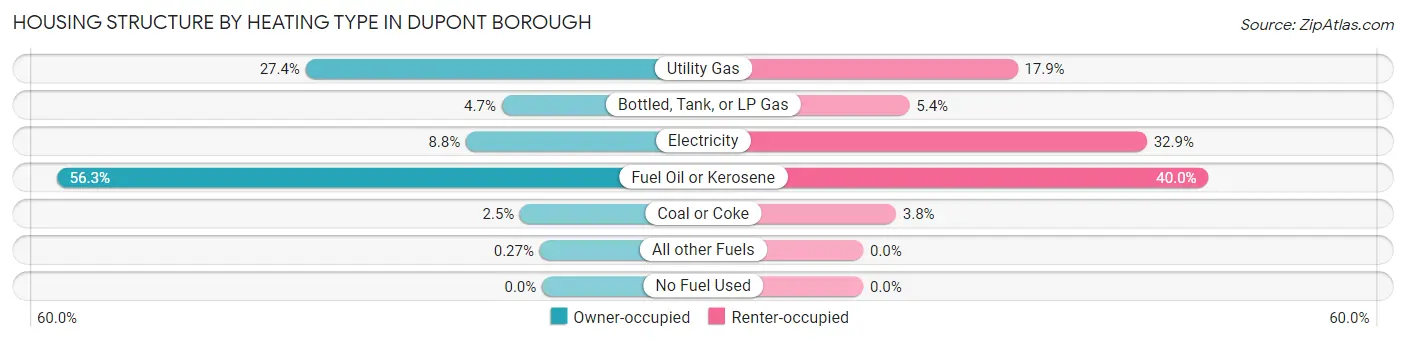
| Heating Type | Owner-occupied | Renter-occupied |
| Utility Gas | 205 (27.4%) | 80 (17.9%) |
| Bottled, Tank, or LP Gas | 35 (4.7%) | 24 (5.4%) |
| Electricity | 66 (8.8%) | 147 (32.9%) |
| Fuel Oil or Kerosene | 421 (56.3%) | 179 (40.0%) |
| Coal or Coke | 19 (2.5%) | 17 (3.8%) |
| All other Fuels | 2 (0.3%) | 0 (0.0%) |
| No Fuel Used | 0 (0.0%) | 0 (0.0%) |
| Total | 748 (100.0%) | 447 (100.0%) |
Household Vehicle Usage in Dupont borough
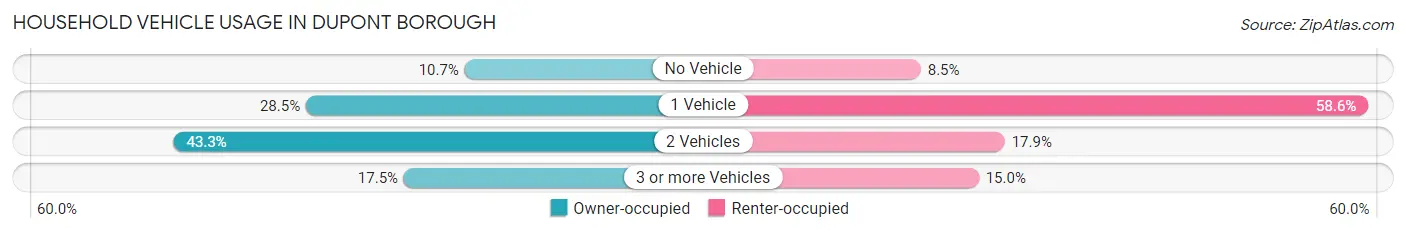
| Vehicles per Household | Owner-occupied | Renter-occupied |
| No Vehicle | 80 (10.7%) | 38 (8.5%) |
| 1 Vehicle | 213 (28.5%) | 262 (58.6%) |
| 2 Vehicles | 324 (43.3%) | 80 (17.9%) |
| 3 or more Vehicles | 131 (17.5%) | 67 (15.0%) |
| Total | 748 (100.0%) | 447 (100.0%) |
Real Estate & Mortgages in Dupont borough
Real Estate and Mortgage Overview in Dupont borough
| Characteristic | Without Mortgage | With Mortgage |
| Housing Units | 347 | 401 |
| Median Property Value | $117,200 | $127,900 |
| Median Household Income | $68,125 | $37 |
| Monthly Housing Costs | $514 | $9 |
| Real Estate Taxes | $1,421 | $9 |
Property Value by Mortgage Status in Dupont borough
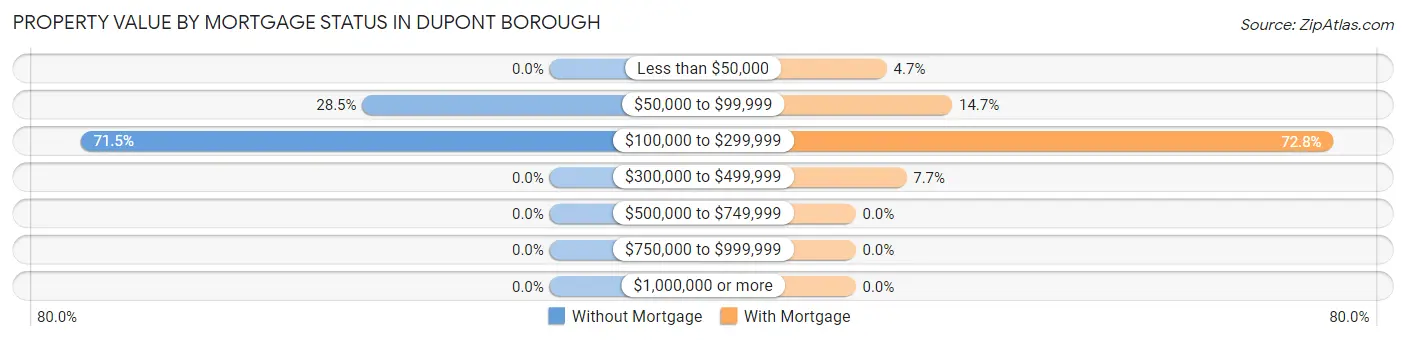
| Property Value | Without Mortgage | With Mortgage |
| Less than $50,000 | 0 (0.0%) | 19 (4.7%) |
| $50,000 to $99,999 | 99 (28.5%) | 59 (14.7%) |
| $100,000 to $299,999 | 248 (71.5%) | 292 (72.8%) |
| $300,000 to $499,999 | 0 (0.0%) | 31 (7.7%) |
| $500,000 to $749,999 | 0 (0.0%) | 0 (0.0%) |
| $750,000 to $999,999 | 0 (0.0%) | 0 (0.0%) |
| $1,000,000 or more | 0 (0.0%) | 0 (0.0%) |
| Total | 347 (100.0%) | 401 (100.0%) |
Household Income by Mortgage Status in Dupont borough
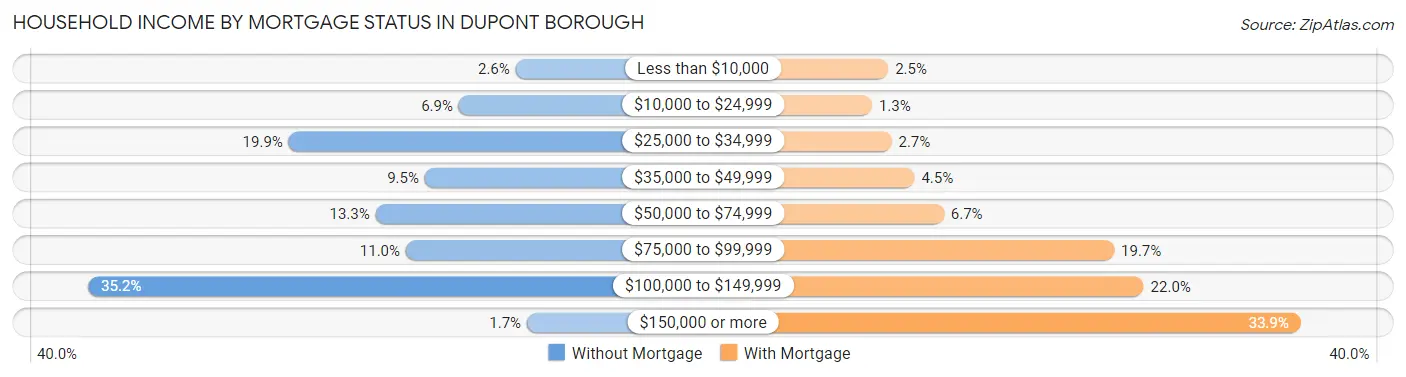
| Household Income | Without Mortgage | With Mortgage |
| Less than $10,000 | 9 (2.6%) | 10 (2.5%) |
| $10,000 to $24,999 | 24 (6.9%) | 5 (1.3%) |
| $25,000 to $34,999 | 69 (19.9%) | 11 (2.7%) |
| $35,000 to $49,999 | 33 (9.5%) | 18 (4.5%) |
| $50,000 to $74,999 | 46 (13.3%) | 27 (6.7%) |
| $75,000 to $99,999 | 38 (11.0%) | 79 (19.7%) |
| $100,000 to $149,999 | 122 (35.2%) | 88 (22.0%) |
| $150,000 or more | 6 (1.7%) | 136 (33.9%) |
| Total | 347 (100.0%) | 401 (100.0%) |
Property Value to Household Income Ratio in Dupont borough
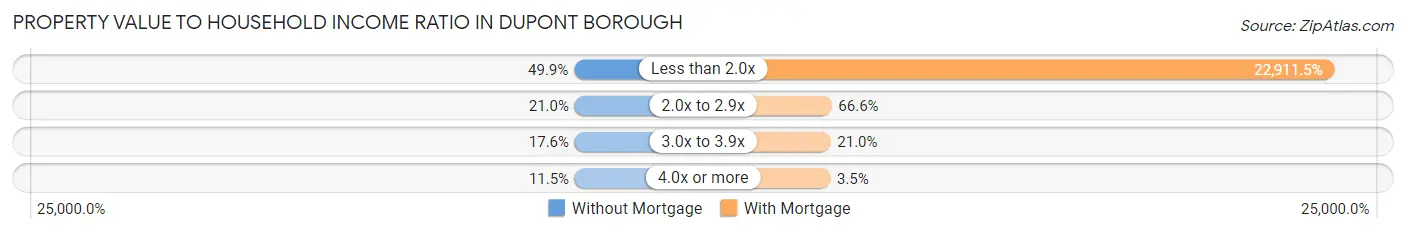
| Value-to-Income Ratio | Without Mortgage | With Mortgage |
| Less than 2.0x | 173 (49.9%) | 91,875 (22,911.5%) |
| 2.0x to 2.9x | 73 (21.0%) | 267 (66.6%) |
| 3.0x to 3.9x | 61 (17.6%) | 84 (20.9%) |
| 4.0x or more | 40 (11.5%) | 14 (3.5%) |
| Total | 347 (100.0%) | 401 (100.0%) |
Real Estate Taxes by Mortgage Status in Dupont borough
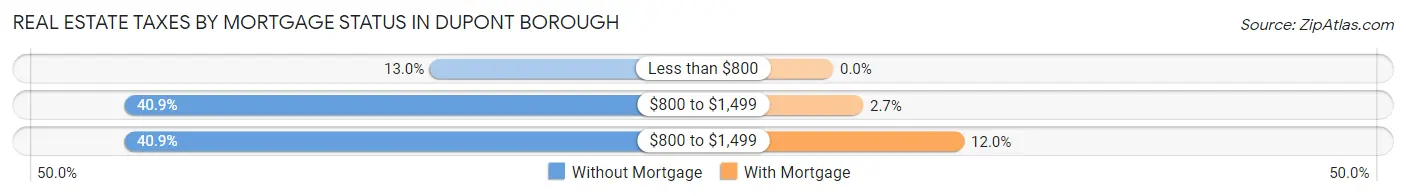
| Property Taxes | Without Mortgage | With Mortgage |
| Less than $800 | 45 (13.0%) | 0 (0.0%) |
| $800 to $1,499 | 142 (40.9%) | 11 (2.7%) |
| $800 to $1,499 | 142 (40.9%) | 48 (12.0%) |
| Total | 347 (100.0%) | 401 (100.0%) |
Health & Disability in Dupont borough
Health Insurance Coverage by Age in Dupont borough
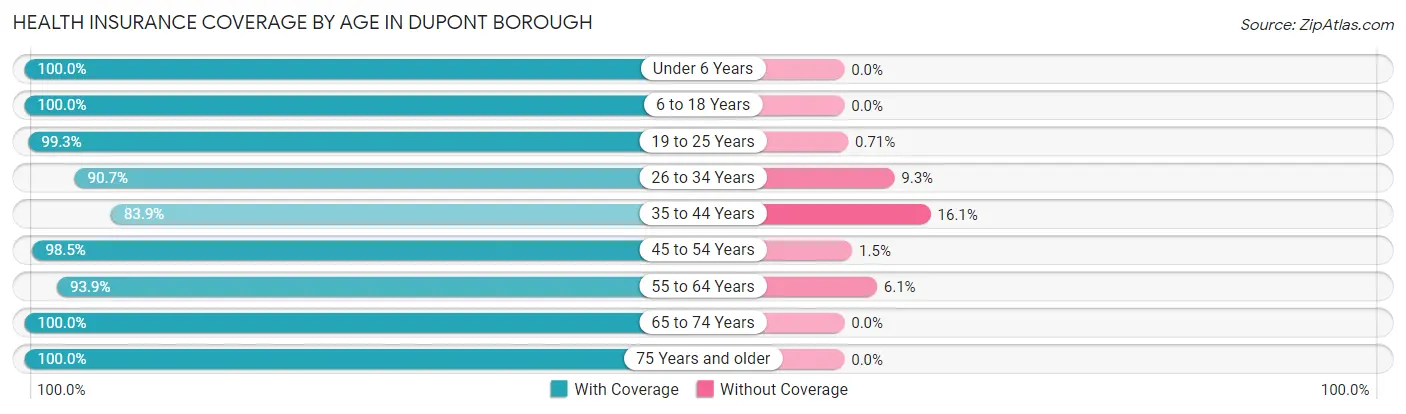
| Age Bracket | With Coverage | Without Coverage |
| Under 6 Years | 23 (100.0%) | 0 (0.0%) |
| 6 to 18 Years | 365 (100.0%) | 0 (0.0%) |
| 19 to 25 Years | 139 (99.3%) | 1 (0.7%) |
| 26 to 34 Years | 359 (90.7%) | 37 (9.3%) |
| 35 to 44 Years | 198 (83.9%) | 38 (16.1%) |
| 45 to 54 Years | 468 (98.5%) | 7 (1.5%) |
| 55 to 64 Years | 325 (93.9%) | 21 (6.1%) |
| 65 to 74 Years | 342 (100.0%) | 0 (0.0%) |
| 75 Years and older | 221 (100.0%) | 0 (0.0%) |
| Total | 2,440 (95.9%) | 104 (4.1%) |
Health Insurance Coverage by Citizenship Status in Dupont borough
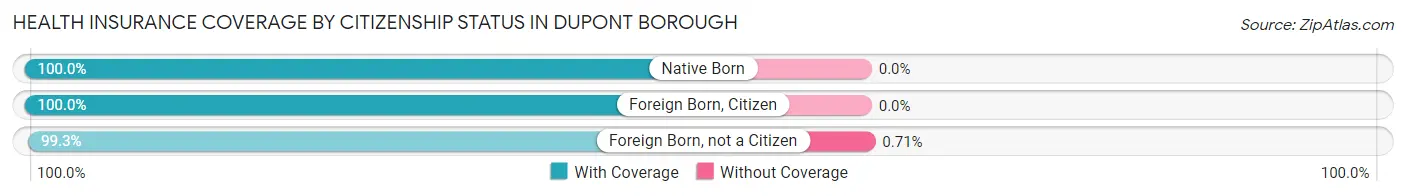
| Citizenship Status | With Coverage | Without Coverage |
| Native Born | 23 (100.0%) | 0 (0.0%) |
| Foreign Born, Citizen | 365 (100.0%) | 0 (0.0%) |
| Foreign Born, not a Citizen | 139 (99.3%) | 1 (0.7%) |
Health Insurance Coverage by Household Income in Dupont borough
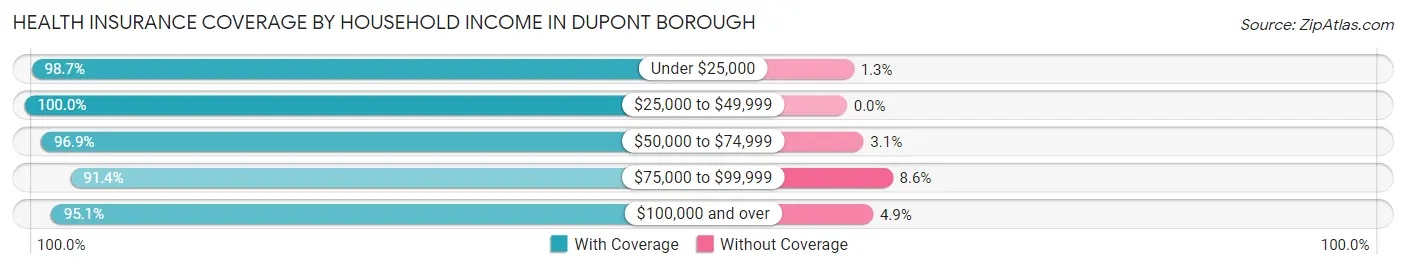
| Household Income | With Coverage | Without Coverage |
| Under $25,000 | 227 (98.7%) | 3 (1.3%) |
| $25,000 to $49,999 | 477 (100.0%) | 0 (0.0%) |
| $50,000 to $74,999 | 312 (96.9%) | 10 (3.1%) |
| $75,000 to $99,999 | 394 (91.4%) | 37 (8.6%) |
| $100,000 and over | 1,026 (95.1%) | 53 (4.9%) |
Public vs Private Health Insurance Coverage by Age in Dupont borough
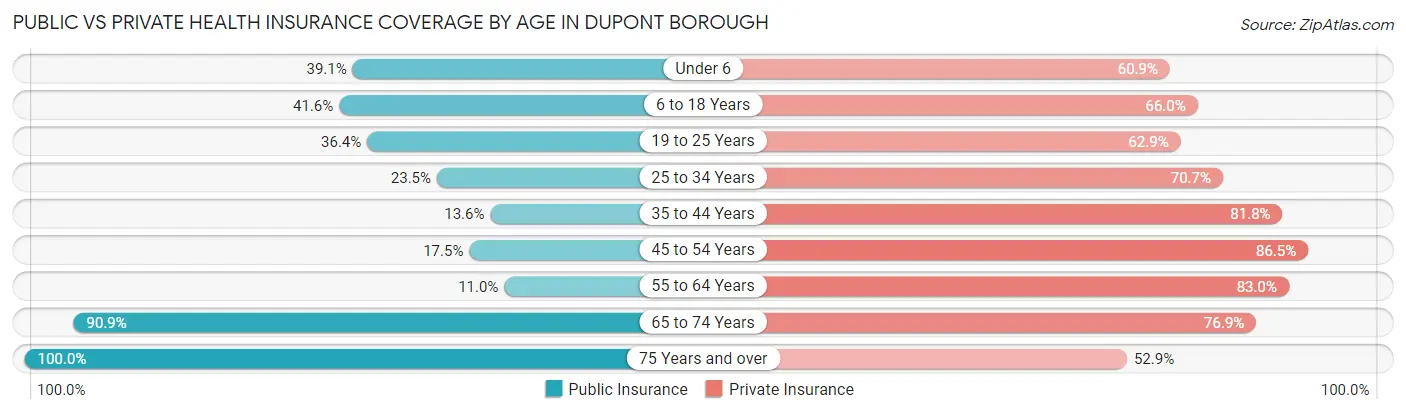
| Age Bracket | Public Insurance | Private Insurance |
| Under 6 | 9 (39.1%) | 14 (60.9%) |
| 6 to 18 Years | 152 (41.6%) | 241 (66.0%) |
| 19 to 25 Years | 51 (36.4%) | 88 (62.9%) |
| 25 to 34 Years | 93 (23.5%) | 280 (70.7%) |
| 35 to 44 Years | 32 (13.6%) | 193 (81.8%) |
| 45 to 54 Years | 83 (17.5%) | 411 (86.5%) |
| 55 to 64 Years | 38 (11.0%) | 287 (83.0%) |
| 65 to 74 Years | 311 (90.9%) | 263 (76.9%) |
| 75 Years and over | 221 (100.0%) | 117 (52.9%) |
| Total | 990 (38.9%) | 1,894 (74.5%) |
Disability Status by Sex by Age in Dupont borough
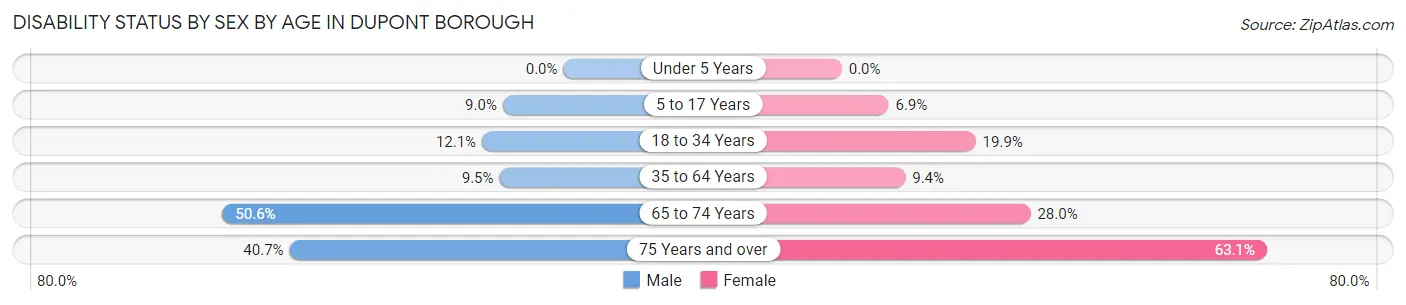
| Age Bracket | Male | Female |
| Under 5 Years | 0 (0.0%) | 0 (0.0%) |
| 5 to 17 Years | 18 (9.0%) | 10 (6.9%) |
| 18 to 34 Years | 26 (12.1%) | 68 (19.9%) |
| 35 to 64 Years | 49 (9.5%) | 51 (9.4%) |
| 65 to 74 Years | 81 (50.6%) | 51 (28.0%) |
| 75 Years and over | 48 (40.7%) | 65 (63.1%) |
Disability Class by Sex by Age in Dupont borough
Disability Class: Hearing Difficulty
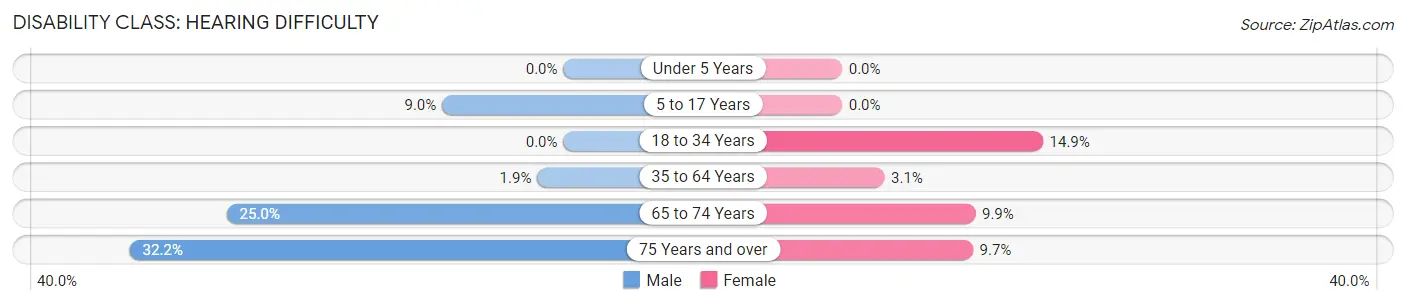
| Age Bracket | Male | Female |
| Under 5 Years | 0 (0.0%) | 0 (0.0%) |
| 5 to 17 Years | 18 (9.0%) | 0 (0.0%) |
| 18 to 34 Years | 0 (0.0%) | 51 (14.9%) |
| 35 to 64 Years | 10 (1.9%) | 17 (3.1%) |
| 65 to 74 Years | 40 (25.0%) | 18 (9.9%) |
| 75 Years and over | 38 (32.2%) | 10 (9.7%) |
Disability Class: Vision Difficulty
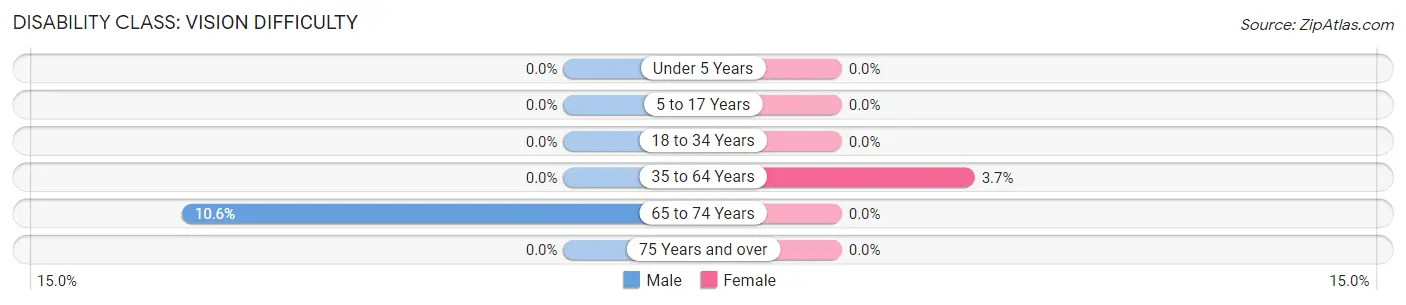
| Age Bracket | Male | Female |
| Under 5 Years | 0 (0.0%) | 0 (0.0%) |
| 5 to 17 Years | 0 (0.0%) | 0 (0.0%) |
| 18 to 34 Years | 0 (0.0%) | 0 (0.0%) |
| 35 to 64 Years | 0 (0.0%) | 20 (3.7%) |
| 65 to 74 Years | 17 (10.6%) | 0 (0.0%) |
| 75 Years and over | 0 (0.0%) | 0 (0.0%) |
Disability Class: Cognitive Difficulty
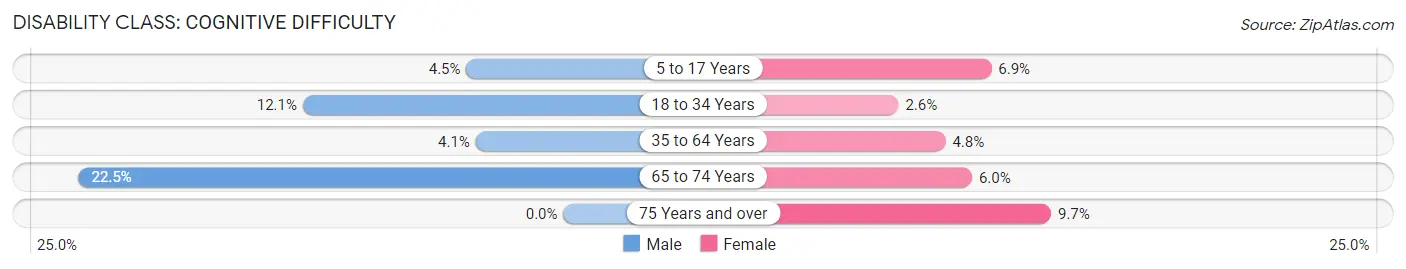
| Age Bracket | Male | Female |
| 5 to 17 Years | 9 (4.5%) | 10 (6.9%) |
| 18 to 34 Years | 26 (12.1%) | 9 (2.6%) |
| 35 to 64 Years | 21 (4.1%) | 26 (4.8%) |
| 65 to 74 Years | 36 (22.5%) | 11 (6.0%) |
| 75 Years and over | 0 (0.0%) | 10 (9.7%) |
Disability Class: Ambulatory Difficulty
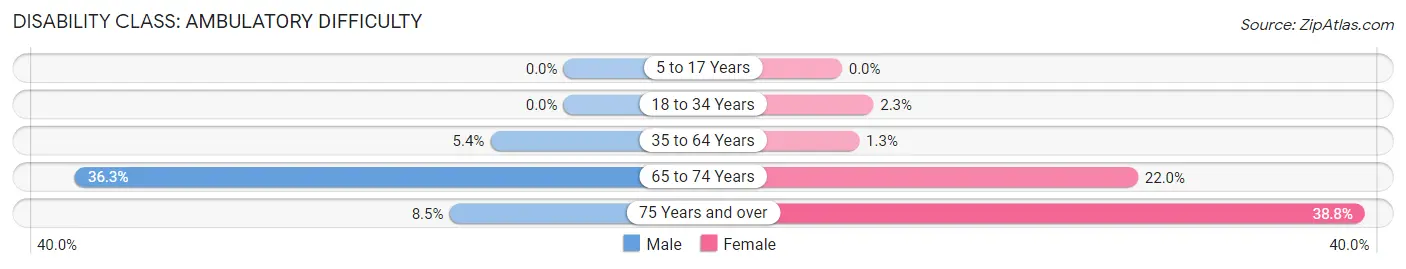
| Age Bracket | Male | Female |
| 5 to 17 Years | 0 (0.0%) | 0 (0.0%) |
| 18 to 34 Years | 0 (0.0%) | 8 (2.3%) |
| 35 to 64 Years | 28 (5.4%) | 7 (1.3%) |
| 65 to 74 Years | 58 (36.2%) | 40 (22.0%) |
| 75 Years and over | 10 (8.5%) | 40 (38.8%) |
Disability Class: Self-Care Difficulty
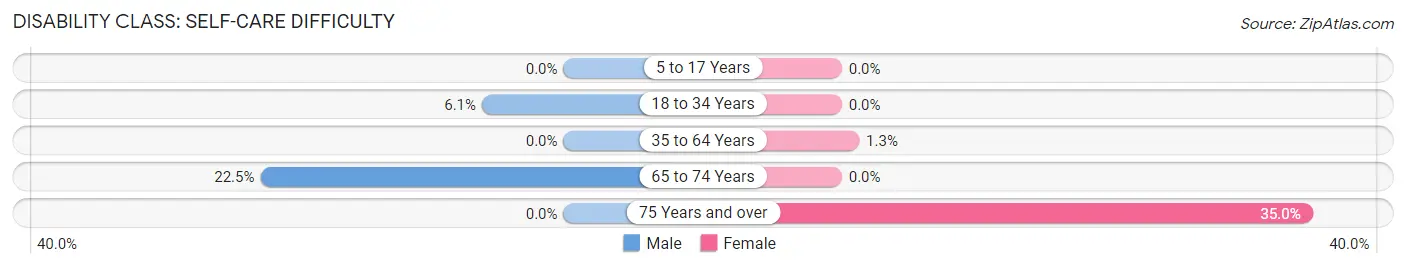
| Age Bracket | Male | Female |
| 5 to 17 Years | 0 (0.0%) | 0 (0.0%) |
| 18 to 34 Years | 13 (6.0%) | 0 (0.0%) |
| 35 to 64 Years | 0 (0.0%) | 7 (1.3%) |
| 65 to 74 Years | 36 (22.5%) | 0 (0.0%) |
| 75 Years and over | 0 (0.0%) | 36 (34.9%) |
Technology Access in Dupont borough
Computing Device Access in Dupont borough
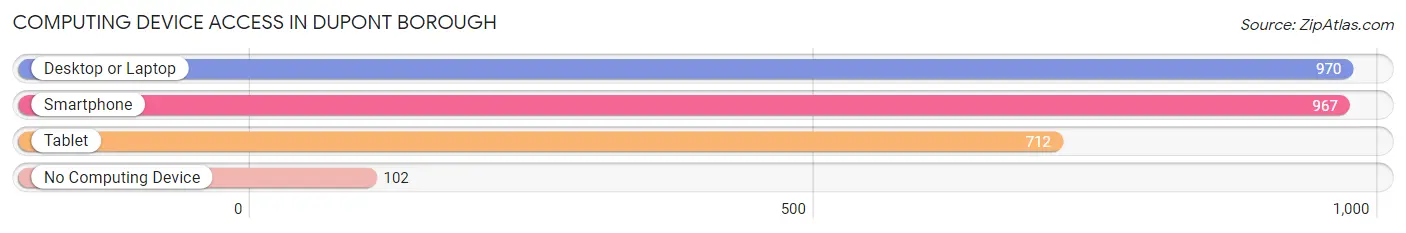
| Device Type | # Households | % Households |
| Desktop or Laptop | 970 | 81.2% |
| Smartphone | 967 | 80.9% |
| Tablet | 712 | 59.6% |
| No Computing Device | 102 | 8.5% |
| Total | 1,195 | 100.0% |
Internet Access in Dupont borough
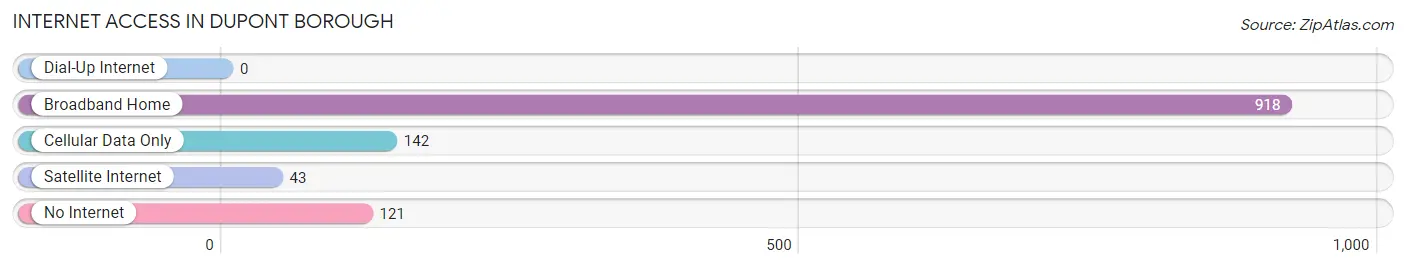
| Internet Type | # Households | % Households |
| Dial-Up Internet | 0 | 0.0% |
| Broadband Home | 918 | 76.8% |
| Cellular Data Only | 142 | 11.9% |
| Satellite Internet | 43 | 3.6% |
| No Internet | 121 | 10.1% |
| Total | 1,195 | 100.0% |
Dupont borough Summary
Dupont Borough is a small borough located in Luzerne County, Pennsylvania. It is situated in the Wyoming Valley, approximately five miles south of Wilkes-Barre. The population of Dupont Borough was 2,845 at the 2010 census.
History
Dupont Borough was founded in 1867 by the Dupont Powder Company, which was established in 1802. The company was founded by Eleuthère Irénée du Pont, a French immigrant who had come to the United States in 1799. The company was originally located in Delaware, but moved to Pennsylvania in 1802. The company was a major supplier of gunpowder during the Civil War and was the largest producer of gunpowder in the world at the time.
The town of Dupont was named after the company and was incorporated in 1867. The town was originally a small farming community, but grew rapidly after the establishment of the Dupont Powder Company. The company built a large factory in the town and employed many of the local residents. The town also became a major transportation hub, with the Lehigh Valley Railroad running through it.
Geography
Dupont Borough is located at 41°14'17" North, 75°51'45" West (41.238, -75.862). It is situated in the Wyoming Valley, approximately five miles south of Wilkes-Barre. The borough is bordered by the townships of Jenkins, Pittston, and Exeter. The Susquehanna River runs through the borough, and the borough is located in the foothills of the Pocono Mountains.
The total area of Dupont Borough is 1.2 square miles, all of which is land. The borough has a humid continental climate, with cold winters and hot, humid summers.
Economy
The economy of Dupont Borough is largely based on the Dupont Powder Company, which is still in operation today. The company is the largest employer in the borough, and provides jobs for many of the local residents. The company produces a variety of products, including explosives, propellants, and smokeless powder.
The borough also has a number of small businesses, including restaurants, retail stores, and service providers. The borough is also home to a number of manufacturing companies, including a plastics manufacturer and a metal fabrication company.
Demographics
As of the 2010 census, the population of Dupont Borough was 2,845. The racial makeup of the borough was 97.3% White, 0.7% African American, 0.2% Native American, 0.4% Asian, 0.1% from other races, and 1.3% from two or more races. Hispanic or Latino of any race were 1.2% of the population.
The median household income in Dupont Borough was $41,250, and the median family income was $50,000. The per capita income for the borough was $20,945. About 8.3% of families and 10.2% of the population were below the poverty line, including 14.2% of those under age 18 and 6.2% of those age 65 or over.
Common Questions
What is Per Capita Income in Dupont borough?
Per Capita income in Dupont borough is $33,328.
What is the Median Family Income in Dupont borough?
Median Family Income in Dupont borough is $88,107.
What is the Median Household income in Dupont borough?
Median Household Income in Dupont borough is $61,224.
What is Income or Wage Gap in Dupont borough?
Income or Wage Gap in Dupont borough is 31.3%.
Women in Dupont borough earn 68.7 cents for every dollar earned by a man.
What is Inequality or Gini Index in Dupont borough?
Inequality or Gini Index in Dupont borough is 0.34.
What is the Total Population of Dupont borough?
Total Population of Dupont borough is 2,544.
What is the Total Male Population of Dupont borough?
Total Male Population of Dupont borough is 1,216.
What is the Total Female Population of Dupont borough?
Total Female Population of Dupont borough is 1,328.
What is the Ratio of Males per 100 Females in Dupont borough?
There are 91.57 Males per 100 Females in Dupont borough.
What is the Ratio of Females per 100 Males in Dupont borough?
There are 109.21 Females per 100 Males in Dupont borough.
What is the Median Population Age in Dupont borough?
Median Population Age in Dupont borough is 47.5 Years.
What is the Average Family Size in Dupont borough
Average Family Size in Dupont borough is 2.5 People.
What is the Average Household Size in Dupont borough
Average Household Size in Dupont borough is 2.1 People.
How Large is the Labor Force in Dupont borough?
There are 1,534 People in the Labor Forcein in Dupont borough.
What is the Percentage of People in the Labor Force in Dupont borough?
67.7% of People are in the Labor Force in Dupont borough.
What is the Unemployment Rate in Dupont borough?
Unemployment Rate in Dupont borough is 9.7%.