Manns Choice borough, PA Map & Demographics
Manns Choice borough Overview
$22,124
PER CAPITA INCOME
$63,125
AVG FAMILY INCOME
$47,500
AVG HOUSEHOLD INCOME
42.8%
WAGE / INCOME GAP [ % ]
57.2¢/ $1
WAGE / INCOME GAP [ $ ]
0.37
INEQUALITY / GINI INDEX
279
TOTAL POPULATION
149
MALE POPULATION
130
FEMALE POPULATION
114.62
MALES / 100 FEMALES
87.25
FEMALES / 100 MALES
37.1
MEDIAN AGE
3.7
AVG FAMILY SIZE
2.9
AVG HOUSEHOLD SIZE
156
LABOR FORCE [ PEOPLE ]
73.9%
PERCENT IN LABOR FORCE
9.6%
UNEMPLOYMENT RATE
Income in Manns Choice borough
Income Overview in Manns Choice borough
Per Capita Income in Manns Choice borough is $22,124, while median incomes of families and households are $63,125 and $47,500 respectively.
| Characteristic | Number | Measure |
| Per Capita Income | 279 | $22,124 |
| Median Family Income | 63 | $63,125 |
| Mean Family Income | 63 | $70,535 |
| Median Household Income | 96 | $47,500 |
| Mean Household Income | 96 | $60,600 |
| Income Deficit | 63 | $0 |
| Wage / Income Gap (%) | 279 | 42.77% |
| Wage / Income Gap ($) | 279 | 57.23¢ per $1 |
| Gini / Inequality Index | 279 | 0.37 |
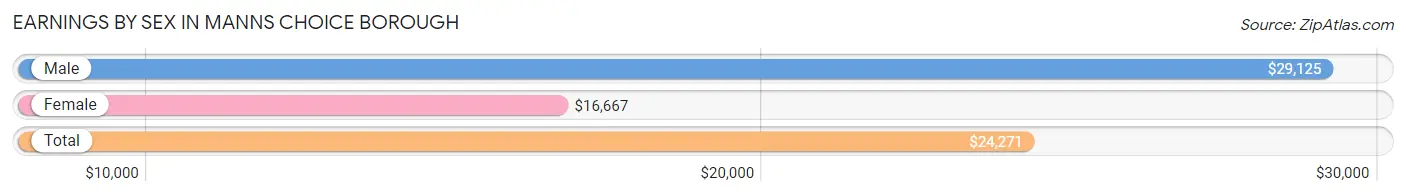
Earnings by Sex in Manns Choice borough
Average Earnings in Manns Choice borough are $24,271, $29,125 for men and $16,667 for women, a difference of 42.8%.
| Sex | Number | Average Earnings |
| Male | 83 (53.5%) | $29,125 |
| Female | 72 (46.5%) | $16,667 |
| Total | 155 (100.0%) | $24,271 |
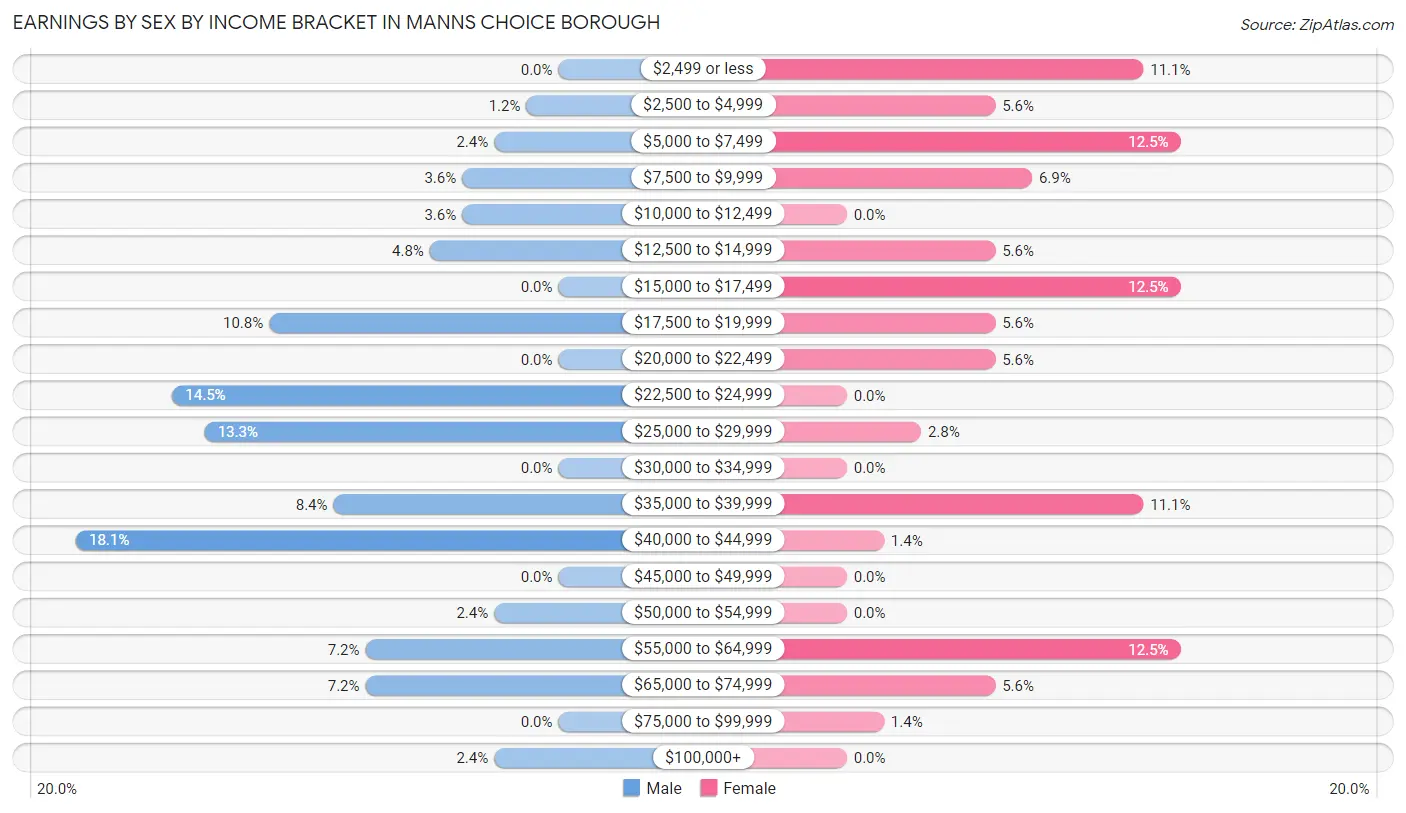
Earnings by Sex by Income Bracket in Manns Choice borough
The most common earnings brackets in Manns Choice borough are $40,000 to $44,999 for men (15 | 18.1%) and $5,000 to $7,499 for women (9 | 12.5%).
| Income | Male | Female |
| $2,499 or less | 0 (0.0%) | 8 (11.1%) |
| $2,500 to $4,999 | 1 (1.2%) | 4 (5.6%) |
| $5,000 to $7,499 | 2 (2.4%) | 9 (12.5%) |
| $7,500 to $9,999 | 3 (3.6%) | 5 (6.9%) |
| $10,000 to $12,499 | 3 (3.6%) | 0 (0.0%) |
| $12,500 to $14,999 | 4 (4.8%) | 4 (5.6%) |
| $15,000 to $17,499 | 0 (0.0%) | 9 (12.5%) |
| $17,500 to $19,999 | 9 (10.8%) | 4 (5.6%) |
| $20,000 to $22,499 | 0 (0.0%) | 4 (5.6%) |
| $22,500 to $24,999 | 12 (14.5%) | 0 (0.0%) |
| $25,000 to $29,999 | 11 (13.3%) | 2 (2.8%) |
| $30,000 to $34,999 | 0 (0.0%) | 0 (0.0%) |
| $35,000 to $39,999 | 7 (8.4%) | 8 (11.1%) |
| $40,000 to $44,999 | 15 (18.1%) | 1 (1.4%) |
| $45,000 to $49,999 | 0 (0.0%) | 0 (0.0%) |
| $50,000 to $54,999 | 2 (2.4%) | 0 (0.0%) |
| $55,000 to $64,999 | 6 (7.2%) | 9 (12.5%) |
| $65,000 to $74,999 | 6 (7.2%) | 4 (5.6%) |
| $75,000 to $99,999 | 0 (0.0%) | 1 (1.4%) |
| $100,000+ | 2 (2.4%) | 0 (0.0%) |
| Total | 83 (100.0%) | 72 (100.0%) |
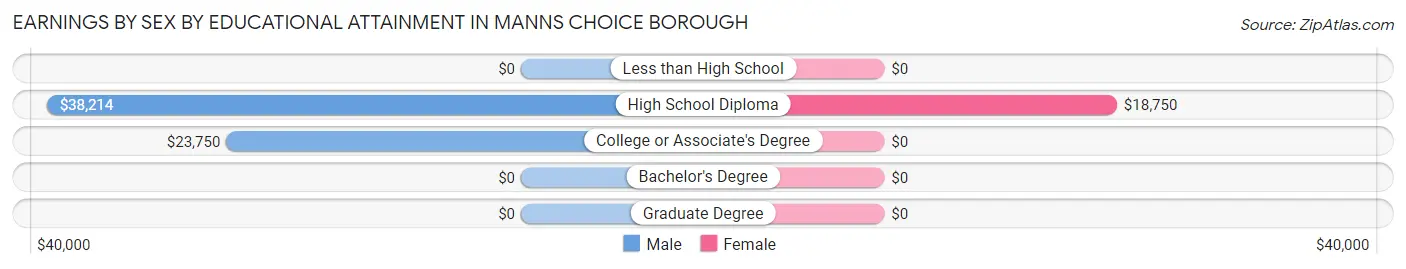
Earnings by Sex by Educational Attainment in Manns Choice borough
Average earnings in Manns Choice borough are $38,036 for men and $18,750 for women, a difference of 50.7%. Men with an educational attainment of high school diploma enjoy the highest average annual earnings of $38,214, while those with college or associate's degree education earn the least with $23,750. Women with an educational attainment of high school diploma earn the most with the average annual earnings of $18,750, while those with high school diploma education have the smallest earnings of $18,750.
| Educational Attainment | Male Income | Female Income |
| Less than High School | - | - |
| High School Diploma | $38,214 | $18,750 |
| College or Associate's Degree | $23,750 | $0 |
| Bachelor's Degree | - | - |
| Graduate Degree | - | - |
| Total | $38,036 | $18,750 |
Family Income in Manns Choice borough
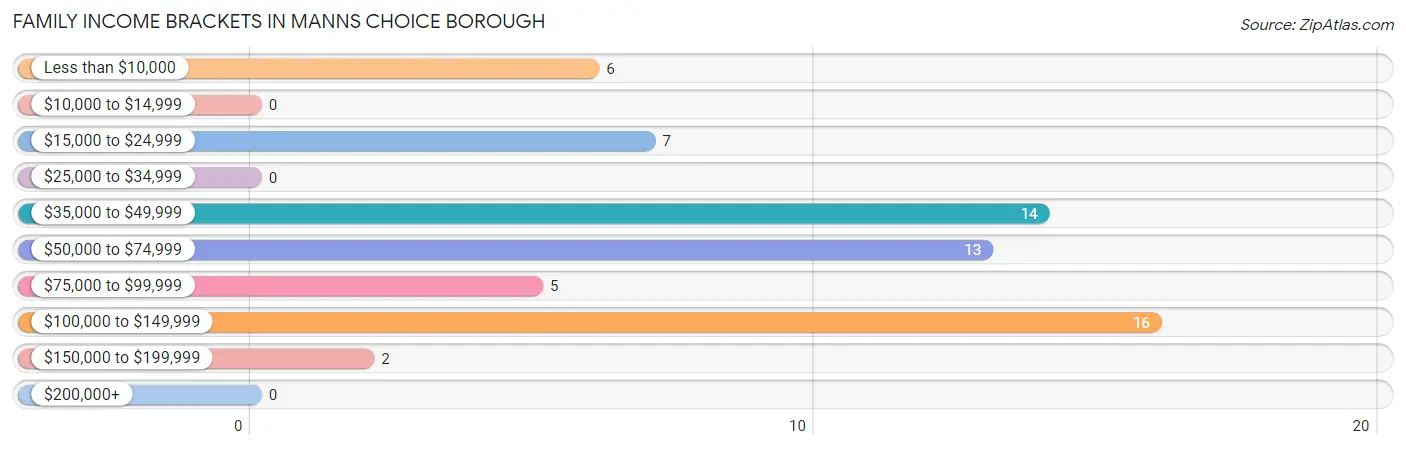
Family Income Brackets in Manns Choice borough
According to the Manns Choice borough family income data, there are 16 families falling into the $100,000 to $149,999 income range, which is the most common income bracket and makes up 25.4% of all families.
| Income Bracket | # Families | % Families |
| Less than $10,000 | 6 | 9.5% |
| $10,000 to $14,999 | 0 | 0.0% |
| $15,000 to $24,999 | 7 | 11.1% |
| $25,000 to $34,999 | 0 | 0.0% |
| $35,000 to $49,999 | 14 | 22.2% |
| $50,000 to $74,999 | 13 | 20.6% |
| $75,000 to $99,999 | 5 | 7.9% |
| $100,000 to $149,999 | 16 | 25.4% |
| $150,000 to $199,999 | 2 | 3.2% |
| $200,000+ | 0 | 0.0% |
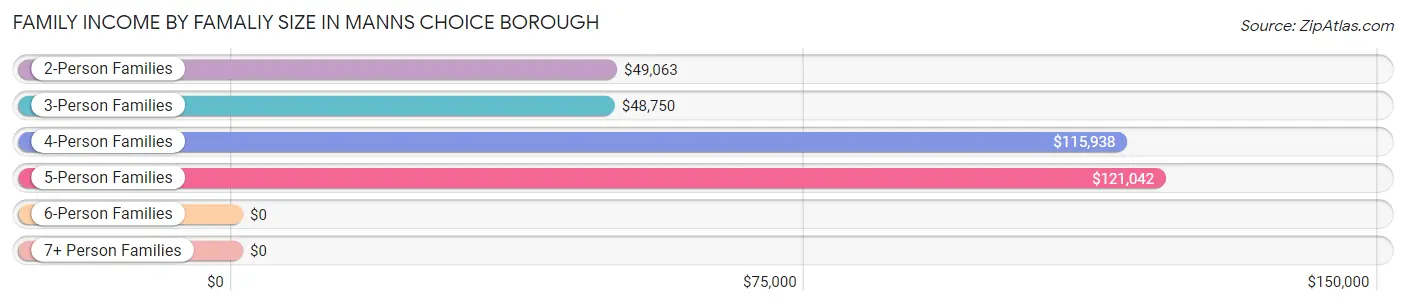
Family Income by Famaliy Size in Manns Choice borough
5-person families (11 | 17.5%) account for the highest median family income in Manns Choice borough with $121,042 per family, while 4-person families (11 | 17.5%) have the highest median income of $28,984 per family member.
| Income Bracket | # Families | Median Income |
| 2-Person Families | 23 (36.5%) | $49,063 |
| 3-Person Families | 16 (25.4%) | $48,750 |
| 4-Person Families | 11 (17.5%) | $115,938 |
| 5-Person Families | 11 (17.5%) | $121,042 |
| 6-Person Families | 2 (3.2%) | $0 |
| 7+ Person Families | 0 (0.0%) | $0 |
| Total | 63 (100.0%) | $63,125 |
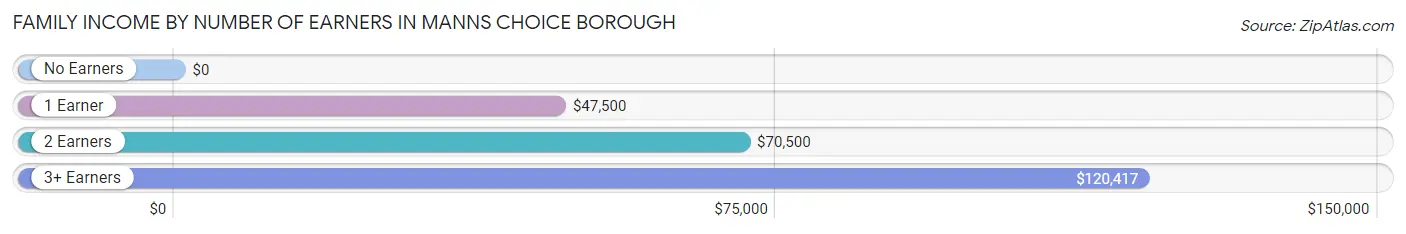
Family Income by Number of Earners in Manns Choice borough
| Number of Earners | # Families | Median Income |
| No Earners | 11 (17.5%) | $0 |
| 1 Earner | 16 (25.4%) | $47,500 |
| 2 Earners | 22 (34.9%) | $70,500 |
| 3+ Earners | 14 (22.2%) | $120,417 |
| Total | 63 (100.0%) | $63,125 |
Household Income in Manns Choice borough
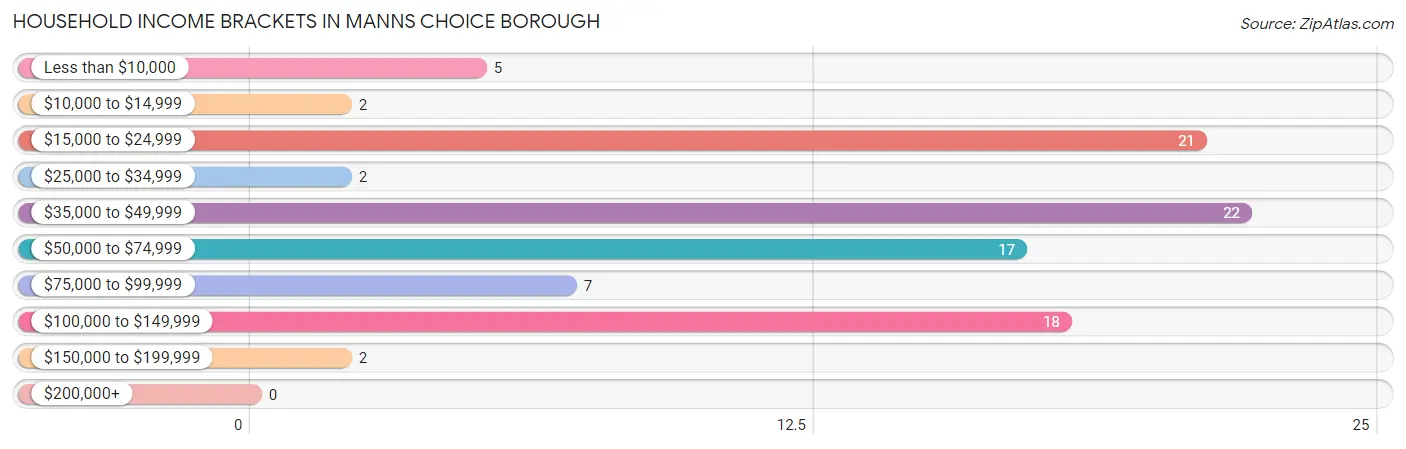
Household Income Brackets in Manns Choice borough
With 22 households falling in the category, the $35,000 to $49,999 income range is the most frequent in Manns Choice borough, accounting for 22.9% of all households.
| Income Bracket | # Households | % Households |
| Less than $10,000 | 5 | 5.2% |
| $10,000 to $14,999 | 2 | 2.1% |
| $15,000 to $24,999 | 21 | 21.9% |
| $25,000 to $34,999 | 2 | 2.1% |
| $35,000 to $49,999 | 22 | 22.9% |
| $50,000 to $74,999 | 17 | 17.7% |
| $75,000 to $99,999 | 7 | 7.3% |
| $100,000 to $149,999 | 18 | 18.8% |
| $150,000 to $199,999 | 2 | 2.1% |
| $200,000+ | 0 | 0.0% |
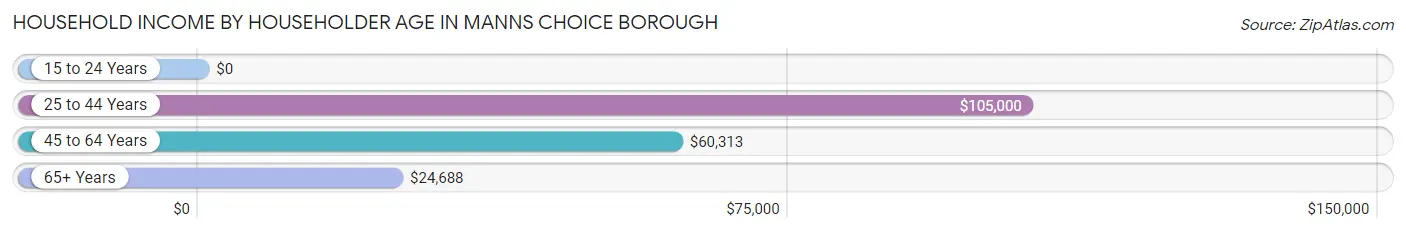
Household Income by Householder Age in Manns Choice borough
The median household income in Manns Choice borough is $47,500, with the highest median household income of $105,000 found in the 25 to 44 years age bracket for the primary householder. A total of 32 households (33.3%) fall into this category. Meanwhile, the 15 to 24 years age bracket for the primary householder has the lowest median household income of $0, with 6 households (6.2%) in this group.
| Income Bracket | # Households | Median Income |
| 15 to 24 Years | 6 (6.2%) | $0 |
| 25 to 44 Years | 32 (33.3%) | $105,000 |
| 45 to 64 Years | 29 (30.2%) | $60,313 |
| 65+ Years | 29 (30.2%) | $24,688 |
| Total | 96 (100.0%) | $47,500 |
Poverty in Manns Choice borough
Income Below Poverty by Sex and Age in Manns Choice borough
With 10.1% poverty level for males and 21.5% for females among the residents of Manns Choice borough, under 5 year old males and 12 to 14 year old females are the most vulnerable to poverty, with 8 males (38.1%) and 4 females (100.0%) in their respective age groups living below the poverty level.
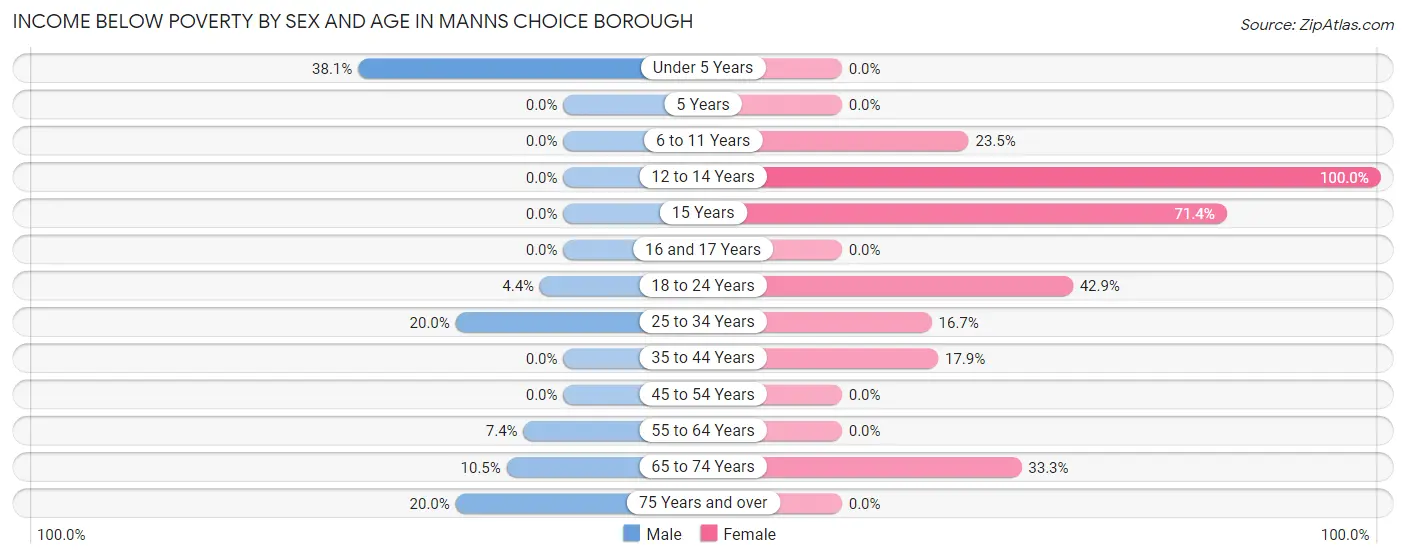
| Age Bracket | Male | Female |
| Under 5 Years | 8 (38.1%) | 0 (0.0%) |
| 5 Years | 0 (0.0%) | 0 (0.0%) |
| 6 to 11 Years | 0 (0.0%) | 4 (23.5%) |
| 12 to 14 Years | 0 (0.0%) | 4 (100.0%) |
| 15 Years | 0 (0.0%) | 5 (71.4%) |
| 16 and 17 Years | 0 (0.0%) | 0 (0.0%) |
| 18 to 24 Years | 1 (4.3%) | 6 (42.9%) |
| 25 to 34 Years | 1 (20.0%) | 2 (16.7%) |
| 35 to 44 Years | 0 (0.0%) | 5 (17.9%) |
| 45 to 54 Years | 0 (0.0%) | 0 (0.0%) |
| 55 to 64 Years | 2 (7.4%) | 0 (0.0%) |
| 65 to 74 Years | 2 (10.5%) | 2 (33.3%) |
| 75 Years and over | 1 (20.0%) | 0 (0.0%) |
| Total | 15 (10.1%) | 28 (21.5%) |
Income Above Poverty by Sex and Age in Manns Choice borough
According to the poverty statistics in Manns Choice borough, males aged 6 to 11 years and females aged under 5 years are the age groups that are most secure financially, with 100.0% of males and 100.0% of females in these age groups living above the poverty line.
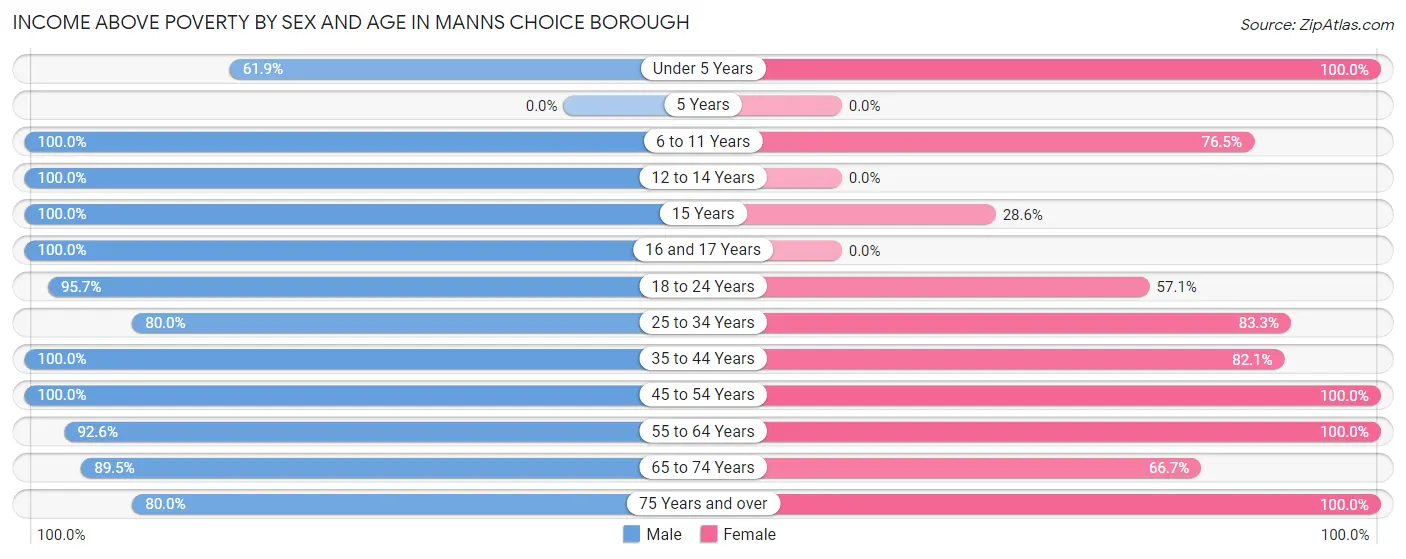
| Age Bracket | Male | Female |
| Under 5 Years | 13 (61.9%) | 4 (100.0%) |
| 5 Years | 0 (0.0%) | 0 (0.0%) |
| 6 to 11 Years | 3 (100.0%) | 13 (76.5%) |
| 12 to 14 Years | 7 (100.0%) | 0 (0.0%) |
| 15 Years | 5 (100.0%) | 2 (28.6%) |
| 16 and 17 Years | 4 (100.0%) | 0 (0.0%) |
| 18 to 24 Years | 22 (95.7%) | 8 (57.1%) |
| 25 to 34 Years | 4 (80.0%) | 10 (83.3%) |
| 35 to 44 Years | 22 (100.0%) | 23 (82.1%) |
| 45 to 54 Years | 8 (100.0%) | 10 (100.0%) |
| 55 to 64 Years | 25 (92.6%) | 17 (100.0%) |
| 65 to 74 Years | 17 (89.5%) | 4 (66.7%) |
| 75 Years and over | 4 (80.0%) | 11 (100.0%) |
| Total | 134 (89.9%) | 102 (78.5%) |
Income Below Poverty Among Married-Couple Families in Manns Choice borough
The poverty statistics for married-couple families in Manns Choice borough show that 6.2% or 3 of the total 48 families live below the poverty line. Families with 3 or 4 children have the highest poverty rate of 40.0%, comprising of 2 families. On the other hand, families with 1 or 2 children have the lowest poverty rate of 0.0%, which includes 0 families.
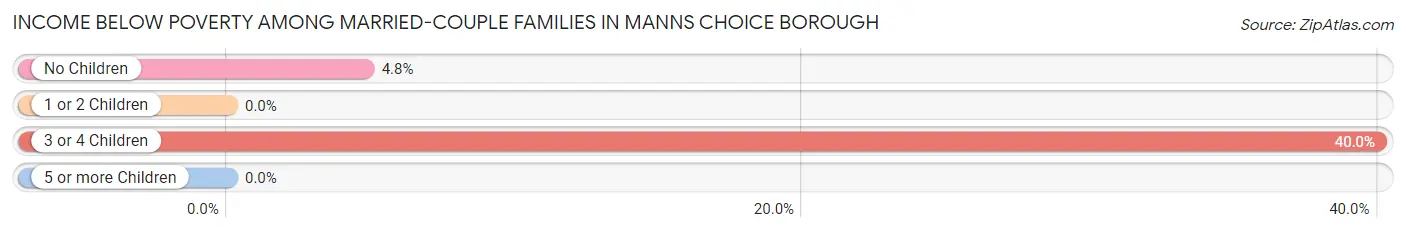
| Children | Above Poverty | Below Poverty |
| No Children | 20 (95.2%) | 1 (4.8%) |
| 1 or 2 Children | 22 (100.0%) | 0 (0.0%) |
| 3 or 4 Children | 3 (60.0%) | 2 (40.0%) |
| 5 or more Children | 0 (0.0%) | 0 (0.0%) |
| Total | 45 (93.8%) | 3 (6.2%) |
Income Below Poverty Among Single-Parent Households in Manns Choice borough
According to the poverty data in Manns Choice borough, 33.3% or 1 single-father households and 58.3% or 7 single-mother households are living below the poverty line. Among single-father households, those with 1 or 2 children have the highest poverty rate, with 1 households (50.0%) experiencing poverty. Likewise, among single-mother households, those with 1 or 2 children have the highest poverty rate, with 7 households (77.8%) falling below the poverty line.
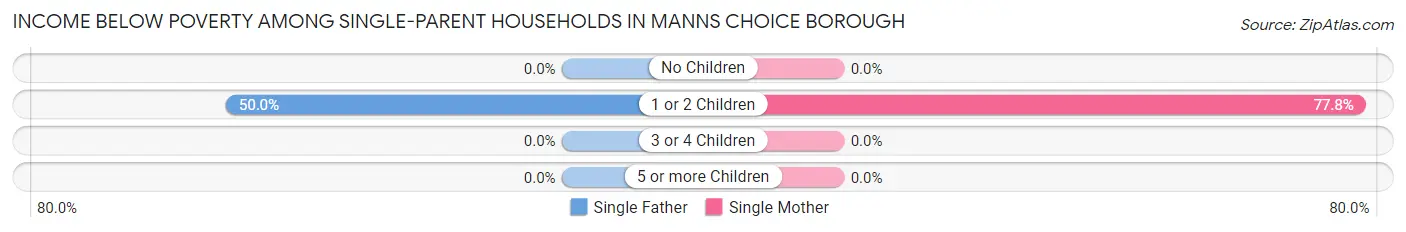
| Children | Single Father | Single Mother |
| No Children | 0 (0.0%) | 0 (0.0%) |
| 1 or 2 Children | 1 (50.0%) | 7 (77.8%) |
| 3 or 4 Children | 0 (0.0%) | 0 (0.0%) |
| 5 or more Children | 0 (0.0%) | 0 (0.0%) |
| Total | 1 (33.3%) | 7 (58.3%) |
Income Below Poverty Among Married-Couple vs Single-Parent Households in Manns Choice borough
The poverty data for Manns Choice borough shows that 3 of the married-couple family households (6.2%) and 8 of the single-parent households (53.3%) are living below the poverty level. Within the married-couple family households, those with 3 or 4 children have the highest poverty rate, with 2 households (40.0%) falling below the poverty line. Among the single-parent households, those with 1 or 2 children have the highest poverty rate, with 8 household (72.7%) living below poverty.
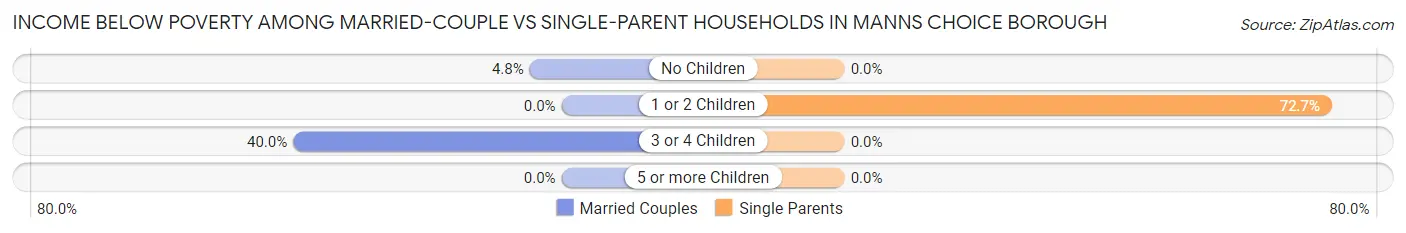
| Children | Married-Couple Families | Single-Parent Households |
| No Children | 1 (4.8%) | 0 (0.0%) |
| 1 or 2 Children | 0 (0.0%) | 8 (72.7%) |
| 3 or 4 Children | 2 (40.0%) | 0 (0.0%) |
| 5 or more Children | 0 (0.0%) | 0 (0.0%) |
| Total | 3 (6.2%) | 8 (53.3%) |
Race in Manns Choice borough
The most populous races in Manns Choice borough are White / Caucasian (270 | 96.8%), and Two or more Races (9 | 3.2%).
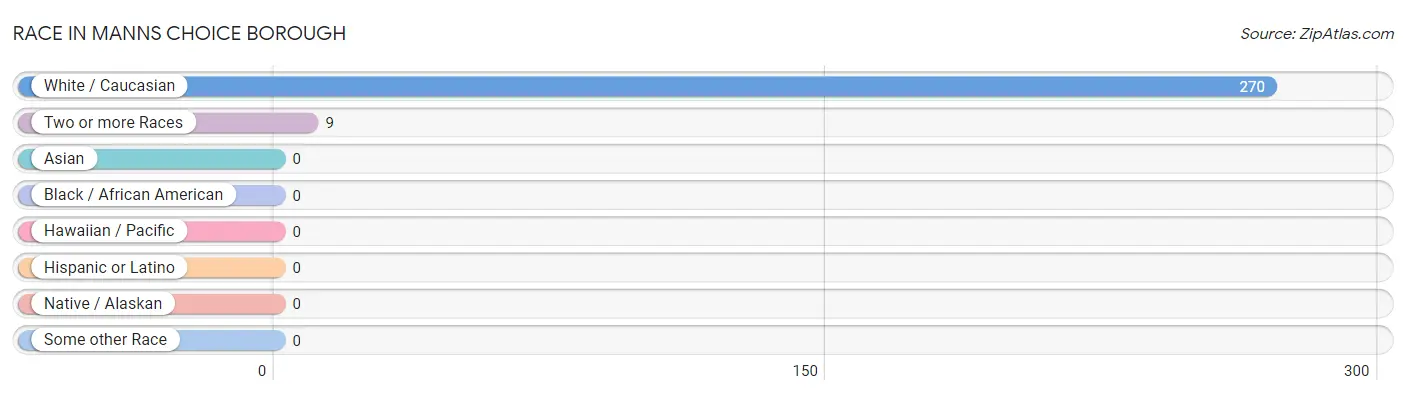
| Race | # Population | % Population |
| Asian | 0 | 0.0% |
| Black / African American | 0 | 0.0% |
| Hawaiian / Pacific | 0 | 0.0% |
| Hispanic or Latino | 0 | 0.0% |
| Native / Alaskan | 0 | 0.0% |
| White / Caucasian | 270 | 96.8% |
| Two or more Races | 9 | 3.2% |
| Some other Race | 0 | 0.0% |
| Total | 279 | 100.0% |
Ancestry in Manns Choice borough
The most populous ancestries reported in Manns Choice borough are German (77 | 27.6%), Irish (26 | 9.3%), Polish (16 | 5.7%), English (15 | 5.4%), and Welsh (11 | 3.9%), together accounting for 52.0% of all Manns Choice borough residents.
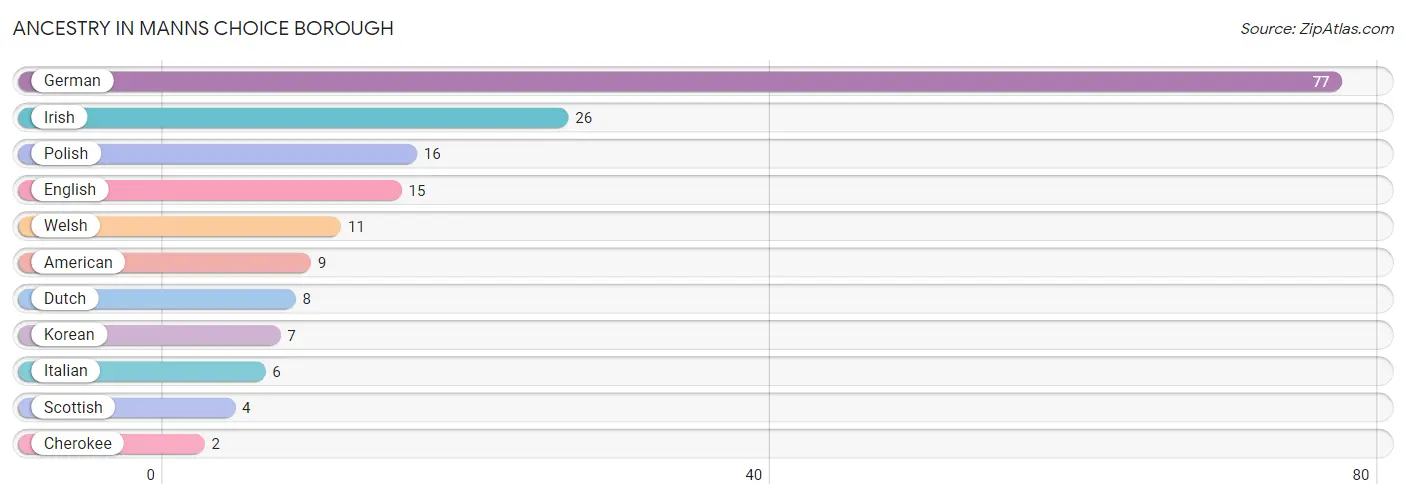
| Ancestry | # Population | % Population |
| American | 9 | 3.2% |
| Cherokee | 2 | 0.7% |
| Dutch | 8 | 2.9% |
| English | 15 | 5.4% |
| German | 77 | 27.6% |
| Irish | 26 | 9.3% |
| Italian | 6 | 2.1% |
| Korean | 7 | 2.5% |
| Polish | 16 | 5.7% |
| Scottish | 4 | 1.4% |
| Welsh | 11 | 3.9% | View All 11 Rows |
Immigrants in Manns Choice borough
The most numerous immigrant groups reported in Manns Choice borough came from Europe (1 | 0.4%), Germany (1 | 0.4%), and Western Europe (1 | 0.4%), together accounting for 1.1% of all Manns Choice borough residents.
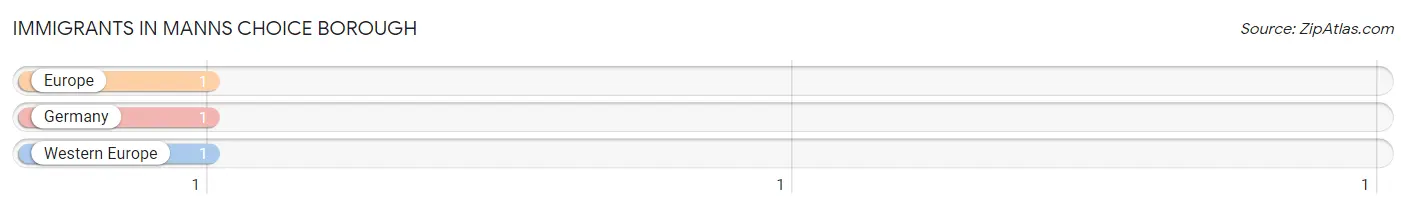
| Immigration Origin | # Population | % Population |
| Europe | 1 | 0.4% |
| Germany | 1 | 0.4% |
| Western Europe | 1 | 0.4% | View All 3 Rows |
Sex and Age in Manns Choice borough
Sex and Age in Manns Choice borough
The most populous age groups in Manns Choice borough are 15 to 19 Years (22 | 14.8%) for men and 35 to 39 Years (16 | 12.3%) for women.
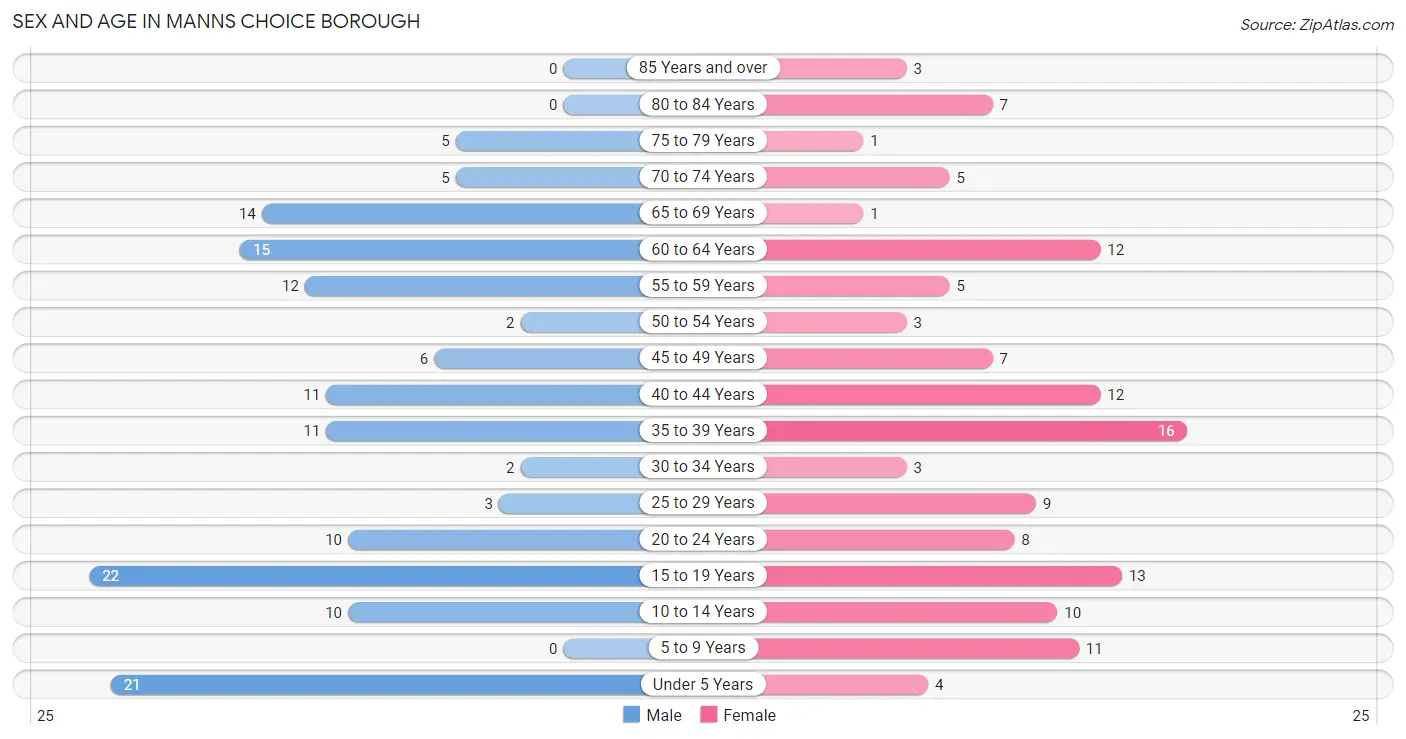
| Age Bracket | Male | Female |
| Under 5 Years | 21 (14.1%) | 4 (3.1%) |
| 5 to 9 Years | 0 (0.0%) | 11 (8.5%) |
| 10 to 14 Years | 10 (6.7%) | 10 (7.7%) |
| 15 to 19 Years | 22 (14.8%) | 13 (10.0%) |
| 20 to 24 Years | 10 (6.7%) | 8 (6.1%) |
| 25 to 29 Years | 3 (2.0%) | 9 (6.9%) |
| 30 to 34 Years | 2 (1.3%) | 3 (2.3%) |
| 35 to 39 Years | 11 (7.4%) | 16 (12.3%) |
| 40 to 44 Years | 11 (7.4%) | 12 (9.2%) |
| 45 to 49 Years | 6 (4.0%) | 7 (5.4%) |
| 50 to 54 Years | 2 (1.3%) | 3 (2.3%) |
| 55 to 59 Years | 12 (8.1%) | 5 (3.8%) |
| 60 to 64 Years | 15 (10.1%) | 12 (9.2%) |
| 65 to 69 Years | 14 (9.4%) | 1 (0.8%) |
| 70 to 74 Years | 5 (3.4%) | 5 (3.8%) |
| 75 to 79 Years | 5 (3.4%) | 1 (0.8%) |
| 80 to 84 Years | 0 (0.0%) | 7 (5.4%) |
| 85 Years and over | 0 (0.0%) | 3 (2.3%) |
| Total | 149 (100.0%) | 130 (100.0%) |
Families and Households in Manns Choice borough
Median Family Size in Manns Choice borough
The median family size in Manns Choice borough is 3.68 persons per family, with married-couple families (48 | 76.2%) accounting for the largest median family size of 3.98 persons per family. On the other hand, single male/father families (3 | 4.8%) represent the smallest median family size with 2.67 persons per family.
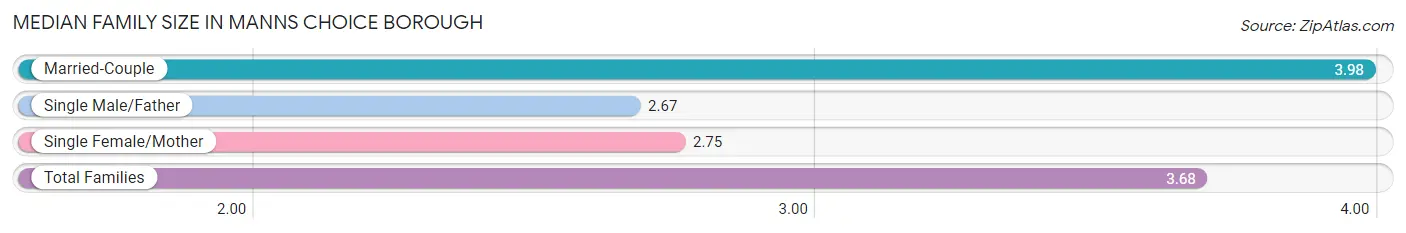
| Family Type | # Families | Family Size |
| Married-Couple | 48 (76.2%) | 3.98 |
| Single Male/Father | 3 (4.8%) | 2.67 |
| Single Female/Mother | 12 (19.1%) | 2.75 |
| Total Families | 63 (100.0%) | 3.68 |
Median Household Size in Manns Choice borough
The median household size in Manns Choice borough is 2.91 persons per household, with married-couple households (48 | 50.0%) accounting for the largest median household size of 3.98 persons per household. non-family households (33 | 34.4%) represent the smallest median household size with 1.12 persons per household.
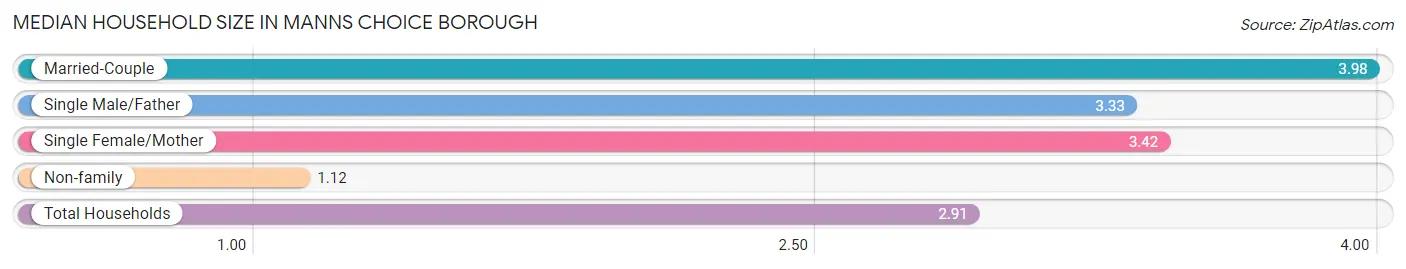
| Household Type | # Households | Household Size |
| Married-Couple | 48 (50.0%) | 3.98 |
| Single Male/Father | 3 (3.1%) | 3.33 |
| Single Female/Mother | 12 (12.5%) | 3.42 |
| Non-family | 33 (34.4%) | 1.12 |
| Total Households | 96 (100.0%) | 2.91 |
Household Size by Marriage Status in Manns Choice borough
Out of a total of 96 households in Manns Choice borough, 63 (65.6%) are family households, while 33 (34.4%) are nonfamily households. The most numerous type of family households are 2-person households, comprising 20, and the most common type of nonfamily households are 1-person households, comprising 29.
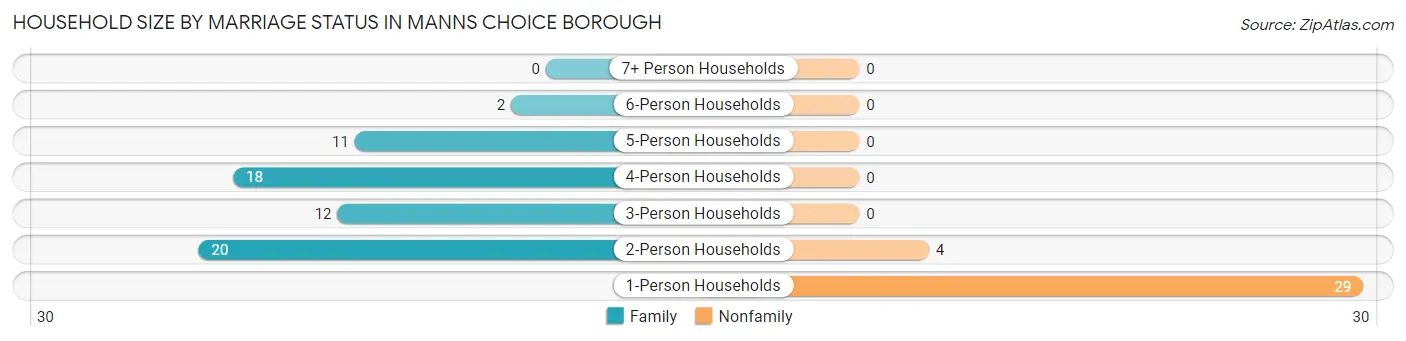
| Household Size | Family Households | Nonfamily Households |
| 1-Person Households | - | 29 (30.2%) |
| 2-Person Households | 20 (20.8%) | 4 (4.2%) |
| 3-Person Households | 12 (12.5%) | 0 (0.0%) |
| 4-Person Households | 18 (18.8%) | 0 (0.0%) |
| 5-Person Households | 11 (11.5%) | 0 (0.0%) |
| 6-Person Households | 2 (2.1%) | 0 (0.0%) |
| 7+ Person Households | 0 (0.0%) | 0 (0.0%) |
| Total | 63 (65.6%) | 33 (34.4%) |
Female Fertility in Manns Choice borough
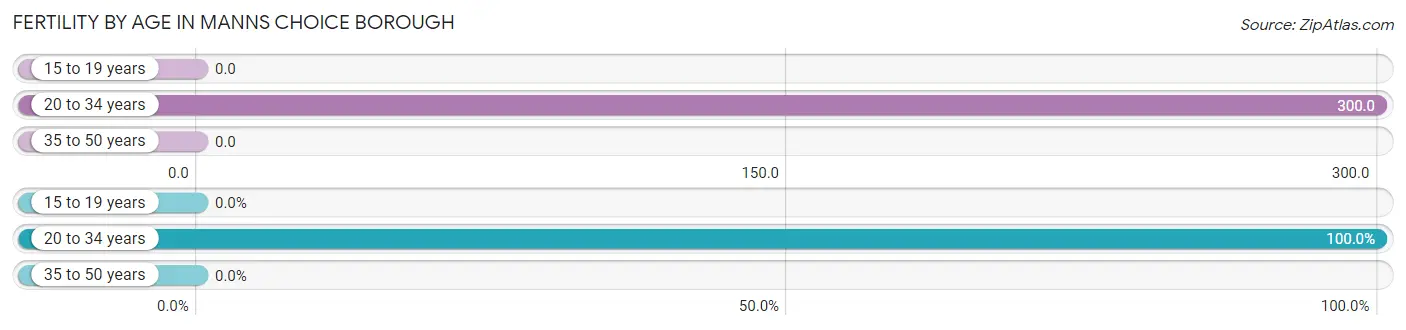
Fertility by Age in Manns Choice borough
Average fertility rate in Manns Choice borough is 88.0 births per 1,000 women. Women in the age bracket of 20 to 34 years have the highest fertility rate with 300.0 births per 1,000 women. Women in the age bracket of 20 to 34 years acount for 100.0% of all women with births.
| Age Bracket | Women with Births | Births / 1,000 Women |
| 15 to 19 years | 0 (0.0%) | 0.0 |
| 20 to 34 years | 6 (100.0%) | 300.0 |
| 35 to 50 years | 0 (0.0%) | 0.0 |
| Total | 6 (100.0%) | 88.0 |
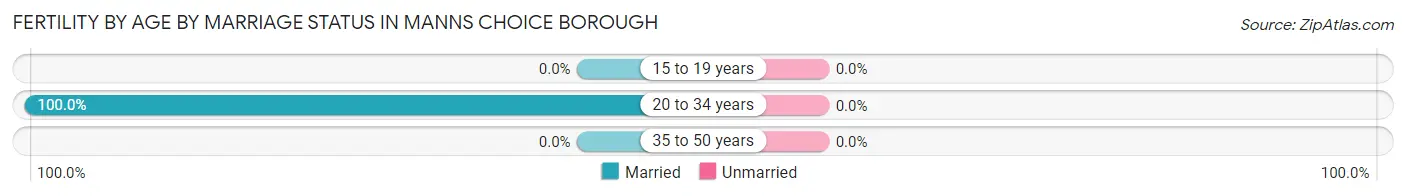
Fertility by Age by Marriage Status in Manns Choice borough
| Age Bracket | Married | Unmarried |
| 15 to 19 years | 0 (0.0%) | 0 (0.0%) |
| 20 to 34 years | 6 (100.0%) | 0 (0.0%) |
| 35 to 50 years | 0 (0.0%) | 0 (0.0%) |
| Total | 6 (100.0%) | 0 (0.0%) |
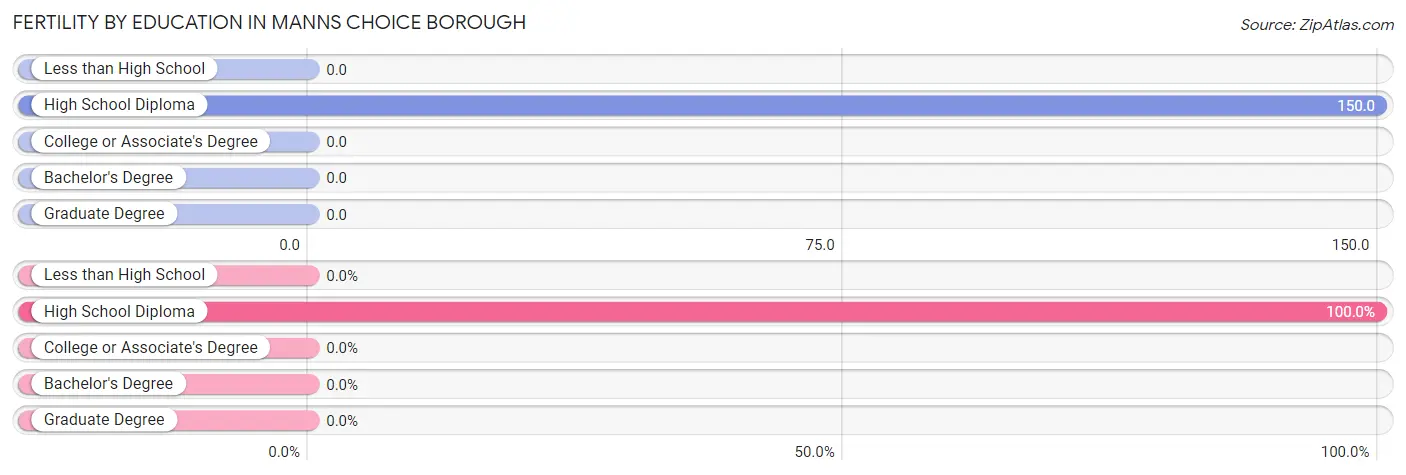
Fertility by Education in Manns Choice borough
| Educational Attainment | Women with Births | Births / 1,000 Women |
| Less than High School | 0 (0.0%) | 0.0 |
| High School Diploma | 6 (100.0%) | 150.0 |
| College or Associate's Degree | 0 (0.0%) | 0.0 |
| Bachelor's Degree | 0 (0.0%) | 0.0 |
| Graduate Degree | 0 (0.0%) | 0.0 |
| Total | 6 (100.0%) | 88.0 |
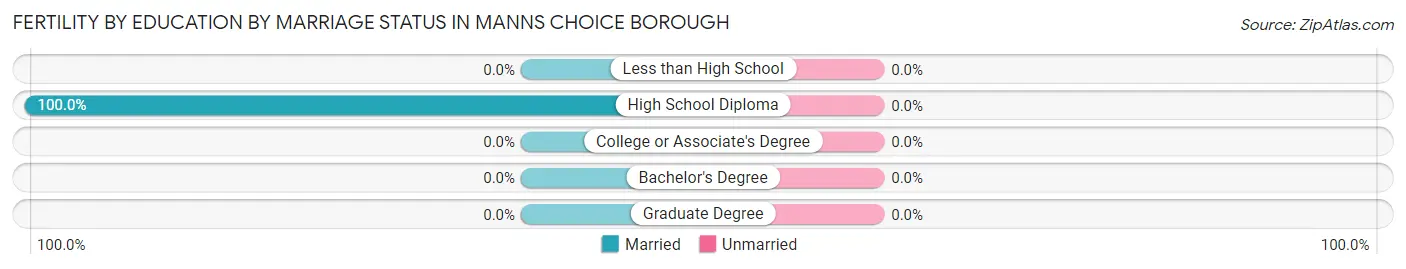
Fertility by Education by Marriage Status in Manns Choice borough
| Educational Attainment | Married | Unmarried |
| Less than High School | 0 (0.0%) | 0 (0.0%) |
| High School Diploma | 6 (100.0%) | 0 (0.0%) |
| College or Associate's Degree | 0 (0.0%) | 0 (0.0%) |
| Bachelor's Degree | 0 (0.0%) | 0 (0.0%) |
| Graduate Degree | 0 (0.0%) | 0 (0.0%) |
| Total | 6 (100.0%) | 0 (0.0%) |
Employment Characteristics in Manns Choice borough
Employment by Class of Employer in Manns Choice borough
Among the 141 employed individuals in Manns Choice borough, private company employees (108 | 76.6%), state government employees (7 | 5.0%), and not-for-profit organizations (6 | 4.3%) make up the most common classes of employment.
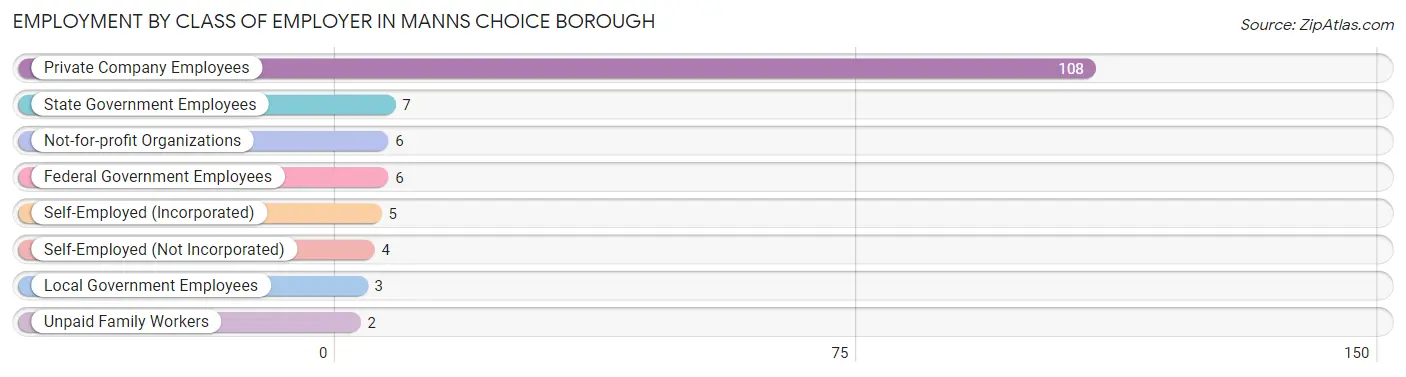
| Employer Class | # Employees | % Employees |
| Private Company Employees | 108 | 76.6% |
| Self-Employed (Incorporated) | 5 | 3.5% |
| Self-Employed (Not Incorporated) | 4 | 2.8% |
| Not-for-profit Organizations | 6 | 4.3% |
| Local Government Employees | 3 | 2.1% |
| State Government Employees | 7 | 5.0% |
| Federal Government Employees | 6 | 4.3% |
| Unpaid Family Workers | 2 | 1.4% |
| Total | 141 | 100.0% |
Employment Status by Age in Manns Choice borough
According to the labor force statistics for Manns Choice borough, out of the total population over 16 years of age (211), 73.9% or 156 individuals are in the labor force, with 9.6% or 15 of them unemployed. The age group with the highest labor force participation rate is 25 to 29 years, with 100.0% or 12 individuals in the labor force. Within the labor force, the 20 to 24 years age range has the highest percentage of unemployed individuals, with 70.0% or 7 of them being unemployed.
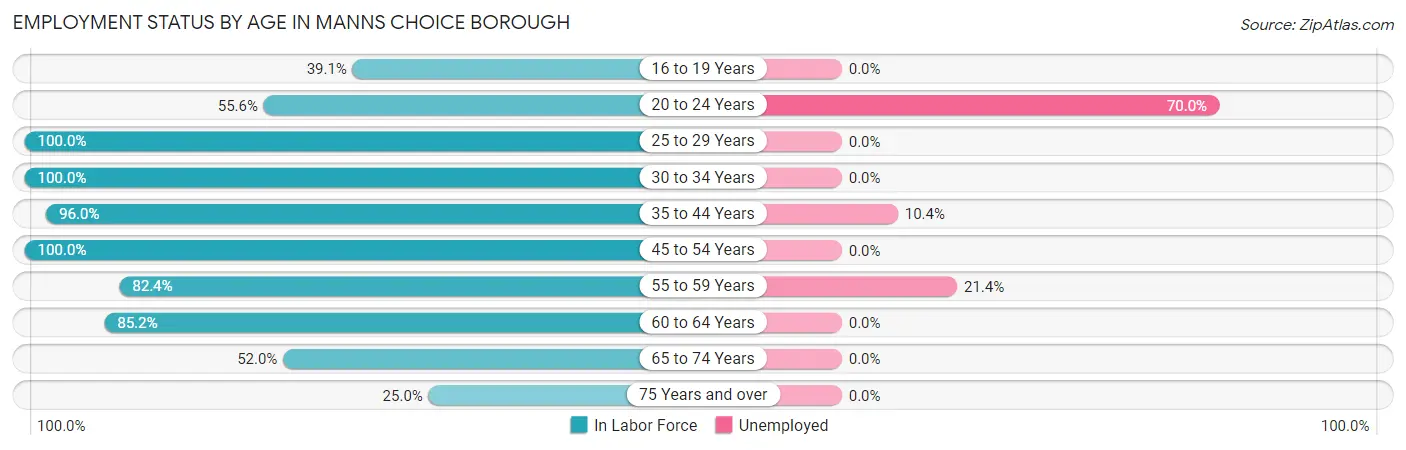
| Age Bracket | In Labor Force | Unemployed |
| 16 to 19 Years | 9 (39.1%) | 0 (0.0%) |
| 20 to 24 Years | 10 (55.6%) | 7 (70.0%) |
| 25 to 29 Years | 12 (100.0%) | 0 (0.0%) |
| 30 to 34 Years | 5 (100.0%) | 0 (0.0%) |
| 35 to 44 Years | 48 (96.0%) | 5 (10.4%) |
| 45 to 54 Years | 18 (100.0%) | 0 (0.0%) |
| 55 to 59 Years | 14 (82.4%) | 3 (21.4%) |
| 60 to 64 Years | 23 (85.2%) | 0 (0.0%) |
| 65 to 74 Years | 13 (52.0%) | 0 (0.0%) |
| 75 Years and over | 4 (25.0%) | 0 (0.0%) |
| Total | 156 (73.9%) | 15 (9.6%) |
Employment Status by Educational Attainment in Manns Choice borough
According to labor force statistics for Manns Choice borough, 93.0% of individuals (120) out of the total population between 25 and 64 years of age (129) are in the labor force, with 6.7% or 8 of them being unemployed. The group with the highest labor force participation rate are those with the educational attainment of less than high school, with 100.0% or 8 individuals in the labor force. Within the labor force, individuals with college / associate degree education have the highest percentage of unemployment, with 17.9% or 5 of them being unemployed.
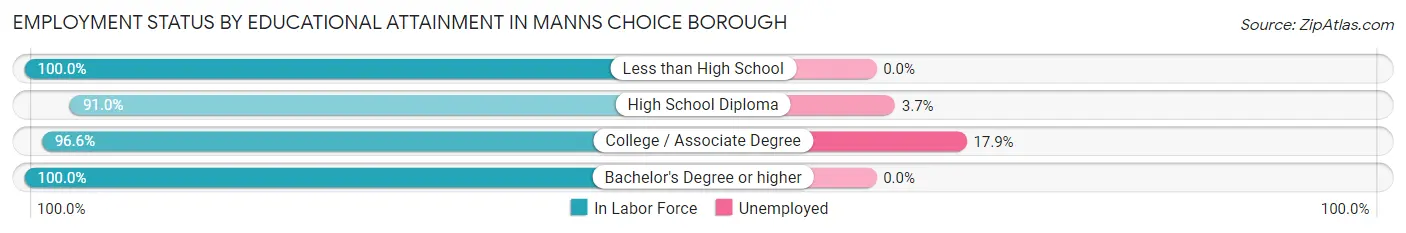
| Educational Attainment | In Labor Force | Unemployed |
| Less than High School | 8 (100.0%) | 0 (0.0%) |
| High School Diploma | 81 (91.0%) | 3 (3.7%) |
| College / Associate Degree | 28 (96.6%) | 5 (17.9%) |
| Bachelor's Degree or higher | 3 (100.0%) | 0 (0.0%) |
| Total | 120 (93.0%) | 9 (6.7%) |
Employment Occupations by Sex in Manns Choice borough
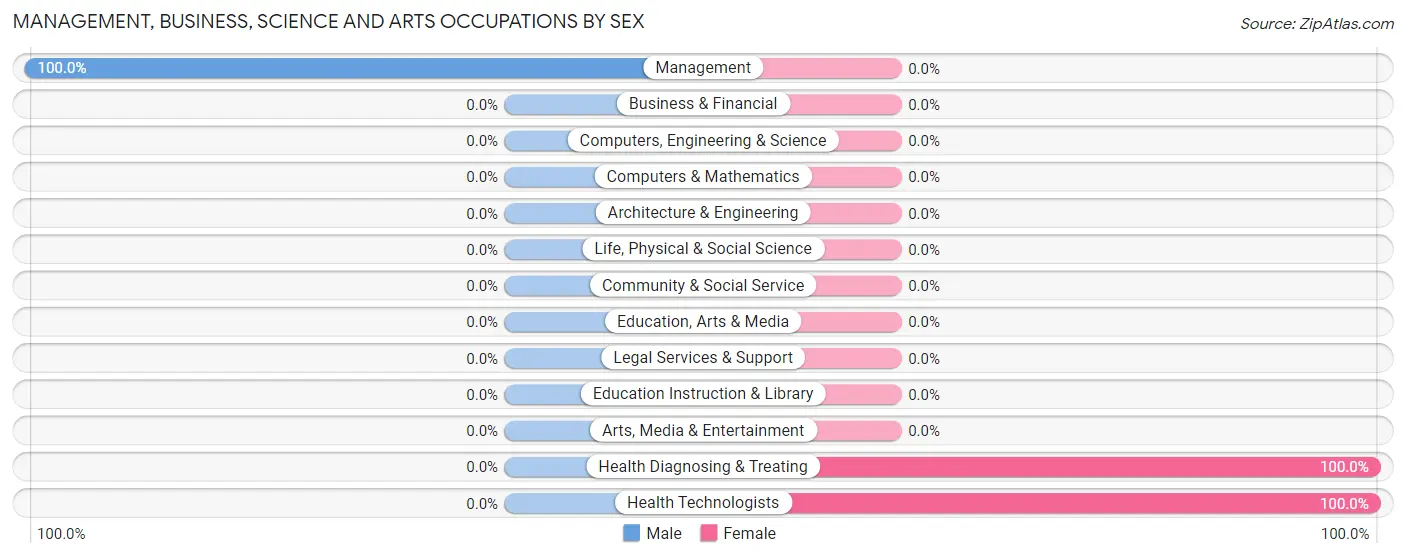
Management, Business, Science and Arts Occupations
The most common Management, Business, Science and Arts occupations in Manns Choice borough are Health Diagnosing & Treating (8 | 5.7%), Management (7 | 5.0%), and Health Technologists (5 | 3.5%).
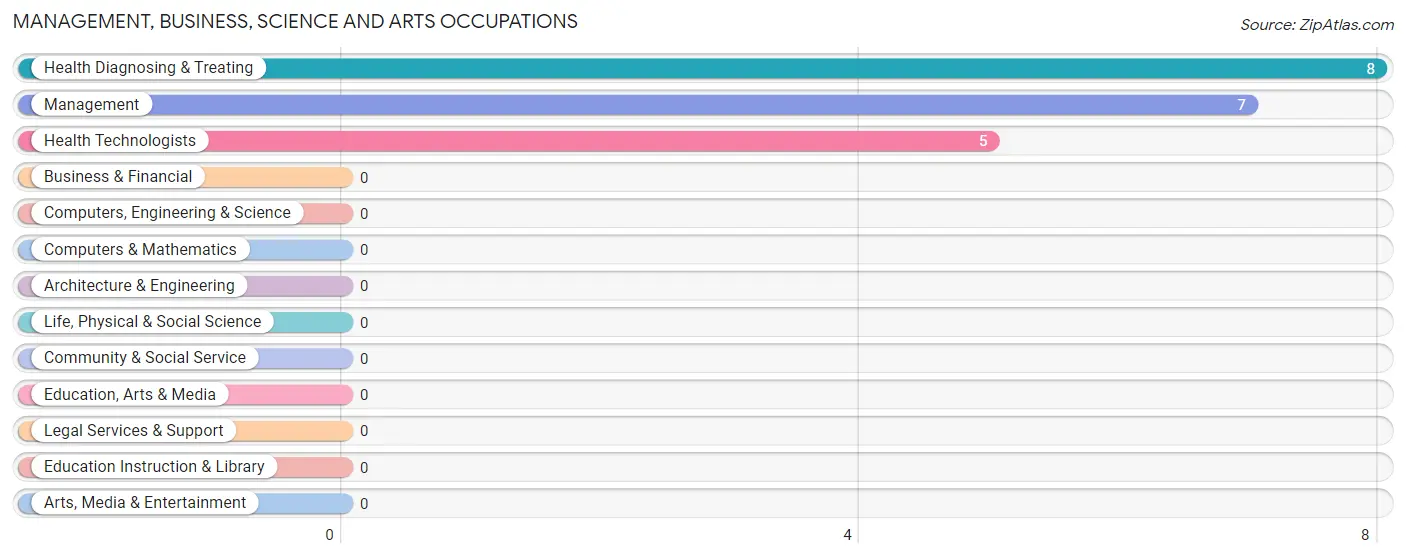
Management, Business, Science and Arts Occupations by Sex
| Occupation | Male | Female |
| Management | 7 (100.0%) | 0 (0.0%) |
| Business & Financial | 0 (0.0%) | 0 (0.0%) |
| Computers, Engineering & Science | 0 (0.0%) | 0 (0.0%) |
| Computers & Mathematics | 0 (0.0%) | 0 (0.0%) |
| Architecture & Engineering | 0 (0.0%) | 0 (0.0%) |
| Life, Physical & Social Science | 0 (0.0%) | 0 (0.0%) |
| Community & Social Service | 0 (0.0%) | 0 (0.0%) |
| Education, Arts & Media | 0 (0.0%) | 0 (0.0%) |
| Legal Services & Support | 0 (0.0%) | 0 (0.0%) |
| Education Instruction & Library | 0 (0.0%) | 0 (0.0%) |
| Arts, Media & Entertainment | 0 (0.0%) | 0 (0.0%) |
| Health Diagnosing & Treating | 0 (0.0%) | 8 (100.0%) |
| Health Technologists | 0 (0.0%) | 5 (100.0%) |
| Total (Category) | 7 (46.7%) | 8 (53.3%) |
| Total (Overall) | 75 (53.2%) | 66 (46.8%) |
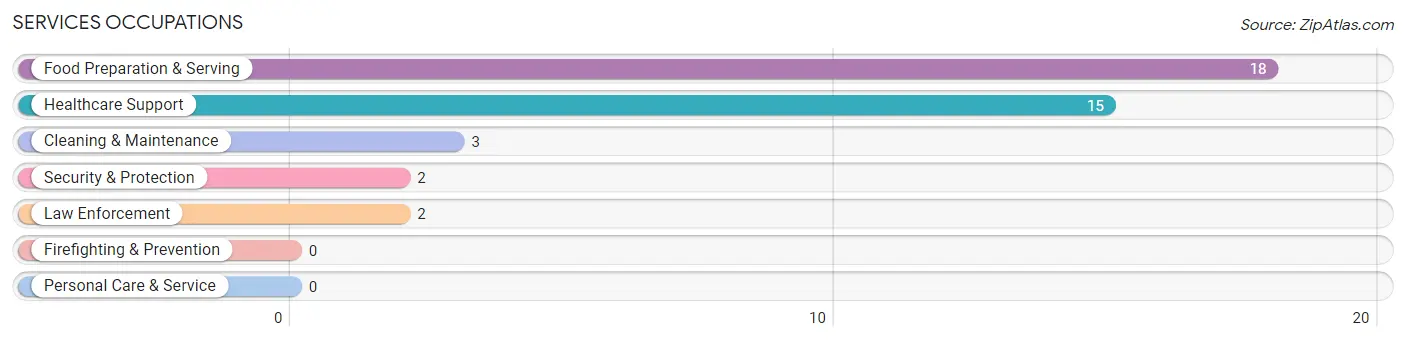
Services Occupations
The most common Services occupations in Manns Choice borough are Food Preparation & Serving (18 | 12.8%), Healthcare Support (15 | 10.6%), Cleaning & Maintenance (3 | 2.1%), Security & Protection (2 | 1.4%), and Law Enforcement (2 | 1.4%).
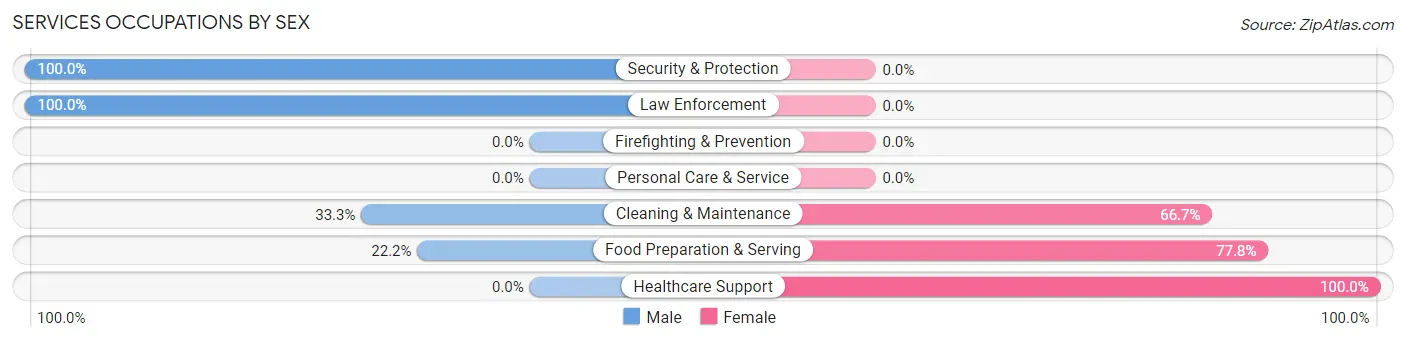
Services Occupations by Sex
Within the Services occupations in Manns Choice borough, the most male-oriented occupations are Security & Protection (100.0%), Law Enforcement (100.0%), and Cleaning & Maintenance (33.3%), while the most female-oriented occupations are Healthcare Support (100.0%), Food Preparation & Serving (77.8%), and Cleaning & Maintenance (66.7%).
| Occupation | Male | Female |
| Healthcare Support | 0 (0.0%) | 15 (100.0%) |
| Security & Protection | 2 (100.0%) | 0 (0.0%) |
| Firefighting & Prevention | 0 (0.0%) | 0 (0.0%) |
| Law Enforcement | 2 (100.0%) | 0 (0.0%) |
| Food Preparation & Serving | 4 (22.2%) | 14 (77.8%) |
| Cleaning & Maintenance | 1 (33.3%) | 2 (66.7%) |
| Personal Care & Service | 0 (0.0%) | 0 (0.0%) |
| Total (Category) | 7 (18.4%) | 31 (81.6%) |
| Total (Overall) | 75 (53.2%) | 66 (46.8%) |
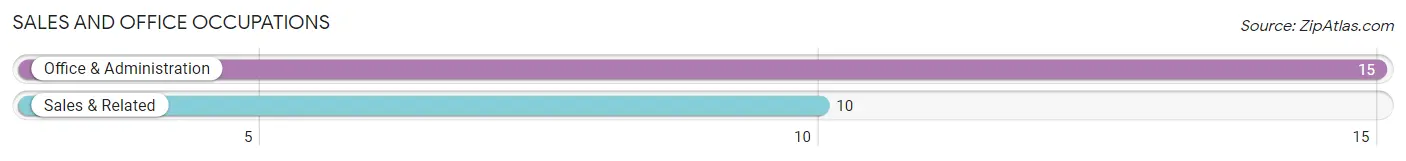
Sales and Office Occupations
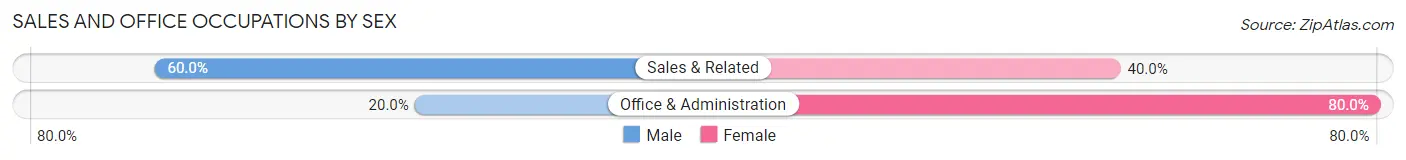
The most common Sales and Office occupations in Manns Choice borough are Office & Administration (15 | 10.6%), and Sales & Related (10 | 7.1%).
Sales and Office Occupations by Sex
| Occupation | Male | Female |
| Sales & Related | 6 (60.0%) | 4 (40.0%) |
| Office & Administration | 3 (20.0%) | 12 (80.0%) |
| Total (Category) | 9 (36.0%) | 16 (64.0%) |
| Total (Overall) | 75 (53.2%) | 66 (46.8%) |
Natural Resources, Construction and Maintenance Occupations
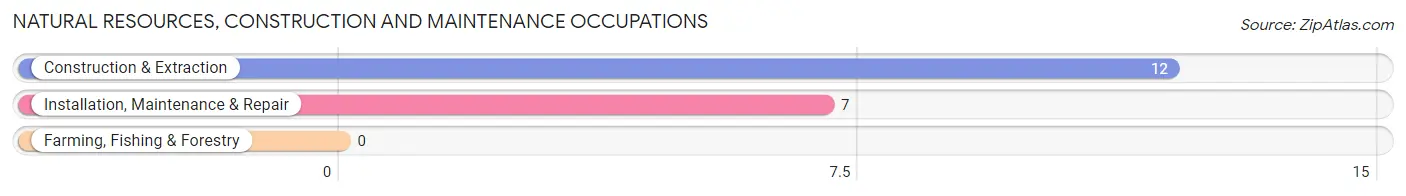
The most common Natural Resources, Construction and Maintenance occupations in Manns Choice borough are Construction & Extraction (12 | 8.5%), and Installation, Maintenance & Repair (7 | 5.0%).
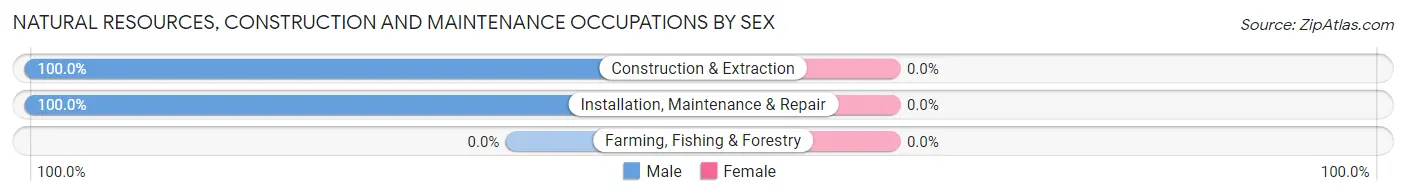
Natural Resources, Construction and Maintenance Occupations by Sex
| Occupation | Male | Female |
| Farming, Fishing & Forestry | 0 (0.0%) | 0 (0.0%) |
| Construction & Extraction | 12 (100.0%) | 0 (0.0%) |
| Installation, Maintenance & Repair | 7 (100.0%) | 0 (0.0%) |
| Total (Category) | 19 (100.0%) | 0 (0.0%) |
| Total (Overall) | 75 (53.2%) | 66 (46.8%) |
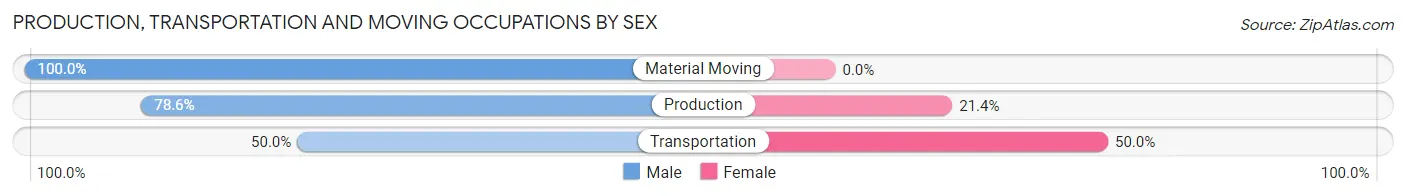
Production, Transportation and Moving Occupations
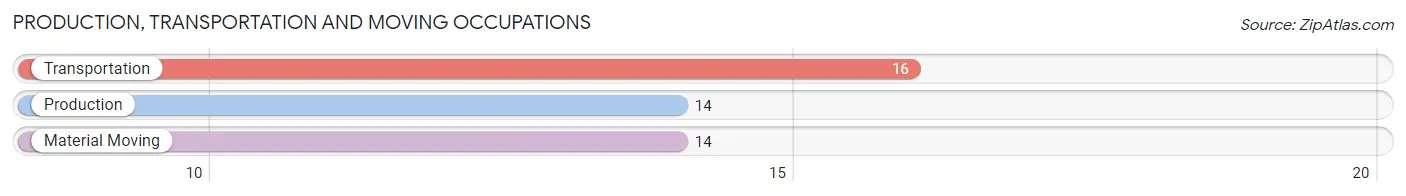
The most common Production, Transportation and Moving occupations in Manns Choice borough are Transportation (16 | 11.4%), Production (14 | 9.9%), and Material Moving (14 | 9.9%).
Production, Transportation and Moving Occupations by Sex
| Occupation | Male | Female |
| Production | 11 (78.6%) | 3 (21.4%) |
| Transportation | 8 (50.0%) | 8 (50.0%) |
| Material Moving | 14 (100.0%) | 0 (0.0%) |
| Total (Category) | 33 (75.0%) | 11 (25.0%) |
| Total (Overall) | 75 (53.2%) | 66 (46.8%) |
Employment Industries by Sex in Manns Choice borough
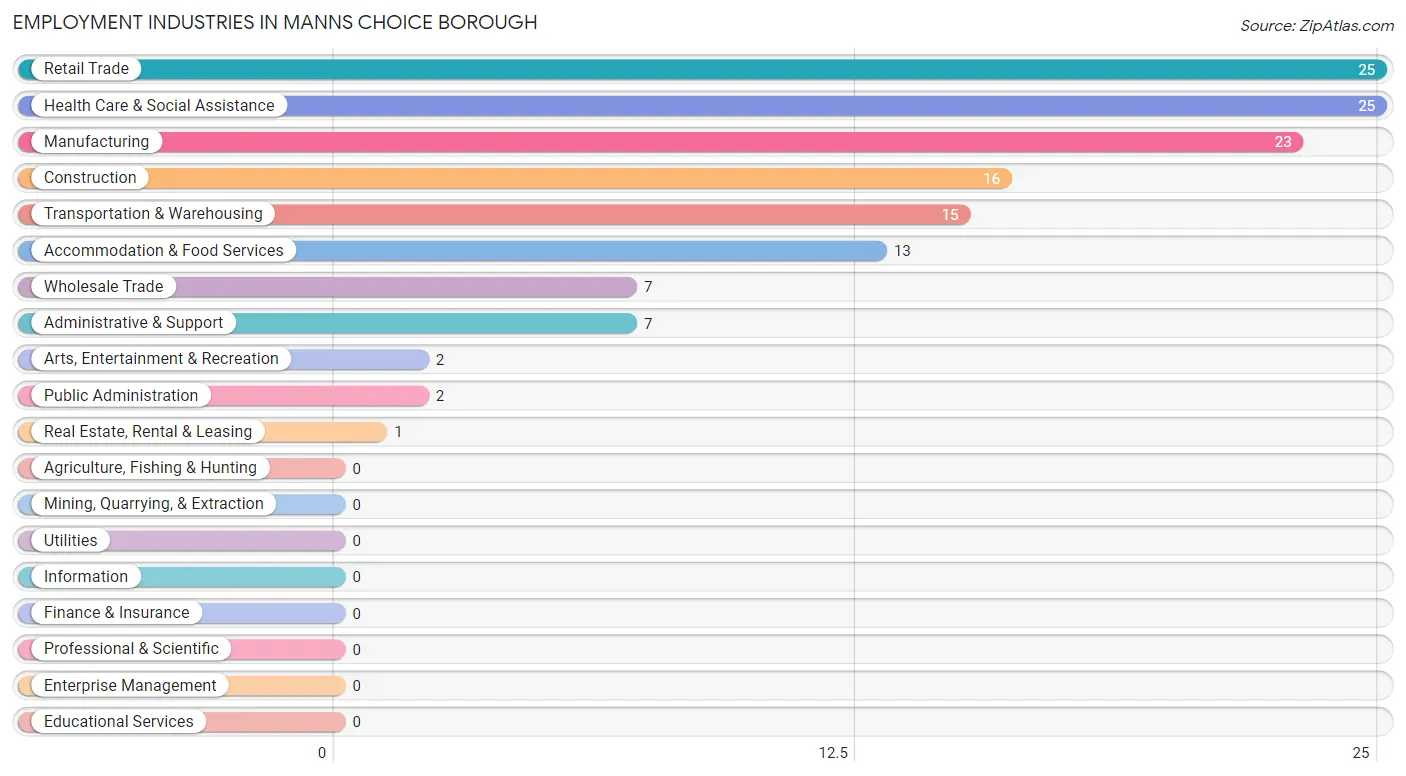
Employment Industries in Manns Choice borough
The major employment industries in Manns Choice borough include Retail Trade (25 | 17.7%), Health Care & Social Assistance (25 | 17.7%), Manufacturing (23 | 16.3%), Construction (16 | 11.4%), and Transportation & Warehousing (15 | 10.6%).
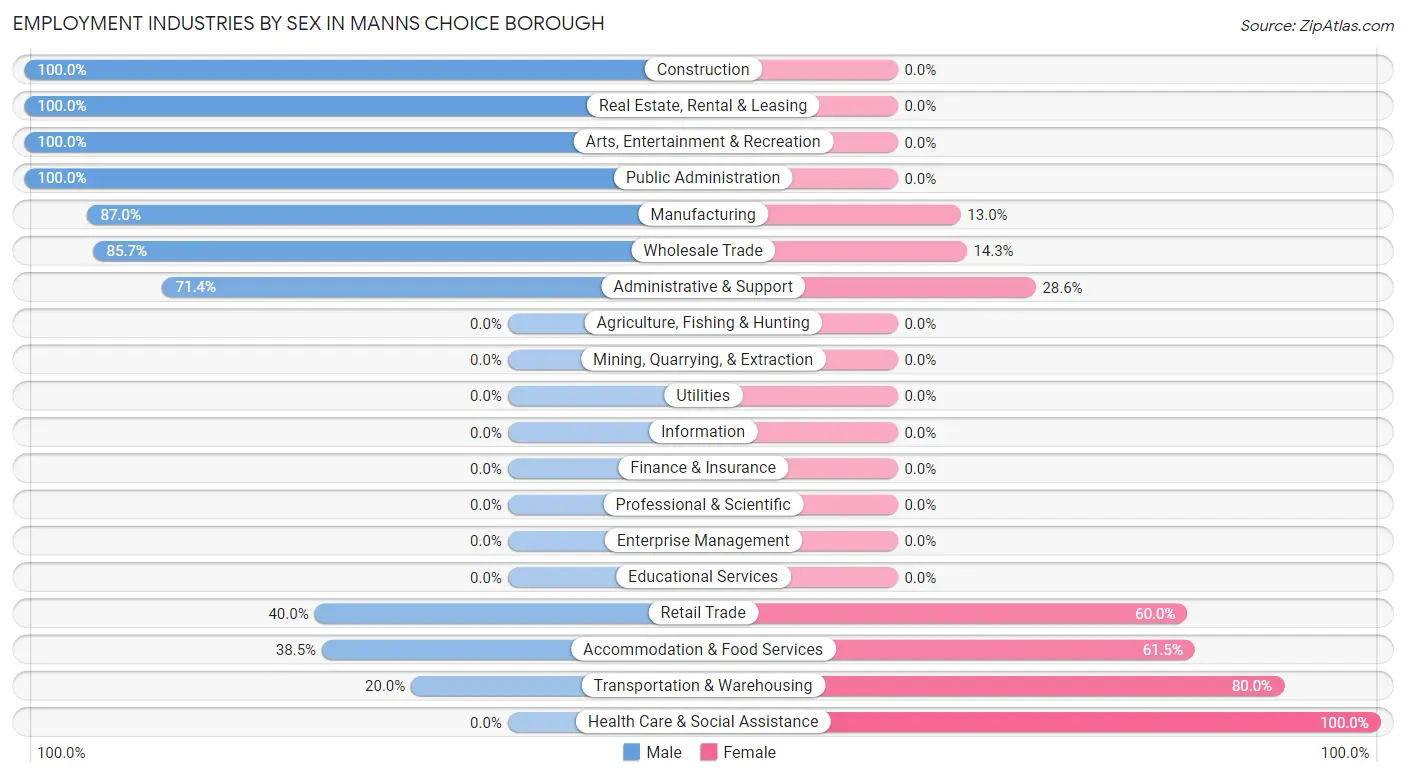
Employment Industries by Sex in Manns Choice borough
The Manns Choice borough industries that see more men than women are Construction (100.0%), Real Estate, Rental & Leasing (100.0%), and Arts, Entertainment & Recreation (100.0%), whereas the industries that tend to have a higher number of women are Health Care & Social Assistance (100.0%), Transportation & Warehousing (80.0%), and Accommodation & Food Services (61.5%).
| Industry | Male | Female |
| Agriculture, Fishing & Hunting | 0 (0.0%) | 0 (0.0%) |
| Mining, Quarrying, & Extraction | 0 (0.0%) | 0 (0.0%) |
| Construction | 16 (100.0%) | 0 (0.0%) |
| Manufacturing | 20 (87.0%) | 3 (13.0%) |
| Wholesale Trade | 6 (85.7%) | 1 (14.3%) |
| Retail Trade | 10 (40.0%) | 15 (60.0%) |
| Transportation & Warehousing | 3 (20.0%) | 12 (80.0%) |
| Utilities | 0 (0.0%) | 0 (0.0%) |
| Information | 0 (0.0%) | 0 (0.0%) |
| Finance & Insurance | 0 (0.0%) | 0 (0.0%) |
| Real Estate, Rental & Leasing | 1 (100.0%) | 0 (0.0%) |
| Professional & Scientific | 0 (0.0%) | 0 (0.0%) |
| Enterprise Management | 0 (0.0%) | 0 (0.0%) |
| Administrative & Support | 5 (71.4%) | 2 (28.6%) |
| Educational Services | 0 (0.0%) | 0 (0.0%) |
| Health Care & Social Assistance | 0 (0.0%) | 25 (100.0%) |
| Arts, Entertainment & Recreation | 2 (100.0%) | 0 (0.0%) |
| Accommodation & Food Services | 5 (38.5%) | 8 (61.5%) |
| Public Administration | 2 (100.0%) | 0 (0.0%) |
| Total | 75 (53.2%) | 66 (46.8%) |
Education in Manns Choice borough
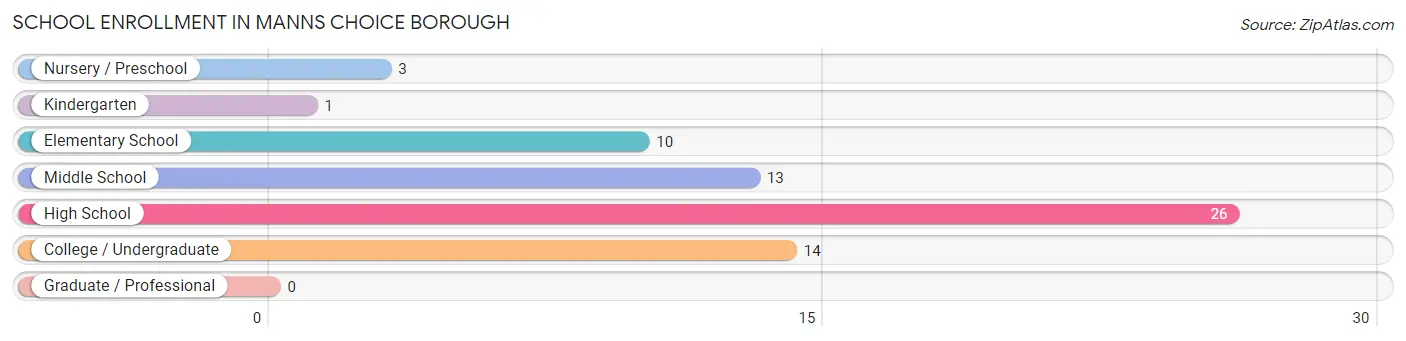
School Enrollment in Manns Choice borough
The most common levels of schooling among the 67 students in Manns Choice borough are high school (26 | 38.8%), college / undergraduate (14 | 20.9%), and middle school (13 | 19.4%).
| School Level | # Students | % Students |
| Nursery / Preschool | 3 | 4.5% |
| Kindergarten | 1 | 1.5% |
| Elementary School | 10 | 14.9% |
| Middle School | 13 | 19.4% |
| High School | 26 | 38.8% |
| College / Undergraduate | 14 | 20.9% |
| Graduate / Professional | 0 | 0.0% |
| Total | 67 | 100.0% |
School Enrollment by Age by Funding Source in Manns Choice borough
Out of a total of 67 students who are enrolled in schools in Manns Choice borough, 8 (11.9%) attend a private institution, while the remaining 59 (88.1%) are enrolled in public schools. The age group of 18 to 19 year olds has the highest likelihood of being enrolled in private schools, with 6 (35.3% in the age bracket) enrolled. Conversely, the age group of 3 to 4 year olds has the lowest likelihood of being enrolled in a private school, with 3 (100.0% in the age bracket) attending a public institution.
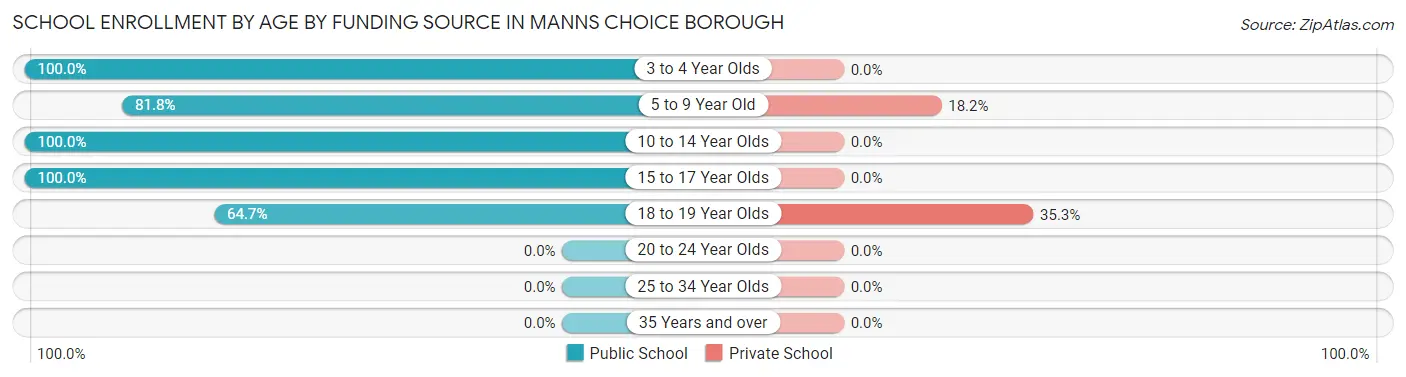
| Age Bracket | Public School | Private School |
| 3 to 4 Year Olds | 3 (100.0%) | 0 (0.0%) |
| 5 to 9 Year Old | 9 (81.8%) | 2 (18.2%) |
| 10 to 14 Year Olds | 20 (100.0%) | 0 (0.0%) |
| 15 to 17 Year Olds | 16 (100.0%) | 0 (0.0%) |
| 18 to 19 Year Olds | 11 (64.7%) | 6 (35.3%) |
| 20 to 24 Year Olds | 0 (0.0%) | 0 (0.0%) |
| 25 to 34 Year Olds | 0 (0.0%) | 0 (0.0%) |
| 35 Years and over | 0 (0.0%) | 0 (0.0%) |
| Total | 59 (88.1%) | 8 (11.9%) |
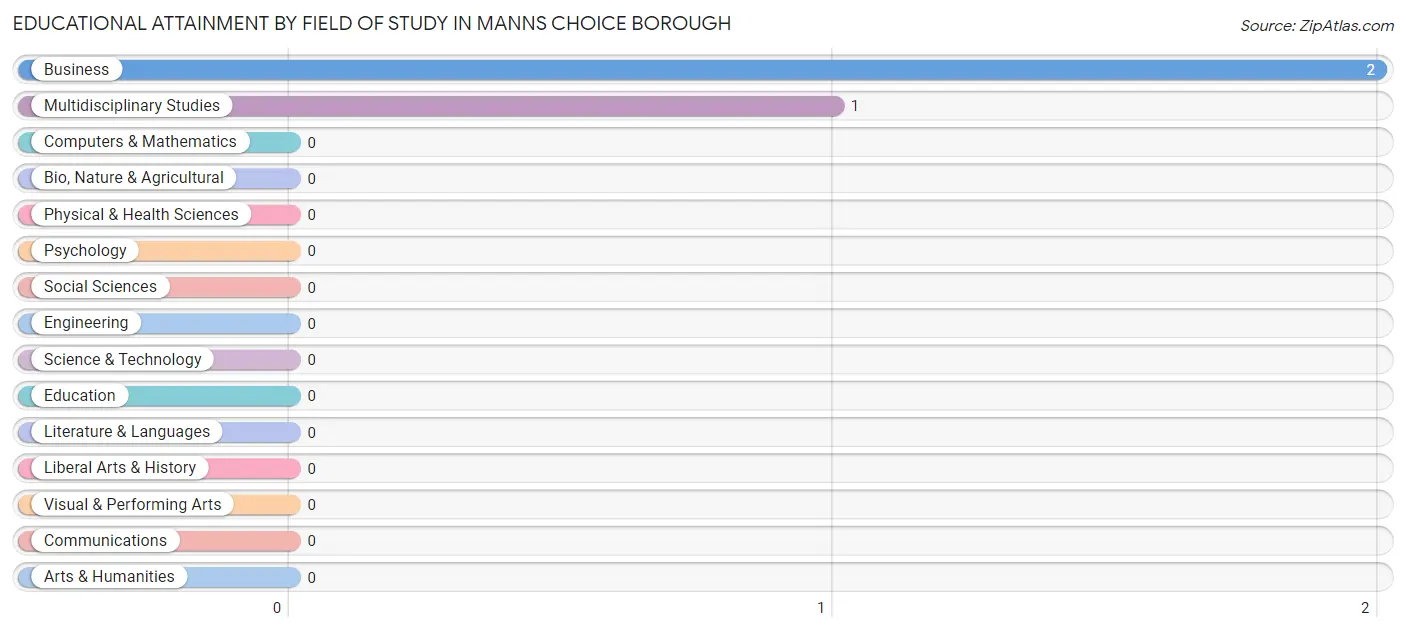
Educational Attainment by Field of Study in Manns Choice borough
Business (2 | 66.7%), and multidisciplinary studies (1 | 33.3%) are the most common fields of study among 3 individuals in Manns Choice borough who have obtained a bachelor's degree or higher.
| Field of Study | # Graduates | % Graduates |
| Computers & Mathematics | 0 | 0.0% |
| Bio, Nature & Agricultural | 0 | 0.0% |
| Physical & Health Sciences | 0 | 0.0% |
| Psychology | 0 | 0.0% |
| Social Sciences | 0 | 0.0% |
| Engineering | 0 | 0.0% |
| Multidisciplinary Studies | 1 | 33.3% |
| Science & Technology | 0 | 0.0% |
| Business | 2 | 66.7% |
| Education | 0 | 0.0% |
| Literature & Languages | 0 | 0.0% |
| Liberal Arts & History | 0 | 0.0% |
| Visual & Performing Arts | 0 | 0.0% |
| Communications | 0 | 0.0% |
| Arts & Humanities | 0 | 0.0% |
| Total | 3 | 100.0% |
Transportation & Commute in Manns Choice borough
Vehicle Availability by Sex in Manns Choice borough
The most prevalent vehicle ownership categories in Manns Choice borough are males with 2 vehicles (31, accounting for 41.3%) and females with 2 vehicles (29, making up 47.0%).

| Vehicles Available | Male | Female |
| No Vehicle | 2 (2.7%) | 1 (1.5%) |
| 1 Vehicle | 18 (24.0%) | 10 (15.1%) |
| 2 Vehicles | 31 (41.3%) | 29 (43.9%) |
| 3 Vehicles | 12 (16.0%) | 11 (16.7%) |
| 4 Vehicles | 6 (8.0%) | 3 (4.5%) |
| 5 or more Vehicles | 6 (8.0%) | 12 (18.2%) |
| Total | 75 (100.0%) | 66 (100.0%) |
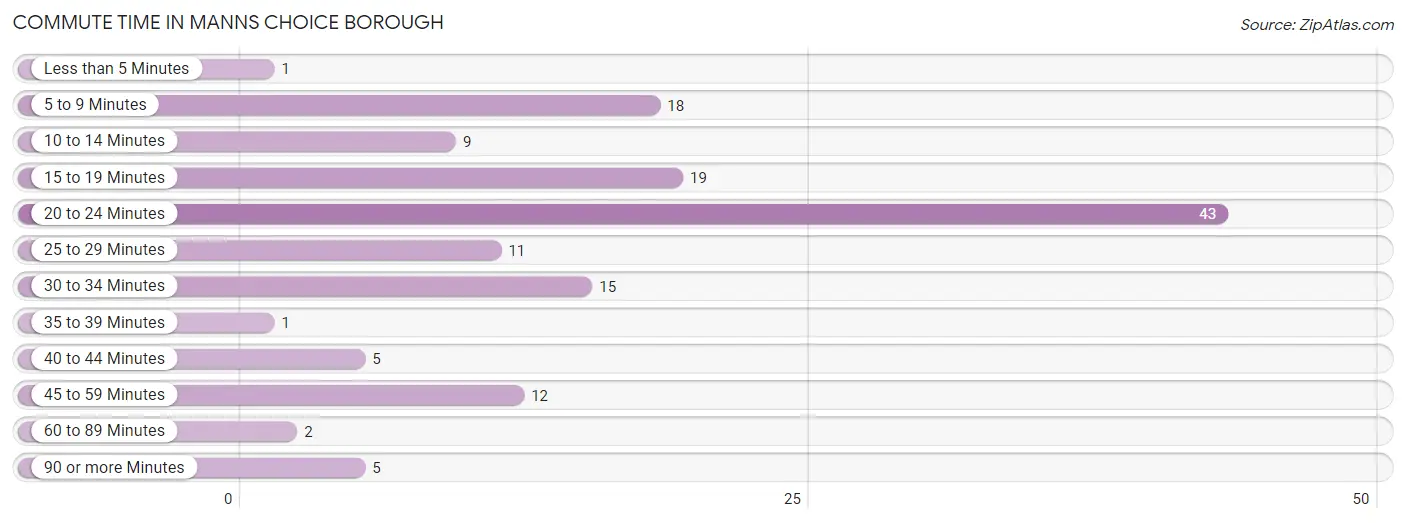
Commute Time in Manns Choice borough
The most frequently occuring commute durations in Manns Choice borough are 20 to 24 minutes (43 commuters, 30.5%), 15 to 19 minutes (19 commuters, 13.5%), and 5 to 9 minutes (18 commuters, 12.8%).
| Commute Time | # Commuters | % Commuters |
| Less than 5 Minutes | 1 | 0.7% |
| 5 to 9 Minutes | 18 | 12.8% |
| 10 to 14 Minutes | 9 | 6.4% |
| 15 to 19 Minutes | 19 | 13.5% |
| 20 to 24 Minutes | 43 | 30.5% |
| 25 to 29 Minutes | 11 | 7.8% |
| 30 to 34 Minutes | 15 | 10.6% |
| 35 to 39 Minutes | 1 | 0.7% |
| 40 to 44 Minutes | 5 | 3.5% |
| 45 to 59 Minutes | 12 | 8.5% |
| 60 to 89 Minutes | 2 | 1.4% |
| 90 or more Minutes | 5 | 3.5% |
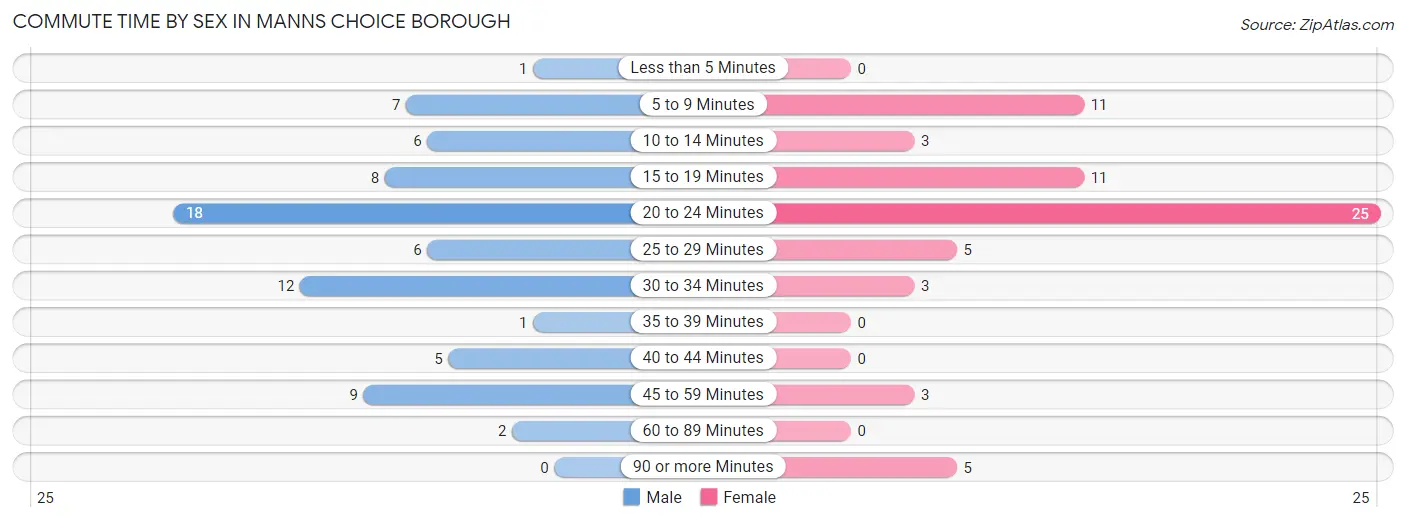
Commute Time by Sex in Manns Choice borough
The most common commute times in Manns Choice borough are 20 to 24 minutes (18 commuters, 24.0%) for males and 20 to 24 minutes (25 commuters, 37.9%) for females.
| Commute Time | Male | Female |
| Less than 5 Minutes | 1 (1.3%) | 0 (0.0%) |
| 5 to 9 Minutes | 7 (9.3%) | 11 (16.7%) |
| 10 to 14 Minutes | 6 (8.0%) | 3 (4.5%) |
| 15 to 19 Minutes | 8 (10.7%) | 11 (16.7%) |
| 20 to 24 Minutes | 18 (24.0%) | 25 (37.9%) |
| 25 to 29 Minutes | 6 (8.0%) | 5 (7.6%) |
| 30 to 34 Minutes | 12 (16.0%) | 3 (4.5%) |
| 35 to 39 Minutes | 1 (1.3%) | 0 (0.0%) |
| 40 to 44 Minutes | 5 (6.7%) | 0 (0.0%) |
| 45 to 59 Minutes | 9 (12.0%) | 3 (4.5%) |
| 60 to 89 Minutes | 2 (2.7%) | 0 (0.0%) |
| 90 or more Minutes | 0 (0.0%) | 5 (7.6%) |
Time of Departure to Work by Sex in Manns Choice borough
The most frequent times of departure to work in Manns Choice borough are 6:00 AM to 6:29 AM (14, 18.7%) for males and 6:30 AM to 6:59 AM (11, 16.7%) for females.
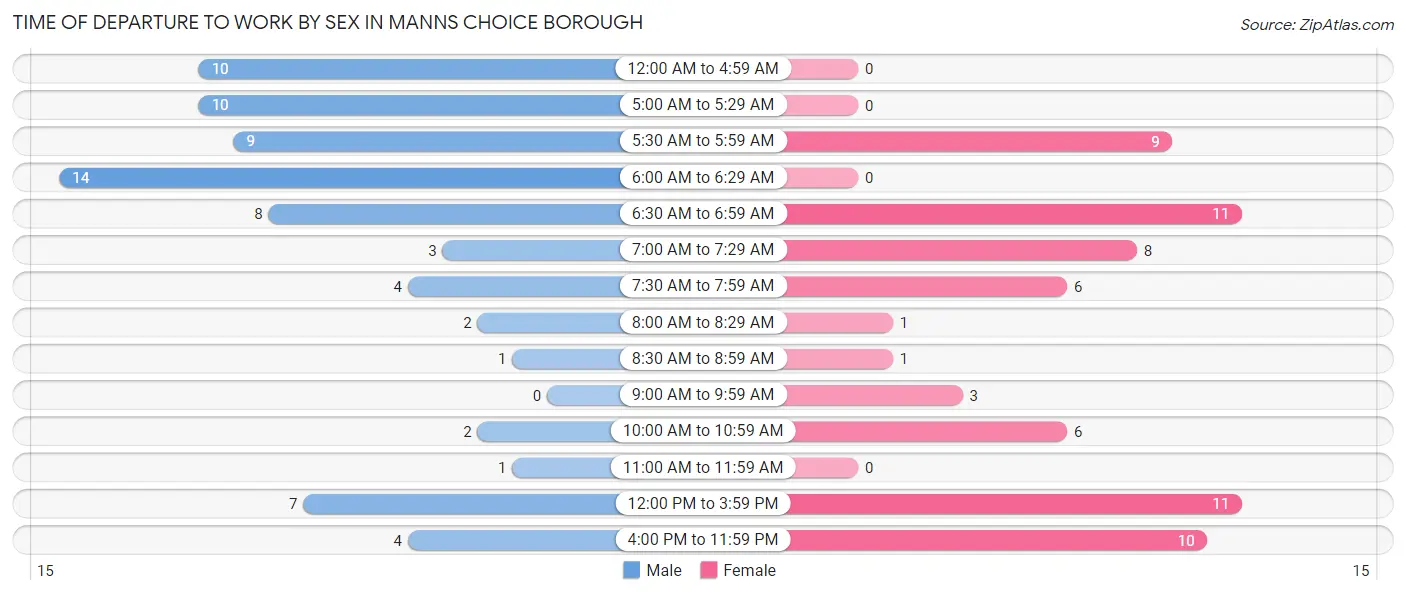
| Time of Departure | Male | Female |
| 12:00 AM to 4:59 AM | 10 (13.3%) | 0 (0.0%) |
| 5:00 AM to 5:29 AM | 10 (13.3%) | 0 (0.0%) |
| 5:30 AM to 5:59 AM | 9 (12.0%) | 9 (13.6%) |
| 6:00 AM to 6:29 AM | 14 (18.7%) | 0 (0.0%) |
| 6:30 AM to 6:59 AM | 8 (10.7%) | 11 (16.7%) |
| 7:00 AM to 7:29 AM | 3 (4.0%) | 8 (12.1%) |
| 7:30 AM to 7:59 AM | 4 (5.3%) | 6 (9.1%) |
| 8:00 AM to 8:29 AM | 2 (2.7%) | 1 (1.5%) |
| 8:30 AM to 8:59 AM | 1 (1.3%) | 1 (1.5%) |
| 9:00 AM to 9:59 AM | 0 (0.0%) | 3 (4.5%) |
| 10:00 AM to 10:59 AM | 2 (2.7%) | 6 (9.1%) |
| 11:00 AM to 11:59 AM | 1 (1.3%) | 0 (0.0%) |
| 12:00 PM to 3:59 PM | 7 (9.3%) | 11 (16.7%) |
| 4:00 PM to 11:59 PM | 4 (5.3%) | 10 (15.1%) |
| Total | 75 (100.0%) | 66 (100.0%) |
Housing Occupancy in Manns Choice borough
Occupancy by Ownership in Manns Choice borough
Of the total 96 dwellings in Manns Choice borough, owner-occupied units account for 71 (74.0%), while renter-occupied units make up 25 (26.0%).
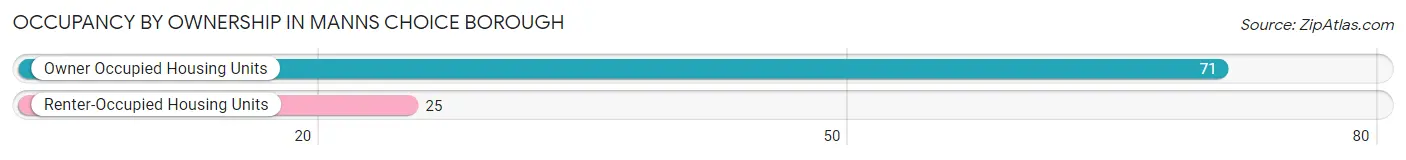
| Occupancy | # Housing Units | % Housing Units |
| Owner Occupied Housing Units | 71 | 74.0% |
| Renter-Occupied Housing Units | 25 | 26.0% |
| Total Occupied Housing Units | 96 | 100.0% |
Occupancy by Household Size in Manns Choice borough
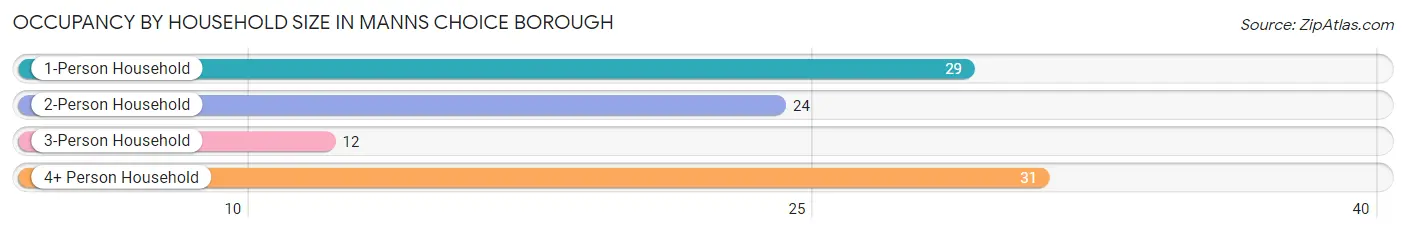
| Household Size | # Housing Units | % Housing Units |
| 1-Person Household | 29 | 30.2% |
| 2-Person Household | 24 | 25.0% |
| 3-Person Household | 12 | 12.5% |
| 4+ Person Household | 31 | 32.3% |
| Total Housing Units | 96 | 100.0% |
Occupancy by Ownership by Household Size in Manns Choice borough
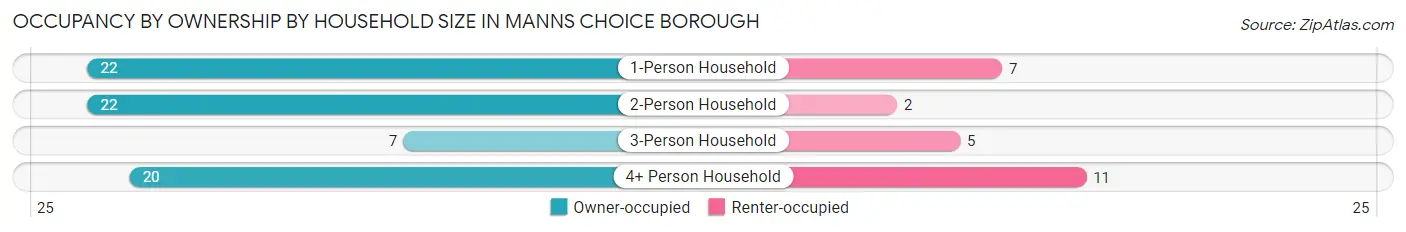
| Household Size | Owner-occupied | Renter-occupied |
| 1-Person Household | 22 (75.9%) | 7 (24.1%) |
| 2-Person Household | 22 (91.7%) | 2 (8.3%) |
| 3-Person Household | 7 (58.3%) | 5 (41.7%) |
| 4+ Person Household | 20 (64.5%) | 11 (35.5%) |
| Total Housing Units | 71 (74.0%) | 25 (26.0%) |
Occupancy by Educational Attainment in Manns Choice borough
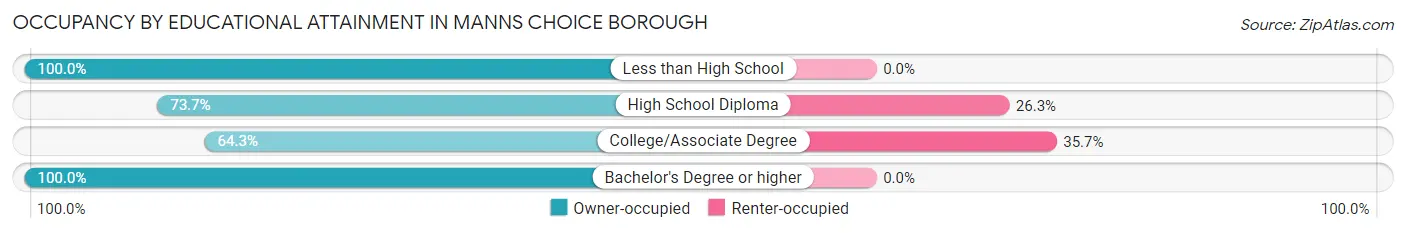
| Household Size | Owner-occupied | Renter-occupied |
| Less than High School | 8 (100.0%) | 0 (0.0%) |
| High School Diploma | 42 (73.7%) | 15 (26.3%) |
| College/Associate Degree | 18 (64.3%) | 10 (35.7%) |
| Bachelor's Degree or higher | 3 (100.0%) | 0 (0.0%) |
Occupancy by Age of Householder in Manns Choice borough
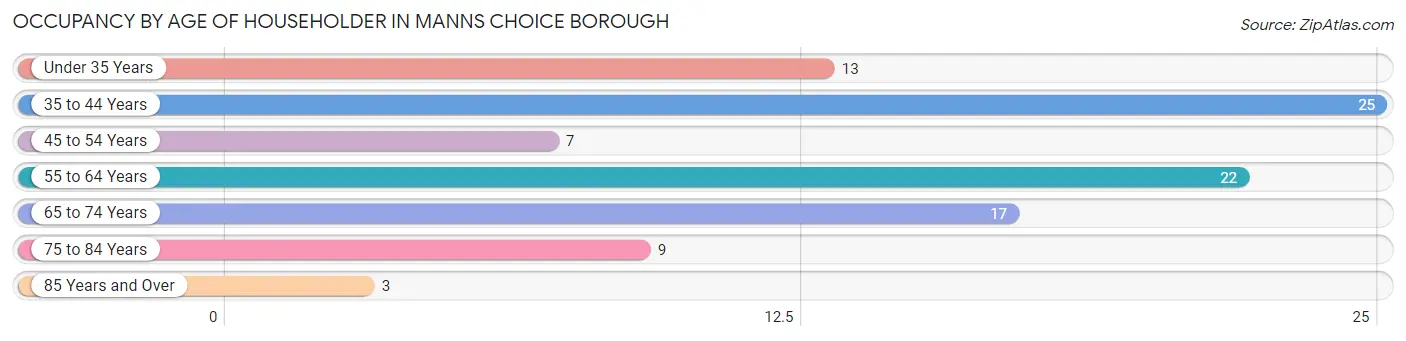
| Age Bracket | # Households | % Households |
| Under 35 Years | 13 | 13.5% |
| 35 to 44 Years | 25 | 26.0% |
| 45 to 54 Years | 7 | 7.3% |
| 55 to 64 Years | 22 | 22.9% |
| 65 to 74 Years | 17 | 17.7% |
| 75 to 84 Years | 9 | 9.4% |
| 85 Years and Over | 3 | 3.1% |
| Total | 96 | 100.0% |
Housing Finances in Manns Choice borough
Median Income by Occupancy in Manns Choice borough
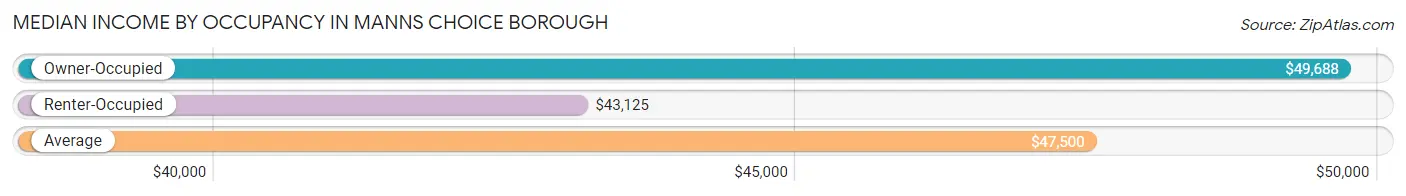
| Occupancy Type | # Households | Median Income |
| Owner-Occupied | 71 (74.0%) | $49,688 |
| Renter-Occupied | 25 (26.0%) | $43,125 |
| Average | 96 (100.0%) | $47,500 |
Occupancy by Householder Income Bracket in Manns Choice borough
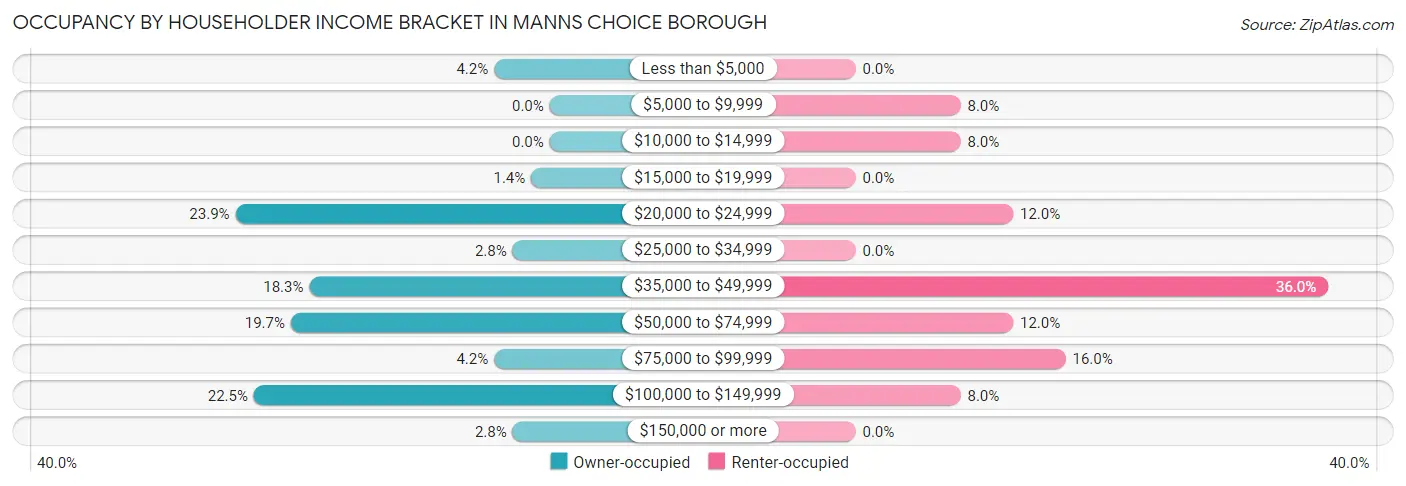
| Income Bracket | Owner-occupied | Renter-occupied |
| Less than $5,000 | 3 (4.2%) | 0 (0.0%) |
| $5,000 to $9,999 | 0 (0.0%) | 2 (8.0%) |
| $10,000 to $14,999 | 0 (0.0%) | 2 (8.0%) |
| $15,000 to $19,999 | 1 (1.4%) | 0 (0.0%) |
| $20,000 to $24,999 | 17 (23.9%) | 3 (12.0%) |
| $25,000 to $34,999 | 2 (2.8%) | 0 (0.0%) |
| $35,000 to $49,999 | 13 (18.3%) | 9 (36.0%) |
| $50,000 to $74,999 | 14 (19.7%) | 3 (12.0%) |
| $75,000 to $99,999 | 3 (4.2%) | 4 (16.0%) |
| $100,000 to $149,999 | 16 (22.5%) | 2 (8.0%) |
| $150,000 or more | 2 (2.8%) | 0 (0.0%) |
| Total | 71 (100.0%) | 25 (100.0%) |
Monthly Housing Cost Tiers in Manns Choice borough
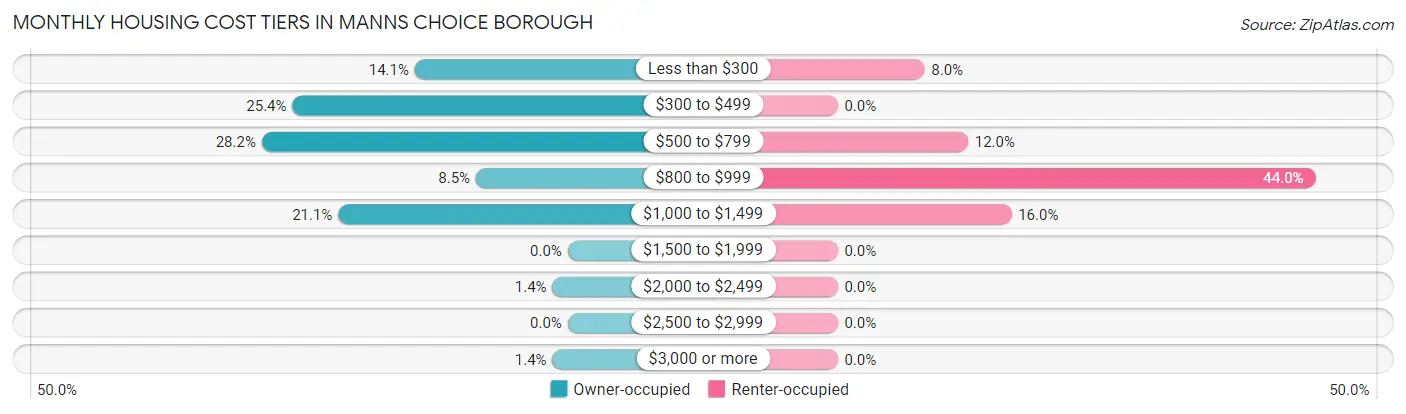
| Monthly Cost | Owner-occupied | Renter-occupied |
| Less than $300 | 10 (14.1%) | 2 (8.0%) |
| $300 to $499 | 18 (25.4%) | 0 (0.0%) |
| $500 to $799 | 20 (28.2%) | 3 (12.0%) |
| $800 to $999 | 6 (8.5%) | 11 (44.0%) |
| $1,000 to $1,499 | 15 (21.1%) | 4 (16.0%) |
| $1,500 to $1,999 | 0 (0.0%) | 0 (0.0%) |
| $2,000 to $2,499 | 1 (1.4%) | 0 (0.0%) |
| $2,500 to $2,999 | 0 (0.0%) | 0 (0.0%) |
| $3,000 or more | 1 (1.4%) | 0 (0.0%) |
| Total | 71 (100.0%) | 25 (100.0%) |
Physical Housing Characteristics in Manns Choice borough
Housing Structures in Manns Choice borough
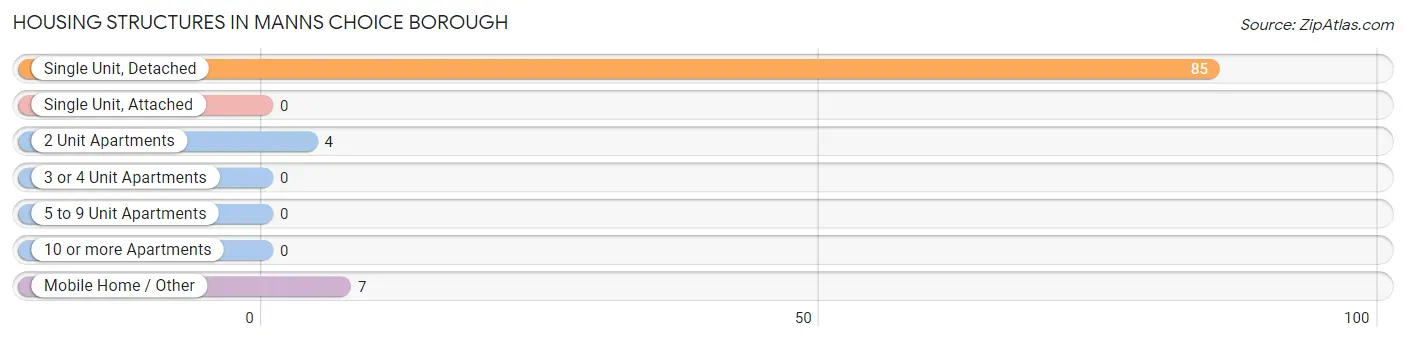
| Structure Type | # Housing Units | % Housing Units |
| Single Unit, Detached | 85 | 88.5% |
| Single Unit, Attached | 0 | 0.0% |
| 2 Unit Apartments | 4 | 4.2% |
| 3 or 4 Unit Apartments | 0 | 0.0% |
| 5 to 9 Unit Apartments | 0 | 0.0% |
| 10 or more Apartments | 0 | 0.0% |
| Mobile Home / Other | 7 | 7.3% |
| Total | 96 | 100.0% |
Housing Structures by Occupancy in Manns Choice borough
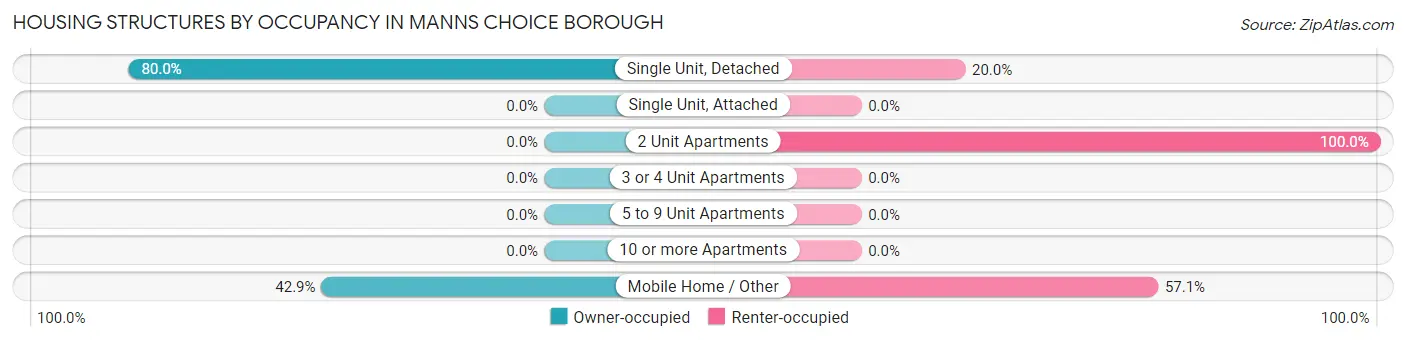
| Structure Type | Owner-occupied | Renter-occupied |
| Single Unit, Detached | 68 (80.0%) | 17 (20.0%) |
| Single Unit, Attached | 0 (0.0%) | 0 (0.0%) |
| 2 Unit Apartments | 0 (0.0%) | 4 (100.0%) |
| 3 or 4 Unit Apartments | 0 (0.0%) | 0 (0.0%) |
| 5 to 9 Unit Apartments | 0 (0.0%) | 0 (0.0%) |
| 10 or more Apartments | 0 (0.0%) | 0 (0.0%) |
| Mobile Home / Other | 3 (42.9%) | 4 (57.1%) |
| Total | 71 (74.0%) | 25 (26.0%) |
Housing Structures by Number of Rooms in Manns Choice borough
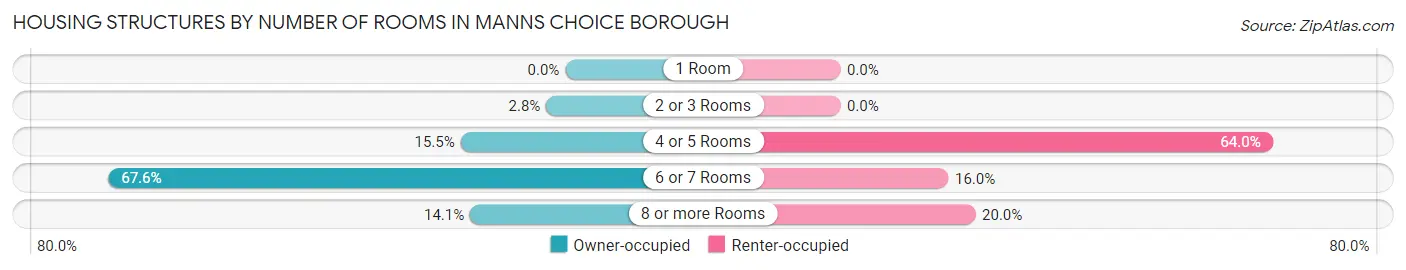
| Number of Rooms | Owner-occupied | Renter-occupied |
| 1 Room | 0 (0.0%) | 0 (0.0%) |
| 2 or 3 Rooms | 2 (2.8%) | 0 (0.0%) |
| 4 or 5 Rooms | 11 (15.5%) | 16 (64.0%) |
| 6 or 7 Rooms | 48 (67.6%) | 4 (16.0%) |
| 8 or more Rooms | 10 (14.1%) | 5 (20.0%) |
| Total | 71 (100.0%) | 25 (100.0%) |
Housing Structure by Heating Type in Manns Choice borough
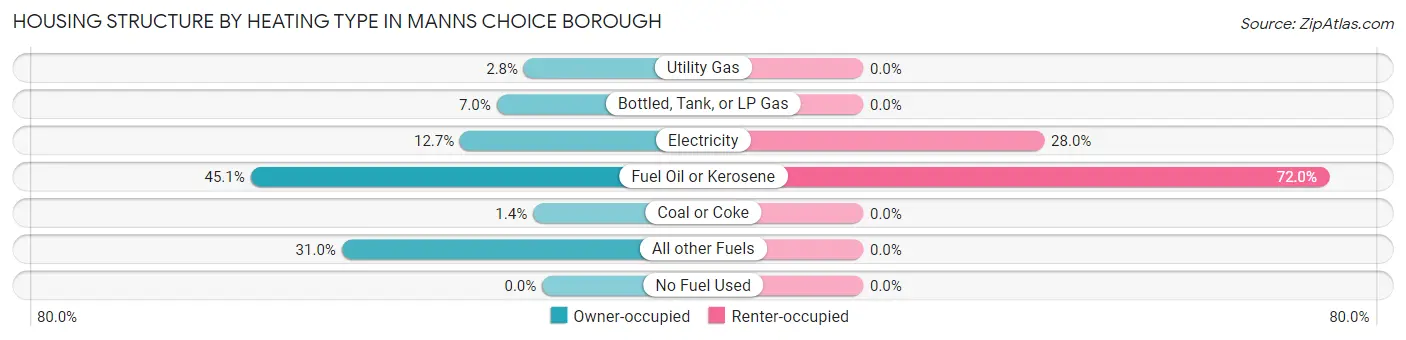
| Heating Type | Owner-occupied | Renter-occupied |
| Utility Gas | 2 (2.8%) | 0 (0.0%) |
| Bottled, Tank, or LP Gas | 5 (7.0%) | 0 (0.0%) |
| Electricity | 9 (12.7%) | 7 (28.0%) |
| Fuel Oil or Kerosene | 32 (45.1%) | 18 (72.0%) |
| Coal or Coke | 1 (1.4%) | 0 (0.0%) |
| All other Fuels | 22 (31.0%) | 0 (0.0%) |
| No Fuel Used | 0 (0.0%) | 0 (0.0%) |
| Total | 71 (100.0%) | 25 (100.0%) |
Household Vehicle Usage in Manns Choice borough
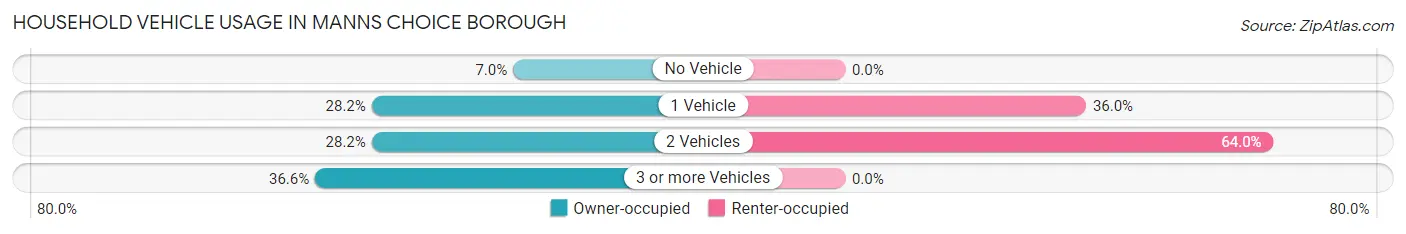
| Vehicles per Household | Owner-occupied | Renter-occupied |
| No Vehicle | 5 (7.0%) | 0 (0.0%) |
| 1 Vehicle | 20 (28.2%) | 9 (36.0%) |
| 2 Vehicles | 20 (28.2%) | 16 (64.0%) |
| 3 or more Vehicles | 26 (36.6%) | 0 (0.0%) |
| Total | 71 (100.0%) | 25 (100.0%) |
Real Estate & Mortgages in Manns Choice borough
Real Estate and Mortgage Overview in Manns Choice borough
| Characteristic | Without Mortgage | With Mortgage |
| Housing Units | 37 | 34 |
| Median Property Value | $88,300 | $125,000 |
| Median Household Income | $39,250 | $2 |
| Monthly Housing Costs | $421 | $1 |
| Real Estate Taxes | $543 | $2 |
Property Value by Mortgage Status in Manns Choice borough
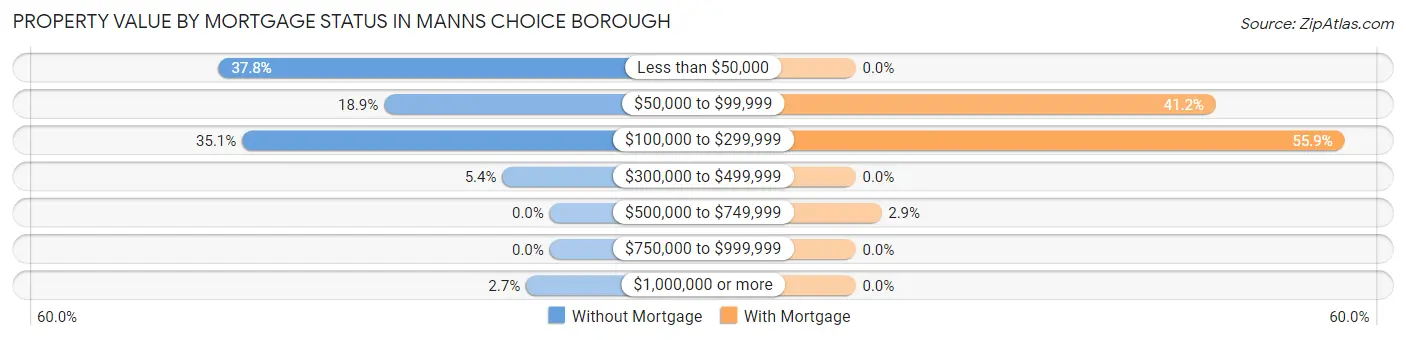
| Property Value | Without Mortgage | With Mortgage |
| Less than $50,000 | 14 (37.8%) | 0 (0.0%) |
| $50,000 to $99,999 | 7 (18.9%) | 14 (41.2%) |
| $100,000 to $299,999 | 13 (35.1%) | 19 (55.9%) |
| $300,000 to $499,999 | 2 (5.4%) | 0 (0.0%) |
| $500,000 to $749,999 | 0 (0.0%) | 1 (2.9%) |
| $750,000 to $999,999 | 0 (0.0%) | 0 (0.0%) |
| $1,000,000 or more | 1 (2.7%) | 0 (0.0%) |
| Total | 37 (100.0%) | 34 (100.0%) |
Household Income by Mortgage Status in Manns Choice borough
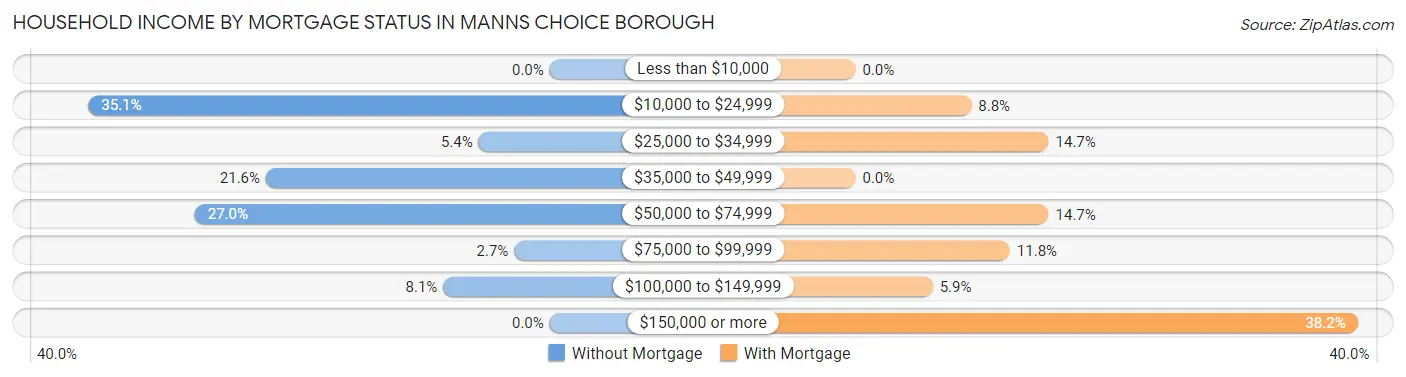
| Household Income | Without Mortgage | With Mortgage |
| Less than $10,000 | 0 (0.0%) | 0 (0.0%) |
| $10,000 to $24,999 | 13 (35.1%) | 3 (8.8%) |
| $25,000 to $34,999 | 2 (5.4%) | 5 (14.7%) |
| $35,000 to $49,999 | 8 (21.6%) | 0 (0.0%) |
| $50,000 to $74,999 | 10 (27.0%) | 5 (14.7%) |
| $75,000 to $99,999 | 1 (2.7%) | 4 (11.8%) |
| $100,000 to $149,999 | 3 (8.1%) | 2 (5.9%) |
| $150,000 or more | 0 (0.0%) | 13 (38.2%) |
| Total | 37 (100.0%) | 34 (100.0%) |
Property Value to Household Income Ratio in Manns Choice borough
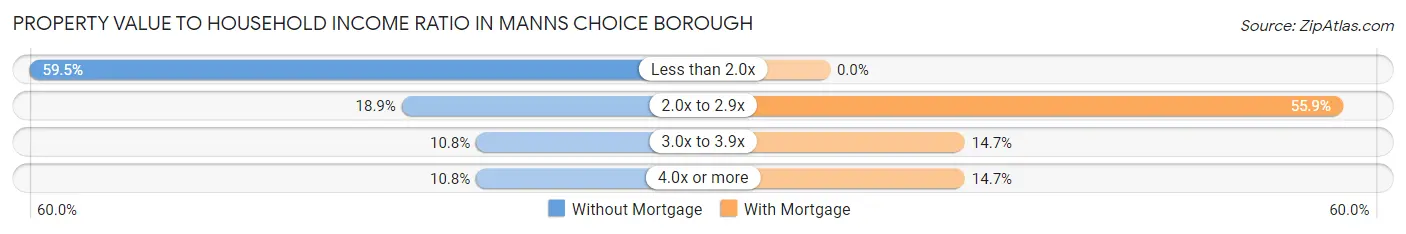
| Value-to-Income Ratio | Without Mortgage | With Mortgage |
| Less than 2.0x | 22 (59.5%) | 0 (0.0%) |
| 2.0x to 2.9x | 7 (18.9%) | 19 (55.9%) |
| 3.0x to 3.9x | 4 (10.8%) | 5 (14.7%) |
| 4.0x or more | 4 (10.8%) | 5 (14.7%) |
| Total | 37 (100.0%) | 34 (100.0%) |
Real Estate Taxes by Mortgage Status in Manns Choice borough
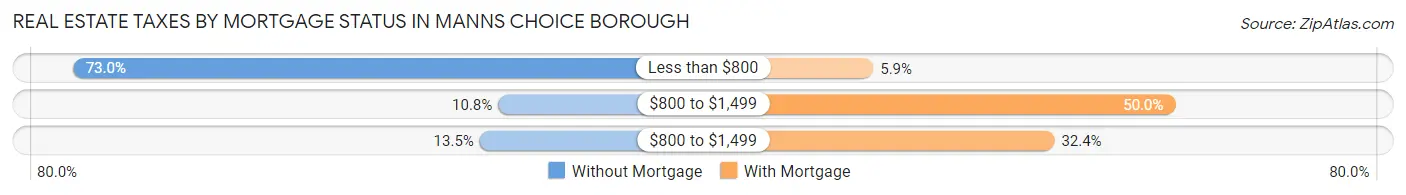
| Property Taxes | Without Mortgage | With Mortgage |
| Less than $800 | 27 (73.0%) | 2 (5.9%) |
| $800 to $1,499 | 4 (10.8%) | 17 (50.0%) |
| $800 to $1,499 | 5 (13.5%) | 11 (32.4%) |
| Total | 37 (100.0%) | 34 (100.0%) |
Health & Disability in Manns Choice borough
Health Insurance Coverage by Age in Manns Choice borough
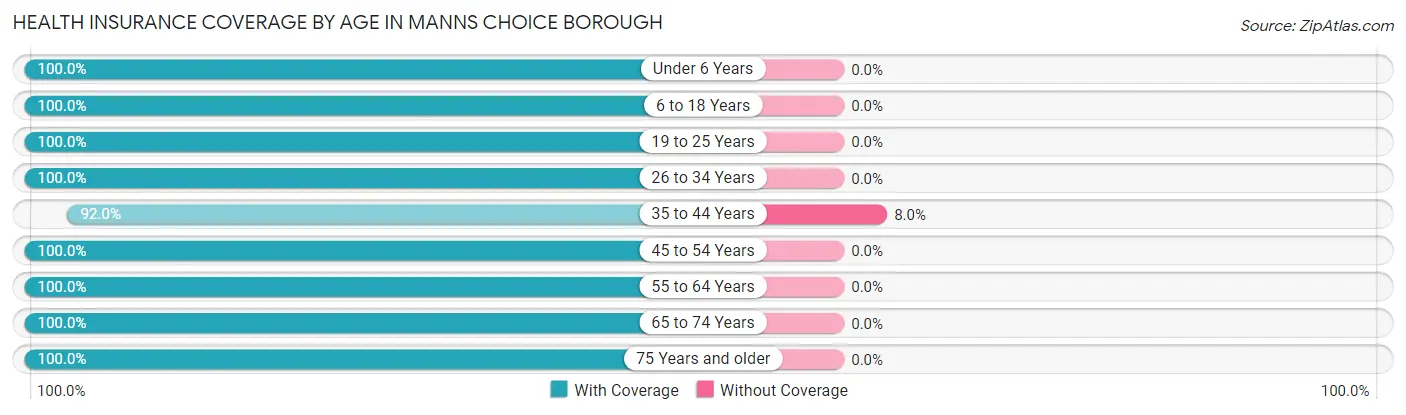
| Age Bracket | With Coverage | Without Coverage |
| Under 6 Years | 25 (100.0%) | 0 (0.0%) |
| 6 to 18 Years | 60 (100.0%) | 0 (0.0%) |
| 19 to 25 Years | 33 (100.0%) | 0 (0.0%) |
| 26 to 34 Years | 8 (100.0%) | 0 (0.0%) |
| 35 to 44 Years | 46 (92.0%) | 4 (8.0%) |
| 45 to 54 Years | 18 (100.0%) | 0 (0.0%) |
| 55 to 64 Years | 44 (100.0%) | 0 (0.0%) |
| 65 to 74 Years | 25 (100.0%) | 0 (0.0%) |
| 75 Years and older | 16 (100.0%) | 0 (0.0%) |
| Total | 275 (98.6%) | 4 (1.4%) |
Health Insurance Coverage by Citizenship Status in Manns Choice borough
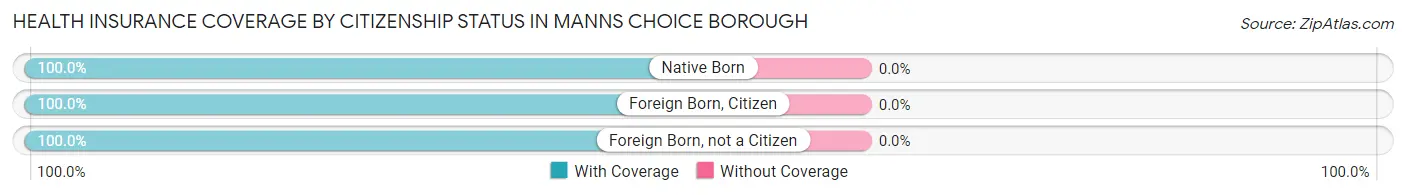
| Citizenship Status | With Coverage | Without Coverage |
| Native Born | 25 (100.0%) | 0 (0.0%) |
| Foreign Born, Citizen | 60 (100.0%) | 0 (0.0%) |
| Foreign Born, not a Citizen | 33 (100.0%) | 0 (0.0%) |
Health Insurance Coverage by Household Income in Manns Choice borough
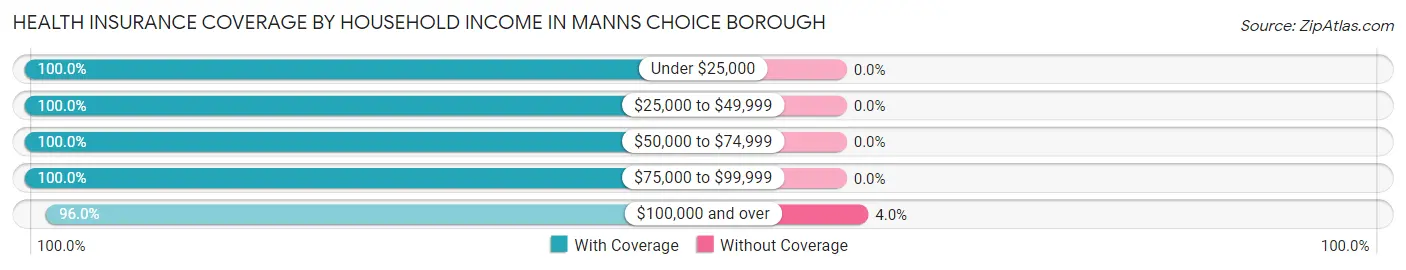
| Household Income | With Coverage | Without Coverage |
| Under $25,000 | 43 (100.0%) | 0 (0.0%) |
| $25,000 to $49,999 | 68 (100.0%) | 0 (0.0%) |
| $50,000 to $74,999 | 48 (100.0%) | 0 (0.0%) |
| $75,000 to $99,999 | 21 (100.0%) | 0 (0.0%) |
| $100,000 and over | 95 (96.0%) | 4 (4.0%) |
Public vs Private Health Insurance Coverage by Age in Manns Choice borough
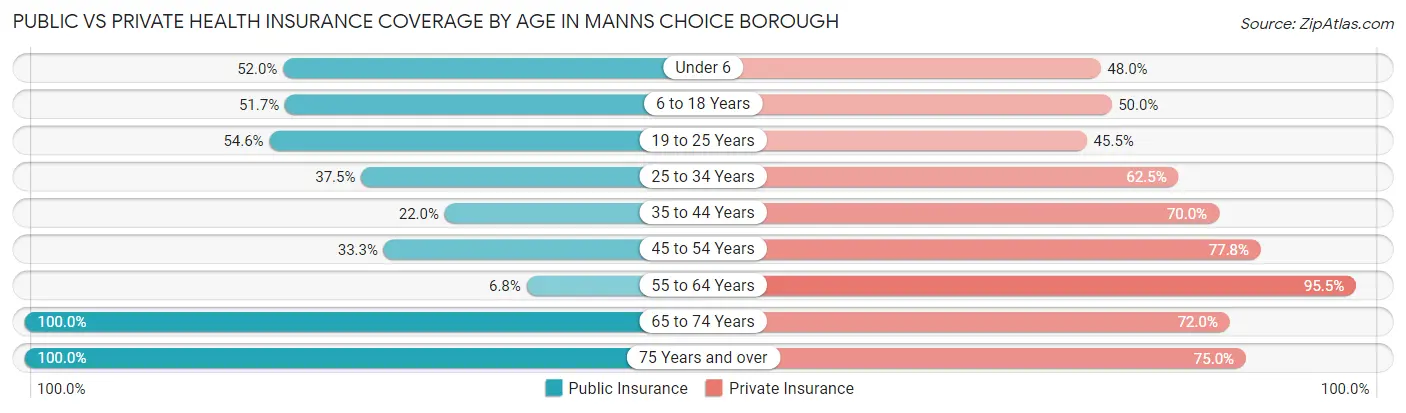
| Age Bracket | Public Insurance | Private Insurance |
| Under 6 | 13 (52.0%) | 12 (48.0%) |
| 6 to 18 Years | 31 (51.7%) | 30 (50.0%) |
| 19 to 25 Years | 18 (54.5%) | 15 (45.5%) |
| 25 to 34 Years | 3 (37.5%) | 5 (62.5%) |
| 35 to 44 Years | 11 (22.0%) | 35 (70.0%) |
| 45 to 54 Years | 6 (33.3%) | 14 (77.8%) |
| 55 to 64 Years | 3 (6.8%) | 42 (95.5%) |
| 65 to 74 Years | 25 (100.0%) | 18 (72.0%) |
| 75 Years and over | 16 (100.0%) | 12 (75.0%) |
| Total | 126 (45.2%) | 183 (65.6%) |
Disability Status by Sex by Age in Manns Choice borough
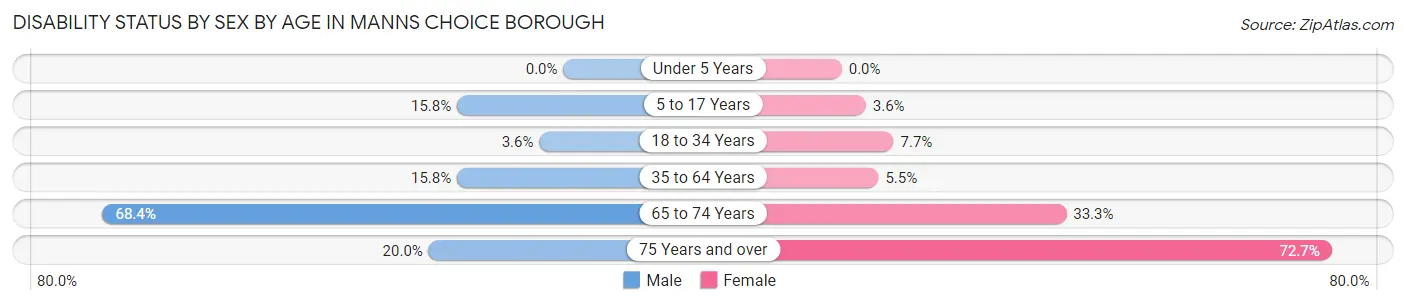
| Age Bracket | Male | Female |
| Under 5 Years | 0 (0.0%) | 0 (0.0%) |
| 5 to 17 Years | 3 (15.8%) | 1 (3.6%) |
| 18 to 34 Years | 1 (3.6%) | 2 (7.7%) |
| 35 to 64 Years | 9 (15.8%) | 3 (5.4%) |
| 65 to 74 Years | 13 (68.4%) | 2 (33.3%) |
| 75 Years and over | 1 (20.0%) | 8 (72.7%) |
Disability Class by Sex by Age in Manns Choice borough
Disability Class: Hearing Difficulty
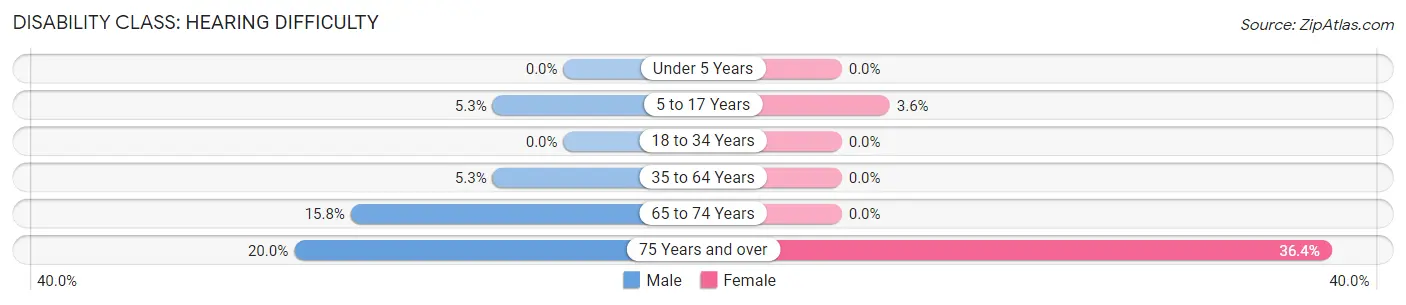
| Age Bracket | Male | Female |
| Under 5 Years | 0 (0.0%) | 0 (0.0%) |
| 5 to 17 Years | 1 (5.3%) | 1 (3.6%) |
| 18 to 34 Years | 0 (0.0%) | 0 (0.0%) |
| 35 to 64 Years | 3 (5.3%) | 0 (0.0%) |
| 65 to 74 Years | 3 (15.8%) | 0 (0.0%) |
| 75 Years and over | 1 (20.0%) | 4 (36.4%) |
Disability Class: Vision Difficulty
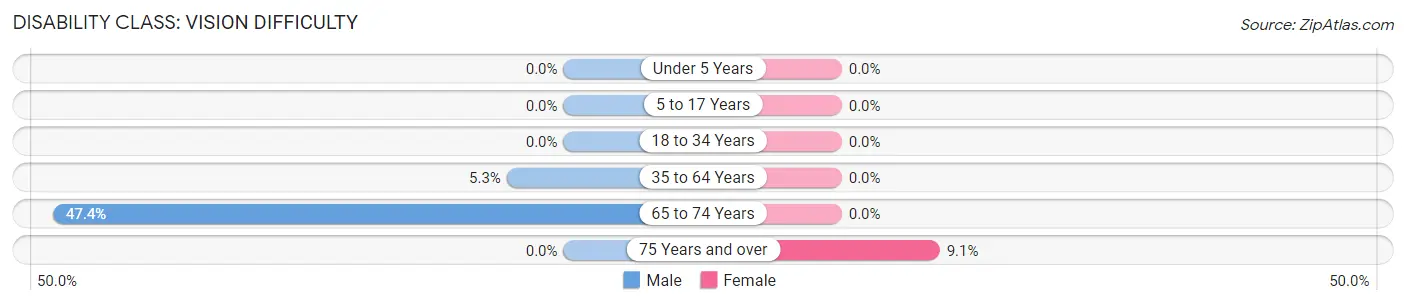
| Age Bracket | Male | Female |
| Under 5 Years | 0 (0.0%) | 0 (0.0%) |
| 5 to 17 Years | 0 (0.0%) | 0 (0.0%) |
| 18 to 34 Years | 0 (0.0%) | 0 (0.0%) |
| 35 to 64 Years | 3 (5.3%) | 0 (0.0%) |
| 65 to 74 Years | 9 (47.4%) | 0 (0.0%) |
| 75 Years and over | 0 (0.0%) | 1 (9.1%) |
Disability Class: Cognitive Difficulty
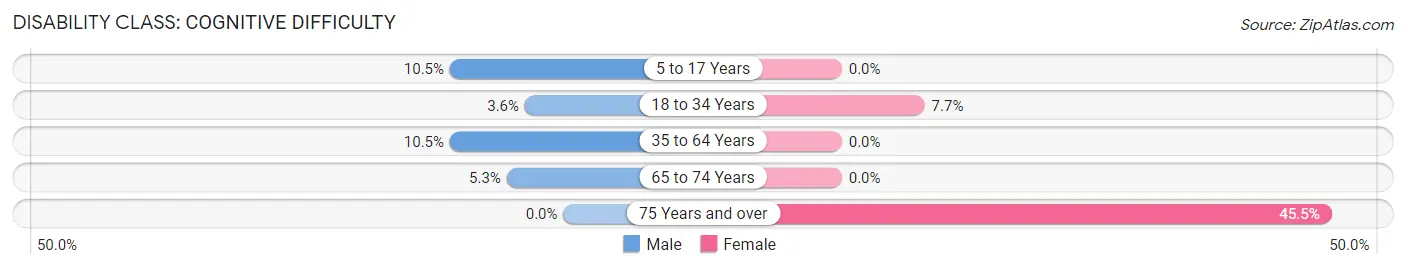
| Age Bracket | Male | Female |
| 5 to 17 Years | 2 (10.5%) | 0 (0.0%) |
| 18 to 34 Years | 1 (3.6%) | 2 (7.7%) |
| 35 to 64 Years | 6 (10.5%) | 0 (0.0%) |
| 65 to 74 Years | 1 (5.3%) | 0 (0.0%) |
| 75 Years and over | 0 (0.0%) | 5 (45.5%) |
Disability Class: Ambulatory Difficulty
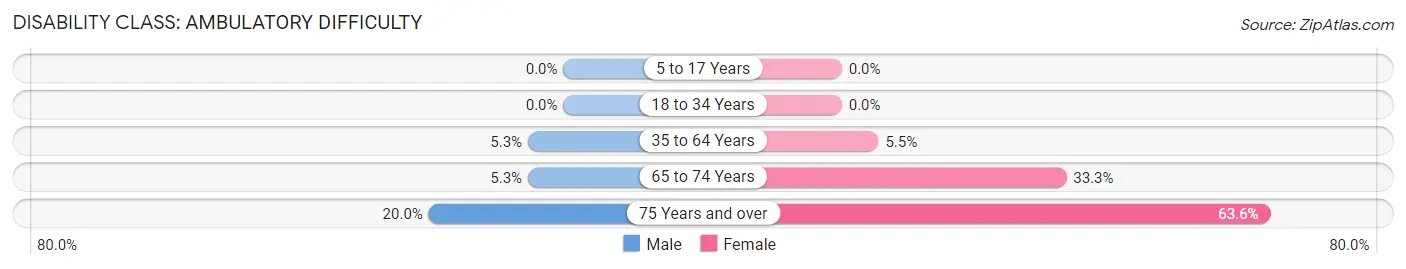
| Age Bracket | Male | Female |
| 5 to 17 Years | 0 (0.0%) | 0 (0.0%) |
| 18 to 34 Years | 0 (0.0%) | 0 (0.0%) |
| 35 to 64 Years | 3 (5.3%) | 3 (5.4%) |
| 65 to 74 Years | 1 (5.3%) | 2 (33.3%) |
| 75 Years and over | 1 (20.0%) | 7 (63.6%) |
Disability Class: Self-Care Difficulty
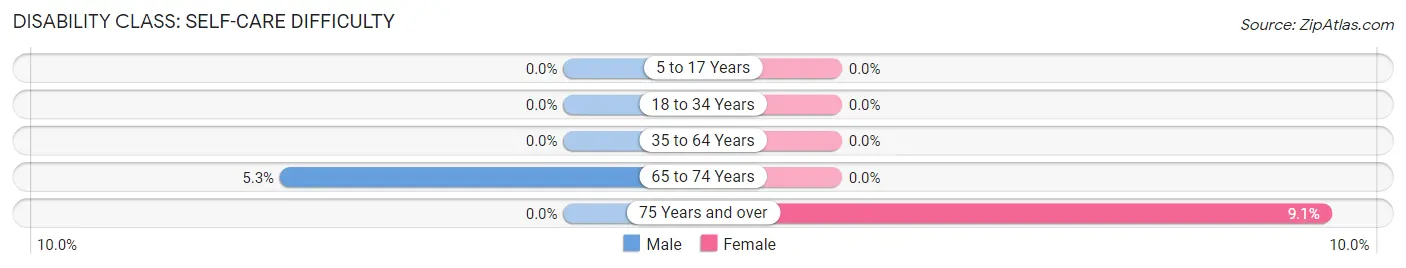
| Age Bracket | Male | Female |
| 5 to 17 Years | 0 (0.0%) | 0 (0.0%) |
| 18 to 34 Years | 0 (0.0%) | 0 (0.0%) |
| 35 to 64 Years | 0 (0.0%) | 0 (0.0%) |
| 65 to 74 Years | 1 (5.3%) | 0 (0.0%) |
| 75 Years and over | 0 (0.0%) | 1 (9.1%) |
Technology Access in Manns Choice borough
Computing Device Access in Manns Choice borough
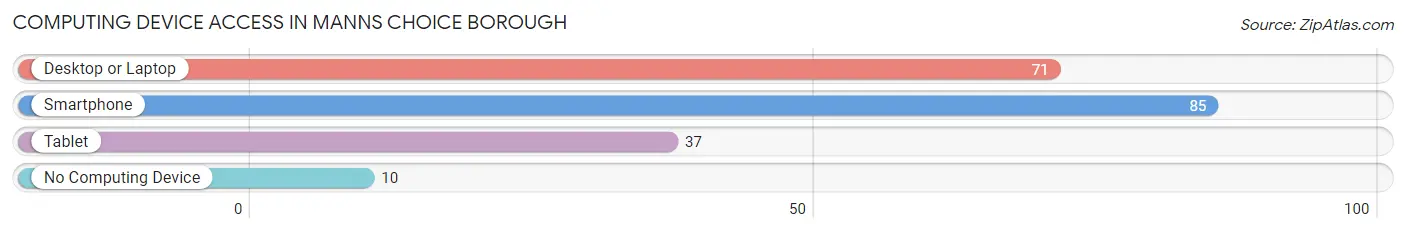
| Device Type | # Households | % Households |
| Desktop or Laptop | 71 | 74.0% |
| Smartphone | 85 | 88.5% |
| Tablet | 37 | 38.5% |
| No Computing Device | 10 | 10.4% |
| Total | 96 | 100.0% |
Internet Access in Manns Choice borough
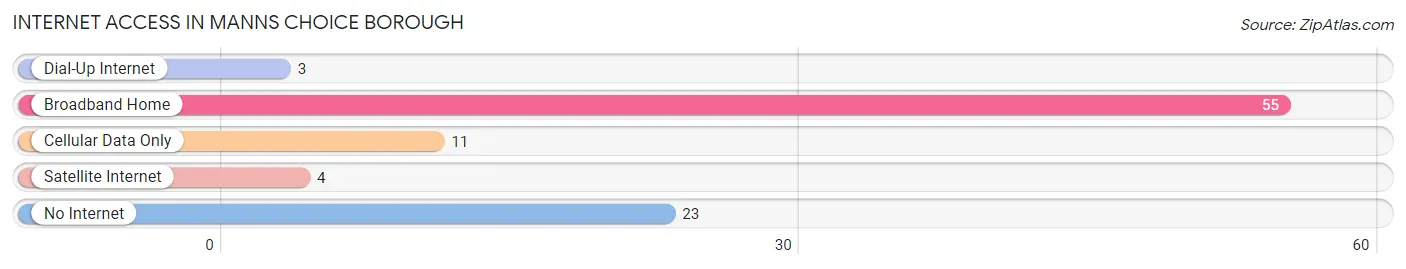
| Internet Type | # Households | % Households |
| Dial-Up Internet | 3 | 3.1% |
| Broadband Home | 55 | 57.3% |
| Cellular Data Only | 11 | 11.5% |
| Satellite Internet | 4 | 4.2% |
| No Internet | 23 | 24.0% |
| Total | 96 | 100.0% |
Manns Choice borough Summary
Manns Choice Borough is a small borough located in Bedford County, Pennsylvania. It is situated in the Allegheny Mountains, approximately 20 miles east of the city of Altoona. The borough has a population of approximately 500 people and covers an area of 0.3 square miles.
History
Manns Choice Borough was founded in 1845 by John Mann, a local farmer. The borough was named after him and was originally part of Bedford Township. In 1854, the borough was incorporated and the first mayor was elected.
The borough was originally a farming community, but in the late 19th century, the area began to develop into a small industrial center. The first industry to be established in the borough was a sawmill, which was built in 1876. This was followed by a grist mill, a tannery, and a brickyard.
In the early 20th century, the borough began to experience a period of growth. The population increased from just over 200 in 1900 to nearly 500 by 1940. This growth was largely due to the development of the local coal industry. The coal industry provided employment for many of the borough’s residents and helped to fuel the local economy.
Geography
Manns Choice Borough is located in the Allegheny Mountains of south-central Pennsylvania. The borough is situated in a valley between two mountain ridges, the Tussey Mountain to the north and the Allegheny Front to the south. The borough is located approximately 20 miles east of Altoona and is bordered by Bedford Township to the east, West Providence Township to the south, and Snake Spring Township to the west.
The borough is located at an elevation of 1,400 feet above sea level and has a total area of 0.3 square miles. The terrain is mostly hilly and the climate is classified as humid continental. The average annual temperature is 48°F and the average annual precipitation is 40 inches.
Economy
Manns Choice Borough’s economy is largely based on agriculture and tourism. The borough is home to several small farms, which produce a variety of crops, including corn, soybeans, and hay. The borough also has several small businesses, including a grocery store, a hardware store, and a restaurant.
Tourism is an important part of the borough’s economy. The borough is home to several attractions, including the Manns Choice Historical Society Museum, the Manns Choice Covered Bridge, and the Manns Choice Railroad Station. The borough also hosts several annual events, including the Manns Choice Fall Festival and the Manns Choice Christmas Parade.
Demographics
As of the 2010 census, the population of Manns Choice Borough was 498. The racial makeup of the borough was 97.2% White, 0.6% African American, 0.2% Native American, 0.2% Asian, 0.2% from other races, and 1.8% from two or more races. Hispanic or Latino of any race were 0.8% of the population.
The median household income in the borough was $37,500 and the median family income was $41,250. The per capita income was $17,845. About 11.2% of the population was below the poverty line. The borough’s population is largely composed of individuals over the age of 65, with nearly 30% of the population being over the age of 65.
Common Questions
What is Per Capita Income in Manns Choice borough?
Per Capita income in Manns Choice borough is $22,124.
What is the Median Family Income in Manns Choice borough?
Median Family Income in Manns Choice borough is $63,125.
What is the Median Household income in Manns Choice borough?
Median Household Income in Manns Choice borough is $47,500.
What is Income or Wage Gap in Manns Choice borough?
Income or Wage Gap in Manns Choice borough is 42.8%.
Women in Manns Choice borough earn 57.2 cents for every dollar earned by a man.
What is Inequality or Gini Index in Manns Choice borough?
Inequality or Gini Index in Manns Choice borough is 0.37.
What is the Total Population of Manns Choice borough?
Total Population of Manns Choice borough is 279.
What is the Total Male Population of Manns Choice borough?
Total Male Population of Manns Choice borough is 149.
What is the Total Female Population of Manns Choice borough?
Total Female Population of Manns Choice borough is 130.
What is the Ratio of Males per 100 Females in Manns Choice borough?
There are 114.62 Males per 100 Females in Manns Choice borough.
What is the Ratio of Females per 100 Males in Manns Choice borough?
There are 87.25 Females per 100 Males in Manns Choice borough.
What is the Median Population Age in Manns Choice borough?
Median Population Age in Manns Choice borough is 37.1 Years.
What is the Average Family Size in Manns Choice borough
Average Family Size in Manns Choice borough is 3.7 People.
What is the Average Household Size in Manns Choice borough
Average Household Size in Manns Choice borough is 2.9 People.
How Large is the Labor Force in Manns Choice borough?
There are 156 People in the Labor Forcein in Manns Choice borough.
What is the Percentage of People in the Labor Force in Manns Choice borough?
73.9% of People are in the Labor Force in Manns Choice borough.
What is the Unemployment Rate in Manns Choice borough?
Unemployment Rate in Manns Choice borough is 9.6%.