Saltsburg borough, PA Map & Demographics
Saltsburg borough Overview
$28,183
PER CAPITA INCOME
$68,260
AVG FAMILY INCOME
$53,125
AVG HOUSEHOLD INCOME
46.7%
WAGE / INCOME GAP [ % ]
53.3¢/ $1
WAGE / INCOME GAP [ $ ]
$10,163
FAMILY INCOME DEFICIT
0.45
INEQUALITY / GINI INDEX
752
TOTAL POPULATION
324
MALE POPULATION
428
FEMALE POPULATION
75.70
MALES / 100 FEMALES
132.10
FEMALES / 100 MALES
34.0
MEDIAN AGE
3.2
AVG FAMILY SIZE
2.5
AVG HOUSEHOLD SIZE
316
LABOR FORCE [ PEOPLE ]
60.5%
PERCENT IN LABOR FORCE
0.9%
UNEMPLOYMENT RATE
Income in Saltsburg borough
Income Overview in Saltsburg borough
Per Capita Income in Saltsburg borough is $28,183, while median incomes of families and households are $68,260 and $53,125 respectively.
| Characteristic | Number | Measure |
| Per Capita Income | 752 | $28,183 |
| Median Family Income | 191 | $68,260 |
| Mean Family Income | 191 | $85,843 |
| Median Household Income | 307 | $53,125 |
| Mean Household Income | 307 | $68,228 |
| Income Deficit | 191 | $10,163 |
| Wage / Income Gap (%) | 752 | 46.66% |
| Wage / Income Gap ($) | 752 | 53.34¢ per $1 |
| Gini / Inequality Index | 752 | 0.45 |
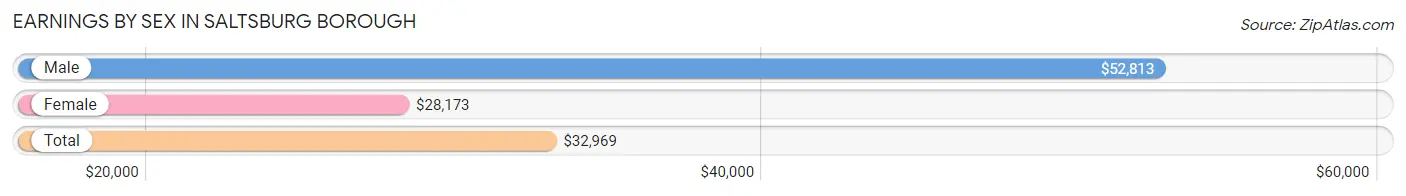
Earnings by Sex in Saltsburg borough
Average Earnings in Saltsburg borough are $32,969, $52,813 for men and $28,173 for women, a difference of 46.7%.
| Sex | Number | Average Earnings |
| Male | 181 (53.2%) | $52,813 |
| Female | 159 (46.8%) | $28,173 |
| Total | 340 (100.0%) | $32,969 |
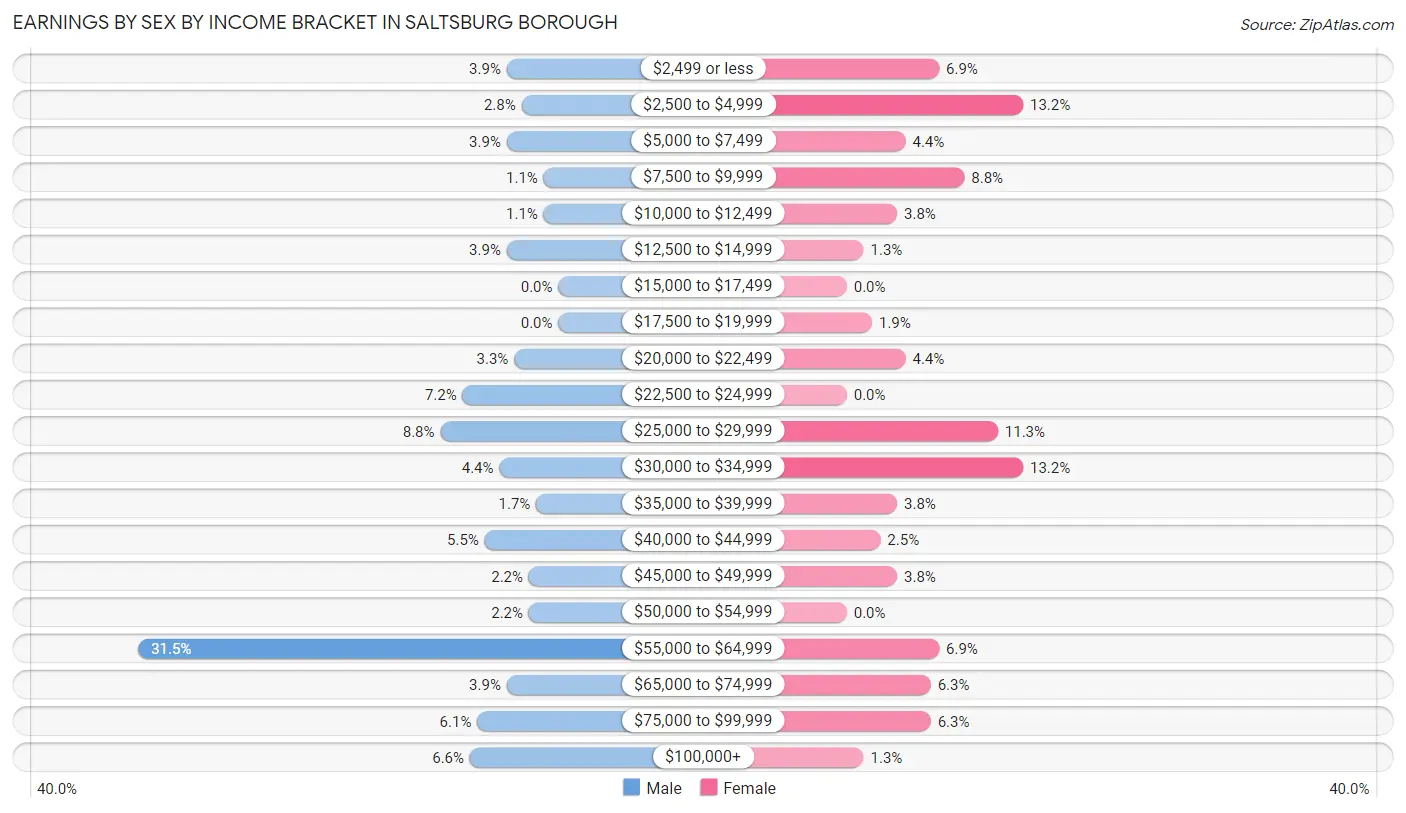
Earnings by Sex by Income Bracket in Saltsburg borough
The most common earnings brackets in Saltsburg borough are $55,000 to $64,999 for men (57 | 31.5%) and $2,500 to $4,999 for women (21 | 13.2%).
| Income | Male | Female |
| $2,499 or less | 7 (3.9%) | 11 (6.9%) |
| $2,500 to $4,999 | 5 (2.8%) | 21 (13.2%) |
| $5,000 to $7,499 | 7 (3.9%) | 7 (4.4%) |
| $7,500 to $9,999 | 2 (1.1%) | 14 (8.8%) |
| $10,000 to $12,499 | 2 (1.1%) | 6 (3.8%) |
| $12,500 to $14,999 | 7 (3.9%) | 2 (1.3%) |
| $15,000 to $17,499 | 0 (0.0%) | 0 (0.0%) |
| $17,500 to $19,999 | 0 (0.0%) | 3 (1.9%) |
| $20,000 to $22,499 | 6 (3.3%) | 7 (4.4%) |
| $22,500 to $24,999 | 13 (7.2%) | 0 (0.0%) |
| $25,000 to $29,999 | 16 (8.8%) | 18 (11.3%) |
| $30,000 to $34,999 | 8 (4.4%) | 21 (13.2%) |
| $35,000 to $39,999 | 3 (1.7%) | 6 (3.8%) |
| $40,000 to $44,999 | 10 (5.5%) | 4 (2.5%) |
| $45,000 to $49,999 | 4 (2.2%) | 6 (3.8%) |
| $50,000 to $54,999 | 4 (2.2%) | 0 (0.0%) |
| $55,000 to $64,999 | 57 (31.5%) | 11 (6.9%) |
| $65,000 to $74,999 | 7 (3.9%) | 10 (6.3%) |
| $75,000 to $99,999 | 11 (6.1%) | 10 (6.3%) |
| $100,000+ | 12 (6.6%) | 2 (1.3%) |
| Total | 181 (100.0%) | 159 (100.0%) |
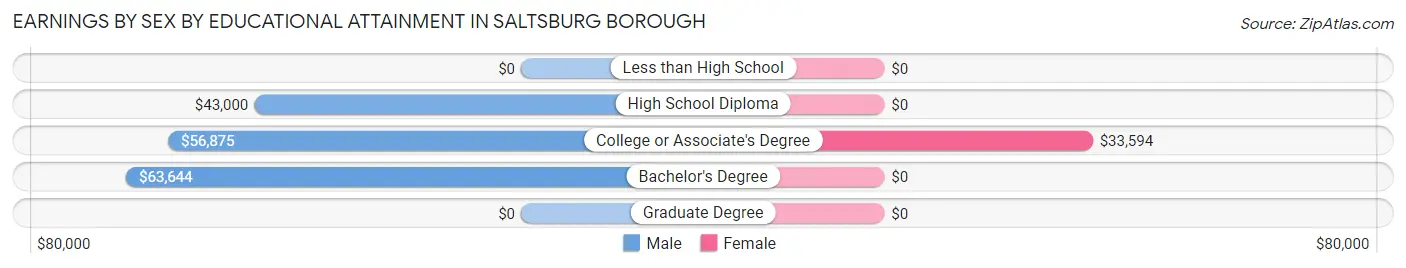
Earnings by Sex by Educational Attainment in Saltsburg borough
Average earnings in Saltsburg borough are $62,857 for men and $28,750 for women, a difference of 54.3%. Men with an educational attainment of bachelor's degree enjoy the highest average annual earnings of $63,644, while those with high school diploma education earn the least with $43,000. Women with an educational attainment of college or associate's degree earn the most with the average annual earnings of $33,594, while those with college or associate's degree education have the smallest earnings of $33,594.
| Educational Attainment | Male Income | Female Income |
| Less than High School | - | - |
| High School Diploma | $43,000 | $0 |
| College or Associate's Degree | $56,875 | $33,594 |
| Bachelor's Degree | $63,644 | $0 |
| Graduate Degree | - | - |
| Total | $62,857 | $28,750 |
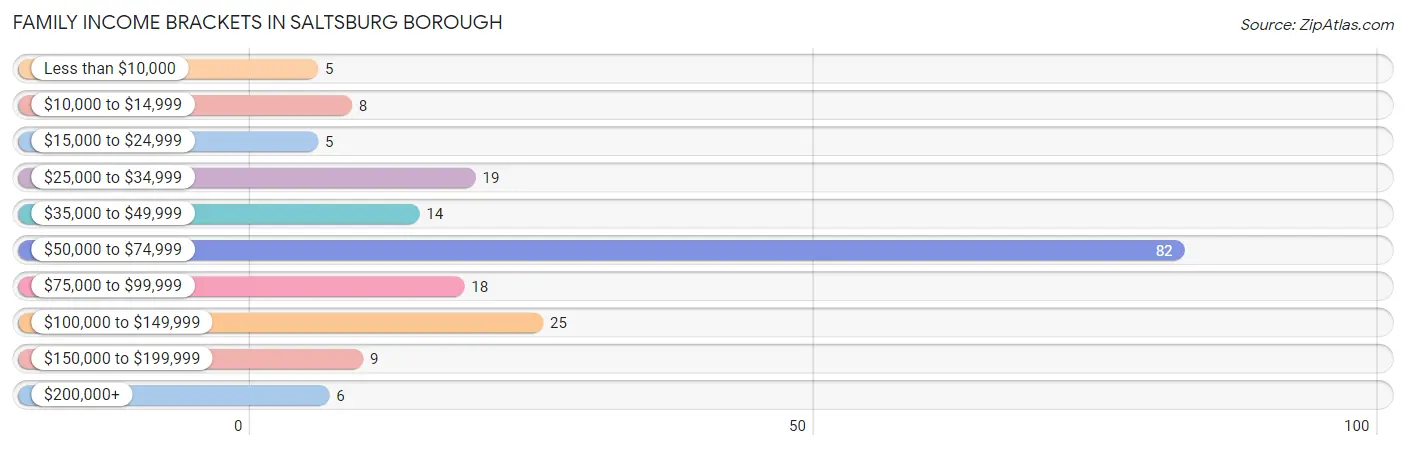
Family Income in Saltsburg borough
Family Income Brackets in Saltsburg borough
According to the Saltsburg borough family income data, there are 82 families falling into the $50,000 to $74,999 income range, which is the most common income bracket and makes up 42.9% of all families. Conversely, the less than $10,000 income bracket is the least frequent group with only 5 families (2.6%) belonging to this category.
| Income Bracket | # Families | % Families |
| Less than $10,000 | 5 | 2.6% |
| $10,000 to $14,999 | 8 | 4.2% |
| $15,000 to $24,999 | 5 | 2.6% |
| $25,000 to $34,999 | 19 | 9.9% |
| $35,000 to $49,999 | 14 | 7.3% |
| $50,000 to $74,999 | 82 | 42.9% |
| $75,000 to $99,999 | 18 | 9.4% |
| $100,000 to $149,999 | 25 | 13.1% |
| $150,000 to $199,999 | 9 | 4.7% |
| $200,000+ | 6 | 3.1% |
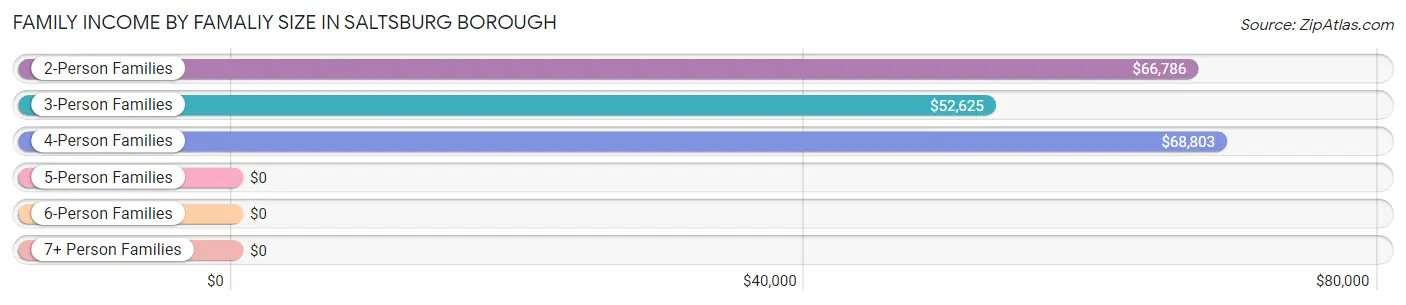
Family Income by Famaliy Size in Saltsburg borough
4-person families (79 | 41.4%) account for the highest median family income in Saltsburg borough with $68,803 per family, while 2-person families (74 | 38.7%) have the highest median income of $33,393 per family member.
| Income Bracket | # Families | Median Income |
| 2-Person Families | 74 (38.7%) | $66,786 |
| 3-Person Families | 33 (17.3%) | $52,625 |
| 4-Person Families | 79 (41.4%) | $68,803 |
| 5-Person Families | 5 (2.6%) | $0 |
| 6-Person Families | 0 (0.0%) | $0 |
| 7+ Person Families | 0 (0.0%) | $0 |
| Total | 191 (100.0%) | $68,260 |
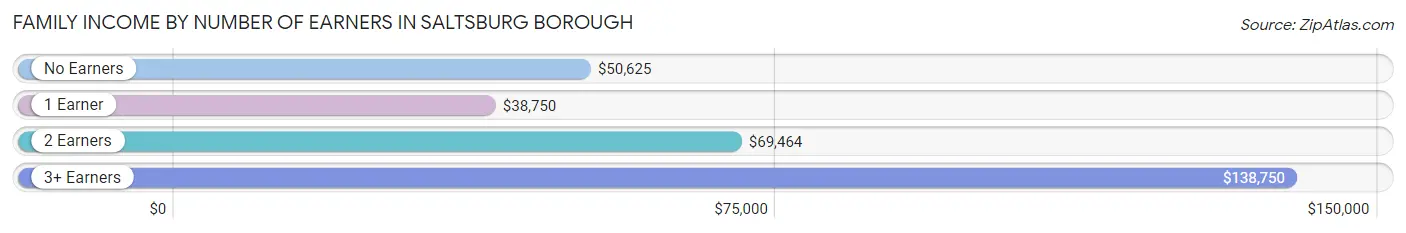
Family Income by Number of Earners in Saltsburg borough
The median family income in Saltsburg borough is $68,260, with families comprising 3+ earners (14) having the highest median family income of $138,750, while families with 1 earner (53) have the lowest median family income of $38,750, accounting for 7.3% and 27.8% of families, respectively.
| Number of Earners | # Families | Median Income |
| No Earners | 27 (14.1%) | $50,625 |
| 1 Earner | 53 (27.8%) | $38,750 |
| 2 Earners | 97 (50.8%) | $69,464 |
| 3+ Earners | 14 (7.3%) | $138,750 |
| Total | 191 (100.0%) | $68,260 |
Household Income in Saltsburg borough
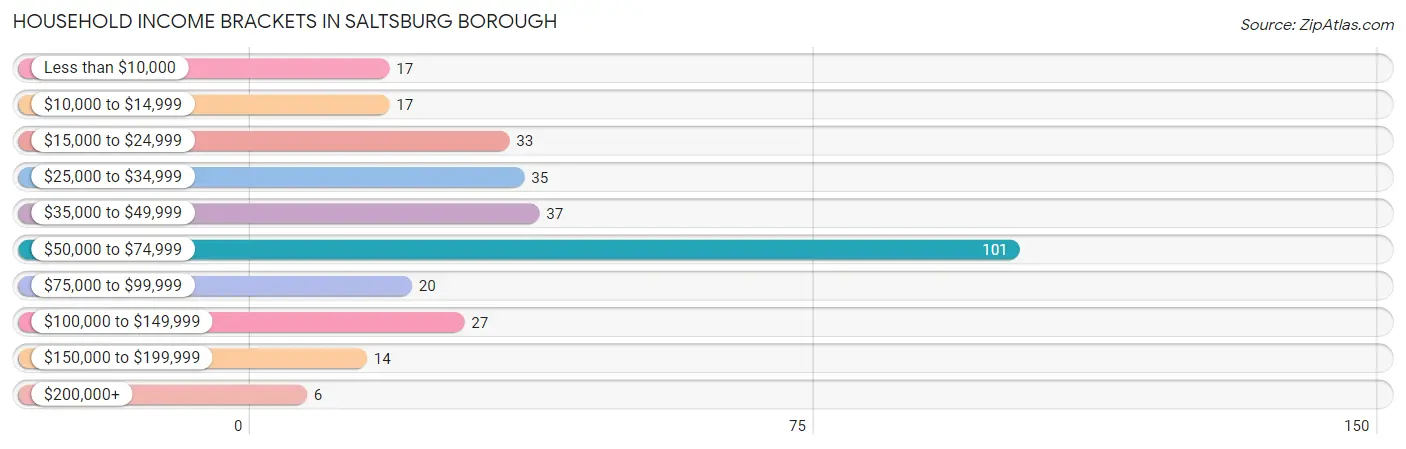
Household Income Brackets in Saltsburg borough
With 101 households falling in the category, the $50,000 to $74,999 income range is the most frequent in Saltsburg borough, accounting for 32.9% of all households. In contrast, only 6 households (1.9%) fall into the $200,000+ income bracket, making it the least populous group.
| Income Bracket | # Households | % Households |
| Less than $10,000 | 17 | 5.5% |
| $10,000 to $14,999 | 17 | 5.5% |
| $15,000 to $24,999 | 33 | 10.7% |
| $25,000 to $34,999 | 35 | 11.4% |
| $35,000 to $49,999 | 37 | 12.1% |
| $50,000 to $74,999 | 101 | 32.9% |
| $75,000 to $99,999 | 20 | 6.5% |
| $100,000 to $149,999 | 27 | 8.8% |
| $150,000 to $199,999 | 14 | 4.6% |
| $200,000+ | 6 | 2.0% |
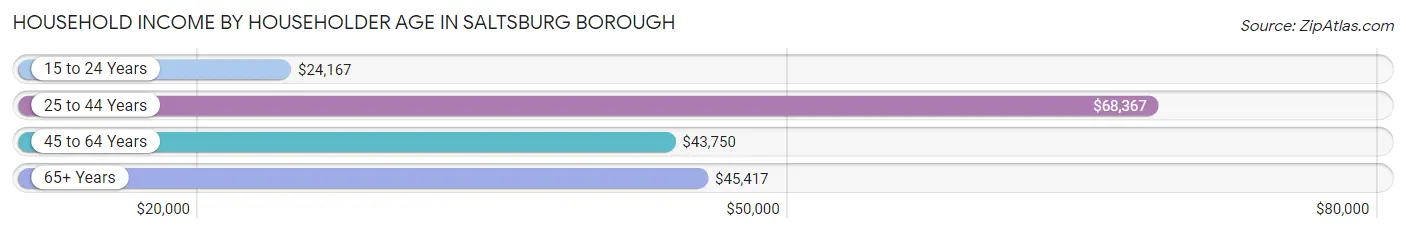
Household Income by Householder Age in Saltsburg borough
The median household income in Saltsburg borough is $53,125, with the highest median household income of $68,367 found in the 25 to 44 years age bracket for the primary householder. A total of 94 households (30.6%) fall into this category. Meanwhile, the 15 to 24 years age bracket for the primary householder has the lowest median household income of $24,167, with 8 households (2.6%) in this group.
| Income Bracket | # Households | Median Income |
| 15 to 24 Years | 8 (2.6%) | $24,167 |
| 25 to 44 Years | 94 (30.6%) | $68,367 |
| 45 to 64 Years | 112 (36.5%) | $43,750 |
| 65+ Years | 93 (30.3%) | $45,417 |
| Total | 307 (100.0%) | $53,125 |
Poverty in Saltsburg borough
Income Below Poverty by Sex and Age in Saltsburg borough
With 8.6% poverty level for males and 13.3% for females among the residents of Saltsburg borough, 55 to 64 year old males and 6 to 11 year old females are the most vulnerable to poverty, with 11 males (25.0%) and 10 females (66.7%) in their respective age groups living below the poverty level.
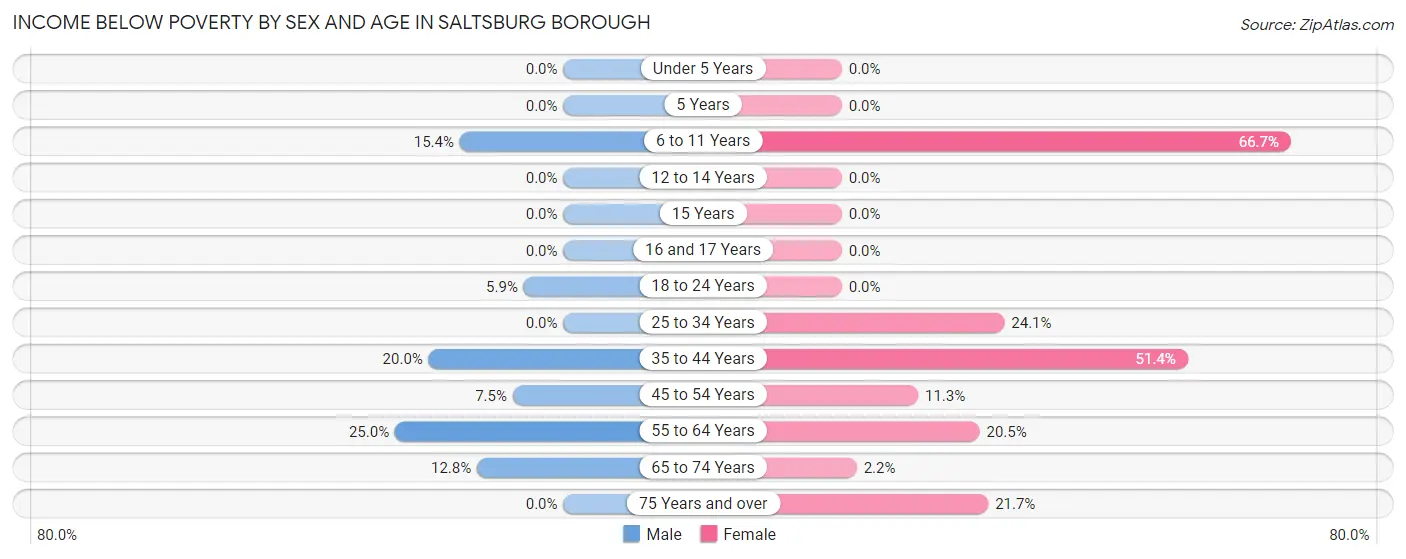
| Age Bracket | Male | Female |
| Under 5 Years | 0 (0.0%) | 0 (0.0%) |
| 5 Years | 0 (0.0%) | 0 (0.0%) |
| 6 to 11 Years | 4 (15.4%) | 10 (66.7%) |
| 12 to 14 Years | 0 (0.0%) | 0 (0.0%) |
| 15 Years | 0 (0.0%) | 0 (0.0%) |
| 16 and 17 Years | 0 (0.0%) | 0 (0.0%) |
| 18 to 24 Years | 2 (5.9%) | 0 (0.0%) |
| 25 to 34 Years | 0 (0.0%) | 7 (24.1%) |
| 35 to 44 Years | 3 (20.0%) | 19 (51.3%) |
| 45 to 54 Years | 3 (7.5%) | 6 (11.3%) |
| 55 to 64 Years | 11 (25.0%) | 9 (20.4%) |
| 65 to 74 Years | 5 (12.8%) | 1 (2.2%) |
| 75 Years and over | 0 (0.0%) | 5 (21.7%) |
| Total | 28 (8.6%) | 57 (13.3%) |
Income Above Poverty by Sex and Age in Saltsburg borough
According to the poverty statistics in Saltsburg borough, males aged under 5 years and females aged under 5 years are the age groups that are most secure financially, with 100.0% of males and 100.0% of females in these age groups living above the poverty line.
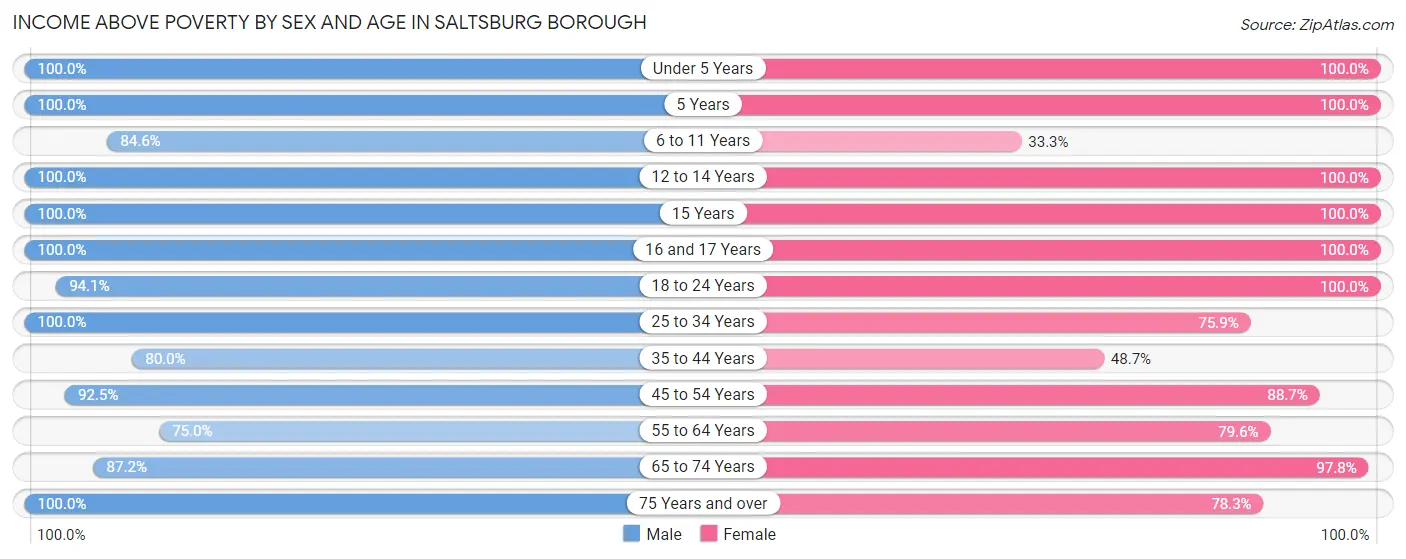
| Age Bracket | Male | Female |
| Under 5 Years | 3 (100.0%) | 86 (100.0%) |
| 5 Years | 3 (100.0%) | 61 (100.0%) |
| 6 to 11 Years | 22 (84.6%) | 5 (33.3%) |
| 12 to 14 Years | 3 (100.0%) | 8 (100.0%) |
| 15 Years | 20 (100.0%) | 5 (100.0%) |
| 16 and 17 Years | 10 (100.0%) | 8 (100.0%) |
| 18 to 24 Years | 32 (94.1%) | 14 (100.0%) |
| 25 to 34 Years | 65 (100.0%) | 22 (75.9%) |
| 35 to 44 Years | 12 (80.0%) | 18 (48.6%) |
| 45 to 54 Years | 37 (92.5%) | 47 (88.7%) |
| 55 to 64 Years | 33 (75.0%) | 35 (79.5%) |
| 65 to 74 Years | 34 (87.2%) | 44 (97.8%) |
| 75 Years and over | 22 (100.0%) | 18 (78.3%) |
| Total | 296 (91.4%) | 371 (86.7%) |
Income Below Poverty Among Married-Couple Families in Saltsburg borough
The poverty statistics for married-couple families in Saltsburg borough show that 5.5% or 8 of the total 146 families live below the poverty line. Families with no children have the highest poverty rate of 7.9%, comprising of 5 families. On the other hand, families with 3 or 4 children have the lowest poverty rate of 0.0%, which includes 0 families.
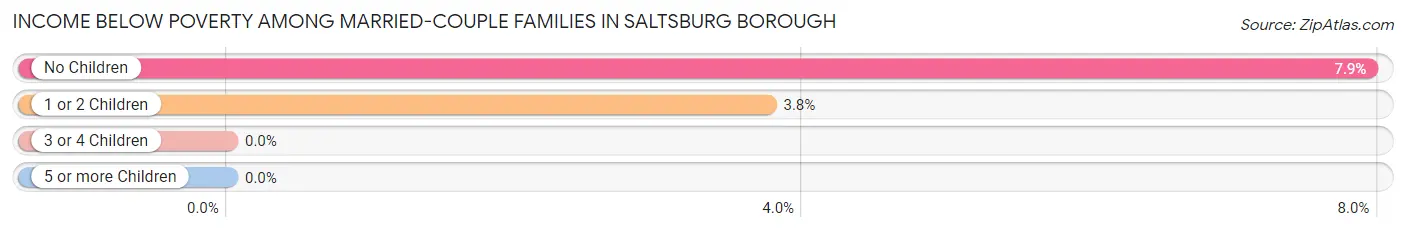
| Children | Above Poverty | Below Poverty |
| No Children | 58 (92.1%) | 5 (7.9%) |
| 1 or 2 Children | 77 (96.3%) | 3 (3.7%) |
| 3 or 4 Children | 3 (100.0%) | 0 (0.0%) |
| 5 or more Children | 0 (0.0%) | 0 (0.0%) |
| Total | 138 (94.5%) | 8 (5.5%) |
Income Below Poverty Among Single-Parent Households in Saltsburg borough
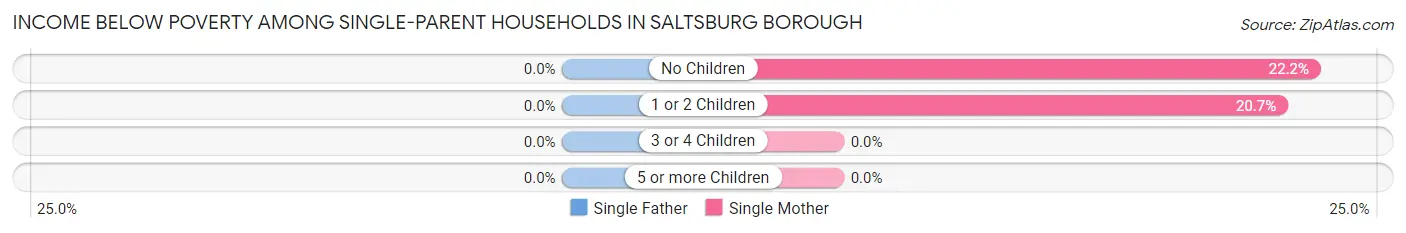
| Children | Single Father | Single Mother |
| No Children | 0 (0.0%) | 2 (22.2%) |
| 1 or 2 Children | 0 (0.0%) | 6 (20.7%) |
| 3 or 4 Children | 0 (0.0%) | 0 (0.0%) |
| 5 or more Children | 0 (0.0%) | 0 (0.0%) |
| Total | 0 (0.0%) | 8 (21.0%) |
Income Below Poverty Among Married-Couple vs Single-Parent Households in Saltsburg borough
The poverty data for Saltsburg borough shows that 8 of the married-couple family households (5.5%) and 8 of the single-parent households (17.8%) are living below the poverty level. Within the married-couple family households, those with no children have the highest poverty rate, with 5 households (7.9%) falling below the poverty line. Among the single-parent households, those with no children have the highest poverty rate, with 2 household (18.2%) living below poverty.
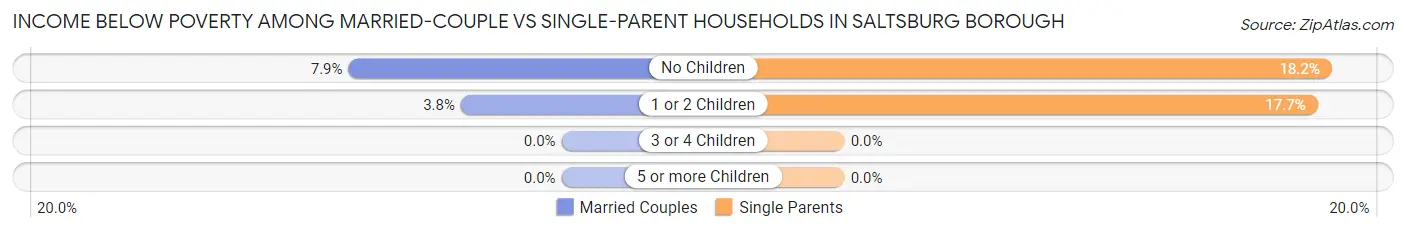
| Children | Married-Couple Families | Single-Parent Households |
| No Children | 5 (7.9%) | 2 (18.2%) |
| 1 or 2 Children | 3 (3.7%) | 6 (17.6%) |
| 3 or 4 Children | 0 (0.0%) | 0 (0.0%) |
| 5 or more Children | 0 (0.0%) | 0 (0.0%) |
| Total | 8 (5.5%) | 8 (17.8%) |
Race in Saltsburg borough
The most populous races in Saltsburg borough are White / Caucasian (563 | 74.9%), Two or more Races (142 | 18.9%), and Asian (47 | 6.2%).
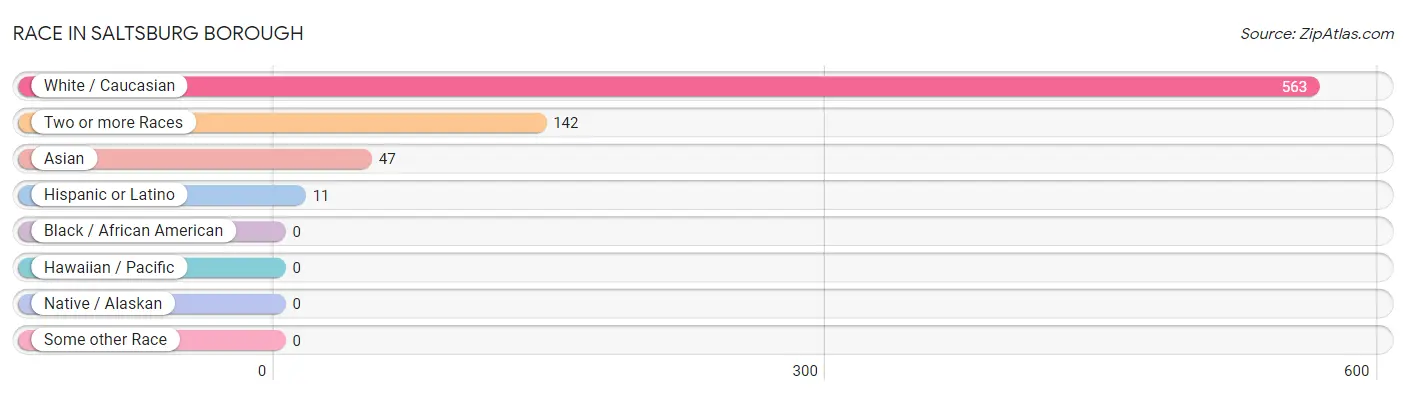
| Race | # Population | % Population |
| Asian | 47 | 6.2% |
| Black / African American | 0 | 0.0% |
| Hawaiian / Pacific | 0 | 0.0% |
| Hispanic or Latino | 11 | 1.5% |
| Native / Alaskan | 0 | 0.0% |
| White / Caucasian | 563 | 74.9% |
| Two or more Races | 142 | 18.9% |
| Some other Race | 0 | 0.0% |
| Total | 752 | 100.0% |
Ancestry in Saltsburg borough
The most populous ancestries reported in Saltsburg borough are Korean (173 | 23.0%), German (148 | 19.7%), Irish (143 | 19.0%), Italian (124 | 16.5%), and English (92 | 12.2%), together accounting for 90.4% of all Saltsburg borough residents.
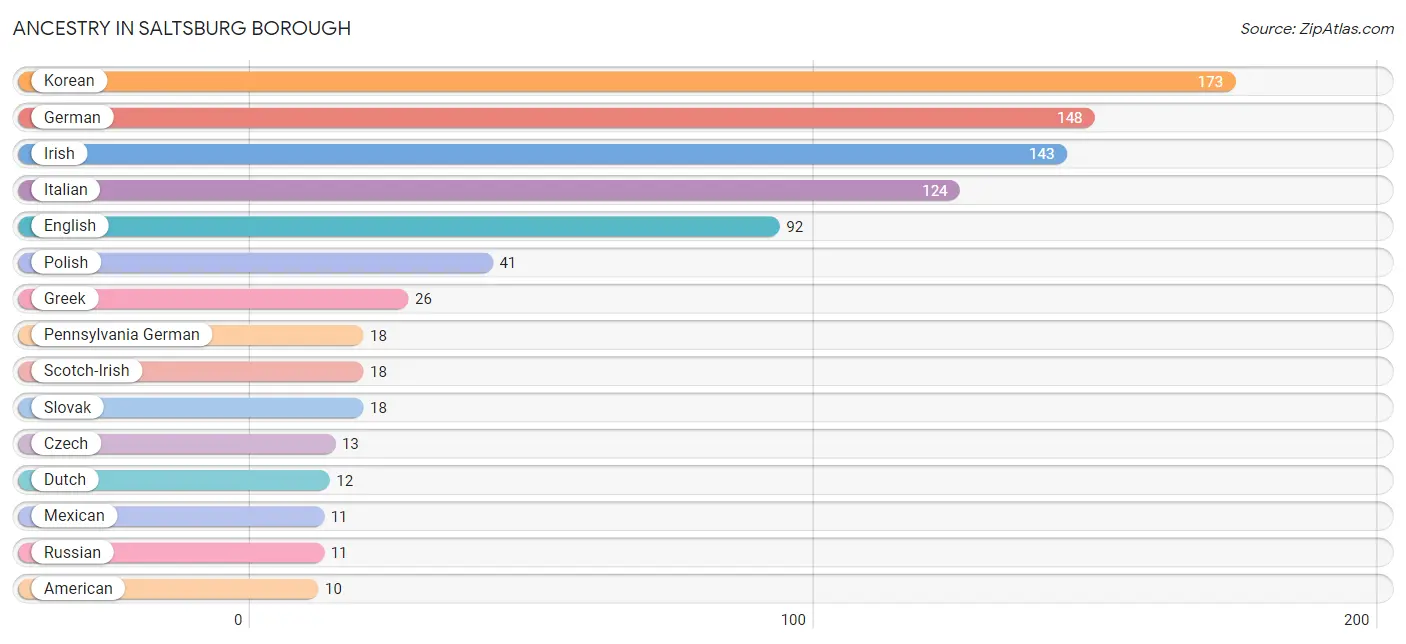
| Ancestry | # Population | % Population |
| American | 10 | 1.3% |
| Arab | 6 | 0.8% |
| Austrian | 6 | 0.8% |
| Blackfeet | 2 | 0.3% |
| British | 7 | 0.9% |
| Cherokee | 2 | 0.3% |
| Czech | 13 | 1.7% |
| Czechoslovakian | 2 | 0.3% |
| Dutch | 12 | 1.6% |
| English | 92 | 12.2% |
| French | 8 | 1.1% |
| German | 148 | 19.7% |
| Greek | 26 | 3.5% |
| Hungarian | 2 | 0.3% |
| Irish | 143 | 19.0% |
| Italian | 124 | 16.5% |
| Korean | 173 | 23.0% |
| Mexican | 11 | 1.5% |
| Pennsylvania German | 18 | 2.4% |
| Polish | 41 | 5.4% |
| Russian | 11 | 1.5% |
| Scotch-Irish | 18 | 2.4% |
| Scottish | 6 | 0.8% |
| Slovak | 18 | 2.4% |
| Slovene | 3 | 0.4% |
| Swedish | 2 | 0.3% |
| Syrian | 6 | 0.8% |
| Ukrainian | 3 | 0.4% |
| Welsh | 4 | 0.5% |
| Yugoslavian | 2 | 0.3% | View All 30 Rows |
Immigrants in Saltsburg borough
The most numerous immigrant groups reported in Saltsburg borough came from Europe (10 | 1.3%), Eastern Europe (4 | 0.5%), Russia (4 | 0.5%), England (2 | 0.3%), and Germany (2 | 0.3%), together accounting for 2.9% of all Saltsburg borough residents.
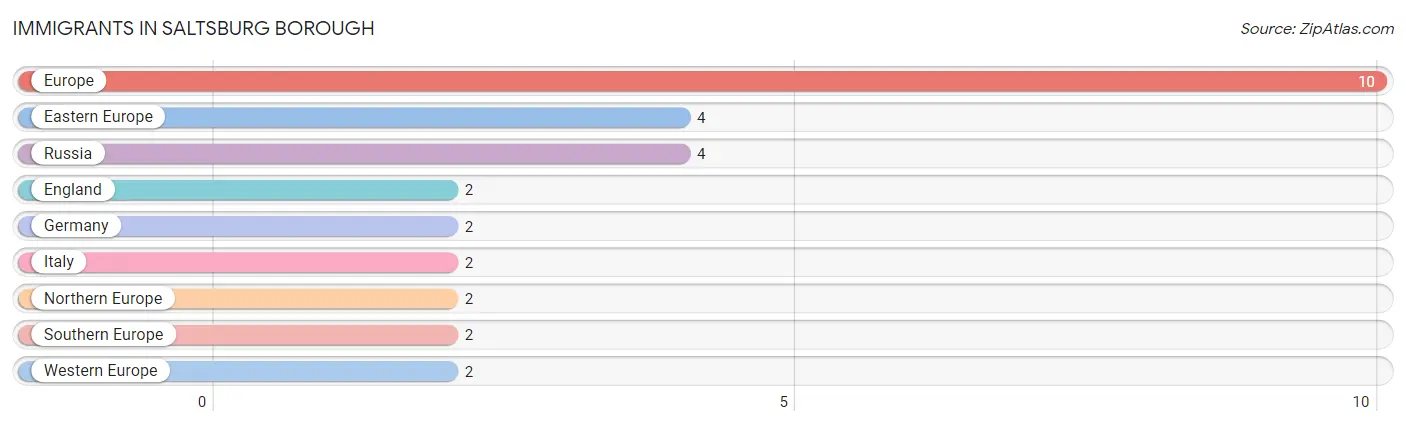
| Immigration Origin | # Population | % Population |
| Eastern Europe | 4 | 0.5% |
| England | 2 | 0.3% |
| Europe | 10 | 1.3% |
| Germany | 2 | 0.3% |
| Italy | 2 | 0.3% |
| Northern Europe | 2 | 0.3% |
| Russia | 4 | 0.5% |
| Southern Europe | 2 | 0.3% |
| Western Europe | 2 | 0.3% | View All 9 Rows |
Sex and Age in Saltsburg borough
Sex and Age in Saltsburg borough
The most populous age groups in Saltsburg borough are 30 to 34 Years (56 | 17.3%) for men and Under 5 Years (86 | 20.1%) for women.
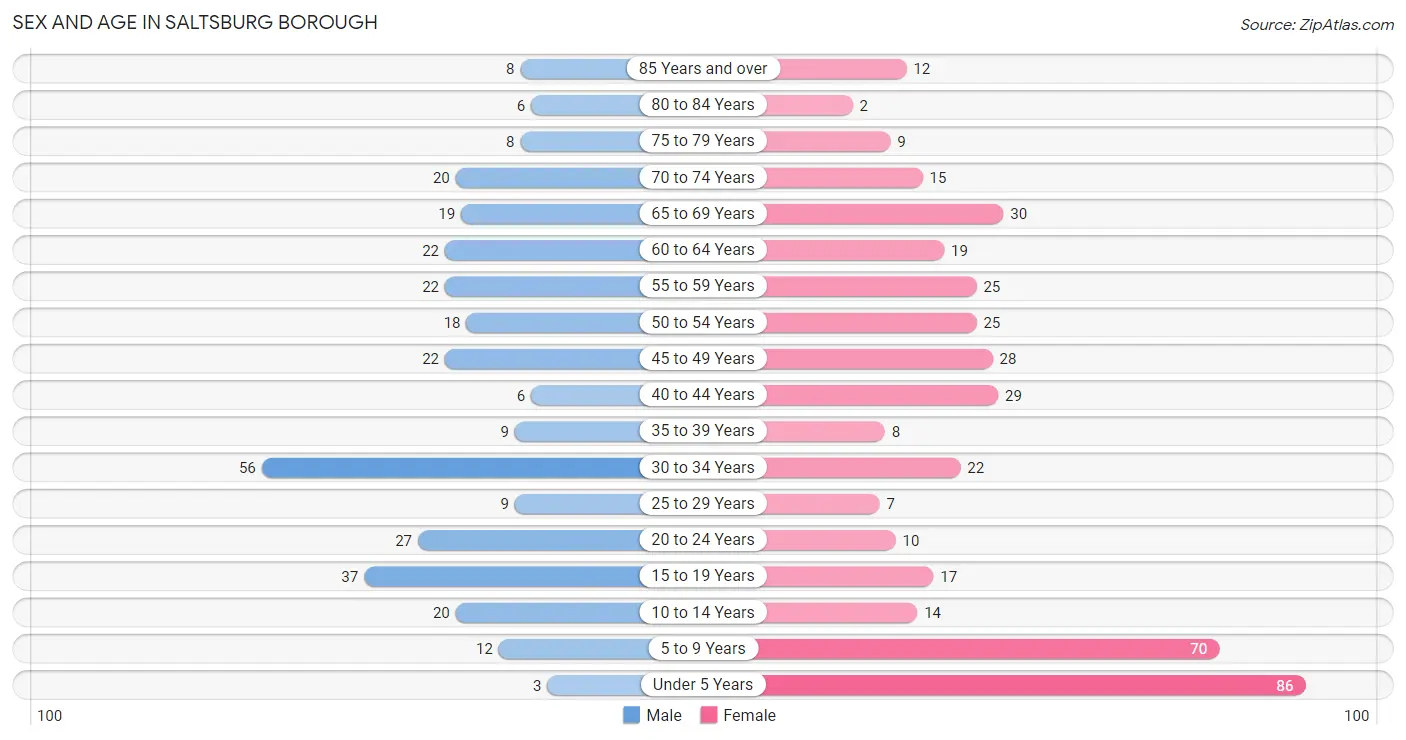
| Age Bracket | Male | Female |
| Under 5 Years | 3 (0.9%) | 86 (20.1%) |
| 5 to 9 Years | 12 (3.7%) | 70 (16.4%) |
| 10 to 14 Years | 20 (6.2%) | 14 (3.3%) |
| 15 to 19 Years | 37 (11.4%) | 17 (4.0%) |
| 20 to 24 Years | 27 (8.3%) | 10 (2.3%) |
| 25 to 29 Years | 9 (2.8%) | 7 (1.6%) |
| 30 to 34 Years | 56 (17.3%) | 22 (5.1%) |
| 35 to 39 Years | 9 (2.8%) | 8 (1.9%) |
| 40 to 44 Years | 6 (1.8%) | 29 (6.8%) |
| 45 to 49 Years | 22 (6.8%) | 28 (6.5%) |
| 50 to 54 Years | 18 (5.6%) | 25 (5.8%) |
| 55 to 59 Years | 22 (6.8%) | 25 (5.8%) |
| 60 to 64 Years | 22 (6.8%) | 19 (4.4%) |
| 65 to 69 Years | 19 (5.9%) | 30 (7.0%) |
| 70 to 74 Years | 20 (6.2%) | 15 (3.5%) |
| 75 to 79 Years | 8 (2.5%) | 9 (2.1%) |
| 80 to 84 Years | 6 (1.8%) | 2 (0.5%) |
| 85 Years and over | 8 (2.5%) | 12 (2.8%) |
| Total | 324 (100.0%) | 428 (100.0%) |
Families and Households in Saltsburg borough
Median Family Size in Saltsburg borough
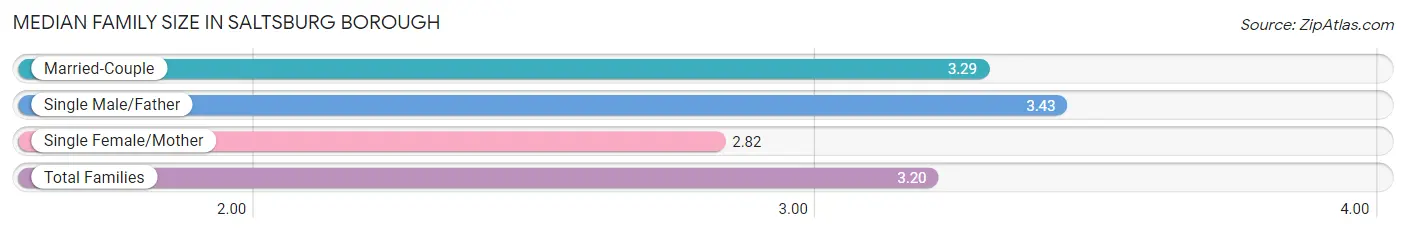
The median family size in Saltsburg borough is 3.20 persons per family, with single male/father families (7 | 3.7%) accounting for the largest median family size of 3.43 persons per family. On the other hand, single female/mother families (38 | 19.9%) represent the smallest median family size with 2.82 persons per family.
| Family Type | # Families | Family Size |
| Married-Couple | 146 (76.4%) | 3.29 |
| Single Male/Father | 7 (3.7%) | 3.43 |
| Single Female/Mother | 38 (19.9%) | 2.82 |
| Total Families | 191 (100.0%) | 3.20 |
Median Household Size in Saltsburg borough
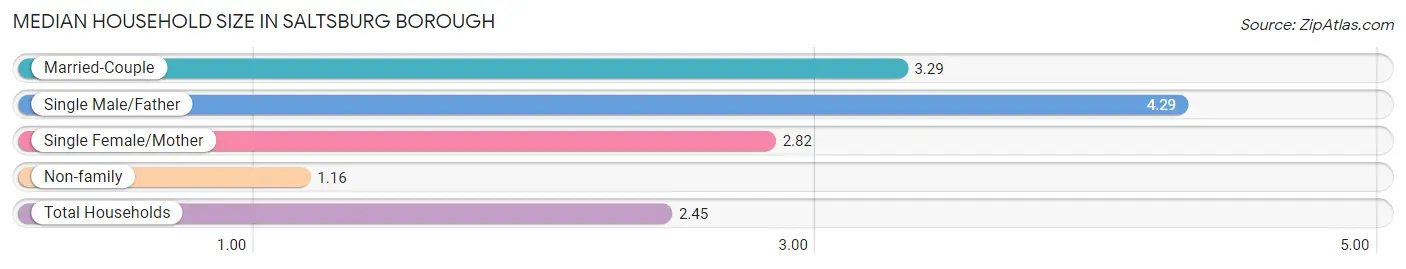
The median household size in Saltsburg borough is 2.45 persons per household, with single male/father households (7 | 2.3%) accounting for the largest median household size of 4.29 persons per household. non-family households (116 | 37.8%) represent the smallest median household size with 1.16 persons per household.
| Household Type | # Households | Household Size |
| Married-Couple | 146 (47.6%) | 3.29 |
| Single Male/Father | 7 (2.3%) | 4.29 |
| Single Female/Mother | 38 (12.4%) | 2.82 |
| Non-family | 116 (37.8%) | 1.16 |
| Total Households | 307 (100.0%) | 2.45 |
Household Size by Marriage Status in Saltsburg borough
Out of a total of 307 households in Saltsburg borough, 191 (62.2%) are family households, while 116 (37.8%) are nonfamily households. The most numerous type of family households are 4-person households, comprising 84, and the most common type of nonfamily households are 1-person households, comprising 103.
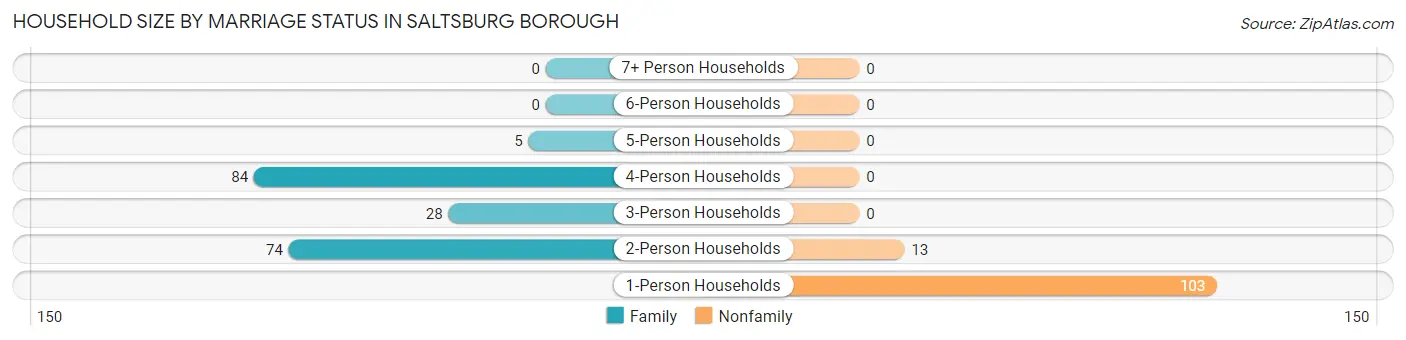
| Household Size | Family Households | Nonfamily Households |
| 1-Person Households | - | 103 (33.6%) |
| 2-Person Households | 74 (24.1%) | 13 (4.2%) |
| 3-Person Households | 28 (9.1%) | 0 (0.0%) |
| 4-Person Households | 84 (27.4%) | 0 (0.0%) |
| 5-Person Households | 5 (1.6%) | 0 (0.0%) |
| 6-Person Households | 0 (0.0%) | 0 (0.0%) |
| 7+ Person Households | 0 (0.0%) | 0 (0.0%) |
| Total | 191 (62.2%) | 116 (37.8%) |
Female Fertility in Saltsburg borough
Fertility by Age in Saltsburg borough
| Age Bracket | Women with Births | Births / 1,000 Women |
| 15 to 19 years | 0 (0.0%) | 0.0 |
| 20 to 34 years | 0 (0.0%) | 0.0 |
| 35 to 50 years | 0 (0.0%) | 0.0 |
| Total | 0 (0.0%) | 0.0 |
Fertility by Age by Marriage Status in Saltsburg borough
| Age Bracket | Married | Unmarried |
| 15 to 19 years | 0 (0.0%) | 0 (0.0%) |
| 20 to 34 years | 0 (0.0%) | 0 (0.0%) |
| 35 to 50 years | 0 (0.0%) | 0 (0.0%) |
| Total | 0 (0.0%) | 0 (0.0%) |
Fertility by Education in Saltsburg borough
| Educational Attainment | Women with Births | Births / 1,000 Women |
| Less than High School | 0 (0.0%) | 0.0 |
| High School Diploma | 0 (0.0%) | 0.0 |
| College or Associate's Degree | 0 (0.0%) | 0.0 |
| Bachelor's Degree | 0 (0.0%) | 0.0 |
| Graduate Degree | 0 (0.0%) | 0.0 |
| Total | 0 (0.0%) | 0.0 |
Fertility by Education by Marriage Status in Saltsburg borough
| Educational Attainment | Married | Unmarried |
| Less than High School | 0 (0.0%) | 0 (0.0%) |
| High School Diploma | 0 (0.0%) | 0 (0.0%) |
| College or Associate's Degree | 0 (0.0%) | 0 (0.0%) |
| Bachelor's Degree | 0 (0.0%) | 0 (0.0%) |
| Graduate Degree | 0 (0.0%) | 0 (0.0%) |
| Total | 0 (0.0%) | 0 (0.0%) |
Employment Characteristics in Saltsburg borough
Employment by Class of Employer in Saltsburg borough
Among the 313 employed individuals in Saltsburg borough, private company employees (258 | 82.4%), not-for-profit organizations (25 | 8.0%), and local government employees (16 | 5.1%) make up the most common classes of employment.
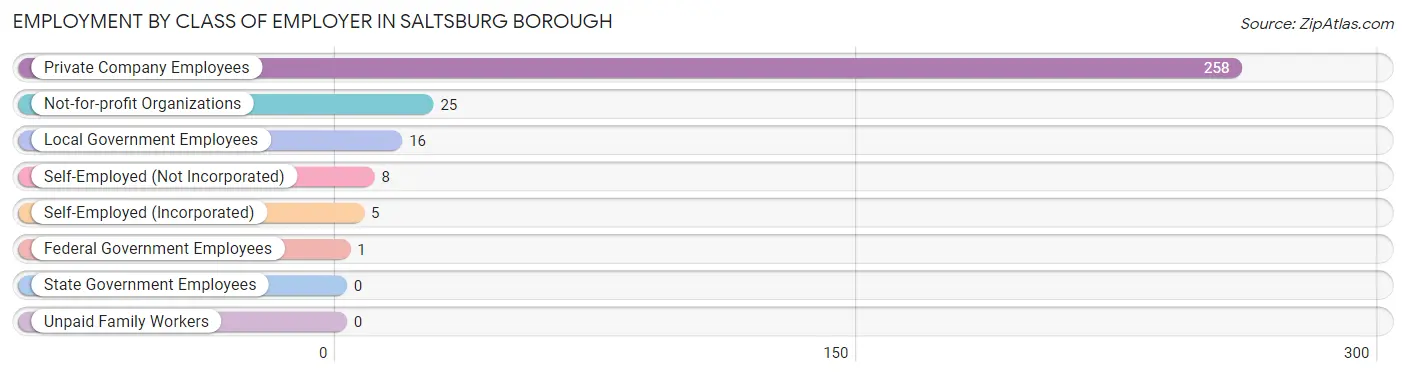
| Employer Class | # Employees | % Employees |
| Private Company Employees | 258 | 82.4% |
| Self-Employed (Incorporated) | 5 | 1.6% |
| Self-Employed (Not Incorporated) | 8 | 2.6% |
| Not-for-profit Organizations | 25 | 8.0% |
| Local Government Employees | 16 | 5.1% |
| State Government Employees | 0 | 0.0% |
| Federal Government Employees | 1 | 0.3% |
| Unpaid Family Workers | 0 | 0.0% |
| Total | 313 | 100.0% |
Employment Status by Age in Saltsburg borough
According to the labor force statistics for Saltsburg borough, out of the total population over 16 years of age (522), 60.5% or 316 individuals are in the labor force, with 0.9% or 3 of them unemployed. The age group with the highest labor force participation rate is 30 to 34 years, with 91.0% or 71 individuals in the labor force. Within the labor force, the 65 to 74 years age range has the highest percentage of unemployed individuals, with 13.6% or 3 of them being unemployed.
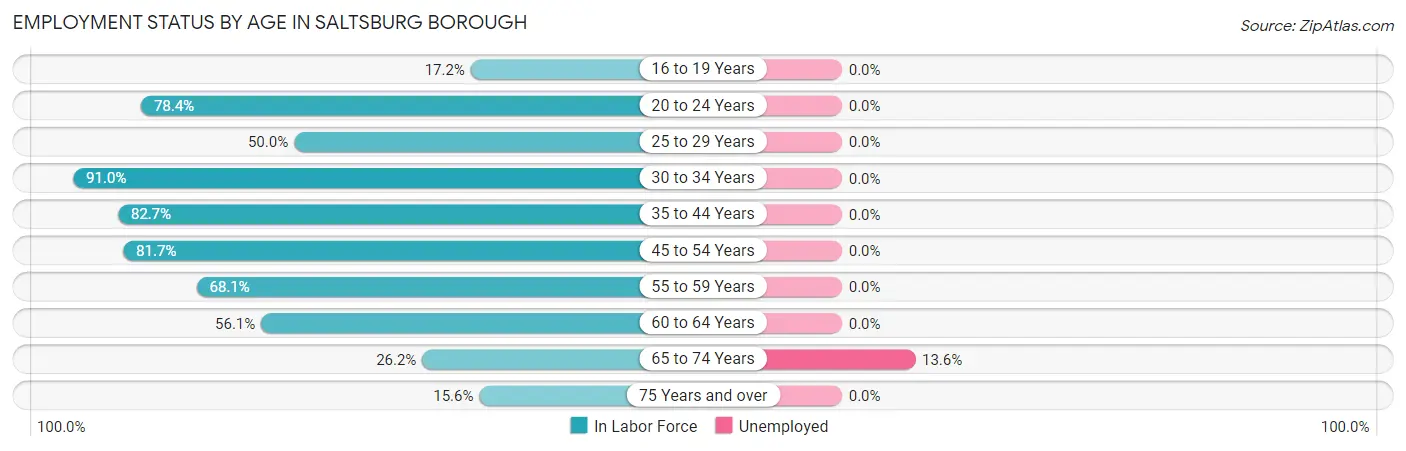
| Age Bracket | In Labor Force | Unemployed |
| 16 to 19 Years | 5 (17.2%) | 0 (0.0%) |
| 20 to 24 Years | 29 (78.4%) | 0 (0.0%) |
| 25 to 29 Years | 8 (50.0%) | 0 (0.0%) |
| 30 to 34 Years | 71 (91.0%) | 0 (0.0%) |
| 35 to 44 Years | 43 (82.7%) | 0 (0.0%) |
| 45 to 54 Years | 76 (81.7%) | 0 (0.0%) |
| 55 to 59 Years | 32 (68.1%) | 0 (0.0%) |
| 60 to 64 Years | 23 (56.1%) | 0 (0.0%) |
| 65 to 74 Years | 22 (26.2%) | 3 (13.6%) |
| 75 Years and over | 7 (15.6%) | 0 (0.0%) |
| Total | 316 (60.5%) | 3 (0.9%) |
Employment Status by Educational Attainment in Saltsburg borough
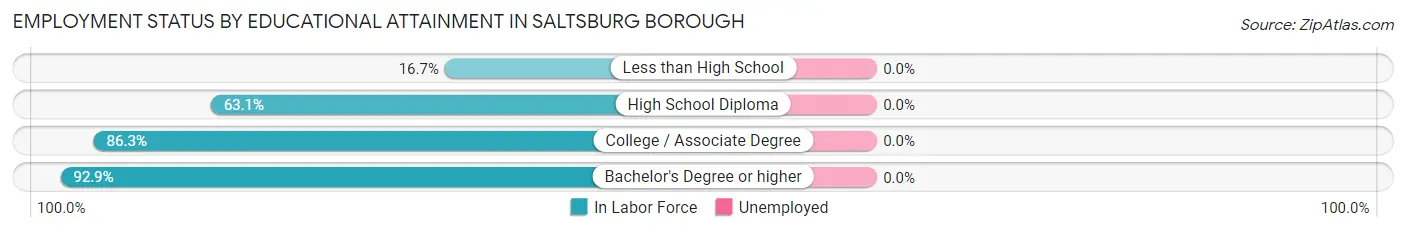
| Educational Attainment | In Labor Force | Unemployed |
| Less than High School | 2 (16.7%) | 0 (0.0%) |
| High School Diploma | 77 (63.1%) | 0 (0.0%) |
| College / Associate Degree | 69 (86.3%) | 0 (0.0%) |
| Bachelor's Degree or higher | 105 (92.9%) | 0 (0.0%) |
| Total | 253 (77.4%) | 0 (0.0%) |
Employment Occupations by Sex in Saltsburg borough
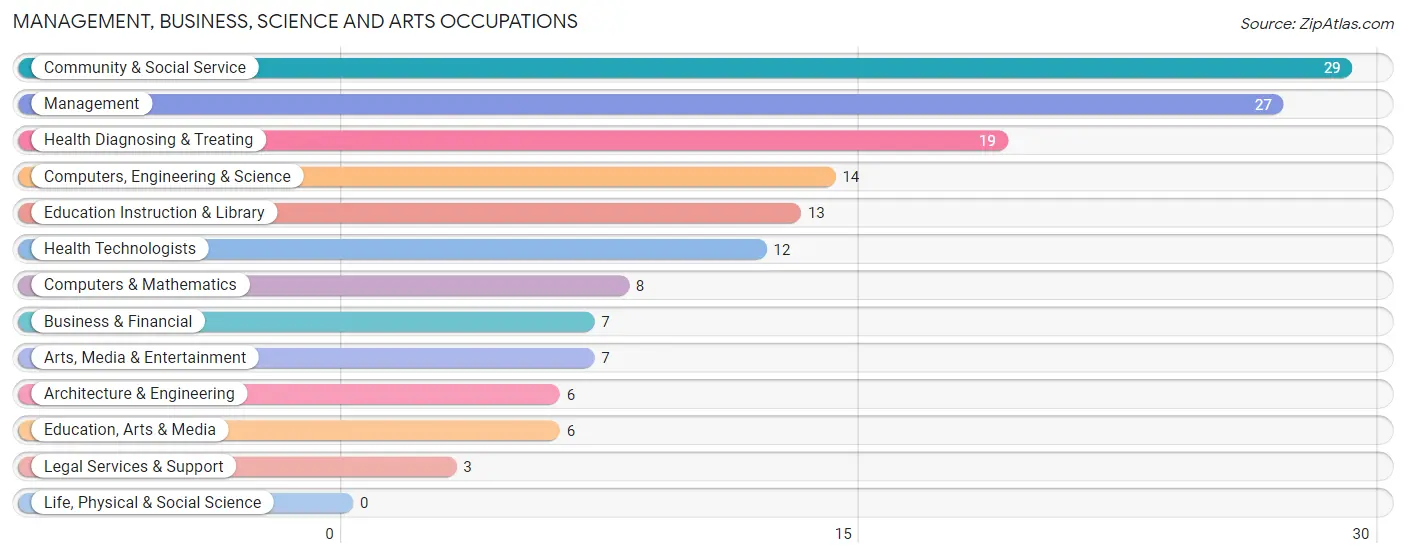
Management, Business, Science and Arts Occupations
The most common Management, Business, Science and Arts occupations in Saltsburg borough are Community & Social Service (29 | 9.3%), Management (27 | 8.6%), Health Diagnosing & Treating (19 | 6.1%), Computers, Engineering & Science (14 | 4.5%), and Education Instruction & Library (13 | 4.2%).
Management, Business, Science and Arts Occupations by Sex
Within the Management, Business, Science and Arts occupations in Saltsburg borough, the most male-oriented occupations are Computers, Engineering & Science (100.0%), Computers & Mathematics (100.0%), and Architecture & Engineering (100.0%), while the most female-oriented occupations are Legal Services & Support (100.0%), Health Diagnosing & Treating (89.5%), and Health Technologists (83.3%).
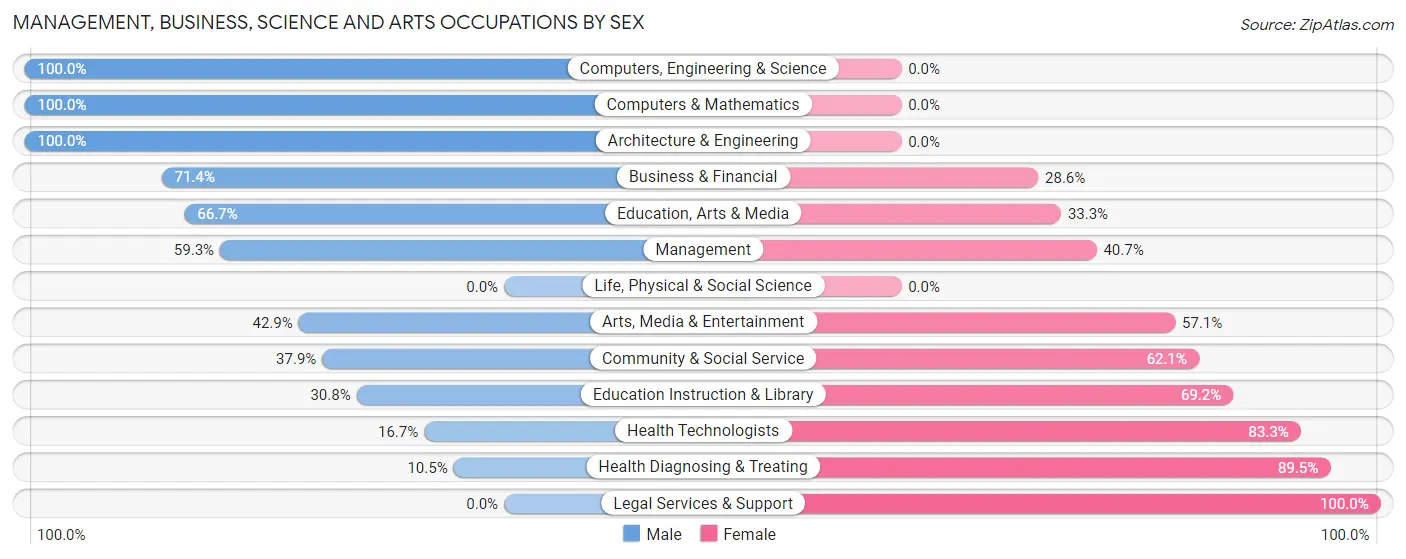
| Occupation | Male | Female |
| Management | 16 (59.3%) | 11 (40.7%) |
| Business & Financial | 5 (71.4%) | 2 (28.6%) |
| Computers, Engineering & Science | 14 (100.0%) | 0 (0.0%) |
| Computers & Mathematics | 8 (100.0%) | 0 (0.0%) |
| Architecture & Engineering | 6 (100.0%) | 0 (0.0%) |
| Life, Physical & Social Science | 0 (0.0%) | 0 (0.0%) |
| Community & Social Service | 11 (37.9%) | 18 (62.1%) |
| Education, Arts & Media | 4 (66.7%) | 2 (33.3%) |
| Legal Services & Support | 0 (0.0%) | 3 (100.0%) |
| Education Instruction & Library | 4 (30.8%) | 9 (69.2%) |
| Arts, Media & Entertainment | 3 (42.9%) | 4 (57.1%) |
| Health Diagnosing & Treating | 2 (10.5%) | 17 (89.5%) |
| Health Technologists | 2 (16.7%) | 10 (83.3%) |
| Total (Category) | 48 (50.0%) | 48 (50.0%) |
| Total (Overall) | 169 (54.0%) | 144 (46.0%) |
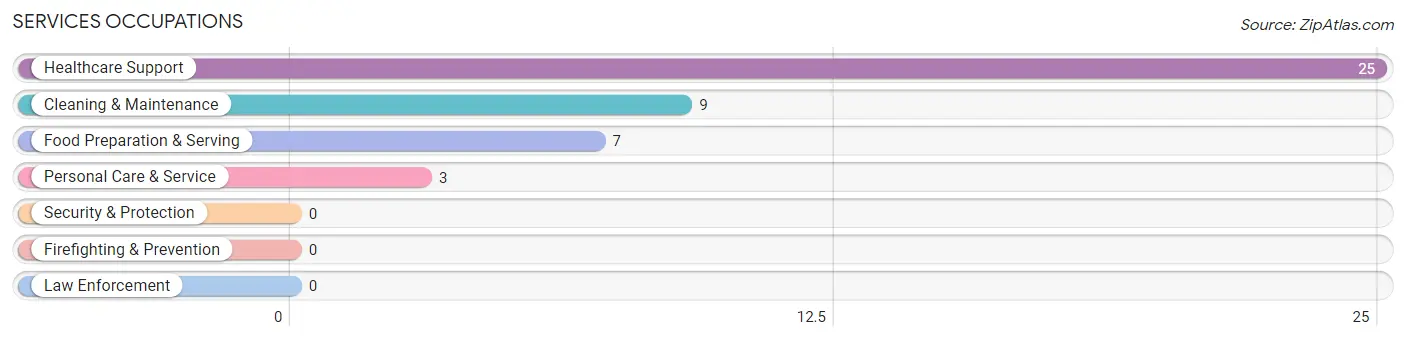
Services Occupations
The most common Services occupations in Saltsburg borough are Healthcare Support (25 | 8.0%), Cleaning & Maintenance (9 | 2.9%), Food Preparation & Serving (7 | 2.2%), and Personal Care & Service (3 | 1.0%).
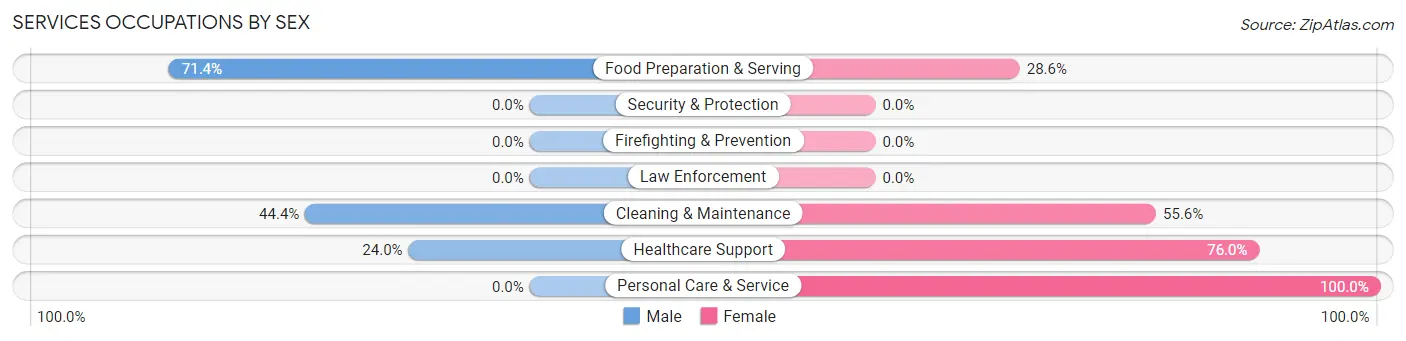
Services Occupations by Sex
Within the Services occupations in Saltsburg borough, the most male-oriented occupations are Food Preparation & Serving (71.4%), Cleaning & Maintenance (44.4%), and Healthcare Support (24.0%), while the most female-oriented occupations are Personal Care & Service (100.0%), Healthcare Support (76.0%), and Cleaning & Maintenance (55.6%).
| Occupation | Male | Female |
| Healthcare Support | 6 (24.0%) | 19 (76.0%) |
| Security & Protection | 0 (0.0%) | 0 (0.0%) |
| Firefighting & Prevention | 0 (0.0%) | 0 (0.0%) |
| Law Enforcement | 0 (0.0%) | 0 (0.0%) |
| Food Preparation & Serving | 5 (71.4%) | 2 (28.6%) |
| Cleaning & Maintenance | 4 (44.4%) | 5 (55.6%) |
| Personal Care & Service | 0 (0.0%) | 3 (100.0%) |
| Total (Category) | 15 (34.1%) | 29 (65.9%) |
| Total (Overall) | 169 (54.0%) | 144 (46.0%) |
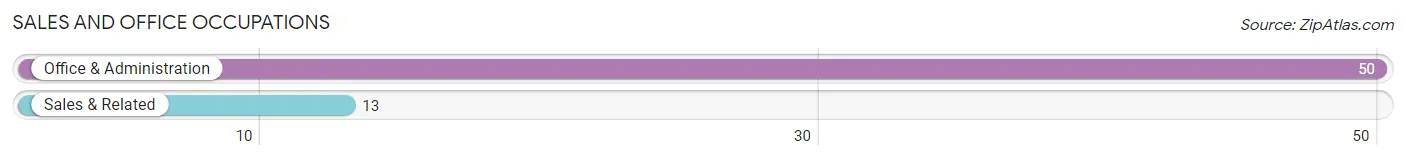
Sales and Office Occupations
The most common Sales and Office occupations in Saltsburg borough are Office & Administration (50 | 16.0%), and Sales & Related (13 | 4.2%).
Sales and Office Occupations by Sex
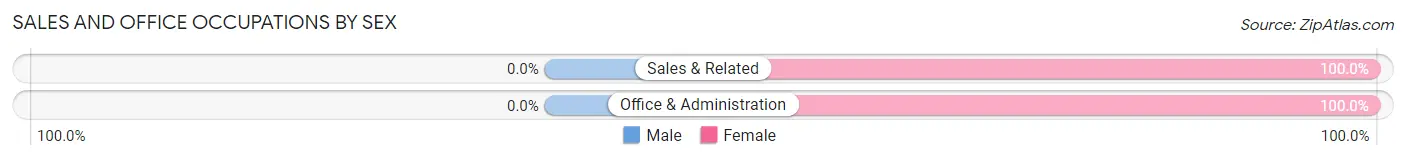
| Occupation | Male | Female |
| Sales & Related | 0 (0.0%) | 13 (100.0%) |
| Office & Administration | 0 (0.0%) | 50 (100.0%) |
| Total (Category) | 0 (0.0%) | 63 (100.0%) |
| Total (Overall) | 169 (54.0%) | 144 (46.0%) |
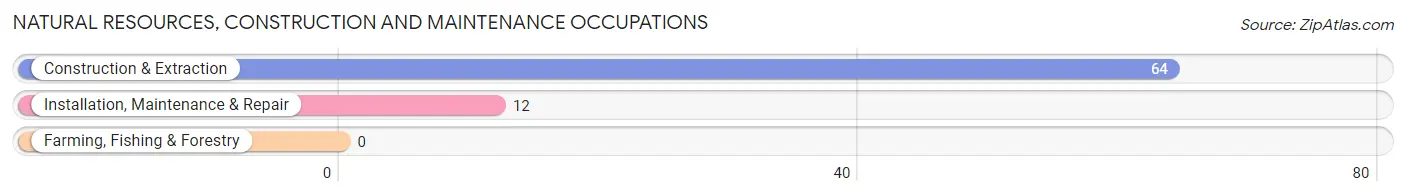
Natural Resources, Construction and Maintenance Occupations
The most common Natural Resources, Construction and Maintenance occupations in Saltsburg borough are Construction & Extraction (64 | 20.4%), and Installation, Maintenance & Repair (12 | 3.8%).
Natural Resources, Construction and Maintenance Occupations by Sex
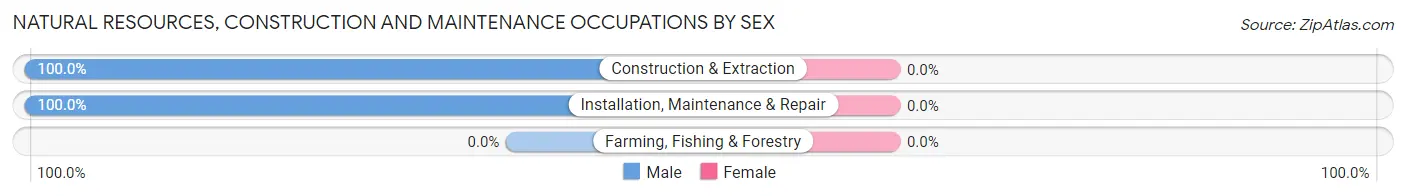
| Occupation | Male | Female |
| Farming, Fishing & Forestry | 0 (0.0%) | 0 (0.0%) |
| Construction & Extraction | 64 (100.0%) | 0 (0.0%) |
| Installation, Maintenance & Repair | 12 (100.0%) | 0 (0.0%) |
| Total (Category) | 76 (100.0%) | 0 (0.0%) |
| Total (Overall) | 169 (54.0%) | 144 (46.0%) |
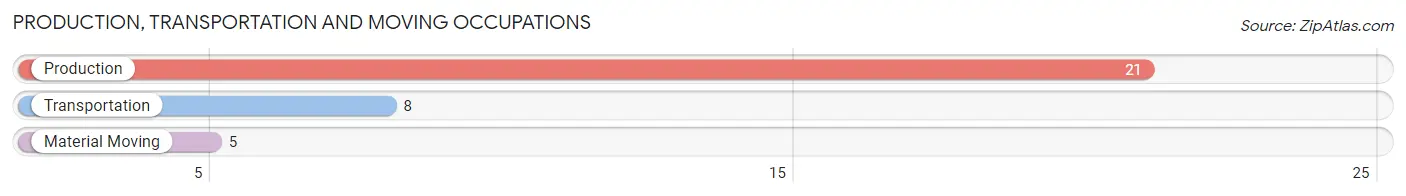
Production, Transportation and Moving Occupations
The most common Production, Transportation and Moving occupations in Saltsburg borough are Production (21 | 6.7%), Transportation (8 | 2.6%), and Material Moving (5 | 1.6%).
Production, Transportation and Moving Occupations by Sex
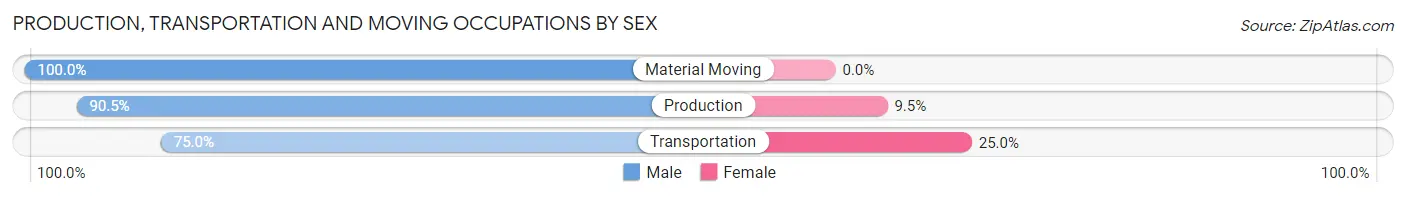
| Occupation | Male | Female |
| Production | 19 (90.5%) | 2 (9.5%) |
| Transportation | 6 (75.0%) | 2 (25.0%) |
| Material Moving | 5 (100.0%) | 0 (0.0%) |
| Total (Category) | 30 (88.2%) | 4 (11.8%) |
| Total (Overall) | 169 (54.0%) | 144 (46.0%) |
Employment Industries by Sex in Saltsburg borough
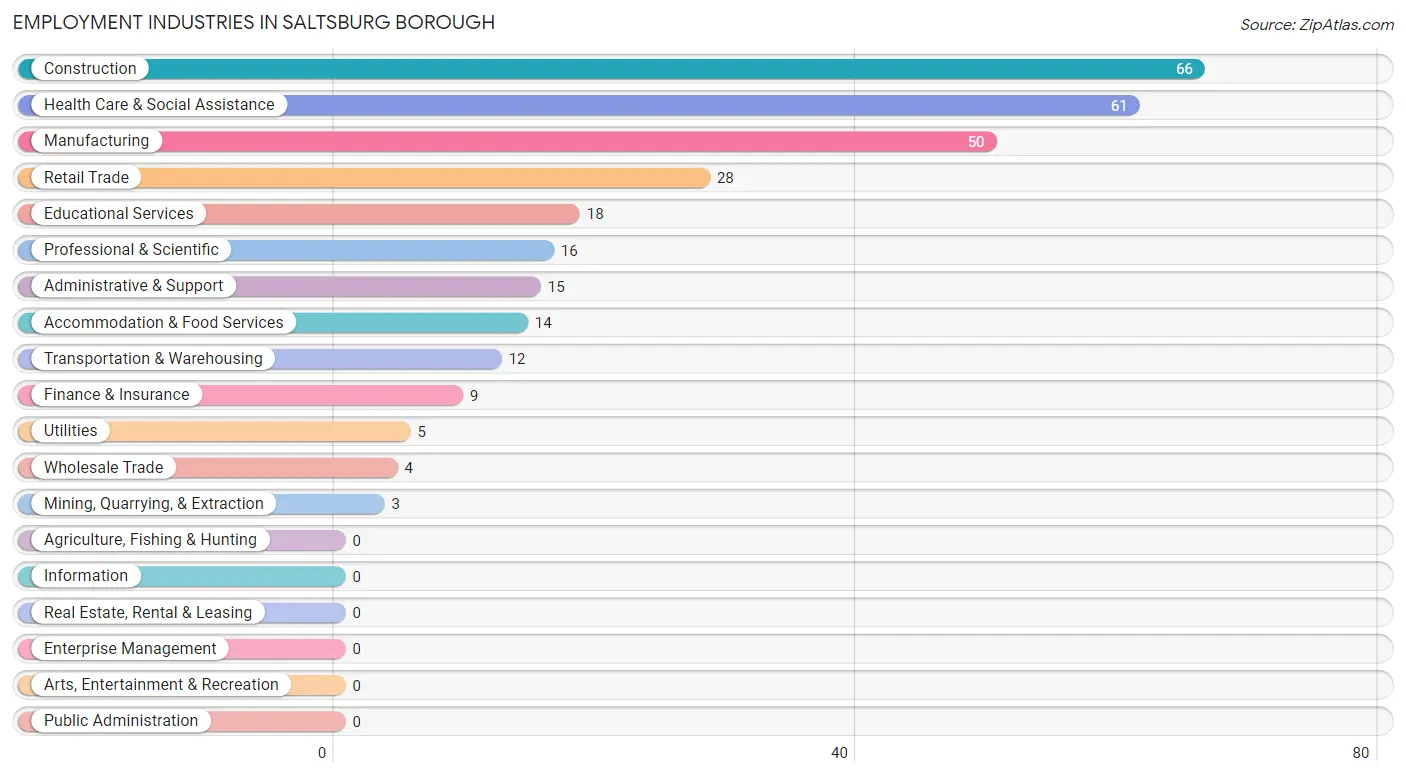
Employment Industries in Saltsburg borough
The major employment industries in Saltsburg borough include Construction (66 | 21.1%), Health Care & Social Assistance (61 | 19.5%), Manufacturing (50 | 16.0%), Retail Trade (28 | 8.9%), and Educational Services (18 | 5.8%).
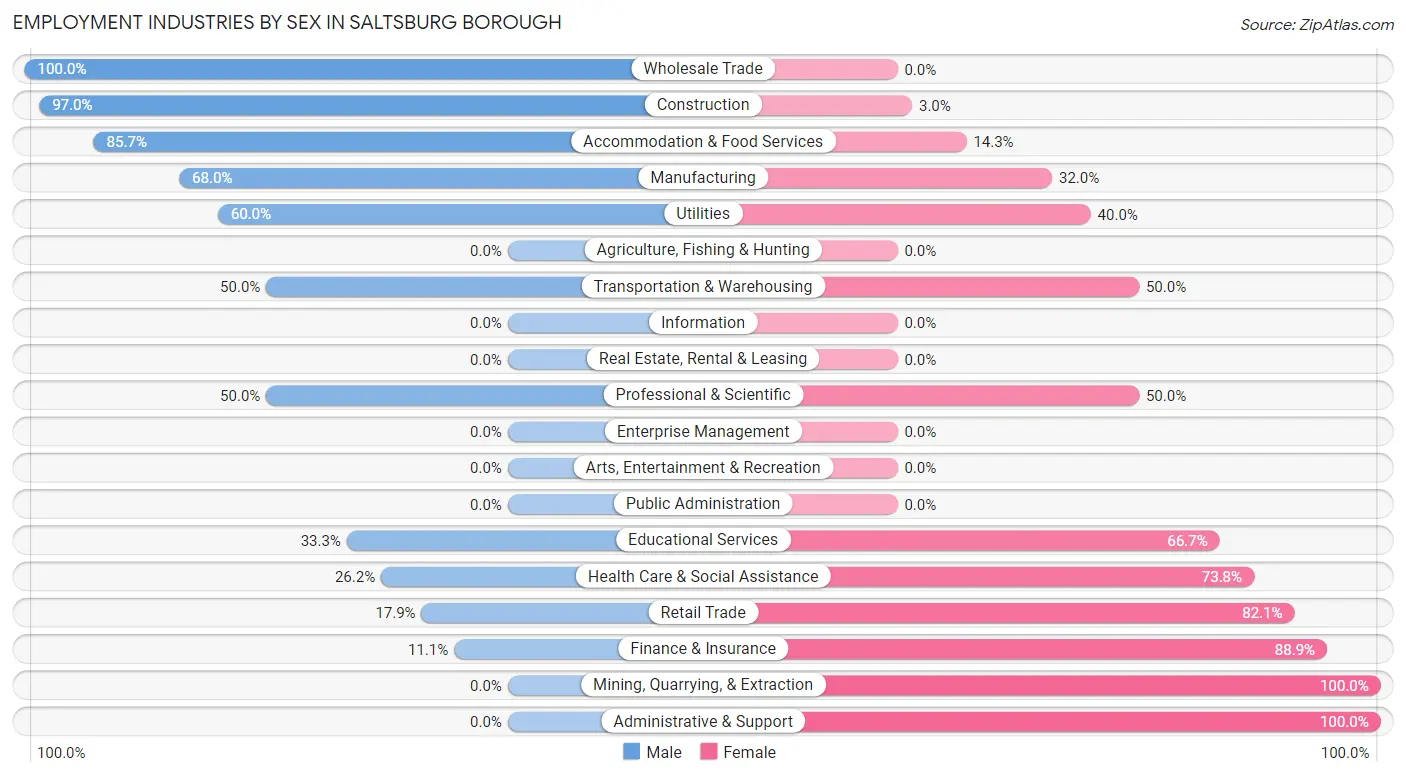
Employment Industries by Sex in Saltsburg borough
The Saltsburg borough industries that see more men than women are Wholesale Trade (100.0%), Construction (97.0%), and Accommodation & Food Services (85.7%), whereas the industries that tend to have a higher number of women are Mining, Quarrying, & Extraction (100.0%), Administrative & Support (100.0%), and Finance & Insurance (88.9%).
| Industry | Male | Female |
| Agriculture, Fishing & Hunting | 0 (0.0%) | 0 (0.0%) |
| Mining, Quarrying, & Extraction | 0 (0.0%) | 3 (100.0%) |
| Construction | 64 (97.0%) | 2 (3.0%) |
| Manufacturing | 34 (68.0%) | 16 (32.0%) |
| Wholesale Trade | 4 (100.0%) | 0 (0.0%) |
| Retail Trade | 5 (17.9%) | 23 (82.1%) |
| Transportation & Warehousing | 6 (50.0%) | 6 (50.0%) |
| Utilities | 3 (60.0%) | 2 (40.0%) |
| Information | 0 (0.0%) | 0 (0.0%) |
| Finance & Insurance | 1 (11.1%) | 8 (88.9%) |
| Real Estate, Rental & Leasing | 0 (0.0%) | 0 (0.0%) |
| Professional & Scientific | 8 (50.0%) | 8 (50.0%) |
| Enterprise Management | 0 (0.0%) | 0 (0.0%) |
| Administrative & Support | 0 (0.0%) | 15 (100.0%) |
| Educational Services | 6 (33.3%) | 12 (66.7%) |
| Health Care & Social Assistance | 16 (26.2%) | 45 (73.8%) |
| Arts, Entertainment & Recreation | 0 (0.0%) | 0 (0.0%) |
| Accommodation & Food Services | 12 (85.7%) | 2 (14.3%) |
| Public Administration | 0 (0.0%) | 0 (0.0%) |
| Total | 169 (54.0%) | 144 (46.0%) |
Education in Saltsburg borough
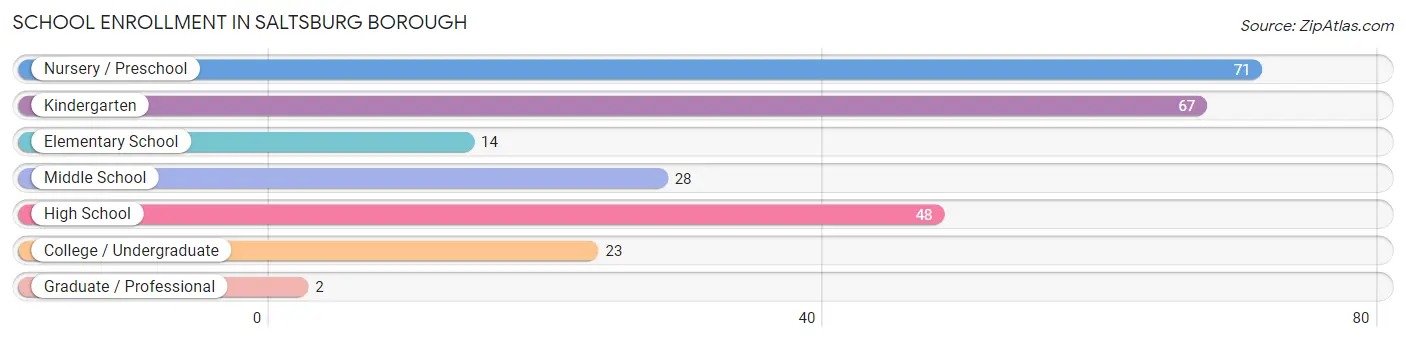
School Enrollment in Saltsburg borough
The most common levels of schooling among the 253 students in Saltsburg borough are nursery / preschool (71 | 28.1%), kindergarten (67 | 26.5%), and high school (48 | 19.0%).
| School Level | # Students | % Students |
| Nursery / Preschool | 71 | 28.1% |
| Kindergarten | 67 | 26.5% |
| Elementary School | 14 | 5.5% |
| Middle School | 28 | 11.1% |
| High School | 48 | 19.0% |
| College / Undergraduate | 23 | 9.1% |
| Graduate / Professional | 2 | 0.8% |
| Total | 253 | 100.0% |
School Enrollment by Age by Funding Source in Saltsburg borough
Out of a total of 253 students who are enrolled in schools in Saltsburg borough, 2 (0.8%) attend a private institution, while the remaining 251 (99.2%) are enrolled in public schools. The age group of 18 to 19 year olds has the highest likelihood of being enrolled in private schools, with 2 (18.2% in the age bracket) enrolled. Conversely, the age group of 3 to 4 year olds has the lowest likelihood of being enrolled in a private school, with 68 (100.0% in the age bracket) attending a public institution.
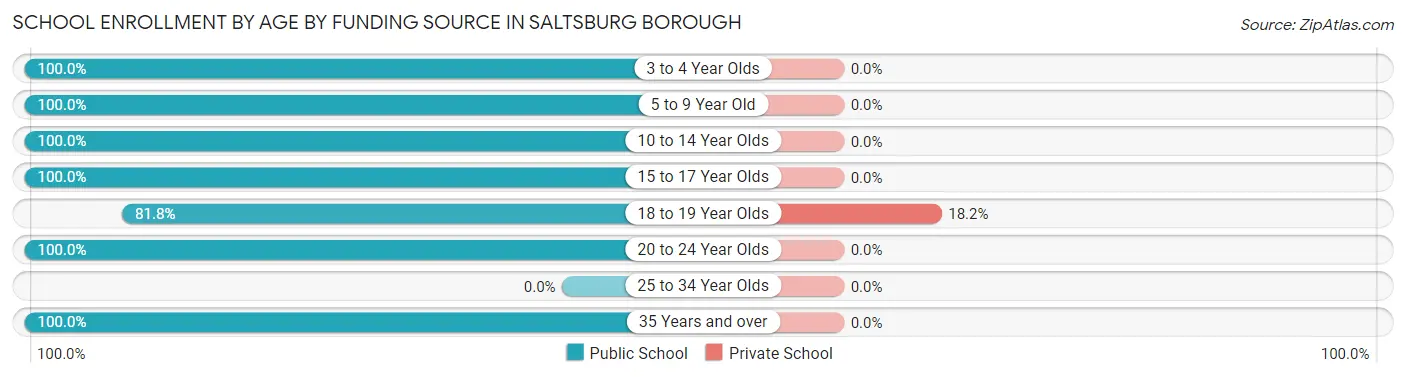
| Age Bracket | Public School | Private School |
| 3 to 4 Year Olds | 68 (100.0%) | 0 (0.0%) |
| 5 to 9 Year Old | 82 (100.0%) | 0 (0.0%) |
| 10 to 14 Year Olds | 32 (100.0%) | 0 (0.0%) |
| 15 to 17 Year Olds | 38 (100.0%) | 0 (0.0%) |
| 18 to 19 Year Olds | 9 (81.8%) | 2 (18.2%) |
| 20 to 24 Year Olds | 15 (100.0%) | 0 (0.0%) |
| 25 to 34 Year Olds | 0 (0.0%) | 0 (0.0%) |
| 35 Years and over | 7 (100.0%) | 0 (0.0%) |
| Total | 251 (99.2%) | 2 (0.8%) |
Educational Attainment by Field of Study in Saltsburg borough
Business (68 | 45.3%), education (32 | 21.3%), science & technology (11 | 7.3%), visual & performing arts (8 | 5.3%), and bio, nature & agricultural (6 | 4.0%) are the most common fields of study among 150 individuals in Saltsburg borough who have obtained a bachelor's degree or higher.
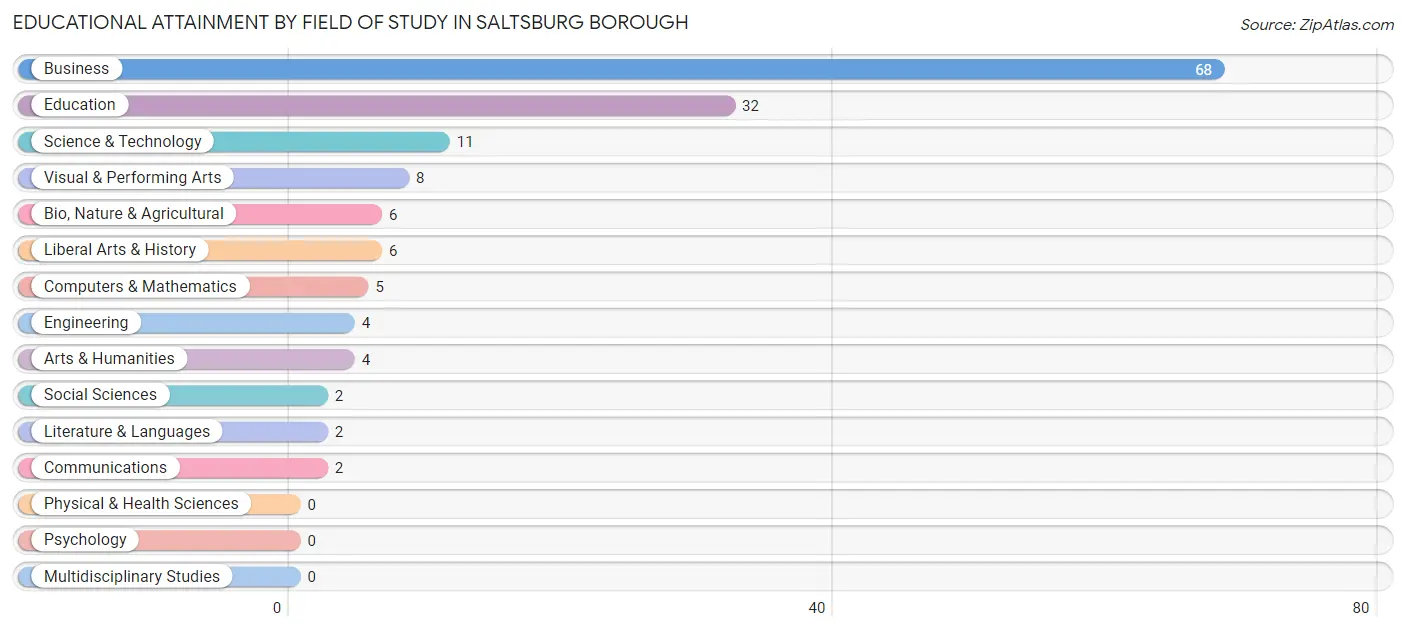
| Field of Study | # Graduates | % Graduates |
| Computers & Mathematics | 5 | 3.3% |
| Bio, Nature & Agricultural | 6 | 4.0% |
| Physical & Health Sciences | 0 | 0.0% |
| Psychology | 0 | 0.0% |
| Social Sciences | 2 | 1.3% |
| Engineering | 4 | 2.7% |
| Multidisciplinary Studies | 0 | 0.0% |
| Science & Technology | 11 | 7.3% |
| Business | 68 | 45.3% |
| Education | 32 | 21.3% |
| Literature & Languages | 2 | 1.3% |
| Liberal Arts & History | 6 | 4.0% |
| Visual & Performing Arts | 8 | 5.3% |
| Communications | 2 | 1.3% |
| Arts & Humanities | 4 | 2.7% |
| Total | 150 | 100.0% |
Transportation & Commute in Saltsburg borough
Vehicle Availability by Sex in Saltsburg borough
The most prevalent vehicle ownership categories in Saltsburg borough are males with 2 vehicles (97, accounting for 57.4%) and females with 2 vehicles (45, making up 67.4%).
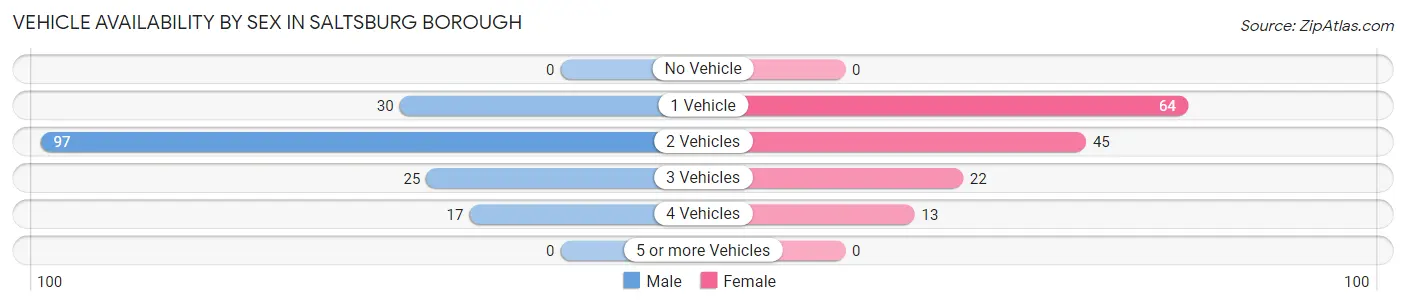
| Vehicles Available | Male | Female |
| No Vehicle | 0 (0.0%) | 0 (0.0%) |
| 1 Vehicle | 30 (17.7%) | 64 (44.4%) |
| 2 Vehicles | 97 (57.4%) | 45 (31.2%) |
| 3 Vehicles | 25 (14.8%) | 22 (15.3%) |
| 4 Vehicles | 17 (10.1%) | 13 (9.0%) |
| 5 or more Vehicles | 0 (0.0%) | 0 (0.0%) |
| Total | 169 (100.0%) | 144 (100.0%) |
Commute Time in Saltsburg borough
The most frequently occuring commute durations in Saltsburg borough are 60 to 89 minutes (69 commuters, 24.6%), 30 to 34 minutes (42 commuters, 15.0%), and 5 to 9 minutes (38 commuters, 13.6%).
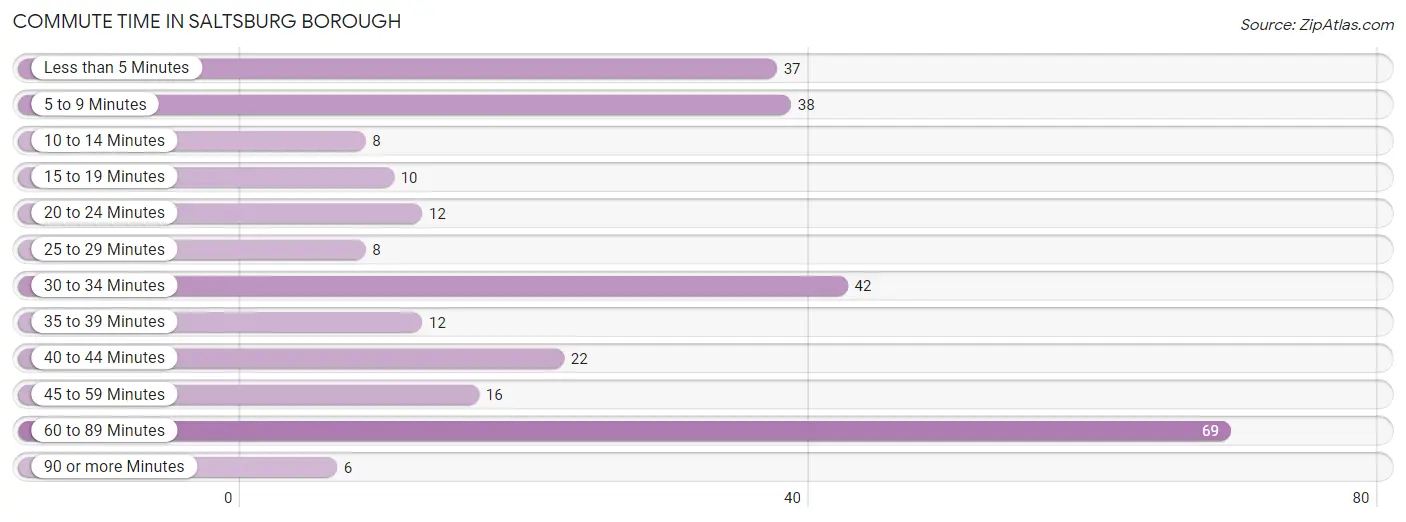
| Commute Time | # Commuters | % Commuters |
| Less than 5 Minutes | 37 | 13.2% |
| 5 to 9 Minutes | 38 | 13.6% |
| 10 to 14 Minutes | 8 | 2.9% |
| 15 to 19 Minutes | 10 | 3.6% |
| 20 to 24 Minutes | 12 | 4.3% |
| 25 to 29 Minutes | 8 | 2.9% |
| 30 to 34 Minutes | 42 | 15.0% |
| 35 to 39 Minutes | 12 | 4.3% |
| 40 to 44 Minutes | 22 | 7.9% |
| 45 to 59 Minutes | 16 | 5.7% |
| 60 to 89 Minutes | 69 | 24.6% |
| 90 or more Minutes | 6 | 2.1% |
Commute Time by Sex in Saltsburg borough
The most common commute times in Saltsburg borough are 60 to 89 minutes (59 commuters, 38.1%) for males and 30 to 34 minutes (24 commuters, 19.2%) for females.
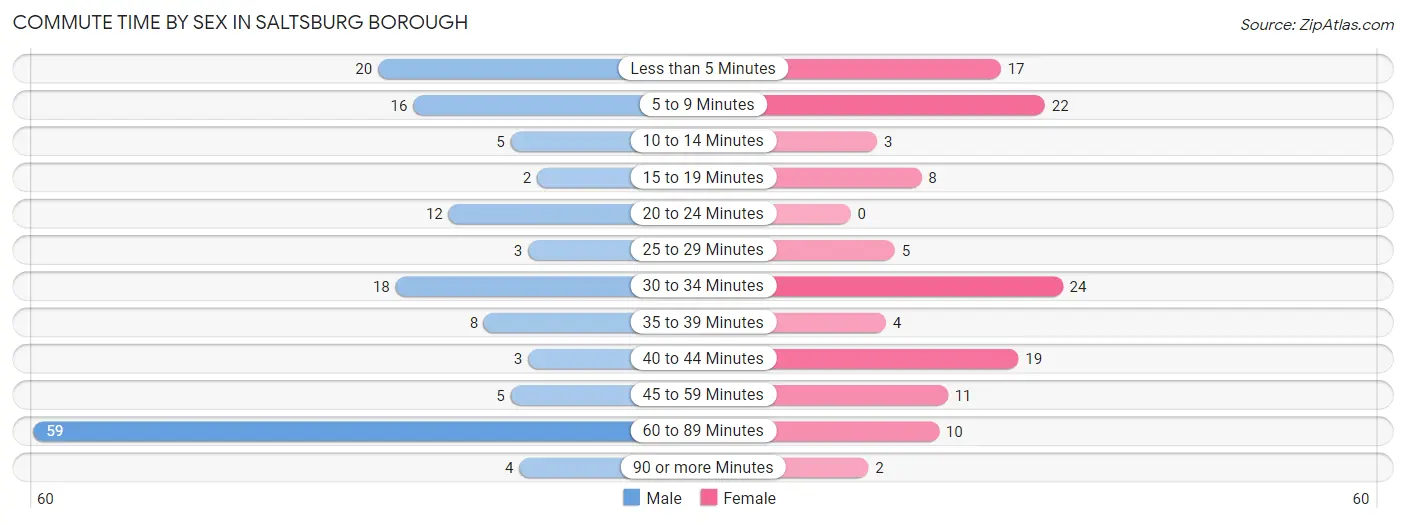
| Commute Time | Male | Female |
| Less than 5 Minutes | 20 (12.9%) | 17 (13.6%) |
| 5 to 9 Minutes | 16 (10.3%) | 22 (17.6%) |
| 10 to 14 Minutes | 5 (3.2%) | 3 (2.4%) |
| 15 to 19 Minutes | 2 (1.3%) | 8 (6.4%) |
| 20 to 24 Minutes | 12 (7.7%) | 0 (0.0%) |
| 25 to 29 Minutes | 3 (1.9%) | 5 (4.0%) |
| 30 to 34 Minutes | 18 (11.6%) | 24 (19.2%) |
| 35 to 39 Minutes | 8 (5.2%) | 4 (3.2%) |
| 40 to 44 Minutes | 3 (1.9%) | 19 (15.2%) |
| 45 to 59 Minutes | 5 (3.2%) | 11 (8.8%) |
| 60 to 89 Minutes | 59 (38.1%) | 10 (8.0%) |
| 90 or more Minutes | 4 (2.6%) | 2 (1.6%) |
Time of Departure to Work by Sex in Saltsburg borough
The most frequent times of departure to work in Saltsburg borough are 6:00 AM to 6:29 AM (63, 40.6%) for males and 7:30 AM to 7:59 AM (38, 30.4%) for females.
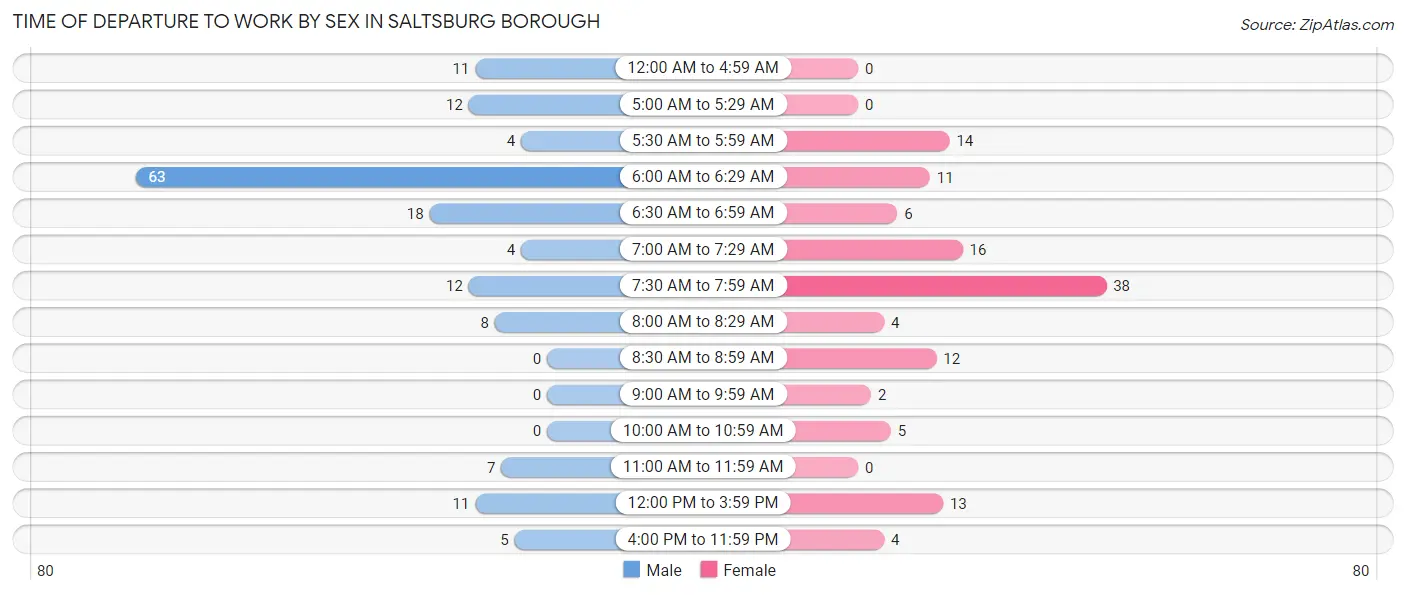
| Time of Departure | Male | Female |
| 12:00 AM to 4:59 AM | 11 (7.1%) | 0 (0.0%) |
| 5:00 AM to 5:29 AM | 12 (7.7%) | 0 (0.0%) |
| 5:30 AM to 5:59 AM | 4 (2.6%) | 14 (11.2%) |
| 6:00 AM to 6:29 AM | 63 (40.6%) | 11 (8.8%) |
| 6:30 AM to 6:59 AM | 18 (11.6%) | 6 (4.8%) |
| 7:00 AM to 7:29 AM | 4 (2.6%) | 16 (12.8%) |
| 7:30 AM to 7:59 AM | 12 (7.7%) | 38 (30.4%) |
| 8:00 AM to 8:29 AM | 8 (5.2%) | 4 (3.2%) |
| 8:30 AM to 8:59 AM | 0 (0.0%) | 12 (9.6%) |
| 9:00 AM to 9:59 AM | 0 (0.0%) | 2 (1.6%) |
| 10:00 AM to 10:59 AM | 0 (0.0%) | 5 (4.0%) |
| 11:00 AM to 11:59 AM | 7 (4.5%) | 0 (0.0%) |
| 12:00 PM to 3:59 PM | 11 (7.1%) | 13 (10.4%) |
| 4:00 PM to 11:59 PM | 5 (3.2%) | 4 (3.2%) |
| Total | 155 (100.0%) | 125 (100.0%) |
Housing Occupancy in Saltsburg borough
Occupancy by Ownership in Saltsburg borough
Of the total 307 dwellings in Saltsburg borough, owner-occupied units account for 216 (70.4%), while renter-occupied units make up 91 (29.6%).
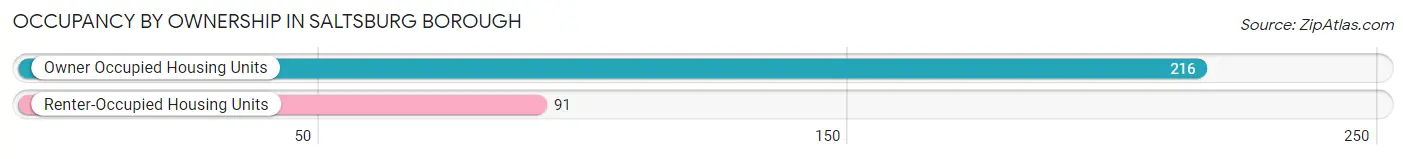
| Occupancy | # Housing Units | % Housing Units |
| Owner Occupied Housing Units | 216 | 70.4% |
| Renter-Occupied Housing Units | 91 | 29.6% |
| Total Occupied Housing Units | 307 | 100.0% |
Occupancy by Household Size in Saltsburg borough
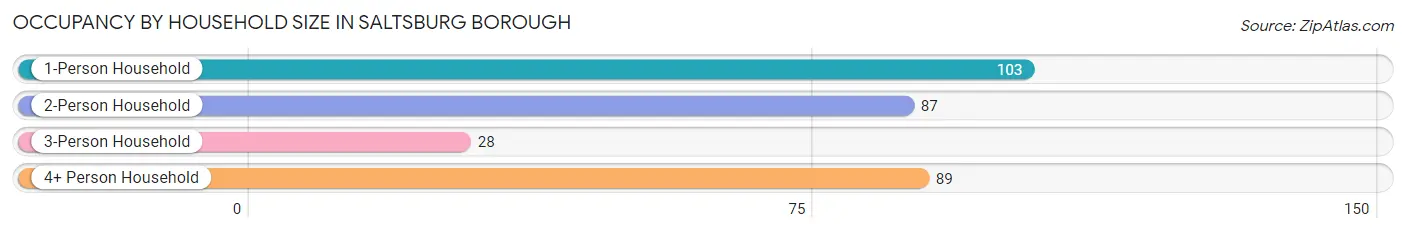
| Household Size | # Housing Units | % Housing Units |
| 1-Person Household | 103 | 33.6% |
| 2-Person Household | 87 | 28.3% |
| 3-Person Household | 28 | 9.1% |
| 4+ Person Household | 89 | 29.0% |
| Total Housing Units | 307 | 100.0% |
Occupancy by Ownership by Household Size in Saltsburg borough
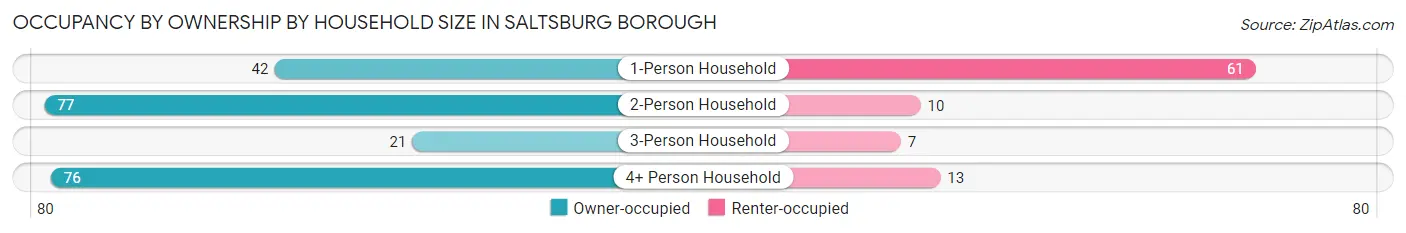
| Household Size | Owner-occupied | Renter-occupied |
| 1-Person Household | 42 (40.8%) | 61 (59.2%) |
| 2-Person Household | 77 (88.5%) | 10 (11.5%) |
| 3-Person Household | 21 (75.0%) | 7 (25.0%) |
| 4+ Person Household | 76 (85.4%) | 13 (14.6%) |
| Total Housing Units | 216 (70.4%) | 91 (29.6%) |
Occupancy by Educational Attainment in Saltsburg borough
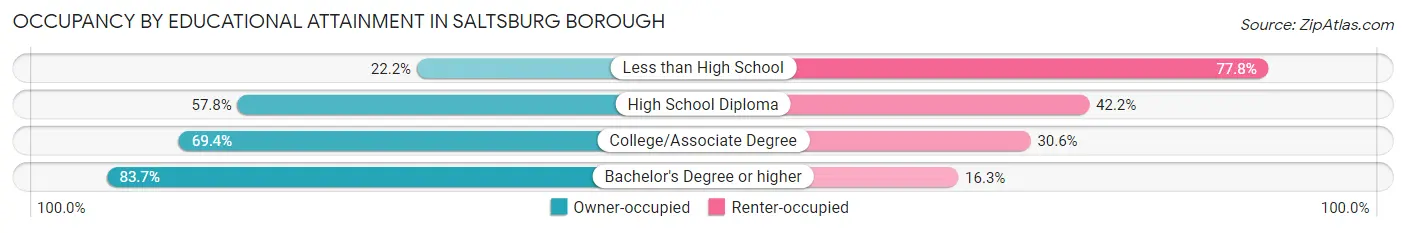
| Household Size | Owner-occupied | Renter-occupied |
| Less than High School | 2 (22.2%) | 7 (77.8%) |
| High School Diploma | 52 (57.8%) | 38 (42.2%) |
| College/Associate Degree | 59 (69.4%) | 26 (30.6%) |
| Bachelor's Degree or higher | 103 (83.7%) | 20 (16.3%) |
Occupancy by Age of Householder in Saltsburg borough
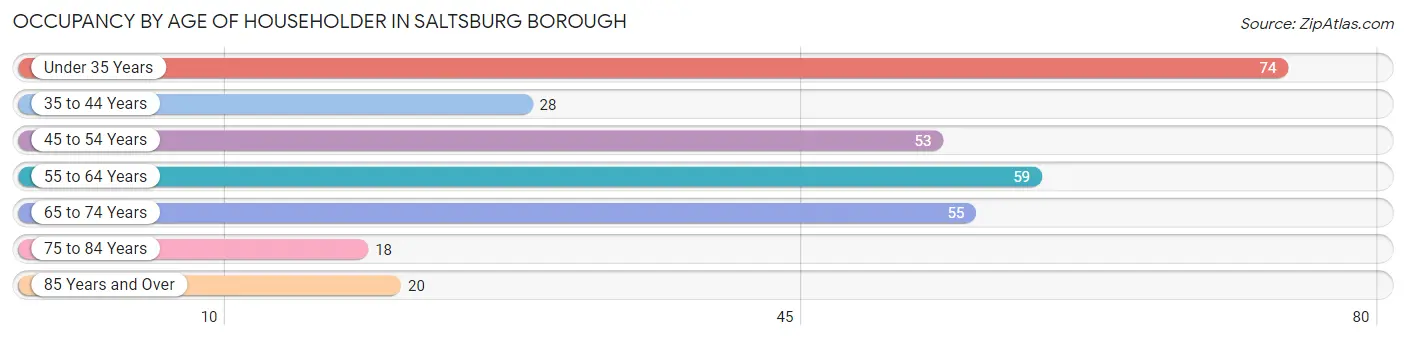
| Age Bracket | # Households | % Households |
| Under 35 Years | 74 | 24.1% |
| 35 to 44 Years | 28 | 9.1% |
| 45 to 54 Years | 53 | 17.3% |
| 55 to 64 Years | 59 | 19.2% |
| 65 to 74 Years | 55 | 17.9% |
| 75 to 84 Years | 18 | 5.9% |
| 85 Years and Over | 20 | 6.5% |
| Total | 307 | 100.0% |
Housing Finances in Saltsburg borough
Median Income by Occupancy in Saltsburg borough
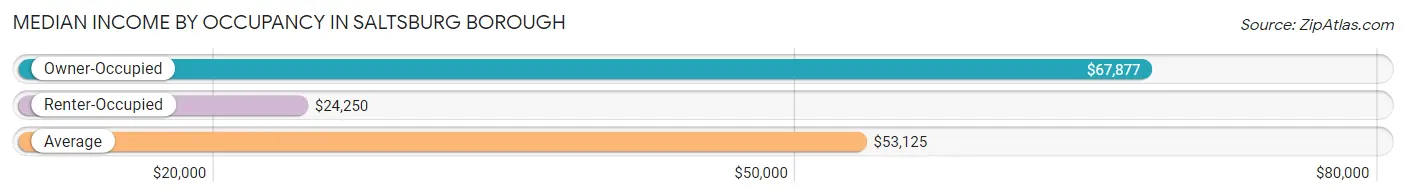
| Occupancy Type | # Households | Median Income |
| Owner-Occupied | 216 (70.4%) | $67,877 |
| Renter-Occupied | 91 (29.6%) | $24,250 |
| Average | 307 (100.0%) | $53,125 |
Occupancy by Householder Income Bracket in Saltsburg borough
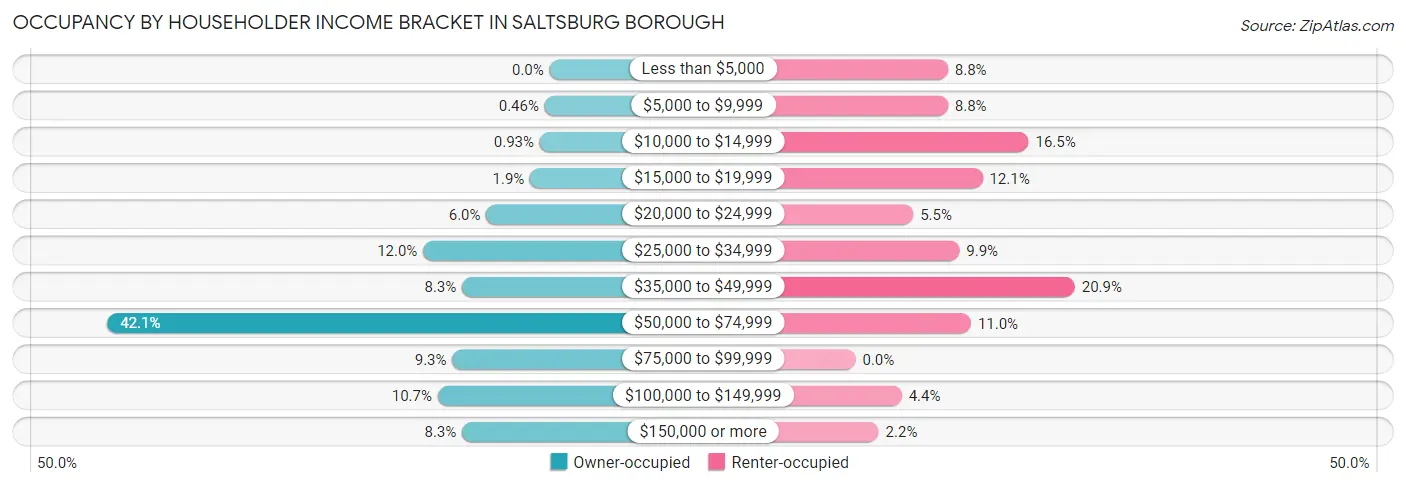
| Income Bracket | Owner-occupied | Renter-occupied |
| Less than $5,000 | 0 (0.0%) | 8 (8.8%) |
| $5,000 to $9,999 | 1 (0.5%) | 8 (8.8%) |
| $10,000 to $14,999 | 2 (0.9%) | 15 (16.5%) |
| $15,000 to $19,999 | 4 (1.8%) | 11 (12.1%) |
| $20,000 to $24,999 | 13 (6.0%) | 5 (5.5%) |
| $25,000 to $34,999 | 26 (12.0%) | 9 (9.9%) |
| $35,000 to $49,999 | 18 (8.3%) | 19 (20.9%) |
| $50,000 to $74,999 | 91 (42.1%) | 10 (11.0%) |
| $75,000 to $99,999 | 20 (9.3%) | 0 (0.0%) |
| $100,000 to $149,999 | 23 (10.6%) | 4 (4.4%) |
| $150,000 or more | 18 (8.3%) | 2 (2.2%) |
| Total | 216 (100.0%) | 91 (100.0%) |
Monthly Housing Cost Tiers in Saltsburg borough
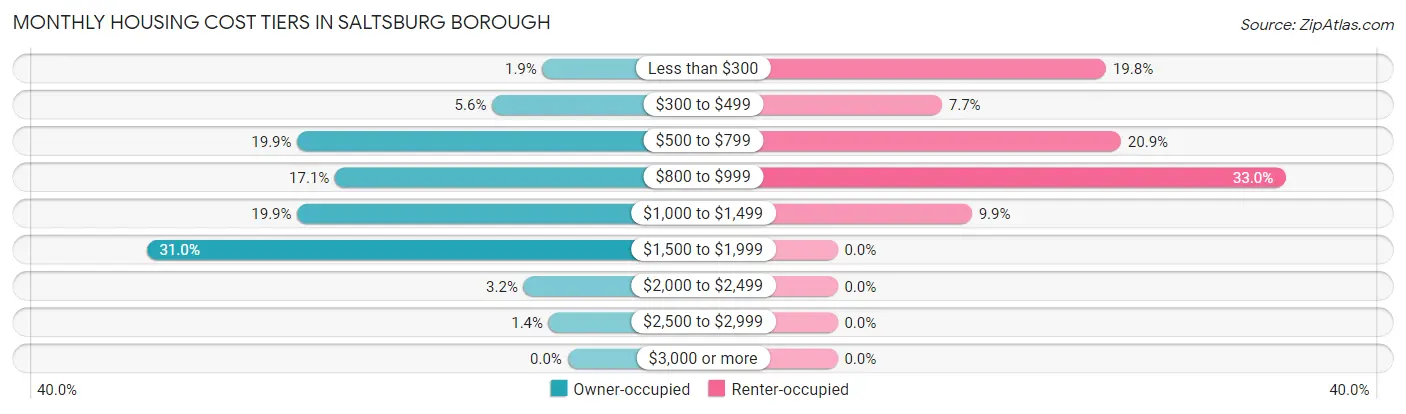
| Monthly Cost | Owner-occupied | Renter-occupied |
| Less than $300 | 4 (1.8%) | 18 (19.8%) |
| $300 to $499 | 12 (5.6%) | 7 (7.7%) |
| $500 to $799 | 43 (19.9%) | 19 (20.9%) |
| $800 to $999 | 37 (17.1%) | 30 (33.0%) |
| $1,000 to $1,499 | 43 (19.9%) | 9 (9.9%) |
| $1,500 to $1,999 | 67 (31.0%) | 0 (0.0%) |
| $2,000 to $2,499 | 7 (3.2%) | 0 (0.0%) |
| $2,500 to $2,999 | 3 (1.4%) | 0 (0.0%) |
| $3,000 or more | 0 (0.0%) | 0 (0.0%) |
| Total | 216 (100.0%) | 91 (100.0%) |
Physical Housing Characteristics in Saltsburg borough
Housing Structures in Saltsburg borough
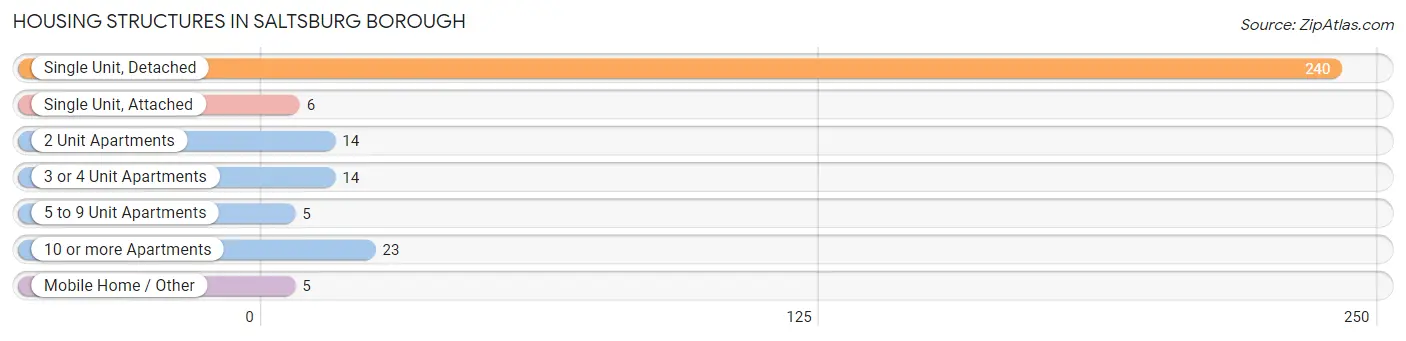
| Structure Type | # Housing Units | % Housing Units |
| Single Unit, Detached | 240 | 78.2% |
| Single Unit, Attached | 6 | 1.9% |
| 2 Unit Apartments | 14 | 4.6% |
| 3 or 4 Unit Apartments | 14 | 4.6% |
| 5 to 9 Unit Apartments | 5 | 1.6% |
| 10 or more Apartments | 23 | 7.5% |
| Mobile Home / Other | 5 | 1.6% |
| Total | 307 | 100.0% |
Housing Structures by Occupancy in Saltsburg borough
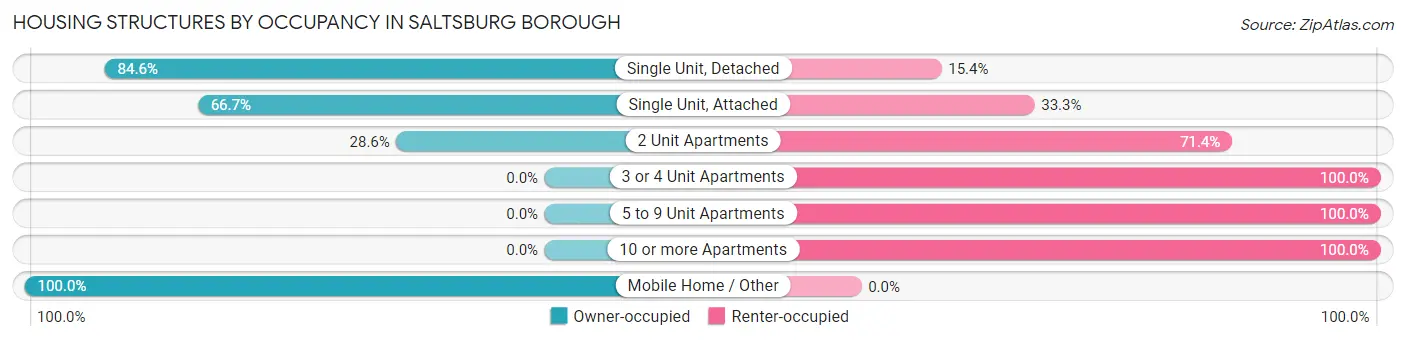
| Structure Type | Owner-occupied | Renter-occupied |
| Single Unit, Detached | 203 (84.6%) | 37 (15.4%) |
| Single Unit, Attached | 4 (66.7%) | 2 (33.3%) |
| 2 Unit Apartments | 4 (28.6%) | 10 (71.4%) |
| 3 or 4 Unit Apartments | 0 (0.0%) | 14 (100.0%) |
| 5 to 9 Unit Apartments | 0 (0.0%) | 5 (100.0%) |
| 10 or more Apartments | 0 (0.0%) | 23 (100.0%) |
| Mobile Home / Other | 5 (100.0%) | 0 (0.0%) |
| Total | 216 (70.4%) | 91 (29.6%) |
Housing Structures by Number of Rooms in Saltsburg borough
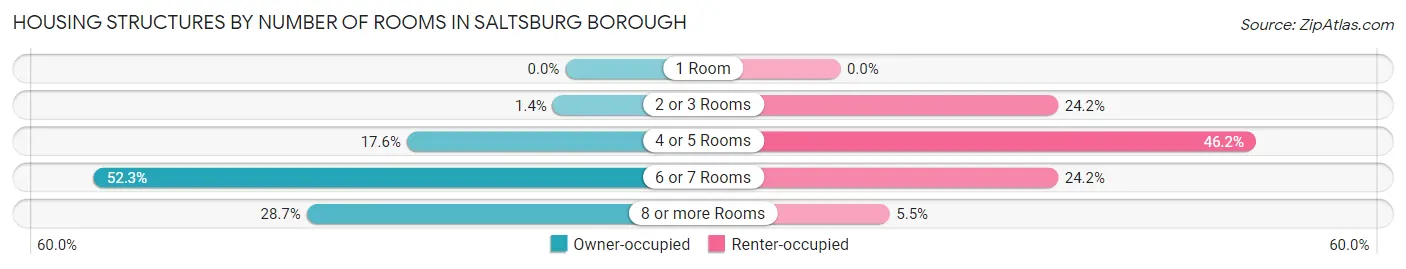
| Number of Rooms | Owner-occupied | Renter-occupied |
| 1 Room | 0 (0.0%) | 0 (0.0%) |
| 2 or 3 Rooms | 3 (1.4%) | 22 (24.2%) |
| 4 or 5 Rooms | 38 (17.6%) | 42 (46.2%) |
| 6 or 7 Rooms | 113 (52.3%) | 22 (24.2%) |
| 8 or more Rooms | 62 (28.7%) | 5 (5.5%) |
| Total | 216 (100.0%) | 91 (100.0%) |
Housing Structure by Heating Type in Saltsburg borough
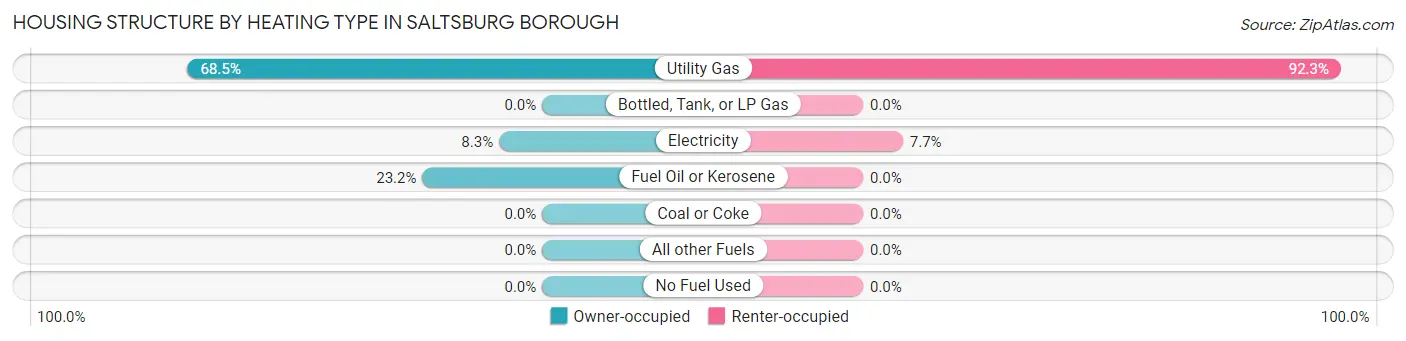
| Heating Type | Owner-occupied | Renter-occupied |
| Utility Gas | 148 (68.5%) | 84 (92.3%) |
| Bottled, Tank, or LP Gas | 0 (0.0%) | 0 (0.0%) |
| Electricity | 18 (8.3%) | 7 (7.7%) |
| Fuel Oil or Kerosene | 50 (23.2%) | 0 (0.0%) |
| Coal or Coke | 0 (0.0%) | 0 (0.0%) |
| All other Fuels | 0 (0.0%) | 0 (0.0%) |
| No Fuel Used | 0 (0.0%) | 0 (0.0%) |
| Total | 216 (100.0%) | 91 (100.0%) |
Household Vehicle Usage in Saltsburg borough
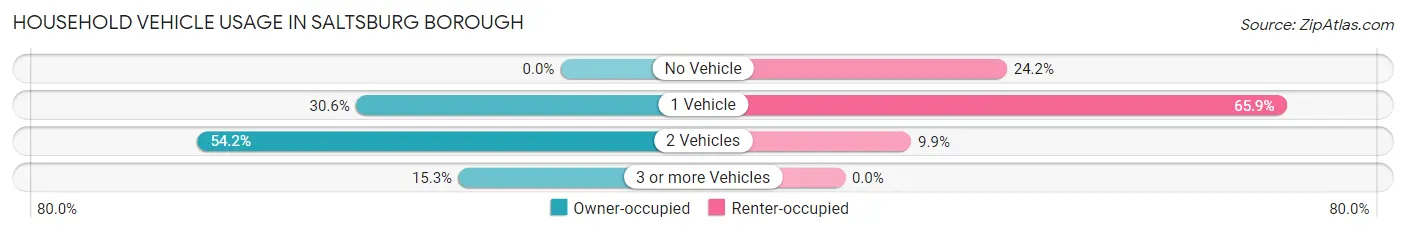
| Vehicles per Household | Owner-occupied | Renter-occupied |
| No Vehicle | 0 (0.0%) | 22 (24.2%) |
| 1 Vehicle | 66 (30.6%) | 60 (65.9%) |
| 2 Vehicles | 117 (54.2%) | 9 (9.9%) |
| 3 or more Vehicles | 33 (15.3%) | 0 (0.0%) |
| Total | 216 (100.0%) | 91 (100.0%) |
Real Estate & Mortgages in Saltsburg borough
Real Estate and Mortgage Overview in Saltsburg borough
| Characteristic | Without Mortgage | With Mortgage |
| Housing Units | 62 | 154 |
| Median Property Value | $114,300 | $133,300 |
| Median Household Income | $53,500 | $14 |
| Monthly Housing Costs | $579 | $0 |
| Real Estate Taxes | $2,211 | $0 |
Property Value by Mortgage Status in Saltsburg borough
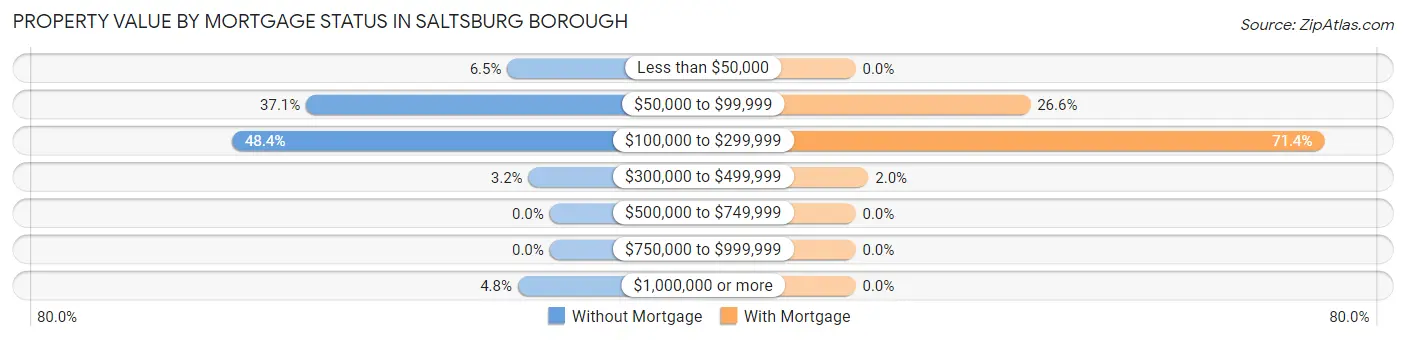
| Property Value | Without Mortgage | With Mortgage |
| Less than $50,000 | 4 (6.5%) | 0 (0.0%) |
| $50,000 to $99,999 | 23 (37.1%) | 41 (26.6%) |
| $100,000 to $299,999 | 30 (48.4%) | 110 (71.4%) |
| $300,000 to $499,999 | 2 (3.2%) | 3 (1.9%) |
| $500,000 to $749,999 | 0 (0.0%) | 0 (0.0%) |
| $750,000 to $999,999 | 0 (0.0%) | 0 (0.0%) |
| $1,000,000 or more | 3 (4.8%) | 0 (0.0%) |
| Total | 62 (100.0%) | 154 (100.0%) |
Household Income by Mortgage Status in Saltsburg borough
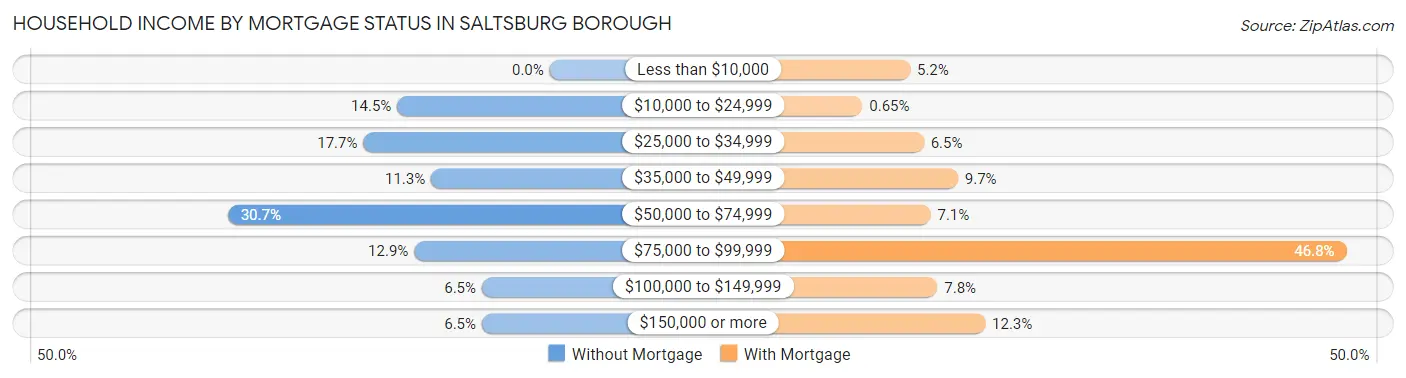
| Household Income | Without Mortgage | With Mortgage |
| Less than $10,000 | 0 (0.0%) | 8 (5.2%) |
| $10,000 to $24,999 | 9 (14.5%) | 1 (0.6%) |
| $25,000 to $34,999 | 11 (17.7%) | 10 (6.5%) |
| $35,000 to $49,999 | 7 (11.3%) | 15 (9.7%) |
| $50,000 to $74,999 | 19 (30.6%) | 11 (7.1%) |
| $75,000 to $99,999 | 8 (12.9%) | 72 (46.8%) |
| $100,000 to $149,999 | 4 (6.5%) | 12 (7.8%) |
| $150,000 or more | 4 (6.5%) | 19 (12.3%) |
| Total | 62 (100.0%) | 154 (100.0%) |
Property Value to Household Income Ratio in Saltsburg borough
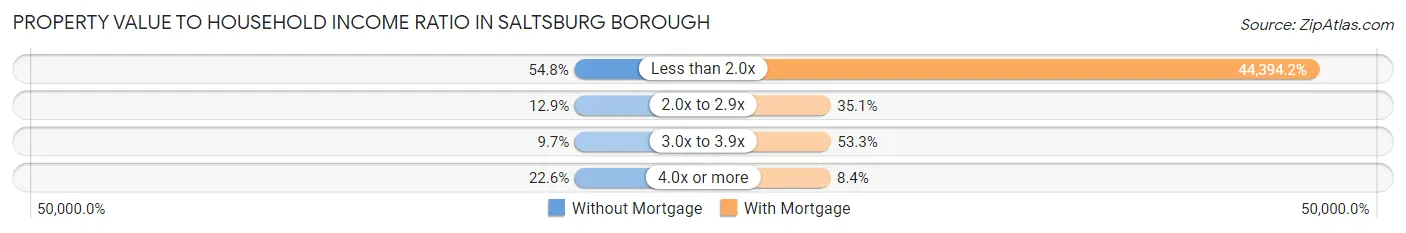
| Value-to-Income Ratio | Without Mortgage | With Mortgage |
| Less than 2.0x | 34 (54.8%) | 68,367 (44,394.2%) |
| 2.0x to 2.9x | 8 (12.9%) | 54 (35.1%) |
| 3.0x to 3.9x | 6 (9.7%) | 82 (53.2%) |
| 4.0x or more | 14 (22.6%) | 13 (8.4%) |
| Total | 62 (100.0%) | 154 (100.0%) |
Real Estate Taxes by Mortgage Status in Saltsburg borough
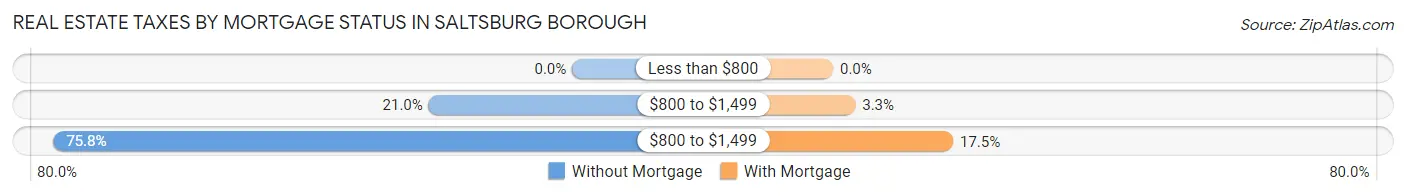
| Property Taxes | Without Mortgage | With Mortgage |
| Less than $800 | 0 (0.0%) | 0 (0.0%) |
| $800 to $1,499 | 13 (21.0%) | 5 (3.3%) |
| $800 to $1,499 | 47 (75.8%) | 27 (17.5%) |
| Total | 62 (100.0%) | 154 (100.0%) |
Health & Disability in Saltsburg borough
Health Insurance Coverage by Age in Saltsburg borough
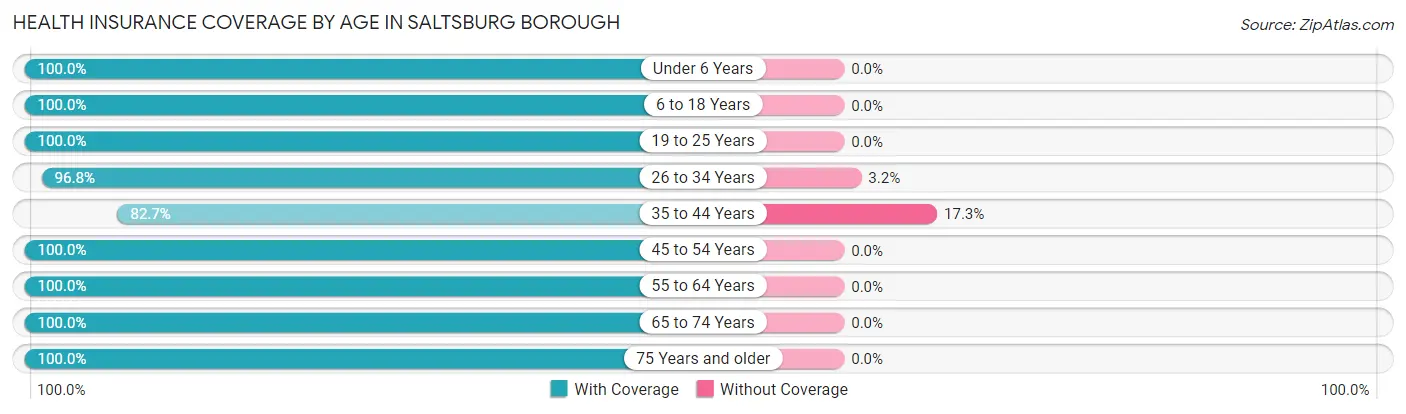
| Age Bracket | With Coverage | Without Coverage |
| Under 6 Years | 153 (100.0%) | 0 (0.0%) |
| 6 to 18 Years | 101 (100.0%) | 0 (0.0%) |
| 19 to 25 Years | 42 (100.0%) | 0 (0.0%) |
| 26 to 34 Years | 91 (96.8%) | 3 (3.2%) |
| 35 to 44 Years | 43 (82.7%) | 9 (17.3%) |
| 45 to 54 Years | 93 (100.0%) | 0 (0.0%) |
| 55 to 64 Years | 88 (100.0%) | 0 (0.0%) |
| 65 to 74 Years | 84 (100.0%) | 0 (0.0%) |
| 75 Years and older | 45 (100.0%) | 0 (0.0%) |
| Total | 740 (98.4%) | 12 (1.6%) |
Health Insurance Coverage by Citizenship Status in Saltsburg borough
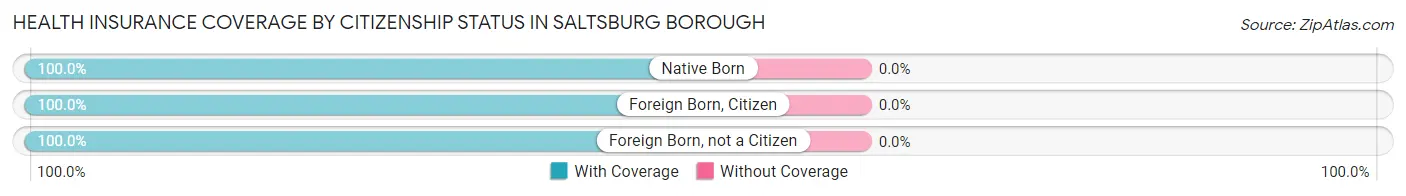
| Citizenship Status | With Coverage | Without Coverage |
| Native Born | 153 (100.0%) | 0 (0.0%) |
| Foreign Born, Citizen | 101 (100.0%) | 0 (0.0%) |
| Foreign Born, not a Citizen | 42 (100.0%) | 0 (0.0%) |
Health Insurance Coverage by Household Income in Saltsburg borough
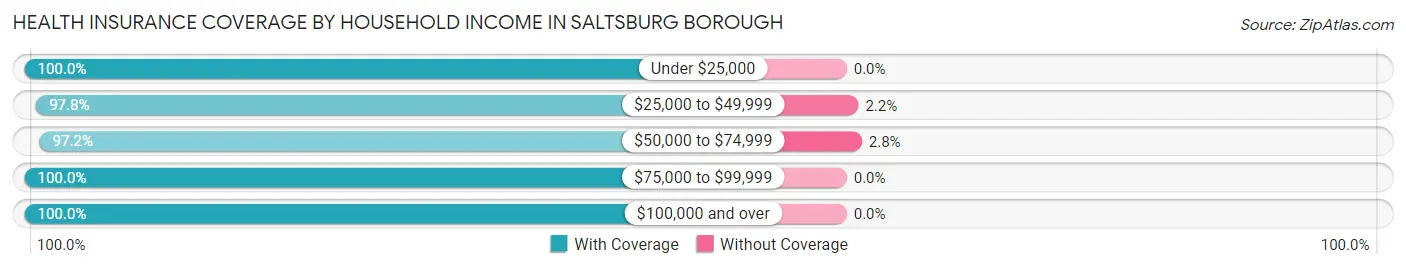
| Household Income | With Coverage | Without Coverage |
| Under $25,000 | 98 (100.0%) | 0 (0.0%) |
| $25,000 to $49,999 | 134 (97.8%) | 3 (2.2%) |
| $50,000 to $74,999 | 310 (97.2%) | 9 (2.8%) |
| $75,000 to $99,999 | 48 (100.0%) | 0 (0.0%) |
| $100,000 and over | 150 (100.0%) | 0 (0.0%) |
Public vs Private Health Insurance Coverage by Age in Saltsburg borough
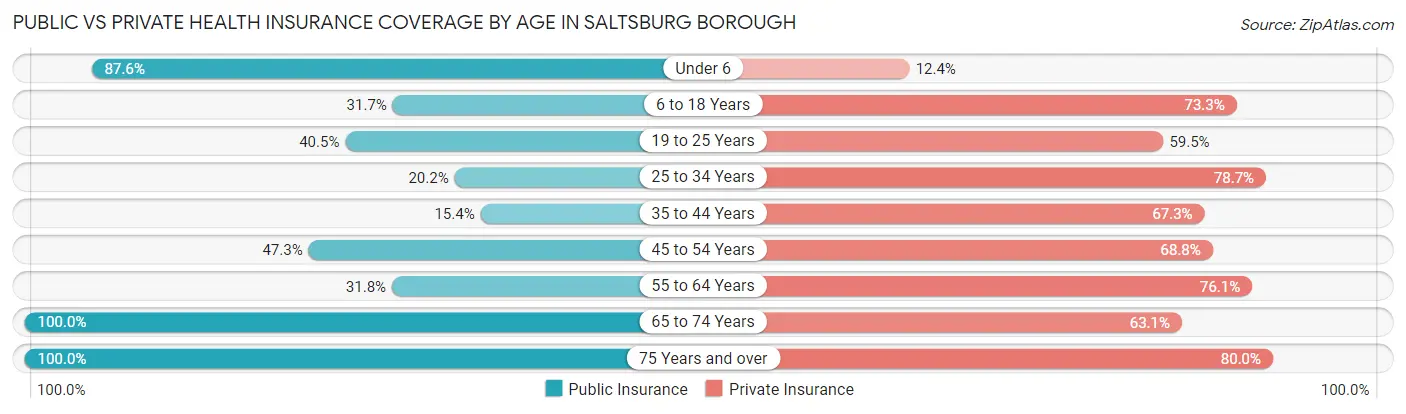
| Age Bracket | Public Insurance | Private Insurance |
| Under 6 | 134 (87.6%) | 19 (12.4%) |
| 6 to 18 Years | 32 (31.7%) | 74 (73.3%) |
| 19 to 25 Years | 17 (40.5%) | 25 (59.5%) |
| 25 to 34 Years | 19 (20.2%) | 74 (78.7%) |
| 35 to 44 Years | 8 (15.4%) | 35 (67.3%) |
| 45 to 54 Years | 44 (47.3%) | 64 (68.8%) |
| 55 to 64 Years | 28 (31.8%) | 67 (76.1%) |
| 65 to 74 Years | 84 (100.0%) | 53 (63.1%) |
| 75 Years and over | 45 (100.0%) | 36 (80.0%) |
| Total | 411 (54.6%) | 447 (59.4%) |
Disability Status by Sex by Age in Saltsburg borough
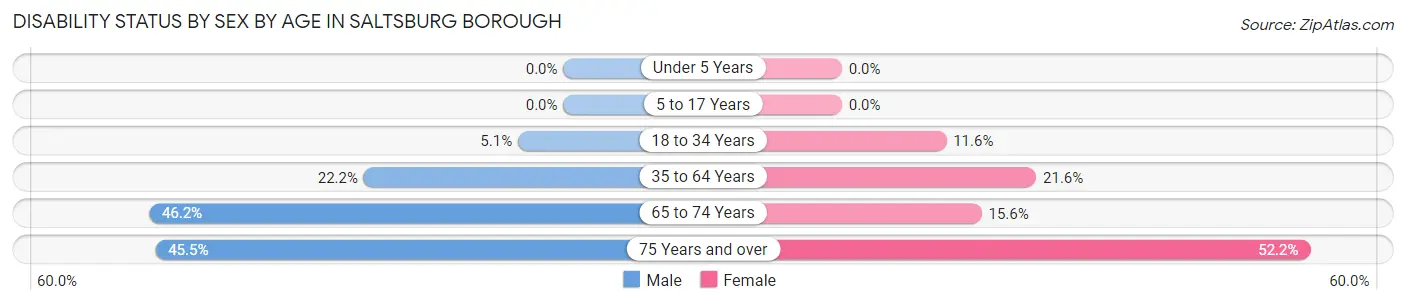
| Age Bracket | Male | Female |
| Under 5 Years | 0 (0.0%) | 0 (0.0%) |
| 5 to 17 Years | 0 (0.0%) | 0 (0.0%) |
| 18 to 34 Years | 5 (5.1%) | 5 (11.6%) |
| 35 to 64 Years | 22 (22.2%) | 29 (21.6%) |
| 65 to 74 Years | 18 (46.2%) | 7 (15.6%) |
| 75 Years and over | 10 (45.5%) | 12 (52.2%) |
Disability Class by Sex by Age in Saltsburg borough
Disability Class: Hearing Difficulty
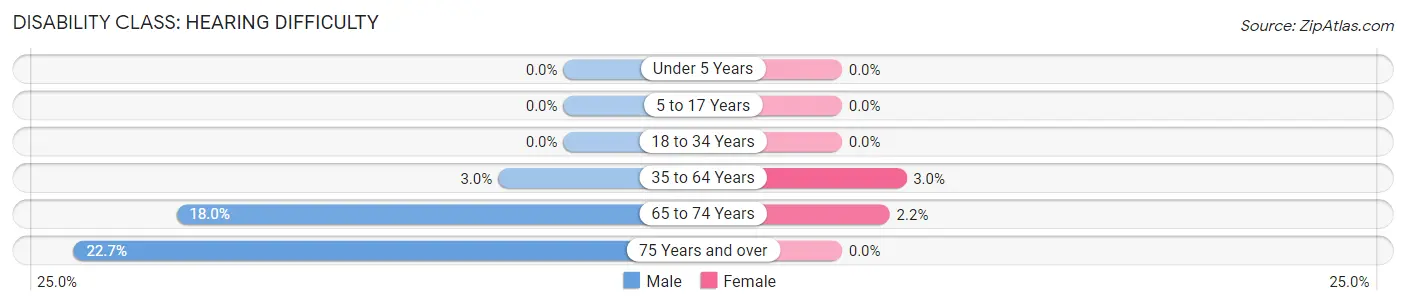
| Age Bracket | Male | Female |
| Under 5 Years | 0 (0.0%) | 0 (0.0%) |
| 5 to 17 Years | 0 (0.0%) | 0 (0.0%) |
| 18 to 34 Years | 0 (0.0%) | 0 (0.0%) |
| 35 to 64 Years | 3 (3.0%) | 4 (3.0%) |
| 65 to 74 Years | 7 (17.9%) | 1 (2.2%) |
| 75 Years and over | 5 (22.7%) | 0 (0.0%) |
Disability Class: Vision Difficulty
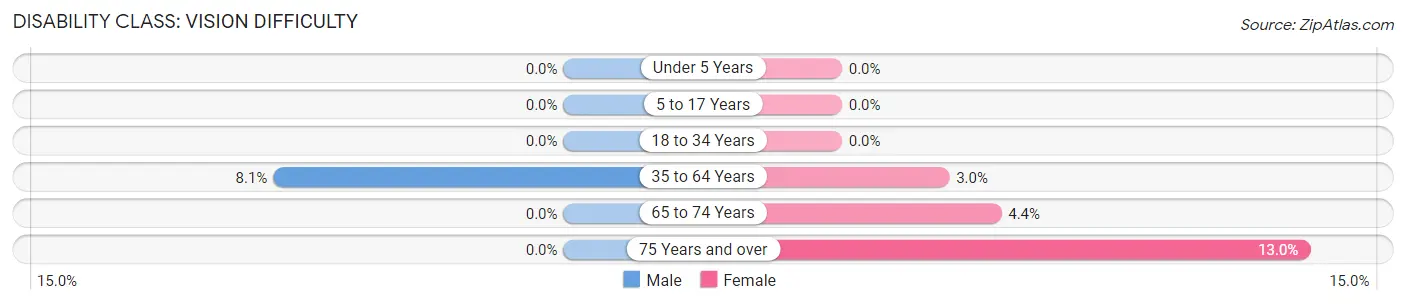
| Age Bracket | Male | Female |
| Under 5 Years | 0 (0.0%) | 0 (0.0%) |
| 5 to 17 Years | 0 (0.0%) | 0 (0.0%) |
| 18 to 34 Years | 0 (0.0%) | 0 (0.0%) |
| 35 to 64 Years | 8 (8.1%) | 4 (3.0%) |
| 65 to 74 Years | 0 (0.0%) | 2 (4.4%) |
| 75 Years and over | 0 (0.0%) | 3 (13.0%) |
Disability Class: Cognitive Difficulty
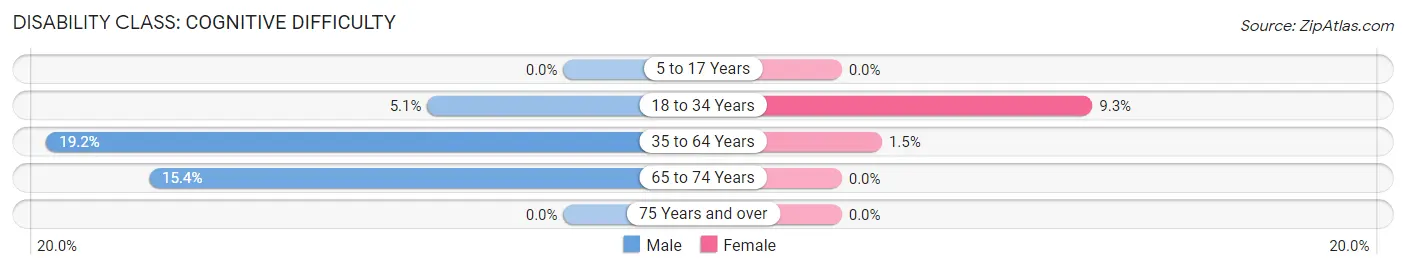
| Age Bracket | Male | Female |
| 5 to 17 Years | 0 (0.0%) | 0 (0.0%) |
| 18 to 34 Years | 5 (5.1%) | 4 (9.3%) |
| 35 to 64 Years | 19 (19.2%) | 2 (1.5%) |
| 65 to 74 Years | 6 (15.4%) | 0 (0.0%) |
| 75 Years and over | 0 (0.0%) | 0 (0.0%) |
Disability Class: Ambulatory Difficulty
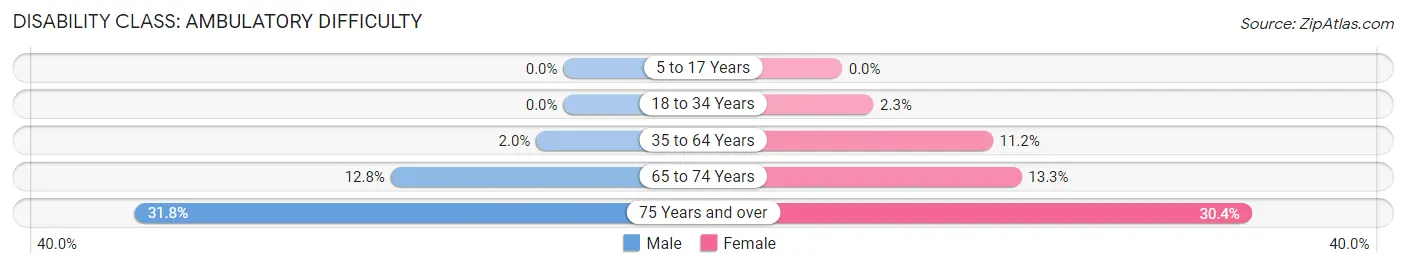
| Age Bracket | Male | Female |
| 5 to 17 Years | 0 (0.0%) | 0 (0.0%) |
| 18 to 34 Years | 0 (0.0%) | 1 (2.3%) |
| 35 to 64 Years | 2 (2.0%) | 15 (11.2%) |
| 65 to 74 Years | 5 (12.8%) | 6 (13.3%) |
| 75 Years and over | 7 (31.8%) | 7 (30.4%) |
Disability Class: Self-Care Difficulty
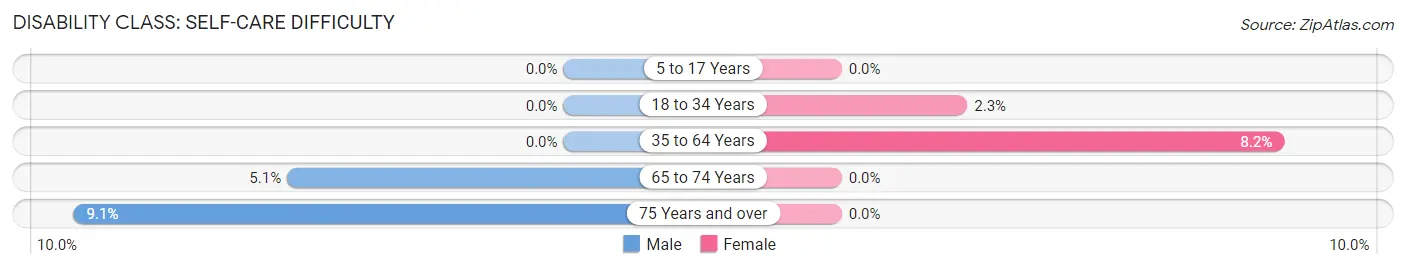
| Age Bracket | Male | Female |
| 5 to 17 Years | 0 (0.0%) | 0 (0.0%) |
| 18 to 34 Years | 0 (0.0%) | 1 (2.3%) |
| 35 to 64 Years | 0 (0.0%) | 11 (8.2%) |
| 65 to 74 Years | 2 (5.1%) | 0 (0.0%) |
| 75 Years and over | 2 (9.1%) | 0 (0.0%) |
Technology Access in Saltsburg borough
Computing Device Access in Saltsburg borough
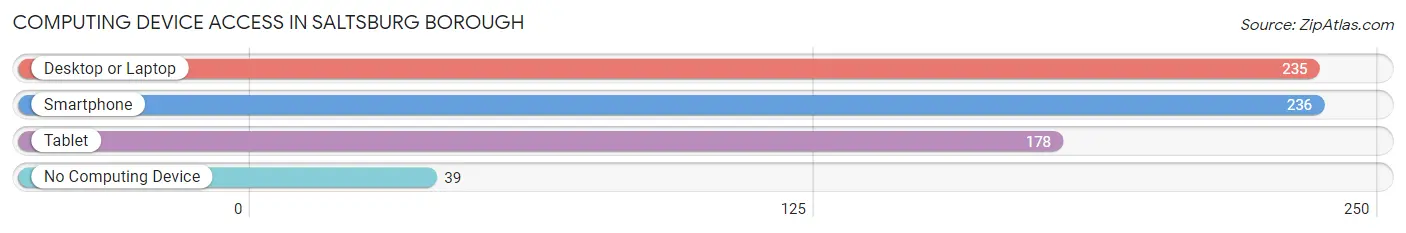
| Device Type | # Households | % Households |
| Desktop or Laptop | 235 | 76.5% |
| Smartphone | 236 | 76.9% |
| Tablet | 178 | 58.0% |
| No Computing Device | 39 | 12.7% |
| Total | 307 | 100.0% |
Internet Access in Saltsburg borough
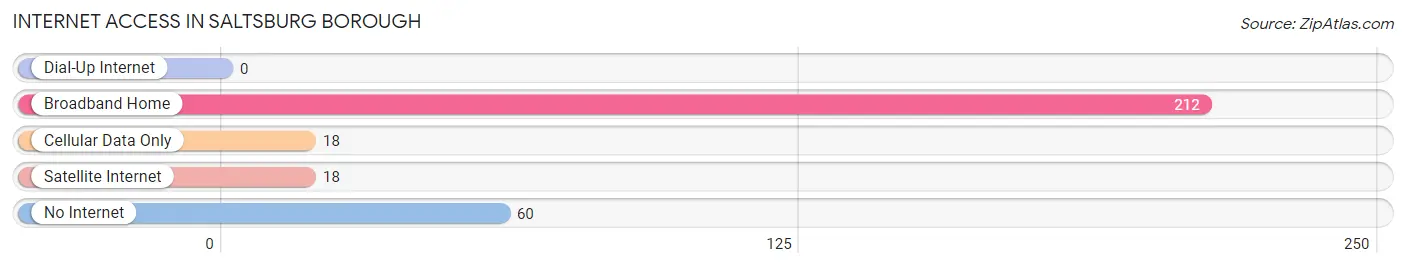
| Internet Type | # Households | % Households |
| Dial-Up Internet | 0 | 0.0% |
| Broadband Home | 212 | 69.1% |
| Cellular Data Only | 18 | 5.9% |
| Satellite Internet | 18 | 5.9% |
| No Internet | 60 | 19.5% |
| Total | 307 | 100.0% |
Saltsburg borough Summary
Saltsburg Borough is a small borough located in Indiana County, Pennsylvania. It is situated along the Conemaugh River, approximately 25 miles northeast of Pittsburgh. The borough has a population of 1,717 as of the 2010 census.
History
The area that is now Saltsburg Borough was first settled in 1769 by a group of Scots-Irish immigrants. The town was originally known as “Salt Lick” due to the abundance of salt springs in the area. In 1832, the town was renamed Saltsburg after the salt industry that had developed in the area.
The town was officially incorporated as a borough in 1851. During the 19th century, Saltsburg was a major center for the production of salt. The salt was produced by boiling brine from the salt springs in the area. The salt was then shipped to Pittsburgh and other cities along the Allegheny River.
The town was also an important stop on the Pennsylvania Canal, which ran through the town from 1834 to 1871. The canal was used to transport goods and passengers between Pittsburgh and Philadelphia.
Geography
Saltsburg Borough is located at 40°27'N 79°30'W (40.45, -79.50). According to the United States Census Bureau, the borough has a total area of 0.7 square miles (1.8 km2), all of it land.
The borough is located in the Allegheny Plateau region of Pennsylvania. The terrain is mostly flat with some rolling hills. The Conemaugh River runs through the borough.
Economy
The economy of Saltsburg Borough is largely based on tourism. The town is home to several historic sites, including the Pennsylvania Canal Museum and the Saltsburg Canal Park. The town also hosts several festivals throughout the year, including the Saltsburg Canal Days Festival and the Saltsburg Music Festival.
The town is also home to several small businesses, including restaurants, shops, and a local newspaper.
Demographics
As of the 2010 census, there were 1,717 people, 745 households, and 463 families residing in the borough. The population density was 2,521.3 people per square mile (973.2/km2). There were 817 housing units at an average density of 1,179.3 per square mile (455.3/km2). The racial makeup of the borough was 97.2% White, 0.9% African American, 0.2% Native American, 0.2% Asian, 0.1% Pacific Islander, 0.2% from other races, and 1.2% from two or more races. Hispanic or Latino of any race were 0.7% of the population.
There were 745 households, out of which 28.2% had children under the age of 18 living with them, 44.2% were married couples living together, 13.2% had a female householder with no husband present, and 37.2% were non-families. 32.2% of all households were made up of individuals, and 14.2% had someone living alone who was 65 years of age or older. The average household size was 2.30 and the average family size was 2.90.
In the borough, the population was spread out, with 22.7% under the age of 18, 7.2% from 18 to 24, 28.2% from 25 to 44, 24.2% from 45 to 64, and 17.7% who were 65 years of age or older. The median age was 40 years. For every 100 females, there were 91.2 males. For every 100 females age 18 and over, there were 87.2 males.
The median income for a household in the borough was $31,250, and the median income for a family was $37,500. Males had a median income of $30,000 versus $21,250 for females. The per capita income for the borough was $17,845. About 8.2% of families and 11.2% of the population were below the poverty line, including 16.2% of those under age 18 and 8.2% of those age 65 or over.
Common Questions
What is Per Capita Income in Saltsburg borough?
Per Capita income in Saltsburg borough is $28,183.
What is the Median Family Income in Saltsburg borough?
Median Family Income in Saltsburg borough is $68,260.
What is the Median Household income in Saltsburg borough?
Median Household Income in Saltsburg borough is $53,125.
What is Income or Wage Gap in Saltsburg borough?
Income or Wage Gap in Saltsburg borough is 46.7%.
Women in Saltsburg borough earn 53.3 cents for every dollar earned by a man.
What is Family Income Deficit in Saltsburg borough?
Family Income Deficit in Saltsburg borough is $10,163.
Families that are below poverty line in Saltsburg borough earn $10,163 less on average than the poverty threshold level.
What is Inequality or Gini Index in Saltsburg borough?
Inequality or Gini Index in Saltsburg borough is 0.45.
What is the Total Population of Saltsburg borough?
Total Population of Saltsburg borough is 752.
What is the Total Male Population of Saltsburg borough?
Total Male Population of Saltsburg borough is 324.
What is the Total Female Population of Saltsburg borough?
Total Female Population of Saltsburg borough is 428.
What is the Ratio of Males per 100 Females in Saltsburg borough?
There are 75.70 Males per 100 Females in Saltsburg borough.
What is the Ratio of Females per 100 Males in Saltsburg borough?
There are 132.10 Females per 100 Males in Saltsburg borough.
What is the Median Population Age in Saltsburg borough?
Median Population Age in Saltsburg borough is 34.0 Years.
What is the Average Family Size in Saltsburg borough
Average Family Size in Saltsburg borough is 3.2 People.
What is the Average Household Size in Saltsburg borough
Average Household Size in Saltsburg borough is 2.5 People.
How Large is the Labor Force in Saltsburg borough?
There are 316 People in the Labor Forcein in Saltsburg borough.
What is the Percentage of People in the Labor Force in Saltsburg borough?
60.5% of People are in the Labor Force in Saltsburg borough.
What is the Unemployment Rate in Saltsburg borough?
Unemployment Rate in Saltsburg borough is 0.9%.