Nuangola borough, PA Map & Demographics
Nuangola borough Overview
$42,685
PER CAPITA INCOME
$93,750
AVG FAMILY INCOME
$77,778
AVG HOUSEHOLD INCOME
14.3%
WAGE / INCOME GAP [ % ]
85.7¢/ $1
WAGE / INCOME GAP [ $ ]
0.41
INEQUALITY / GINI INDEX
712
TOTAL POPULATION
321
MALE POPULATION
391
FEMALE POPULATION
82.10
MALES / 100 FEMALES
121.81
FEMALES / 100 MALES
44.3
MEDIAN AGE
3.0
AVG FAMILY SIZE
2.5
AVG HOUSEHOLD SIZE
390
LABOR FORCE [ PEOPLE ]
63.6%
PERCENT IN LABOR FORCE
1.8%
UNEMPLOYMENT RATE
Income in Nuangola borough
Income Overview in Nuangola borough
Per Capita Income in Nuangola borough is $42,685, while median incomes of families and households are $93,750 and $77,778 respectively.
| Characteristic | Number | Measure |
| Per Capita Income | 712 | $42,685 |
| Median Family Income | 196 | $93,750 |
| Mean Family Income | 196 | $113,413 |
| Median Household Income | 288 | $77,778 |
| Mean Household Income | 288 | $100,180 |
| Income Deficit | 196 | $0 |
| Wage / Income Gap (%) | 712 | 14.26% |
| Wage / Income Gap ($) | 712 | 85.74¢ per $1 |
| Gini / Inequality Index | 712 | 0.41 |
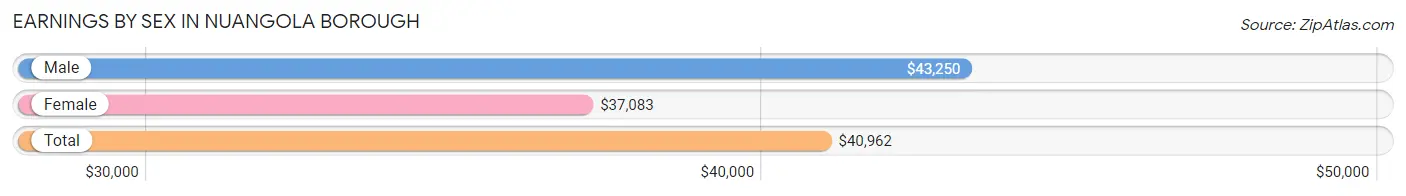
Earnings by Sex in Nuangola borough
Average Earnings in Nuangola borough are $40,962, $43,250 for men and $37,083 for women, a difference of 14.3%.
| Sex | Number | Average Earnings |
| Male | 187 (46.3%) | $43,250 |
| Female | 217 (53.7%) | $37,083 |
| Total | 404 (100.0%) | $40,962 |
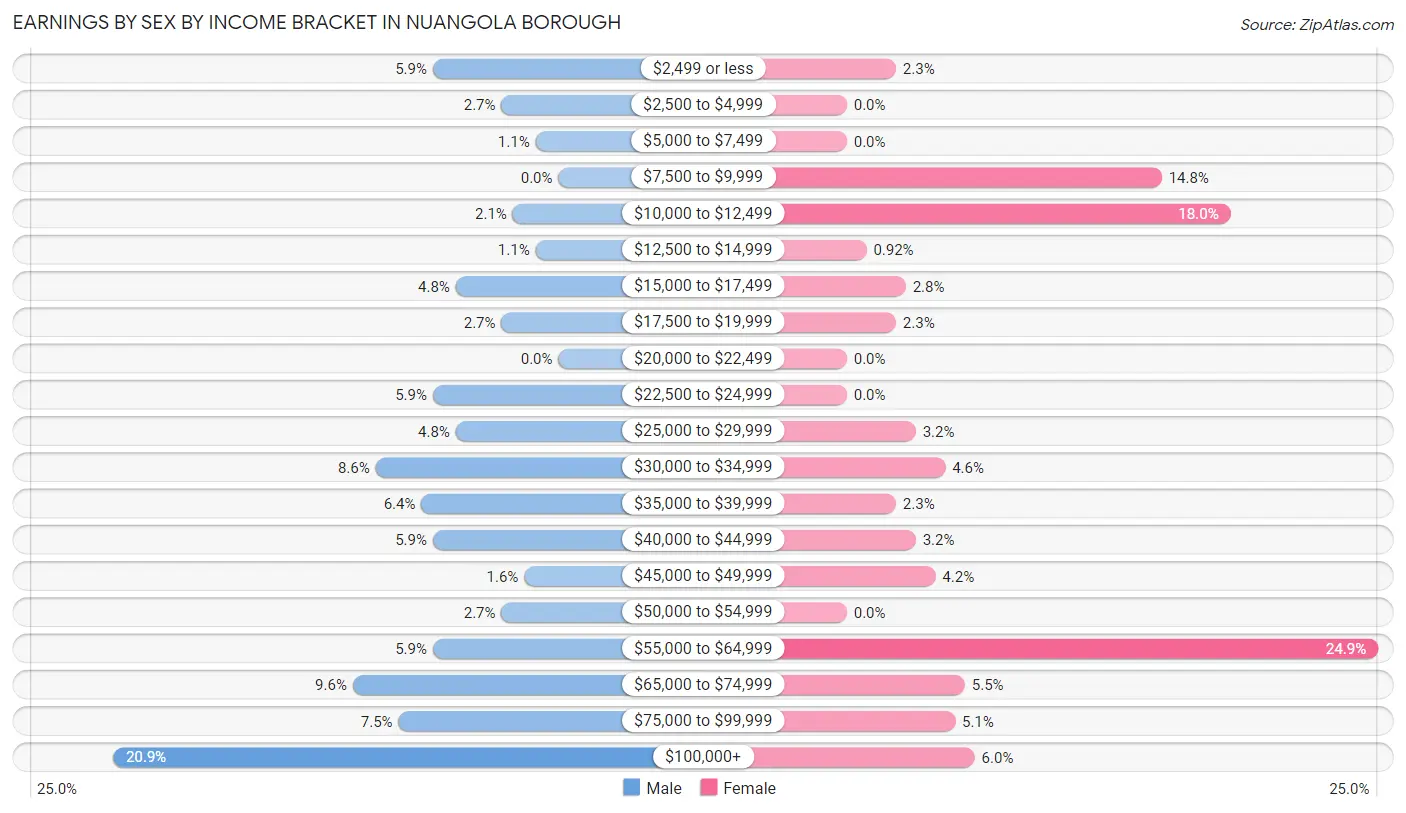
Earnings by Sex by Income Bracket in Nuangola borough
The most common earnings brackets in Nuangola borough are $100,000+ for men (39 | 20.9%) and $55,000 to $64,999 for women (54 | 24.9%).
| Income | Male | Female |
| $2,499 or less | 11 (5.9%) | 5 (2.3%) |
| $2,500 to $4,999 | 5 (2.7%) | 0 (0.0%) |
| $5,000 to $7,499 | 2 (1.1%) | 0 (0.0%) |
| $7,500 to $9,999 | 0 (0.0%) | 32 (14.7%) |
| $10,000 to $12,499 | 4 (2.1%) | 39 (18.0%) |
| $12,500 to $14,999 | 2 (1.1%) | 2 (0.9%) |
| $15,000 to $17,499 | 9 (4.8%) | 6 (2.8%) |
| $17,500 to $19,999 | 5 (2.7%) | 5 (2.3%) |
| $20,000 to $22,499 | 0 (0.0%) | 0 (0.0%) |
| $22,500 to $24,999 | 11 (5.9%) | 0 (0.0%) |
| $25,000 to $29,999 | 9 (4.8%) | 7 (3.2%) |
| $30,000 to $34,999 | 16 (8.6%) | 10 (4.6%) |
| $35,000 to $39,999 | 12 (6.4%) | 5 (2.3%) |
| $40,000 to $44,999 | 11 (5.9%) | 7 (3.2%) |
| $45,000 to $49,999 | 3 (1.6%) | 9 (4.2%) |
| $50,000 to $54,999 | 5 (2.7%) | 0 (0.0%) |
| $55,000 to $64,999 | 11 (5.9%) | 54 (24.9%) |
| $65,000 to $74,999 | 18 (9.6%) | 12 (5.5%) |
| $75,000 to $99,999 | 14 (7.5%) | 11 (5.1%) |
| $100,000+ | 39 (20.9%) | 13 (6.0%) |
| Total | 187 (100.0%) | 217 (100.0%) |
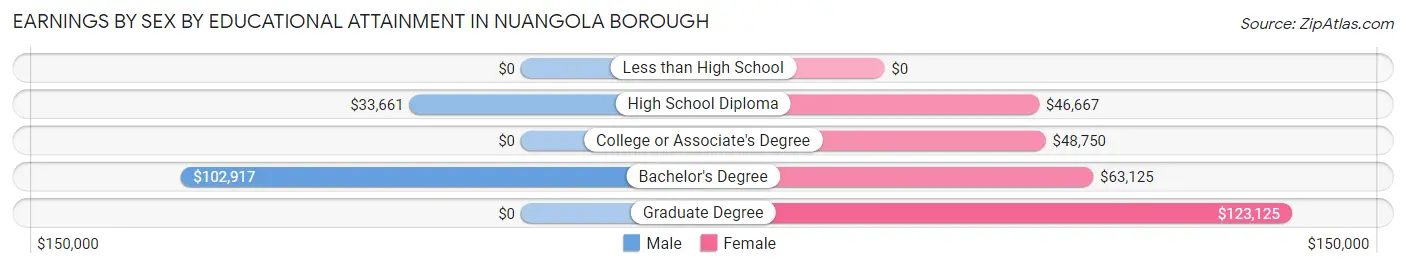
Earnings by Sex by Educational Attainment in Nuangola borough
Average earnings in Nuangola borough are $46,250 for men and $56,875 for women, a difference of 18.7%. Men with an educational attainment of bachelor's degree enjoy the highest average annual earnings of $102,917, while those with high school diploma education earn the least with $33,661. Women with an educational attainment of graduate degree earn the most with the average annual earnings of $123,125, while those with high school diploma education have the smallest earnings of $46,667.
| Educational Attainment | Male Income | Female Income |
| Less than High School | - | - |
| High School Diploma | $33,661 | $46,667 |
| College or Associate's Degree | - | - |
| Bachelor's Degree | $102,917 | $63,125 |
| Graduate Degree | - | - |
| Total | $46,250 | $56,875 |
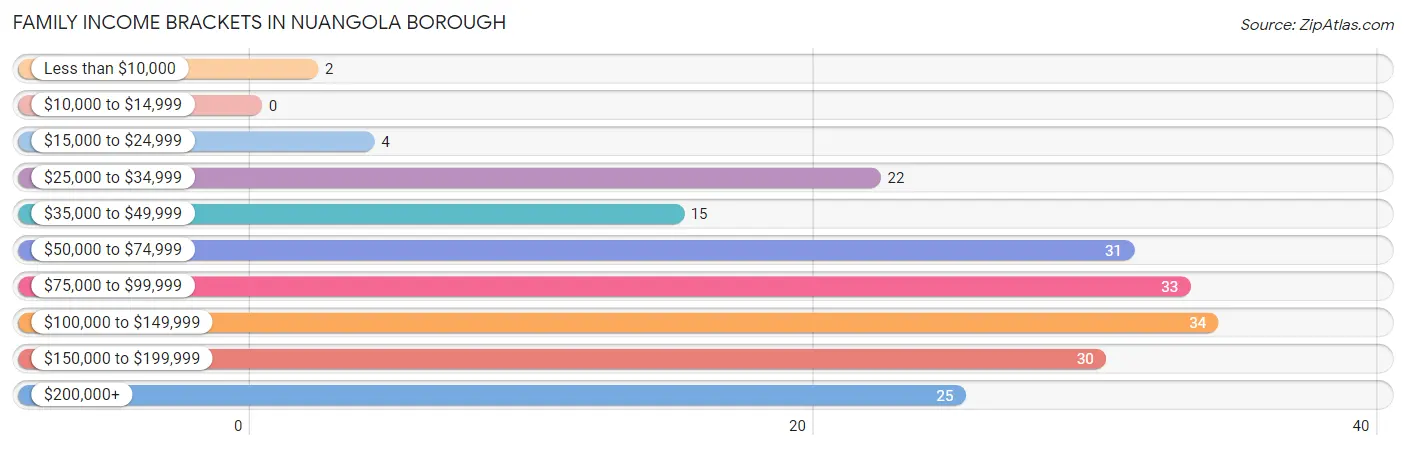
Family Income in Nuangola borough
Family Income Brackets in Nuangola borough
According to the Nuangola borough family income data, there are 34 families falling into the $100,000 to $149,999 income range, which is the most common income bracket and makes up 17.3% of all families.
| Income Bracket | # Families | % Families |
| Less than $10,000 | 2 | 1.0% |
| $10,000 to $14,999 | 0 | 0.0% |
| $15,000 to $24,999 | 4 | 2.0% |
| $25,000 to $34,999 | 22 | 11.2% |
| $35,000 to $49,999 | 15 | 7.7% |
| $50,000 to $74,999 | 31 | 15.8% |
| $75,000 to $99,999 | 33 | 16.8% |
| $100,000 to $149,999 | 34 | 17.3% |
| $150,000 to $199,999 | 30 | 15.3% |
| $200,000+ | 25 | 12.8% |
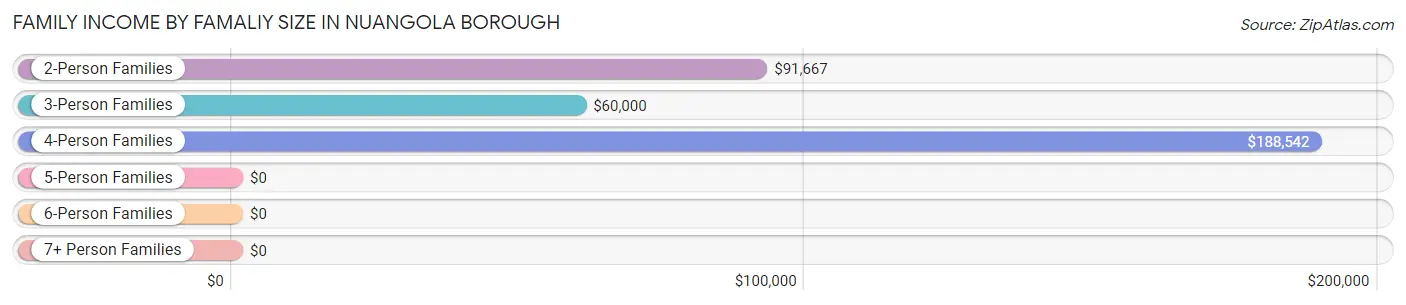
Family Income by Famaliy Size in Nuangola borough
4-person families (24 | 12.2%) account for the highest median family income in Nuangola borough with $188,542 per family, while 4-person families (24 | 12.2%) have the highest median income of $47,136 per family member.
| Income Bracket | # Families | Median Income |
| 2-Person Families | 126 (64.3%) | $91,667 |
| 3-Person Families | 32 (16.3%) | $60,000 |
| 4-Person Families | 24 (12.2%) | $188,542 |
| 5-Person Families | 10 (5.1%) | $0 |
| 6-Person Families | 2 (1.0%) | $0 |
| 7+ Person Families | 2 (1.0%) | $0 |
| Total | 196 (100.0%) | $93,750 |
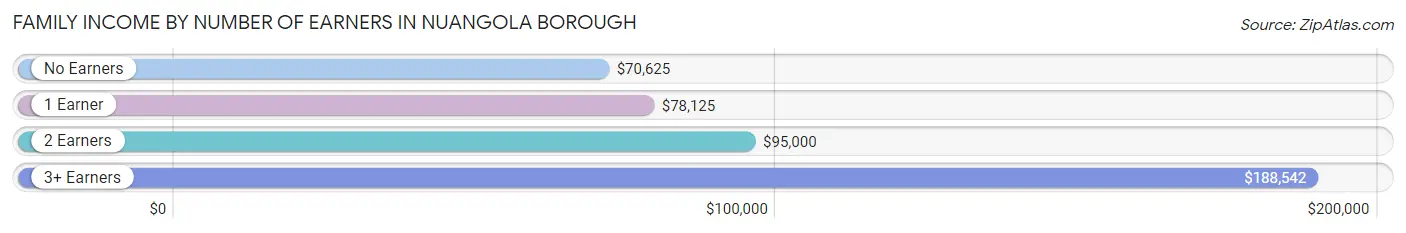
Family Income by Number of Earners in Nuangola borough
The median family income in Nuangola borough is $93,750, with families comprising 3+ earners (20) having the highest median family income of $188,542, while families with no earners (43) have the lowest median family income of $70,625, accounting for 10.2% and 21.9% of families, respectively.
| Number of Earners | # Families | Median Income |
| No Earners | 43 (21.9%) | $70,625 |
| 1 Earner | 63 (32.1%) | $78,125 |
| 2 Earners | 70 (35.7%) | $95,000 |
| 3+ Earners | 20 (10.2%) | $188,542 |
| Total | 196 (100.0%) | $93,750 |
Household Income in Nuangola borough
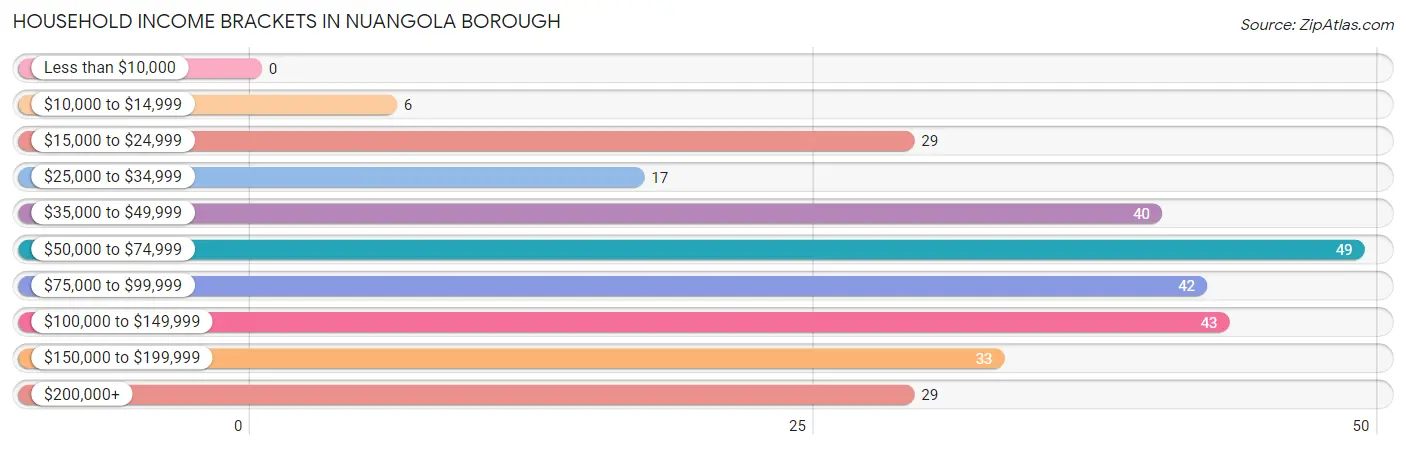
Household Income Brackets in Nuangola borough
With 49 households falling in the category, the $50,000 to $74,999 income range is the most frequent in Nuangola borough, accounting for 17.0% of all households.
| Income Bracket | # Households | % Households |
| Less than $10,000 | 0 | 0.0% |
| $10,000 to $14,999 | 6 | 2.1% |
| $15,000 to $24,999 | 29 | 10.1% |
| $25,000 to $34,999 | 17 | 5.9% |
| $35,000 to $49,999 | 40 | 13.9% |
| $50,000 to $74,999 | 49 | 17.0% |
| $75,000 to $99,999 | 42 | 14.6% |
| $100,000 to $149,999 | 43 | 14.9% |
| $150,000 to $199,999 | 33 | 11.5% |
| $200,000+ | 29 | 10.1% |
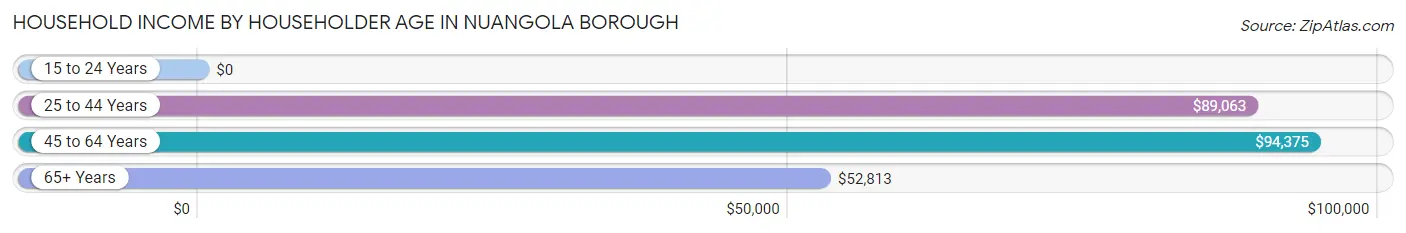
Household Income by Householder Age in Nuangola borough
The median household income in Nuangola borough is $77,778, with the highest median household income of $94,375 found in the 45 to 64 years age bracket for the primary householder. A total of 95 households (33.0%) fall into this category. Meanwhile, the 15 to 24 years age bracket for the primary householder has the lowest median household income of $0, with 8 households (2.8%) in this group.
| Income Bracket | # Households | Median Income |
| 15 to 24 Years | 8 (2.8%) | $0 |
| 25 to 44 Years | 79 (27.4%) | $89,063 |
| 45 to 64 Years | 95 (33.0%) | $94,375 |
| 65+ Years | 106 (36.8%) | $52,813 |
| Total | 288 (100.0%) | $77,778 |
Poverty in Nuangola borough
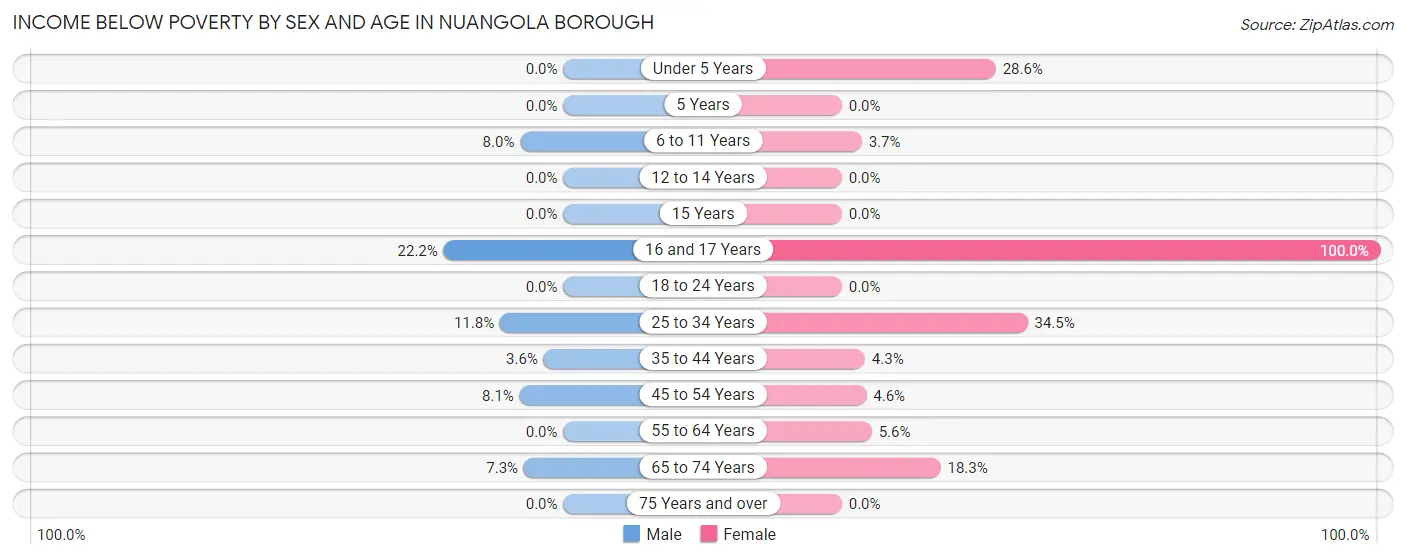
Income Below Poverty by Sex and Age in Nuangola borough
With 5.0% poverty level for males and 9.5% for females among the residents of Nuangola borough, 16 and 17 year old males and 16 and 17 year old females are the most vulnerable to poverty, with 2 males (22.2%) and 2 females (100.0%) in their respective age groups living below the poverty level.
| Age Bracket | Male | Female |
| Under 5 Years | 0 (0.0%) | 6 (28.6%) |
| 5 Years | 0 (0.0%) | 0 (0.0%) |
| 6 to 11 Years | 2 (8.0%) | 1 (3.7%) |
| 12 to 14 Years | 0 (0.0%) | 0 (0.0%) |
| 15 Years | 0 (0.0%) | 0 (0.0%) |
| 16 and 17 Years | 2 (22.2%) | 2 (100.0%) |
| 18 to 24 Years | 0 (0.0%) | 0 (0.0%) |
| 25 to 34 Years | 4 (11.8%) | 10 (34.5%) |
| 35 to 44 Years | 2 (3.6%) | 3 (4.3%) |
| 45 to 54 Years | 3 (8.1%) | 2 (4.5%) |
| 55 to 64 Years | 0 (0.0%) | 2 (5.6%) |
| 65 to 74 Years | 3 (7.3%) | 11 (18.3%) |
| 75 Years and over | 0 (0.0%) | 0 (0.0%) |
| Total | 16 (5.0%) | 37 (9.5%) |
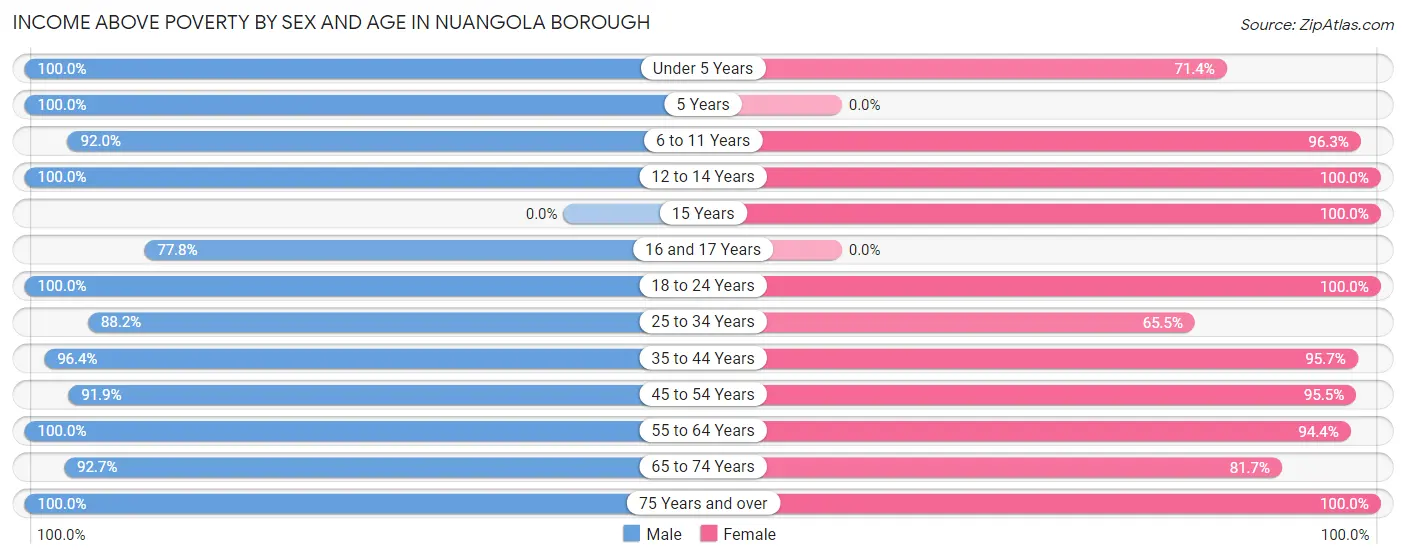
Income Above Poverty by Sex and Age in Nuangola borough
According to the poverty statistics in Nuangola borough, males aged under 5 years and females aged 12 to 14 years are the age groups that are most secure financially, with 100.0% of males and 100.0% of females in these age groups living above the poverty line.
| Age Bracket | Male | Female |
| Under 5 Years | 13 (100.0%) | 15 (71.4%) |
| 5 Years | 2 (100.0%) | 0 (0.0%) |
| 6 to 11 Years | 23 (92.0%) | 26 (96.3%) |
| 12 to 14 Years | 3 (100.0%) | 6 (100.0%) |
| 15 Years | 0 (0.0%) | 2 (100.0%) |
| 16 and 17 Years | 7 (77.8%) | 0 (0.0%) |
| 18 to 24 Years | 20 (100.0%) | 61 (100.0%) |
| 25 to 34 Years | 30 (88.2%) | 19 (65.5%) |
| 35 to 44 Years | 53 (96.4%) | 67 (95.7%) |
| 45 to 54 Years | 34 (91.9%) | 42 (95.5%) |
| 55 to 64 Years | 49 (100.0%) | 34 (94.4%) |
| 65 to 74 Years | 38 (92.7%) | 49 (81.7%) |
| 75 Years and over | 33 (100.0%) | 33 (100.0%) |
| Total | 305 (95.0%) | 354 (90.5%) |
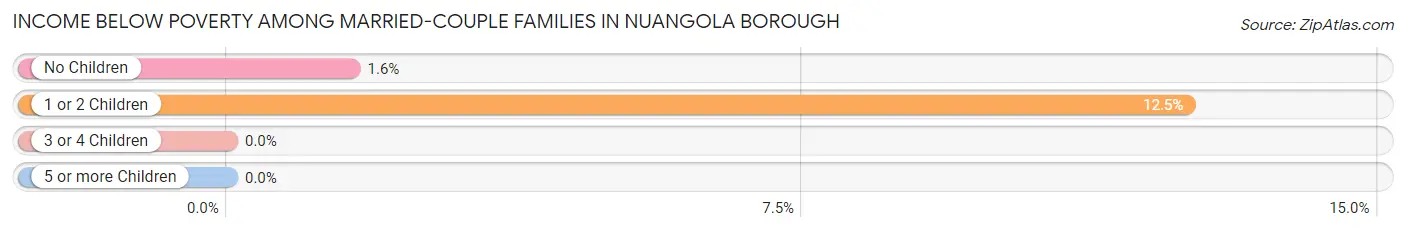
Income Below Poverty Among Married-Couple Families in Nuangola borough
The poverty statistics for married-couple families in Nuangola borough show that 2.6% or 4 of the total 153 families live below the poverty line. Families with 1 or 2 children have the highest poverty rate of 12.5%, comprising of 2 families. On the other hand, families with 3 or 4 children have the lowest poverty rate of 0.0%, which includes 0 families.
| Children | Above Poverty | Below Poverty |
| No Children | 123 (98.4%) | 2 (1.6%) |
| 1 or 2 Children | 14 (87.5%) | 2 (12.5%) |
| 3 or 4 Children | 10 (100.0%) | 0 (0.0%) |
| 5 or more Children | 2 (100.0%) | 0 (0.0%) |
| Total | 149 (97.4%) | 4 (2.6%) |
Income Below Poverty Among Single-Parent Households in Nuangola borough
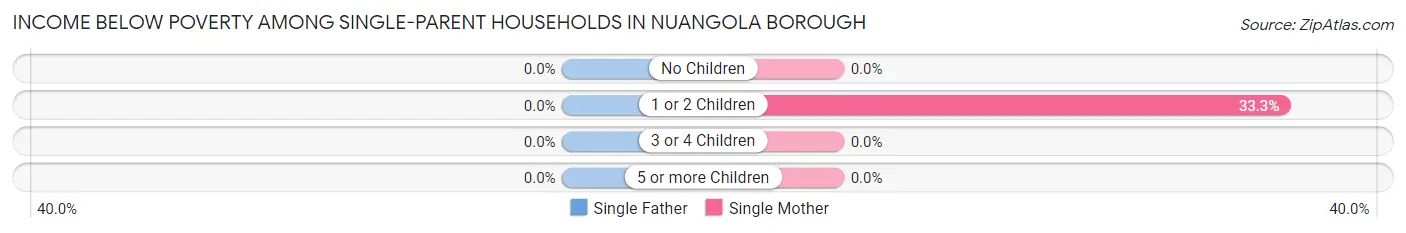
| Children | Single Father | Single Mother |
| No Children | 0 (0.0%) | 0 (0.0%) |
| 1 or 2 Children | 0 (0.0%) | 4 (33.3%) |
| 3 or 4 Children | 0 (0.0%) | 0 (0.0%) |
| 5 or more Children | 0 (0.0%) | 0 (0.0%) |
| Total | 0 (0.0%) | 4 (13.3%) |
Income Below Poverty Among Married-Couple vs Single-Parent Households in Nuangola borough
The poverty data for Nuangola borough shows that 4 of the married-couple family households (2.6%) and 4 of the single-parent households (9.3%) are living below the poverty level. Within the married-couple family households, those with 1 or 2 children have the highest poverty rate, with 2 households (12.5%) falling below the poverty line. Among the single-parent households, those with 1 or 2 children have the highest poverty rate, with 4 household (18.2%) living below poverty.
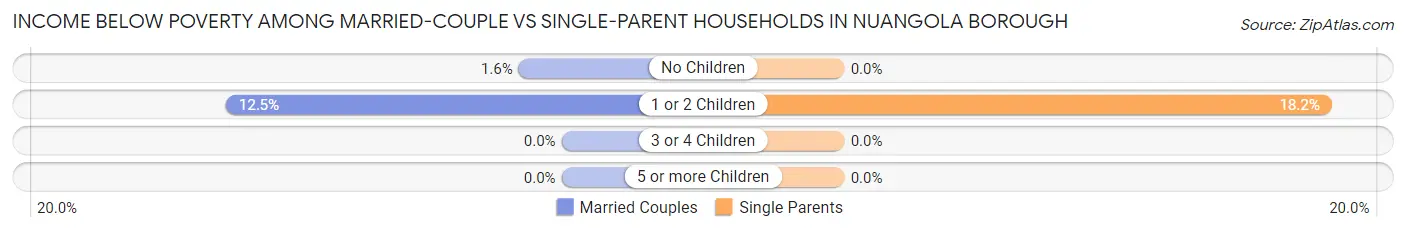
| Children | Married-Couple Families | Single-Parent Households |
| No Children | 2 (1.6%) | 0 (0.0%) |
| 1 or 2 Children | 2 (12.5%) | 4 (18.2%) |
| 3 or 4 Children | 0 (0.0%) | 0 (0.0%) |
| 5 or more Children | 0 (0.0%) | 0 (0.0%) |
| Total | 4 (2.6%) | 4 (9.3%) |
Race in Nuangola borough
The most populous races in Nuangola borough are White / Caucasian (692 | 97.2%), Two or more Races (16 | 2.2%), and Asian (4 | 0.6%).
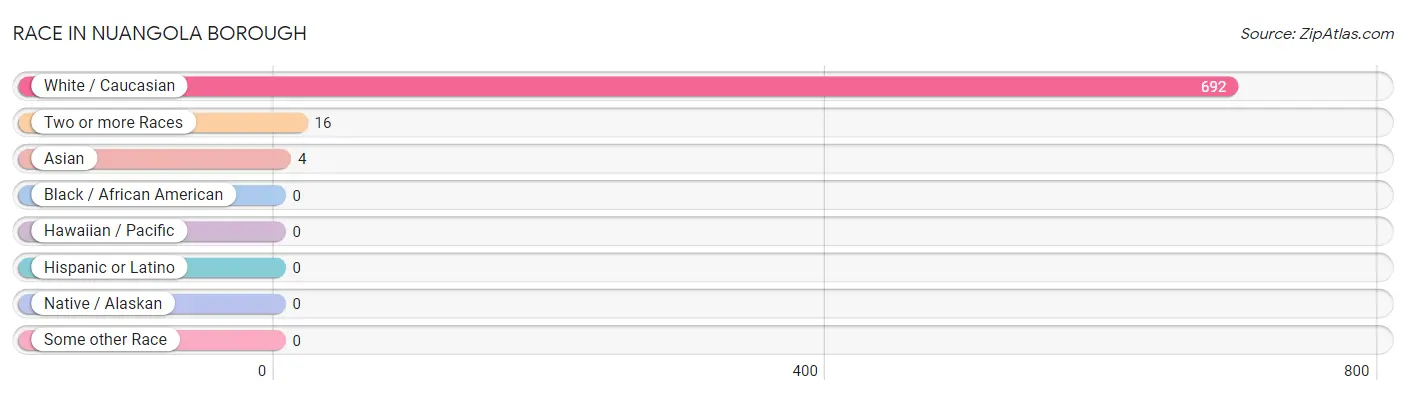
| Race | # Population | % Population |
| Asian | 4 | 0.6% |
| Black / African American | 0 | 0.0% |
| Hawaiian / Pacific | 0 | 0.0% |
| Hispanic or Latino | 0 | 0.0% |
| Native / Alaskan | 0 | 0.0% |
| White / Caucasian | 692 | 97.2% |
| Two or more Races | 16 | 2.2% |
| Some other Race | 0 | 0.0% |
| Total | 712 | 100.0% |
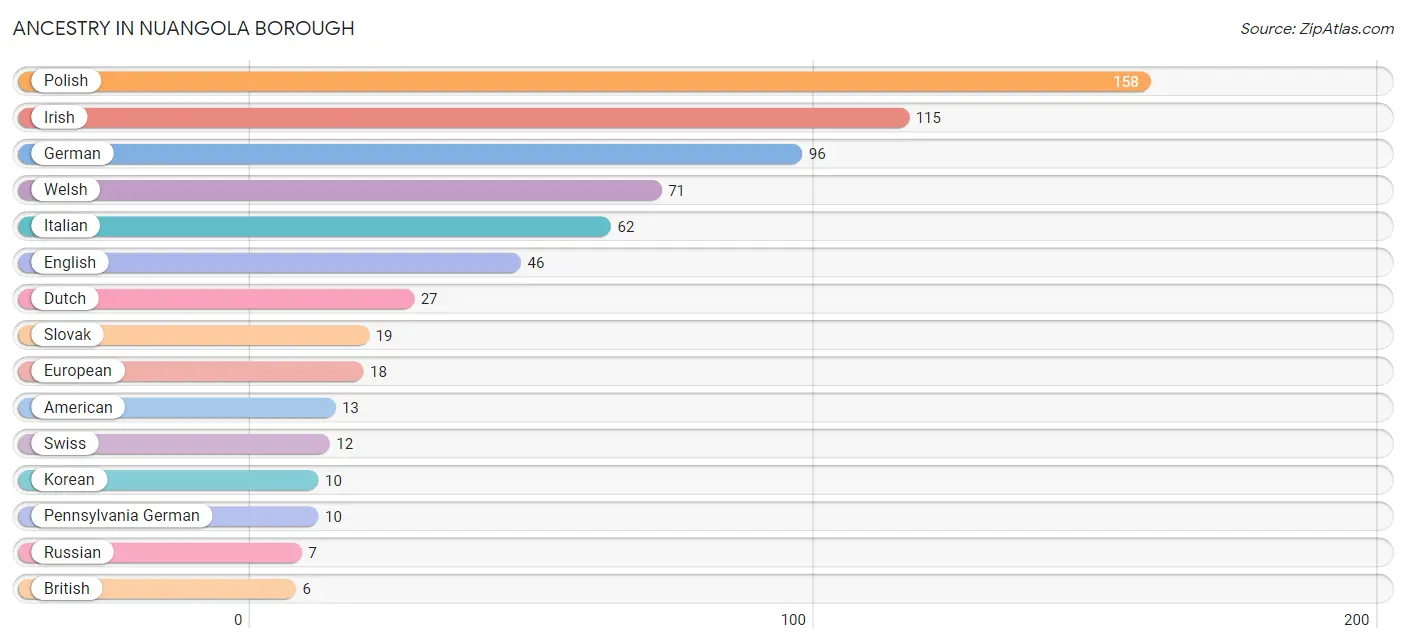
Ancestry in Nuangola borough
The most populous ancestries reported in Nuangola borough are Polish (158 | 22.2%), Irish (115 | 16.2%), German (96 | 13.5%), Welsh (71 | 10.0%), and Italian (62 | 8.7%), together accounting for 70.5% of all Nuangola borough residents.
| Ancestry | # Population | % Population |
| American | 13 | 1.8% |
| Austrian | 2 | 0.3% |
| Blackfeet | 1 | 0.1% |
| British | 6 | 0.8% |
| Burmese | 5 | 0.7% |
| Czech | 2 | 0.3% |
| Dutch | 27 | 3.8% |
| English | 46 | 6.5% |
| European | 18 | 2.5% |
| French | 3 | 0.4% |
| German | 96 | 13.5% |
| Greek | 1 | 0.1% |
| Irish | 115 | 16.2% |
| Italian | 62 | 8.7% |
| Korean | 10 | 1.4% |
| Lithuanian | 6 | 0.8% |
| Norwegian | 2 | 0.3% |
| Pakistani | 2 | 0.3% |
| Pennsylvania German | 10 | 1.4% |
| Polish | 158 | 22.2% |
| Russian | 7 | 1.0% |
| Scandinavian | 2 | 0.3% |
| Scottish | 2 | 0.3% |
| Slavic | 6 | 0.8% |
| Slovak | 19 | 2.7% |
| Swedish | 2 | 0.3% |
| Swiss | 12 | 1.7% |
| Ukrainian | 4 | 0.6% |
| Welsh | 71 | 10.0% | View All 29 Rows |
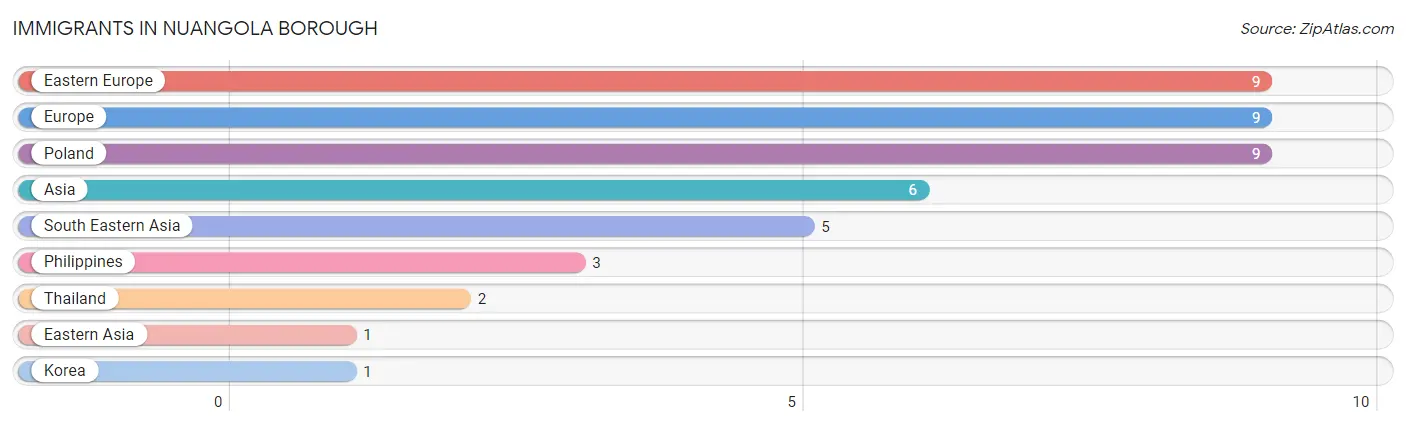
Immigrants in Nuangola borough
The most numerous immigrant groups reported in Nuangola borough came from Eastern Europe (9 | 1.3%), Europe (9 | 1.3%), Poland (9 | 1.3%), Asia (6 | 0.8%), and South Eastern Asia (5 | 0.7%), together accounting for 5.3% of all Nuangola borough residents.
| Immigration Origin | # Population | % Population |
| Asia | 6 | 0.8% |
| Eastern Asia | 1 | 0.1% |
| Eastern Europe | 9 | 1.3% |
| Europe | 9 | 1.3% |
| Korea | 1 | 0.1% |
| Philippines | 3 | 0.4% |
| Poland | 9 | 1.3% |
| South Eastern Asia | 5 | 0.7% |
| Thailand | 2 | 0.3% | View All 9 Rows |
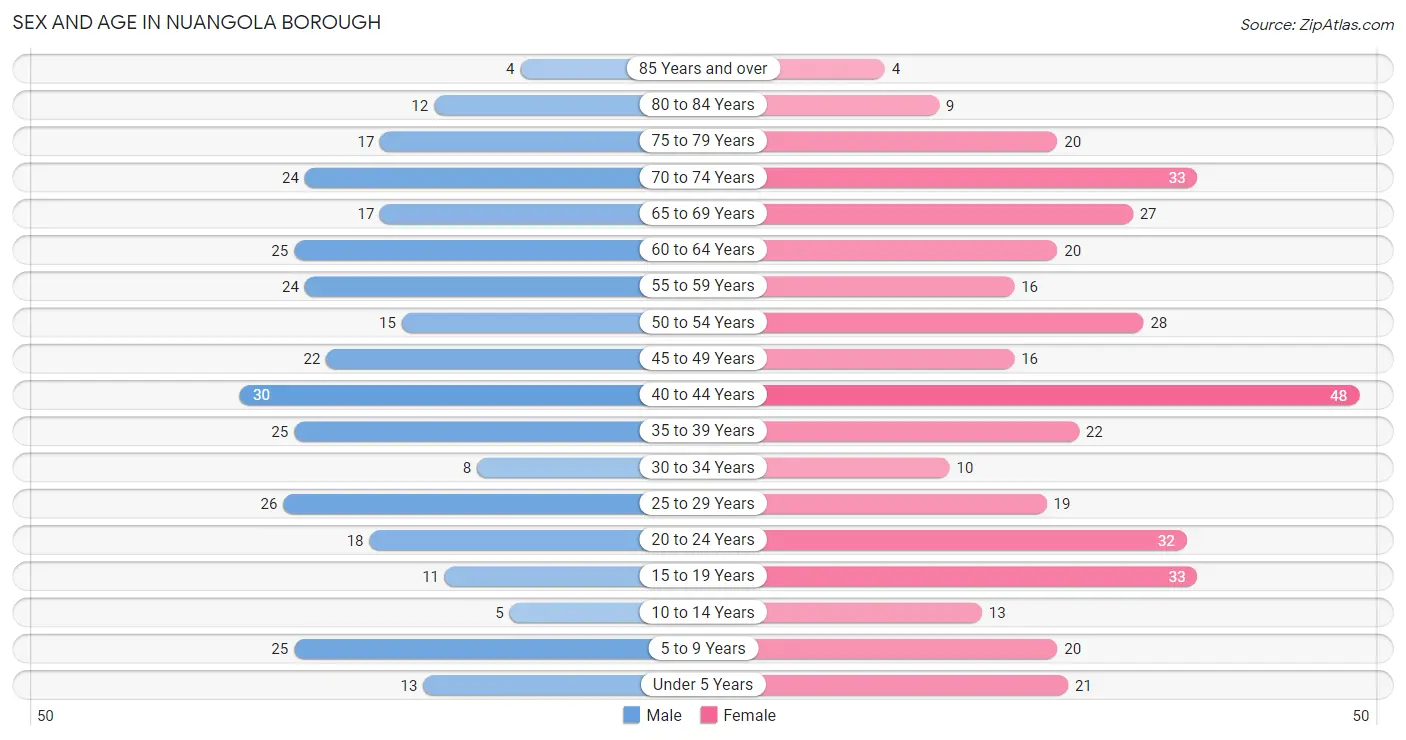
Sex and Age in Nuangola borough
Sex and Age in Nuangola borough
The most populous age groups in Nuangola borough are 40 to 44 Years (30 | 9.3%) for men and 40 to 44 Years (48 | 12.3%) for women.
| Age Bracket | Male | Female |
| Under 5 Years | 13 (4.1%) | 21 (5.4%) |
| 5 to 9 Years | 25 (7.8%) | 20 (5.1%) |
| 10 to 14 Years | 5 (1.6%) | 13 (3.3%) |
| 15 to 19 Years | 11 (3.4%) | 33 (8.4%) |
| 20 to 24 Years | 18 (5.6%) | 32 (8.2%) |
| 25 to 29 Years | 26 (8.1%) | 19 (4.9%) |
| 30 to 34 Years | 8 (2.5%) | 10 (2.6%) |
| 35 to 39 Years | 25 (7.8%) | 22 (5.6%) |
| 40 to 44 Years | 30 (9.3%) | 48 (12.3%) |
| 45 to 49 Years | 22 (6.9%) | 16 (4.1%) |
| 50 to 54 Years | 15 (4.7%) | 28 (7.2%) |
| 55 to 59 Years | 24 (7.5%) | 16 (4.1%) |
| 60 to 64 Years | 25 (7.8%) | 20 (5.1%) |
| 65 to 69 Years | 17 (5.3%) | 27 (6.9%) |
| 70 to 74 Years | 24 (7.5%) | 33 (8.4%) |
| 75 to 79 Years | 17 (5.3%) | 20 (5.1%) |
| 80 to 84 Years | 12 (3.7%) | 9 (2.3%) |
| 85 Years and over | 4 (1.3%) | 4 (1.0%) |
| Total | 321 (100.0%) | 391 (100.0%) |
Families and Households in Nuangola borough
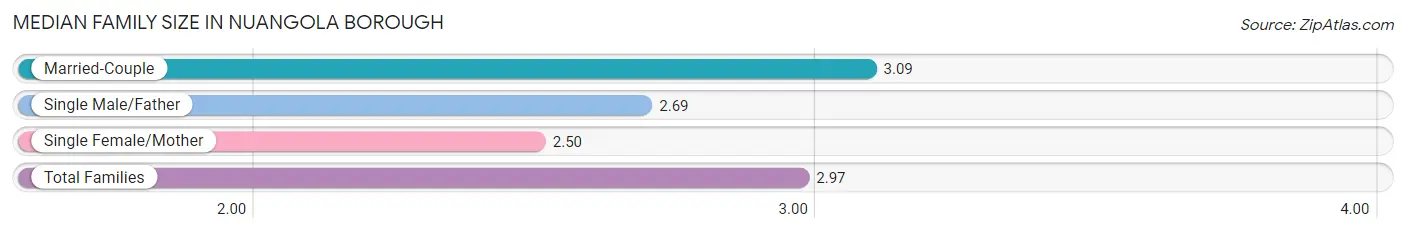
Median Family Size in Nuangola borough
The median family size in Nuangola borough is 2.97 persons per family, with married-couple families (153 | 78.1%) accounting for the largest median family size of 3.09 persons per family. On the other hand, single female/mother families (30 | 15.3%) represent the smallest median family size with 2.50 persons per family.
| Family Type | # Families | Family Size |
| Married-Couple | 153 (78.1%) | 3.09 |
| Single Male/Father | 13 (6.6%) | 2.69 |
| Single Female/Mother | 30 (15.3%) | 2.50 |
| Total Families | 196 (100.0%) | 2.97 |
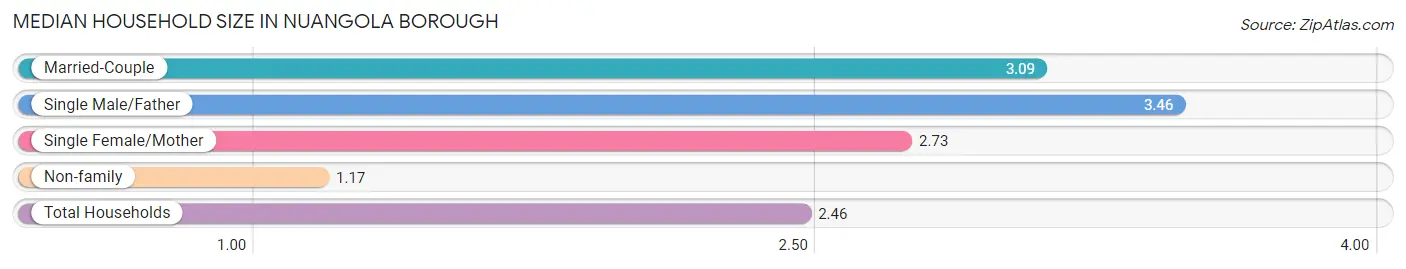
Median Household Size in Nuangola borough
The median household size in Nuangola borough is 2.46 persons per household, with single male/father households (13 | 4.5%) accounting for the largest median household size of 3.46 persons per household. non-family households (92 | 31.9%) represent the smallest median household size with 1.17 persons per household.
| Household Type | # Households | Household Size |
| Married-Couple | 153 (53.1%) | 3.09 |
| Single Male/Father | 13 (4.5%) | 3.46 |
| Single Female/Mother | 30 (10.4%) | 2.73 |
| Non-family | 92 (31.9%) | 1.17 |
| Total Households | 288 (100.0%) | 2.46 |
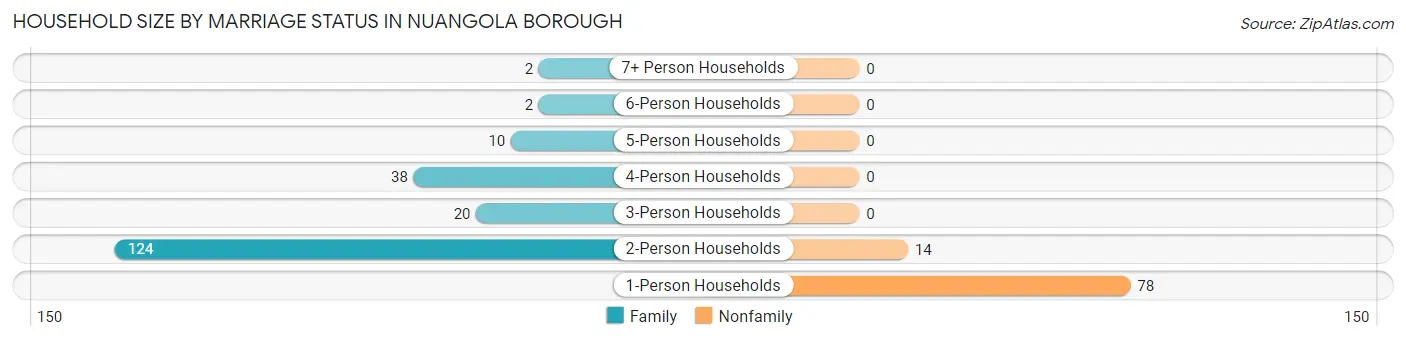
Household Size by Marriage Status in Nuangola borough
Out of a total of 288 households in Nuangola borough, 196 (68.1%) are family households, while 92 (31.9%) are nonfamily households. The most numerous type of family households are 2-person households, comprising 124, and the most common type of nonfamily households are 1-person households, comprising 78.
| Household Size | Family Households | Nonfamily Households |
| 1-Person Households | - | 78 (27.1%) |
| 2-Person Households | 124 (43.1%) | 14 (4.9%) |
| 3-Person Households | 20 (6.9%) | 0 (0.0%) |
| 4-Person Households | 38 (13.2%) | 0 (0.0%) |
| 5-Person Households | 10 (3.5%) | 0 (0.0%) |
| 6-Person Households | 2 (0.7%) | 0 (0.0%) |
| 7+ Person Households | 2 (0.7%) | 0 (0.0%) |
| Total | 196 (68.1%) | 92 (31.9%) |
Female Fertility in Nuangola borough
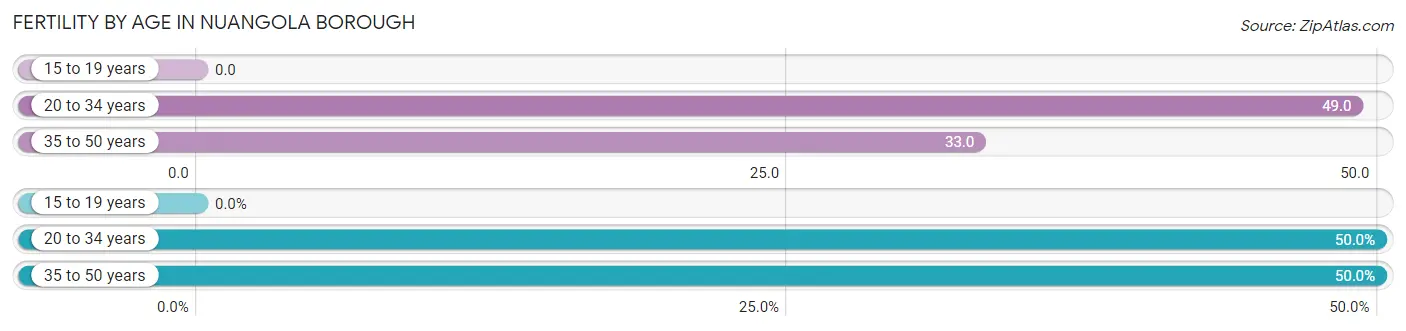
Fertility by Age in Nuangola borough
Average fertility rate in Nuangola borough is 33.0 births per 1,000 women. Women in the age bracket of 20 to 34 years have the highest fertility rate with 49.0 births per 1,000 women. Women in the age bracket of 20 to 34 years acount for 50.0% of all women with births.
| Age Bracket | Women with Births | Births / 1,000 Women |
| 15 to 19 years | 0 (0.0%) | 0.0 |
| 20 to 34 years | 3 (50.0%) | 49.0 |
| 35 to 50 years | 3 (50.0%) | 33.0 |
| Total | 6 (100.0%) | 33.0 |
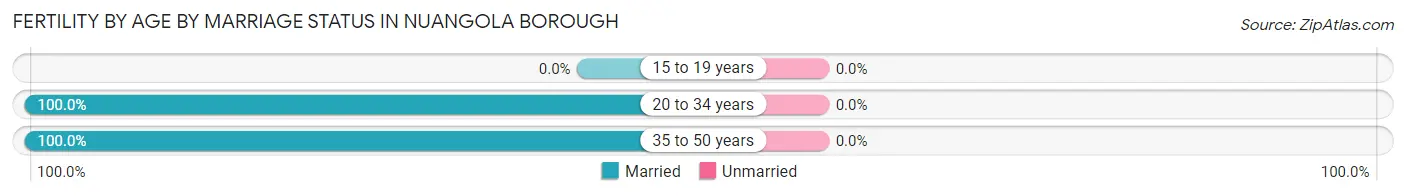
Fertility by Age by Marriage Status in Nuangola borough
| Age Bracket | Married | Unmarried |
| 15 to 19 years | 0 (0.0%) | 0 (0.0%) |
| 20 to 34 years | 3 (100.0%) | 0 (0.0%) |
| 35 to 50 years | 3 (100.0%) | 0 (0.0%) |
| Total | 6 (100.0%) | 0 (0.0%) |
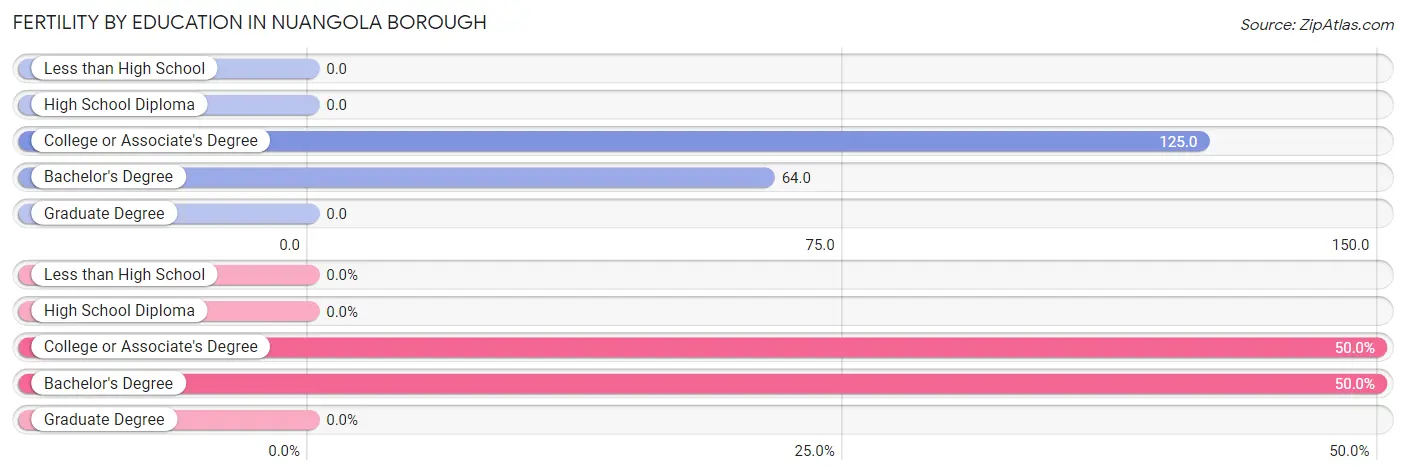
Fertility by Education in Nuangola borough
| Educational Attainment | Women with Births | Births / 1,000 Women |
| Less than High School | 0 (0.0%) | 0.0 |
| High School Diploma | 0 (0.0%) | 0.0 |
| College or Associate's Degree | 3 (50.0%) | 125.0 |
| Bachelor's Degree | 3 (50.0%) | 64.0 |
| Graduate Degree | 0 (0.0%) | 0.0 |
| Total | 6 (100.0%) | 33.0 |
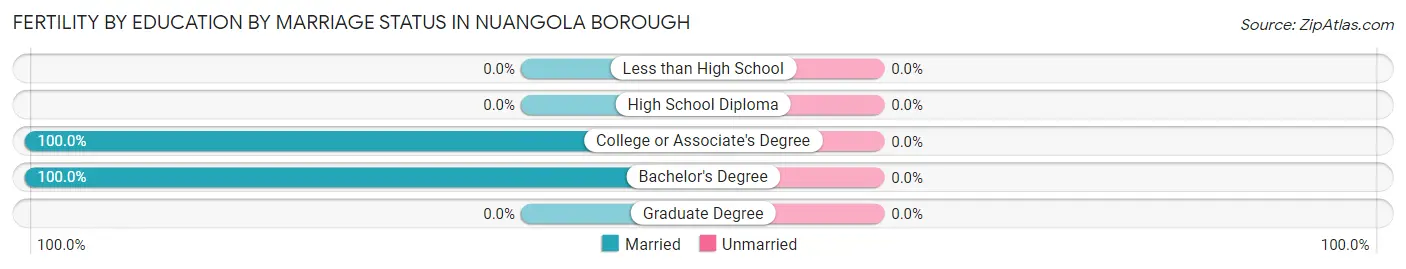
Fertility by Education by Marriage Status in Nuangola borough
| Educational Attainment | Married | Unmarried |
| Less than High School | 0 (0.0%) | 0 (0.0%) |
| High School Diploma | 0 (0.0%) | 0 (0.0%) |
| College or Associate's Degree | 3 (100.0%) | 0 (0.0%) |
| Bachelor's Degree | 3 (100.0%) | 0 (0.0%) |
| Graduate Degree | 0 (0.0%) | 0 (0.0%) |
| Total | 6 (100.0%) | 0 (0.0%) |
Employment Characteristics in Nuangola borough
Employment by Class of Employer in Nuangola borough
Among the 379 employed individuals in Nuangola borough, private company employees (272 | 71.8%), not-for-profit organizations (60 | 15.8%), and local government employees (13 | 3.4%) make up the most common classes of employment.
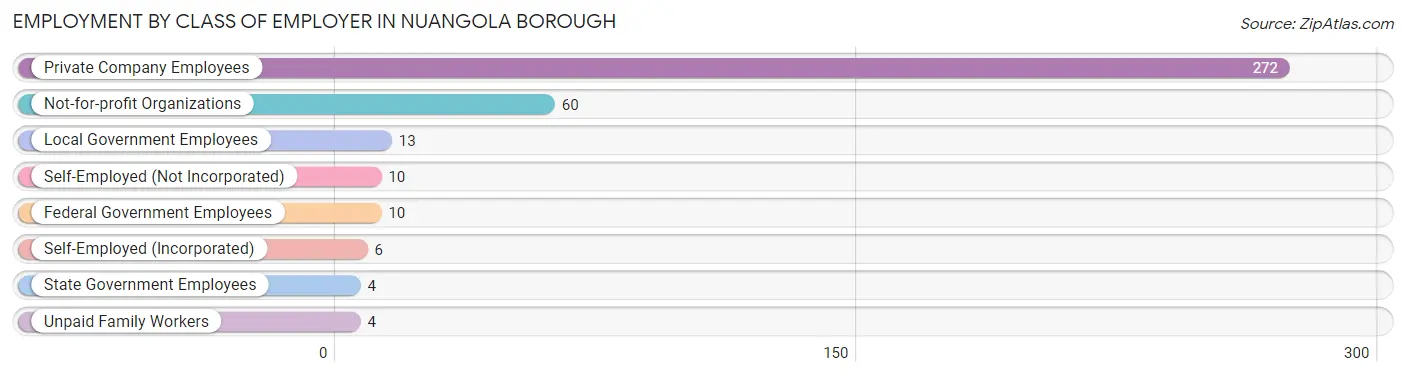
| Employer Class | # Employees | % Employees |
| Private Company Employees | 272 | 71.8% |
| Self-Employed (Incorporated) | 6 | 1.6% |
| Self-Employed (Not Incorporated) | 10 | 2.6% |
| Not-for-profit Organizations | 60 | 15.8% |
| Local Government Employees | 13 | 3.4% |
| State Government Employees | 4 | 1.1% |
| Federal Government Employees | 10 | 2.6% |
| Unpaid Family Workers | 4 | 1.1% |
| Total | 379 | 100.0% |
Employment Status by Age in Nuangola borough
According to the labor force statistics for Nuangola borough, out of the total population over 16 years of age (613), 63.6% or 390 individuals are in the labor force, with 1.8% or 7 of them unemployed. The age group with the highest labor force participation rate is 20 to 24 years, with 100.0% or 50 individuals in the labor force. Within the labor force, the 45 to 54 years age range has the highest percentage of unemployed individuals, with 6.6% or 5 of them being unemployed.
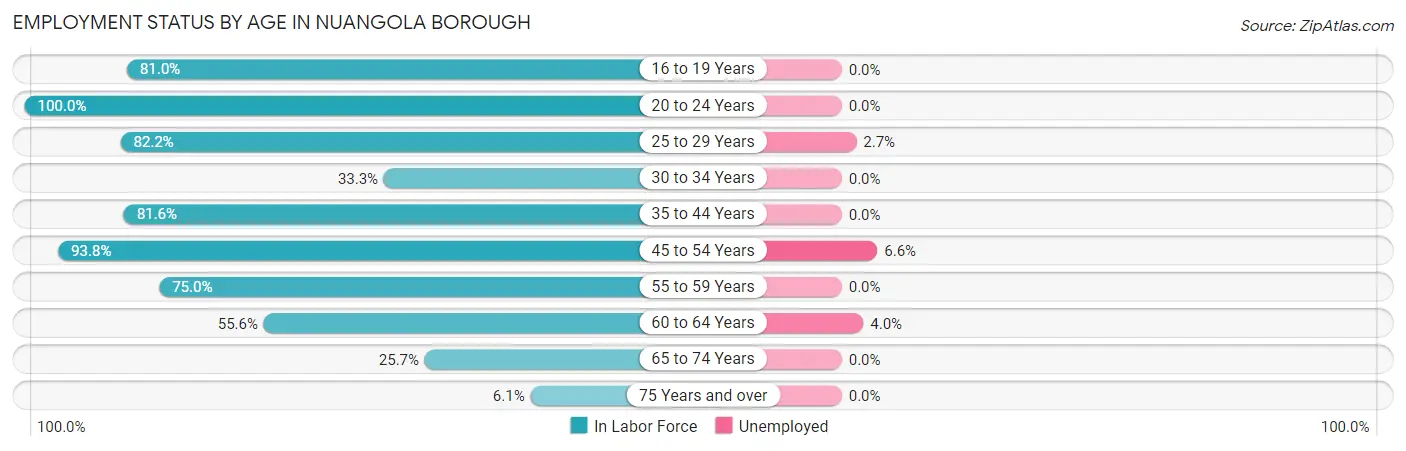
| Age Bracket | In Labor Force | Unemployed |
| 16 to 19 Years | 34 (81.0%) | 0 (0.0%) |
| 20 to 24 Years | 50 (100.0%) | 0 (0.0%) |
| 25 to 29 Years | 37 (82.2%) | 1 (2.7%) |
| 30 to 34 Years | 6 (33.3%) | 0 (0.0%) |
| 35 to 44 Years | 102 (81.6%) | 0 (0.0%) |
| 45 to 54 Years | 76 (93.8%) | 5 (6.6%) |
| 55 to 59 Years | 30 (75.0%) | 0 (0.0%) |
| 60 to 64 Years | 25 (55.6%) | 1 (4.0%) |
| 65 to 74 Years | 26 (25.7%) | 0 (0.0%) |
| 75 Years and over | 4 (6.1%) | 0 (0.0%) |
| Total | 390 (63.6%) | 7 (1.8%) |
Employment Status by Educational Attainment in Nuangola borough
According to labor force statistics for Nuangola borough, 78.0% of individuals (276) out of the total population between 25 and 64 years of age (354) are in the labor force, with 2.5% or 7 of them being unemployed. The group with the highest labor force participation rate are those with the educational attainment of bachelor's degree or higher, with 83.3% or 115 individuals in the labor force. Within the labor force, individuals with college / associate degree education have the highest percentage of unemployment, with 4.1% or 3 of them being unemployed.
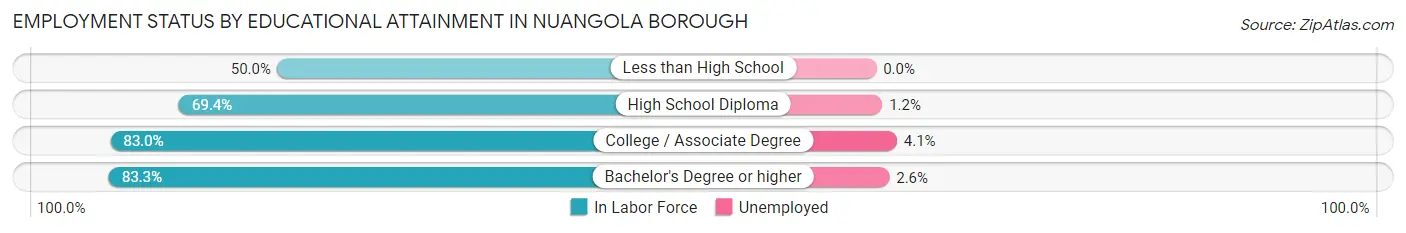
| Educational Attainment | In Labor Force | Unemployed |
| Less than High School | 2 (50.0%) | 0 (0.0%) |
| High School Diploma | 86 (69.4%) | 1 (1.2%) |
| College / Associate Degree | 73 (83.0%) | 4 (4.1%) |
| Bachelor's Degree or higher | 115 (83.3%) | 4 (2.6%) |
| Total | 276 (78.0%) | 9 (2.5%) |
Employment Occupations by Sex in Nuangola borough
Management, Business, Science and Arts Occupations
The most common Management, Business, Science and Arts occupations in Nuangola borough are Community & Social Service (59 | 15.4%), Education Instruction & Library (43 | 11.2%), Computers, Engineering & Science (35 | 9.1%), Management (28 | 7.3%), and Architecture & Engineering (28 | 7.3%).
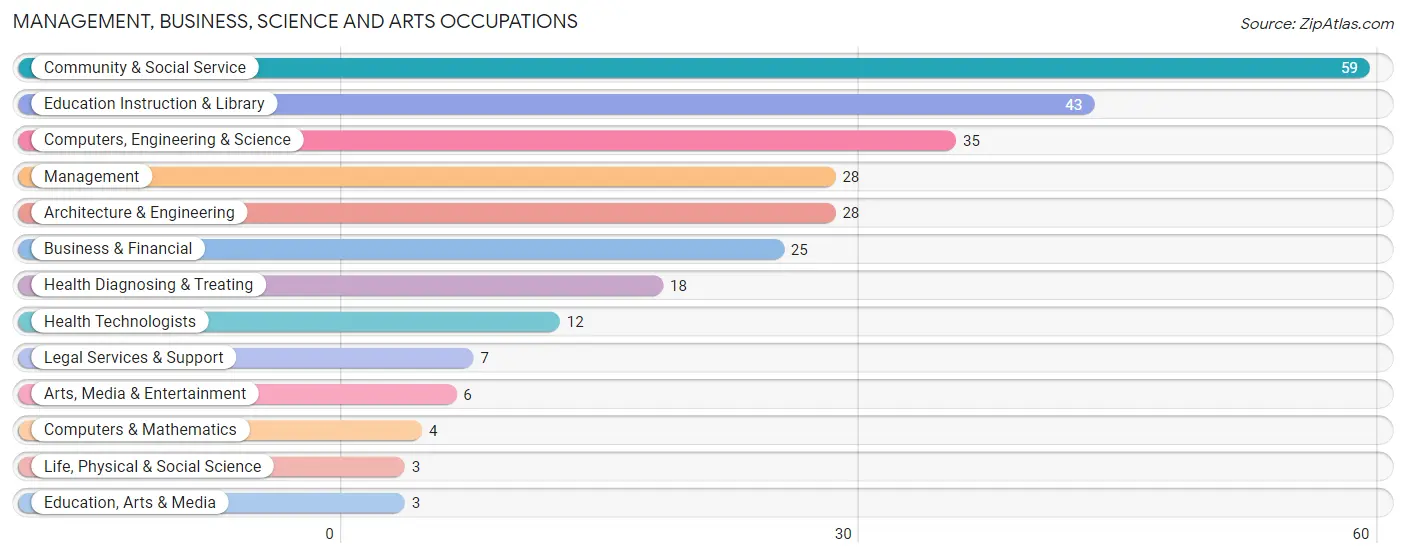
Management, Business, Science and Arts Occupations by Sex
Within the Management, Business, Science and Arts occupations in Nuangola borough, the most male-oriented occupations are Life, Physical & Social Science (100.0%), Legal Services & Support (100.0%), and Management (64.3%), while the most female-oriented occupations are Education, Arts & Media (100.0%), Health Diagnosing & Treating (100.0%), and Health Technologists (100.0%).
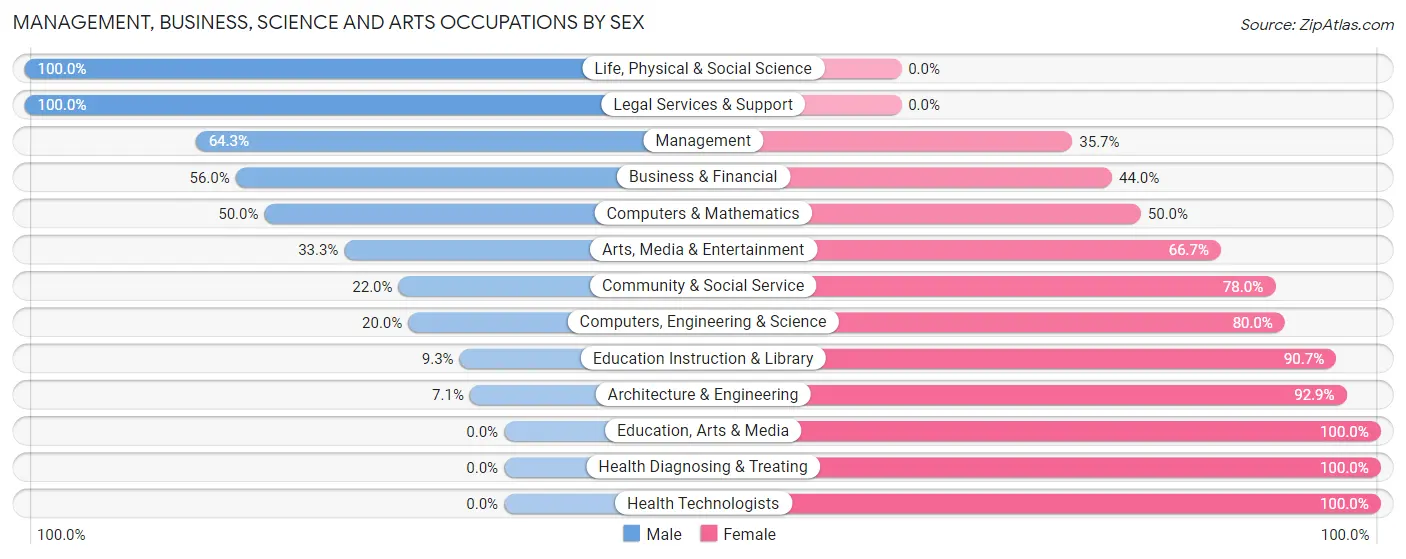
| Occupation | Male | Female |
| Management | 18 (64.3%) | 10 (35.7%) |
| Business & Financial | 14 (56.0%) | 11 (44.0%) |
| Computers, Engineering & Science | 7 (20.0%) | 28 (80.0%) |
| Computers & Mathematics | 2 (50.0%) | 2 (50.0%) |
| Architecture & Engineering | 2 (7.1%) | 26 (92.9%) |
| Life, Physical & Social Science | 3 (100.0%) | 0 (0.0%) |
| Community & Social Service | 13 (22.0%) | 46 (78.0%) |
| Education, Arts & Media | 0 (0.0%) | 3 (100.0%) |
| Legal Services & Support | 7 (100.0%) | 0 (0.0%) |
| Education Instruction & Library | 4 (9.3%) | 39 (90.7%) |
| Arts, Media & Entertainment | 2 (33.3%) | 4 (66.7%) |
| Health Diagnosing & Treating | 0 (0.0%) | 18 (100.0%) |
| Health Technologists | 0 (0.0%) | 12 (100.0%) |
| Total (Category) | 52 (31.5%) | 113 (68.5%) |
| Total (Overall) | 176 (46.0%) | 207 (54.0%) |
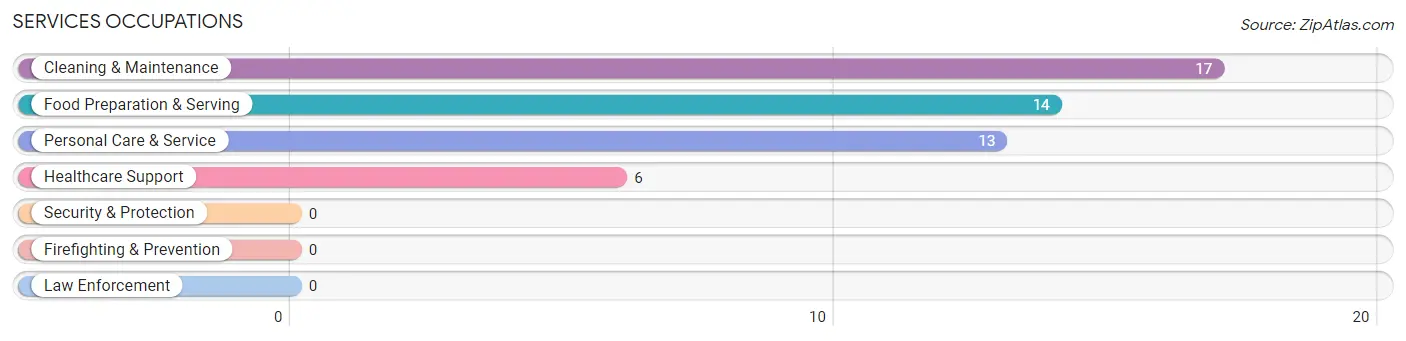
Services Occupations
The most common Services occupations in Nuangola borough are Cleaning & Maintenance (17 | 4.4%), Food Preparation & Serving (14 | 3.7%), Personal Care & Service (13 | 3.4%), and Healthcare Support (6 | 1.6%).
Services Occupations by Sex
Within the Services occupations in Nuangola borough, the most male-oriented occupations are Personal Care & Service (100.0%), Cleaning & Maintenance (88.2%), and Food Preparation & Serving (71.4%), while the most female-oriented occupations are Healthcare Support (100.0%), Food Preparation & Serving (28.6%), and Cleaning & Maintenance (11.8%).
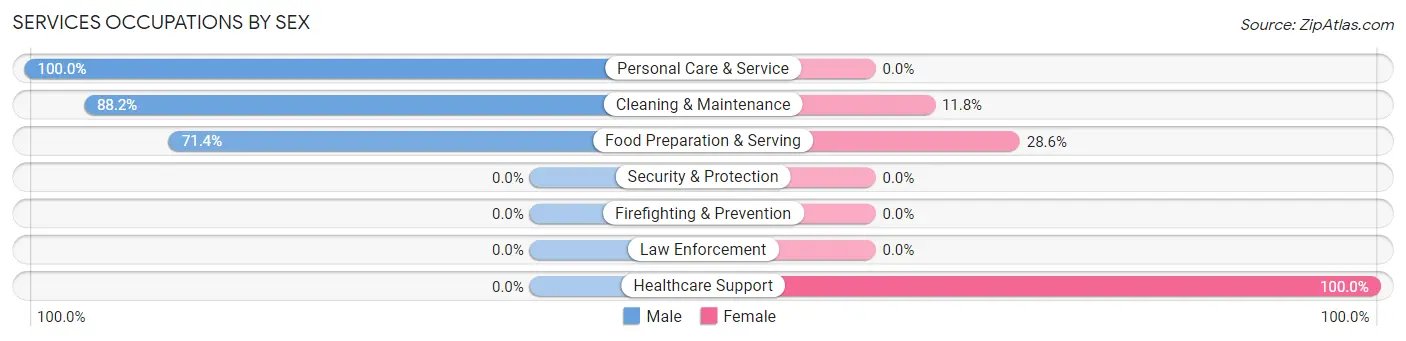
| Occupation | Male | Female |
| Healthcare Support | 0 (0.0%) | 6 (100.0%) |
| Security & Protection | 0 (0.0%) | 0 (0.0%) |
| Firefighting & Prevention | 0 (0.0%) | 0 (0.0%) |
| Law Enforcement | 0 (0.0%) | 0 (0.0%) |
| Food Preparation & Serving | 10 (71.4%) | 4 (28.6%) |
| Cleaning & Maintenance | 15 (88.2%) | 2 (11.8%) |
| Personal Care & Service | 13 (100.0%) | 0 (0.0%) |
| Total (Category) | 38 (76.0%) | 12 (24.0%) |
| Total (Overall) | 176 (46.0%) | 207 (54.0%) |
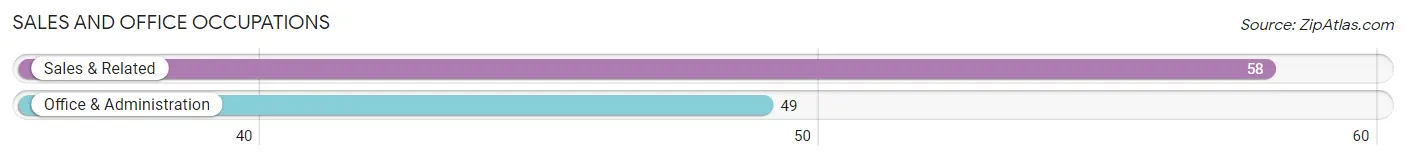
Sales and Office Occupations
The most common Sales and Office occupations in Nuangola borough are Sales & Related (58 | 15.1%), and Office & Administration (49 | 12.8%).
Sales and Office Occupations by Sex
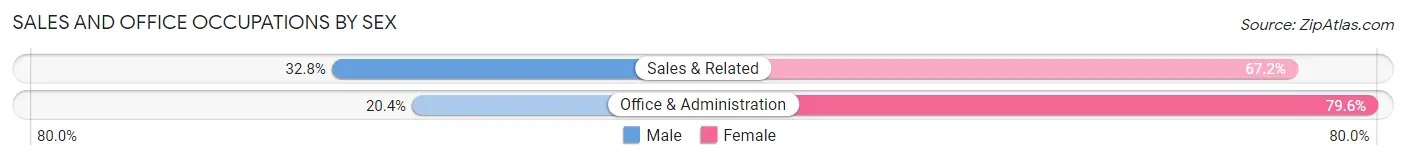
| Occupation | Male | Female |
| Sales & Related | 19 (32.8%) | 39 (67.2%) |
| Office & Administration | 10 (20.4%) | 39 (79.6%) |
| Total (Category) | 29 (27.1%) | 78 (72.9%) |
| Total (Overall) | 176 (46.0%) | 207 (54.0%) |
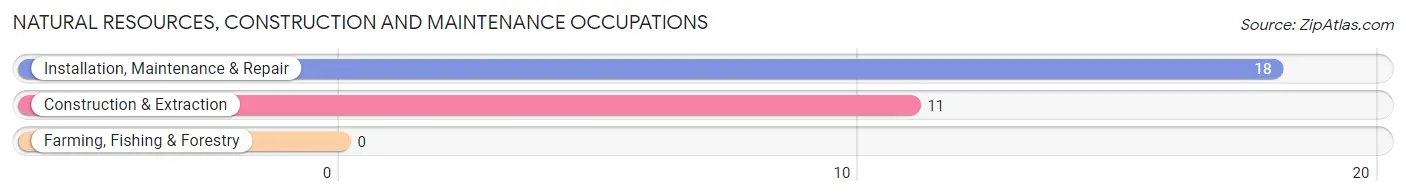
Natural Resources, Construction and Maintenance Occupations
The most common Natural Resources, Construction and Maintenance occupations in Nuangola borough are Installation, Maintenance & Repair (18 | 4.7%), and Construction & Extraction (11 | 2.9%).
Natural Resources, Construction and Maintenance Occupations by Sex
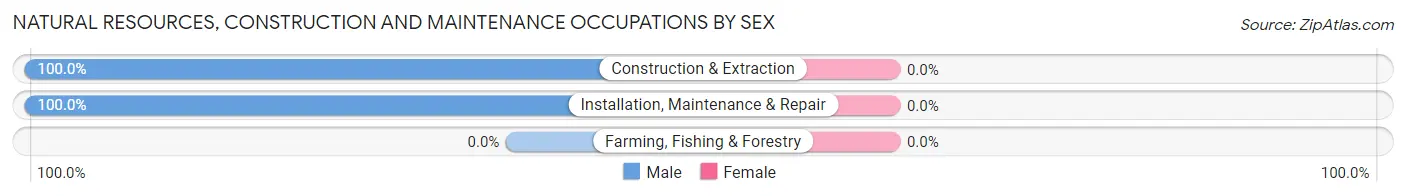
| Occupation | Male | Female |
| Farming, Fishing & Forestry | 0 (0.0%) | 0 (0.0%) |
| Construction & Extraction | 11 (100.0%) | 0 (0.0%) |
| Installation, Maintenance & Repair | 18 (100.0%) | 0 (0.0%) |
| Total (Category) | 29 (100.0%) | 0 (0.0%) |
| Total (Overall) | 176 (46.0%) | 207 (54.0%) |
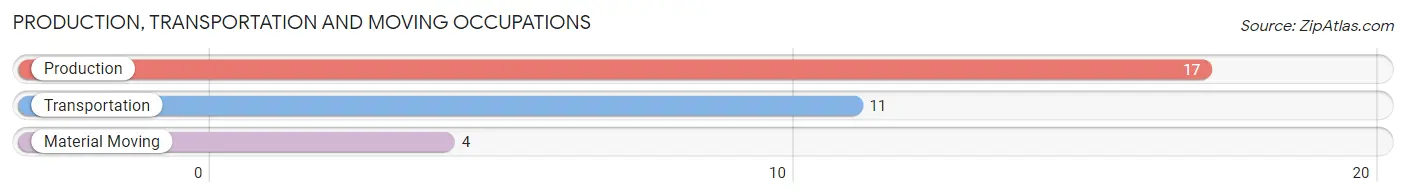
Production, Transportation and Moving Occupations
The most common Production, Transportation and Moving occupations in Nuangola borough are Production (17 | 4.4%), Transportation (11 | 2.9%), and Material Moving (4 | 1.0%).
Production, Transportation and Moving Occupations by Sex
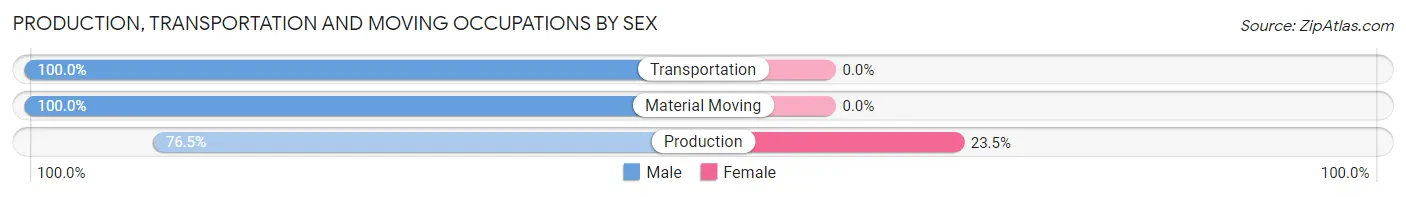
| Occupation | Male | Female |
| Production | 13 (76.5%) | 4 (23.5%) |
| Transportation | 11 (100.0%) | 0 (0.0%) |
| Material Moving | 4 (100.0%) | 0 (0.0%) |
| Total (Category) | 28 (87.5%) | 4 (12.5%) |
| Total (Overall) | 176 (46.0%) | 207 (54.0%) |
Employment Industries by Sex in Nuangola borough
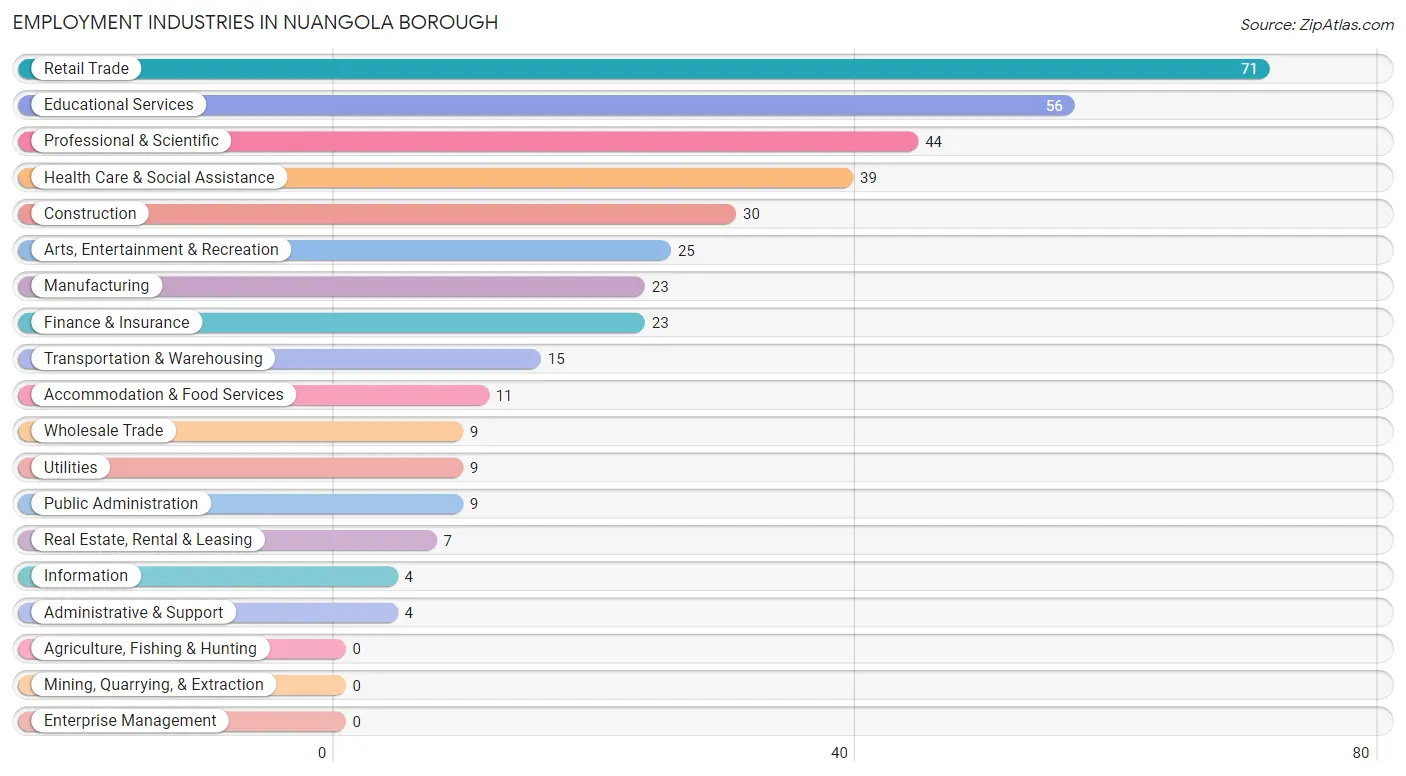
Employment Industries in Nuangola borough
The major employment industries in Nuangola borough include Retail Trade (71 | 18.5%), Educational Services (56 | 14.6%), Professional & Scientific (44 | 11.5%), Health Care & Social Assistance (39 | 10.2%), and Construction (30 | 7.8%).
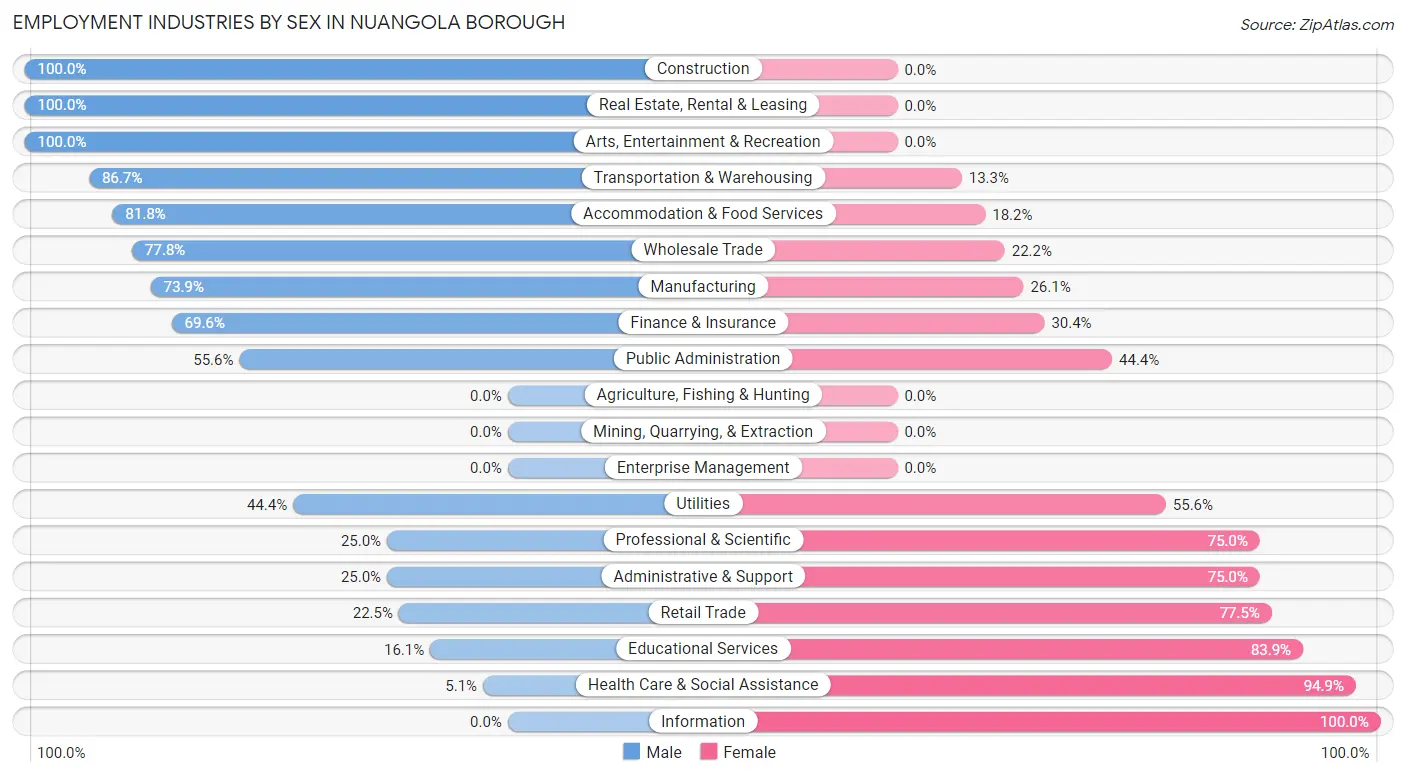
Employment Industries by Sex in Nuangola borough
The Nuangola borough industries that see more men than women are Construction (100.0%), Real Estate, Rental & Leasing (100.0%), and Arts, Entertainment & Recreation (100.0%), whereas the industries that tend to have a higher number of women are Information (100.0%), Health Care & Social Assistance (94.9%), and Educational Services (83.9%).
| Industry | Male | Female |
| Agriculture, Fishing & Hunting | 0 (0.0%) | 0 (0.0%) |
| Mining, Quarrying, & Extraction | 0 (0.0%) | 0 (0.0%) |
| Construction | 30 (100.0%) | 0 (0.0%) |
| Manufacturing | 17 (73.9%) | 6 (26.1%) |
| Wholesale Trade | 7 (77.8%) | 2 (22.2%) |
| Retail Trade | 16 (22.5%) | 55 (77.5%) |
| Transportation & Warehousing | 13 (86.7%) | 2 (13.3%) |
| Utilities | 4 (44.4%) | 5 (55.6%) |
| Information | 0 (0.0%) | 4 (100.0%) |
| Finance & Insurance | 16 (69.6%) | 7 (30.4%) |
| Real Estate, Rental & Leasing | 7 (100.0%) | 0 (0.0%) |
| Professional & Scientific | 11 (25.0%) | 33 (75.0%) |
| Enterprise Management | 0 (0.0%) | 0 (0.0%) |
| Administrative & Support | 1 (25.0%) | 3 (75.0%) |
| Educational Services | 9 (16.1%) | 47 (83.9%) |
| Health Care & Social Assistance | 2 (5.1%) | 37 (94.9%) |
| Arts, Entertainment & Recreation | 25 (100.0%) | 0 (0.0%) |
| Accommodation & Food Services | 9 (81.8%) | 2 (18.2%) |
| Public Administration | 5 (55.6%) | 4 (44.4%) |
| Total | 176 (46.0%) | 207 (54.0%) |
Education in Nuangola borough
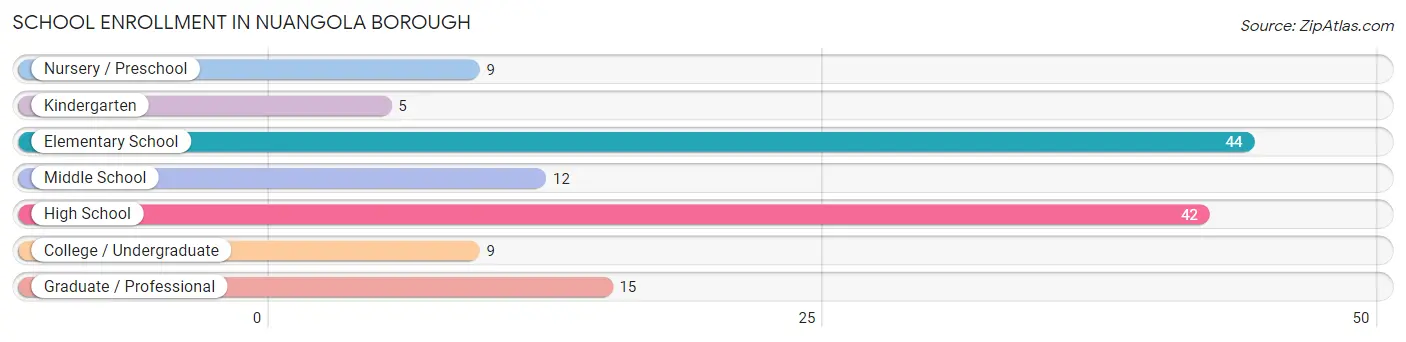
School Enrollment in Nuangola borough
The most common levels of schooling among the 136 students in Nuangola borough are elementary school (44 | 32.4%), high school (42 | 30.9%), and graduate / professional (15 | 11.0%).
| School Level | # Students | % Students |
| Nursery / Preschool | 9 | 6.6% |
| Kindergarten | 5 | 3.7% |
| Elementary School | 44 | 32.4% |
| Middle School | 12 | 8.8% |
| High School | 42 | 30.9% |
| College / Undergraduate | 9 | 6.6% |
| Graduate / Professional | 15 | 11.0% |
| Total | 136 | 100.0% |
School Enrollment by Age by Funding Source in Nuangola borough
Out of a total of 136 students who are enrolled in schools in Nuangola borough, 14 (10.3%) attend a private institution, while the remaining 122 (89.7%) are enrolled in public schools. The age group of 3 to 4 year olds has the highest likelihood of being enrolled in private schools, with 6 (66.7% in the age bracket) enrolled. Conversely, the age group of 10 to 14 year olds has the lowest likelihood of being enrolled in a private school, with 18 (100.0% in the age bracket) attending a public institution.
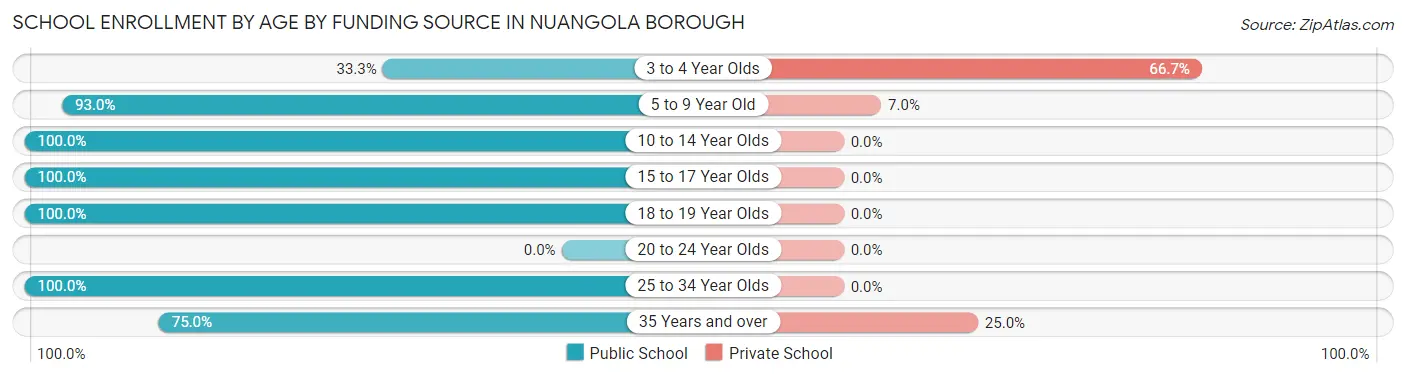
| Age Bracket | Public School | Private School |
| 3 to 4 Year Olds | 3 (33.3%) | 6 (66.7%) |
| 5 to 9 Year Old | 40 (93.0%) | 3 (7.0%) |
| 10 to 14 Year Olds | 18 (100.0%) | 0 (0.0%) |
| 15 to 17 Year Olds | 13 (100.0%) | 0 (0.0%) |
| 18 to 19 Year Olds | 31 (100.0%) | 0 (0.0%) |
| 20 to 24 Year Olds | 0 (0.0%) | 0 (0.0%) |
| 25 to 34 Year Olds | 2 (100.0%) | 0 (0.0%) |
| 35 Years and over | 15 (75.0%) | 5 (25.0%) |
| Total | 122 (89.7%) | 14 (10.3%) |
Educational Attainment by Field of Study in Nuangola borough
Education (34 | 17.0%), psychology (31 | 15.5%), arts & humanities (30 | 15.0%), science & technology (26 | 13.0%), and business (26 | 13.0%) are the most common fields of study among 200 individuals in Nuangola borough who have obtained a bachelor's degree or higher.
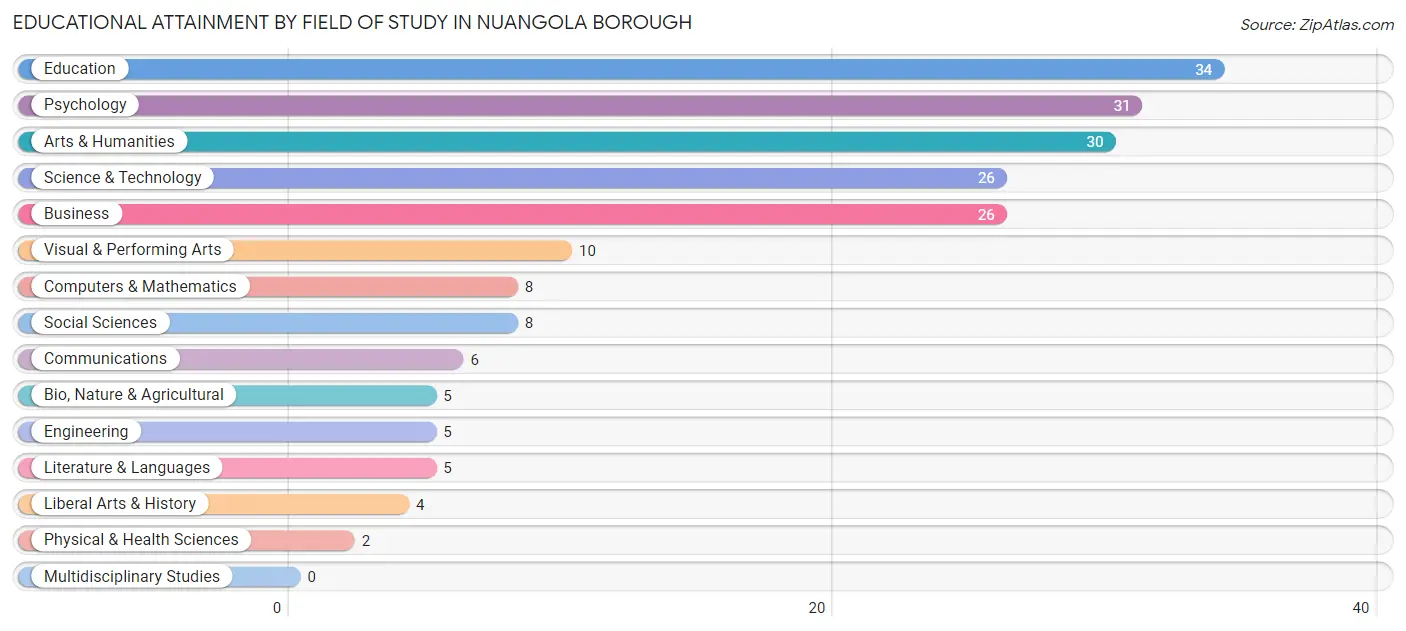
| Field of Study | # Graduates | % Graduates |
| Computers & Mathematics | 8 | 4.0% |
| Bio, Nature & Agricultural | 5 | 2.5% |
| Physical & Health Sciences | 2 | 1.0% |
| Psychology | 31 | 15.5% |
| Social Sciences | 8 | 4.0% |
| Engineering | 5 | 2.5% |
| Multidisciplinary Studies | 0 | 0.0% |
| Science & Technology | 26 | 13.0% |
| Business | 26 | 13.0% |
| Education | 34 | 17.0% |
| Literature & Languages | 5 | 2.5% |
| Liberal Arts & History | 4 | 2.0% |
| Visual & Performing Arts | 10 | 5.0% |
| Communications | 6 | 3.0% |
| Arts & Humanities | 30 | 15.0% |
| Total | 200 | 100.0% |
Transportation & Commute in Nuangola borough
Vehicle Availability by Sex in Nuangola borough
The most prevalent vehicle ownership categories in Nuangola borough are males with 2 vehicles (99, accounting for 57.6%) and females with 2 vehicles (65, making up 47.8%).
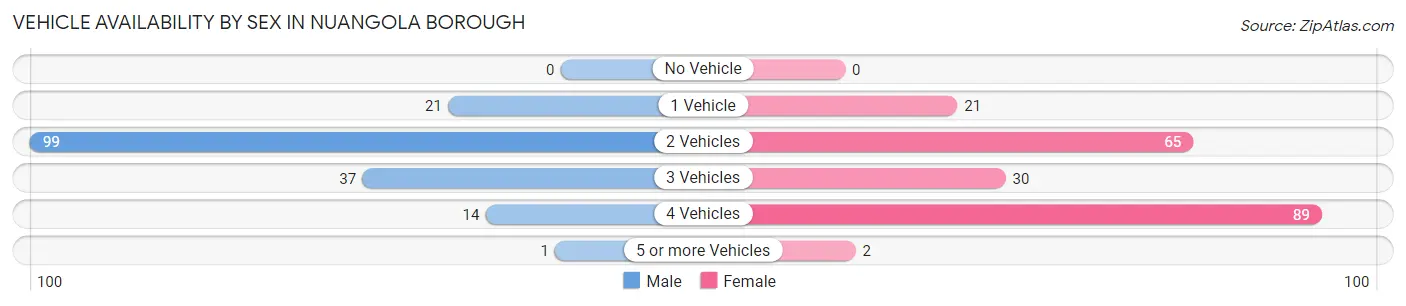
| Vehicles Available | Male | Female |
| No Vehicle | 0 (0.0%) | 0 (0.0%) |
| 1 Vehicle | 21 (12.2%) | 21 (10.1%) |
| 2 Vehicles | 99 (57.6%) | 65 (31.4%) |
| 3 Vehicles | 37 (21.5%) | 30 (14.5%) |
| 4 Vehicles | 14 (8.1%) | 89 (43.0%) |
| 5 or more Vehicles | 1 (0.6%) | 2 (1.0%) |
| Total | 172 (100.0%) | 207 (100.0%) |
Commute Time in Nuangola borough
The most frequently occuring commute durations in Nuangola borough are 15 to 19 minutes (117 commuters, 37.9%), 30 to 34 minutes (51 commuters, 16.5%), and 10 to 14 minutes (45 commuters, 14.6%).
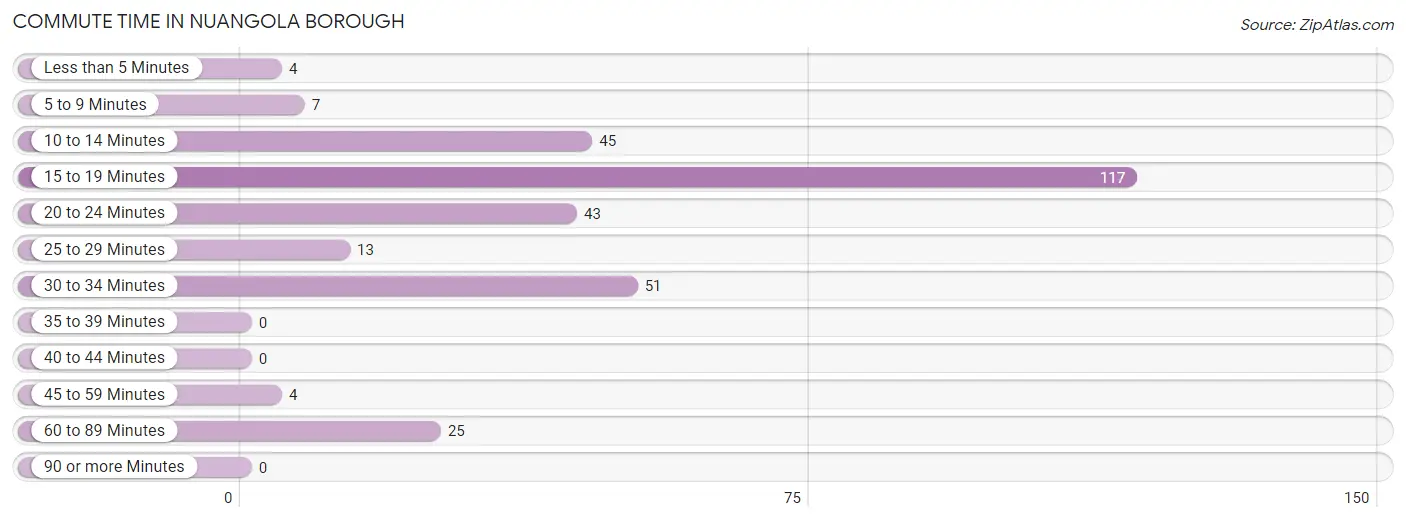
| Commute Time | # Commuters | % Commuters |
| Less than 5 Minutes | 4 | 1.3% |
| 5 to 9 Minutes | 7 | 2.3% |
| 10 to 14 Minutes | 45 | 14.6% |
| 15 to 19 Minutes | 117 | 37.9% |
| 20 to 24 Minutes | 43 | 13.9% |
| 25 to 29 Minutes | 13 | 4.2% |
| 30 to 34 Minutes | 51 | 16.5% |
| 35 to 39 Minutes | 0 | 0.0% |
| 40 to 44 Minutes | 0 | 0.0% |
| 45 to 59 Minutes | 4 | 1.3% |
| 60 to 89 Minutes | 25 | 8.1% |
| 90 or more Minutes | 0 | 0.0% |
Commute Time by Sex in Nuangola borough
The most common commute times in Nuangola borough are 15 to 19 minutes (59 commuters, 36.9%) for males and 15 to 19 minutes (58 commuters, 38.9%) for females.
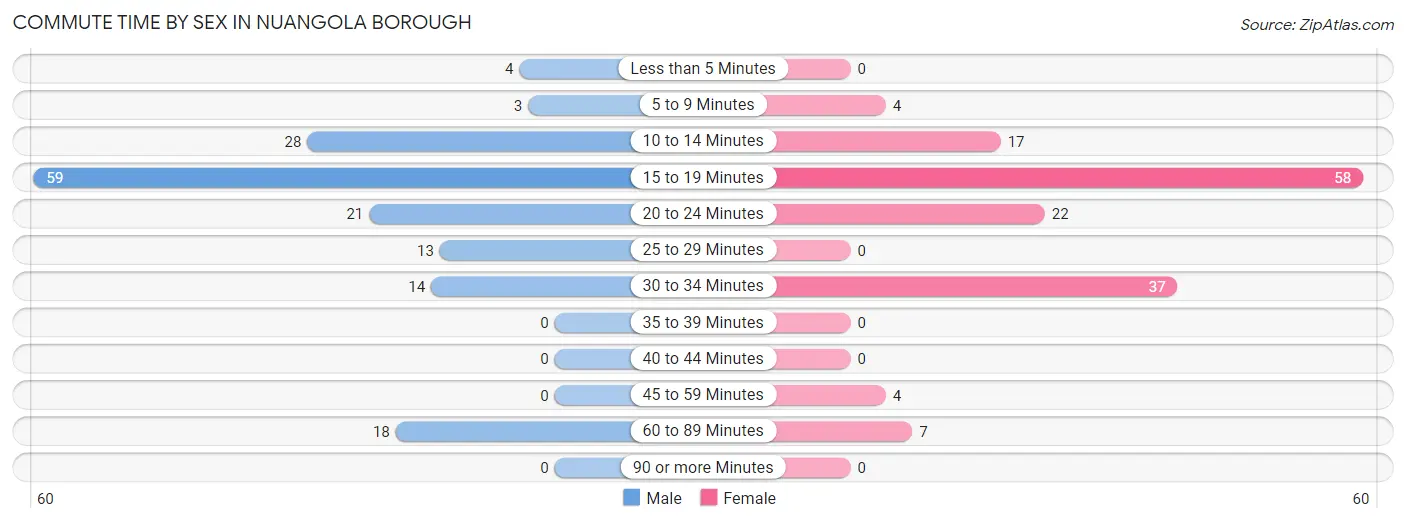
| Commute Time | Male | Female |
| Less than 5 Minutes | 4 (2.5%) | 0 (0.0%) |
| 5 to 9 Minutes | 3 (1.9%) | 4 (2.7%) |
| 10 to 14 Minutes | 28 (17.5%) | 17 (11.4%) |
| 15 to 19 Minutes | 59 (36.9%) | 58 (38.9%) |
| 20 to 24 Minutes | 21 (13.1%) | 22 (14.8%) |
| 25 to 29 Minutes | 13 (8.1%) | 0 (0.0%) |
| 30 to 34 Minutes | 14 (8.7%) | 37 (24.8%) |
| 35 to 39 Minutes | 0 (0.0%) | 0 (0.0%) |
| 40 to 44 Minutes | 0 (0.0%) | 0 (0.0%) |
| 45 to 59 Minutes | 0 (0.0%) | 4 (2.7%) |
| 60 to 89 Minutes | 18 (11.3%) | 7 (4.7%) |
| 90 or more Minutes | 0 (0.0%) | 0 (0.0%) |
Time of Departure to Work by Sex in Nuangola borough
The most frequent times of departure to work in Nuangola borough are 5:30 AM to 5:59 AM (25, 15.6%) for males and 7:30 AM to 7:59 AM (42, 28.2%) for females.
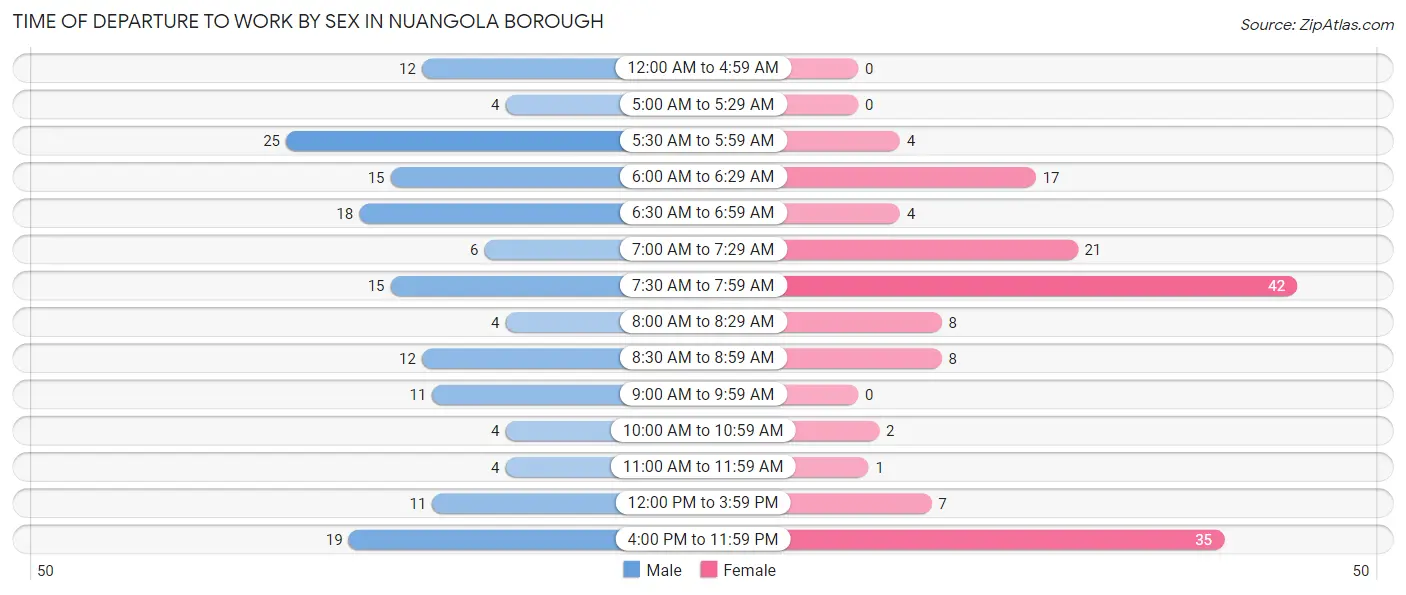
| Time of Departure | Male | Female |
| 12:00 AM to 4:59 AM | 12 (7.5%) | 0 (0.0%) |
| 5:00 AM to 5:29 AM | 4 (2.5%) | 0 (0.0%) |
| 5:30 AM to 5:59 AM | 25 (15.6%) | 4 (2.7%) |
| 6:00 AM to 6:29 AM | 15 (9.4%) | 17 (11.4%) |
| 6:30 AM to 6:59 AM | 18 (11.3%) | 4 (2.7%) |
| 7:00 AM to 7:29 AM | 6 (3.7%) | 21 (14.1%) |
| 7:30 AM to 7:59 AM | 15 (9.4%) | 42 (28.2%) |
| 8:00 AM to 8:29 AM | 4 (2.5%) | 8 (5.4%) |
| 8:30 AM to 8:59 AM | 12 (7.5%) | 8 (5.4%) |
| 9:00 AM to 9:59 AM | 11 (6.9%) | 0 (0.0%) |
| 10:00 AM to 10:59 AM | 4 (2.5%) | 2 (1.3%) |
| 11:00 AM to 11:59 AM | 4 (2.5%) | 1 (0.7%) |
| 12:00 PM to 3:59 PM | 11 (6.9%) | 7 (4.7%) |
| 4:00 PM to 11:59 PM | 19 (11.9%) | 35 (23.5%) |
| Total | 160 (100.0%) | 149 (100.0%) |
Housing Occupancy in Nuangola borough
Occupancy by Ownership in Nuangola borough
Of the total 288 dwellings in Nuangola borough, owner-occupied units account for 251 (87.2%), while renter-occupied units make up 37 (12.9%).
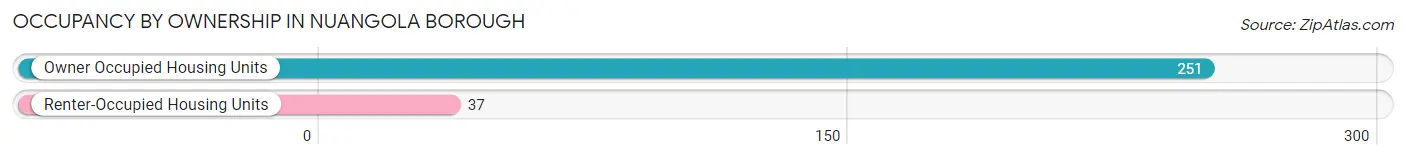
| Occupancy | # Housing Units | % Housing Units |
| Owner Occupied Housing Units | 251 | 87.2% |
| Renter-Occupied Housing Units | 37 | 12.9% |
| Total Occupied Housing Units | 288 | 100.0% |
Occupancy by Household Size in Nuangola borough
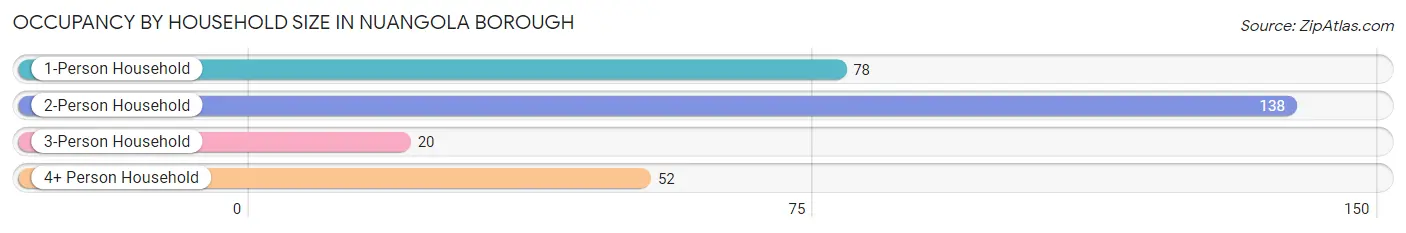
| Household Size | # Housing Units | % Housing Units |
| 1-Person Household | 78 | 27.1% |
| 2-Person Household | 138 | 47.9% |
| 3-Person Household | 20 | 6.9% |
| 4+ Person Household | 52 | 18.1% |
| Total Housing Units | 288 | 100.0% |
Occupancy by Ownership by Household Size in Nuangola borough
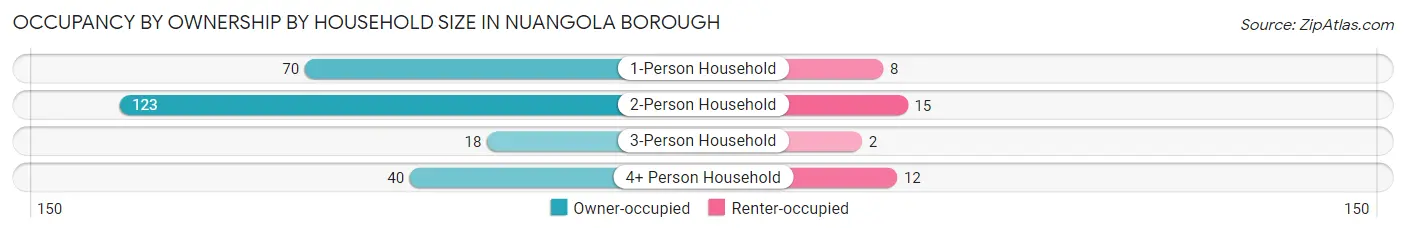
| Household Size | Owner-occupied | Renter-occupied |
| 1-Person Household | 70 (89.7%) | 8 (10.3%) |
| 2-Person Household | 123 (89.1%) | 15 (10.9%) |
| 3-Person Household | 18 (90.0%) | 2 (10.0%) |
| 4+ Person Household | 40 (76.9%) | 12 (23.1%) |
| Total Housing Units | 251 (87.2%) | 37 (12.9%) |
Occupancy by Educational Attainment in Nuangola borough
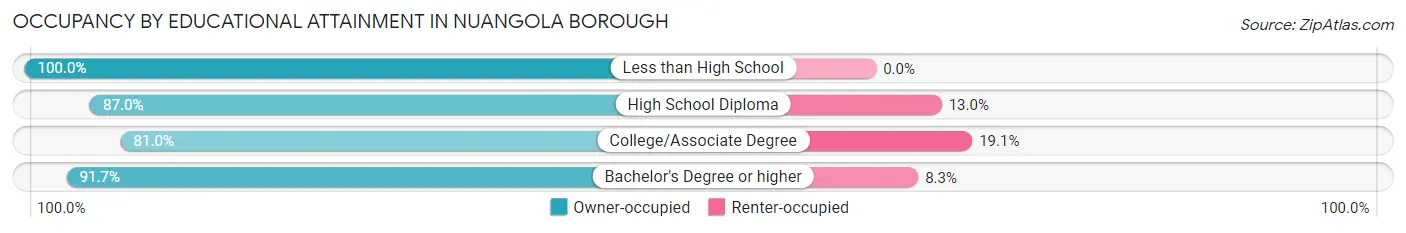
| Household Size | Owner-occupied | Renter-occupied |
| Less than High School | 8 (100.0%) | 0 (0.0%) |
| High School Diploma | 87 (87.0%) | 13 (13.0%) |
| College/Associate Degree | 68 (80.9%) | 16 (19.1%) |
| Bachelor's Degree or higher | 88 (91.7%) | 8 (8.3%) |
Occupancy by Age of Householder in Nuangola borough
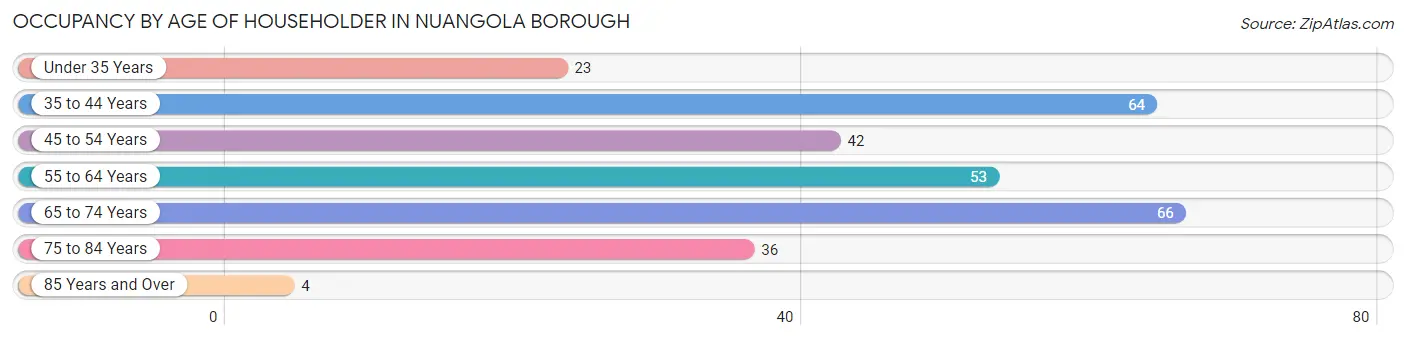
| Age Bracket | # Households | % Households |
| Under 35 Years | 23 | 8.0% |
| 35 to 44 Years | 64 | 22.2% |
| 45 to 54 Years | 42 | 14.6% |
| 55 to 64 Years | 53 | 18.4% |
| 65 to 74 Years | 66 | 22.9% |
| 75 to 84 Years | 36 | 12.5% |
| 85 Years and Over | 4 | 1.4% |
| Total | 288 | 100.0% |
Housing Finances in Nuangola borough
Median Income by Occupancy in Nuangola borough
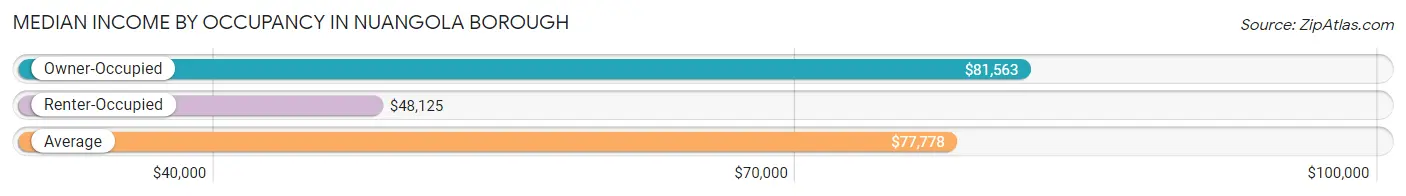
| Occupancy Type | # Households | Median Income |
| Owner-Occupied | 251 (87.2%) | $81,563 |
| Renter-Occupied | 37 (12.9%) | $48,125 |
| Average | 288 (100.0%) | $77,778 |
Occupancy by Householder Income Bracket in Nuangola borough
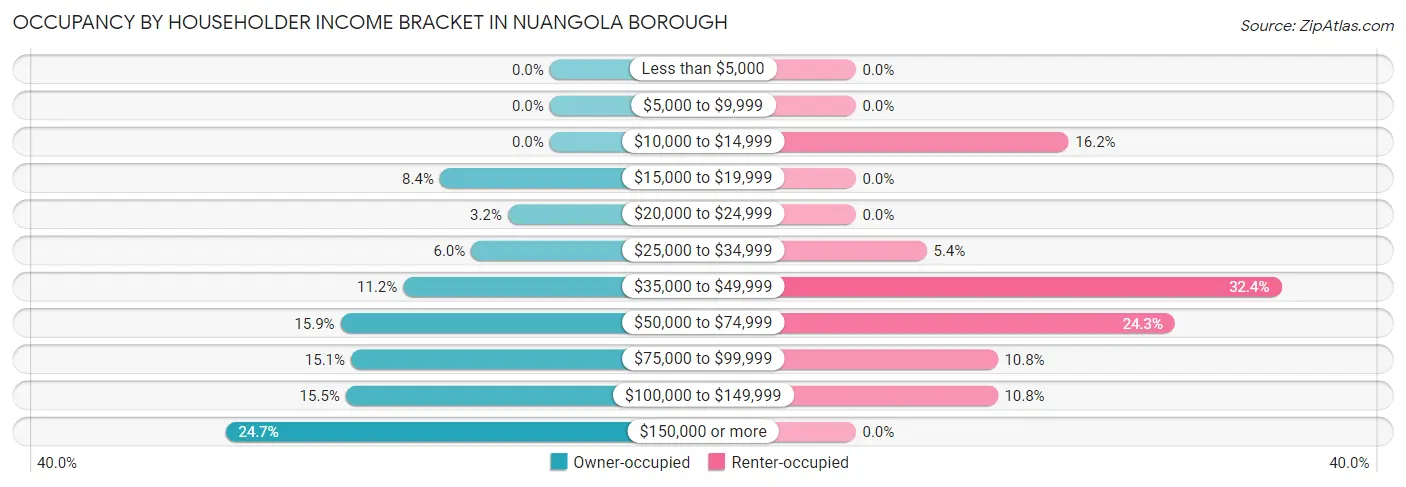
| Income Bracket | Owner-occupied | Renter-occupied |
| Less than $5,000 | 0 (0.0%) | 0 (0.0%) |
| $5,000 to $9,999 | 0 (0.0%) | 0 (0.0%) |
| $10,000 to $14,999 | 0 (0.0%) | 6 (16.2%) |
| $15,000 to $19,999 | 21 (8.4%) | 0 (0.0%) |
| $20,000 to $24,999 | 8 (3.2%) | 0 (0.0%) |
| $25,000 to $34,999 | 15 (6.0%) | 2 (5.4%) |
| $35,000 to $49,999 | 28 (11.2%) | 12 (32.4%) |
| $50,000 to $74,999 | 40 (15.9%) | 9 (24.3%) |
| $75,000 to $99,999 | 38 (15.1%) | 4 (10.8%) |
| $100,000 to $149,999 | 39 (15.5%) | 4 (10.8%) |
| $150,000 or more | 62 (24.7%) | 0 (0.0%) |
| Total | 251 (100.0%) | 37 (100.0%) |
Monthly Housing Cost Tiers in Nuangola borough
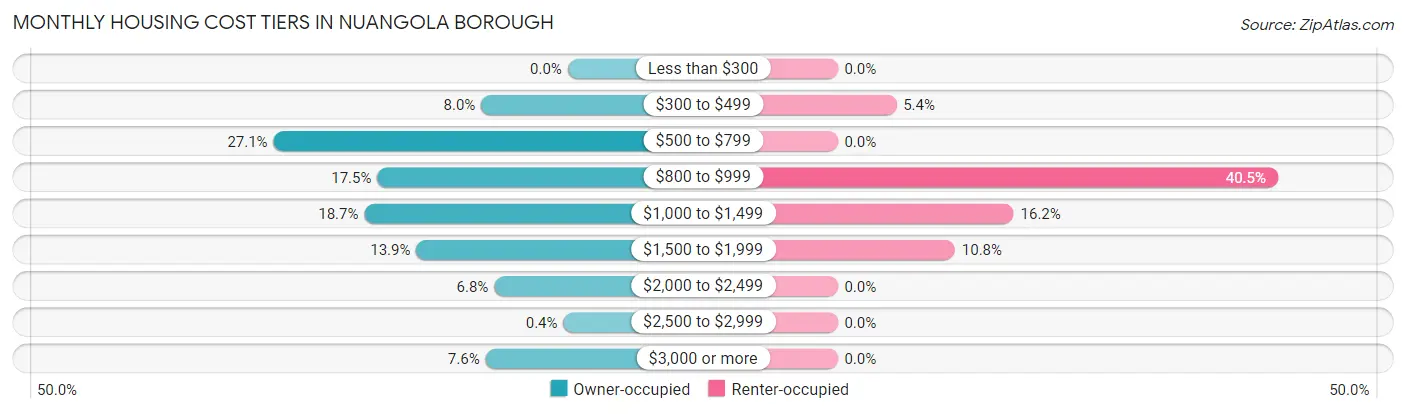
| Monthly Cost | Owner-occupied | Renter-occupied |
| Less than $300 | 0 (0.0%) | 0 (0.0%) |
| $300 to $499 | 20 (8.0%) | 2 (5.4%) |
| $500 to $799 | 68 (27.1%) | 0 (0.0%) |
| $800 to $999 | 44 (17.5%) | 15 (40.5%) |
| $1,000 to $1,499 | 47 (18.7%) | 6 (16.2%) |
| $1,500 to $1,999 | 35 (13.9%) | 4 (10.8%) |
| $2,000 to $2,499 | 17 (6.8%) | 0 (0.0%) |
| $2,500 to $2,999 | 1 (0.4%) | 0 (0.0%) |
| $3,000 or more | 19 (7.6%) | 0 (0.0%) |
| Total | 251 (100.0%) | 37 (100.0%) |
Physical Housing Characteristics in Nuangola borough
Housing Structures in Nuangola borough
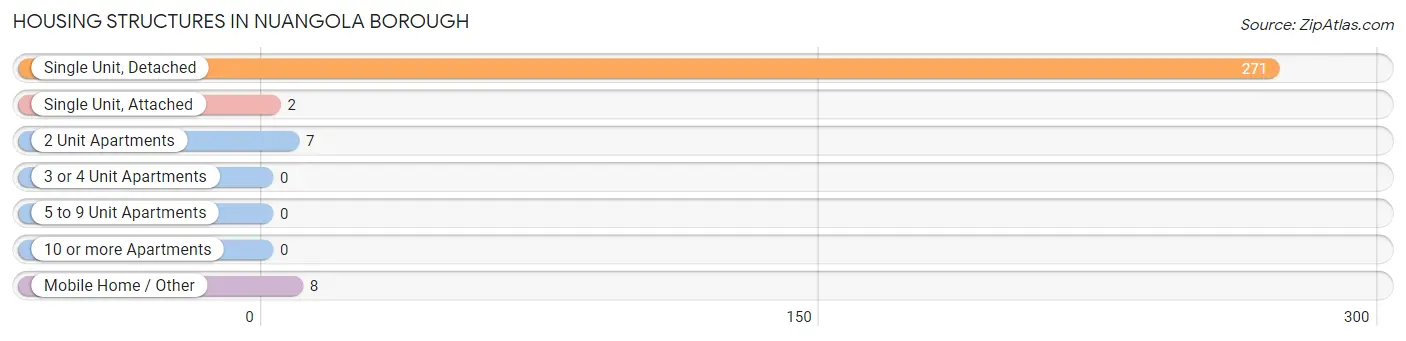
| Structure Type | # Housing Units | % Housing Units |
| Single Unit, Detached | 271 | 94.1% |
| Single Unit, Attached | 2 | 0.7% |
| 2 Unit Apartments | 7 | 2.4% |
| 3 or 4 Unit Apartments | 0 | 0.0% |
| 5 to 9 Unit Apartments | 0 | 0.0% |
| 10 or more Apartments | 0 | 0.0% |
| Mobile Home / Other | 8 | 2.8% |
| Total | 288 | 100.0% |
Housing Structures by Occupancy in Nuangola borough
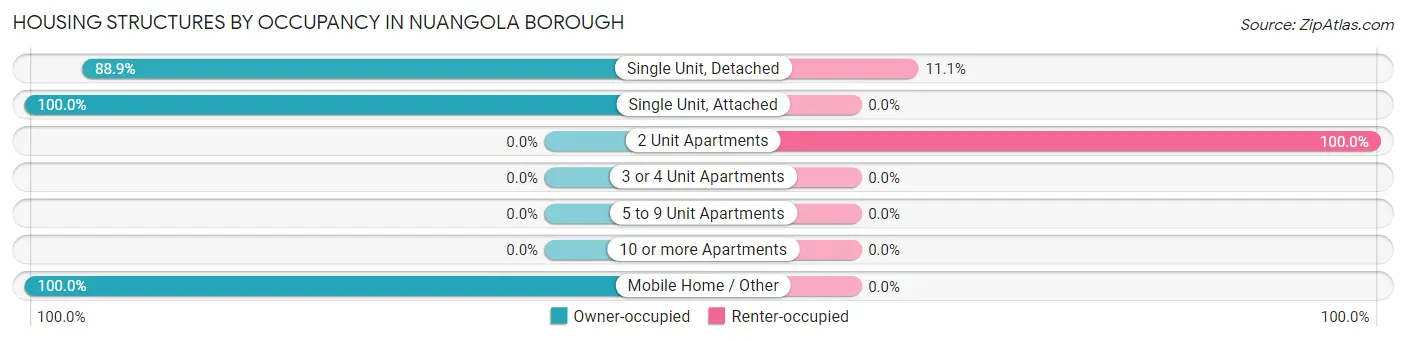
| Structure Type | Owner-occupied | Renter-occupied |
| Single Unit, Detached | 241 (88.9%) | 30 (11.1%) |
| Single Unit, Attached | 2 (100.0%) | 0 (0.0%) |
| 2 Unit Apartments | 0 (0.0%) | 7 (100.0%) |
| 3 or 4 Unit Apartments | 0 (0.0%) | 0 (0.0%) |
| 5 to 9 Unit Apartments | 0 (0.0%) | 0 (0.0%) |
| 10 or more Apartments | 0 (0.0%) | 0 (0.0%) |
| Mobile Home / Other | 8 (100.0%) | 0 (0.0%) |
| Total | 251 (87.2%) | 37 (12.9%) |
Housing Structures by Number of Rooms in Nuangola borough
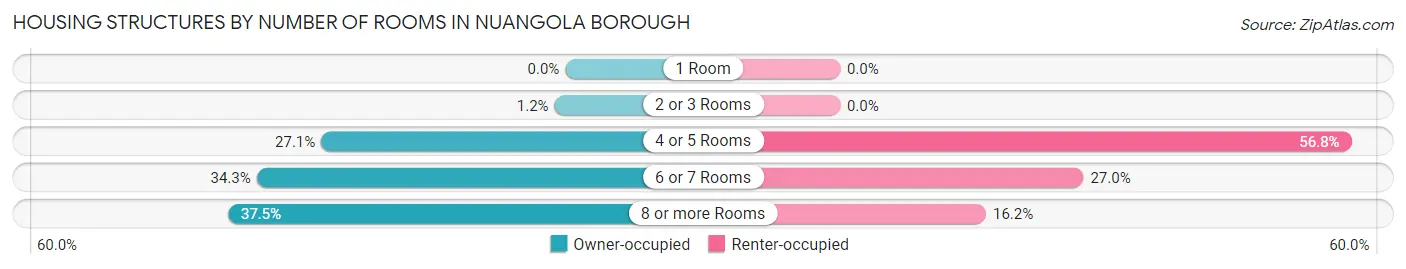
| Number of Rooms | Owner-occupied | Renter-occupied |
| 1 Room | 0 (0.0%) | 0 (0.0%) |
| 2 or 3 Rooms | 3 (1.2%) | 0 (0.0%) |
| 4 or 5 Rooms | 68 (27.1%) | 21 (56.8%) |
| 6 or 7 Rooms | 86 (34.3%) | 10 (27.0%) |
| 8 or more Rooms | 94 (37.4%) | 6 (16.2%) |
| Total | 251 (100.0%) | 37 (100.0%) |
Housing Structure by Heating Type in Nuangola borough
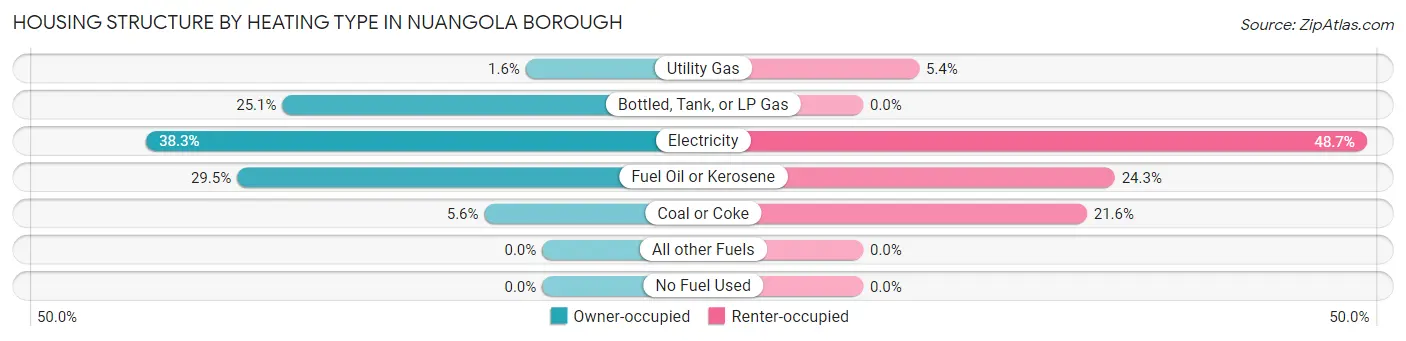
| Heating Type | Owner-occupied | Renter-occupied |
| Utility Gas | 4 (1.6%) | 2 (5.4%) |
| Bottled, Tank, or LP Gas | 63 (25.1%) | 0 (0.0%) |
| Electricity | 96 (38.3%) | 18 (48.6%) |
| Fuel Oil or Kerosene | 74 (29.5%) | 9 (24.3%) |
| Coal or Coke | 14 (5.6%) | 8 (21.6%) |
| All other Fuels | 0 (0.0%) | 0 (0.0%) |
| No Fuel Used | 0 (0.0%) | 0 (0.0%) |
| Total | 251 (100.0%) | 37 (100.0%) |
Household Vehicle Usage in Nuangola borough
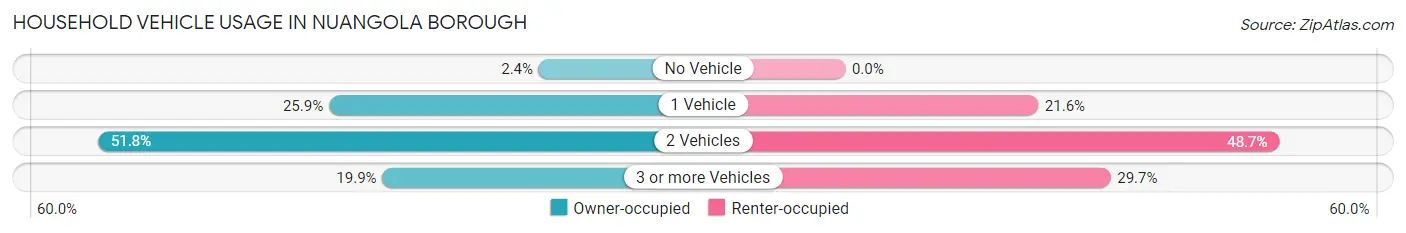
| Vehicles per Household | Owner-occupied | Renter-occupied |
| No Vehicle | 6 (2.4%) | 0 (0.0%) |
| 1 Vehicle | 65 (25.9%) | 8 (21.6%) |
| 2 Vehicles | 130 (51.8%) | 18 (48.6%) |
| 3 or more Vehicles | 50 (19.9%) | 11 (29.7%) |
| Total | 251 (100.0%) | 37 (100.0%) |
Real Estate & Mortgages in Nuangola borough
Real Estate and Mortgage Overview in Nuangola borough
| Characteristic | Without Mortgage | With Mortgage |
| Housing Units | 107 | 144 |
| Median Property Value | $226,000 | $215,600 |
| Median Household Income | $70,893 | $44 |
| Monthly Housing Costs | $711 | $19 |
| Real Estate Taxes | $2,917 | $0 |
Property Value by Mortgage Status in Nuangola borough
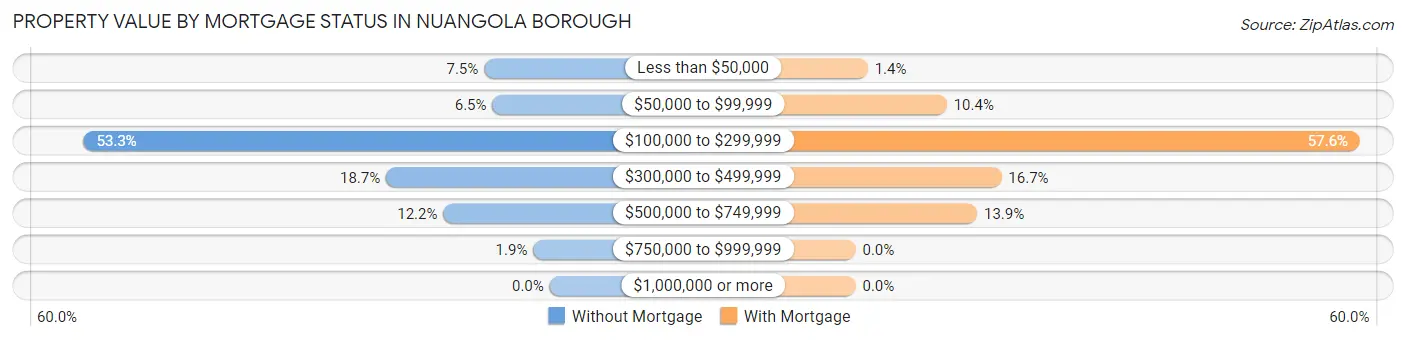
| Property Value | Without Mortgage | With Mortgage |
| Less than $50,000 | 8 (7.5%) | 2 (1.4%) |
| $50,000 to $99,999 | 7 (6.5%) | 15 (10.4%) |
| $100,000 to $299,999 | 57 (53.3%) | 83 (57.6%) |
| $300,000 to $499,999 | 20 (18.7%) | 24 (16.7%) |
| $500,000 to $749,999 | 13 (12.1%) | 20 (13.9%) |
| $750,000 to $999,999 | 2 (1.9%) | 0 (0.0%) |
| $1,000,000 or more | 0 (0.0%) | 0 (0.0%) |
| Total | 107 (100.0%) | 144 (100.0%) |
Household Income by Mortgage Status in Nuangola borough
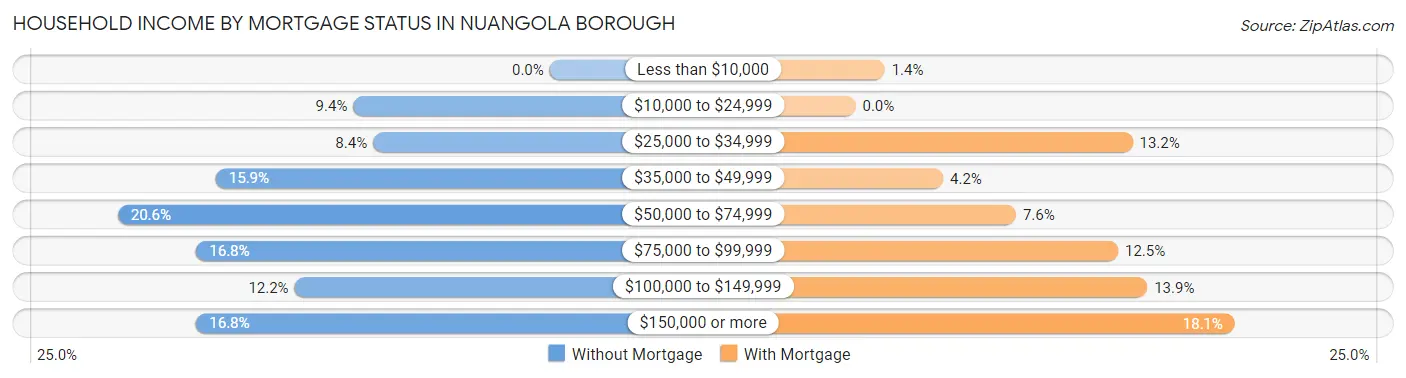
| Household Income | Without Mortgage | With Mortgage |
| Less than $10,000 | 0 (0.0%) | 2 (1.4%) |
| $10,000 to $24,999 | 10 (9.3%) | 0 (0.0%) |
| $25,000 to $34,999 | 9 (8.4%) | 19 (13.2%) |
| $35,000 to $49,999 | 17 (15.9%) | 6 (4.2%) |
| $50,000 to $74,999 | 22 (20.6%) | 11 (7.6%) |
| $75,000 to $99,999 | 18 (16.8%) | 18 (12.5%) |
| $100,000 to $149,999 | 13 (12.1%) | 20 (13.9%) |
| $150,000 or more | 18 (16.8%) | 26 (18.1%) |
| Total | 107 (100.0%) | 144 (100.0%) |
Property Value to Household Income Ratio in Nuangola borough
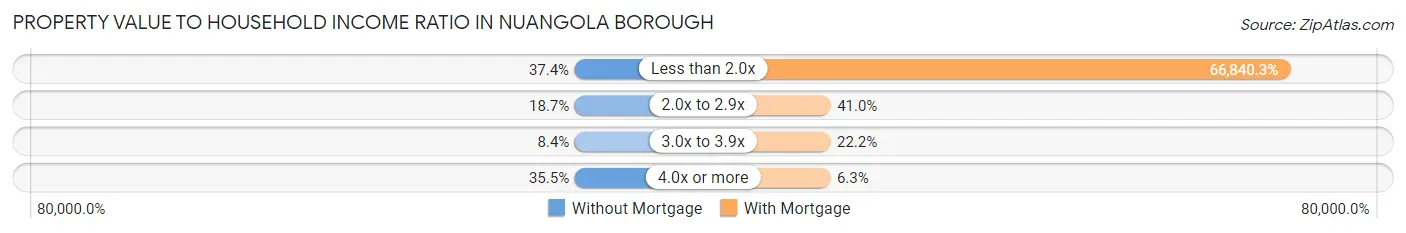
| Value-to-Income Ratio | Without Mortgage | With Mortgage |
| Less than 2.0x | 40 (37.4%) | 96,250 (66,840.3%) |
| 2.0x to 2.9x | 20 (18.7%) | 59 (41.0%) |
| 3.0x to 3.9x | 9 (8.4%) | 32 (22.2%) |
| 4.0x or more | 38 (35.5%) | 9 (6.2%) |
| Total | 107 (100.0%) | 144 (100.0%) |
Real Estate Taxes by Mortgage Status in Nuangola borough
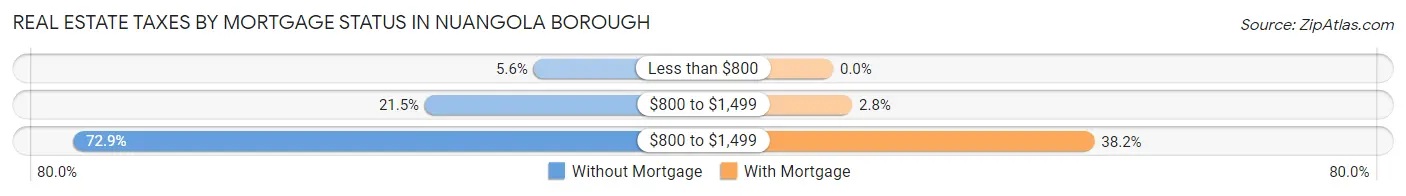
| Property Taxes | Without Mortgage | With Mortgage |
| Less than $800 | 6 (5.6%) | 0 (0.0%) |
| $800 to $1,499 | 23 (21.5%) | 4 (2.8%) |
| $800 to $1,499 | 78 (72.9%) | 55 (38.2%) |
| Total | 107 (100.0%) | 144 (100.0%) |
Health & Disability in Nuangola borough
Health Insurance Coverage by Age in Nuangola borough
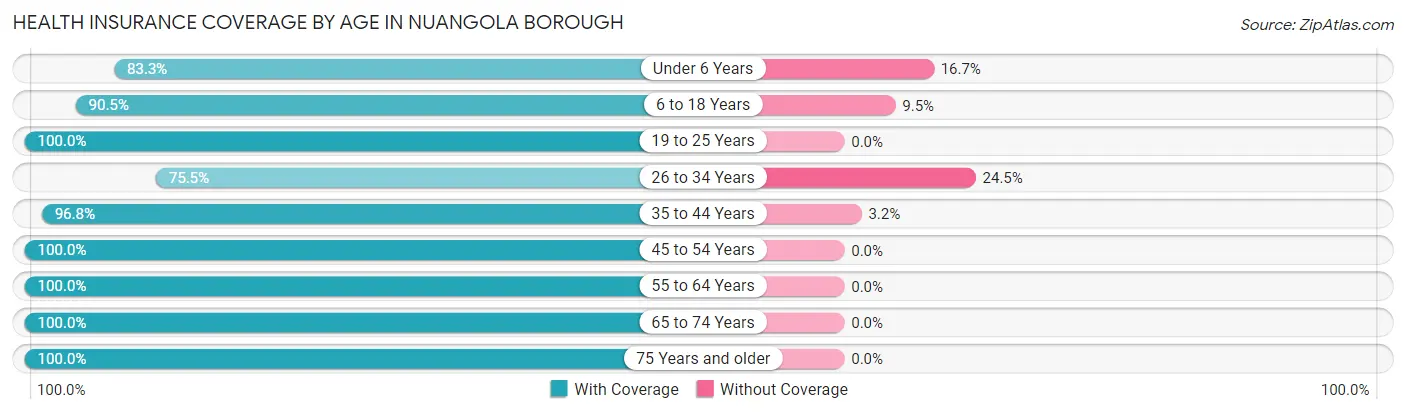
| Age Bracket | With Coverage | Without Coverage |
| Under 6 Years | 30 (83.3%) | 6 (16.7%) |
| 6 to 18 Years | 95 (90.5%) | 10 (9.5%) |
| 19 to 25 Years | 64 (100.0%) | 0 (0.0%) |
| 26 to 34 Years | 37 (75.5%) | 12 (24.5%) |
| 35 to 44 Years | 121 (96.8%) | 4 (3.2%) |
| 45 to 54 Years | 81 (100.0%) | 0 (0.0%) |
| 55 to 64 Years | 85 (100.0%) | 0 (0.0%) |
| 65 to 74 Years | 101 (100.0%) | 0 (0.0%) |
| 75 Years and older | 66 (100.0%) | 0 (0.0%) |
| Total | 680 (95.5%) | 32 (4.5%) |
Health Insurance Coverage by Citizenship Status in Nuangola borough
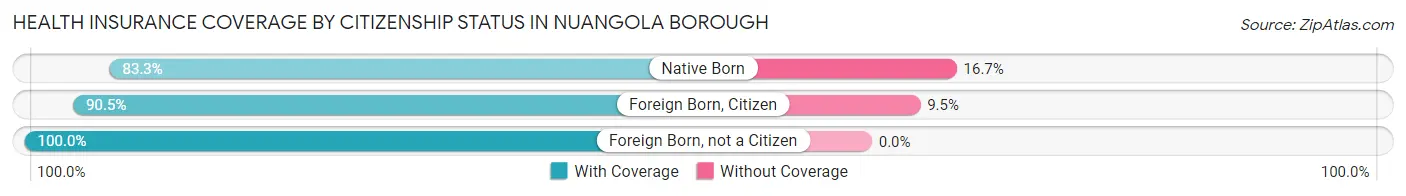
| Citizenship Status | With Coverage | Without Coverage |
| Native Born | 30 (83.3%) | 6 (16.7%) |
| Foreign Born, Citizen | 95 (90.5%) | 10 (9.5%) |
| Foreign Born, not a Citizen | 64 (100.0%) | 0 (0.0%) |
Health Insurance Coverage by Household Income in Nuangola borough
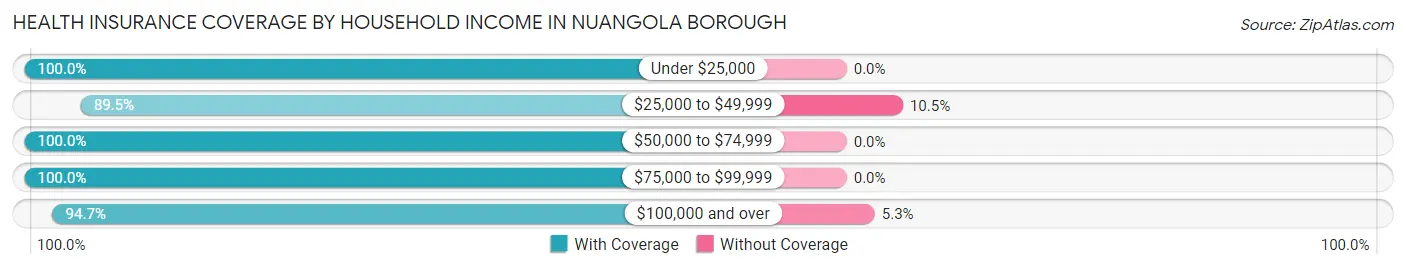
| Household Income | With Coverage | Without Coverage |
| Under $25,000 | 43 (100.0%) | 0 (0.0%) |
| $25,000 to $49,999 | 119 (89.5%) | 14 (10.5%) |
| $50,000 to $74,999 | 99 (100.0%) | 0 (0.0%) |
| $75,000 to $99,999 | 91 (100.0%) | 0 (0.0%) |
| $100,000 and over | 324 (94.7%) | 18 (5.3%) |
Public vs Private Health Insurance Coverage by Age in Nuangola borough
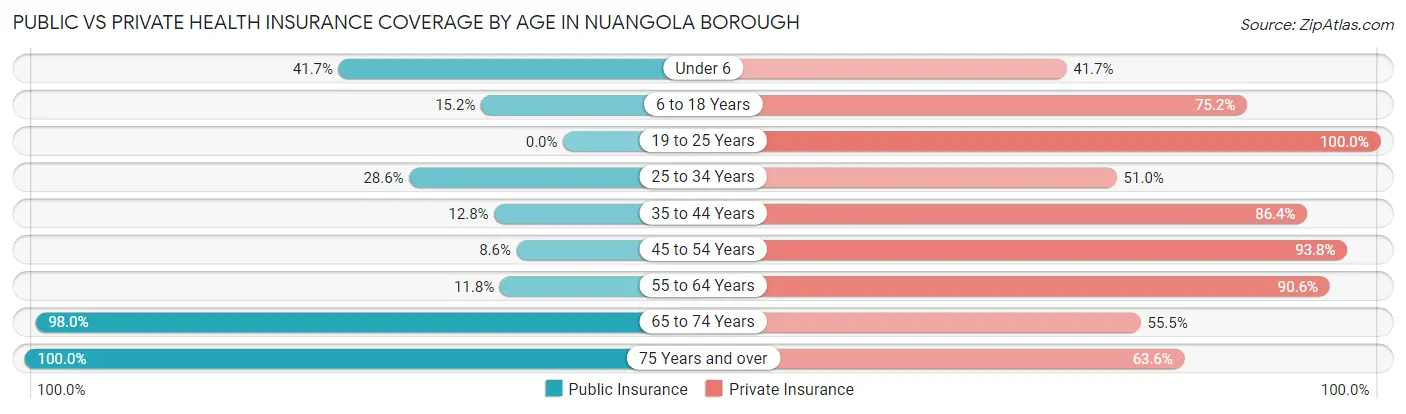
| Age Bracket | Public Insurance | Private Insurance |
| Under 6 | 15 (41.7%) | 15 (41.7%) |
| 6 to 18 Years | 16 (15.2%) | 79 (75.2%) |
| 19 to 25 Years | 0 (0.0%) | 64 (100.0%) |
| 25 to 34 Years | 14 (28.6%) | 25 (51.0%) |
| 35 to 44 Years | 16 (12.8%) | 108 (86.4%) |
| 45 to 54 Years | 7 (8.6%) | 76 (93.8%) |
| 55 to 64 Years | 10 (11.8%) | 77 (90.6%) |
| 65 to 74 Years | 99 (98.0%) | 56 (55.4%) |
| 75 Years and over | 66 (100.0%) | 42 (63.6%) |
| Total | 243 (34.1%) | 542 (76.1%) |
Disability Status by Sex by Age in Nuangola borough
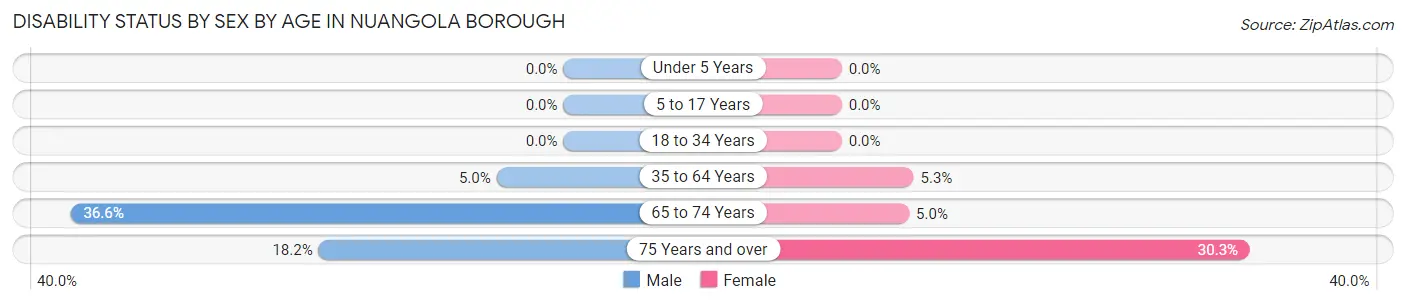
| Age Bracket | Male | Female |
| Under 5 Years | 0 (0.0%) | 0 (0.0%) |
| 5 to 17 Years | 0 (0.0%) | 0 (0.0%) |
| 18 to 34 Years | 0 (0.0%) | 0 (0.0%) |
| 35 to 64 Years | 7 (5.0%) | 8 (5.3%) |
| 65 to 74 Years | 15 (36.6%) | 3 (5.0%) |
| 75 Years and over | 6 (18.2%) | 10 (30.3%) |
Disability Class by Sex by Age in Nuangola borough
Disability Class: Hearing Difficulty
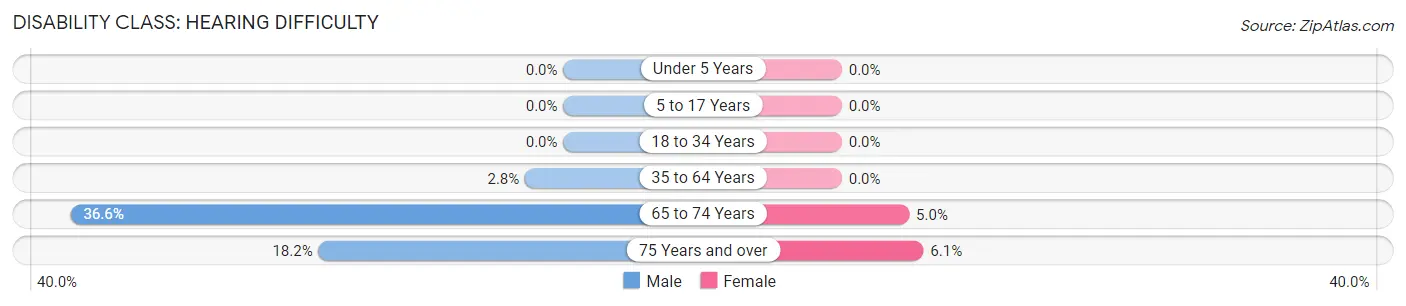
| Age Bracket | Male | Female |
| Under 5 Years | 0 (0.0%) | 0 (0.0%) |
| 5 to 17 Years | 0 (0.0%) | 0 (0.0%) |
| 18 to 34 Years | 0 (0.0%) | 0 (0.0%) |
| 35 to 64 Years | 4 (2.8%) | 0 (0.0%) |
| 65 to 74 Years | 15 (36.6%) | 3 (5.0%) |
| 75 Years and over | 6 (18.2%) | 2 (6.1%) |
Disability Class: Vision Difficulty
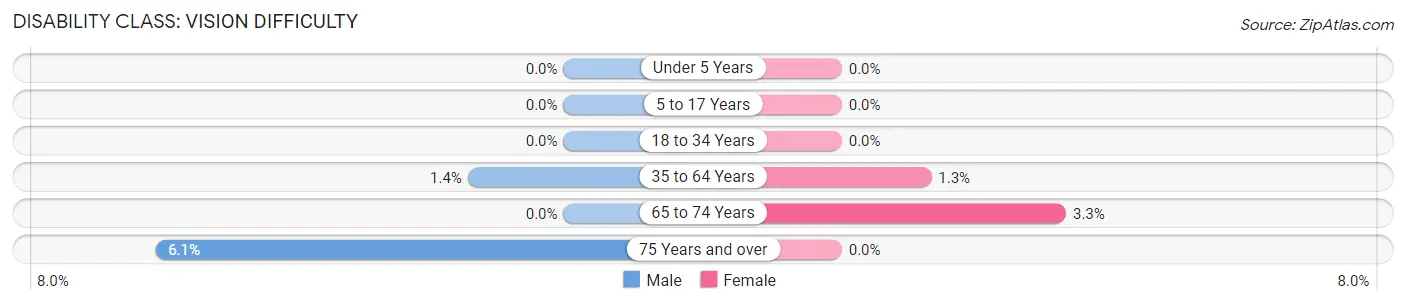
| Age Bracket | Male | Female |
| Under 5 Years | 0 (0.0%) | 0 (0.0%) |
| 5 to 17 Years | 0 (0.0%) | 0 (0.0%) |
| 18 to 34 Years | 0 (0.0%) | 0 (0.0%) |
| 35 to 64 Years | 2 (1.4%) | 2 (1.3%) |
| 65 to 74 Years | 0 (0.0%) | 2 (3.3%) |
| 75 Years and over | 2 (6.1%) | 0 (0.0%) |
Disability Class: Cognitive Difficulty
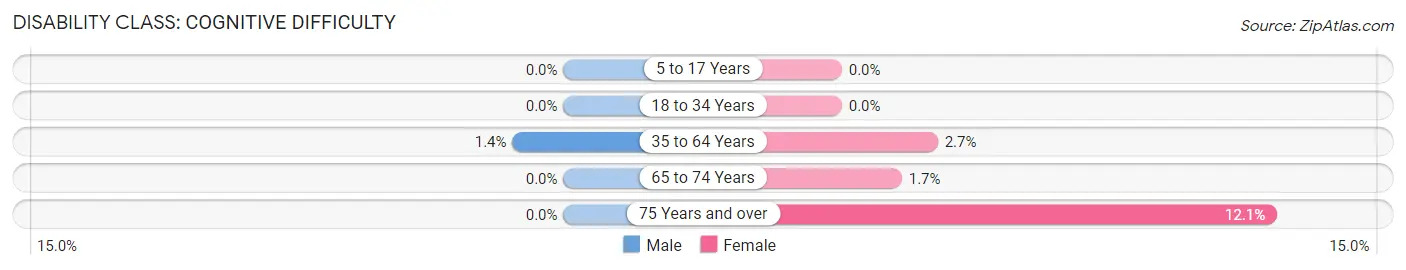
| Age Bracket | Male | Female |
| 5 to 17 Years | 0 (0.0%) | 0 (0.0%) |
| 18 to 34 Years | 0 (0.0%) | 0 (0.0%) |
| 35 to 64 Years | 2 (1.4%) | 4 (2.7%) |
| 65 to 74 Years | 0 (0.0%) | 1 (1.7%) |
| 75 Years and over | 0 (0.0%) | 4 (12.1%) |
Disability Class: Ambulatory Difficulty
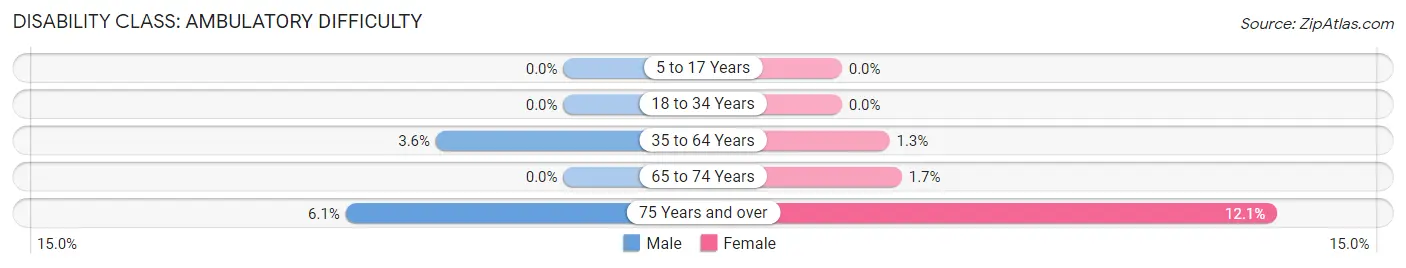
| Age Bracket | Male | Female |
| 5 to 17 Years | 0 (0.0%) | 0 (0.0%) |
| 18 to 34 Years | 0 (0.0%) | 0 (0.0%) |
| 35 to 64 Years | 5 (3.5%) | 2 (1.3%) |
| 65 to 74 Years | 0 (0.0%) | 1 (1.7%) |
| 75 Years and over | 2 (6.1%) | 4 (12.1%) |
Disability Class: Self-Care Difficulty
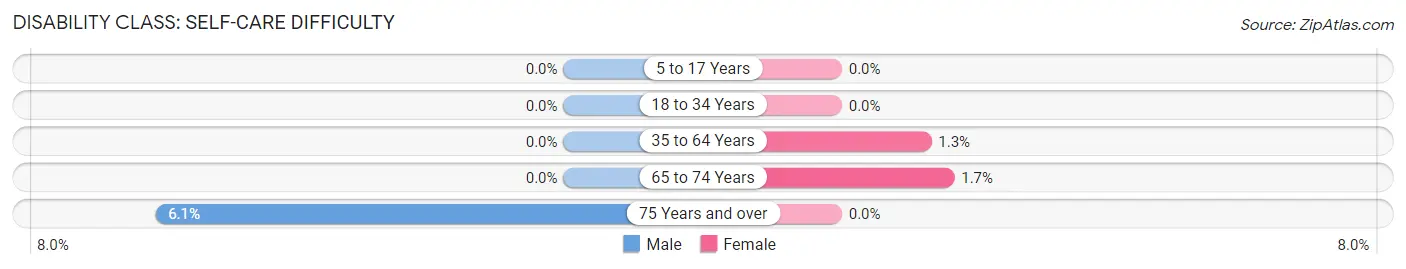
| Age Bracket | Male | Female |
| 5 to 17 Years | 0 (0.0%) | 0 (0.0%) |
| 18 to 34 Years | 0 (0.0%) | 0 (0.0%) |
| 35 to 64 Years | 0 (0.0%) | 2 (1.3%) |
| 65 to 74 Years | 0 (0.0%) | 1 (1.7%) |
| 75 Years and over | 2 (6.1%) | 0 (0.0%) |
Technology Access in Nuangola borough
Computing Device Access in Nuangola borough
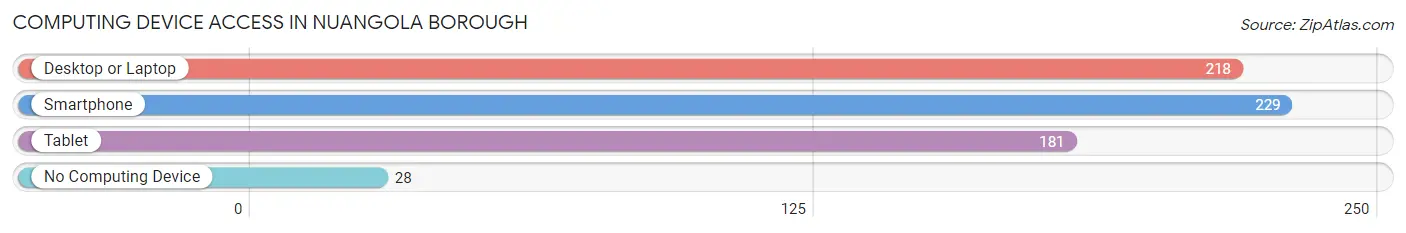
| Device Type | # Households | % Households |
| Desktop or Laptop | 218 | 75.7% |
| Smartphone | 229 | 79.5% |
| Tablet | 181 | 62.8% |
| No Computing Device | 28 | 9.7% |
| Total | 288 | 100.0% |
Internet Access in Nuangola borough
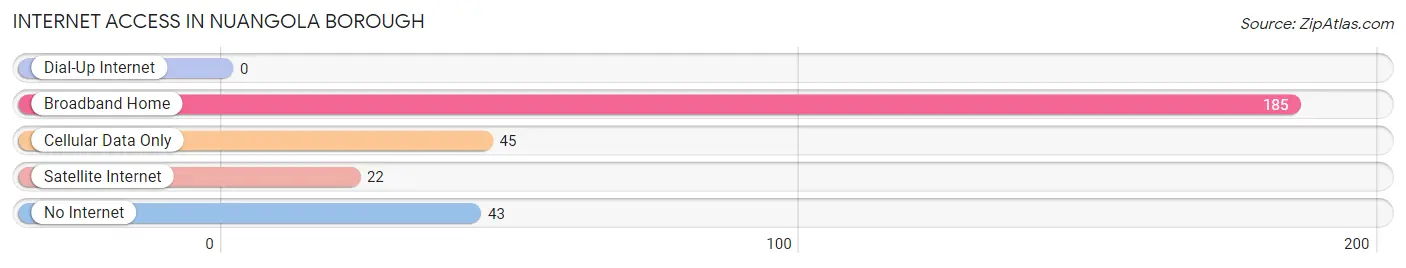
| Internet Type | # Households | % Households |
| Dial-Up Internet | 0 | 0.0% |
| Broadband Home | 185 | 64.2% |
| Cellular Data Only | 45 | 15.6% |
| Satellite Internet | 22 | 7.6% |
| No Internet | 43 | 14.9% |
| Total | 288 | 100.0% |
Nuangola borough Summary
Nuangola Borough is a small borough located in Luzerne County, Pennsylvania. It is situated in the foothills of the Pocono Mountains and is bordered by the Susquehanna River. The borough has a population of approximately 1,000 people and covers an area of 1.2 square miles.
History
Nuangola Borough was founded in 1876 by a group of settlers from the nearby town of Wilkes-Barre. The settlers were looking for a place to settle and build a community. The name Nuangola is derived from the Native American word for “land of the sun”. The borough was officially incorporated in 1891.
In the early 1900s, Nuangola was a thriving community with a variety of businesses, including a hotel, a general store, a sawmill, and a grist mill. The borough was also home to a number of churches, including the First Presbyterian Church, which was founded in 1891.
In the 1950s, Nuangola began to experience a decline in population as people moved away to larger cities. This trend continued until the late 1980s, when the borough began to experience a resurgence in population growth.
Geography
Nuangola Borough is located in the foothills of the Pocono Mountains in northeastern Pennsylvania. The borough is bordered by the Susquehanna River to the north and the Lackawanna River to the south. The borough is situated at an elevation of 1,000 feet above sea level.
The borough is home to a variety of natural features, including several creeks, ponds, and wetlands. The borough is also home to a number of parks, including Nuangola Park, which features a playground, picnic area, and walking trails.
Economy
Nuangola Borough has a diverse economy that is largely driven by tourism. The borough is home to a number of bed and breakfasts, restaurants, and other tourist attractions. The borough is also home to a number of small businesses, including a grocery store, a hardware store, and a pharmacy.
The borough is also home to a number of manufacturing companies, including a plastics manufacturer and a metal fabrication company. The borough is also home to a number of service-based businesses, including a law firm and a real estate agency.
Demographics
As of the 2010 census, the population of Nuangola Borough was 1,000 people. The racial makeup of the borough was 97.2% White, 0.7% African American, 0.2% Native American, 0.2% Asian, 0.2% from other races, and 1.7% from two or more races. Hispanic or Latino of any race were 1.2% of the population.
The median household income in Nuangola Borough was $45,000, and the median family income was $50,000. The per capita income was $20,000. About 8.3% of families and 10.2% of the population were below the poverty line, including 14.3% of those under age 18 and 6.7% of those age 65 or over.
Conclusion
Nuangola Borough is a small borough located in Luzerne County, Pennsylvania. It is situated in the foothills of the Pocono Mountains and is bordered by the Susquehanna River. The borough has a population of approximately 1,000 people and covers an area of 1.2 square miles. The borough has a diverse economy that is largely driven by tourism, and the population is predominantly White. The median household income in Nuangola Borough was $45,000, and the median family income was $50,000. The per capita income was $20,000.
Common Questions
What is Per Capita Income in Nuangola borough?
Per Capita income in Nuangola borough is $42,685.
What is the Median Family Income in Nuangola borough?
Median Family Income in Nuangola borough is $93,750.
What is the Median Household income in Nuangola borough?
Median Household Income in Nuangola borough is $77,778.
What is Income or Wage Gap in Nuangola borough?
Income or Wage Gap in Nuangola borough is 14.3%.
Women in Nuangola borough earn 85.7 cents for every dollar earned by a man.
What is Inequality or Gini Index in Nuangola borough?
Inequality or Gini Index in Nuangola borough is 0.41.
What is the Total Population of Nuangola borough?
Total Population of Nuangola borough is 712.
What is the Total Male Population of Nuangola borough?
Total Male Population of Nuangola borough is 321.
What is the Total Female Population of Nuangola borough?
Total Female Population of Nuangola borough is 391.
What is the Ratio of Males per 100 Females in Nuangola borough?
There are 82.10 Males per 100 Females in Nuangola borough.
What is the Ratio of Females per 100 Males in Nuangola borough?
There are 121.81 Females per 100 Males in Nuangola borough.
What is the Median Population Age in Nuangola borough?
Median Population Age in Nuangola borough is 44.3 Years.
What is the Average Family Size in Nuangola borough
Average Family Size in Nuangola borough is 3.0 People.
What is the Average Household Size in Nuangola borough
Average Household Size in Nuangola borough is 2.5 People.
How Large is the Labor Force in Nuangola borough?
There are 390 People in the Labor Forcein in Nuangola borough.
What is the Percentage of People in the Labor Force in Nuangola borough?
63.6% of People are in the Labor Force in Nuangola borough.
What is the Unemployment Rate in Nuangola borough?
Unemployment Rate in Nuangola borough is 1.8%.