Flying Hills, PA Map & Demographics
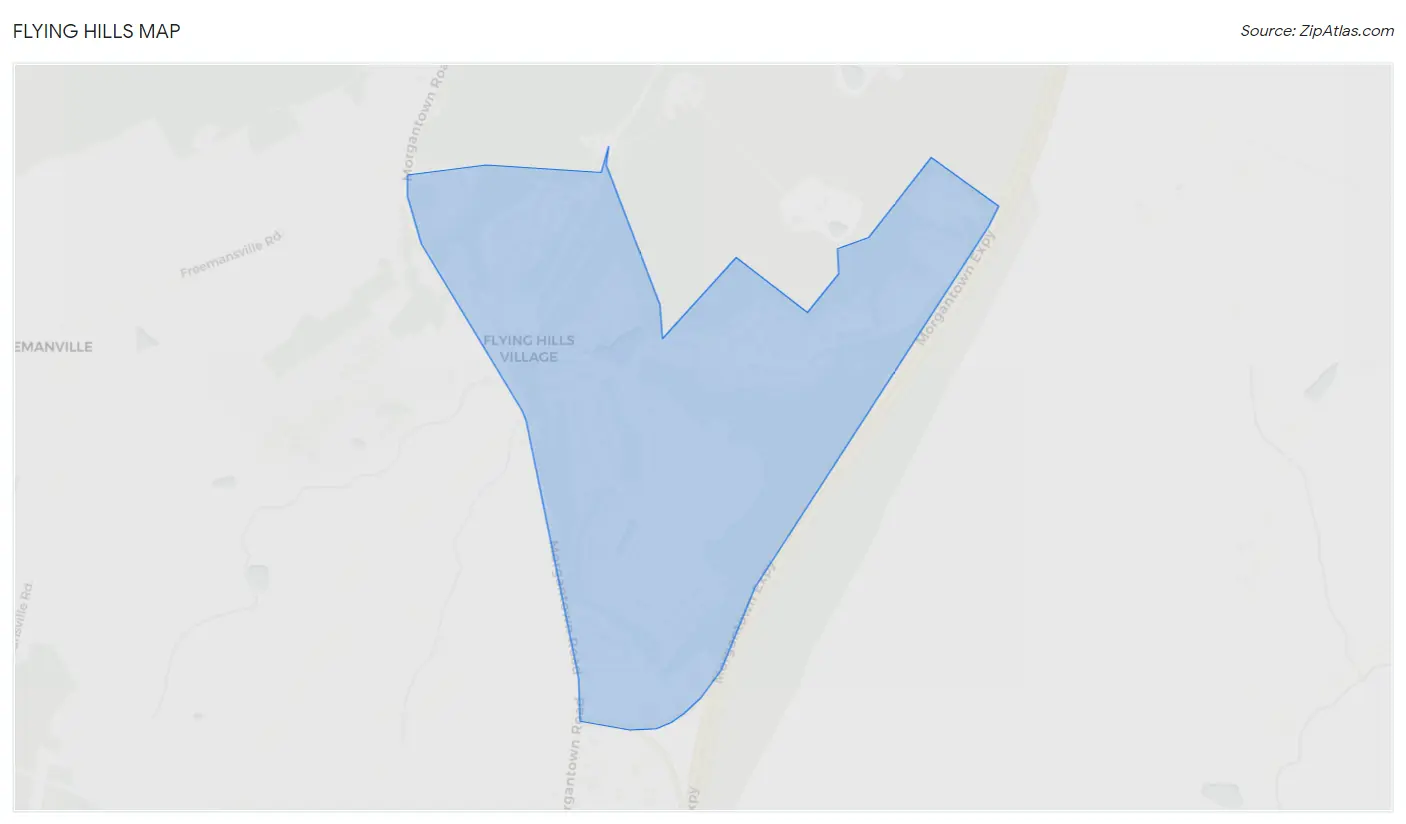
Flying Hills Map
Flying Hills Overview
$61,239
PER CAPITA INCOME
$99,028
AVG FAMILY INCOME
$87,586
AVG HOUSEHOLD INCOME
40.6%
WAGE / INCOME GAP [ % ]
59.4¢/ $1
WAGE / INCOME GAP [ $ ]
0.40
INEQUALITY / GINI INDEX
1,716
TOTAL POPULATION
900
MALE POPULATION
816
FEMALE POPULATION
110.29
MALES / 100 FEMALES
90.67
FEMALES / 100 MALES
53.4
MEDIAN AGE
2.3
AVG FAMILY SIZE
1.7
AVG HOUSEHOLD SIZE
984
LABOR FORCE [ PEOPLE ]
64.3%
PERCENT IN LABOR FORCE
Income in Flying Hills
Income Overview in Flying Hills
Per Capita Income in Flying Hills is $61,239, while median incomes of families and households are $99,028 and $87,586 respectively.
| Characteristic | Number | Measure |
| Per Capita Income | 1,716 | $61,239 |
| Median Family Income | 357 | $99,028 |
| Mean Family Income | 357 | $131,892 |
| Median Household Income | 1,027 | $87,586 |
| Mean Household Income | 1,027 | $102,840 |
| Income Deficit | 357 | $0 |
| Wage / Income Gap (%) | 1,716 | 40.61% |
| Wage / Income Gap ($) | 1,716 | 59.39¢ per $1 |
| Gini / Inequality Index | 1,716 | 0.40 |
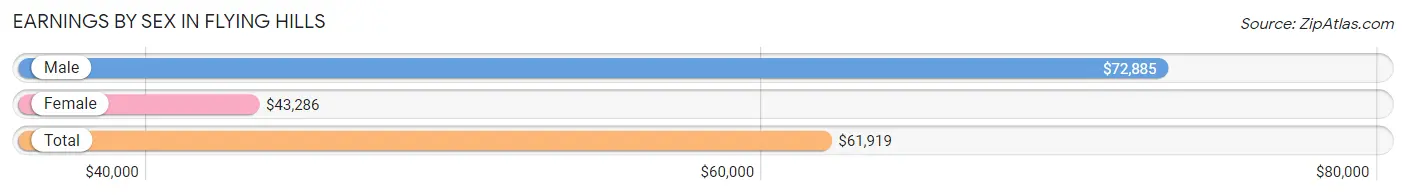
Earnings by Sex in Flying Hills
Average Earnings in Flying Hills are $61,919, $72,885 for men and $43,286 for women, a difference of 40.6%.
| Sex | Number | Average Earnings |
| Male | 606 (57.9%) | $72,885 |
| Female | 440 (42.1%) | $43,286 |
| Total | 1,046 (100.0%) | $61,919 |
Earnings by Sex by Income Bracket in Flying Hills
The most common earnings brackets in Flying Hills are $100,000+ for men (229 | 37.8%) and $40,000 to $44,999 for women (58 | 13.2%).
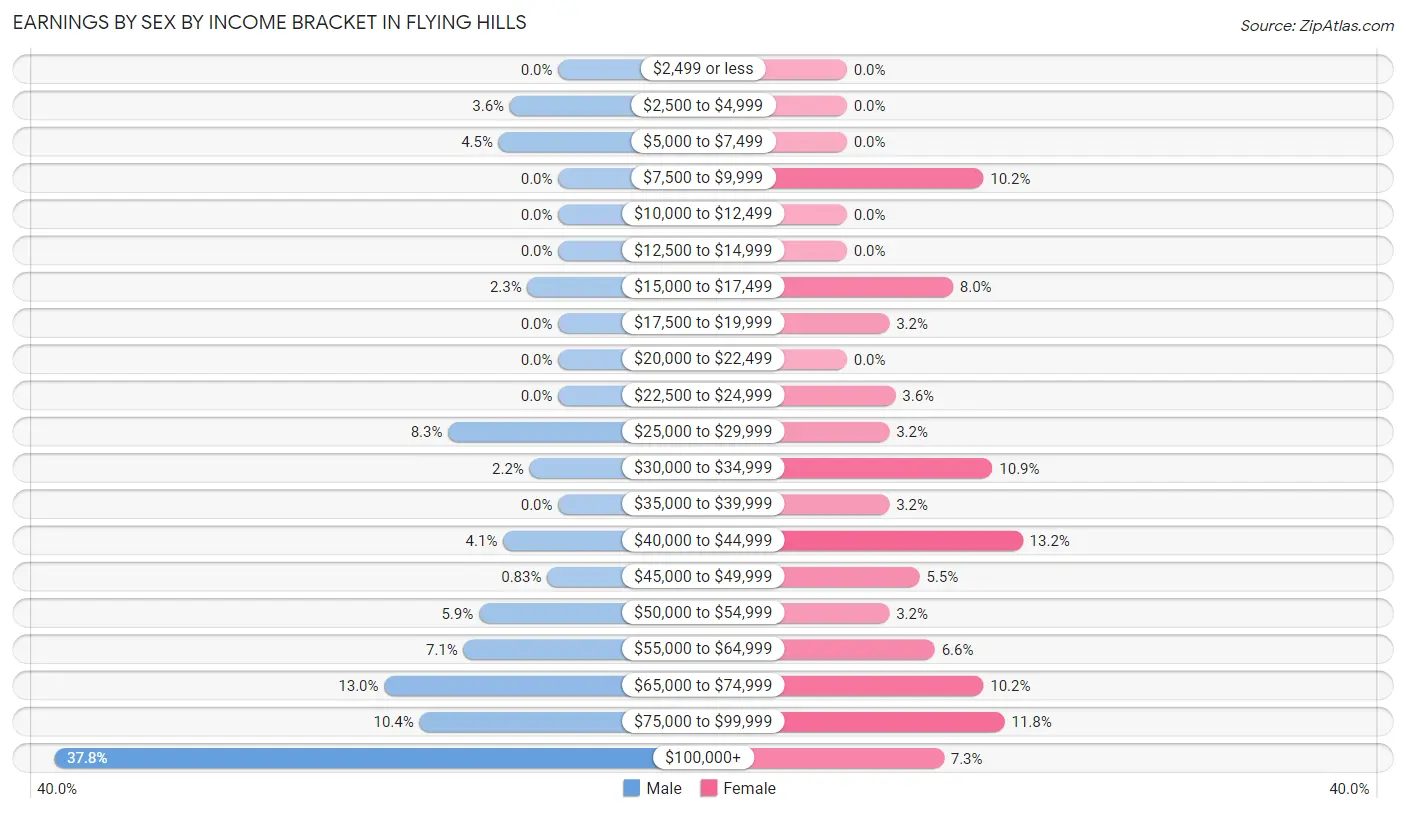
| Income | Male | Female |
| $2,499 or less | 0 (0.0%) | 0 (0.0%) |
| $2,500 to $4,999 | 22 (3.6%) | 0 (0.0%) |
| $5,000 to $7,499 | 27 (4.5%) | 0 (0.0%) |
| $7,500 to $9,999 | 0 (0.0%) | 45 (10.2%) |
| $10,000 to $12,499 | 0 (0.0%) | 0 (0.0%) |
| $12,500 to $14,999 | 0 (0.0%) | 0 (0.0%) |
| $15,000 to $17,499 | 14 (2.3%) | 35 (8.0%) |
| $17,500 to $19,999 | 0 (0.0%) | 14 (3.2%) |
| $20,000 to $22,499 | 0 (0.0%) | 0 (0.0%) |
| $22,500 to $24,999 | 0 (0.0%) | 16 (3.6%) |
| $25,000 to $29,999 | 50 (8.3%) | 14 (3.2%) |
| $30,000 to $34,999 | 13 (2.1%) | 48 (10.9%) |
| $35,000 to $39,999 | 0 (0.0%) | 14 (3.2%) |
| $40,000 to $44,999 | 25 (4.1%) | 58 (13.2%) |
| $45,000 to $49,999 | 5 (0.8%) | 24 (5.4%) |
| $50,000 to $54,999 | 36 (5.9%) | 14 (3.2%) |
| $55,000 to $64,999 | 43 (7.1%) | 29 (6.6%) |
| $65,000 to $74,999 | 79 (13.0%) | 45 (10.2%) |
| $75,000 to $99,999 | 63 (10.4%) | 52 (11.8%) |
| $100,000+ | 229 (37.8%) | 32 (7.3%) |
| Total | 606 (100.0%) | 440 (100.0%) |
Earnings by Sex by Educational Attainment in Flying Hills
Average earnings in Flying Hills are $77,917 for men and $42,011 for women, a difference of 46.1%. Men with an educational attainment of graduate degree enjoy the highest average annual earnings of $155,000, while those with college or associate's degree education earn the least with $70,909. Women with an educational attainment of graduate degree earn the most with the average annual earnings of $61,875, while those with college or associate's degree education have the smallest earnings of $19,375.
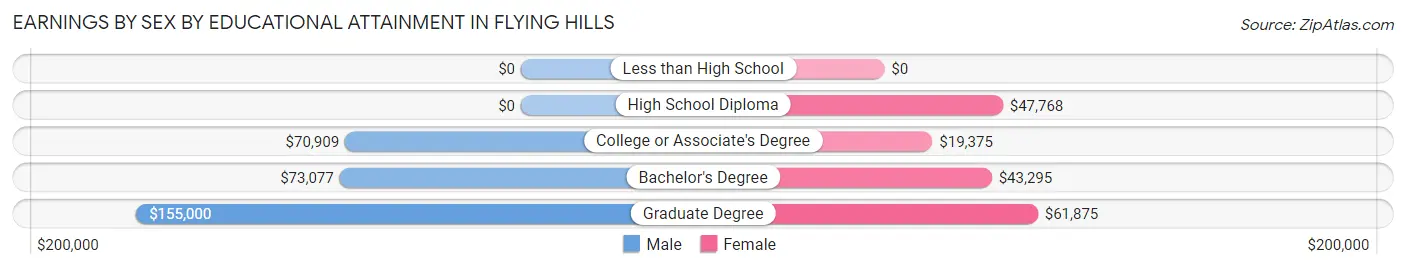
| Educational Attainment | Male Income | Female Income |
| Less than High School | - | - |
| High School Diploma | - | - |
| College or Associate's Degree | $70,909 | $19,375 |
| Bachelor's Degree | $73,077 | $43,295 |
| Graduate Degree | $155,000 | $61,875 |
| Total | $77,917 | $42,011 |
Family Income in Flying Hills
Family Income Brackets in Flying Hills
According to the Flying Hills family income data, there are 80 families falling into the $50,000 to $74,999 income range, which is the most common income bracket and makes up 22.4% of all families.
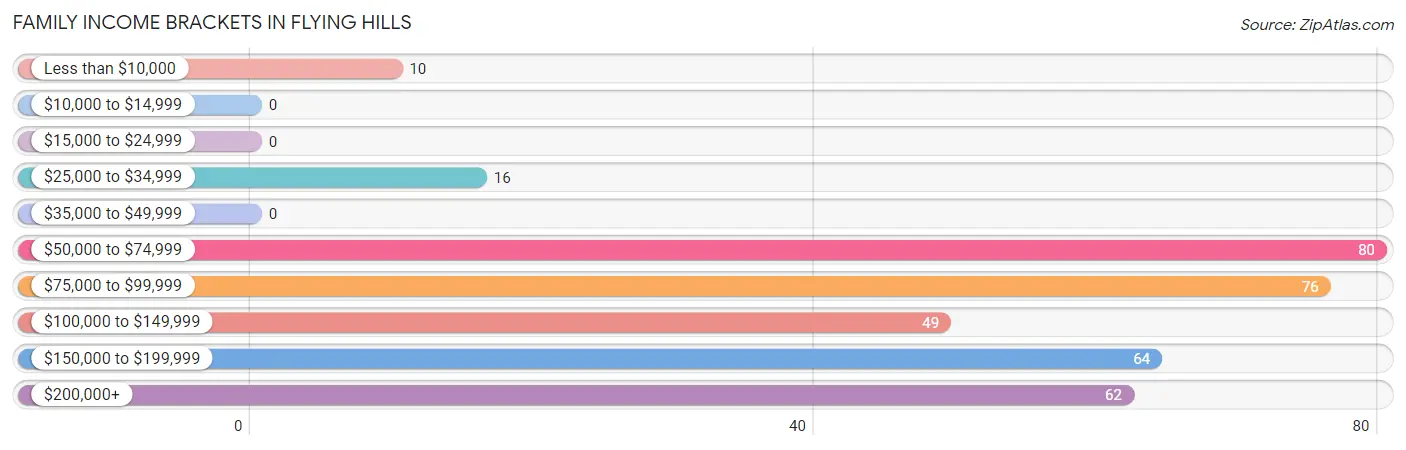
| Income Bracket | # Families | % Families |
| Less than $10,000 | 10 | 2.8% |
| $10,000 to $14,999 | 0 | 0.0% |
| $15,000 to $24,999 | 0 | 0.0% |
| $25,000 to $34,999 | 16 | 4.5% |
| $35,000 to $49,999 | 0 | 0.0% |
| $50,000 to $74,999 | 80 | 22.4% |
| $75,000 to $99,999 | 76 | 21.3% |
| $100,000 to $149,999 | 49 | 13.7% |
| $150,000 to $199,999 | 64 | 17.9% |
| $200,000+ | 62 | 17.4% |
Family Income by Famaliy Size in Flying Hills
2-person families (254 | 71.2%) account for the highest median family income in Flying Hills with $129,375 per family, while 2-person families (254 | 71.2%) have the highest median income of $64,688 per family member.
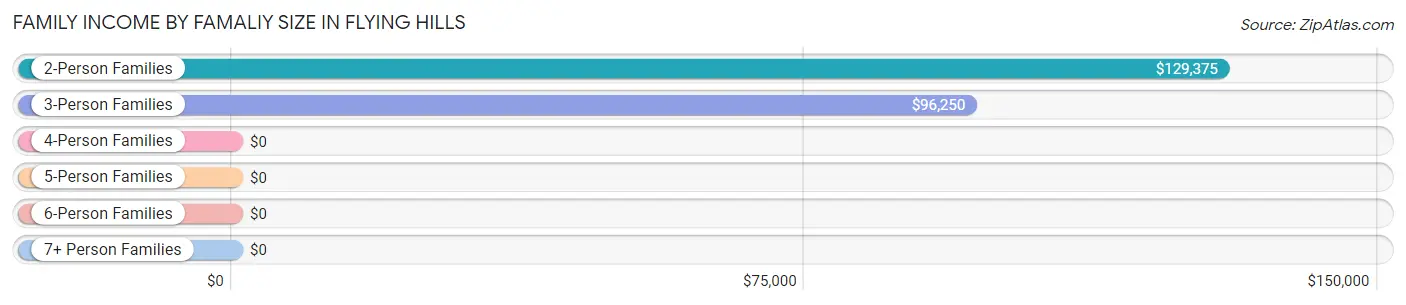
| Income Bracket | # Families | Median Income |
| 2-Person Families | 254 (71.2%) | $129,375 |
| 3-Person Families | 74 (20.7%) | $96,250 |
| 4-Person Families | 11 (3.1%) | $0 |
| 5-Person Families | 18 (5.0%) | $0 |
| 6-Person Families | 0 (0.0%) | $0 |
| 7+ Person Families | 0 (0.0%) | $0 |
| Total | 357 (100.0%) | $99,028 |
Family Income by Number of Earners in Flying Hills
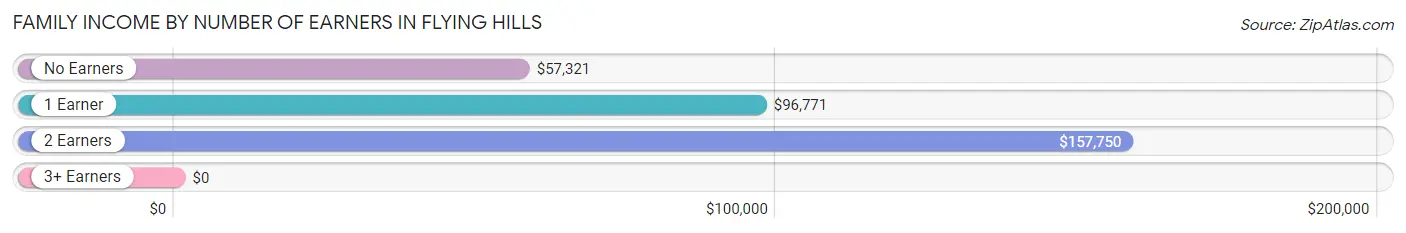
| Number of Earners | # Families | Median Income |
| No Earners | 58 (16.3%) | $57,321 |
| 1 Earner | 166 (46.5%) | $96,771 |
| 2 Earners | 133 (37.2%) | $157,750 |
| 3+ Earners | 0 (0.0%) | $0 |
| Total | 357 (100.0%) | $99,028 |
Household Income in Flying Hills
Household Income Brackets in Flying Hills
With 208 households falling in the category, the $75,000 to $99,999 income range is the most frequent in Flying Hills, accounting for 20.3% of all households.
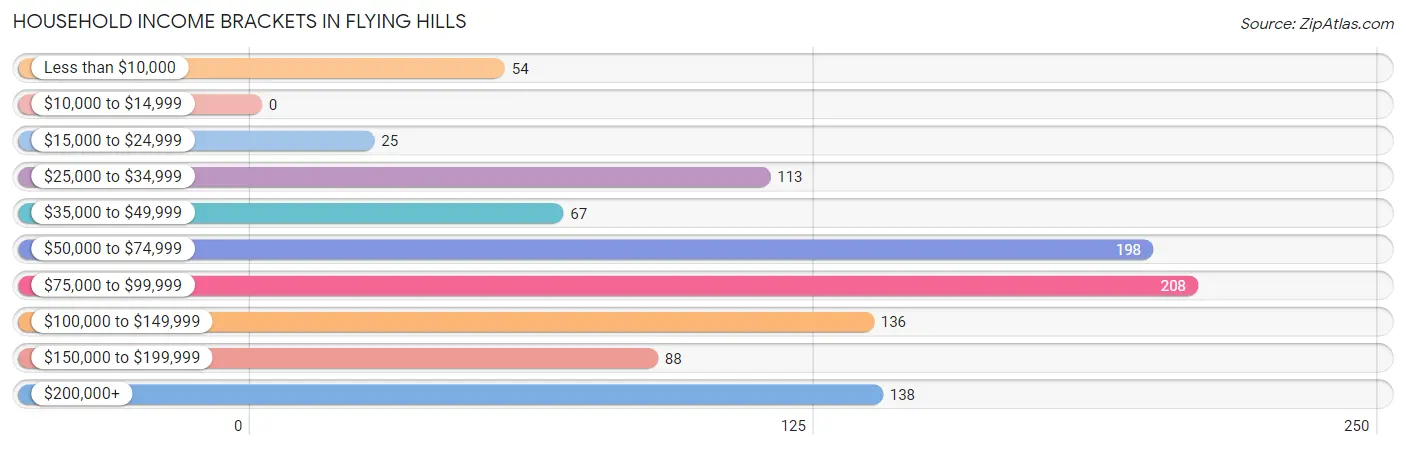
| Income Bracket | # Households | % Households |
| Less than $10,000 | 54 | 5.3% |
| $10,000 to $14,999 | 0 | 0.0% |
| $15,000 to $24,999 | 25 | 2.4% |
| $25,000 to $34,999 | 113 | 11.0% |
| $35,000 to $49,999 | 67 | 6.5% |
| $50,000 to $74,999 | 198 | 19.3% |
| $75,000 to $99,999 | 208 | 20.3% |
| $100,000 to $149,999 | 136 | 13.2% |
| $150,000 to $199,999 | 88 | 8.6% |
| $200,000+ | 138 | 13.4% |
Household Income by Householder Age in Flying Hills
The median household income in Flying Hills is $87,586, with the highest median household income of $117,935 found in the 45 to 64 years age bracket for the primary householder. A total of 330 households (32.1%) fall into this category. Meanwhile, the 15 to 24 years age bracket for the primary householder has the lowest median household income of $0, with 47 households (4.6%) in this group.
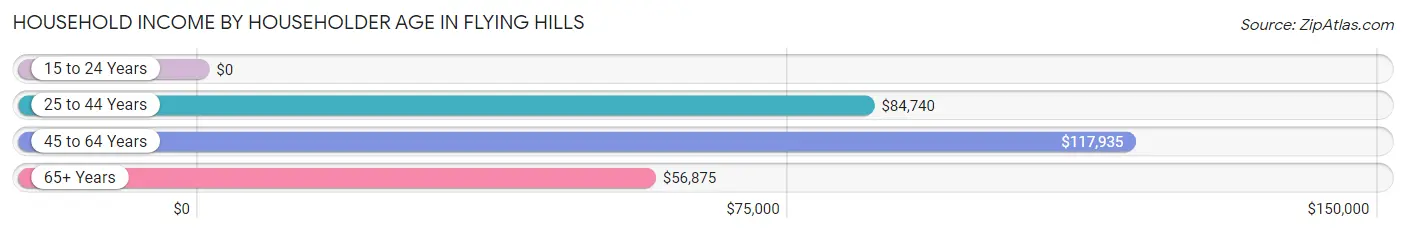
| Income Bracket | # Households | Median Income |
| 15 to 24 Years | 47 (4.6%) | $0 |
| 25 to 44 Years | 285 (27.8%) | $84,740 |
| 45 to 64 Years | 330 (32.1%) | $117,935 |
| 65+ Years | 365 (35.5%) | $56,875 |
| Total | 1,027 (100.0%) | $87,586 |
Poverty in Flying Hills
Income Below Poverty by Sex and Age in Flying Hills
With 9.2% poverty level for males and 9.9% for females among the residents of Flying Hills, 18 to 24 year old males and 25 to 34 year old females are the most vulnerable to poverty, with 57 males (83.8%) and 38 females (27.5%) in their respective age groups living below the poverty level.
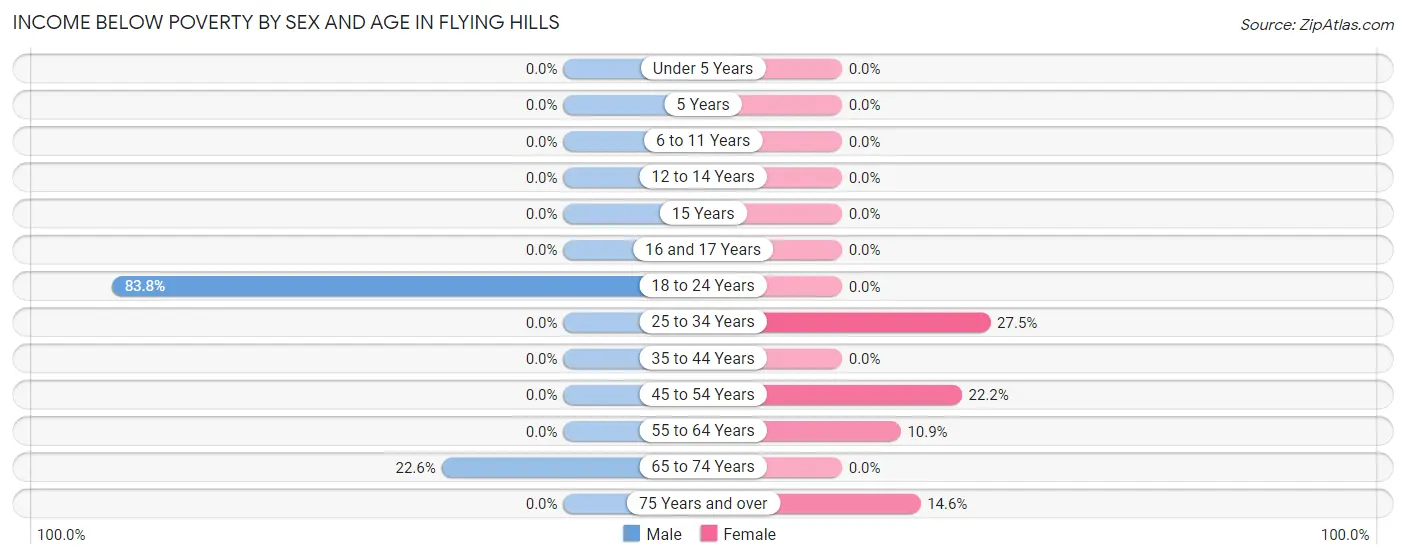
| Age Bracket | Male | Female |
| Under 5 Years | 0 (0.0%) | 0 (0.0%) |
| 5 Years | 0 (0.0%) | 0 (0.0%) |
| 6 to 11 Years | 0 (0.0%) | 0 (0.0%) |
| 12 to 14 Years | 0 (0.0%) | 0 (0.0%) |
| 15 Years | 0 (0.0%) | 0 (0.0%) |
| 16 and 17 Years | 0 (0.0%) | 0 (0.0%) |
| 18 to 24 Years | 57 (83.8%) | 0 (0.0%) |
| 25 to 34 Years | 0 (0.0%) | 38 (27.5%) |
| 35 to 44 Years | 0 (0.0%) | 0 (0.0%) |
| 45 to 54 Years | 0 (0.0%) | 12 (22.2%) |
| 55 to 64 Years | 0 (0.0%) | 11 (10.9%) |
| 65 to 74 Years | 26 (22.6%) | 0 (0.0%) |
| 75 Years and over | 0 (0.0%) | 16 (14.5%) |
| Total | 83 (9.2%) | 77 (9.9%) |
Income Above Poverty by Sex and Age in Flying Hills
According to the poverty statistics in Flying Hills, males aged under 5 years and females aged under 5 years are the age groups that are most secure financially, with 100.0% of males and 100.0% of females in these age groups living above the poverty line.
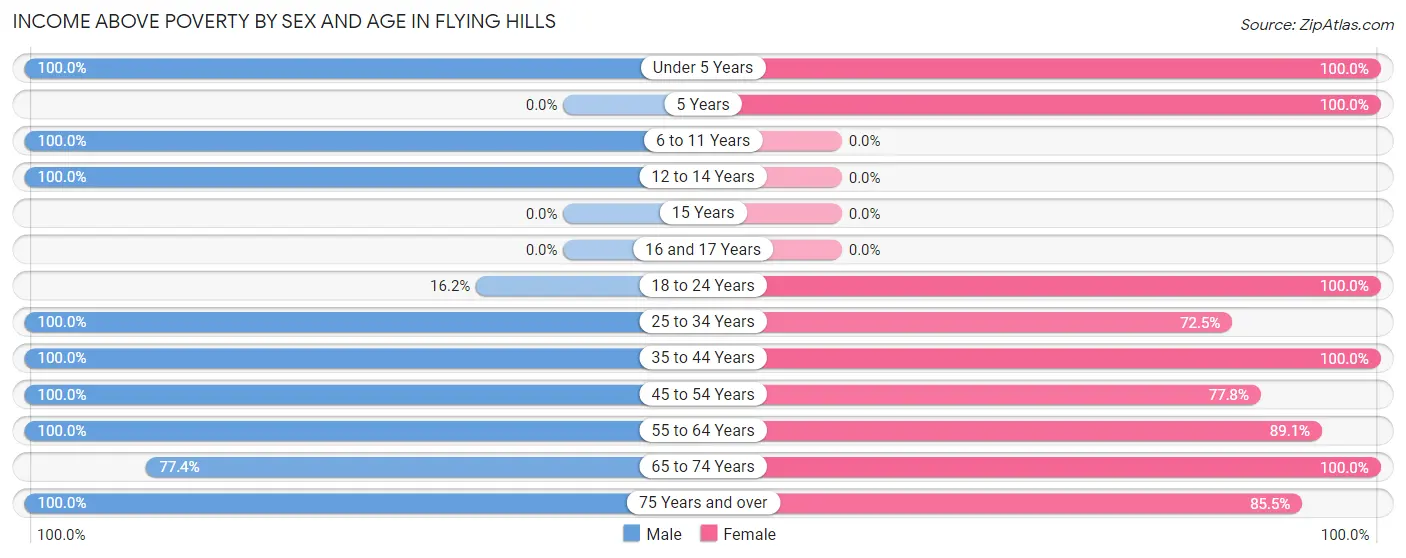
| Age Bracket | Male | Female |
| Under 5 Years | 60 (100.0%) | 53 (100.0%) |
| 5 Years | 0 (0.0%) | 9 (100.0%) |
| 6 to 11 Years | 11 (100.0%) | 0 (0.0%) |
| 12 to 14 Years | 11 (100.0%) | 0 (0.0%) |
| 15 Years | 0 (0.0%) | 0 (0.0%) |
| 16 and 17 Years | 0 (0.0%) | 0 (0.0%) |
| 18 to 24 Years | 11 (16.2%) | 31 (100.0%) |
| 25 to 34 Years | 114 (100.0%) | 100 (72.5%) |
| 35 to 44 Years | 118 (100.0%) | 91 (100.0%) |
| 45 to 54 Years | 104 (100.0%) | 42 (77.8%) |
| 55 to 64 Years | 175 (100.0%) | 90 (89.1%) |
| 65 to 74 Years | 89 (77.4%) | 188 (100.0%) |
| 75 Years and over | 124 (100.0%) | 94 (85.5%) |
| Total | 817 (90.8%) | 698 (90.1%) |
Income Below Poverty Among Married-Couple Families in Flying Hills
The poverty statistics for married-couple families in Flying Hills show that 3.1% or 10 of the total 318 families live below the poverty line. Families with no children have the highest poverty rate of 4.0%, comprising of 10 families. On the other hand, families with 1 or 2 children have the lowest poverty rate of 0.0%, which includes 0 families.
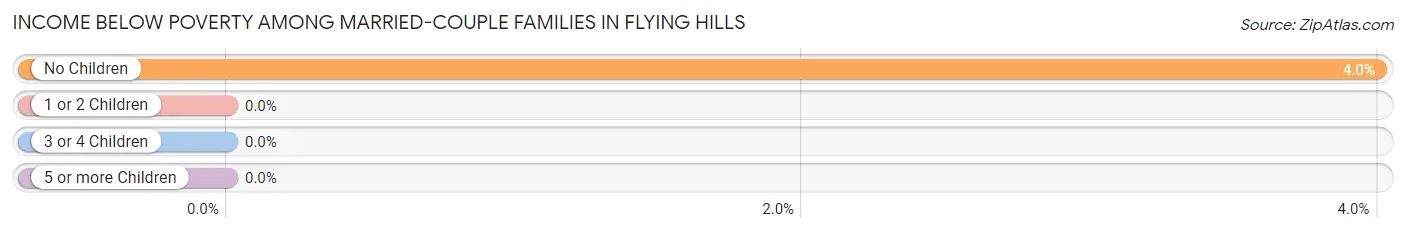
| Children | Above Poverty | Below Poverty |
| No Children | 240 (96.0%) | 10 (4.0%) |
| 1 or 2 Children | 50 (100.0%) | 0 (0.0%) |
| 3 or 4 Children | 18 (100.0%) | 0 (0.0%) |
| 5 or more Children | 0 (0.0%) | 0 (0.0%) |
| Total | 308 (96.9%) | 10 (3.1%) |
Income Below Poverty Among Single-Parent Households in Flying Hills
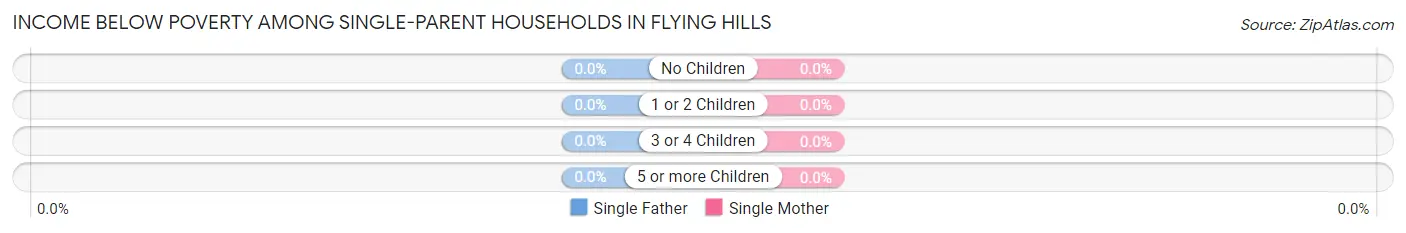
| Children | Single Father | Single Mother |
| No Children | 0 (0.0%) | 0 (0.0%) |
| 1 or 2 Children | 0 (0.0%) | 0 (0.0%) |
| 3 or 4 Children | 0 (0.0%) | 0 (0.0%) |
| 5 or more Children | 0 (0.0%) | 0 (0.0%) |
| Total | 0 (0.0%) | 0 (0.0%) |
Income Below Poverty Among Married-Couple vs Single-Parent Households in Flying Hills
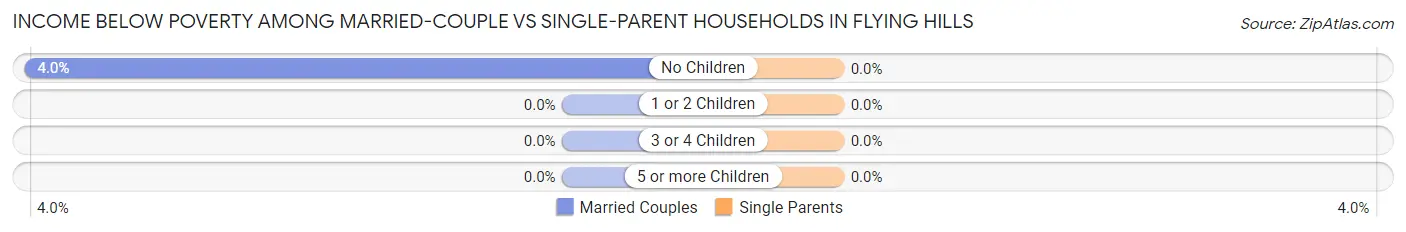
| Children | Married-Couple Families | Single-Parent Households |
| No Children | 10 (4.0%) | 0 (0.0%) |
| 1 or 2 Children | 0 (0.0%) | 0 (0.0%) |
| 3 or 4 Children | 0 (0.0%) | 0 (0.0%) |
| 5 or more Children | 0 (0.0%) | 0 (0.0%) |
| Total | 10 (3.1%) | 0 (0.0%) |
Race in Flying Hills
The most populous races in Flying Hills are White / Caucasian (1,469 | 85.6%), Hispanic or Latino (263 | 15.3%), and Some other Race (189 | 11.0%).
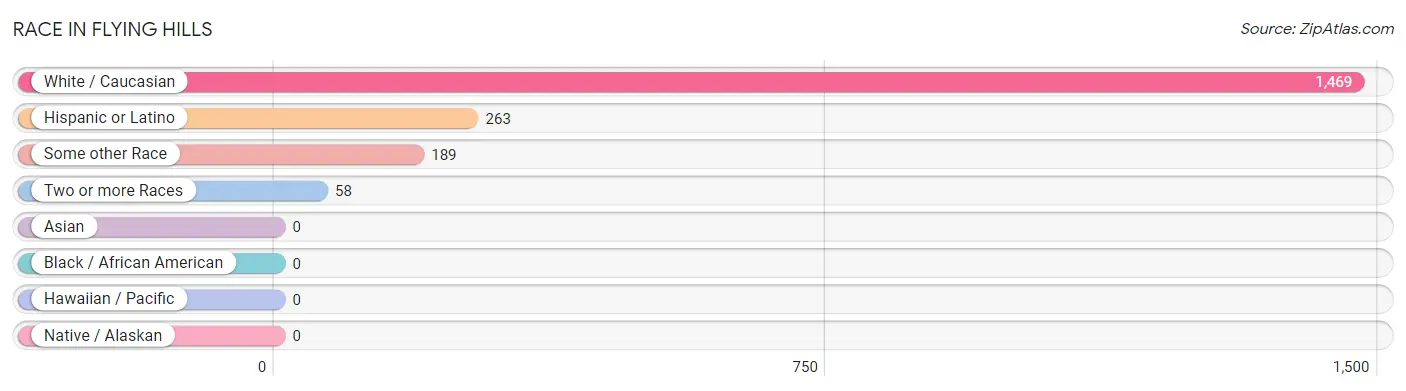
| Race | # Population | % Population |
| Asian | 0 | 0.0% |
| Black / African American | 0 | 0.0% |
| Hawaiian / Pacific | 0 | 0.0% |
| Hispanic or Latino | 263 | 15.3% |
| Native / Alaskan | 0 | 0.0% |
| White / Caucasian | 1,469 | 85.6% |
| Two or more Races | 58 | 3.4% |
| Some other Race | 189 | 11.0% |
| Total | 1,716 | 100.0% |
Ancestry in Flying Hills
The most populous ancestries reported in Flying Hills are German (613 | 35.7%), Irish (232 | 13.5%), Puerto Rican (205 | 11.9%), English (152 | 8.9%), and Italian (135 | 7.9%), together accounting for 77.9% of all Flying Hills residents.
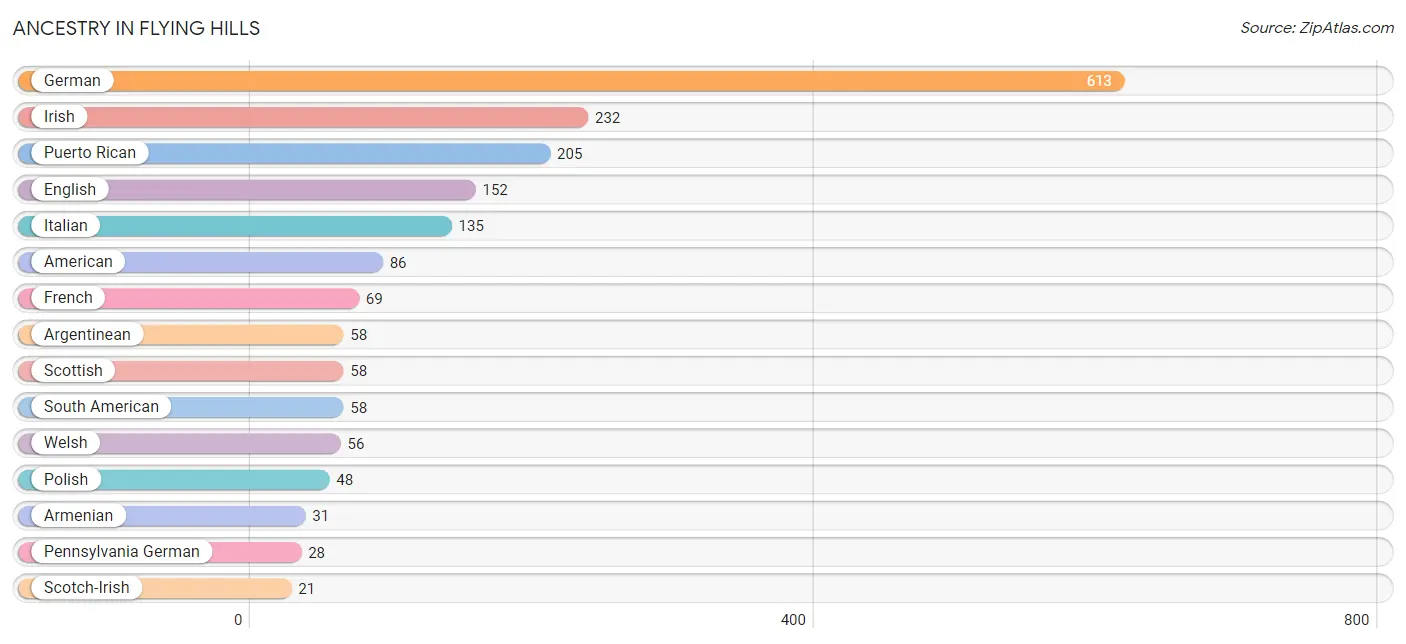
| Ancestry | # Population | % Population |
| American | 86 | 5.0% |
| Argentinean | 58 | 3.4% |
| Armenian | 31 | 1.8% |
| Dutch | 3 | 0.2% |
| English | 152 | 8.9% |
| French | 69 | 4.0% |
| German | 613 | 35.7% |
| Irish | 232 | 13.5% |
| Italian | 135 | 7.9% |
| Lithuanian | 13 | 0.8% |
| Pennsylvania German | 28 | 1.6% |
| Polish | 48 | 2.8% |
| Puerto Rican | 205 | 11.9% |
| Russian | 9 | 0.5% |
| Scotch-Irish | 21 | 1.2% |
| Scottish | 58 | 3.4% |
| South American | 58 | 3.4% |
| Swedish | 10 | 0.6% |
| Ukrainian | 4 | 0.2% |
| Welsh | 56 | 3.3% | View All 20 Rows |
Immigrants in Flying Hills
The most numerous immigrant groups reported in Flying Hills came from Europe (67 | 3.9%), Eastern Europe (44 | 2.6%), Ukraine (44 | 2.6%), Argentina (39 | 2.3%), and Latin America (39 | 2.3%), together accounting for 13.6% of all Flying Hills residents.
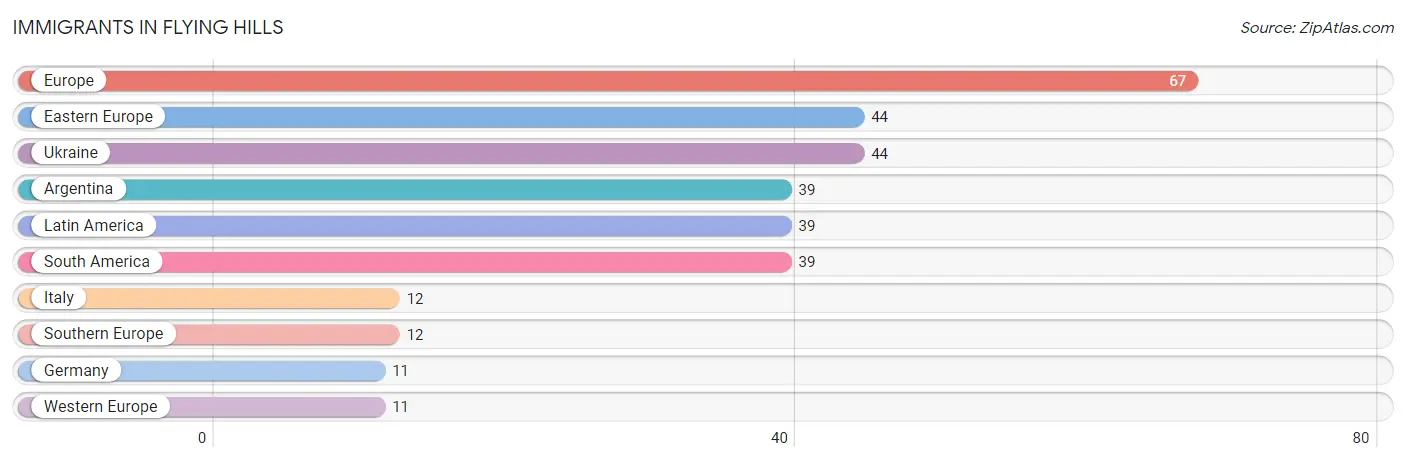
| Immigration Origin | # Population | % Population |
| Argentina | 39 | 2.3% |
| Eastern Europe | 44 | 2.6% |
| Europe | 67 | 3.9% |
| Germany | 11 | 0.6% |
| Italy | 12 | 0.7% |
| Latin America | 39 | 2.3% |
| South America | 39 | 2.3% |
| Southern Europe | 12 | 0.7% |
| Ukraine | 44 | 2.6% |
| Western Europe | 11 | 0.6% | View All 10 Rows |
Sex and Age in Flying Hills
Sex and Age in Flying Hills
The most populous age groups in Flying Hills are 60 to 64 Years (112 | 12.4%) for men and 70 to 74 Years (106 | 13.0%) for women.
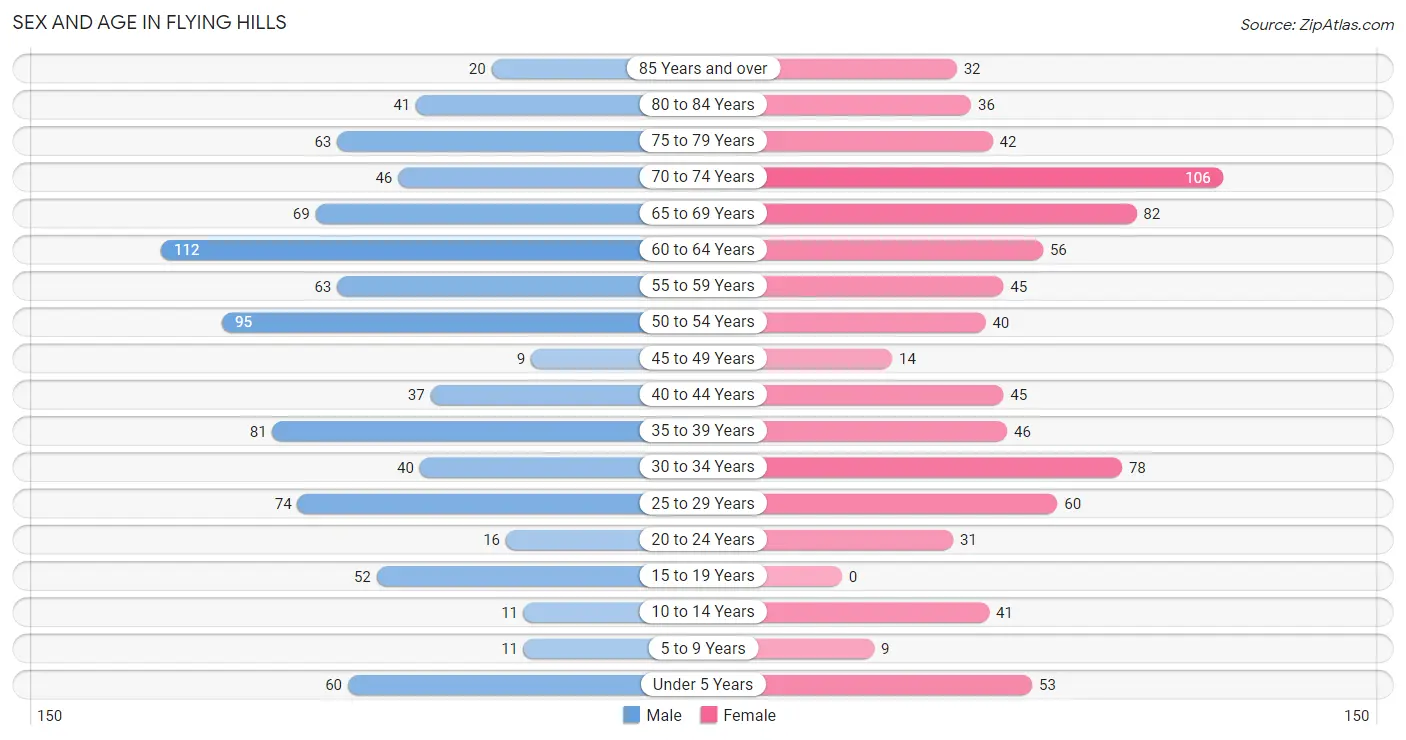
| Age Bracket | Male | Female |
| Under 5 Years | 60 (6.7%) | 53 (6.5%) |
| 5 to 9 Years | 11 (1.2%) | 9 (1.1%) |
| 10 to 14 Years | 11 (1.2%) | 41 (5.0%) |
| 15 to 19 Years | 52 (5.8%) | 0 (0.0%) |
| 20 to 24 Years | 16 (1.8%) | 31 (3.8%) |
| 25 to 29 Years | 74 (8.2%) | 60 (7.3%) |
| 30 to 34 Years | 40 (4.4%) | 78 (9.6%) |
| 35 to 39 Years | 81 (9.0%) | 46 (5.6%) |
| 40 to 44 Years | 37 (4.1%) | 45 (5.5%) |
| 45 to 49 Years | 9 (1.0%) | 14 (1.7%) |
| 50 to 54 Years | 95 (10.6%) | 40 (4.9%) |
| 55 to 59 Years | 63 (7.0%) | 45 (5.5%) |
| 60 to 64 Years | 112 (12.4%) | 56 (6.9%) |
| 65 to 69 Years | 69 (7.7%) | 82 (10.1%) |
| 70 to 74 Years | 46 (5.1%) | 106 (13.0%) |
| 75 to 79 Years | 63 (7.0%) | 42 (5.1%) |
| 80 to 84 Years | 41 (4.6%) | 36 (4.4%) |
| 85 Years and over | 20 (2.2%) | 32 (3.9%) |
| Total | 900 (100.0%) | 816 (100.0%) |
Families and Households in Flying Hills
Median Family Size in Flying Hills
The median family size in Flying Hills is 2.27 persons per family, with single female/mother families (15 | 4.2%) accounting for the largest median family size of 2.8 persons per family. On the other hand, married-couple families (318 | 89.1%) represent the smallest median family size with 2.21 persons per family.
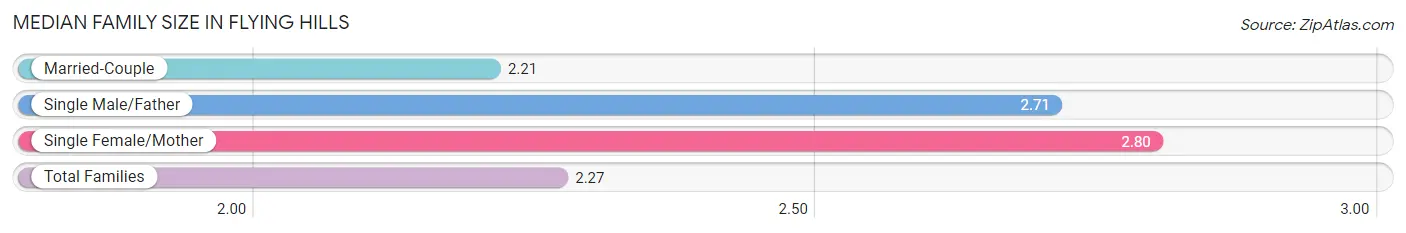
| Family Type | # Families | Family Size |
| Married-Couple | 318 (89.1%) | 2.21 |
| Single Male/Father | 24 (6.7%) | 2.71 |
| Single Female/Mother | 15 (4.2%) | 2.80 |
| Total Families | 357 (100.0%) | 2.27 |
Median Household Size in Flying Hills
The median household size in Flying Hills is 1.67 persons per household, with single male/father households (24 | 2.3%) accounting for the largest median household size of 3.79 persons per household. non-family households (670 | 65.2%) represent the smallest median household size with 1.31 persons per household.
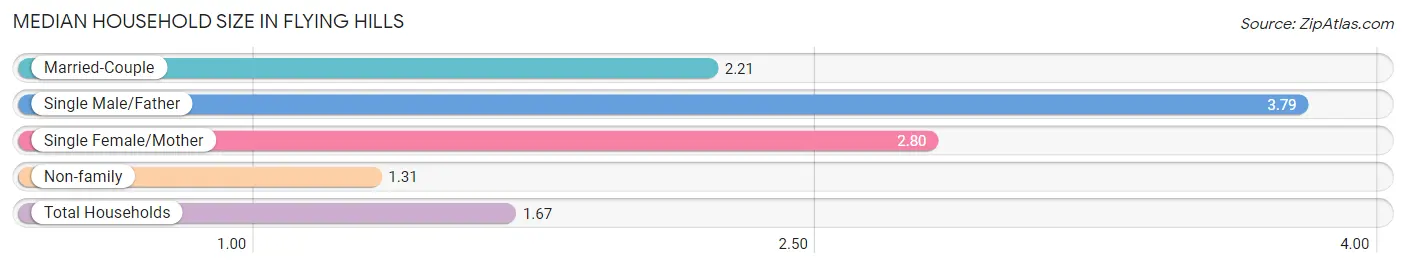
| Household Type | # Households | Household Size |
| Married-Couple | 318 (31.0%) | 2.21 |
| Single Male/Father | 24 (2.3%) | 3.79 |
| Single Female/Mother | 15 (1.5%) | 2.80 |
| Non-family | 670 (65.2%) | 1.31 |
| Total Households | 1,027 (100.0%) | 1.67 |
Household Size by Marriage Status in Flying Hills
Out of a total of 1,027 households in Flying Hills, 357 (34.8%) are family households, while 670 (65.2%) are nonfamily households. The most numerous type of family households are 2-person households, comprising 254, and the most common type of nonfamily households are 1-person households, comprising 537.
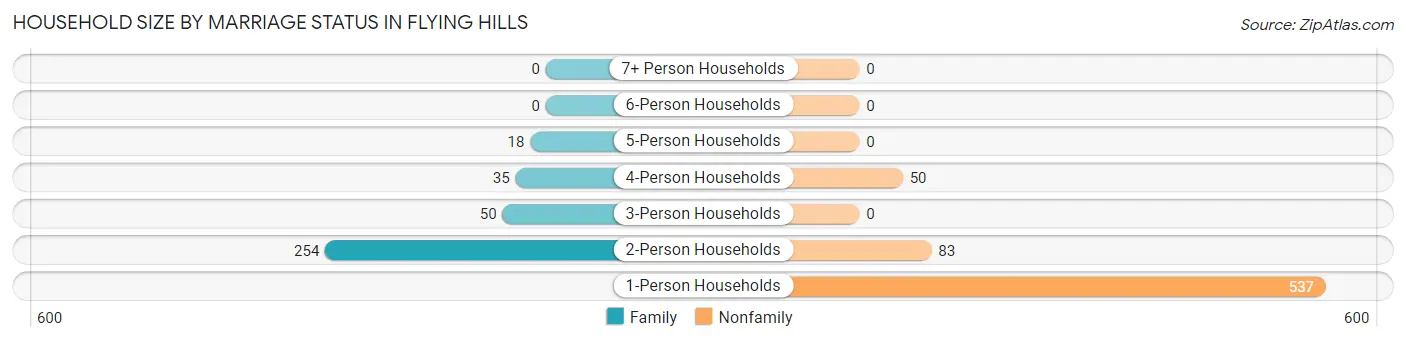
| Household Size | Family Households | Nonfamily Households |
| 1-Person Households | - | 537 (52.3%) |
| 2-Person Households | 254 (24.7%) | 83 (8.1%) |
| 3-Person Households | 50 (4.9%) | 0 (0.0%) |
| 4-Person Households | 35 (3.4%) | 50 (4.9%) |
| 5-Person Households | 18 (1.8%) | 0 (0.0%) |
| 6-Person Households | 0 (0.0%) | 0 (0.0%) |
| 7+ Person Households | 0 (0.0%) | 0 (0.0%) |
| Total | 357 (34.8%) | 670 (65.2%) |
Female Fertility in Flying Hills
Fertility by Age in Flying Hills
Average fertility rate in Flying Hills is 126.0 births per 1,000 women. Women in the age bracket of 20 to 34 years have the highest fertility rate with 213.0 births per 1,000 women. Women in the age bracket of 20 to 34 years acount for 100.0% of all women with births.
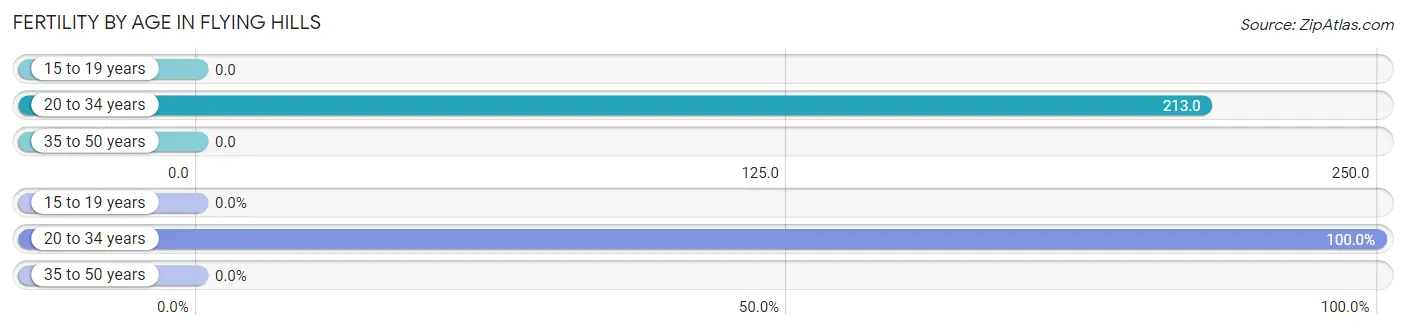
| Age Bracket | Women with Births | Births / 1,000 Women |
| 15 to 19 years | 0 (0.0%) | 0.0 |
| 20 to 34 years | 36 (100.0%) | 213.0 |
| 35 to 50 years | 0 (0.0%) | 0.0 |
| Total | 36 (100.0%) | 126.0 |
Fertility by Age by Marriage Status in Flying Hills
27.8% of women with births (36) in Flying Hills are married. The highest percentage of unmarried women with births falls into 20 to 34 years age bracket with 72.2% of them unmarried at the time of birth, while the lowest percentage of unmarried women with births belong to 20 to 34 years age bracket with 72.2% of them unmarried.
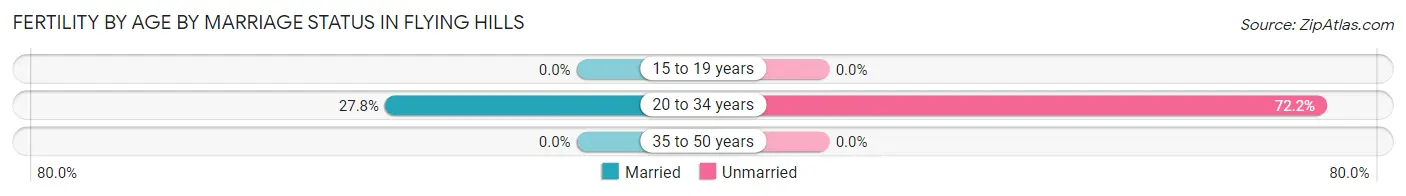
| Age Bracket | Married | Unmarried |
| 15 to 19 years | 0 (0.0%) | 0 (0.0%) |
| 20 to 34 years | 10 (27.8%) | 26 (72.2%) |
| 35 to 50 years | 0 (0.0%) | 0 (0.0%) |
| Total | 10 (27.8%) | 26 (72.2%) |
Fertility by Education in Flying Hills
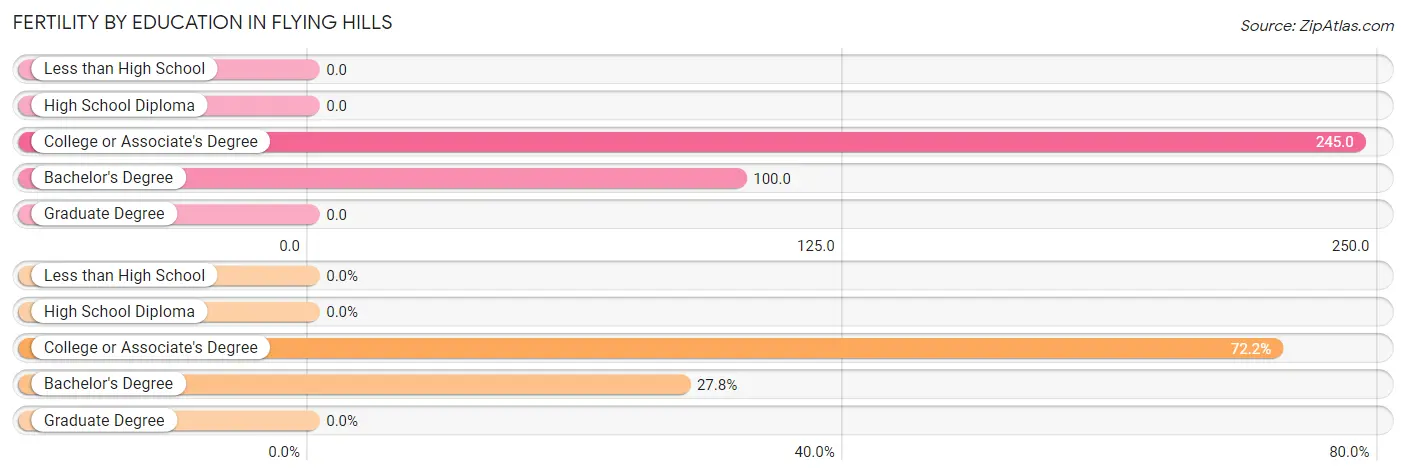
| Educational Attainment | Women with Births | Births / 1,000 Women |
| Less than High School | 0 (0.0%) | 0.0 |
| High School Diploma | 0 (0.0%) | 0.0 |
| College or Associate's Degree | 26 (72.2%) | 245.0 |
| Bachelor's Degree | 10 (27.8%) | 100.0 |
| Graduate Degree | 0 (0.0%) | 0.0 |
| Total | 36 (100.0%) | 126.0 |
Fertility by Education by Marriage Status in Flying Hills
72.2% of women with births in Flying Hills are unmarried. Women with the educational attainment of bachelor's degree are most likely to be married with 100.0% of them married at childbirth, while women with the educational attainment of college or associate's degree are least likely to be married with 100.0% of them unmarried at childbirth.
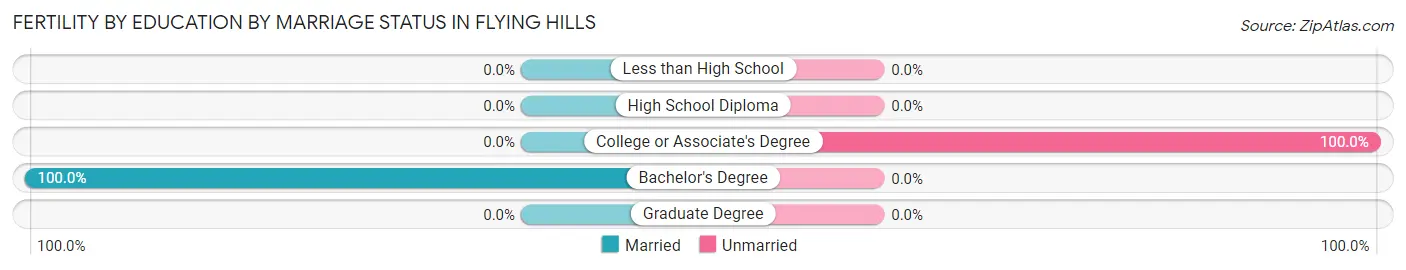
| Educational Attainment | Married | Unmarried |
| Less than High School | 0 (0.0%) | 0 (0.0%) |
| High School Diploma | 0 (0.0%) | 0 (0.0%) |
| College or Associate's Degree | 0 (0.0%) | 26 (100.0%) |
| Bachelor's Degree | 10 (100.0%) | 0 (0.0%) |
| Graduate Degree | 0 (0.0%) | 0 (0.0%) |
| Total | 10 (27.8%) | 26 (72.2%) |
Employment Characteristics in Flying Hills
Employment by Class of Employer in Flying Hills
Among the 985 employed individuals in Flying Hills, private company employees (559 | 56.8%), not-for-profit organizations (144 | 14.6%), and state government employees (87 | 8.8%) make up the most common classes of employment.
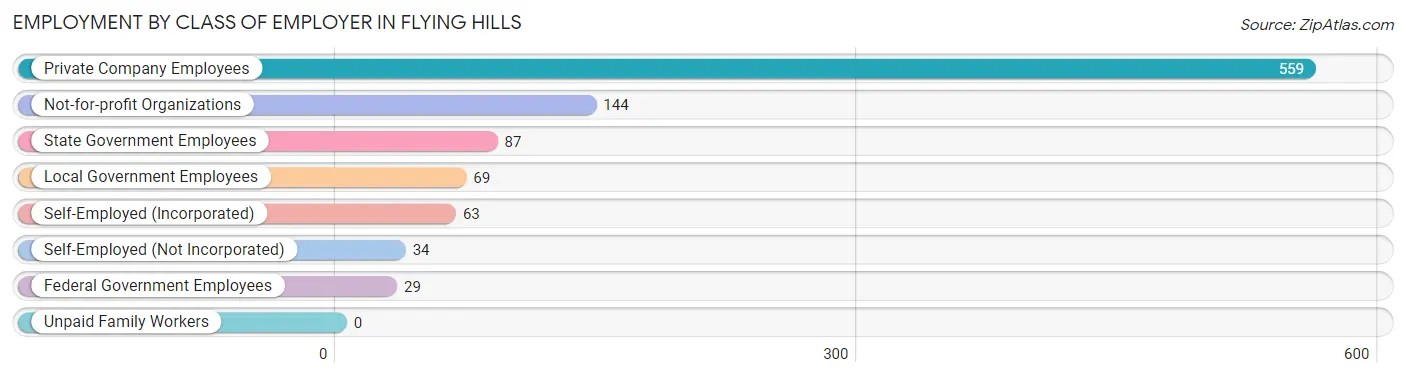
| Employer Class | # Employees | % Employees |
| Private Company Employees | 559 | 56.8% |
| Self-Employed (Incorporated) | 63 | 6.4% |
| Self-Employed (Not Incorporated) | 34 | 3.5% |
| Not-for-profit Organizations | 144 | 14.6% |
| Local Government Employees | 69 | 7.0% |
| State Government Employees | 87 | 8.8% |
| Federal Government Employees | 29 | 2.9% |
| Unpaid Family Workers | 0 | 0.0% |
| Total | 985 | 100.0% |
Employment Status by Age in Flying Hills
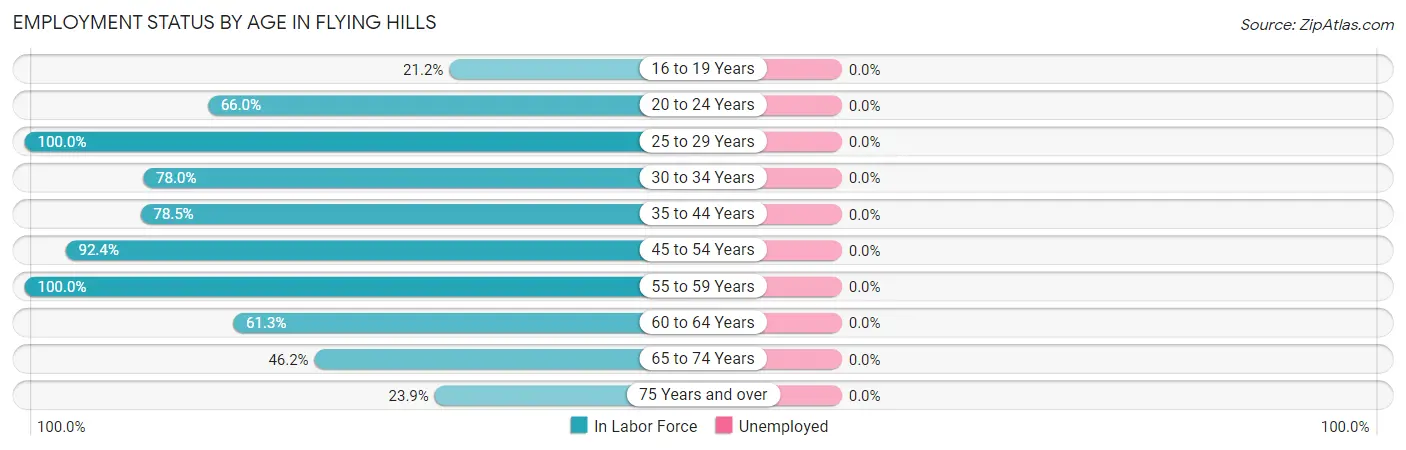
| Age Bracket | In Labor Force | Unemployed |
| 16 to 19 Years | 11 (21.2%) | 0 (0.0%) |
| 20 to 24 Years | 31 (66.0%) | 0 (0.0%) |
| 25 to 29 Years | 134 (100.0%) | 0 (0.0%) |
| 30 to 34 Years | 92 (78.0%) | 0 (0.0%) |
| 35 to 44 Years | 164 (78.5%) | 0 (0.0%) |
| 45 to 54 Years | 146 (92.4%) | 0 (0.0%) |
| 55 to 59 Years | 108 (100.0%) | 0 (0.0%) |
| 60 to 64 Years | 103 (61.3%) | 0 (0.0%) |
| 65 to 74 Years | 140 (46.2%) | 0 (0.0%) |
| 75 Years and over | 56 (23.9%) | 0 (0.0%) |
| Total | 984 (64.3%) | 0 (0.0%) |
Employment Status by Educational Attainment in Flying Hills
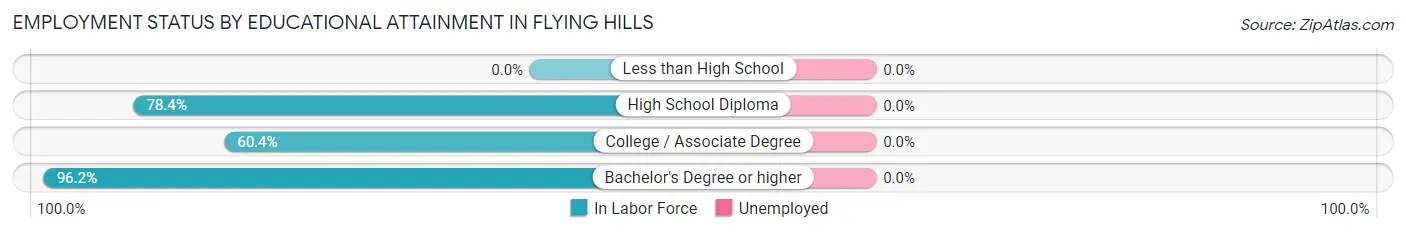
| Educational Attainment | In Labor Force | Unemployed |
| Less than High School | 0 (0.0%) | 0 (0.0%) |
| High School Diploma | 40 (78.4%) | 0 (0.0%) |
| College / Associate Degree | 177 (60.4%) | 0 (0.0%) |
| Bachelor's Degree or higher | 530 (96.2%) | 0 (0.0%) |
| Total | 747 (83.5%) | 0 (0.0%) |
Employment Occupations by Sex in Flying Hills
Management, Business, Science and Arts Occupations
The most common Management, Business, Science and Arts occupations in Flying Hills are Community & Social Service (199 | 20.2%), Business & Financial (85 | 8.6%), Management (84 | 8.5%), Computers, Engineering & Science (84 | 8.5%), and Health Diagnosing & Treating (69 | 7.0%).
Management, Business, Science and Arts Occupations by Sex
Within the Management, Business, Science and Arts occupations in Flying Hills, the most male-oriented occupations are Computers, Engineering & Science (100.0%), Computers & Mathematics (100.0%), and Architecture & Engineering (100.0%), while the most female-oriented occupations are Health Diagnosing & Treating (75.4%), Health Technologists (75.4%), and Arts, Media & Entertainment (73.5%).
| Occupation | Male | Female |
| Management | 60 (71.4%) | 24 (28.6%) |
| Business & Financial | 38 (44.7%) | 47 (55.3%) |
| Computers, Engineering & Science | 84 (100.0%) | 0 (0.0%) |
| Computers & Mathematics | 17 (100.0%) | 0 (0.0%) |
| Architecture & Engineering | 58 (100.0%) | 0 (0.0%) |
| Life, Physical & Social Science | 9 (100.0%) | 0 (0.0%) |
| Community & Social Service | 100 (50.2%) | 99 (49.7%) |
| Education, Arts & Media | 36 (58.1%) | 26 (41.9%) |
| Legal Services & Support | 21 (67.7%) | 10 (32.3%) |
| Education Instruction & Library | 30 (52.6%) | 27 (47.4%) |
| Arts, Media & Entertainment | 13 (26.5%) | 36 (73.5%) |
| Health Diagnosing & Treating | 17 (24.6%) | 52 (75.4%) |
| Health Technologists | 17 (24.6%) | 52 (75.4%) |
| Total (Category) | 299 (57.4%) | 222 (42.6%) |
| Total (Overall) | 580 (58.9%) | 405 (41.1%) |
Services Occupations
The most common Services occupations in Flying Hills are Healthcare Support (25 | 2.5%), Food Preparation & Serving (25 | 2.5%), Security & Protection (20 | 2.0%), Law Enforcement (20 | 2.0%), and Personal Care & Service (12 | 1.2%).
Services Occupations by Sex
Within the Services occupations in Flying Hills, the most male-oriented occupations are Security & Protection (100.0%), Law Enforcement (100.0%), and Personal Care & Service (100.0%), while the most female-oriented occupations are Healthcare Support (100.0%), and Food Preparation & Serving (44.0%).
| Occupation | Male | Female |
| Healthcare Support | 0 (0.0%) | 25 (100.0%) |
| Security & Protection | 20 (100.0%) | 0 (0.0%) |
| Firefighting & Prevention | 0 (0.0%) | 0 (0.0%) |
| Law Enforcement | 20 (100.0%) | 0 (0.0%) |
| Food Preparation & Serving | 14 (56.0%) | 11 (44.0%) |
| Cleaning & Maintenance | 0 (0.0%) | 0 (0.0%) |
| Personal Care & Service | 12 (100.0%) | 0 (0.0%) |
| Total (Category) | 46 (56.1%) | 36 (43.9%) |
| Total (Overall) | 580 (58.9%) | 405 (41.1%) |
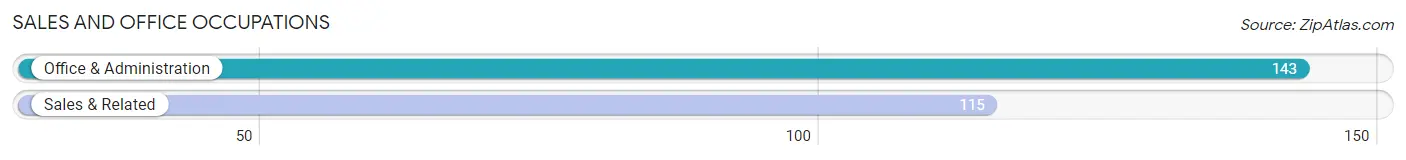
Sales and Office Occupations
The most common Sales and Office occupations in Flying Hills are Office & Administration (143 | 14.5%), and Sales & Related (115 | 11.7%).
Sales and Office Occupations by Sex
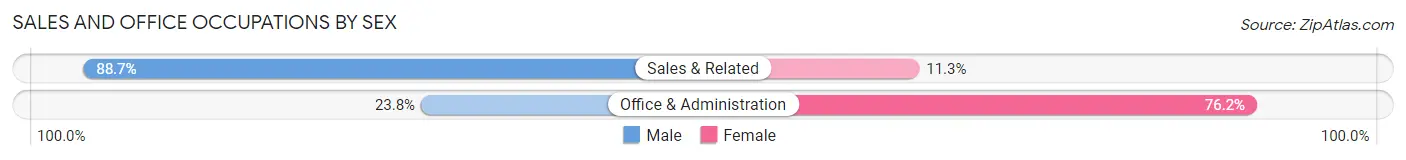
| Occupation | Male | Female |
| Sales & Related | 102 (88.7%) | 13 (11.3%) |
| Office & Administration | 34 (23.8%) | 109 (76.2%) |
| Total (Category) | 136 (52.7%) | 122 (47.3%) |
| Total (Overall) | 580 (58.9%) | 405 (41.1%) |
Natural Resources, Construction and Maintenance Occupations
Natural Resources, Construction and Maintenance Occupations by Sex
| Occupation | Male | Female |
| Farming, Fishing & Forestry | 0 (0.0%) | 0 (0.0%) |
| Construction & Extraction | 0 (0.0%) | 0 (0.0%) |
| Installation, Maintenance & Repair | 0 (0.0%) | 0 (0.0%) |
| Total (Category) | 0 (0.0%) | 0 (0.0%) |
| Total (Overall) | 580 (58.9%) | 405 (41.1%) |
Production, Transportation and Moving Occupations
The most common Production, Transportation and Moving occupations in Flying Hills are Production (98 | 10.0%), Transportation (13 | 1.3%), and Material Moving (13 | 1.3%).
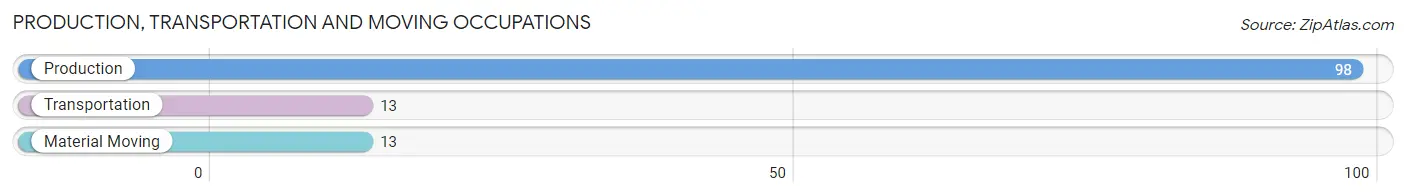
Production, Transportation and Moving Occupations by Sex
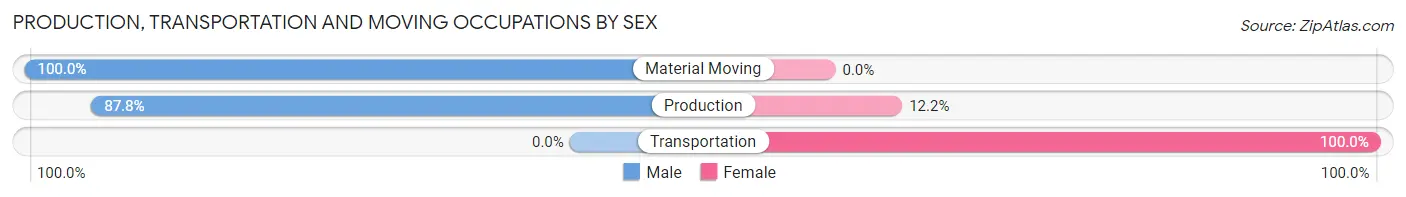
| Occupation | Male | Female |
| Production | 86 (87.8%) | 12 (12.2%) |
| Transportation | 0 (0.0%) | 13 (100.0%) |
| Material Moving | 13 (100.0%) | 0 (0.0%) |
| Total (Category) | 99 (79.8%) | 25 (20.2%) |
| Total (Overall) | 580 (58.9%) | 405 (41.1%) |
Employment Industries by Sex in Flying Hills
Employment Industries in Flying Hills
The major employment industries in Flying Hills include Manufacturing (184 | 18.7%), Health Care & Social Assistance (156 | 15.8%), Public Administration (101 | 10.2%), Professional & Scientific (91 | 9.2%), and Finance & Insurance (89 | 9.0%).
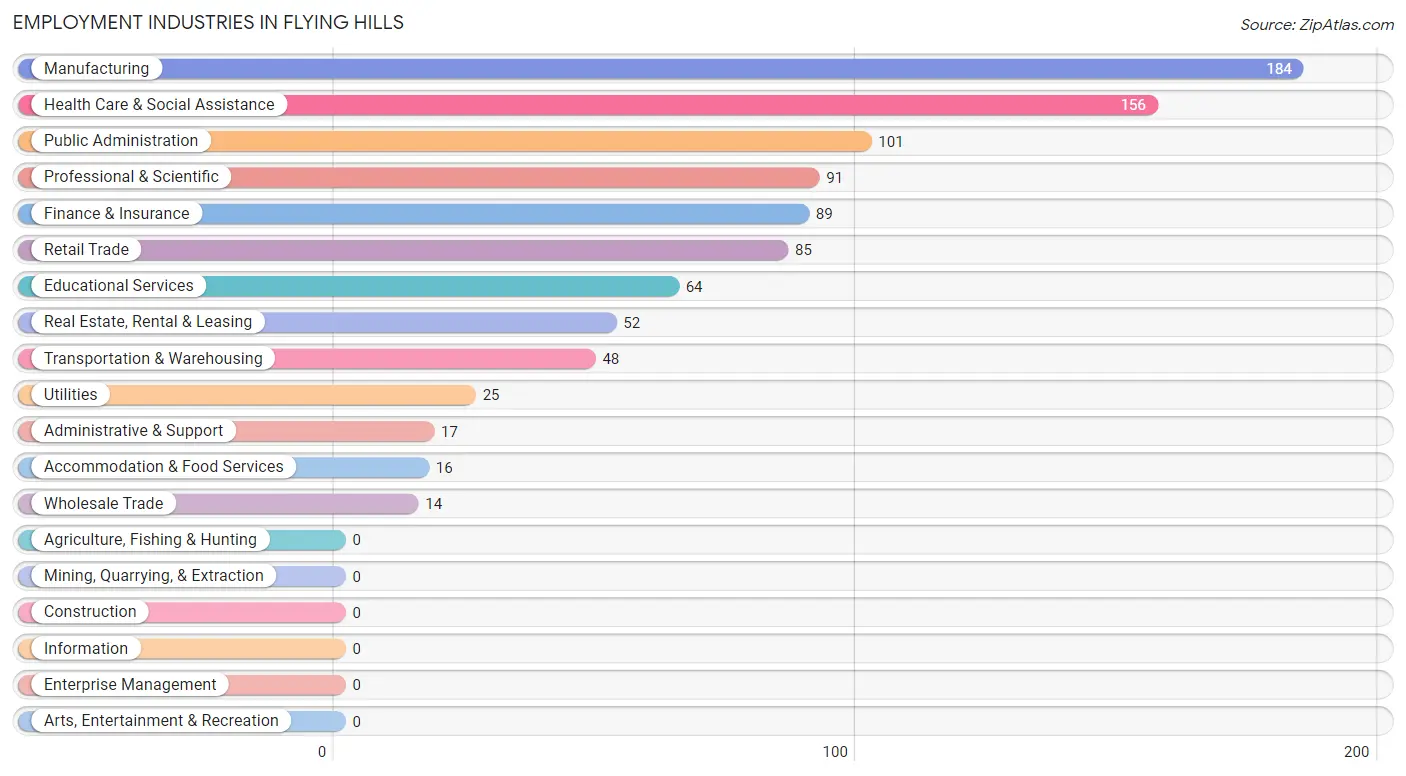
Employment Industries by Sex in Flying Hills
The Flying Hills industries that see more men than women are Utilities (100.0%), Administrative & Support (100.0%), and Public Administration (100.0%), whereas the industries that tend to have a higher number of women are Wholesale Trade (100.0%), Health Care & Social Assistance (90.4%), and Accommodation & Food Services (68.8%).
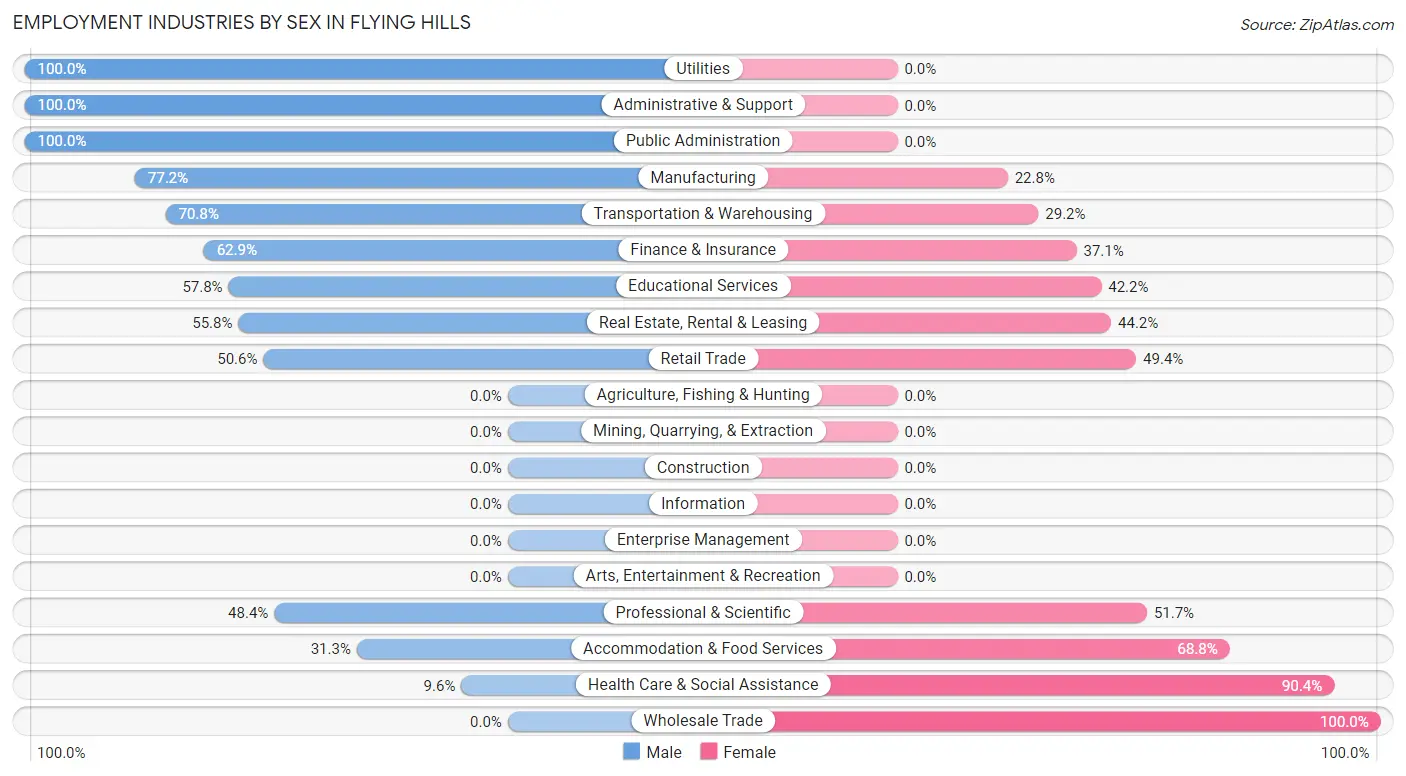
| Industry | Male | Female |
| Agriculture, Fishing & Hunting | 0 (0.0%) | 0 (0.0%) |
| Mining, Quarrying, & Extraction | 0 (0.0%) | 0 (0.0%) |
| Construction | 0 (0.0%) | 0 (0.0%) |
| Manufacturing | 142 (77.2%) | 42 (22.8%) |
| Wholesale Trade | 0 (0.0%) | 14 (100.0%) |
| Retail Trade | 43 (50.6%) | 42 (49.4%) |
| Transportation & Warehousing | 34 (70.8%) | 14 (29.2%) |
| Utilities | 25 (100.0%) | 0 (0.0%) |
| Information | 0 (0.0%) | 0 (0.0%) |
| Finance & Insurance | 56 (62.9%) | 33 (37.1%) |
| Real Estate, Rental & Leasing | 29 (55.8%) | 23 (44.2%) |
| Professional & Scientific | 44 (48.3%) | 47 (51.6%) |
| Enterprise Management | 0 (0.0%) | 0 (0.0%) |
| Administrative & Support | 17 (100.0%) | 0 (0.0%) |
| Educational Services | 37 (57.8%) | 27 (42.2%) |
| Health Care & Social Assistance | 15 (9.6%) | 141 (90.4%) |
| Arts, Entertainment & Recreation | 0 (0.0%) | 0 (0.0%) |
| Accommodation & Food Services | 5 (31.2%) | 11 (68.8%) |
| Public Administration | 101 (100.0%) | 0 (0.0%) |
| Total | 580 (58.9%) | 405 (41.1%) |
Education in Flying Hills
School Enrollment in Flying Hills
The most common levels of schooling among the 223 students in Flying Hills are college / undergraduate (83 | 37.2%), middle school (52 | 23.3%), and high school (41 | 18.4%).
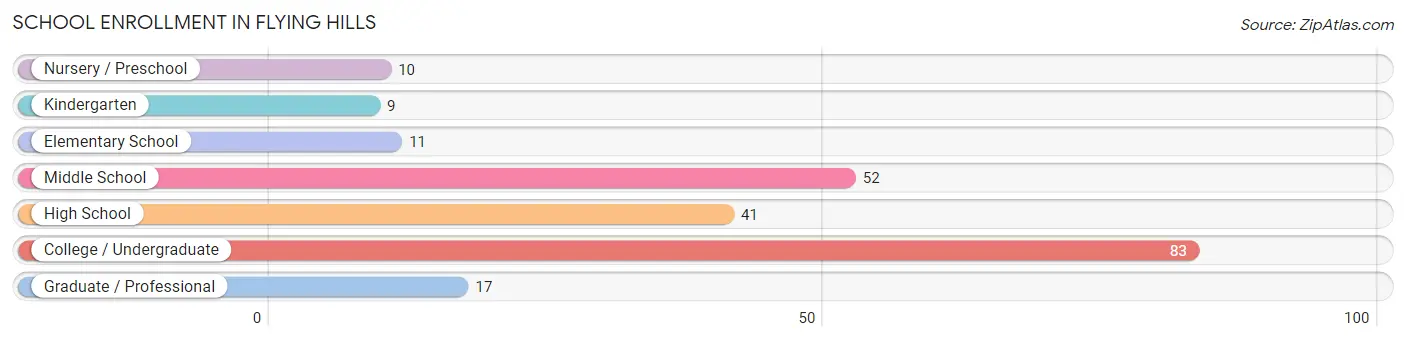
| School Level | # Students | % Students |
| Nursery / Preschool | 10 | 4.5% |
| Kindergarten | 9 | 4.0% |
| Elementary School | 11 | 4.9% |
| Middle School | 52 | 23.3% |
| High School | 41 | 18.4% |
| College / Undergraduate | 83 | 37.2% |
| Graduate / Professional | 17 | 7.6% |
| Total | 223 | 100.0% |
School Enrollment by Age by Funding Source in Flying Hills
Out of a total of 223 students who are enrolled in schools in Flying Hills, 27 (12.1%) attend a private institution, while the remaining 196 (87.9%) are enrolled in public schools. The age group of 3 to 4 year olds has the highest likelihood of being enrolled in private schools, with 10 (100.0% in the age bracket) enrolled. Conversely, the age group of 5 to 9 year old has the lowest likelihood of being enrolled in a private school, with 20 (100.0% in the age bracket) attending a public institution.
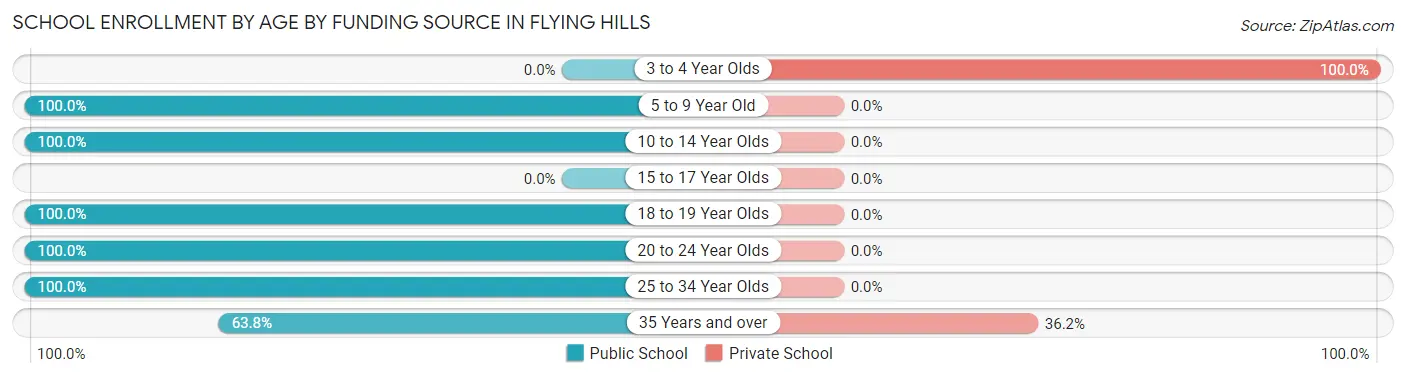
| Age Bracket | Public School | Private School |
| 3 to 4 Year Olds | 0 (0.0%) | 10 (100.0%) |
| 5 to 9 Year Old | 20 (100.0%) | 0 (0.0%) |
| 10 to 14 Year Olds | 52 (100.0%) | 0 (0.0%) |
| 15 to 17 Year Olds | 0 (0.0%) | 0 (0.0%) |
| 18 to 19 Year Olds | 52 (100.0%) | 0 (0.0%) |
| 20 to 24 Year Olds | 16 (100.0%) | 0 (0.0%) |
| 25 to 34 Year Olds | 26 (100.0%) | 0 (0.0%) |
| 35 Years and over | 30 (63.8%) | 17 (36.2%) |
| Total | 196 (87.9%) | 27 (12.1%) |
Educational Attainment by Field of Study in Flying Hills
Social sciences (145 | 17.2%), education (124 | 14.7%), business (113 | 13.4%), engineering (81 | 9.6%), and arts & humanities (75 | 8.9%) are the most common fields of study among 845 individuals in Flying Hills who have obtained a bachelor's degree or higher.
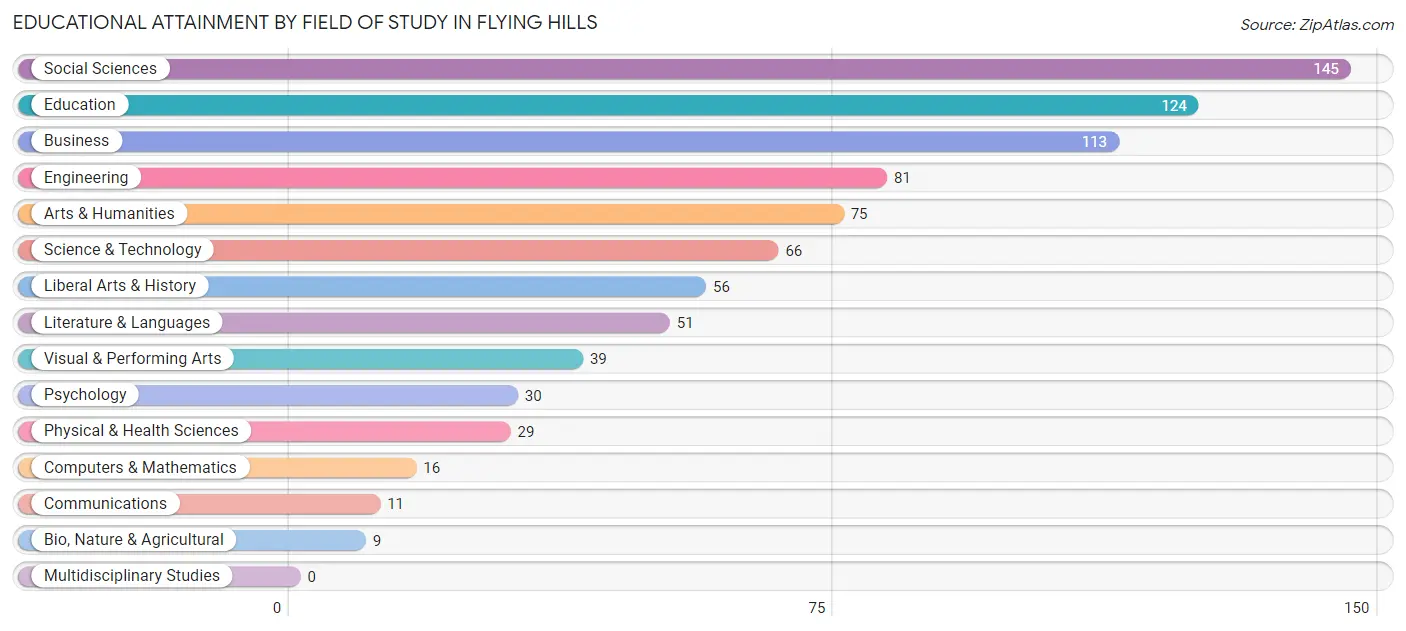
| Field of Study | # Graduates | % Graduates |
| Computers & Mathematics | 16 | 1.9% |
| Bio, Nature & Agricultural | 9 | 1.1% |
| Physical & Health Sciences | 29 | 3.4% |
| Psychology | 30 | 3.5% |
| Social Sciences | 145 | 17.2% |
| Engineering | 81 | 9.6% |
| Multidisciplinary Studies | 0 | 0.0% |
| Science & Technology | 66 | 7.8% |
| Business | 113 | 13.4% |
| Education | 124 | 14.7% |
| Literature & Languages | 51 | 6.0% |
| Liberal Arts & History | 56 | 6.6% |
| Visual & Performing Arts | 39 | 4.6% |
| Communications | 11 | 1.3% |
| Arts & Humanities | 75 | 8.9% |
| Total | 845 | 100.0% |
Transportation & Commute in Flying Hills
Vehicle Availability by Sex in Flying Hills
The most prevalent vehicle ownership categories in Flying Hills are males with 2 vehicles (285, accounting for 49.1%) and females with 2 vehicles (195, making up 70.4%).
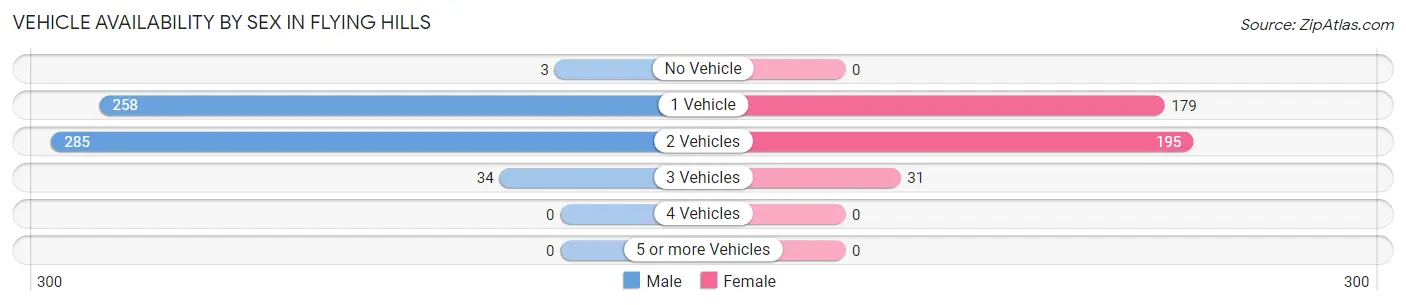
| Vehicles Available | Male | Female |
| No Vehicle | 3 (0.5%) | 0 (0.0%) |
| 1 Vehicle | 258 (44.5%) | 179 (44.2%) |
| 2 Vehicles | 285 (49.1%) | 195 (48.1%) |
| 3 Vehicles | 34 (5.9%) | 31 (7.6%) |
| 4 Vehicles | 0 (0.0%) | 0 (0.0%) |
| 5 or more Vehicles | 0 (0.0%) | 0 (0.0%) |
| Total | 580 (100.0%) | 405 (100.0%) |
Commute Time in Flying Hills
The most frequently occuring commute durations in Flying Hills are 15 to 19 minutes (261 commuters, 28.2%), 45 to 59 minutes (152 commuters, 16.5%), and 10 to 14 minutes (124 commuters, 13.4%).
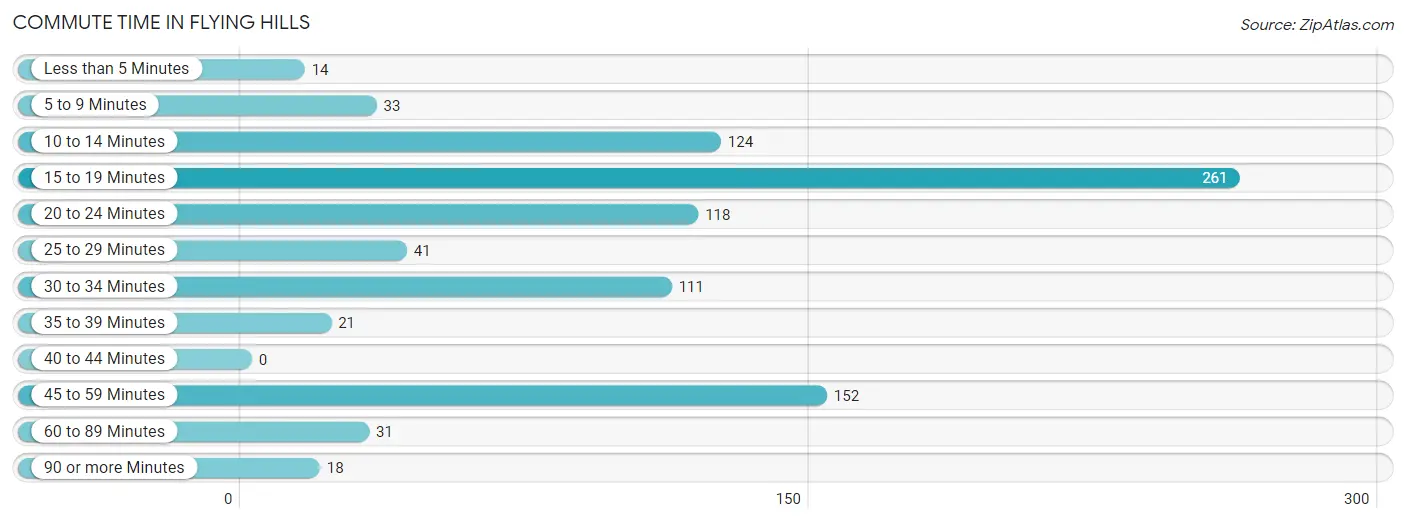
| Commute Time | # Commuters | % Commuters |
| Less than 5 Minutes | 14 | 1.5% |
| 5 to 9 Minutes | 33 | 3.6% |
| 10 to 14 Minutes | 124 | 13.4% |
| 15 to 19 Minutes | 261 | 28.2% |
| 20 to 24 Minutes | 118 | 12.8% |
| 25 to 29 Minutes | 41 | 4.4% |
| 30 to 34 Minutes | 111 | 12.0% |
| 35 to 39 Minutes | 21 | 2.3% |
| 40 to 44 Minutes | 0 | 0.0% |
| 45 to 59 Minutes | 152 | 16.5% |
| 60 to 89 Minutes | 31 | 3.4% |
| 90 or more Minutes | 18 | 1.9% |
Commute Time by Sex in Flying Hills
The most common commute times in Flying Hills are 15 to 19 minutes (192 commuters, 34.7%) for males and 45 to 59 minutes (73 commuters, 19.7%) for females.
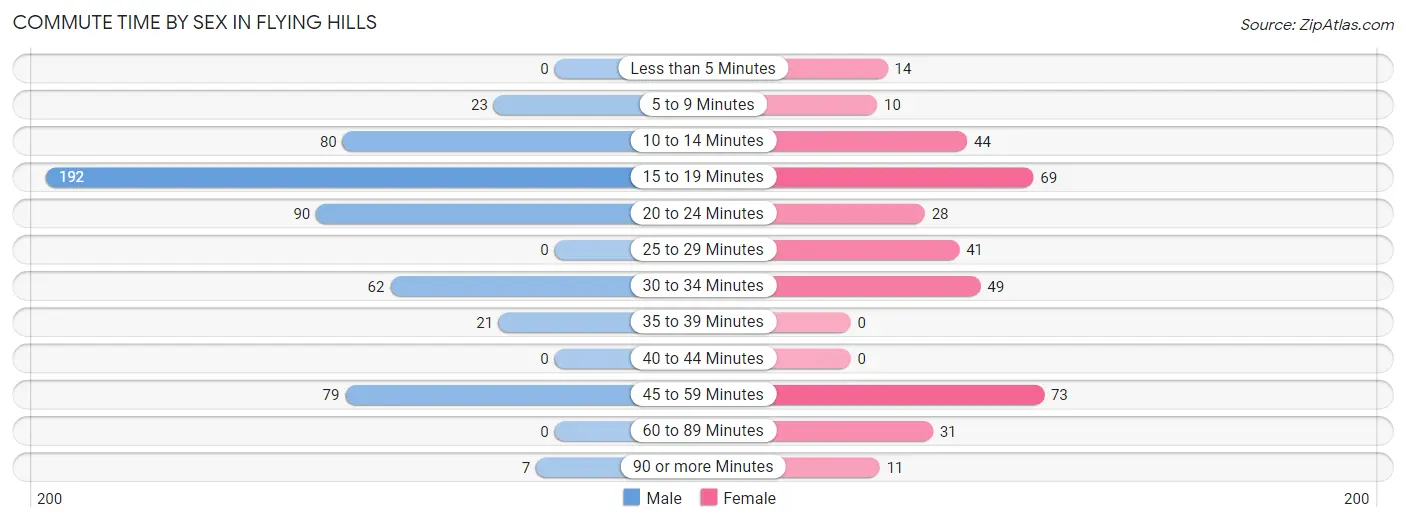
| Commute Time | Male | Female |
| Less than 5 Minutes | 0 (0.0%) | 14 (3.8%) |
| 5 to 9 Minutes | 23 (4.2%) | 10 (2.7%) |
| 10 to 14 Minutes | 80 (14.4%) | 44 (11.9%) |
| 15 to 19 Minutes | 192 (34.7%) | 69 (18.6%) |
| 20 to 24 Minutes | 90 (16.3%) | 28 (7.6%) |
| 25 to 29 Minutes | 0 (0.0%) | 41 (11.1%) |
| 30 to 34 Minutes | 62 (11.2%) | 49 (13.2%) |
| 35 to 39 Minutes | 21 (3.8%) | 0 (0.0%) |
| 40 to 44 Minutes | 0 (0.0%) | 0 (0.0%) |
| 45 to 59 Minutes | 79 (14.3%) | 73 (19.7%) |
| 60 to 89 Minutes | 0 (0.0%) | 31 (8.4%) |
| 90 or more Minutes | 7 (1.3%) | 11 (3.0%) |
Time of Departure to Work by Sex in Flying Hills
The most frequent times of departure to work in Flying Hills are 7:30 AM to 7:59 AM (105, 19.0%) for males and 7:30 AM to 7:59 AM (85, 23.0%) for females.
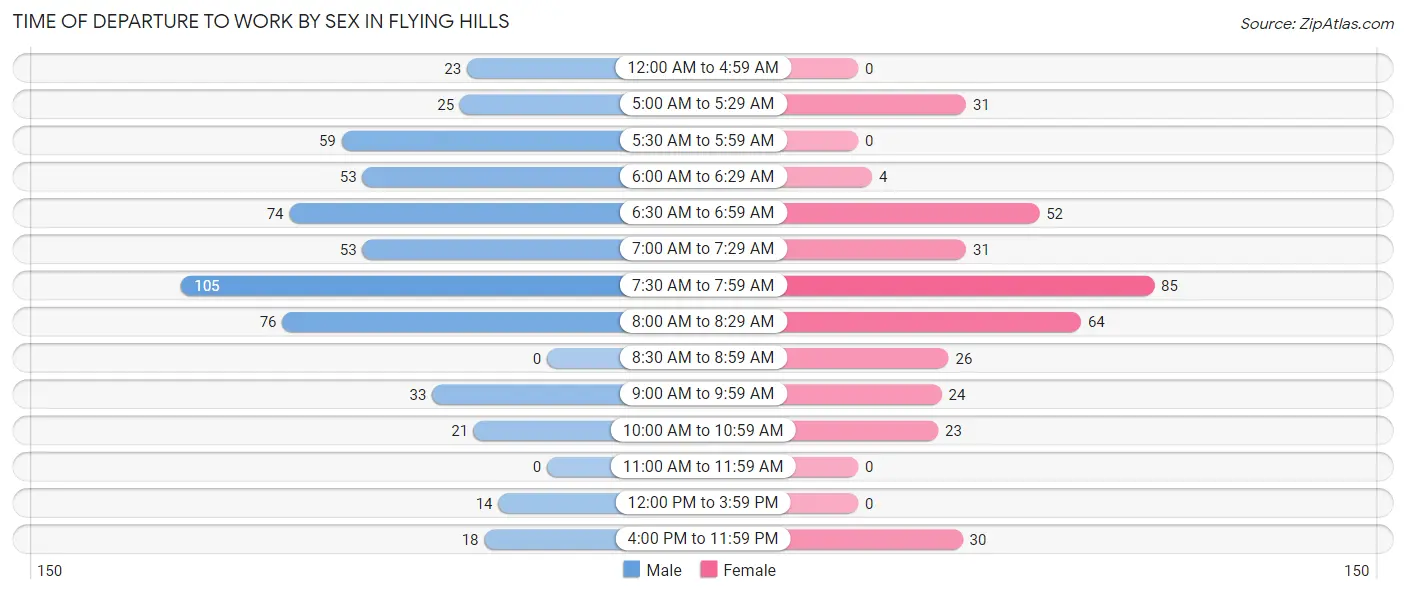
| Time of Departure | Male | Female |
| 12:00 AM to 4:59 AM | 23 (4.2%) | 0 (0.0%) |
| 5:00 AM to 5:29 AM | 25 (4.5%) | 31 (8.4%) |
| 5:30 AM to 5:59 AM | 59 (10.6%) | 0 (0.0%) |
| 6:00 AM to 6:29 AM | 53 (9.6%) | 4 (1.1%) |
| 6:30 AM to 6:59 AM | 74 (13.4%) | 52 (14.1%) |
| 7:00 AM to 7:29 AM | 53 (9.6%) | 31 (8.4%) |
| 7:30 AM to 7:59 AM | 105 (19.0%) | 85 (23.0%) |
| 8:00 AM to 8:29 AM | 76 (13.7%) | 64 (17.3%) |
| 8:30 AM to 8:59 AM | 0 (0.0%) | 26 (7.0%) |
| 9:00 AM to 9:59 AM | 33 (6.0%) | 24 (6.5%) |
| 10:00 AM to 10:59 AM | 21 (3.8%) | 23 (6.2%) |
| 11:00 AM to 11:59 AM | 0 (0.0%) | 0 (0.0%) |
| 12:00 PM to 3:59 PM | 14 (2.5%) | 0 (0.0%) |
| 4:00 PM to 11:59 PM | 18 (3.3%) | 30 (8.1%) |
| Total | 554 (100.0%) | 370 (100.0%) |
Housing Occupancy in Flying Hills
Occupancy by Ownership in Flying Hills
Of the total 1,027 dwellings in Flying Hills, owner-occupied units account for 510 (49.7%), while renter-occupied units make up 517 (50.3%).
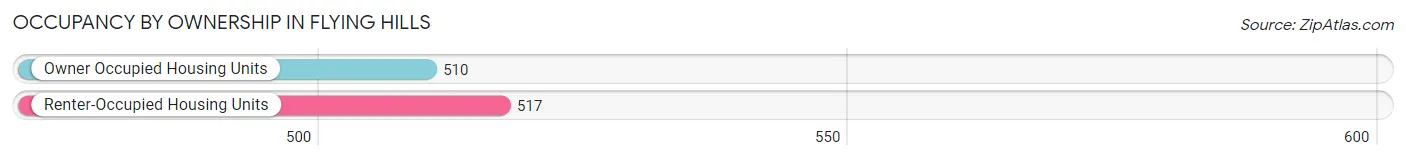
| Occupancy | # Housing Units | % Housing Units |
| Owner Occupied Housing Units | 510 | 49.7% |
| Renter-Occupied Housing Units | 517 | 50.3% |
| Total Occupied Housing Units | 1,027 | 100.0% |
Occupancy by Household Size in Flying Hills
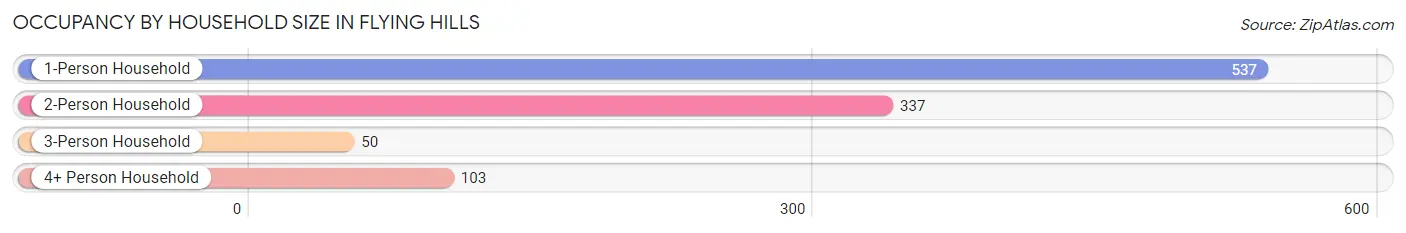
| Household Size | # Housing Units | % Housing Units |
| 1-Person Household | 537 | 52.3% |
| 2-Person Household | 337 | 32.8% |
| 3-Person Household | 50 | 4.9% |
| 4+ Person Household | 103 | 10.0% |
| Total Housing Units | 1,027 | 100.0% |
Occupancy by Ownership by Household Size in Flying Hills
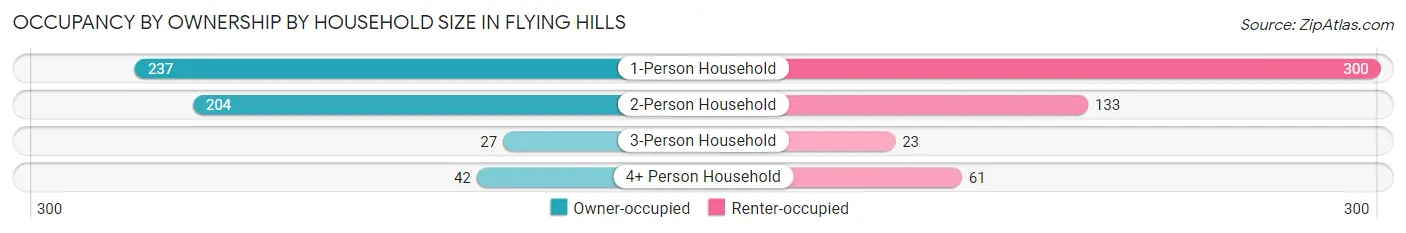
| Household Size | Owner-occupied | Renter-occupied |
| 1-Person Household | 237 (44.1%) | 300 (55.9%) |
| 2-Person Household | 204 (60.5%) | 133 (39.5%) |
| 3-Person Household | 27 (54.0%) | 23 (46.0%) |
| 4+ Person Household | 42 (40.8%) | 61 (59.2%) |
| Total Housing Units | 510 (49.7%) | 517 (50.3%) |
Occupancy by Educational Attainment in Flying Hills
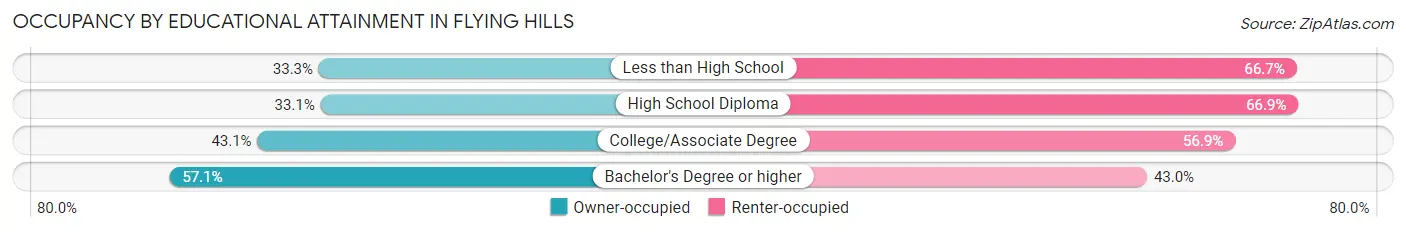
| Household Size | Owner-occupied | Renter-occupied |
| Less than High School | 12 (33.3%) | 24 (66.7%) |
| High School Diploma | 40 (33.1%) | 81 (66.9%) |
| College/Associate Degree | 118 (43.1%) | 156 (56.9%) |
| Bachelor's Degree or higher | 340 (57.1%) | 256 (42.9%) |
Occupancy by Age of Householder in Flying Hills
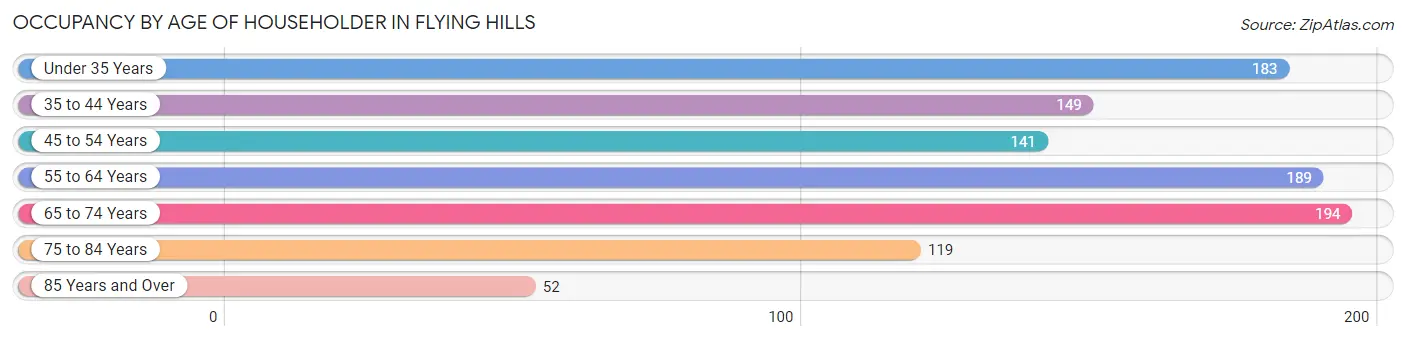
| Age Bracket | # Households | % Households |
| Under 35 Years | 183 | 17.8% |
| 35 to 44 Years | 149 | 14.5% |
| 45 to 54 Years | 141 | 13.7% |
| 55 to 64 Years | 189 | 18.4% |
| 65 to 74 Years | 194 | 18.9% |
| 75 to 84 Years | 119 | 11.6% |
| 85 Years and Over | 52 | 5.1% |
| Total | 1,027 | 100.0% |
Housing Finances in Flying Hills
Median Income by Occupancy in Flying Hills
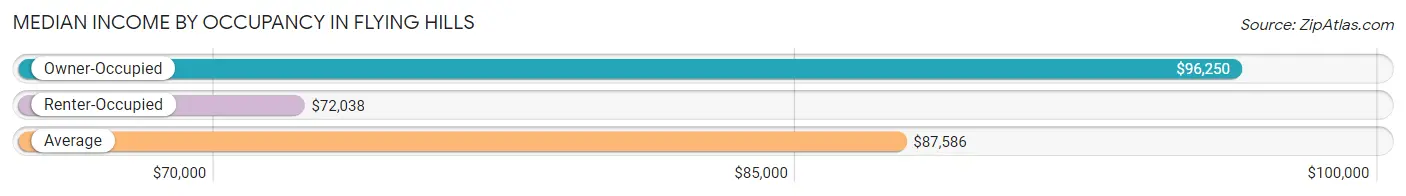
| Occupancy Type | # Households | Median Income |
| Owner-Occupied | 510 (49.7%) | $96,250 |
| Renter-Occupied | 517 (50.3%) | $72,038 |
| Average | 1,027 (100.0%) | $87,586 |
Occupancy by Householder Income Bracket in Flying Hills
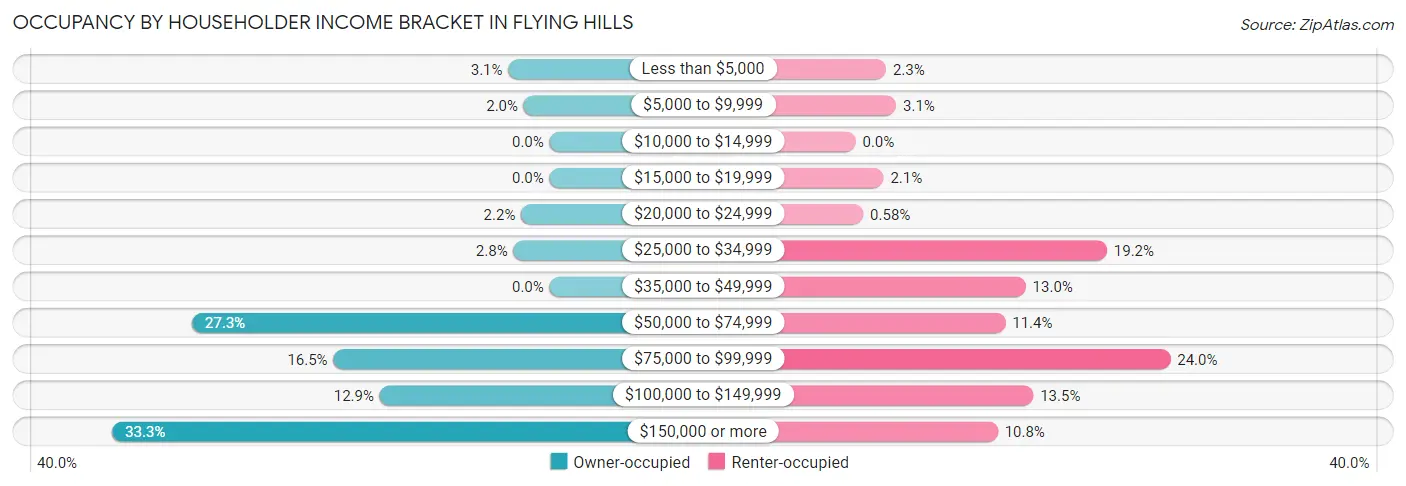
| Income Bracket | Owner-occupied | Renter-occupied |
| Less than $5,000 | 16 (3.1%) | 12 (2.3%) |
| $5,000 to $9,999 | 10 (2.0%) | 16 (3.1%) |
| $10,000 to $14,999 | 0 (0.0%) | 0 (0.0%) |
| $15,000 to $19,999 | 0 (0.0%) | 11 (2.1%) |
| $20,000 to $24,999 | 11 (2.2%) | 3 (0.6%) |
| $25,000 to $34,999 | 14 (2.8%) | 99 (19.2%) |
| $35,000 to $49,999 | 0 (0.0%) | 67 (13.0%) |
| $50,000 to $74,999 | 139 (27.3%) | 59 (11.4%) |
| $75,000 to $99,999 | 84 (16.5%) | 124 (24.0%) |
| $100,000 to $149,999 | 66 (12.9%) | 70 (13.5%) |
| $150,000 or more | 170 (33.3%) | 56 (10.8%) |
| Total | 510 (100.0%) | 517 (100.0%) |
Monthly Housing Cost Tiers in Flying Hills
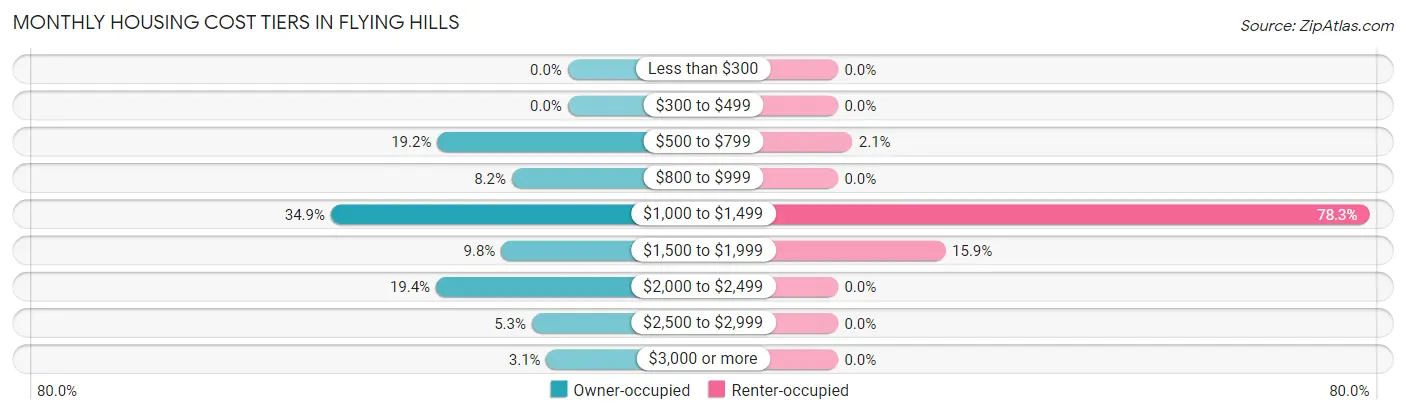
| Monthly Cost | Owner-occupied | Renter-occupied |
| Less than $300 | 0 (0.0%) | 0 (0.0%) |
| $300 to $499 | 0 (0.0%) | 0 (0.0%) |
| $500 to $799 | 98 (19.2%) | 11 (2.1%) |
| $800 to $999 | 42 (8.2%) | 0 (0.0%) |
| $1,000 to $1,499 | 178 (34.9%) | 405 (78.3%) |
| $1,500 to $1,999 | 50 (9.8%) | 82 (15.9%) |
| $2,000 to $2,499 | 99 (19.4%) | 0 (0.0%) |
| $2,500 to $2,999 | 27 (5.3%) | 0 (0.0%) |
| $3,000 or more | 16 (3.1%) | 0 (0.0%) |
| Total | 510 (100.0%) | 517 (100.0%) |
Physical Housing Characteristics in Flying Hills
Housing Structures in Flying Hills
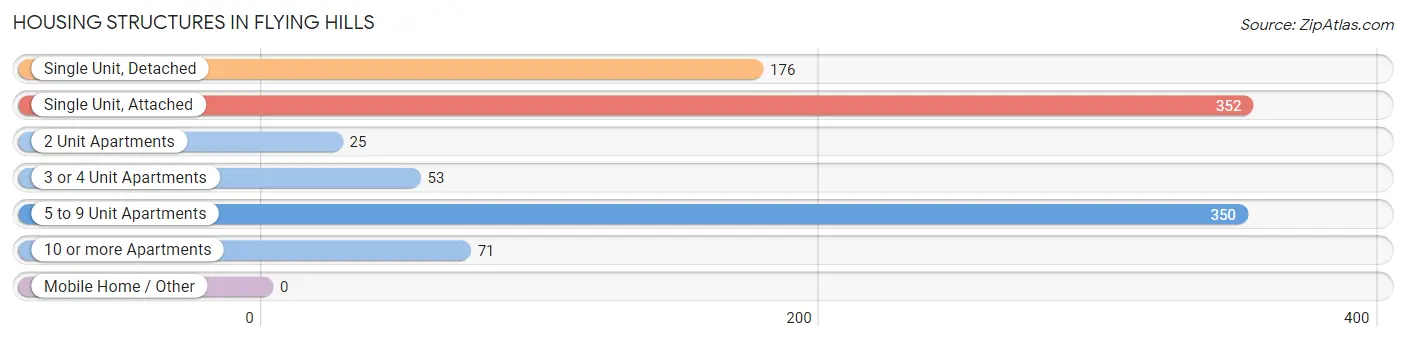
| Structure Type | # Housing Units | % Housing Units |
| Single Unit, Detached | 176 | 17.1% |
| Single Unit, Attached | 352 | 34.3% |
| 2 Unit Apartments | 25 | 2.4% |
| 3 or 4 Unit Apartments | 53 | 5.2% |
| 5 to 9 Unit Apartments | 350 | 34.1% |
| 10 or more Apartments | 71 | 6.9% |
| Mobile Home / Other | 0 | 0.0% |
| Total | 1,027 | 100.0% |
Housing Structures by Occupancy in Flying Hills
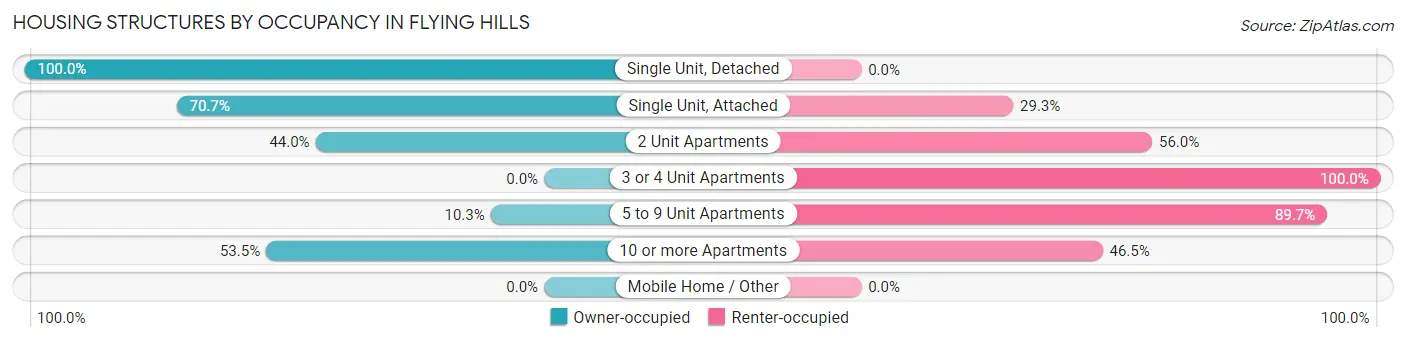
| Structure Type | Owner-occupied | Renter-occupied |
| Single Unit, Detached | 176 (100.0%) | 0 (0.0%) |
| Single Unit, Attached | 249 (70.7%) | 103 (29.3%) |
| 2 Unit Apartments | 11 (44.0%) | 14 (56.0%) |
| 3 or 4 Unit Apartments | 0 (0.0%) | 53 (100.0%) |
| 5 to 9 Unit Apartments | 36 (10.3%) | 314 (89.7%) |
| 10 or more Apartments | 38 (53.5%) | 33 (46.5%) |
| Mobile Home / Other | 0 (0.0%) | 0 (0.0%) |
| Total | 510 (49.7%) | 517 (50.3%) |
Housing Structures by Number of Rooms in Flying Hills
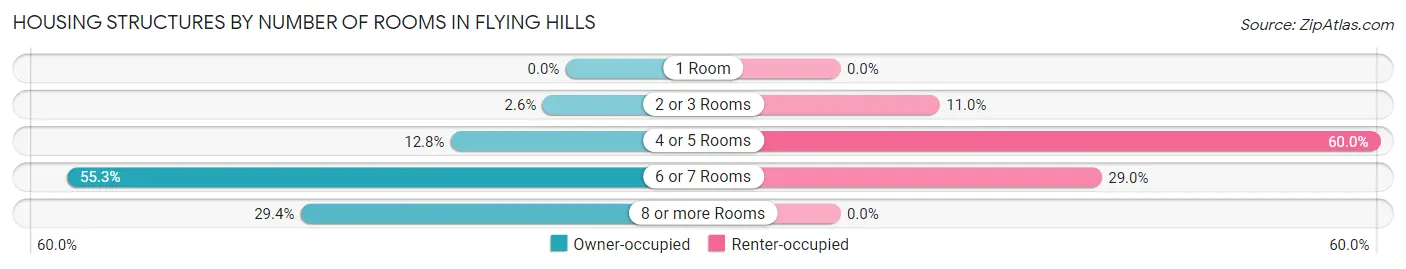
| Number of Rooms | Owner-occupied | Renter-occupied |
| 1 Room | 0 (0.0%) | 0 (0.0%) |
| 2 or 3 Rooms | 13 (2.5%) | 57 (11.0%) |
| 4 or 5 Rooms | 65 (12.8%) | 310 (60.0%) |
| 6 or 7 Rooms | 282 (55.3%) | 150 (29.0%) |
| 8 or more Rooms | 150 (29.4%) | 0 (0.0%) |
| Total | 510 (100.0%) | 517 (100.0%) |
Housing Structure by Heating Type in Flying Hills
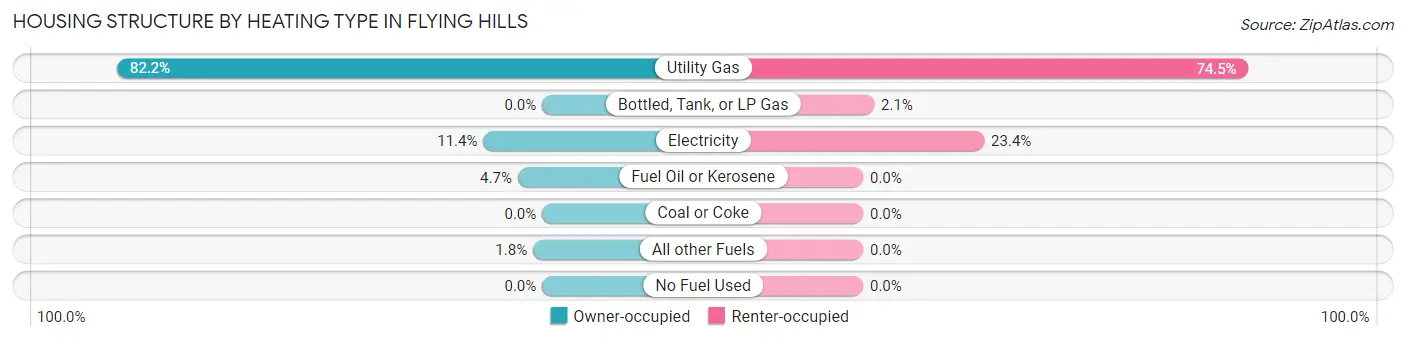
| Heating Type | Owner-occupied | Renter-occupied |
| Utility Gas | 419 (82.2%) | 385 (74.5%) |
| Bottled, Tank, or LP Gas | 0 (0.0%) | 11 (2.1%) |
| Electricity | 58 (11.4%) | 121 (23.4%) |
| Fuel Oil or Kerosene | 24 (4.7%) | 0 (0.0%) |
| Coal or Coke | 0 (0.0%) | 0 (0.0%) |
| All other Fuels | 9 (1.8%) | 0 (0.0%) |
| No Fuel Used | 0 (0.0%) | 0 (0.0%) |
| Total | 510 (100.0%) | 517 (100.0%) |
Household Vehicle Usage in Flying Hills
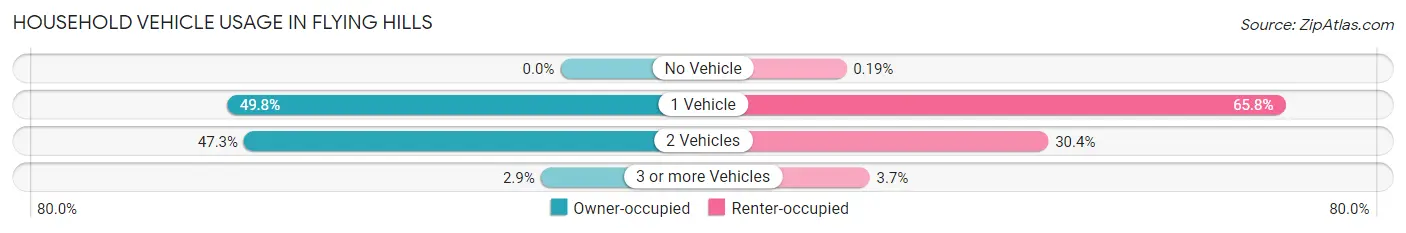
| Vehicles per Household | Owner-occupied | Renter-occupied |
| No Vehicle | 0 (0.0%) | 1 (0.2%) |
| 1 Vehicle | 254 (49.8%) | 340 (65.8%) |
| 2 Vehicles | 241 (47.2%) | 157 (30.4%) |
| 3 or more Vehicles | 15 (2.9%) | 19 (3.7%) |
| Total | 510 (100.0%) | 517 (100.0%) |
Real Estate & Mortgages in Flying Hills
Real Estate and Mortgage Overview in Flying Hills
| Characteristic | Without Mortgage | With Mortgage |
| Housing Units | 176 | 334 |
| Median Property Value | $250,700 | $213,400 |
| Median Household Income | $161,250 | $76 |
| Monthly Housing Costs | $888 | $16 |
| Real Estate Taxes | $4,750 | $40 |
Property Value by Mortgage Status in Flying Hills
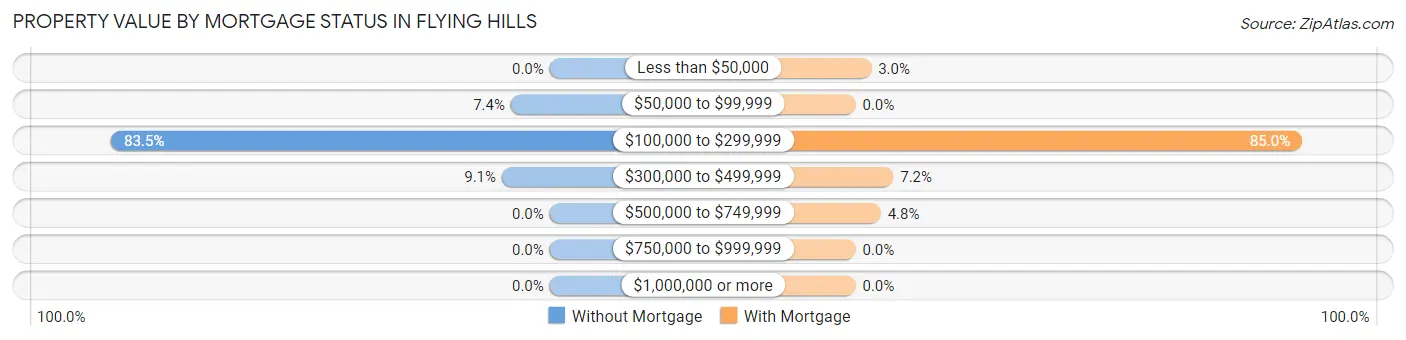
| Property Value | Without Mortgage | With Mortgage |
| Less than $50,000 | 0 (0.0%) | 10 (3.0%) |
| $50,000 to $99,999 | 13 (7.4%) | 0 (0.0%) |
| $100,000 to $299,999 | 147 (83.5%) | 284 (85.0%) |
| $300,000 to $499,999 | 16 (9.1%) | 24 (7.2%) |
| $500,000 to $749,999 | 0 (0.0%) | 16 (4.8%) |
| $750,000 to $999,999 | 0 (0.0%) | 0 (0.0%) |
| $1,000,000 or more | 0 (0.0%) | 0 (0.0%) |
| Total | 176 (100.0%) | 334 (100.0%) |
Household Income by Mortgage Status in Flying Hills
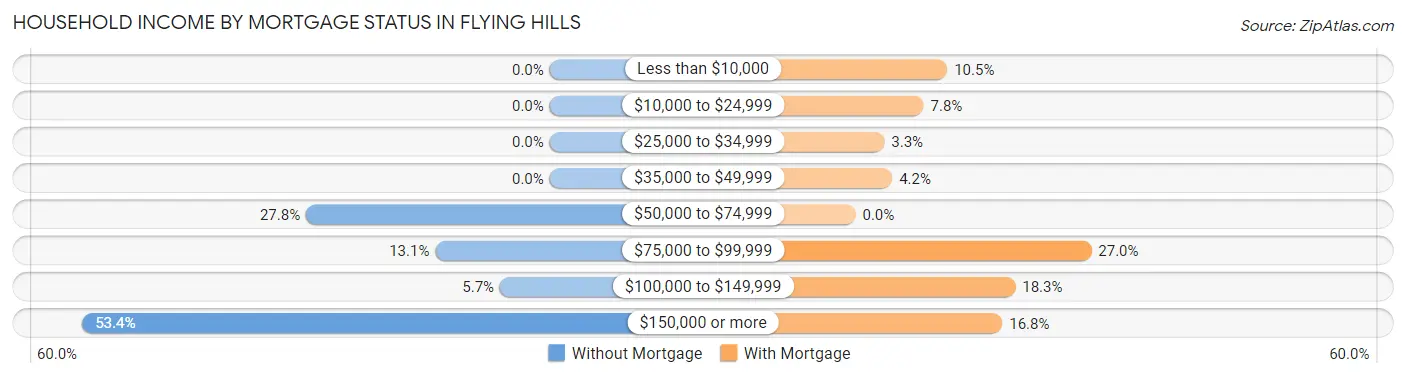
| Household Income | Without Mortgage | With Mortgage |
| Less than $10,000 | 0 (0.0%) | 35 (10.5%) |
| $10,000 to $24,999 | 0 (0.0%) | 26 (7.8%) |
| $25,000 to $34,999 | 0 (0.0%) | 11 (3.3%) |
| $35,000 to $49,999 | 0 (0.0%) | 14 (4.2%) |
| $50,000 to $74,999 | 49 (27.8%) | 0 (0.0%) |
| $75,000 to $99,999 | 23 (13.1%) | 90 (27.0%) |
| $100,000 to $149,999 | 10 (5.7%) | 61 (18.3%) |
| $150,000 or more | 94 (53.4%) | 56 (16.8%) |
| Total | 176 (100.0%) | 334 (100.0%) |
Property Value to Household Income Ratio in Flying Hills
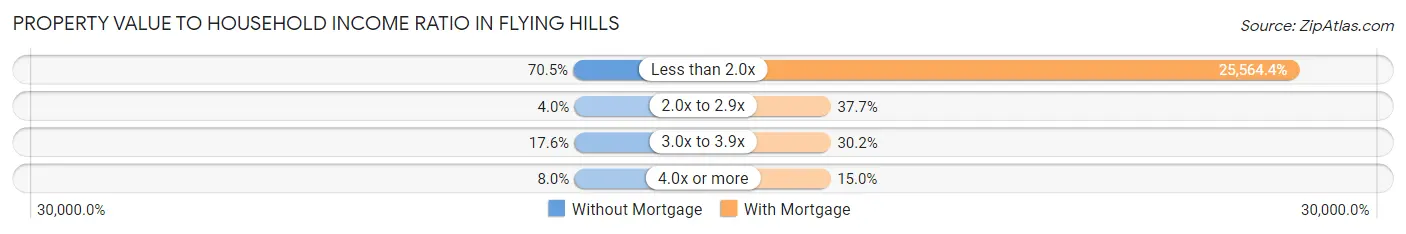
| Value-to-Income Ratio | Without Mortgage | With Mortgage |
| Less than 2.0x | 124 (70.5%) | 85,385 (25,564.4%) |
| 2.0x to 2.9x | 7 (4.0%) | 126 (37.7%) |
| 3.0x to 3.9x | 31 (17.6%) | 101 (30.2%) |
| 4.0x or more | 14 (8.0%) | 50 (15.0%) |
| Total | 176 (100.0%) | 334 (100.0%) |
Real Estate Taxes by Mortgage Status in Flying Hills
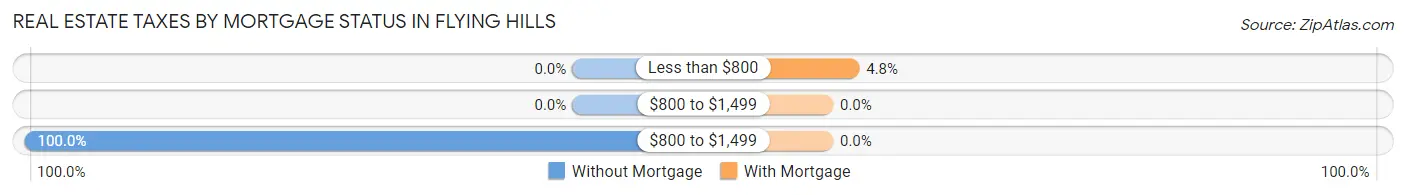
| Property Taxes | Without Mortgage | With Mortgage |
| Less than $800 | 0 (0.0%) | 16 (4.8%) |
| $800 to $1,499 | 0 (0.0%) | 0 (0.0%) |
| $800 to $1,499 | 176 (100.0%) | 0 (0.0%) |
| Total | 176 (100.0%) | 334 (100.0%) |
Health & Disability in Flying Hills
Health Insurance Coverage by Age in Flying Hills
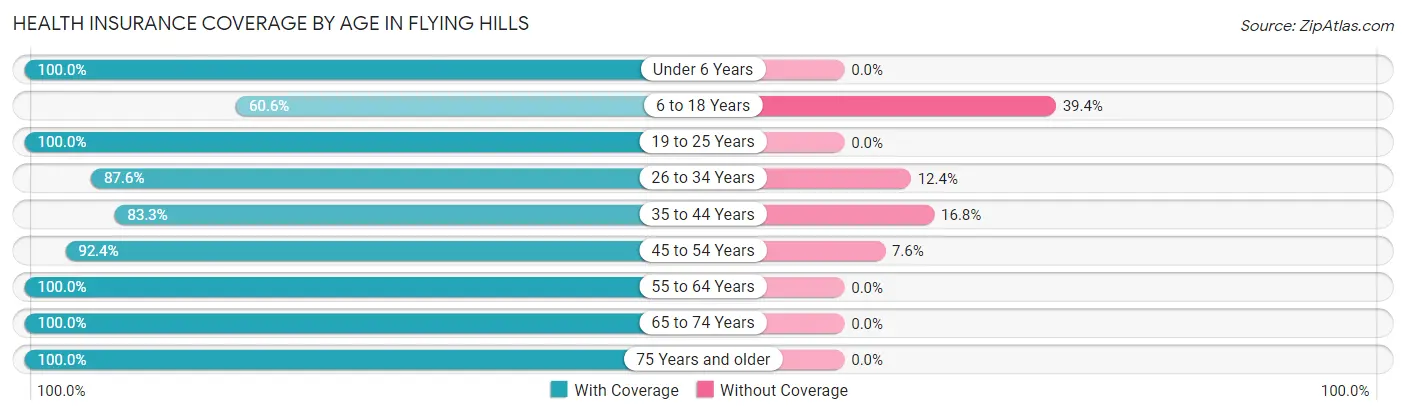
| Age Bracket | With Coverage | Without Coverage |
| Under 6 Years | 122 (100.0%) | 0 (0.0%) |
| 6 to 18 Years | 63 (60.6%) | 41 (39.4%) |
| 19 to 25 Years | 84 (100.0%) | 0 (0.0%) |
| 26 to 34 Years | 198 (87.6%) | 28 (12.4%) |
| 35 to 44 Years | 174 (83.3%) | 35 (16.8%) |
| 45 to 54 Years | 146 (92.4%) | 12 (7.6%) |
| 55 to 64 Years | 276 (100.0%) | 0 (0.0%) |
| 65 to 74 Years | 303 (100.0%) | 0 (0.0%) |
| 75 Years and older | 234 (100.0%) | 0 (0.0%) |
| Total | 1,600 (93.2%) | 116 (6.8%) |
Health Insurance Coverage by Citizenship Status in Flying Hills
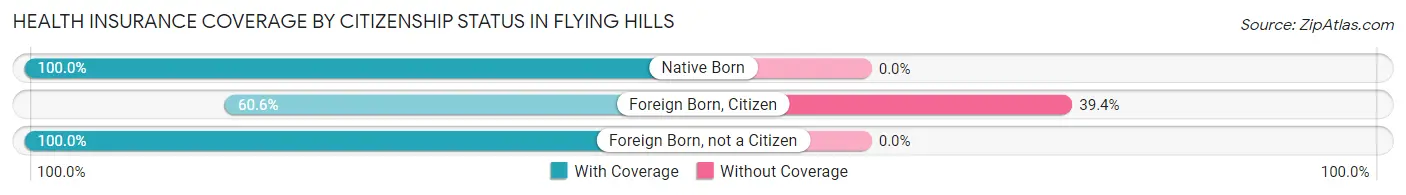
| Citizenship Status | With Coverage | Without Coverage |
| Native Born | 122 (100.0%) | 0 (0.0%) |
| Foreign Born, Citizen | 63 (60.6%) | 41 (39.4%) |
| Foreign Born, not a Citizen | 84 (100.0%) | 0 (0.0%) |
Health Insurance Coverage by Household Income in Flying Hills
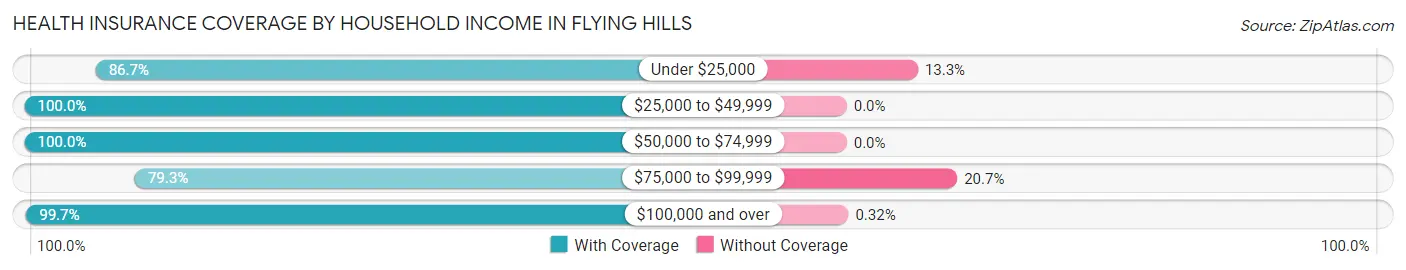
| Household Income | With Coverage | Without Coverage |
| Under $25,000 | 78 (86.7%) | 12 (13.3%) |
| $25,000 to $49,999 | 209 (100.0%) | 0 (0.0%) |
| $50,000 to $74,999 | 297 (100.0%) | 0 (0.0%) |
| $75,000 to $99,999 | 391 (79.3%) | 102 (20.7%) |
| $100,000 and over | 625 (99.7%) | 2 (0.3%) |
Public vs Private Health Insurance Coverage by Age in Flying Hills
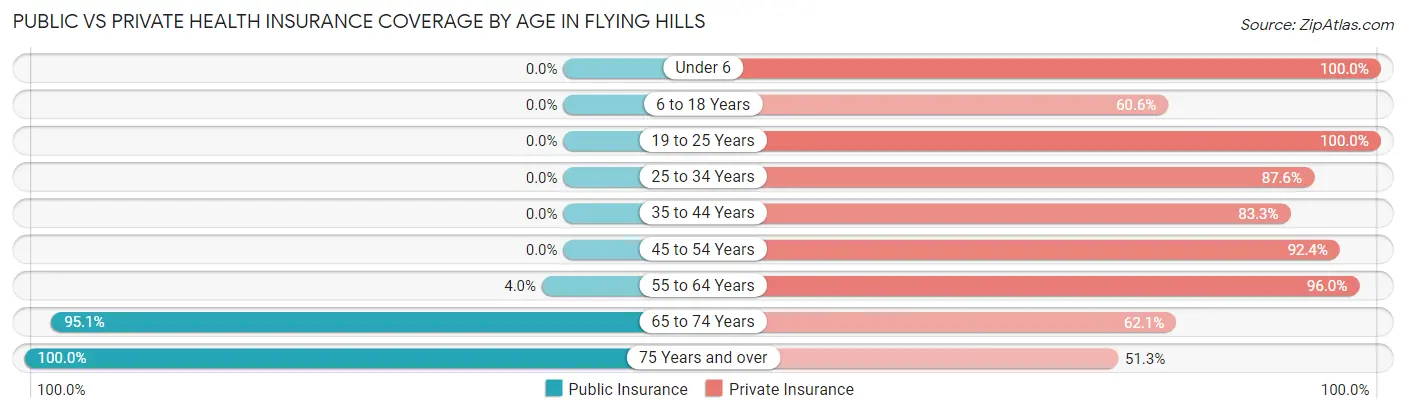
| Age Bracket | Public Insurance | Private Insurance |
| Under 6 | 0 (0.0%) | 122 (100.0%) |
| 6 to 18 Years | 0 (0.0%) | 63 (60.6%) |
| 19 to 25 Years | 0 (0.0%) | 84 (100.0%) |
| 25 to 34 Years | 0 (0.0%) | 198 (87.6%) |
| 35 to 44 Years | 0 (0.0%) | 174 (83.3%) |
| 45 to 54 Years | 0 (0.0%) | 146 (92.4%) |
| 55 to 64 Years | 11 (4.0%) | 265 (96.0%) |
| 65 to 74 Years | 288 (95.1%) | 188 (62.1%) |
| 75 Years and over | 234 (100.0%) | 120 (51.3%) |
| Total | 533 (31.1%) | 1,360 (79.2%) |
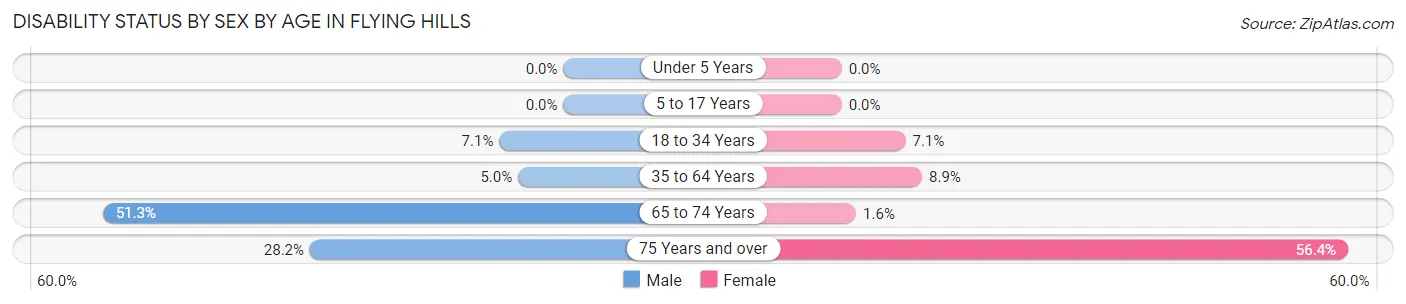
Disability Status by Sex by Age in Flying Hills
| Age Bracket | Male | Female |
| Under 5 Years | 0 (0.0%) | 0 (0.0%) |
| 5 to 17 Years | 0 (0.0%) | 0 (0.0%) |
| 18 to 34 Years | 13 (7.1%) | 12 (7.1%) |
| 35 to 64 Years | 20 (5.0%) | 22 (8.9%) |
| 65 to 74 Years | 59 (51.3%) | 3 (1.6%) |
| 75 Years and over | 35 (28.2%) | 62 (56.4%) |
Disability Class by Sex by Age in Flying Hills
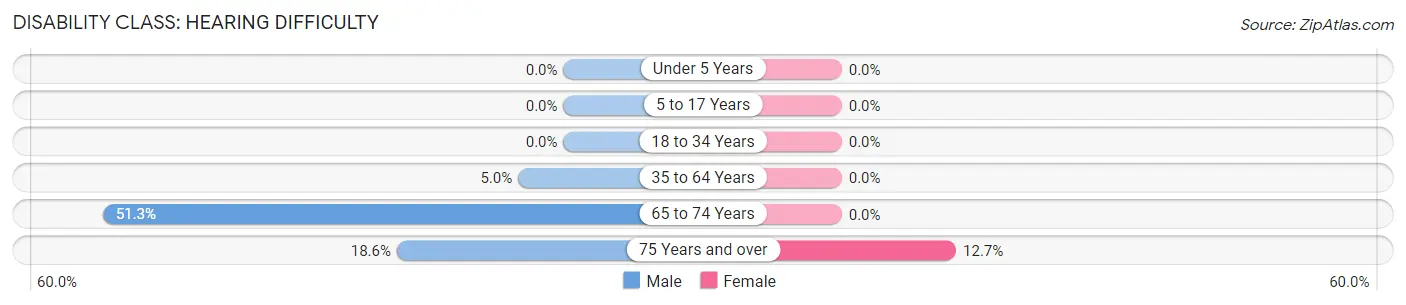
Disability Class: Hearing Difficulty
| Age Bracket | Male | Female |
| Under 5 Years | 0 (0.0%) | 0 (0.0%) |
| 5 to 17 Years | 0 (0.0%) | 0 (0.0%) |
| 18 to 34 Years | 0 (0.0%) | 0 (0.0%) |
| 35 to 64 Years | 20 (5.0%) | 0 (0.0%) |
| 65 to 74 Years | 59 (51.3%) | 0 (0.0%) |
| 75 Years and over | 23 (18.5%) | 14 (12.7%) |
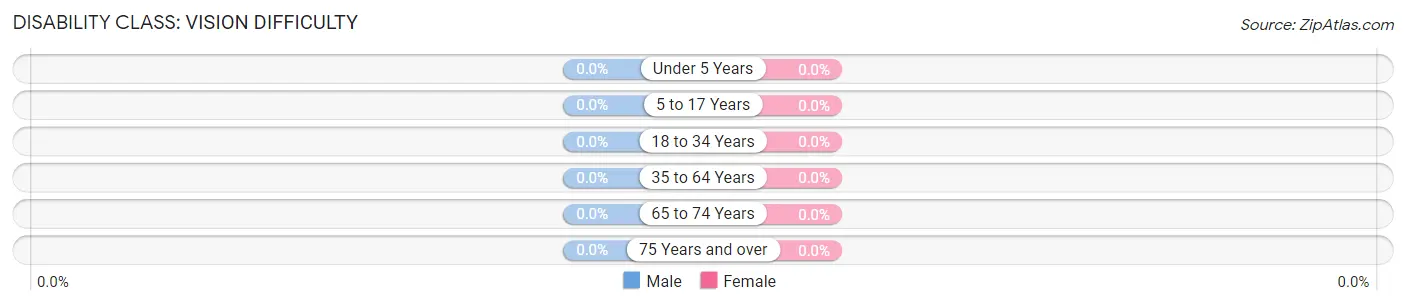
Disability Class: Vision Difficulty
| Age Bracket | Male | Female |
| Under 5 Years | 0 (0.0%) | 0 (0.0%) |
| 5 to 17 Years | 0 (0.0%) | 0 (0.0%) |
| 18 to 34 Years | 0 (0.0%) | 0 (0.0%) |
| 35 to 64 Years | 0 (0.0%) | 0 (0.0%) |
| 65 to 74 Years | 0 (0.0%) | 0 (0.0%) |
| 75 Years and over | 0 (0.0%) | 0 (0.0%) |
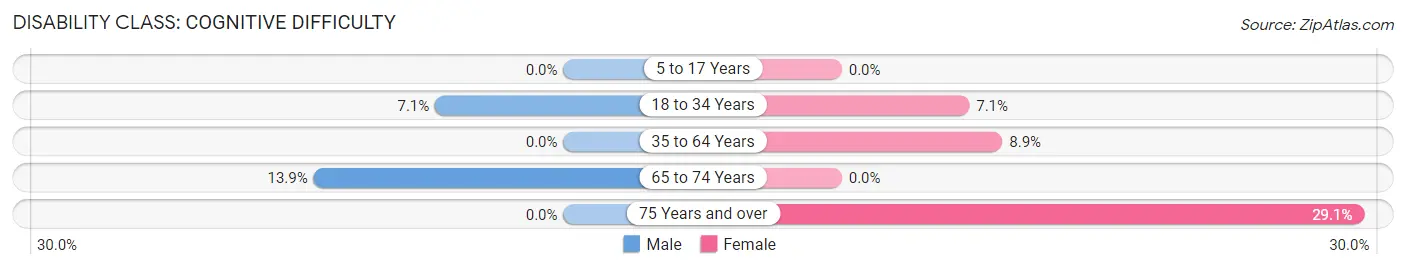
Disability Class: Cognitive Difficulty
| Age Bracket | Male | Female |
| 5 to 17 Years | 0 (0.0%) | 0 (0.0%) |
| 18 to 34 Years | 13 (7.1%) | 12 (7.1%) |
| 35 to 64 Years | 0 (0.0%) | 22 (8.9%) |
| 65 to 74 Years | 16 (13.9%) | 0 (0.0%) |
| 75 Years and over | 0 (0.0%) | 32 (29.1%) |
Disability Class: Ambulatory Difficulty
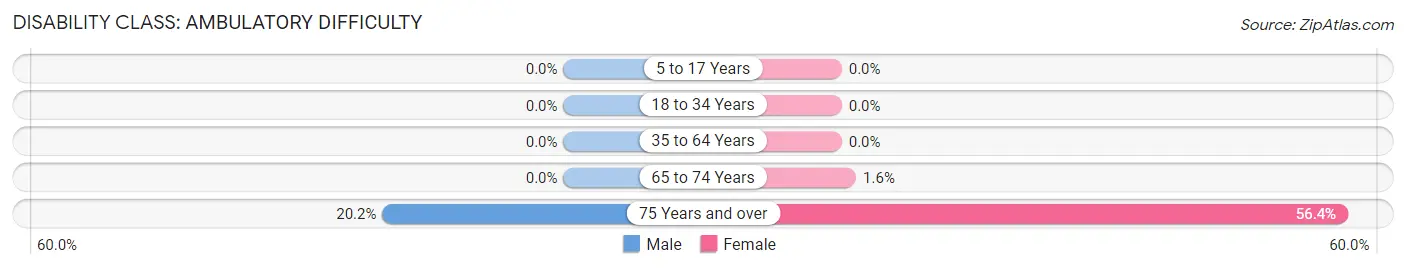
| Age Bracket | Male | Female |
| 5 to 17 Years | 0 (0.0%) | 0 (0.0%) |
| 18 to 34 Years | 0 (0.0%) | 0 (0.0%) |
| 35 to 64 Years | 0 (0.0%) | 0 (0.0%) |
| 65 to 74 Years | 0 (0.0%) | 3 (1.6%) |
| 75 Years and over | 25 (20.2%) | 62 (56.4%) |
Disability Class: Self-Care Difficulty
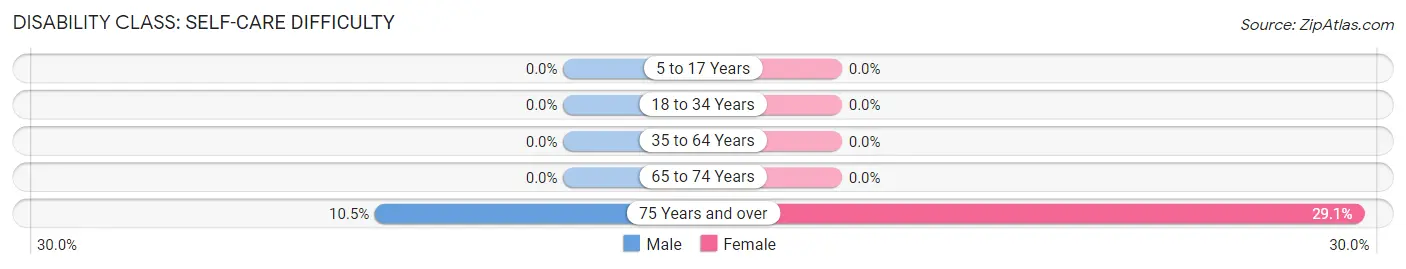
| Age Bracket | Male | Female |
| 5 to 17 Years | 0 (0.0%) | 0 (0.0%) |
| 18 to 34 Years | 0 (0.0%) | 0 (0.0%) |
| 35 to 64 Years | 0 (0.0%) | 0 (0.0%) |
| 65 to 74 Years | 0 (0.0%) | 0 (0.0%) |
| 75 Years and over | 13 (10.5%) | 32 (29.1%) |
Technology Access in Flying Hills
Computing Device Access in Flying Hills
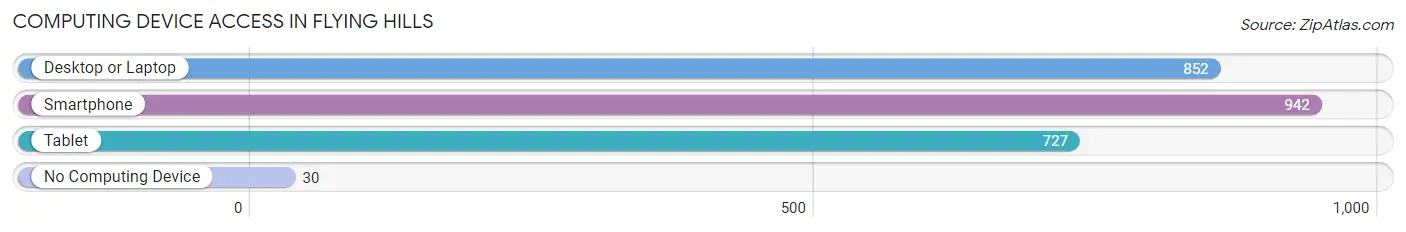
| Device Type | # Households | % Households |
| Desktop or Laptop | 852 | 83.0% |
| Smartphone | 942 | 91.7% |
| Tablet | 727 | 70.8% |
| No Computing Device | 30 | 2.9% |
| Total | 1,027 | 100.0% |
Internet Access in Flying Hills
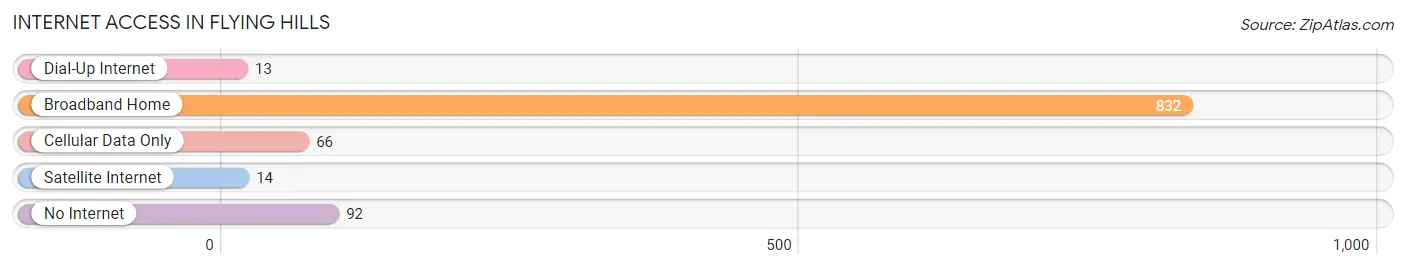
| Internet Type | # Households | % Households |
| Dial-Up Internet | 13 | 1.3% |
| Broadband Home | 832 | 81.0% |
| Cellular Data Only | 66 | 6.4% |
| Satellite Internet | 14 | 1.4% |
| No Internet | 92 | 9.0% |
| Total | 1,027 | 100.0% |
Flying Hills Summary
Hills, Pennsylvania is a small borough located in Montgomery County, Pennsylvania. It is situated in the southeastern part of the state, approximately 20 miles northwest of Philadelphia. The population of the borough was 2,845 at the 2010 census.
History
The area that is now known as Flying Hills was originally inhabited by the Lenni Lenape Native Americans. The first European settlers arrived in the area in the late 1700s. The area was originally known as “Fry’s Corner”, named after the Fry family who owned a large tract of land in the area. In 1845, the area was renamed “Flying Hills” after the local legend of a flying horse that was seen in the area.
The borough of Flying Hills was officially incorporated in 1891. The first mayor of the borough was William H. Fry, who served from 1891 to 1895. The borough was originally a farming community, but in the early 1900s, the area began to develop into a residential community.
Geography
Flying Hills is located at 40°10'45" North, 75°20'45" West (40.179167, -75.345833). It is situated in the southeastern part of Montgomery County, approximately 20 miles northwest of Philadelphia. The borough has a total area of 0.7 square miles, all of which is land.
The borough is bordered by Upper Providence Township to the north, Lower Providence Township to the east, Limerick Township to the south, and Upper Frederick Township to the west. The borough is located in the Perkiomen Creek watershed.
Economy
The economy of Flying Hills is largely based on the service industry. The borough is home to several small businesses, including restaurants, retail stores, and professional services. The borough is also home to a number of corporate offices, including those of the pharmaceutical company Merck & Co. and the financial services company Prudential Financial.
Demographics
As of the 2010 census, there were 2,845 people, 1,093 households, and 790 families residing in the borough. The population density was 4,093.3 people per square mile. The racial makeup of the borough was 94.2% White, 2.2% African American, 0.2% Native American, 1.2% Asian, 0.1% Pacific Islander, 0.9% from other races, and 1.2% from two or more races. Hispanic or Latino of any race were 2.7% of the population.
The median age in the borough was 43.2 years. 22.2% of residents were under the age of 18; 6.2% were between the ages of 18 and 24; 24.2% were from 25 to 44; 32.2% were from 45 to 64; and 15.2% were 65 years of age or older. The gender makeup of the borough was 48.2% male and 51.8% female.
The median income for a household in the borough was $76,944, and the median income for a family was $90,938. The per capita income for the borough was $35,945. About 2.2% of families and 3.2% of the population were below the poverty line, including 4.2% of those under age 18 and 2.2% of those age 65 or over.
Common Questions
What is Per Capita Income in Flying Hills?
Per Capita income in Flying Hills is $61,239.
What is the Median Family Income in Flying Hills?
Median Family Income in Flying Hills is $99,028.
What is the Median Household income in Flying Hills?
Median Household Income in Flying Hills is $87,586.
What is Income or Wage Gap in Flying Hills?
Income or Wage Gap in Flying Hills is 40.6%.
Women in Flying Hills earn 59.4 cents for every dollar earned by a man.
What is Inequality or Gini Index in Flying Hills?
Inequality or Gini Index in Flying Hills is 0.40.
What is the Total Population of Flying Hills?
Total Population of Flying Hills is 1,716.
What is the Total Male Population of Flying Hills?
Total Male Population of Flying Hills is 900.
What is the Total Female Population of Flying Hills?
Total Female Population of Flying Hills is 816.
What is the Ratio of Males per 100 Females in Flying Hills?
There are 110.29 Males per 100 Females in Flying Hills.
What is the Ratio of Females per 100 Males in Flying Hills?
There are 90.67 Females per 100 Males in Flying Hills.
What is the Median Population Age in Flying Hills?
Median Population Age in Flying Hills is 53.4 Years.
What is the Average Family Size in Flying Hills
Average Family Size in Flying Hills is 2.3 People.
What is the Average Household Size in Flying Hills
Average Household Size in Flying Hills is 1.7 People.
How Large is the Labor Force in Flying Hills?
There are 984 People in the Labor Forcein in Flying Hills.
What is the Percentage of People in the Labor Force in Flying Hills?
64.3% of People are in the Labor Force in Flying Hills.