Zip Codes with the Highest Percentage of Immigrants from Latin America in Scranton, PA
RELATED REPORTS & OPTIONS
Latin America
Scranton
Compare Zip Codes
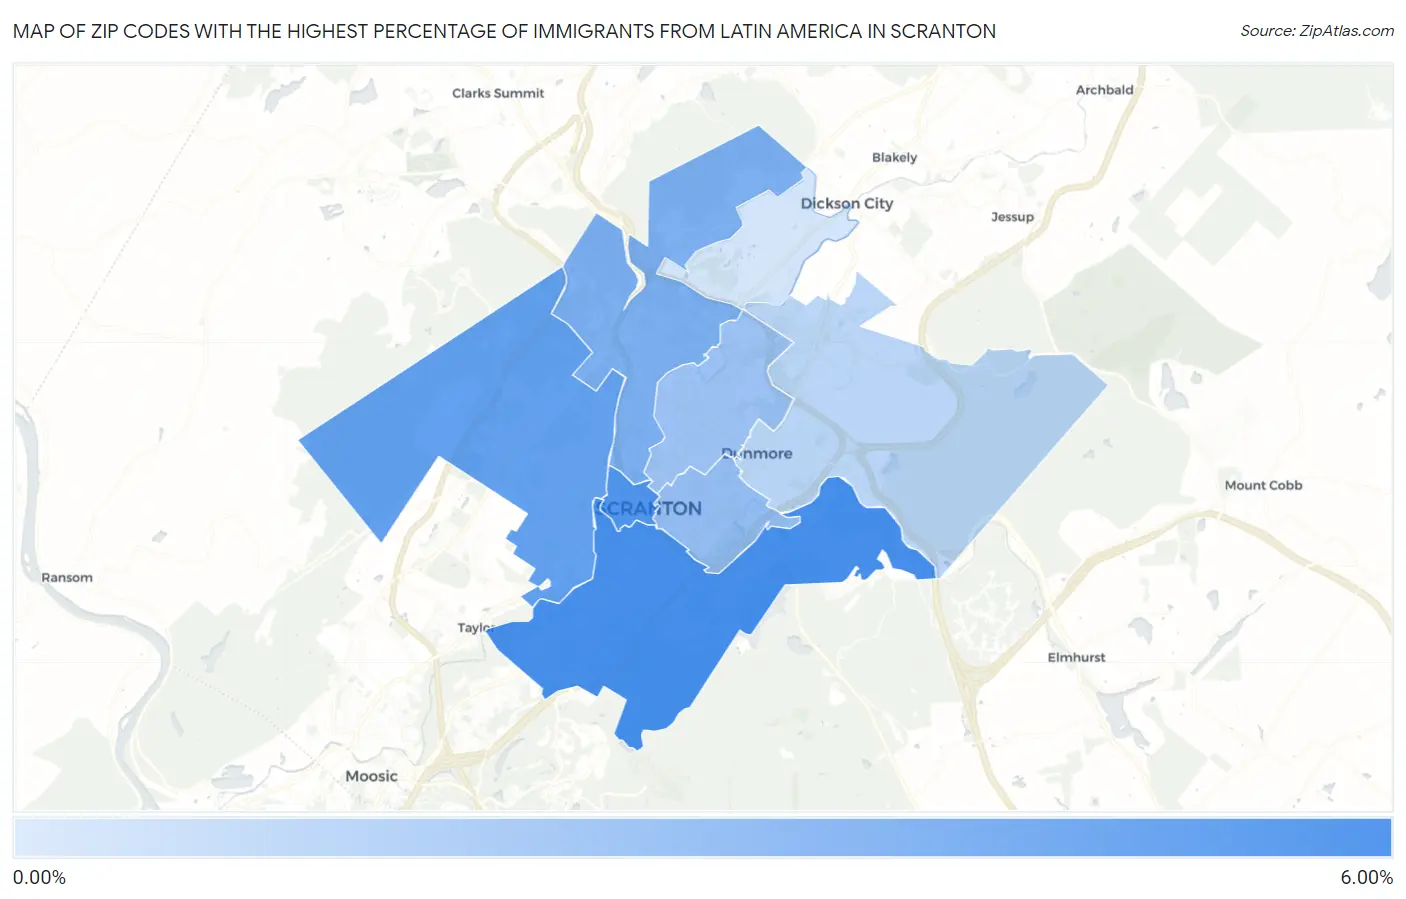
Map of Zip Codes with the Highest Percentage of Immigrants from Latin America in Scranton
0.33%
5.86%
Zip Codes with the Highest Percentage of Immigrants from Latin America in Scranton, PA
| Zip Code | Latin America | vs State | vs National | |
| 1. | 18505 | 5.86% | 2.31%(+3.55)#-1 | 6.84%(-0.976)#0 |
| 2. | 18503 | 5.45% | 2.31%(+3.13)#0 | 6.84%(-1.39)#1 |
| 3. | 18504 | 4.78% | 2.31%(+2.47)#1 | 6.84%(-2.06)#2 |
| 4. | 18508 | 3.77% | 2.31%(+1.46)#2 | 6.84%(-3.07)#3 |
| 5. | 18510 | 2.87% | 2.31%(+0.555)#88 | 6.84%(-3.97)#3,279 |
| 6. | 18509 | 2.46% | 2.31%(+0.146)#89 | 6.84%(-4.38)#3,280 |
| 7. | 18512 | 1.31% | 2.31%(-1.00)#90 | 6.84%(-5.53)#3,281 |
| 8. | 18519 | 0.33% | 2.31%(-1.98)#91 | 6.84%(-6.51)#3,282 |
1
Common Questions
What are the Top 5 Zip Codes with the Highest Percentage of Immigrants from Latin America in Scranton, PA?
Top 5 Zip Codes with the Highest Percentage of Immigrants from Latin America in Scranton, PA are:
What zip code has the Highest Percentage of Immigrants from Latin America in Scranton, PA?
18505 has the Highest Percentage of Immigrants from Latin America in Scranton, PA with 5.86%.
What is the Percentage of Immigrants from Latin America in Scranton, PA?
Percentage of Immigrants from Latin America in Scranton is 4.39%.
What is the Percentage of Immigrants from Latin America in Pennsylvania?
Percentage of Immigrants from Latin America in Pennsylvania is 2.31%.
What is the Percentage of Immigrants from Latin America in the United States?
Percentage of Immigrants from Latin America in the United States is 6.84%.