Norvelt, PA Map & Demographics
Norvelt Map
Norvelt Overview
$34,338
PER CAPITA INCOME
$75,227
AVG FAMILY INCOME
$57,875
AVG HOUSEHOLD INCOME
41.8%
WAGE / INCOME GAP [ % ]
58.2¢/ $1
WAGE / INCOME GAP [ $ ]
0.35
INEQUALITY / GINI INDEX
1,005
TOTAL POPULATION
478
MALE POPULATION
527
FEMALE POPULATION
90.70
MALES / 100 FEMALES
110.25
FEMALES / 100 MALES
53.5
MEDIAN AGE
2.5
AVG FAMILY SIZE
2.0
AVG HOUSEHOLD SIZE
469
LABOR FORCE [ PEOPLE ]
52.1%
PERCENT IN LABOR FORCE
Norvelt Zip Codes
Norvelt Area Codes
Income in Norvelt
Income Overview in Norvelt
Per Capita Income in Norvelt is $34,338, while median incomes of families and households are $75,227 and $57,875 respectively.
| Characteristic | Number | Measure |
| Per Capita Income | 1,005 | $34,338 |
| Median Family Income | 332 | $75,227 |
| Mean Family Income | 332 | $86,553 |
| Median Household Income | 489 | $57,875 |
| Mean Household Income | 489 | $71,070 |
| Income Deficit | 332 | $0 |
| Wage / Income Gap (%) | 1,005 | 41.78% |
| Wage / Income Gap ($) | 1,005 | 58.22¢ per $1 |
| Gini / Inequality Index | 1,005 | 0.35 |
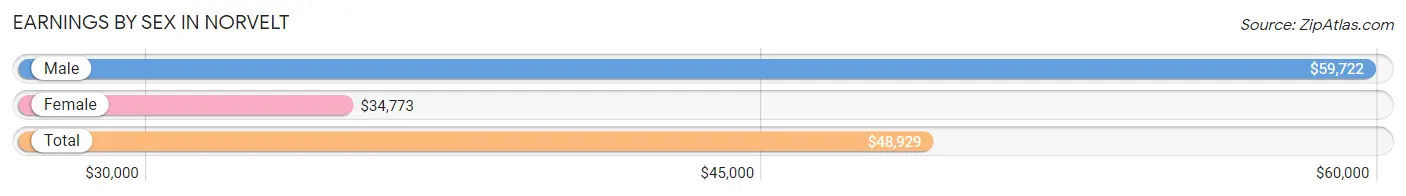
Earnings by Sex in Norvelt
Average Earnings in Norvelt are $48,929, $59,722 for men and $34,773 for women, a difference of 41.8%.
| Sex | Number | Average Earnings |
| Male | 246 (49.8%) | $59,722 |
| Female | 248 (50.2%) | $34,773 |
| Total | 494 (100.0%) | $48,929 |
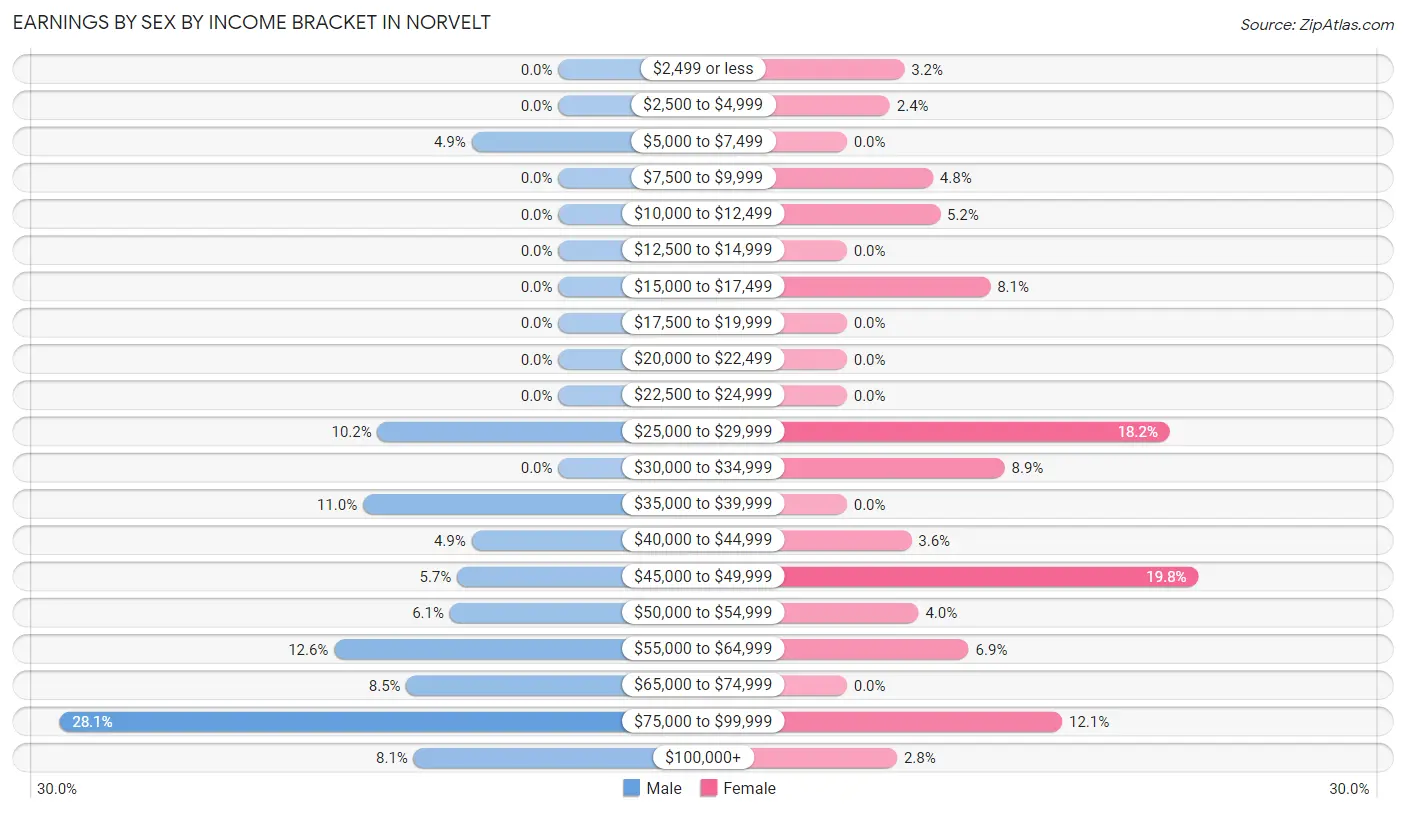
Earnings by Sex by Income Bracket in Norvelt
The most common earnings brackets in Norvelt are $75,000 to $99,999 for men (69 | 28.1%) and $45,000 to $49,999 for women (49 | 19.8%).
| Income | Male | Female |
| $2,499 or less | 0 (0.0%) | 8 (3.2%) |
| $2,500 to $4,999 | 0 (0.0%) | 6 (2.4%) |
| $5,000 to $7,499 | 12 (4.9%) | 0 (0.0%) |
| $7,500 to $9,999 | 0 (0.0%) | 12 (4.8%) |
| $10,000 to $12,499 | 0 (0.0%) | 13 (5.2%) |
| $12,500 to $14,999 | 0 (0.0%) | 0 (0.0%) |
| $15,000 to $17,499 | 0 (0.0%) | 20 (8.1%) |
| $17,500 to $19,999 | 0 (0.0%) | 0 (0.0%) |
| $20,000 to $22,499 | 0 (0.0%) | 0 (0.0%) |
| $22,500 to $24,999 | 0 (0.0%) | 0 (0.0%) |
| $25,000 to $29,999 | 25 (10.2%) | 45 (18.1%) |
| $30,000 to $34,999 | 0 (0.0%) | 22 (8.9%) |
| $35,000 to $39,999 | 27 (11.0%) | 0 (0.0%) |
| $40,000 to $44,999 | 12 (4.9%) | 9 (3.6%) |
| $45,000 to $49,999 | 14 (5.7%) | 49 (19.8%) |
| $50,000 to $54,999 | 15 (6.1%) | 10 (4.0%) |
| $55,000 to $64,999 | 31 (12.6%) | 17 (6.9%) |
| $65,000 to $74,999 | 21 (8.5%) | 0 (0.0%) |
| $75,000 to $99,999 | 69 (28.1%) | 30 (12.1%) |
| $100,000+ | 20 (8.1%) | 7 (2.8%) |
| Total | 246 (100.0%) | 248 (100.0%) |
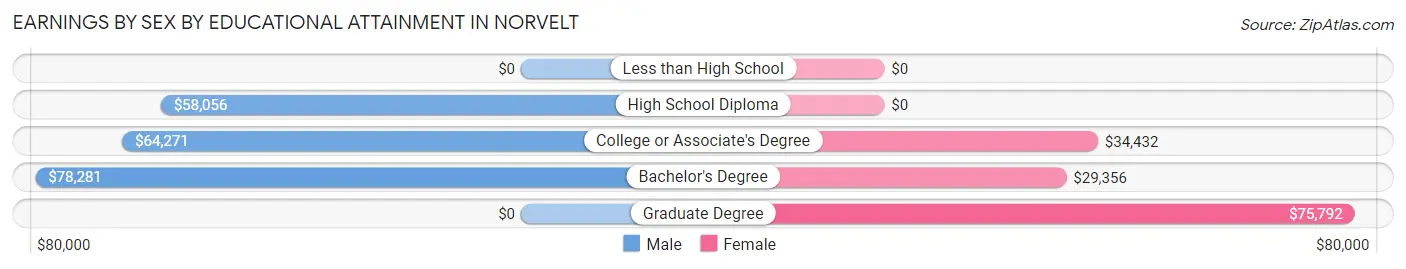
Earnings by Sex by Educational Attainment in Norvelt
Average earnings in Norvelt are $63,333 for men and $43,889 for women, a difference of 30.7%. Men with an educational attainment of bachelor's degree enjoy the highest average annual earnings of $78,281, while those with high school diploma education earn the least with $58,056. Women with an educational attainment of graduate degree earn the most with the average annual earnings of $75,792, while those with bachelor's degree education have the smallest earnings of $29,356.
| Educational Attainment | Male Income | Female Income |
| Less than High School | - | - |
| High School Diploma | $58,056 | $0 |
| College or Associate's Degree | $64,271 | $34,432 |
| Bachelor's Degree | $78,281 | $29,356 |
| Graduate Degree | - | - |
| Total | $63,333 | $43,889 |
Family Income in Norvelt
Family Income Brackets in Norvelt
According to the Norvelt family income data, there are 149 families falling into the $100,000 to $149,999 income range, which is the most common income bracket and makes up 44.9% of all families.
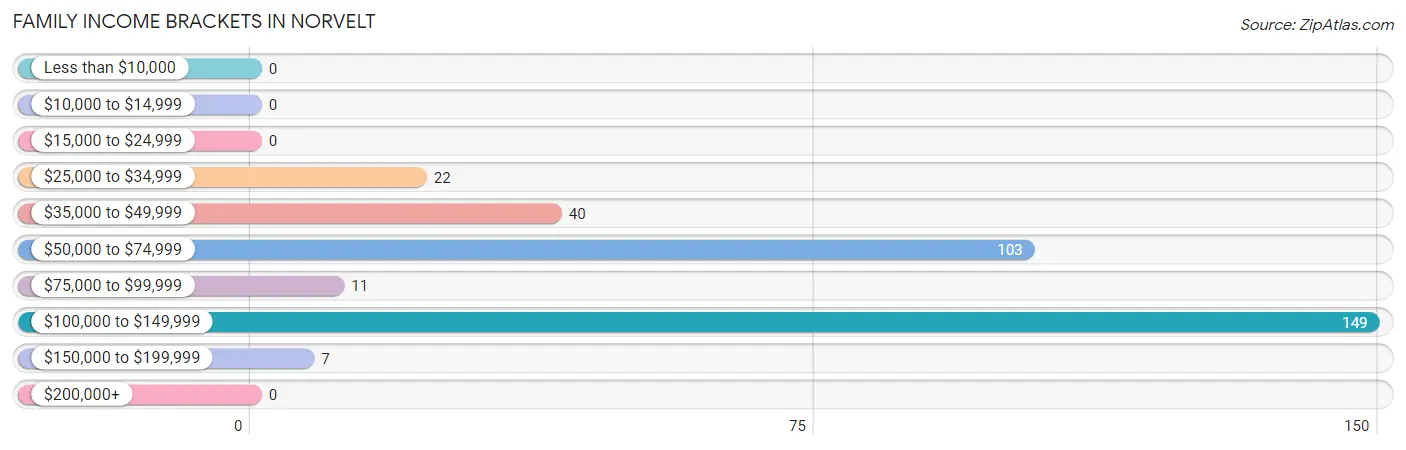
| Income Bracket | # Families | % Families |
| Less than $10,000 | 0 | 0.0% |
| $10,000 to $14,999 | 0 | 0.0% |
| $15,000 to $24,999 | 0 | 0.0% |
| $25,000 to $34,999 | 22 | 6.6% |
| $35,000 to $49,999 | 40 | 12.0% |
| $50,000 to $74,999 | 103 | 31.0% |
| $75,000 to $99,999 | 11 | 3.3% |
| $100,000 to $149,999 | 149 | 44.9% |
| $150,000 to $199,999 | 7 | 2.1% |
| $200,000+ | 0 | 0.0% |
Family Income by Famaliy Size in Norvelt
4-person families (67 | 20.2%) account for the highest median family income in Norvelt with $134,494 per family, while 3-person families (31 | 9.3%) have the highest median income of $37,743 per family member.
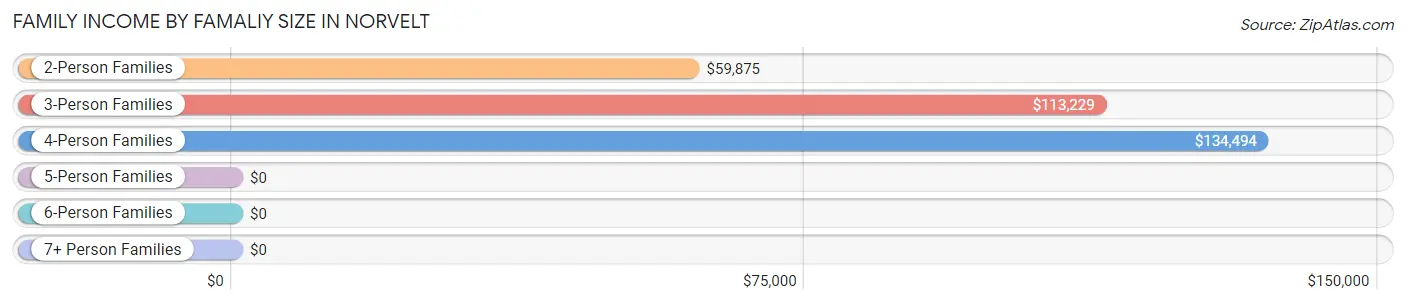
| Income Bracket | # Families | Median Income |
| 2-Person Families | 225 (67.8%) | $59,875 |
| 3-Person Families | 31 (9.3%) | $113,229 |
| 4-Person Families | 67 (20.2%) | $134,494 |
| 5-Person Families | 0 (0.0%) | $0 |
| 6-Person Families | 9 (2.7%) | $0 |
| 7+ Person Families | 0 (0.0%) | $0 |
| Total | 332 (100.0%) | $75,227 |
Family Income by Number of Earners in Norvelt
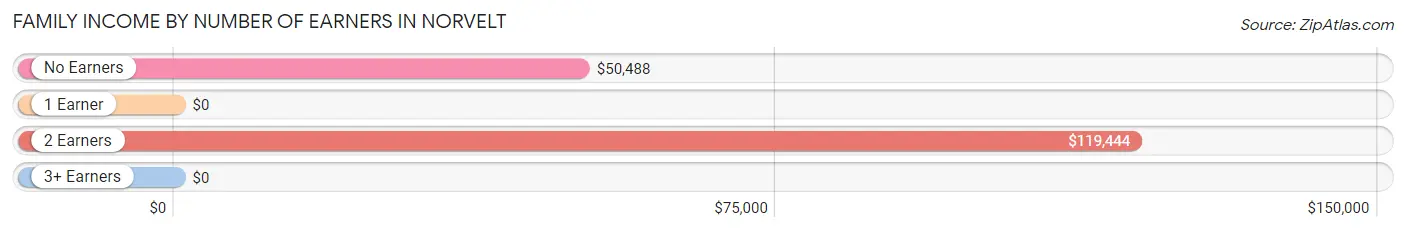
| Number of Earners | # Families | Median Income |
| No Earners | 116 (34.9%) | $50,488 |
| 1 Earner | 21 (6.3%) | $0 |
| 2 Earners | 174 (52.4%) | $119,444 |
| 3+ Earners | 21 (6.3%) | $0 |
| Total | 332 (100.0%) | $75,227 |
Household Income in Norvelt
Household Income Brackets in Norvelt
With 169 households falling in the category, the $100,000 to $149,999 income range is the most frequent in Norvelt, accounting for 34.6% of all households.
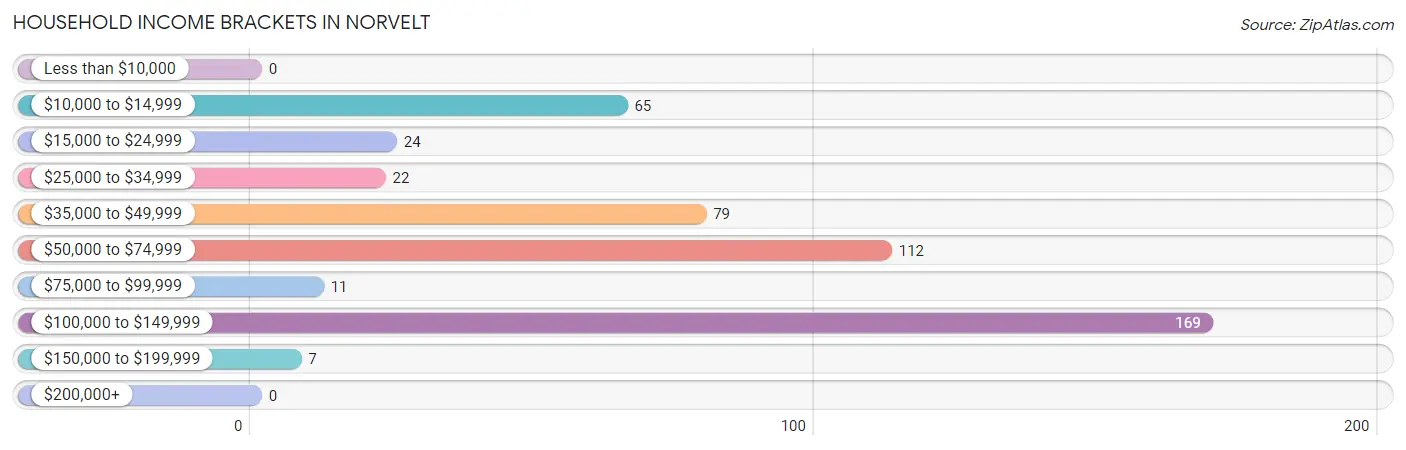
| Income Bracket | # Households | % Households |
| Less than $10,000 | 0 | 0.0% |
| $10,000 to $14,999 | 65 | 13.3% |
| $15,000 to $24,999 | 24 | 4.9% |
| $25,000 to $34,999 | 22 | 4.5% |
| $35,000 to $49,999 | 79 | 16.2% |
| $50,000 to $74,999 | 112 | 22.9% |
| $75,000 to $99,999 | 11 | 2.2% |
| $100,000 to $149,999 | 169 | 34.6% |
| $150,000 to $199,999 | 7 | 1.4% |
| $200,000+ | 0 | 0.0% |
Household Income by Householder Age in Norvelt
The median household income in Norvelt is $57,875, with the highest median household income of $133,661 found in the 25 to 44 years age bracket for the primary householder. A total of 109 households (22.3%) fall into this category.
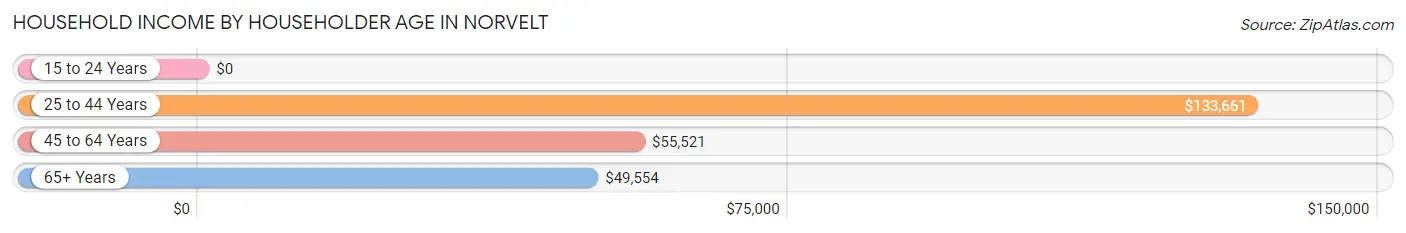
| Income Bracket | # Households | Median Income |
| 15 to 24 Years | 0 (0.0%) | $0 |
| 25 to 44 Years | 109 (22.3%) | $133,661 |
| 45 to 64 Years | 221 (45.2%) | $55,521 |
| 65+ Years | 159 (32.5%) | $49,554 |
| Total | 489 (100.0%) | $57,875 |
Poverty in Norvelt
Income Below Poverty by Sex and Age in Norvelt
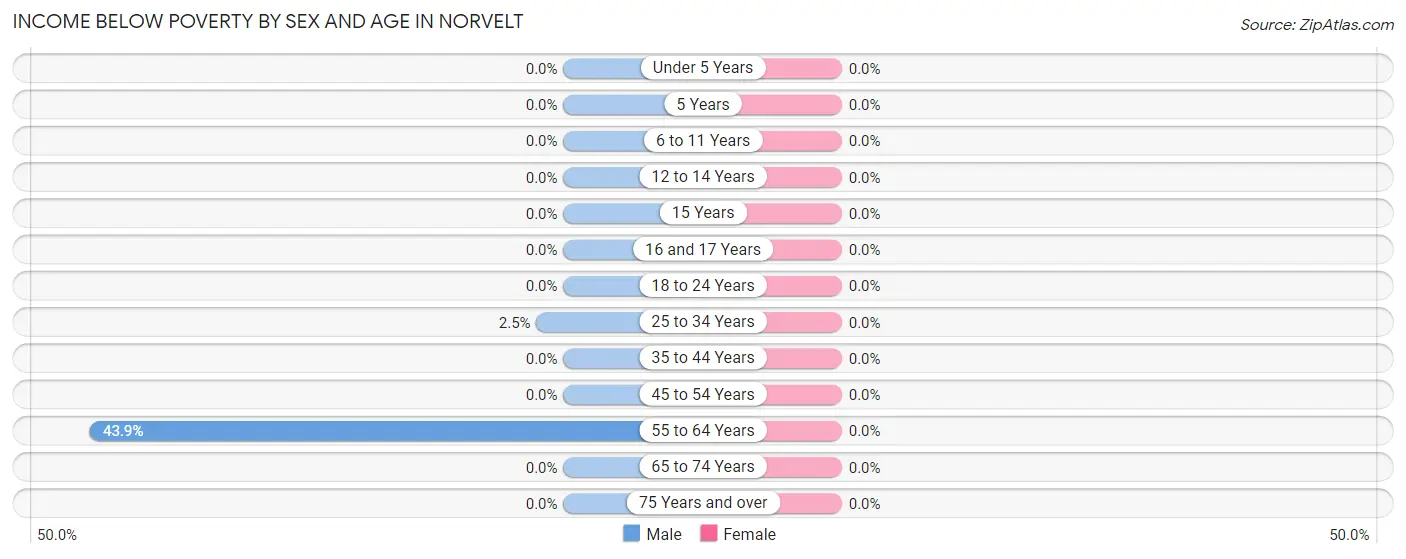
| Age Bracket | Male | Female |
| Under 5 Years | 0 (0.0%) | 0 (0.0%) |
| 5 Years | 0 (0.0%) | 0 (0.0%) |
| 6 to 11 Years | 0 (0.0%) | 0 (0.0%) |
| 12 to 14 Years | 0 (0.0%) | 0 (0.0%) |
| 15 Years | 0 (0.0%) | 0 (0.0%) |
| 16 and 17 Years | 0 (0.0%) | 0 (0.0%) |
| 18 to 24 Years | 0 (0.0%) | 0 (0.0%) |
| 25 to 34 Years | 1 (2.5%) | 0 (0.0%) |
| 35 to 44 Years | 0 (0.0%) | 0 (0.0%) |
| 45 to 54 Years | 0 (0.0%) | 0 (0.0%) |
| 55 to 64 Years | 65 (43.9%) | 0 (0.0%) |
| 65 to 74 Years | 0 (0.0%) | 0 (0.0%) |
| 75 Years and over | 0 (0.0%) | 0 (0.0%) |
| Total | 66 (13.8%) | 0 (0.0%) |
Income Above Poverty by Sex and Age in Norvelt
According to the poverty statistics in Norvelt, males aged 5 years and females aged 6 to 11 years are the age groups that are most secure financially, with 100.0% of males and 100.0% of females in these age groups living above the poverty line.
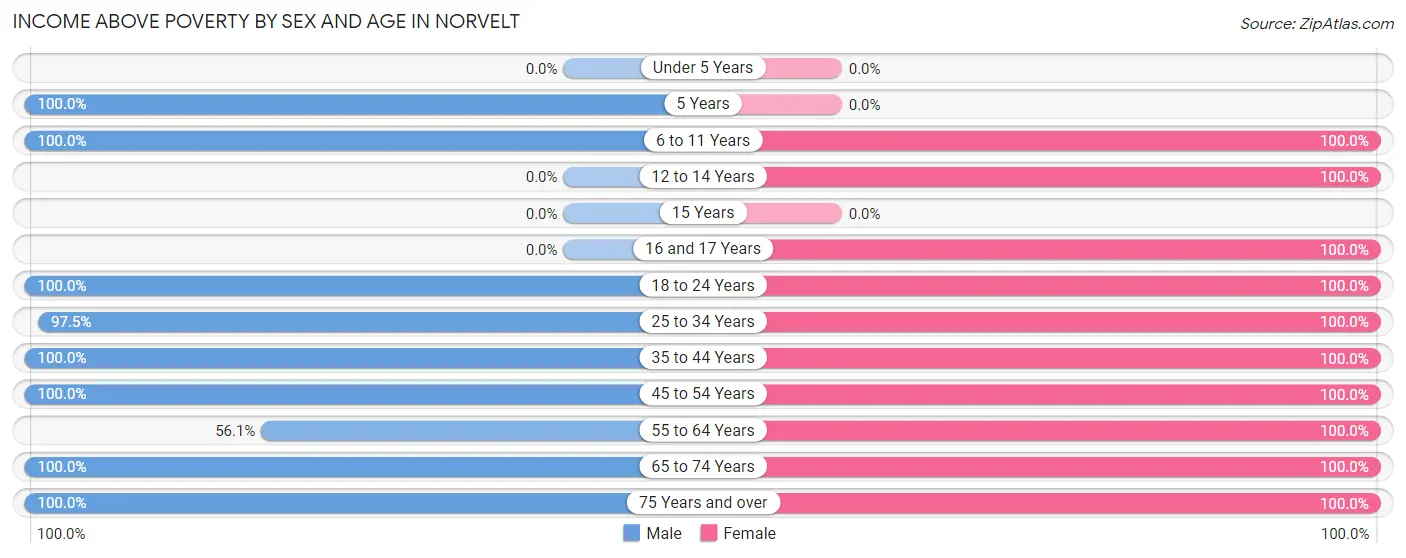
| Age Bracket | Male | Female |
| Under 5 Years | 0 (0.0%) | 0 (0.0%) |
| 5 Years | 7 (100.0%) | 0 (0.0%) |
| 6 to 11 Years | 27 (100.0%) | 9 (100.0%) |
| 12 to 14 Years | 0 (0.0%) | 62 (100.0%) |
| 15 Years | 0 (0.0%) | 0 (0.0%) |
| 16 and 17 Years | 0 (0.0%) | 37 (100.0%) |
| 18 to 24 Years | 10 (100.0%) | 6 (100.0%) |
| 25 to 34 Years | 39 (97.5%) | 33 (100.0%) |
| 35 to 44 Years | 61 (100.0%) | 84 (100.0%) |
| 45 to 54 Years | 89 (100.0%) | 72 (100.0%) |
| 55 to 64 Years | 83 (56.1%) | 53 (100.0%) |
| 65 to 74 Years | 66 (100.0%) | 105 (100.0%) |
| 75 Years and over | 30 (100.0%) | 66 (100.0%) |
| Total | 412 (86.2%) | 527 (100.0%) |
Income Below Poverty Among Married-Couple Families in Norvelt
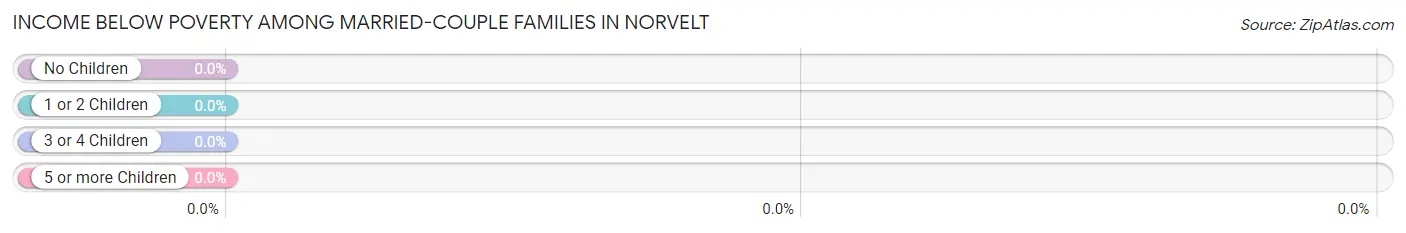
| Children | Above Poverty | Below Poverty |
| No Children | 201 (100.0%) | 0 (0.0%) |
| 1 or 2 Children | 83 (100.0%) | 0 (0.0%) |
| 3 or 4 Children | 0 (0.0%) | 0 (0.0%) |
| 5 or more Children | 0 (0.0%) | 0 (0.0%) |
| Total | 284 (100.0%) | 0 (0.0%) |
Income Below Poverty Among Single-Parent Households in Norvelt
| Children | Single Father | Single Mother |
| No Children | 0 (0.0%) | 0 (0.0%) |
| 1 or 2 Children | 0 (0.0%) | 0 (0.0%) |
| 3 or 4 Children | 0 (0.0%) | 0 (0.0%) |
| 5 or more Children | 0 (0.0%) | 0 (0.0%) |
| Total | 0 (0.0%) | 0 (0.0%) |
Income Below Poverty Among Married-Couple vs Single-Parent Households in Norvelt
| Children | Married-Couple Families | Single-Parent Households |
| No Children | 0 (0.0%) | 0 (0.0%) |
| 1 or 2 Children | 0 (0.0%) | 0 (0.0%) |
| 3 or 4 Children | 0 (0.0%) | 0 (0.0%) |
| 5 or more Children | 0 (0.0%) | 0 (0.0%) |
| Total | 0 (0.0%) | 0 (0.0%) |
Race in Norvelt
The most populous races in Norvelt are White / Caucasian (989 | 98.4%), Two or more Races (15 | 1.5%), and Black / African American (1 | 0.1%).
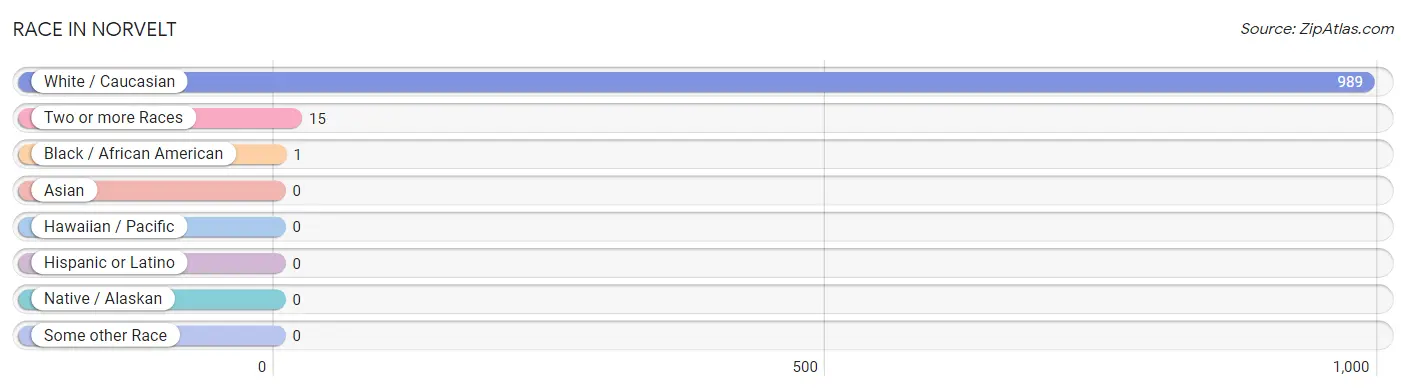
| Race | # Population | % Population |
| Asian | 0 | 0.0% |
| Black / African American | 1 | 0.1% |
| Hawaiian / Pacific | 0 | 0.0% |
| Hispanic or Latino | 0 | 0.0% |
| Native / Alaskan | 0 | 0.0% |
| White / Caucasian | 989 | 98.4% |
| Two or more Races | 15 | 1.5% |
| Some other Race | 0 | 0.0% |
| Total | 1,005 | 100.0% |
Ancestry in Norvelt
The most populous ancestries reported in Norvelt are German (284 | 28.3%), Irish (215 | 21.4%), Italian (165 | 16.4%), American (79 | 7.9%), and Slovak (71 | 7.1%), together accounting for 81.0% of all Norvelt residents.
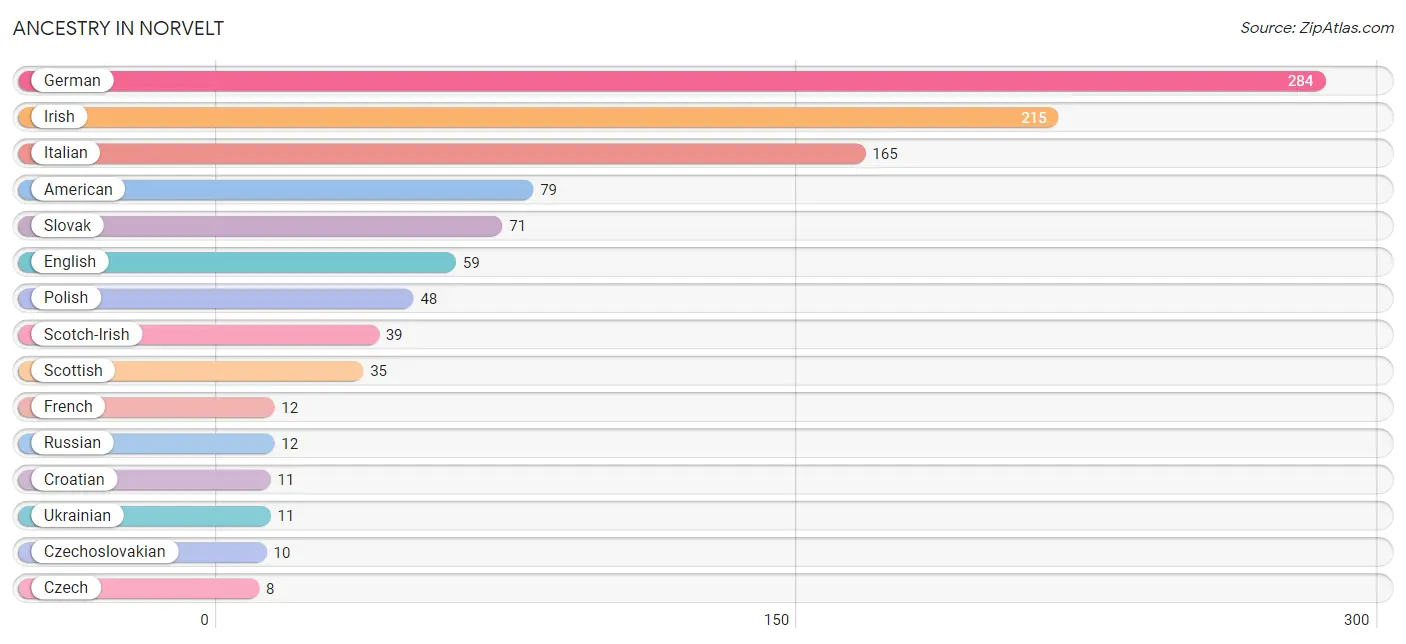
| Ancestry | # Population | % Population |
| American | 79 | 7.9% |
| Croatian | 11 | 1.1% |
| Czech | 8 | 0.8% |
| Czechoslovakian | 10 | 1.0% |
| English | 59 | 5.9% |
| French | 12 | 1.2% |
| German | 284 | 28.3% |
| Irish | 215 | 21.4% |
| Italian | 165 | 16.4% |
| Polish | 48 | 4.8% |
| Russian | 12 | 1.2% |
| Scotch-Irish | 39 | 3.9% |
| Scottish | 35 | 3.5% |
| Slovak | 71 | 7.1% |
| Ukrainian | 11 | 1.1% | View All 15 Rows |
Immigrants in Norvelt

| Immigration Origin | # Population | % Population | View All 0 Rows |
Sex and Age in Norvelt
Sex and Age in Norvelt
The most populous age groups in Norvelt are 60 to 64 Years (123 | 25.7%) for men and 70 to 74 Years (79 | 15.0%) for women.
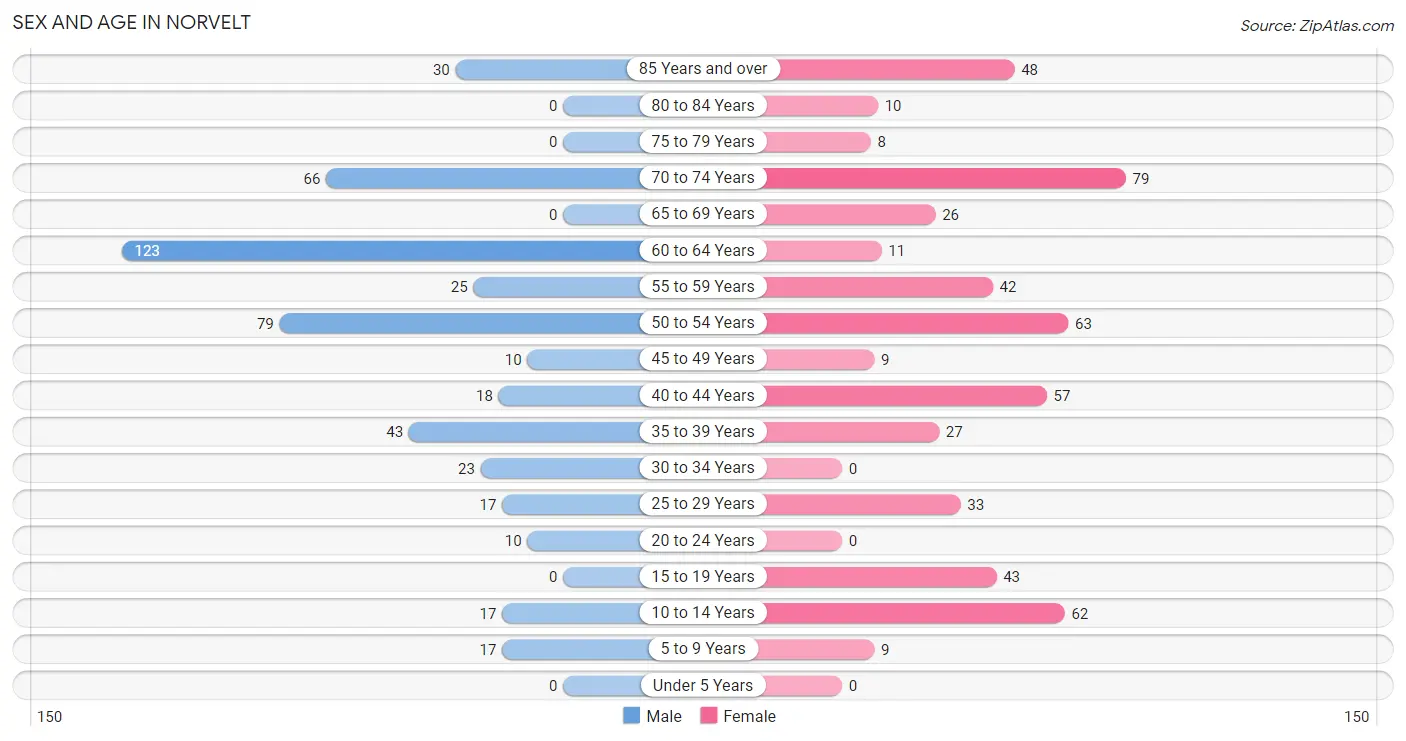
| Age Bracket | Male | Female |
| Under 5 Years | 0 (0.0%) | 0 (0.0%) |
| 5 to 9 Years | 17 (3.6%) | 9 (1.7%) |
| 10 to 14 Years | 17 (3.6%) | 62 (11.8%) |
| 15 to 19 Years | 0 (0.0%) | 43 (8.2%) |
| 20 to 24 Years | 10 (2.1%) | 0 (0.0%) |
| 25 to 29 Years | 17 (3.6%) | 33 (6.3%) |
| 30 to 34 Years | 23 (4.8%) | 0 (0.0%) |
| 35 to 39 Years | 43 (9.0%) | 27 (5.1%) |
| 40 to 44 Years | 18 (3.8%) | 57 (10.8%) |
| 45 to 49 Years | 10 (2.1%) | 9 (1.7%) |
| 50 to 54 Years | 79 (16.5%) | 63 (11.9%) |
| 55 to 59 Years | 25 (5.2%) | 42 (8.0%) |
| 60 to 64 Years | 123 (25.7%) | 11 (2.1%) |
| 65 to 69 Years | 0 (0.0%) | 26 (4.9%) |
| 70 to 74 Years | 66 (13.8%) | 79 (15.0%) |
| 75 to 79 Years | 0 (0.0%) | 8 (1.5%) |
| 80 to 84 Years | 0 (0.0%) | 10 (1.9%) |
| 85 Years and over | 30 (6.3%) | 48 (9.1%) |
| Total | 478 (100.0%) | 527 (100.0%) |
Families and Households in Norvelt
Median Family Size in Norvelt
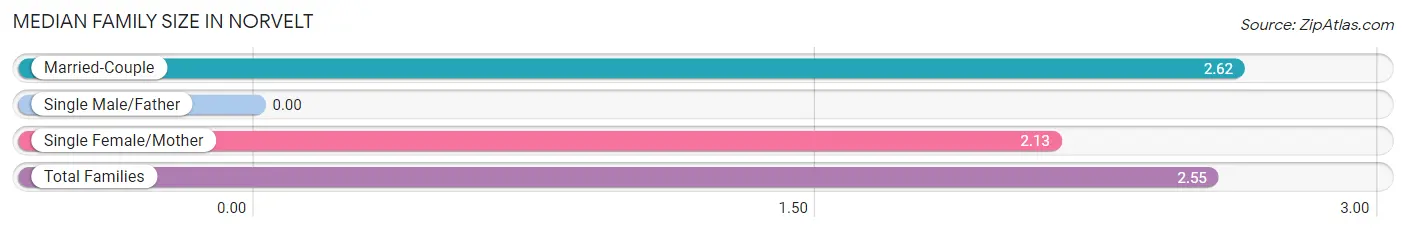
| Family Type | # Families | Family Size |
| Married-Couple | 284 (85.5%) | 2.62 |
| Single Male/Father | 0 (0.0%) | - |
| Single Female/Mother | 48 (14.5%) | 2.13 |
| Total Families | 332 (100.0%) | 2.55 |
Median Household Size in Norvelt
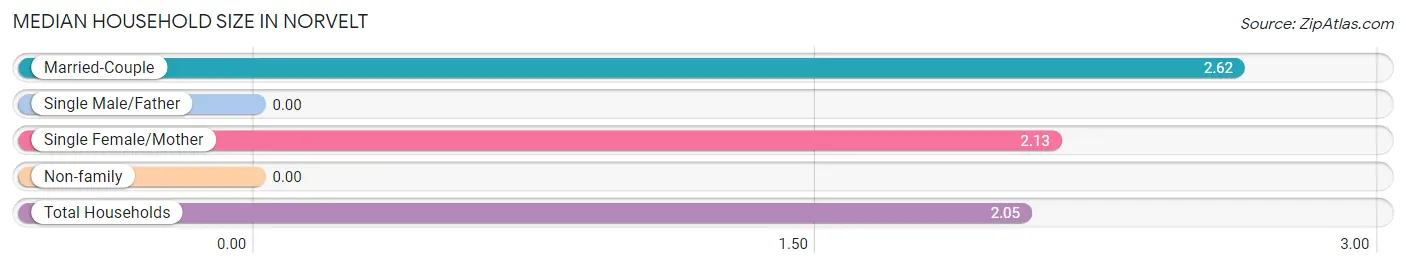
| Household Type | # Households | Household Size |
| Married-Couple | 284 (58.1%) | 2.62 |
| Single Male/Father | 0 (0.0%) | - |
| Single Female/Mother | 48 (9.8%) | 2.13 |
| Non-family | 157 (32.1%) | - |
| Total Households | 489 (100.0%) | 2.05 |
Household Size by Marriage Status in Norvelt
Out of a total of 489 households in Norvelt, 332 (67.9%) are family households, while 157 (32.1%) are nonfamily households. The most numerous type of family households are 2-person households, comprising 225, and the most common type of nonfamily households are 1-person households, comprising 157.
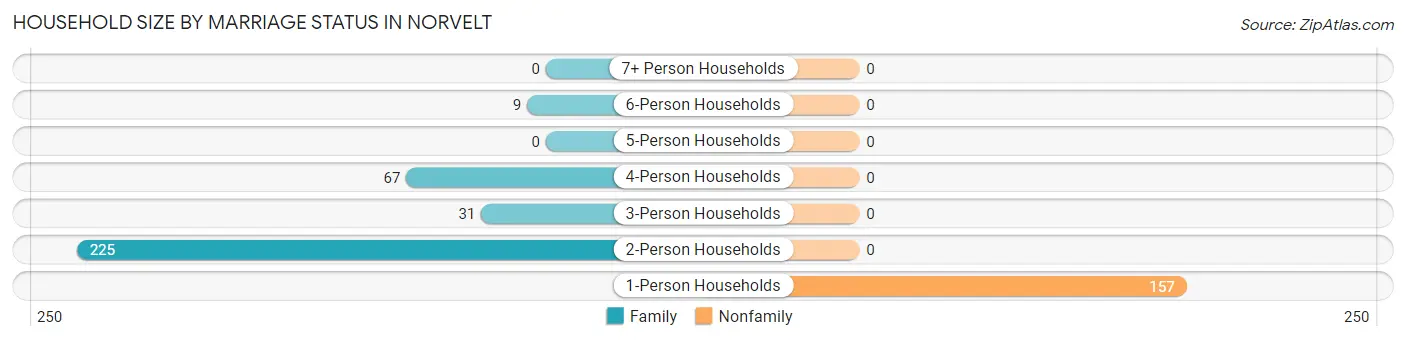
| Household Size | Family Households | Nonfamily Households |
| 1-Person Households | - | 157 (32.1%) |
| 2-Person Households | 225 (46.0%) | 0 (0.0%) |
| 3-Person Households | 31 (6.3%) | 0 (0.0%) |
| 4-Person Households | 67 (13.7%) | 0 (0.0%) |
| 5-Person Households | 0 (0.0%) | 0 (0.0%) |
| 6-Person Households | 9 (1.8%) | 0 (0.0%) |
| 7+ Person Households | 0 (0.0%) | 0 (0.0%) |
| Total | 332 (67.9%) | 157 (32.1%) |
Female Fertility in Norvelt
Fertility by Age in Norvelt
| Age Bracket | Women with Births | Births / 1,000 Women |
| 15 to 19 years | 0 (0.0%) | 0.0 |
| 20 to 34 years | 0 (0.0%) | 0.0 |
| 35 to 50 years | 0 (0.0%) | 0.0 |
| Total | 0 (0.0%) | 0.0 |
Fertility by Age by Marriage Status in Norvelt
| Age Bracket | Married | Unmarried |
| 15 to 19 years | 0 (0.0%) | 0 (0.0%) |
| 20 to 34 years | 0 (0.0%) | 0 (0.0%) |
| 35 to 50 years | 0 (0.0%) | 0 (0.0%) |
| Total | 0 (0.0%) | 0 (0.0%) |
Fertility by Education in Norvelt
| Educational Attainment | Women with Births | Births / 1,000 Women |
| Less than High School | 0 (0.0%) | 0.0 |
| High School Diploma | 0 (0.0%) | 0.0 |
| College or Associate's Degree | 0 (0.0%) | 0.0 |
| Bachelor's Degree | 0 (0.0%) | 0.0 |
| Graduate Degree | 0 (0.0%) | 0.0 |
| Total | 0 (0.0%) | 0.0 |
Fertility by Education by Marriage Status in Norvelt
| Educational Attainment | Married | Unmarried |
| Less than High School | 0 (0.0%) | 0 (0.0%) |
| High School Diploma | 0 (0.0%) | 0 (0.0%) |
| College or Associate's Degree | 0 (0.0%) | 0 (0.0%) |
| Bachelor's Degree | 0 (0.0%) | 0 (0.0%) |
| Graduate Degree | 0 (0.0%) | 0 (0.0%) |
| Total | 0 (0.0%) | 0 (0.0%) |
Employment Characteristics in Norvelt
Employment by Class of Employer in Norvelt
Among the 438 employed individuals in Norvelt, private company employees (300 | 68.5%), not-for-profit organizations (67 | 15.3%), and federal government employees (42 | 9.6%) make up the most common classes of employment.
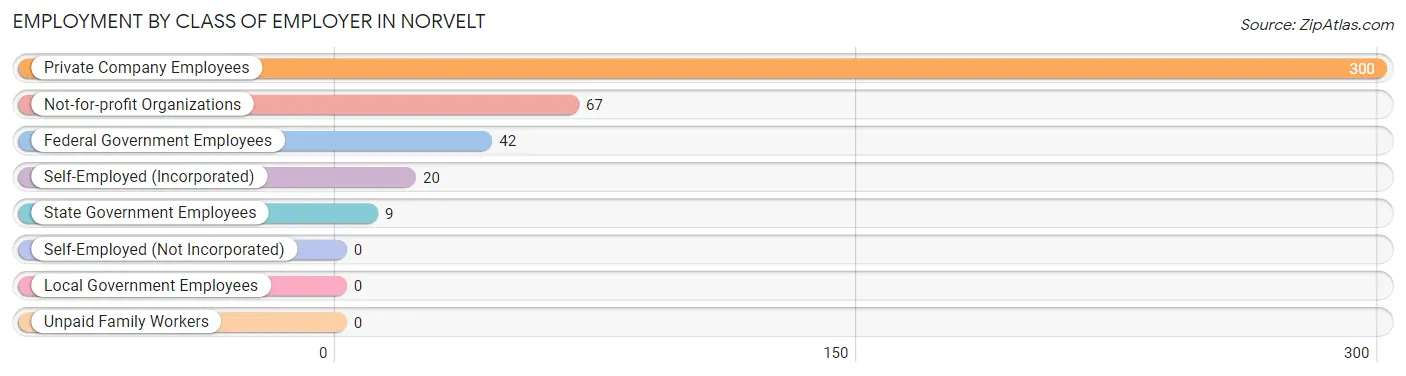
| Employer Class | # Employees | % Employees |
| Private Company Employees | 300 | 68.5% |
| Self-Employed (Incorporated) | 20 | 4.6% |
| Self-Employed (Not Incorporated) | 0 | 0.0% |
| Not-for-profit Organizations | 67 | 15.3% |
| Local Government Employees | 0 | 0.0% |
| State Government Employees | 9 | 2.1% |
| Federal Government Employees | 42 | 9.6% |
| Unpaid Family Workers | 0 | 0.0% |
| Total | 438 | 100.0% |
Employment Status by Age in Norvelt
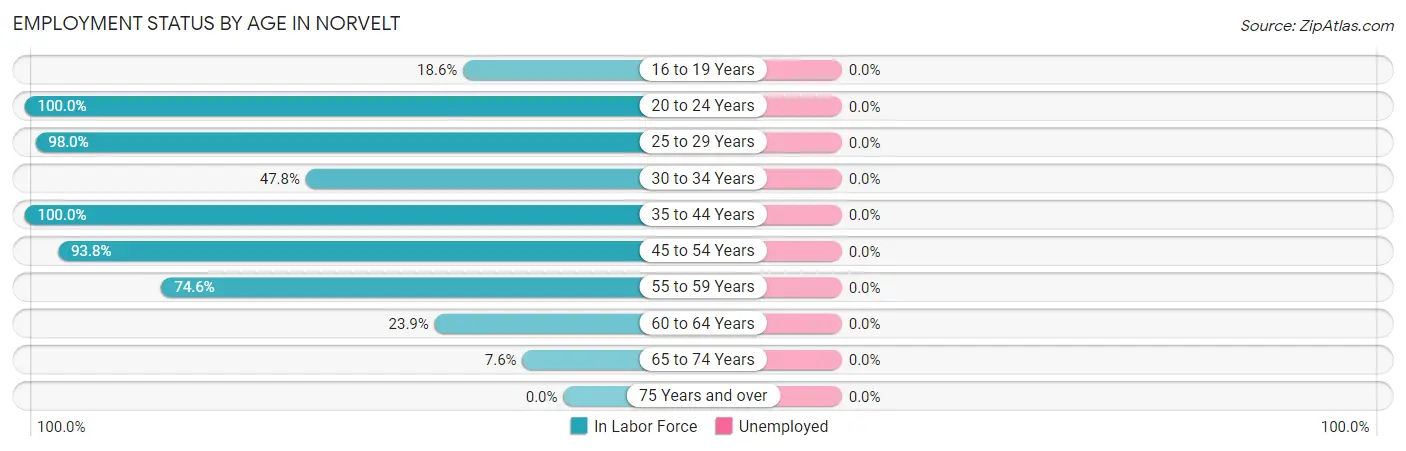
| Age Bracket | In Labor Force | Unemployed |
| 16 to 19 Years | 8 (18.6%) | 0 (0.0%) |
| 20 to 24 Years | 10 (100.0%) | 0 (0.0%) |
| 25 to 29 Years | 49 (98.0%) | 0 (0.0%) |
| 30 to 34 Years | 11 (47.8%) | 0 (0.0%) |
| 35 to 44 Years | 145 (100.0%) | 0 (0.0%) |
| 45 to 54 Years | 151 (93.8%) | 0 (0.0%) |
| 55 to 59 Years | 50 (74.6%) | 0 (0.0%) |
| 60 to 64 Years | 32 (23.9%) | 0 (0.0%) |
| 65 to 74 Years | 13 (7.6%) | 0 (0.0%) |
| 75 Years and over | 0 (0.0%) | 0 (0.0%) |
| Total | 469 (52.1%) | 0 (0.0%) |
Employment Status by Educational Attainment in Norvelt
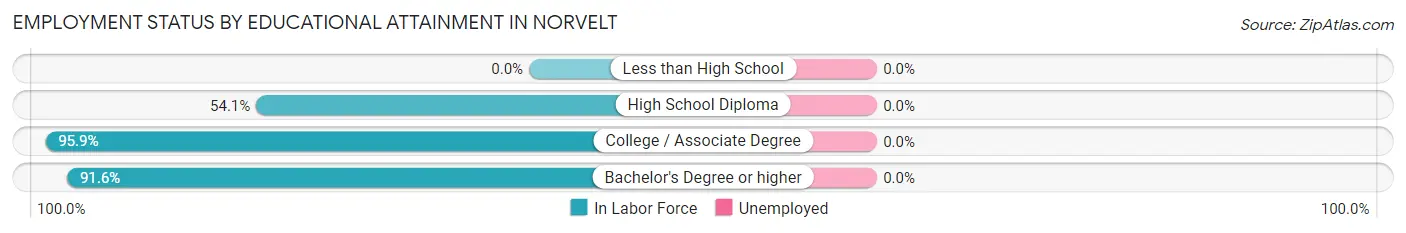
| Educational Attainment | In Labor Force | Unemployed |
| Less than High School | 0 (0.0%) | 0 (0.0%) |
| High School Diploma | 145 (54.1%) | 0 (0.0%) |
| College / Associate Degree | 162 (95.9%) | 0 (0.0%) |
| Bachelor's Degree or higher | 131 (91.6%) | 0 (0.0%) |
| Total | 438 (75.5%) | 0 (0.0%) |
Employment Occupations by Sex in Norvelt
Management, Business, Science and Arts Occupations
The most common Management, Business, Science and Arts occupations in Norvelt are Community & Social Service (56 | 11.9%), Education Instruction & Library (39 | 8.3%), Health Diagnosing & Treating (24 | 5.1%), Health Technologists (24 | 5.1%), and Management (12 | 2.6%).
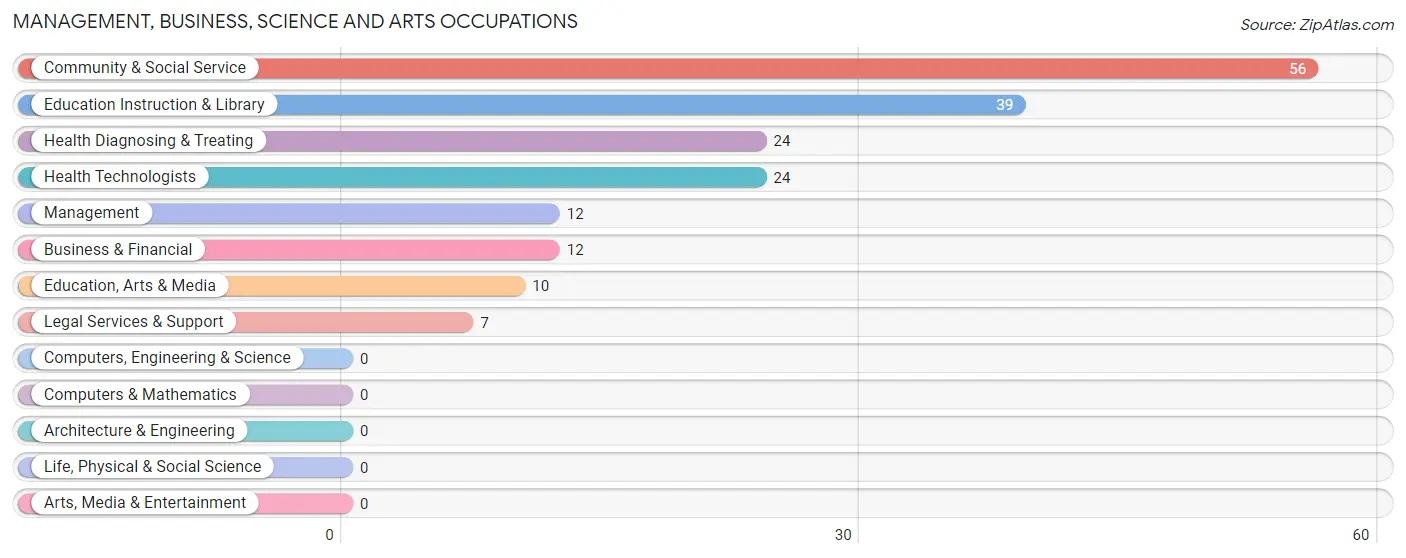
Management, Business, Science and Arts Occupations by Sex
Within the Management, Business, Science and Arts occupations in Norvelt, the most male-oriented occupations are Management (100.0%), and Business & Financial (100.0%), while the most female-oriented occupations are Community & Social Service (100.0%), Education, Arts & Media (100.0%), and Legal Services & Support (100.0%).
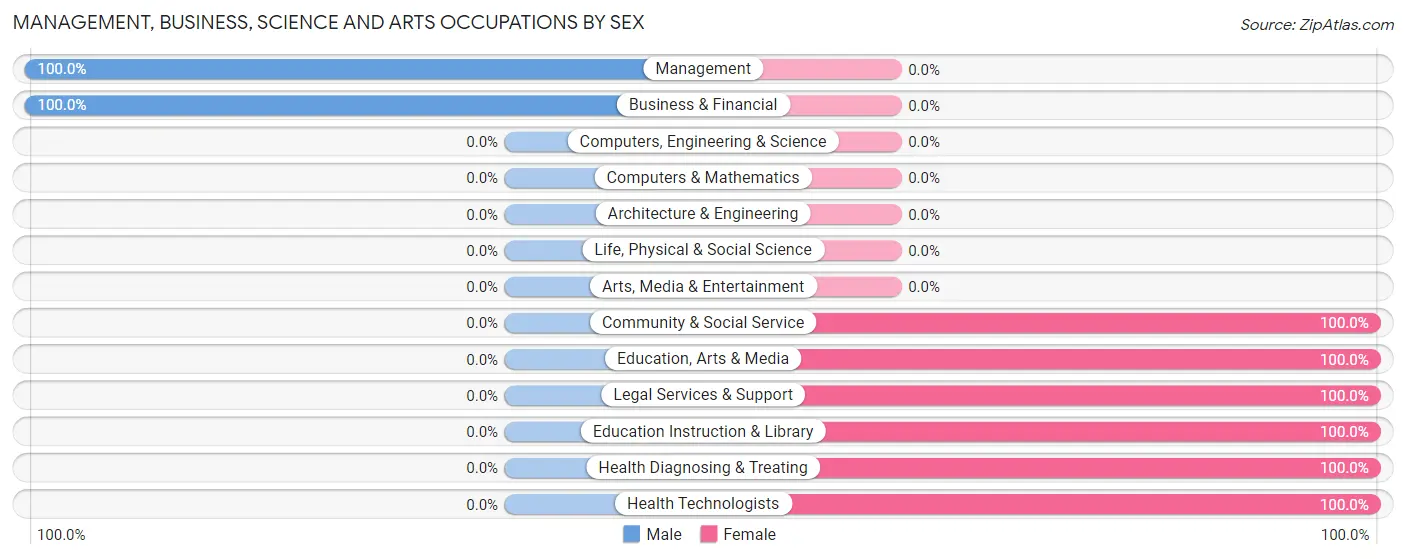
| Occupation | Male | Female |
| Management | 12 (100.0%) | 0 (0.0%) |
| Business & Financial | 12 (100.0%) | 0 (0.0%) |
| Computers, Engineering & Science | 0 (0.0%) | 0 (0.0%) |
| Computers & Mathematics | 0 (0.0%) | 0 (0.0%) |
| Architecture & Engineering | 0 (0.0%) | 0 (0.0%) |
| Life, Physical & Social Science | 0 (0.0%) | 0 (0.0%) |
| Community & Social Service | 0 (0.0%) | 56 (100.0%) |
| Education, Arts & Media | 0 (0.0%) | 10 (100.0%) |
| Legal Services & Support | 0 (0.0%) | 7 (100.0%) |
| Education Instruction & Library | 0 (0.0%) | 39 (100.0%) |
| Arts, Media & Entertainment | 0 (0.0%) | 0 (0.0%) |
| Health Diagnosing & Treating | 0 (0.0%) | 24 (100.0%) |
| Health Technologists | 0 (0.0%) | 24 (100.0%) |
| Total (Category) | 24 (23.1%) | 80 (76.9%) |
| Total (Overall) | 227 (48.4%) | 242 (51.6%) |
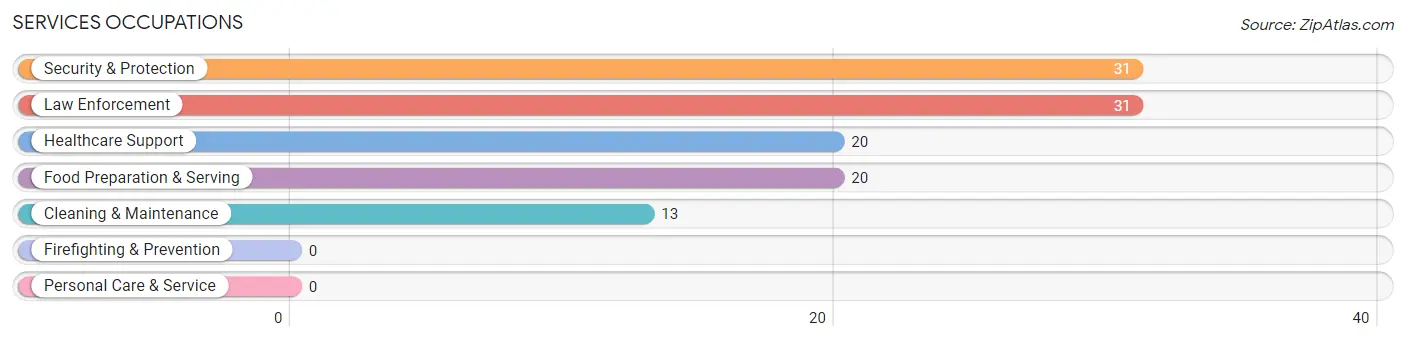
Services Occupations
The most common Services occupations in Norvelt are Security & Protection (31 | 6.6%), Law Enforcement (31 | 6.6%), Healthcare Support (20 | 4.3%), Food Preparation & Serving (20 | 4.3%), and Cleaning & Maintenance (13 | 2.8%).
Services Occupations by Sex
Within the Services occupations in Norvelt, the most male-oriented occupations are Security & Protection (100.0%), and Law Enforcement (100.0%), while the most female-oriented occupations are Healthcare Support (100.0%), Food Preparation & Serving (100.0%), and Cleaning & Maintenance (100.0%).
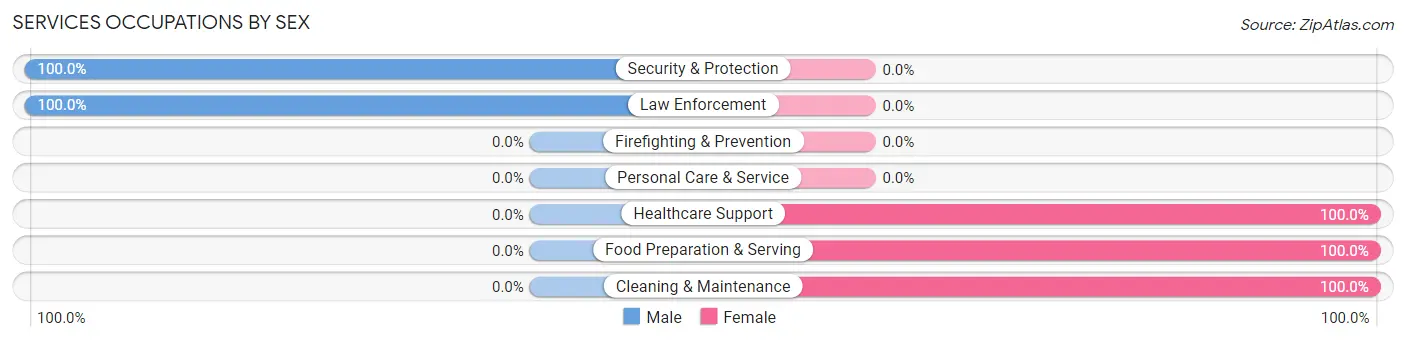
| Occupation | Male | Female |
| Healthcare Support | 0 (0.0%) | 20 (100.0%) |
| Security & Protection | 31 (100.0%) | 0 (0.0%) |
| Firefighting & Prevention | 0 (0.0%) | 0 (0.0%) |
| Law Enforcement | 31 (100.0%) | 0 (0.0%) |
| Food Preparation & Serving | 0 (0.0%) | 20 (100.0%) |
| Cleaning & Maintenance | 0 (0.0%) | 13 (100.0%) |
| Personal Care & Service | 0 (0.0%) | 0 (0.0%) |
| Total (Category) | 31 (36.9%) | 53 (63.1%) |
| Total (Overall) | 227 (48.4%) | 242 (51.6%) |
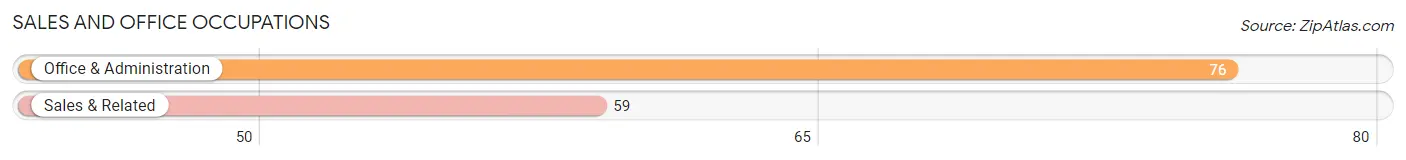
Sales and Office Occupations
The most common Sales and Office occupations in Norvelt are Office & Administration (76 | 16.2%), and Sales & Related (59 | 12.6%).
Sales and Office Occupations by Sex
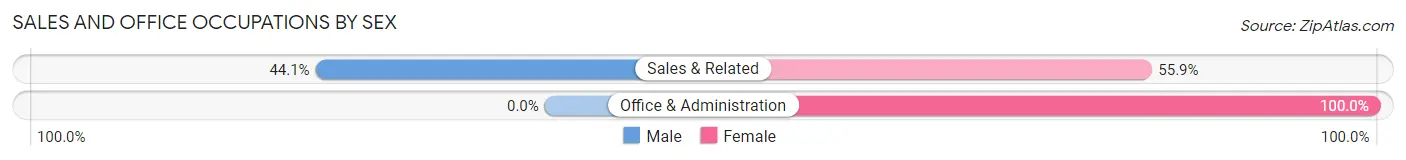
| Occupation | Male | Female |
| Sales & Related | 26 (44.1%) | 33 (55.9%) |
| Office & Administration | 0 (0.0%) | 76 (100.0%) |
| Total (Category) | 26 (19.3%) | 109 (80.7%) |
| Total (Overall) | 227 (48.4%) | 242 (51.6%) |
Natural Resources, Construction and Maintenance Occupations
The most common Natural Resources, Construction and Maintenance occupations in Norvelt are Construction & Extraction (62 | 13.2%), and Installation, Maintenance & Repair (22 | 4.7%).
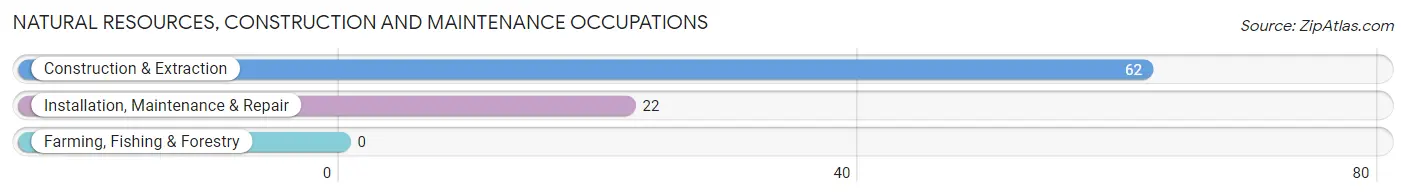
Natural Resources, Construction and Maintenance Occupations by Sex
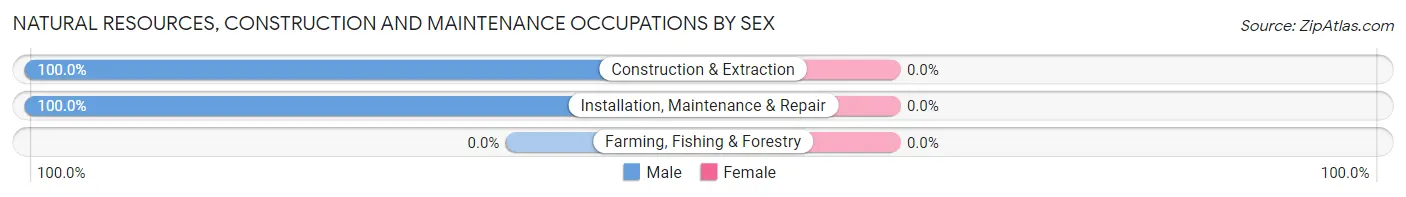
| Occupation | Male | Female |
| Farming, Fishing & Forestry | 0 (0.0%) | 0 (0.0%) |
| Construction & Extraction | 62 (100.0%) | 0 (0.0%) |
| Installation, Maintenance & Repair | 22 (100.0%) | 0 (0.0%) |
| Total (Category) | 84 (100.0%) | 0 (0.0%) |
| Total (Overall) | 227 (48.4%) | 242 (51.6%) |
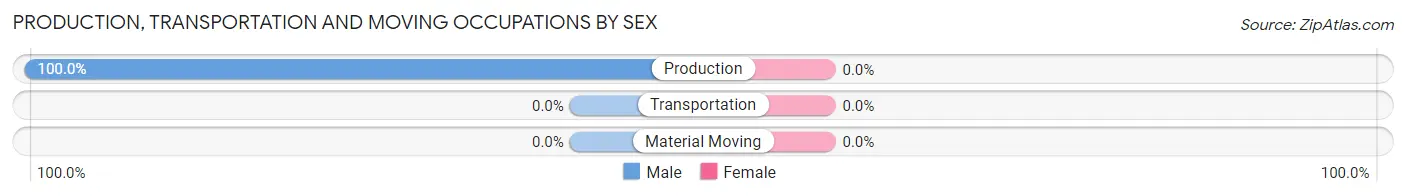
Production, Transportation and Moving Occupations
The most common Production, Transportation and Moving occupations in Norvelt are , and Production (62 | 13.2%).
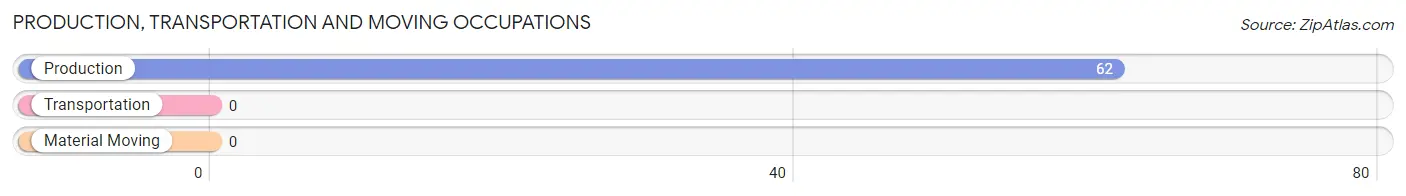
Production, Transportation and Moving Occupations by Sex
| Occupation | Male | Female |
| Production | 62 (100.0%) | 0 (0.0%) |
| Transportation | 0 (0.0%) | 0 (0.0%) |
| Material Moving | 0 (0.0%) | 0 (0.0%) |
| Total (Category) | 62 (100.0%) | 0 (0.0%) |
| Total (Overall) | 227 (48.4%) | 242 (51.6%) |
Employment Industries by Sex in Norvelt
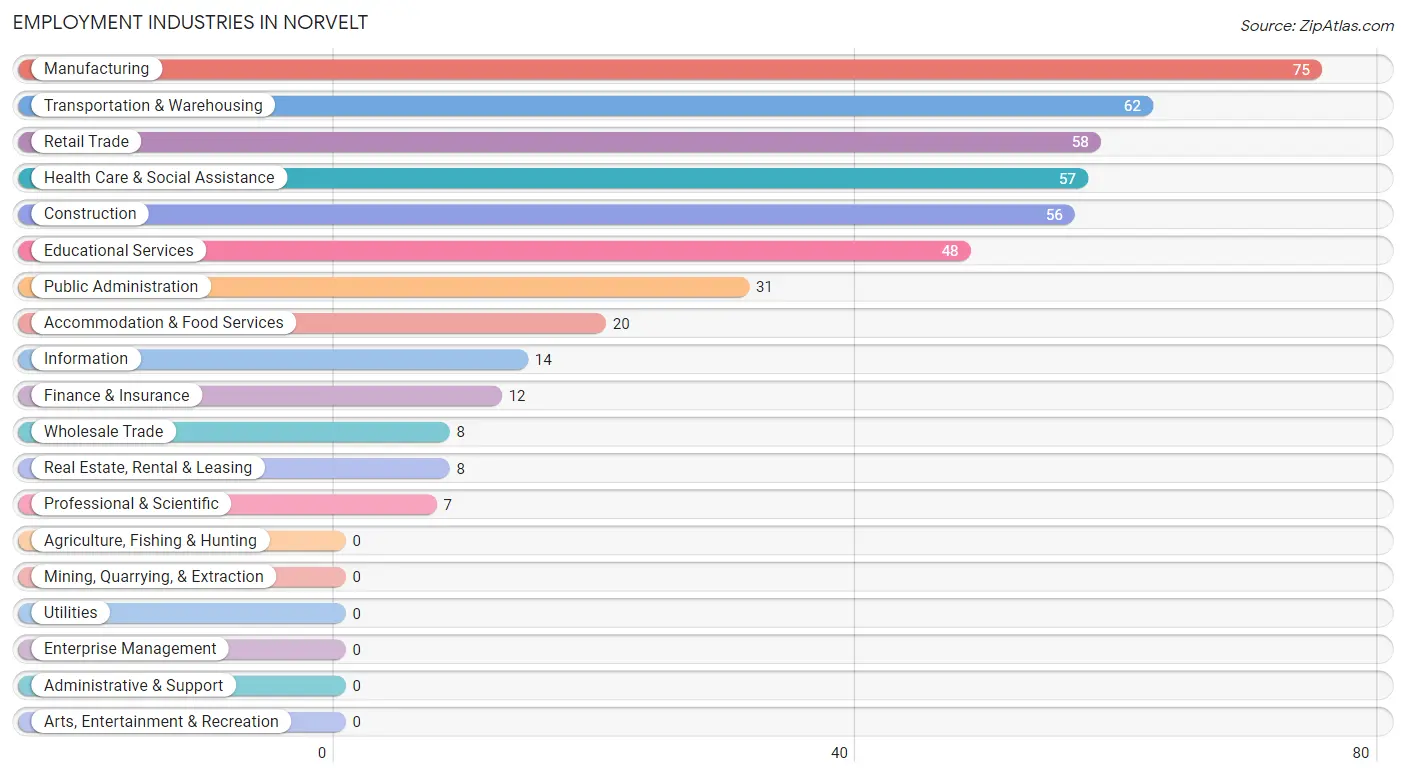
Employment Industries in Norvelt
The major employment industries in Norvelt include Manufacturing (75 | 16.0%), Transportation & Warehousing (62 | 13.2%), Retail Trade (58 | 12.4%), Health Care & Social Assistance (57 | 12.1%), and Construction (56 | 11.9%).
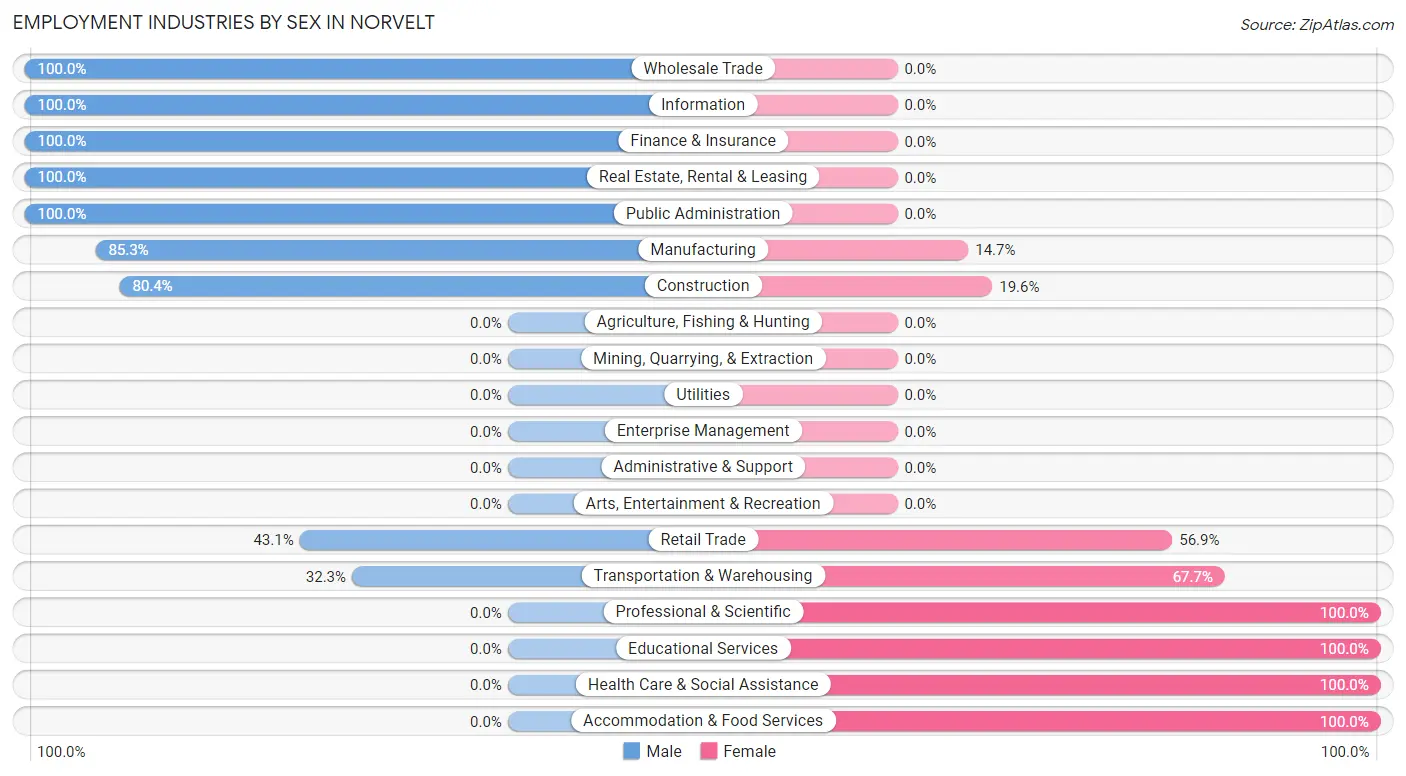
Employment Industries by Sex in Norvelt
The Norvelt industries that see more men than women are Wholesale Trade (100.0%), Information (100.0%), and Finance & Insurance (100.0%), whereas the industries that tend to have a higher number of women are Professional & Scientific (100.0%), Educational Services (100.0%), and Health Care & Social Assistance (100.0%).
| Industry | Male | Female |
| Agriculture, Fishing & Hunting | 0 (0.0%) | 0 (0.0%) |
| Mining, Quarrying, & Extraction | 0 (0.0%) | 0 (0.0%) |
| Construction | 45 (80.4%) | 11 (19.6%) |
| Manufacturing | 64 (85.3%) | 11 (14.7%) |
| Wholesale Trade | 8 (100.0%) | 0 (0.0%) |
| Retail Trade | 25 (43.1%) | 33 (56.9%) |
| Transportation & Warehousing | 20 (32.3%) | 42 (67.7%) |
| Utilities | 0 (0.0%) | 0 (0.0%) |
| Information | 14 (100.0%) | 0 (0.0%) |
| Finance & Insurance | 12 (100.0%) | 0 (0.0%) |
| Real Estate, Rental & Leasing | 8 (100.0%) | 0 (0.0%) |
| Professional & Scientific | 0 (0.0%) | 7 (100.0%) |
| Enterprise Management | 0 (0.0%) | 0 (0.0%) |
| Administrative & Support | 0 (0.0%) | 0 (0.0%) |
| Educational Services | 0 (0.0%) | 48 (100.0%) |
| Health Care & Social Assistance | 0 (0.0%) | 57 (100.0%) |
| Arts, Entertainment & Recreation | 0 (0.0%) | 0 (0.0%) |
| Accommodation & Food Services | 0 (0.0%) | 20 (100.0%) |
| Public Administration | 31 (100.0%) | 0 (0.0%) |
| Total | 227 (48.4%) | 242 (51.6%) |
Education in Norvelt
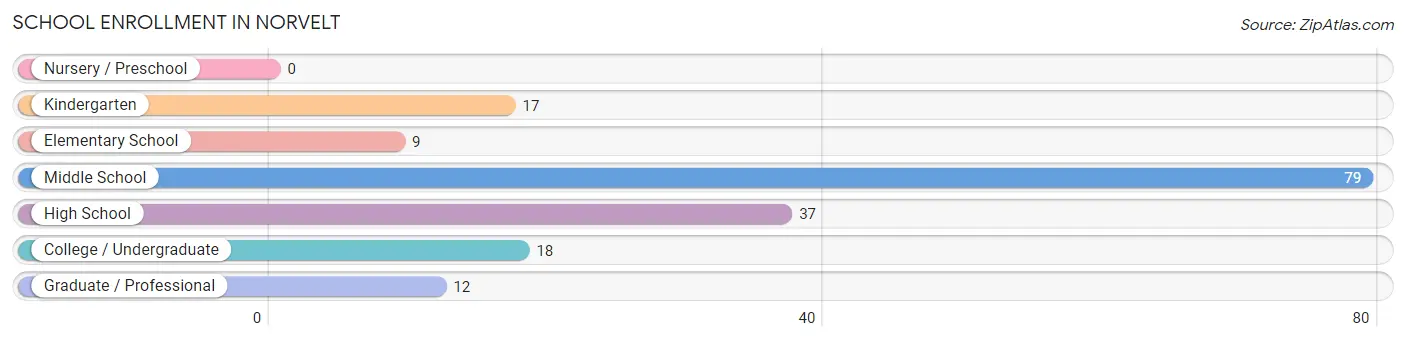
School Enrollment in Norvelt
The most common levels of schooling among the 172 students in Norvelt are middle school (79 | 45.9%), high school (37 | 21.5%), and college / undergraduate (18 | 10.5%).
| School Level | # Students | % Students |
| Nursery / Preschool | 0 | 0.0% |
| Kindergarten | 17 | 9.9% |
| Elementary School | 9 | 5.2% |
| Middle School | 79 | 45.9% |
| High School | 37 | 21.5% |
| College / Undergraduate | 18 | 10.5% |
| Graduate / Professional | 12 | 7.0% |
| Total | 172 | 100.0% |
School Enrollment by Age by Funding Source in Norvelt
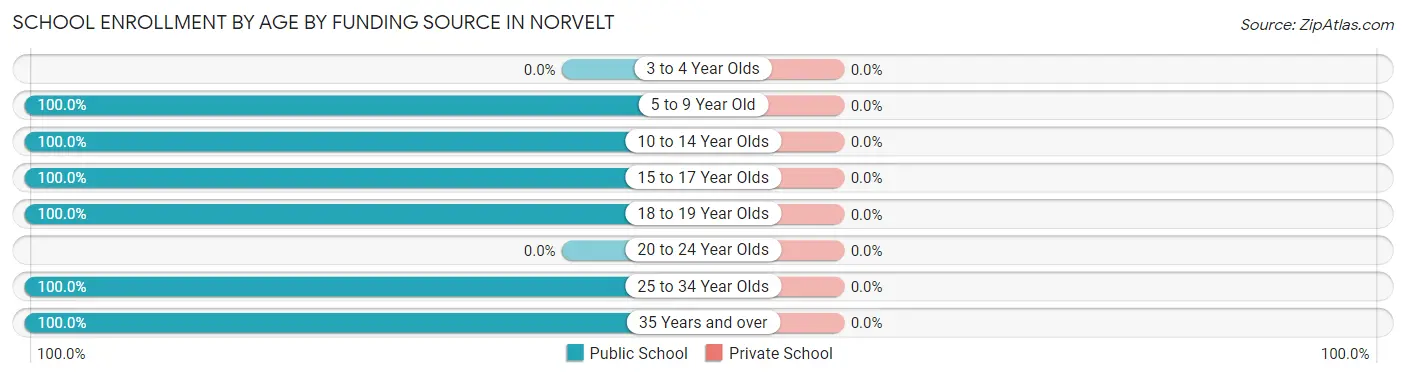
| Age Bracket | Public School | Private School |
| 3 to 4 Year Olds | 0 (0.0%) | 0 (0.0%) |
| 5 to 9 Year Old | 26 (100.0%) | 0 (0.0%) |
| 10 to 14 Year Olds | 79 (100.0%) | 0 (0.0%) |
| 15 to 17 Year Olds | 37 (100.0%) | 0 (0.0%) |
| 18 to 19 Year Olds | 6 (100.0%) | 0 (0.0%) |
| 20 to 24 Year Olds | 0 (0.0%) | 0 (0.0%) |
| 25 to 34 Year Olds | 12 (100.0%) | 0 (0.0%) |
| 35 Years and over | 12 (100.0%) | 0 (0.0%) |
| Total | 172 (100.0%) | 0 (0.0%) |
Educational Attainment by Field of Study in Norvelt
Psychology (40 | 24.4%), physical & health sciences (33 | 20.1%), education (25 | 15.2%), business (18 | 11.0%), and science & technology (15 | 9.1%) are the most common fields of study among 164 individuals in Norvelt who have obtained a bachelor's degree or higher.
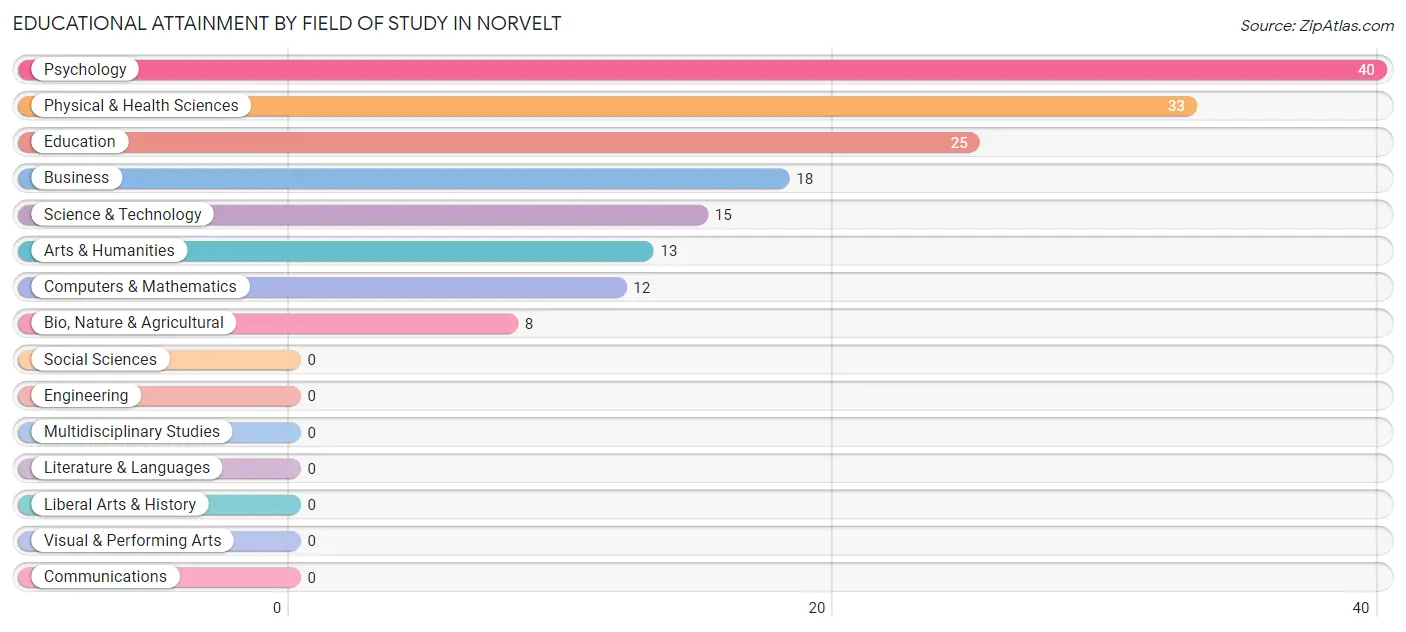
| Field of Study | # Graduates | % Graduates |
| Computers & Mathematics | 12 | 7.3% |
| Bio, Nature & Agricultural | 8 | 4.9% |
| Physical & Health Sciences | 33 | 20.1% |
| Psychology | 40 | 24.4% |
| Social Sciences | 0 | 0.0% |
| Engineering | 0 | 0.0% |
| Multidisciplinary Studies | 0 | 0.0% |
| Science & Technology | 15 | 9.1% |
| Business | 18 | 11.0% |
| Education | 25 | 15.2% |
| Literature & Languages | 0 | 0.0% |
| Liberal Arts & History | 0 | 0.0% |
| Visual & Performing Arts | 0 | 0.0% |
| Communications | 0 | 0.0% |
| Arts & Humanities | 13 | 7.9% |
| Total | 164 | 100.0% |
Transportation & Commute in Norvelt
Vehicle Availability by Sex in Norvelt
The most prevalent vehicle ownership categories in Norvelt are males with 2 vehicles (93, accounting for 47.4%) and females with 2 vehicles (121, making up 38.4%).
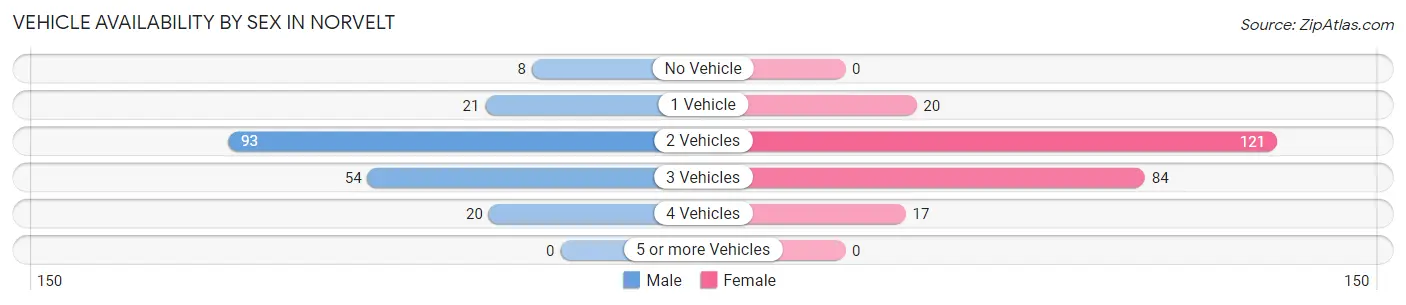
| Vehicles Available | Male | Female |
| No Vehicle | 8 (4.1%) | 0 (0.0%) |
| 1 Vehicle | 21 (10.7%) | 20 (8.3%) |
| 2 Vehicles | 93 (47.4%) | 121 (50.0%) |
| 3 Vehicles | 54 (27.6%) | 84 (34.7%) |
| 4 Vehicles | 20 (10.2%) | 17 (7.0%) |
| 5 or more Vehicles | 0 (0.0%) | 0 (0.0%) |
| Total | 196 (100.0%) | 242 (100.0%) |
Commute Time in Norvelt
The most frequently occuring commute durations in Norvelt are 30 to 34 minutes (91 commuters, 21.8%), less than 5 minutes (54 commuters, 13.0%), and 5 to 9 minutes (53 commuters, 12.7%).
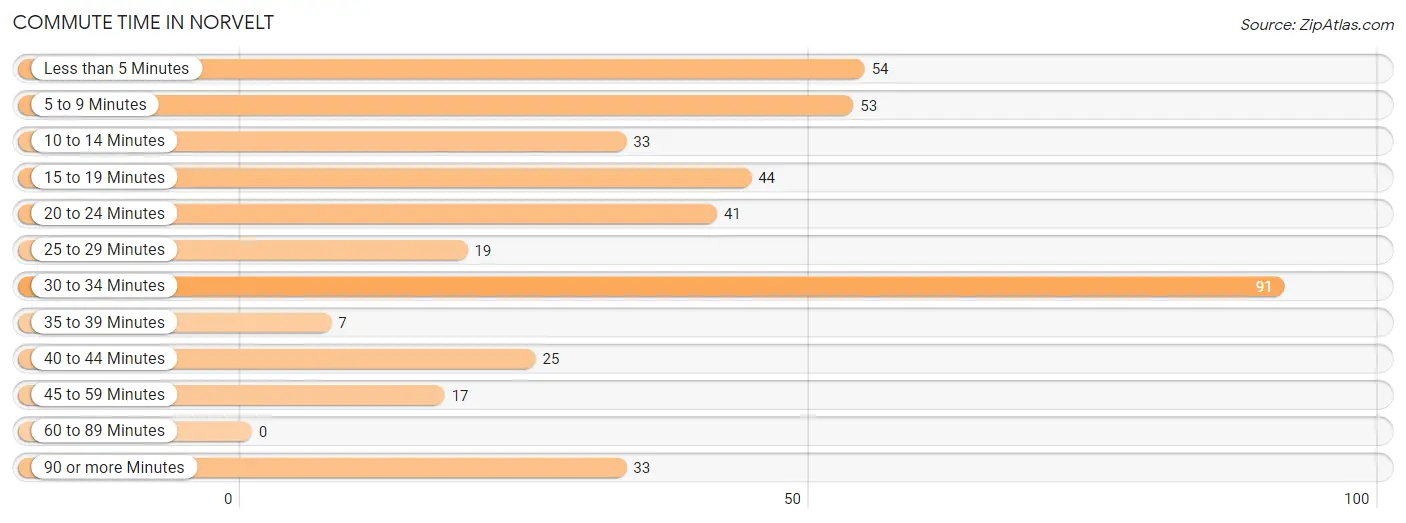
| Commute Time | # Commuters | % Commuters |
| Less than 5 Minutes | 54 | 13.0% |
| 5 to 9 Minutes | 53 | 12.7% |
| 10 to 14 Minutes | 33 | 7.9% |
| 15 to 19 Minutes | 44 | 10.5% |
| 20 to 24 Minutes | 41 | 9.8% |
| 25 to 29 Minutes | 19 | 4.6% |
| 30 to 34 Minutes | 91 | 21.8% |
| 35 to 39 Minutes | 7 | 1.7% |
| 40 to 44 Minutes | 25 | 6.0% |
| 45 to 59 Minutes | 17 | 4.1% |
| 60 to 89 Minutes | 0 | 0.0% |
| 90 or more Minutes | 33 | 7.9% |
Commute Time by Sex in Norvelt
The most common commute times in Norvelt are 20 to 24 minutes (30 commuters, 16.1%) for males and 30 to 34 minutes (76 commuters, 32.9%) for females.
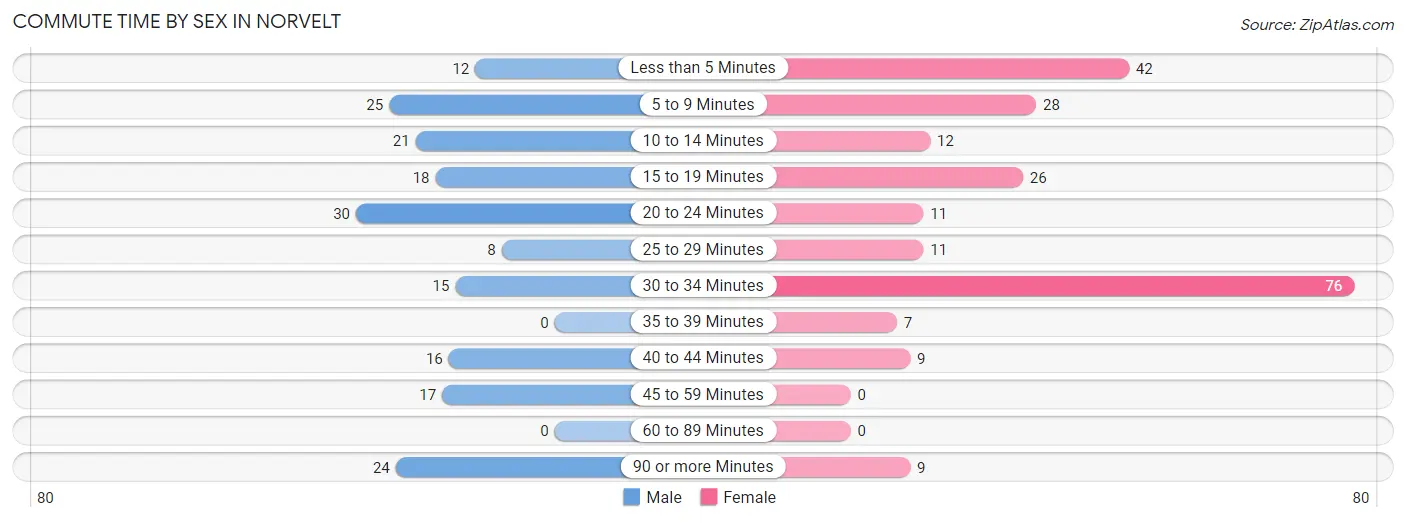
| Commute Time | Male | Female |
| Less than 5 Minutes | 12 (6.5%) | 42 (18.2%) |
| 5 to 9 Minutes | 25 (13.4%) | 28 (12.1%) |
| 10 to 14 Minutes | 21 (11.3%) | 12 (5.2%) |
| 15 to 19 Minutes | 18 (9.7%) | 26 (11.3%) |
| 20 to 24 Minutes | 30 (16.1%) | 11 (4.8%) |
| 25 to 29 Minutes | 8 (4.3%) | 11 (4.8%) |
| 30 to 34 Minutes | 15 (8.1%) | 76 (32.9%) |
| 35 to 39 Minutes | 0 (0.0%) | 7 (3.0%) |
| 40 to 44 Minutes | 16 (8.6%) | 9 (3.9%) |
| 45 to 59 Minutes | 17 (9.1%) | 0 (0.0%) |
| 60 to 89 Minutes | 0 (0.0%) | 0 (0.0%) |
| 90 or more Minutes | 24 (12.9%) | 9 (3.9%) |
Time of Departure to Work by Sex in Norvelt
The most frequent times of departure to work in Norvelt are 12:00 AM to 4:59 AM (48, 25.8%) for males and 7:00 AM to 7:29 AM (59, 25.5%) for females.
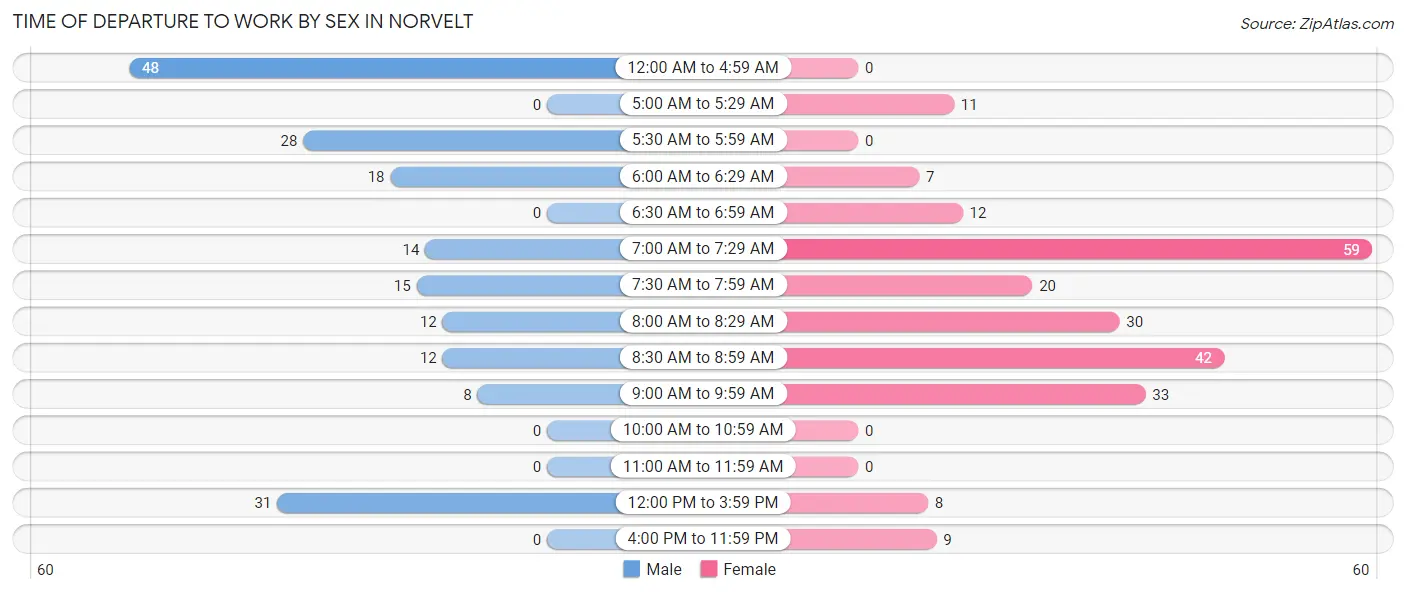
| Time of Departure | Male | Female |
| 12:00 AM to 4:59 AM | 48 (25.8%) | 0 (0.0%) |
| 5:00 AM to 5:29 AM | 0 (0.0%) | 11 (4.8%) |
| 5:30 AM to 5:59 AM | 28 (15.0%) | 0 (0.0%) |
| 6:00 AM to 6:29 AM | 18 (9.7%) | 7 (3.0%) |
| 6:30 AM to 6:59 AM | 0 (0.0%) | 12 (5.2%) |
| 7:00 AM to 7:29 AM | 14 (7.5%) | 59 (25.5%) |
| 7:30 AM to 7:59 AM | 15 (8.1%) | 20 (8.7%) |
| 8:00 AM to 8:29 AM | 12 (6.5%) | 30 (13.0%) |
| 8:30 AM to 8:59 AM | 12 (6.5%) | 42 (18.2%) |
| 9:00 AM to 9:59 AM | 8 (4.3%) | 33 (14.3%) |
| 10:00 AM to 10:59 AM | 0 (0.0%) | 0 (0.0%) |
| 11:00 AM to 11:59 AM | 0 (0.0%) | 0 (0.0%) |
| 12:00 PM to 3:59 PM | 31 (16.7%) | 8 (3.5%) |
| 4:00 PM to 11:59 PM | 0 (0.0%) | 9 (3.9%) |
| Total | 186 (100.0%) | 231 (100.0%) |
Housing Occupancy in Norvelt
Occupancy by Ownership in Norvelt
Of the total 489 dwellings in Norvelt, owner-occupied units account for 439 (89.8%), while renter-occupied units make up 50 (10.2%).
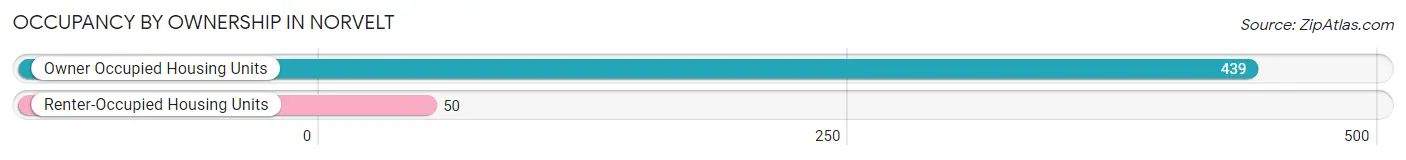
| Occupancy | # Housing Units | % Housing Units |
| Owner Occupied Housing Units | 439 | 89.8% |
| Renter-Occupied Housing Units | 50 | 10.2% |
| Total Occupied Housing Units | 489 | 100.0% |
Occupancy by Household Size in Norvelt
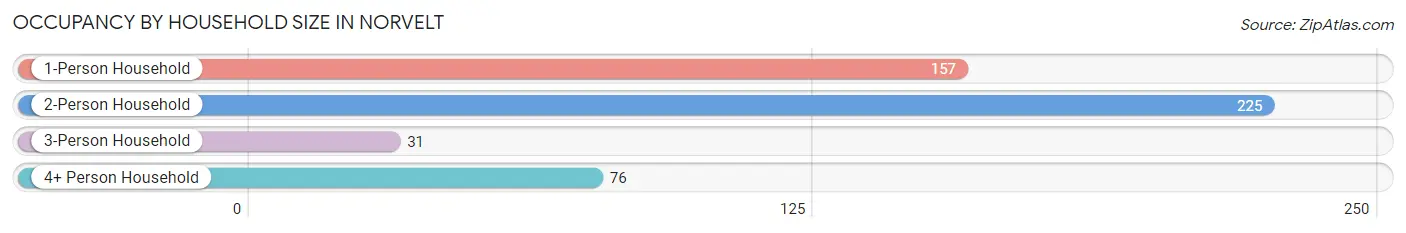
| Household Size | # Housing Units | % Housing Units |
| 1-Person Household | 157 | 32.1% |
| 2-Person Household | 225 | 46.0% |
| 3-Person Household | 31 | 6.3% |
| 4+ Person Household | 76 | 15.5% |
| Total Housing Units | 489 | 100.0% |
Occupancy by Ownership by Household Size in Norvelt
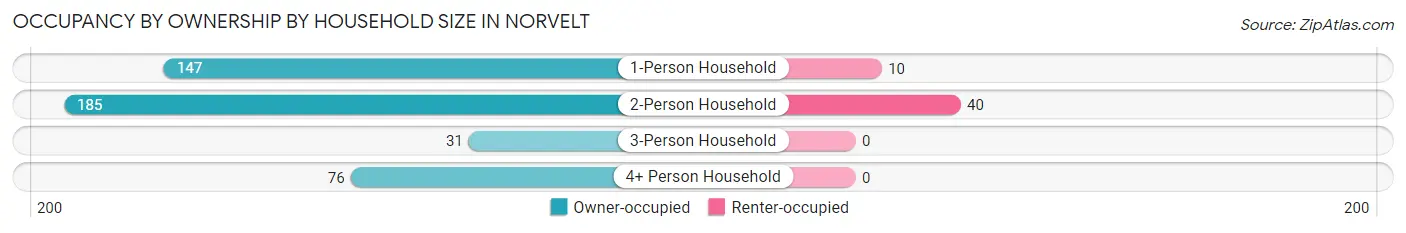
| Household Size | Owner-occupied | Renter-occupied |
| 1-Person Household | 147 (93.6%) | 10 (6.4%) |
| 2-Person Household | 185 (82.2%) | 40 (17.8%) |
| 3-Person Household | 31 (100.0%) | 0 (0.0%) |
| 4+ Person Household | 76 (100.0%) | 0 (0.0%) |
| Total Housing Units | 439 (89.8%) | 50 (10.2%) |
Occupancy by Educational Attainment in Norvelt
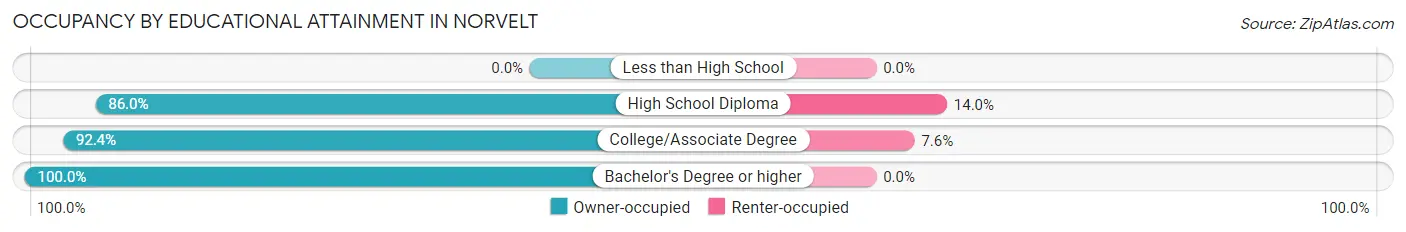
| Household Size | Owner-occupied | Renter-occupied |
| Less than High School | 0 (0.0%) | 0 (0.0%) |
| High School Diploma | 233 (86.0%) | 38 (14.0%) |
| College/Associate Degree | 146 (92.4%) | 12 (7.6%) |
| Bachelor's Degree or higher | 60 (100.0%) | 0 (0.0%) |
Occupancy by Age of Householder in Norvelt
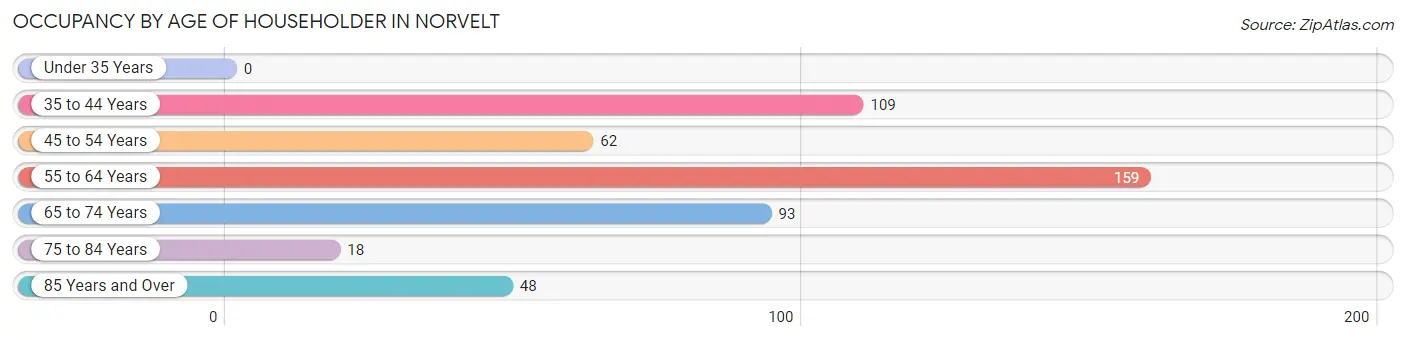
| Age Bracket | # Households | % Households |
| Under 35 Years | 0 | 0.0% |
| 35 to 44 Years | 109 | 22.3% |
| 45 to 54 Years | 62 | 12.7% |
| 55 to 64 Years | 159 | 32.5% |
| 65 to 74 Years | 93 | 19.0% |
| 75 to 84 Years | 18 | 3.7% |
| 85 Years and Over | 48 | 9.8% |
| Total | 489 | 100.0% |
Housing Finances in Norvelt
Median Income by Occupancy in Norvelt

| Occupancy Type | # Households | Median Income |
| Owner-Occupied | 439 (89.8%) | $65,750 |
| Renter-Occupied | 50 (10.2%) | $38,839 |
| Average | 489 (100.0%) | $57,875 |
Occupancy by Householder Income Bracket in Norvelt
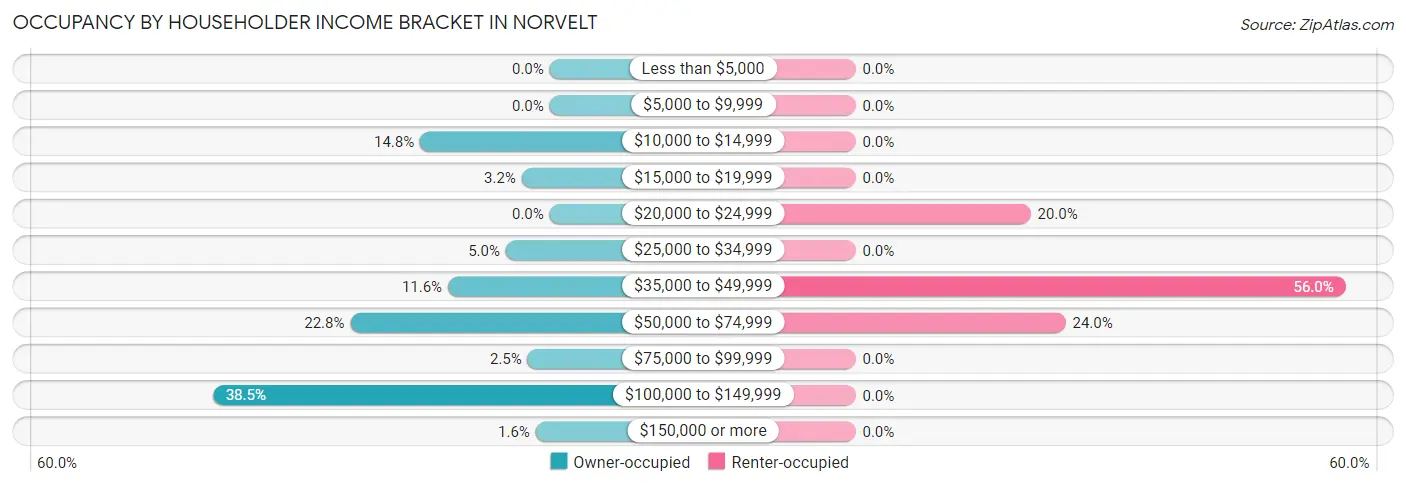
| Income Bracket | Owner-occupied | Renter-occupied |
| Less than $5,000 | 0 (0.0%) | 0 (0.0%) |
| $5,000 to $9,999 | 0 (0.0%) | 0 (0.0%) |
| $10,000 to $14,999 | 65 (14.8%) | 0 (0.0%) |
| $15,000 to $19,999 | 14 (3.2%) | 0 (0.0%) |
| $20,000 to $24,999 | 0 (0.0%) | 10 (20.0%) |
| $25,000 to $34,999 | 22 (5.0%) | 0 (0.0%) |
| $35,000 to $49,999 | 51 (11.6%) | 28 (56.0%) |
| $50,000 to $74,999 | 100 (22.8%) | 12 (24.0%) |
| $75,000 to $99,999 | 11 (2.5%) | 0 (0.0%) |
| $100,000 to $149,999 | 169 (38.5%) | 0 (0.0%) |
| $150,000 or more | 7 (1.6%) | 0 (0.0%) |
| Total | 439 (100.0%) | 50 (100.0%) |
Monthly Housing Cost Tiers in Norvelt
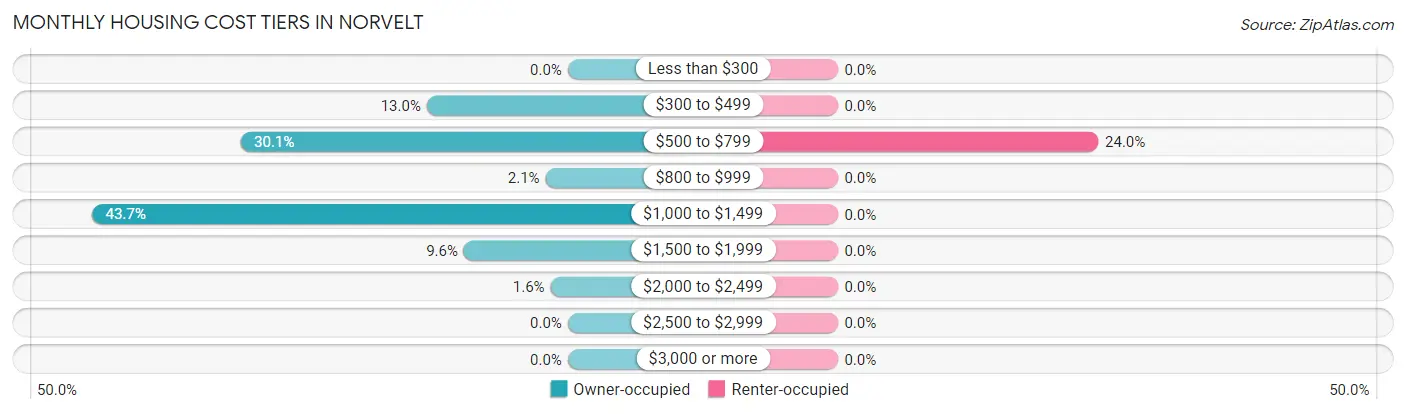
| Monthly Cost | Owner-occupied | Renter-occupied |
| Less than $300 | 0 (0.0%) | 0 (0.0%) |
| $300 to $499 | 57 (13.0%) | 0 (0.0%) |
| $500 to $799 | 132 (30.1%) | 12 (24.0%) |
| $800 to $999 | 9 (2.1%) | 0 (0.0%) |
| $1,000 to $1,499 | 192 (43.7%) | 0 (0.0%) |
| $1,500 to $1,999 | 42 (9.6%) | 0 (0.0%) |
| $2,000 to $2,499 | 7 (1.6%) | 0 (0.0%) |
| $2,500 to $2,999 | 0 (0.0%) | 0 (0.0%) |
| $3,000 or more | 0 (0.0%) | 0 (0.0%) |
| Total | 439 (100.0%) | 50 (100.0%) |
Physical Housing Characteristics in Norvelt
Housing Structures in Norvelt
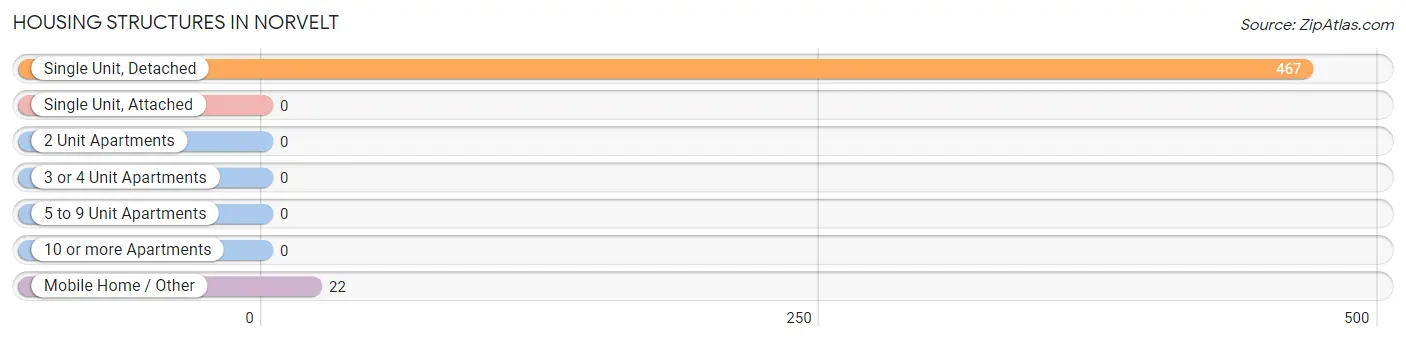
| Structure Type | # Housing Units | % Housing Units |
| Single Unit, Detached | 467 | 95.5% |
| Single Unit, Attached | 0 | 0.0% |
| 2 Unit Apartments | 0 | 0.0% |
| 3 or 4 Unit Apartments | 0 | 0.0% |
| 5 to 9 Unit Apartments | 0 | 0.0% |
| 10 or more Apartments | 0 | 0.0% |
| Mobile Home / Other | 22 | 4.5% |
| Total | 489 | 100.0% |
Housing Structures by Occupancy in Norvelt
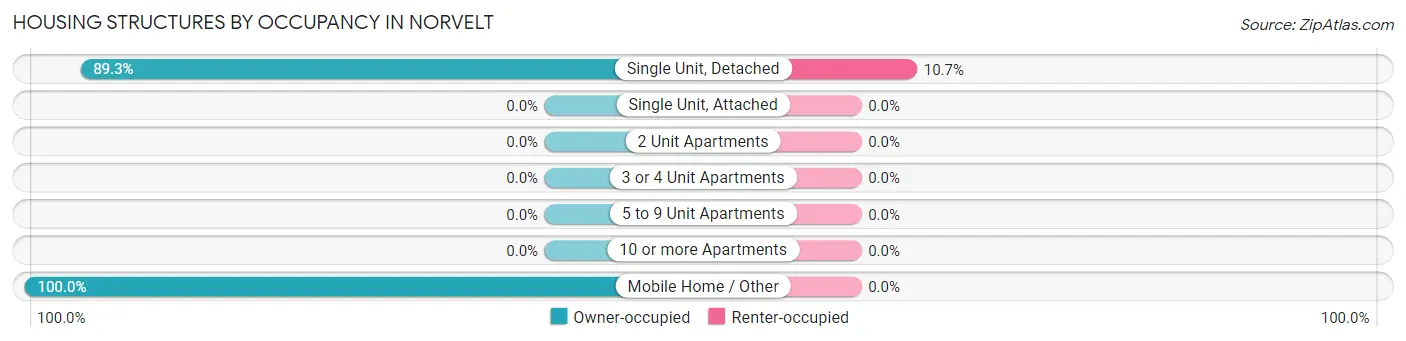
| Structure Type | Owner-occupied | Renter-occupied |
| Single Unit, Detached | 417 (89.3%) | 50 (10.7%) |
| Single Unit, Attached | 0 (0.0%) | 0 (0.0%) |
| 2 Unit Apartments | 0 (0.0%) | 0 (0.0%) |
| 3 or 4 Unit Apartments | 0 (0.0%) | 0 (0.0%) |
| 5 to 9 Unit Apartments | 0 (0.0%) | 0 (0.0%) |
| 10 or more Apartments | 0 (0.0%) | 0 (0.0%) |
| Mobile Home / Other | 22 (100.0%) | 0 (0.0%) |
| Total | 439 (89.8%) | 50 (10.2%) |
Housing Structures by Number of Rooms in Norvelt
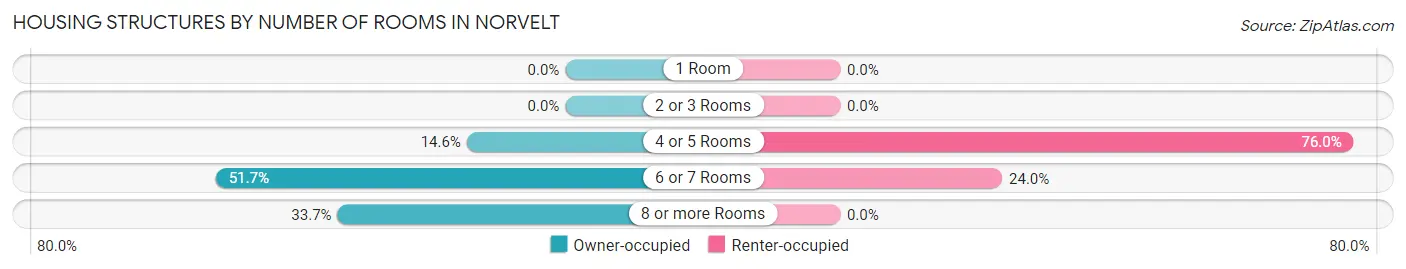
| Number of Rooms | Owner-occupied | Renter-occupied |
| 1 Room | 0 (0.0%) | 0 (0.0%) |
| 2 or 3 Rooms | 0 (0.0%) | 0 (0.0%) |
| 4 or 5 Rooms | 64 (14.6%) | 38 (76.0%) |
| 6 or 7 Rooms | 227 (51.7%) | 12 (24.0%) |
| 8 or more Rooms | 148 (33.7%) | 0 (0.0%) |
| Total | 439 (100.0%) | 50 (100.0%) |
Housing Structure by Heating Type in Norvelt
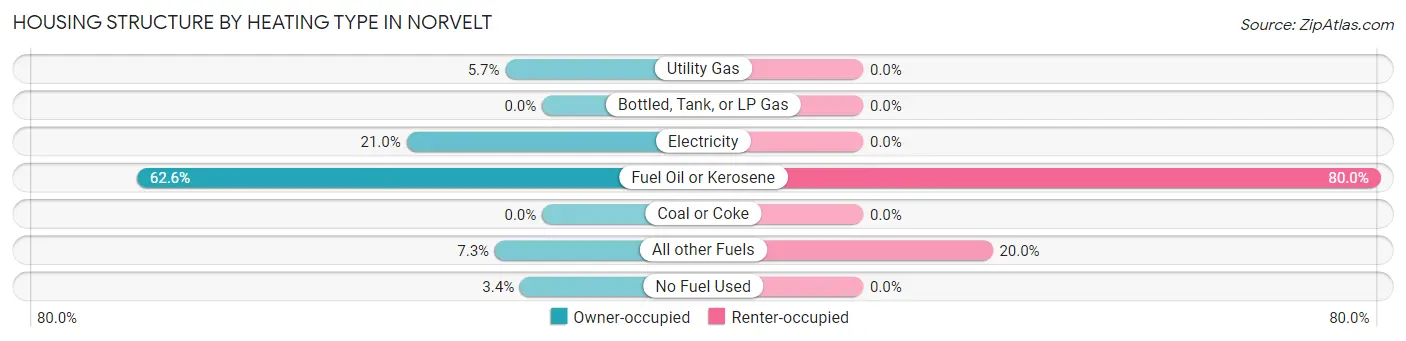
| Heating Type | Owner-occupied | Renter-occupied |
| Utility Gas | 25 (5.7%) | 0 (0.0%) |
| Bottled, Tank, or LP Gas | 0 (0.0%) | 0 (0.0%) |
| Electricity | 92 (21.0%) | 0 (0.0%) |
| Fuel Oil or Kerosene | 275 (62.6%) | 40 (80.0%) |
| Coal or Coke | 0 (0.0%) | 0 (0.0%) |
| All other Fuels | 32 (7.3%) | 10 (20.0%) |
| No Fuel Used | 15 (3.4%) | 0 (0.0%) |
| Total | 439 (100.0%) | 50 (100.0%) |
Household Vehicle Usage in Norvelt
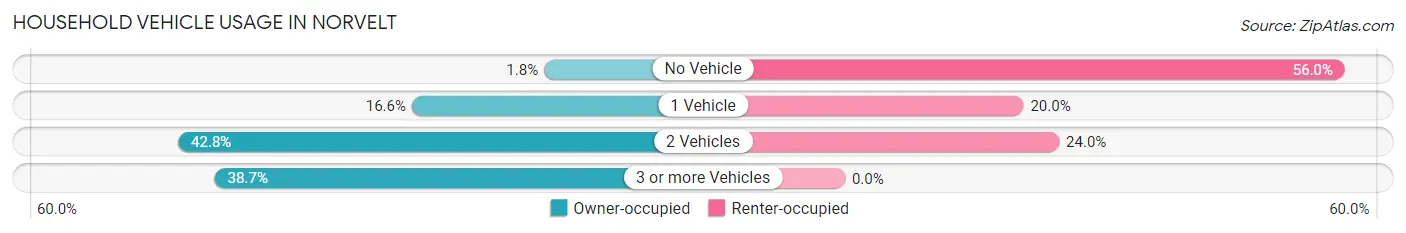
| Vehicles per Household | Owner-occupied | Renter-occupied |
| No Vehicle | 8 (1.8%) | 28 (56.0%) |
| 1 Vehicle | 73 (16.6%) | 10 (20.0%) |
| 2 Vehicles | 188 (42.8%) | 12 (24.0%) |
| 3 or more Vehicles | 170 (38.7%) | 0 (0.0%) |
| Total | 439 (100.0%) | 50 (100.0%) |
Real Estate & Mortgages in Norvelt
Real Estate and Mortgage Overview in Norvelt
| Characteristic | Without Mortgage | With Mortgage |
| Housing Units | 172 | 267 |
| Median Property Value | $151,300 | $204,000 |
| Median Household Income | $50,976 | $7 |
| Monthly Housing Costs | $547 | $0 |
| Real Estate Taxes | $2,138 | $65 |
Property Value by Mortgage Status in Norvelt
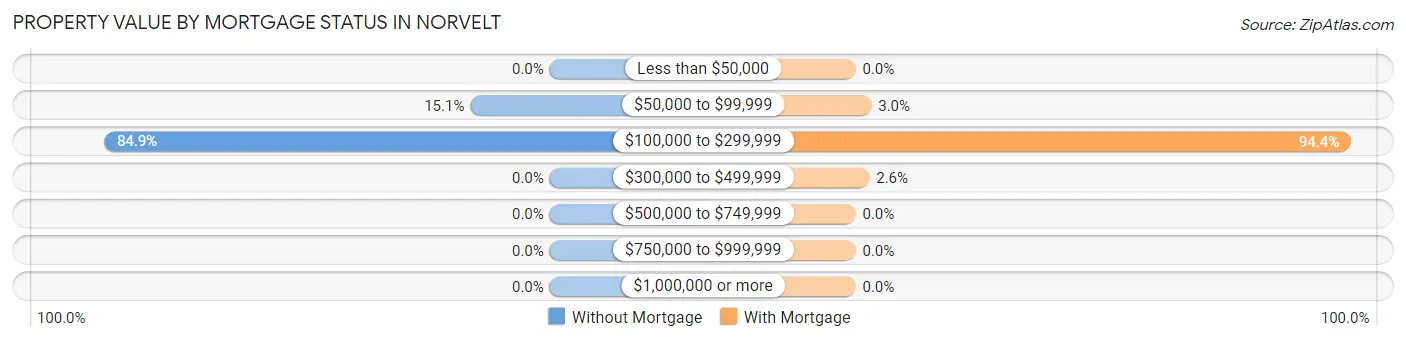
| Property Value | Without Mortgage | With Mortgage |
| Less than $50,000 | 0 (0.0%) | 0 (0.0%) |
| $50,000 to $99,999 | 26 (15.1%) | 8 (3.0%) |
| $100,000 to $299,999 | 146 (84.9%) | 252 (94.4%) |
| $300,000 to $499,999 | 0 (0.0%) | 7 (2.6%) |
| $500,000 to $749,999 | 0 (0.0%) | 0 (0.0%) |
| $750,000 to $999,999 | 0 (0.0%) | 0 (0.0%) |
| $1,000,000 or more | 0 (0.0%) | 0 (0.0%) |
| Total | 172 (100.0%) | 267 (100.0%) |
Household Income by Mortgage Status in Norvelt
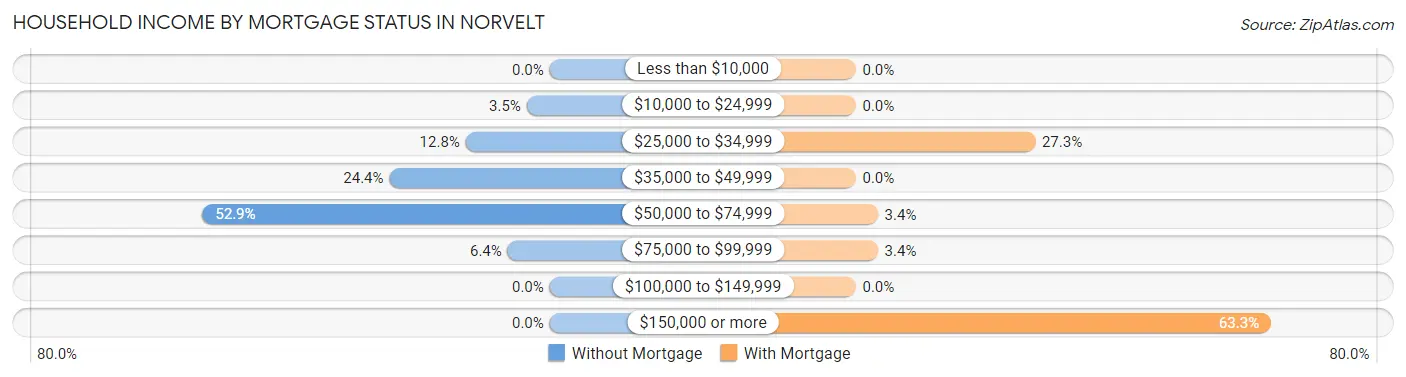
| Household Income | Without Mortgage | With Mortgage |
| Less than $10,000 | 0 (0.0%) | 0 (0.0%) |
| $10,000 to $24,999 | 6 (3.5%) | 0 (0.0%) |
| $25,000 to $34,999 | 22 (12.8%) | 73 (27.3%) |
| $35,000 to $49,999 | 42 (24.4%) | 0 (0.0%) |
| $50,000 to $74,999 | 91 (52.9%) | 9 (3.4%) |
| $75,000 to $99,999 | 11 (6.4%) | 9 (3.4%) |
| $100,000 to $149,999 | 0 (0.0%) | 0 (0.0%) |
| $150,000 or more | 0 (0.0%) | 169 (63.3%) |
| Total | 172 (100.0%) | 267 (100.0%) |
Property Value to Household Income Ratio in Norvelt
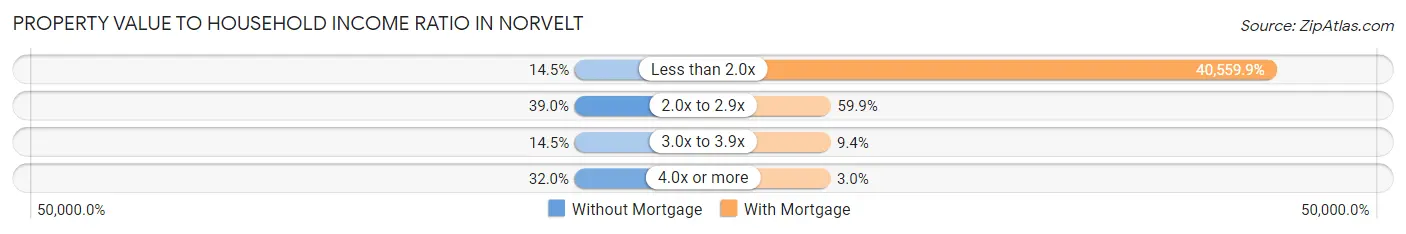
| Value-to-Income Ratio | Without Mortgage | With Mortgage |
| Less than 2.0x | 25 (14.5%) | 108,295 (40,559.9%) |
| 2.0x to 2.9x | 67 (39.0%) | 160 (59.9%) |
| 3.0x to 3.9x | 25 (14.5%) | 25 (9.4%) |
| 4.0x or more | 55 (32.0%) | 8 (3.0%) |
| Total | 172 (100.0%) | 267 (100.0%) |
Real Estate Taxes by Mortgage Status in Norvelt
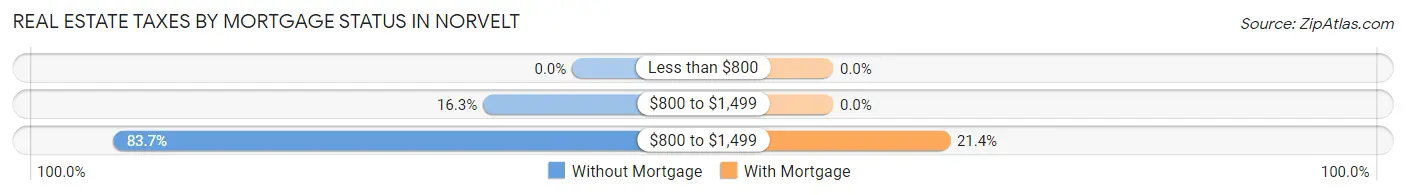
| Property Taxes | Without Mortgage | With Mortgage |
| Less than $800 | 0 (0.0%) | 0 (0.0%) |
| $800 to $1,499 | 28 (16.3%) | 0 (0.0%) |
| $800 to $1,499 | 144 (83.7%) | 57 (21.3%) |
| Total | 172 (100.0%) | 267 (100.0%) |
Health & Disability in Norvelt
Health Insurance Coverage by Age in Norvelt
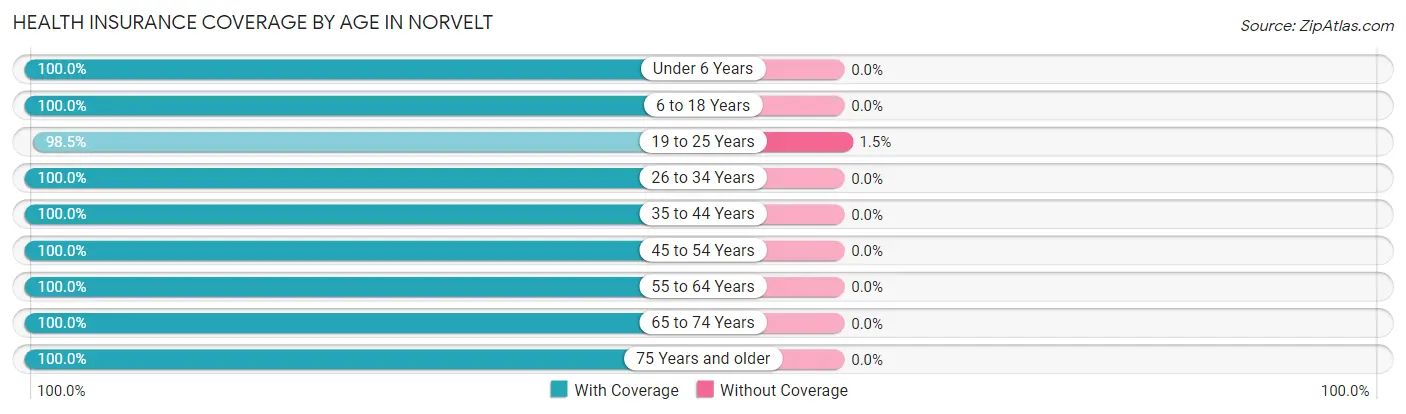
| Age Bracket | With Coverage | Without Coverage |
| Under 6 Years | 7 (100.0%) | 0 (0.0%) |
| 6 to 18 Years | 135 (100.0%) | 0 (0.0%) |
| 19 to 25 Years | 65 (98.5%) | 1 (1.5%) |
| 26 to 34 Years | 23 (100.0%) | 0 (0.0%) |
| 35 to 44 Years | 145 (100.0%) | 0 (0.0%) |
| 45 to 54 Years | 161 (100.0%) | 0 (0.0%) |
| 55 to 64 Years | 201 (100.0%) | 0 (0.0%) |
| 65 to 74 Years | 171 (100.0%) | 0 (0.0%) |
| 75 Years and older | 96 (100.0%) | 0 (0.0%) |
| Total | 1,004 (99.9%) | 1 (0.1%) |
Health Insurance Coverage by Citizenship Status in Norvelt
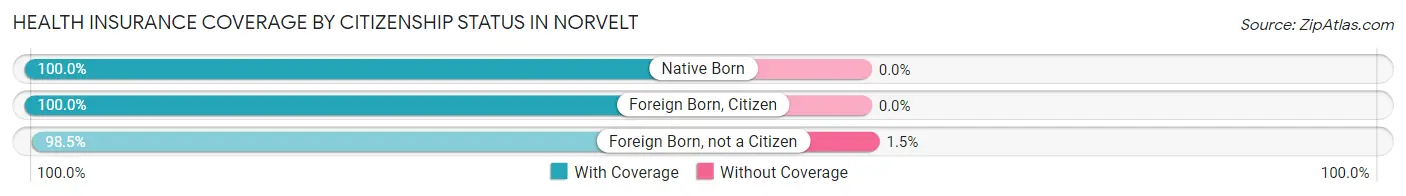
| Citizenship Status | With Coverage | Without Coverage |
| Native Born | 7 (100.0%) | 0 (0.0%) |
| Foreign Born, Citizen | 135 (100.0%) | 0 (0.0%) |
| Foreign Born, not a Citizen | 65 (98.5%) | 1 (1.5%) |
Health Insurance Coverage by Household Income in Norvelt
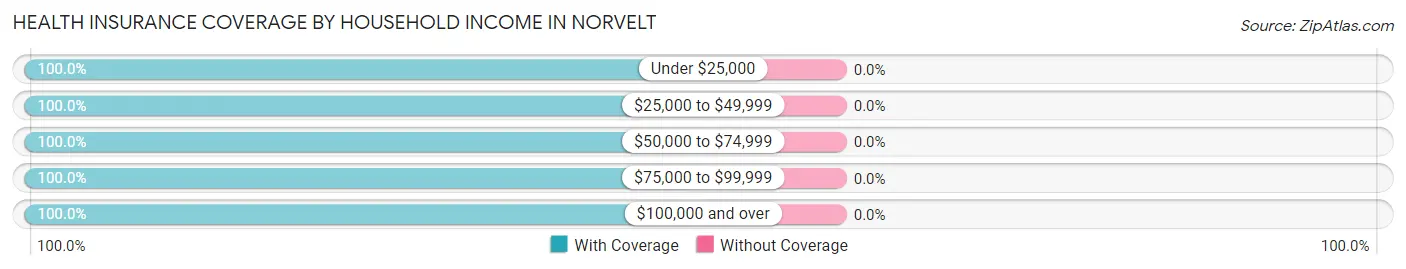
| Household Income | With Coverage | Without Coverage |
| Under $25,000 | 89 (100.0%) | 0 (0.0%) |
| $25,000 to $49,999 | 166 (100.0%) | 0 (0.0%) |
| $50,000 to $74,999 | 222 (100.0%) | 0 (0.0%) |
| $75,000 to $99,999 | 23 (100.0%) | 0 (0.0%) |
| $100,000 and over | 504 (100.0%) | 0 (0.0%) |
Public vs Private Health Insurance Coverage by Age in Norvelt
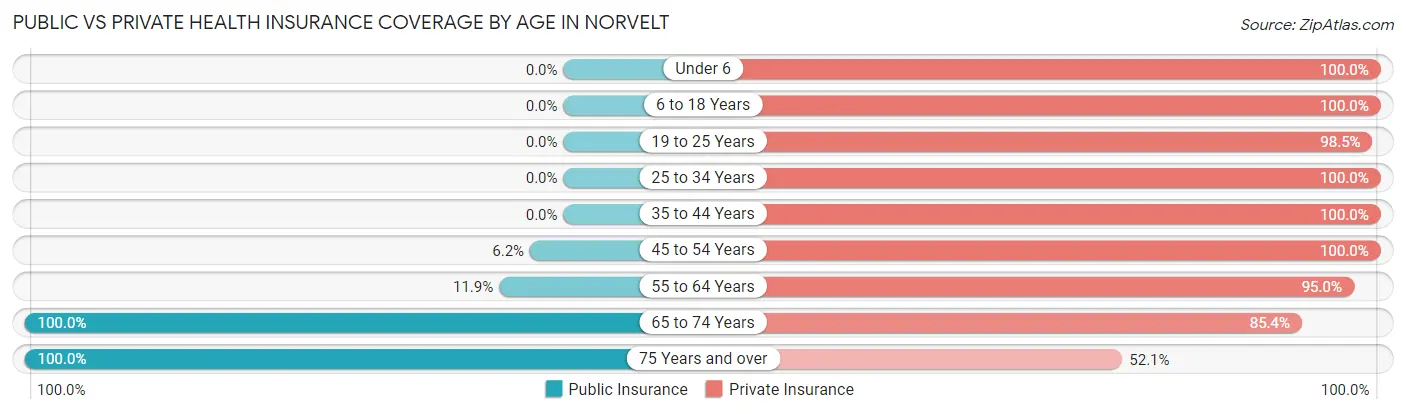
| Age Bracket | Public Insurance | Private Insurance |
| Under 6 | 0 (0.0%) | 7 (100.0%) |
| 6 to 18 Years | 0 (0.0%) | 135 (100.0%) |
| 19 to 25 Years | 0 (0.0%) | 65 (98.5%) |
| 25 to 34 Years | 0 (0.0%) | 23 (100.0%) |
| 35 to 44 Years | 0 (0.0%) | 145 (100.0%) |
| 45 to 54 Years | 10 (6.2%) | 161 (100.0%) |
| 55 to 64 Years | 24 (11.9%) | 191 (95.0%) |
| 65 to 74 Years | 171 (100.0%) | 146 (85.4%) |
| 75 Years and over | 96 (100.0%) | 50 (52.1%) |
| Total | 301 (29.9%) | 923 (91.8%) |
Disability Status by Sex by Age in Norvelt
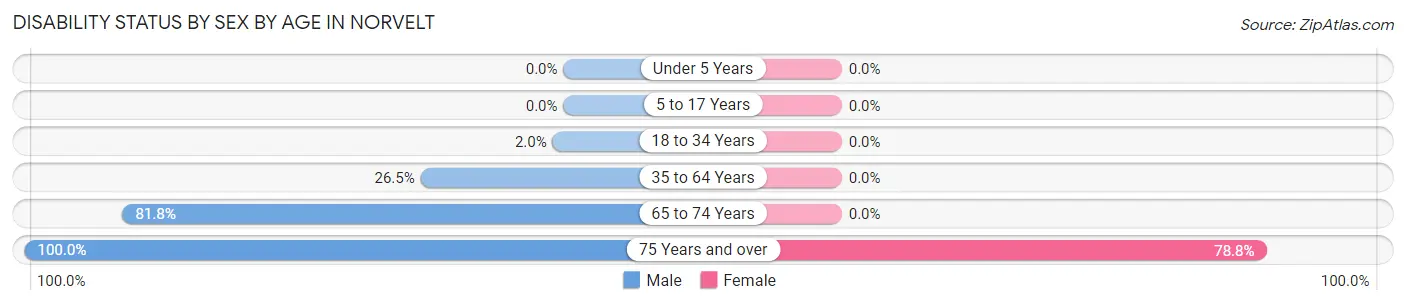
| Age Bracket | Male | Female |
| Under 5 Years | 0 (0.0%) | 0 (0.0%) |
| 5 to 17 Years | 0 (0.0%) | 0 (0.0%) |
| 18 to 34 Years | 1 (2.0%) | 0 (0.0%) |
| 35 to 64 Years | 79 (26.5%) | 0 (0.0%) |
| 65 to 74 Years | 54 (81.8%) | 0 (0.0%) |
| 75 Years and over | 30 (100.0%) | 52 (78.8%) |
Disability Class by Sex by Age in Norvelt
Disability Class: Hearing Difficulty
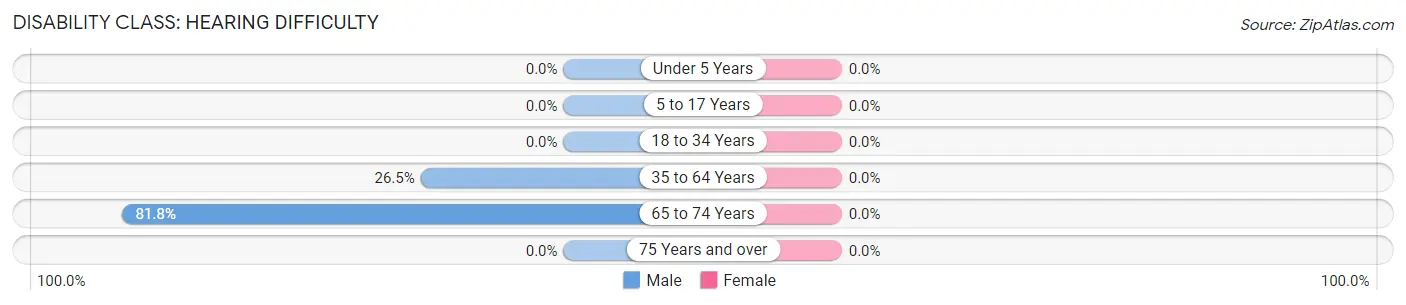
| Age Bracket | Male | Female |
| Under 5 Years | 0 (0.0%) | 0 (0.0%) |
| 5 to 17 Years | 0 (0.0%) | 0 (0.0%) |
| 18 to 34 Years | 0 (0.0%) | 0 (0.0%) |
| 35 to 64 Years | 79 (26.5%) | 0 (0.0%) |
| 65 to 74 Years | 54 (81.8%) | 0 (0.0%) |
| 75 Years and over | 0 (0.0%) | 0 (0.0%) |
Disability Class: Vision Difficulty
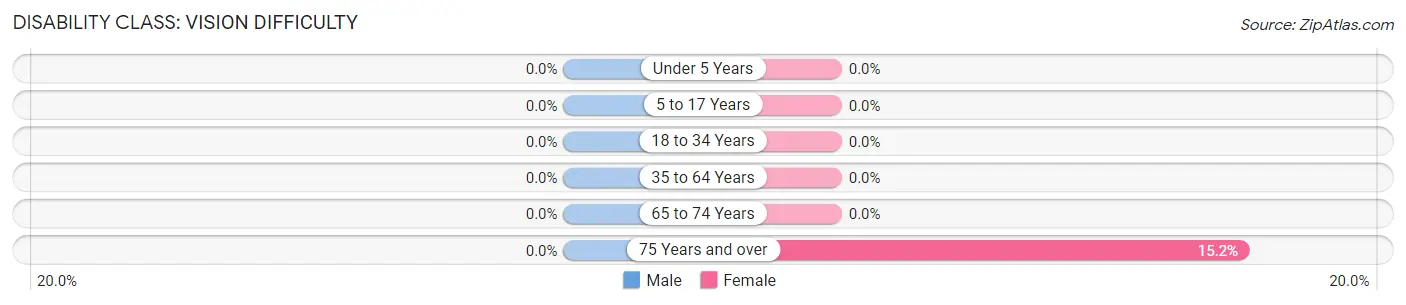
| Age Bracket | Male | Female |
| Under 5 Years | 0 (0.0%) | 0 (0.0%) |
| 5 to 17 Years | 0 (0.0%) | 0 (0.0%) |
| 18 to 34 Years | 0 (0.0%) | 0 (0.0%) |
| 35 to 64 Years | 0 (0.0%) | 0 (0.0%) |
| 65 to 74 Years | 0 (0.0%) | 0 (0.0%) |
| 75 Years and over | 0 (0.0%) | 10 (15.1%) |
Disability Class: Cognitive Difficulty
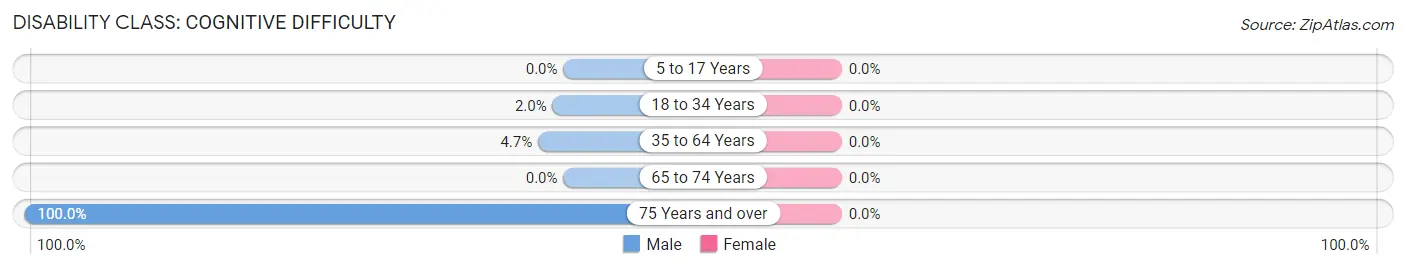
| Age Bracket | Male | Female |
| 5 to 17 Years | 0 (0.0%) | 0 (0.0%) |
| 18 to 34 Years | 1 (2.0%) | 0 (0.0%) |
| 35 to 64 Years | 14 (4.7%) | 0 (0.0%) |
| 65 to 74 Years | 0 (0.0%) | 0 (0.0%) |
| 75 Years and over | 30 (100.0%) | 0 (0.0%) |
Disability Class: Ambulatory Difficulty
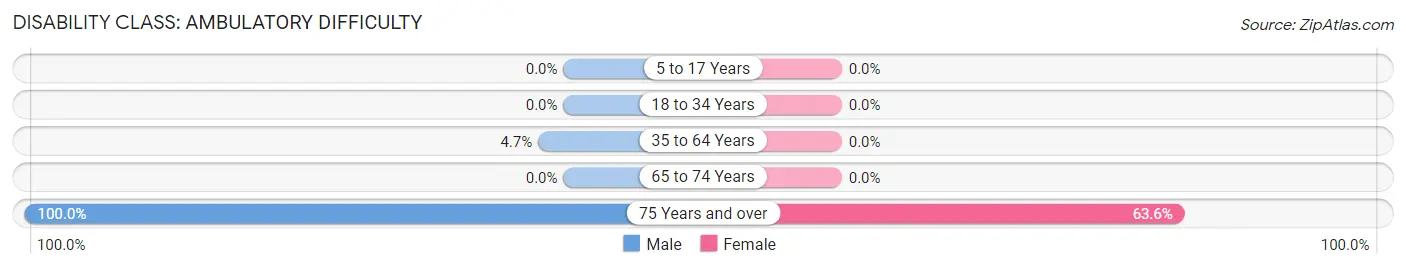
| Age Bracket | Male | Female |
| 5 to 17 Years | 0 (0.0%) | 0 (0.0%) |
| 18 to 34 Years | 0 (0.0%) | 0 (0.0%) |
| 35 to 64 Years | 14 (4.7%) | 0 (0.0%) |
| 65 to 74 Years | 0 (0.0%) | 0 (0.0%) |
| 75 Years and over | 30 (100.0%) | 42 (63.6%) |
Disability Class: Self-Care Difficulty
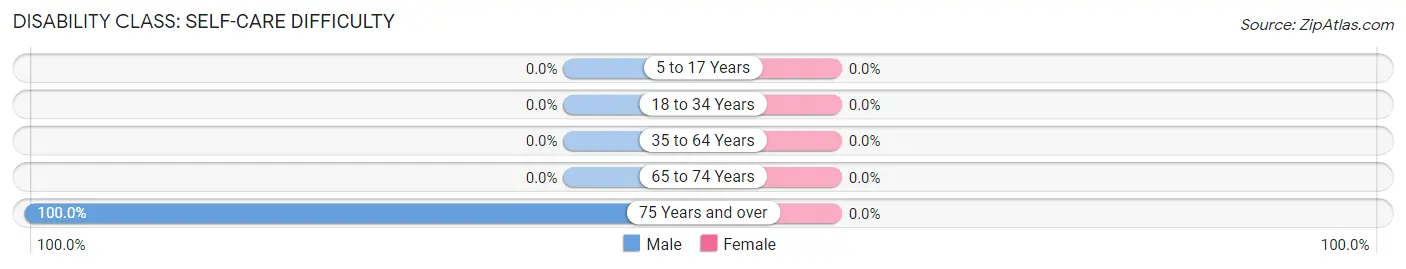
| Age Bracket | Male | Female |
| 5 to 17 Years | 0 (0.0%) | 0 (0.0%) |
| 18 to 34 Years | 0 (0.0%) | 0 (0.0%) |
| 35 to 64 Years | 0 (0.0%) | 0 (0.0%) |
| 65 to 74 Years | 0 (0.0%) | 0 (0.0%) |
| 75 Years and over | 30 (100.0%) | 0 (0.0%) |
Technology Access in Norvelt
Computing Device Access in Norvelt
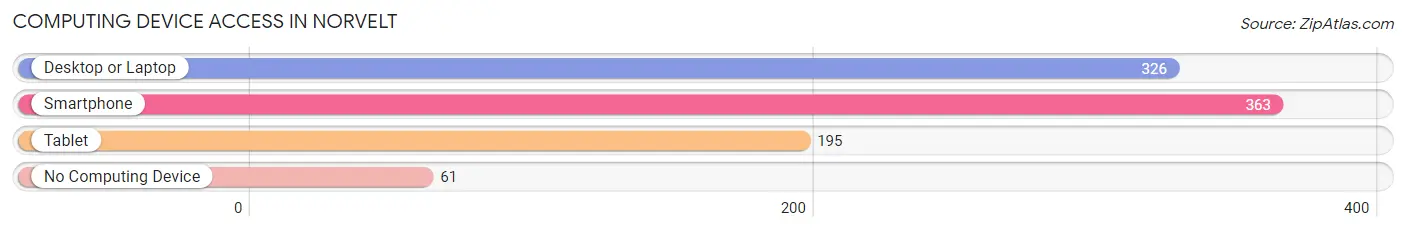
| Device Type | # Households | % Households |
| Desktop or Laptop | 326 | 66.7% |
| Smartphone | 363 | 74.2% |
| Tablet | 195 | 39.9% |
| No Computing Device | 61 | 12.5% |
| Total | 489 | 100.0% |
Internet Access in Norvelt
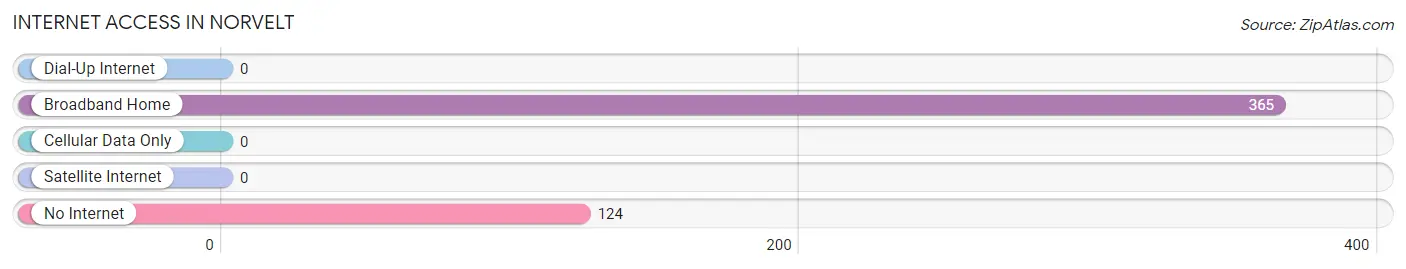
| Internet Type | # Households | % Households |
| Dial-Up Internet | 0 | 0.0% |
| Broadband Home | 365 | 74.6% |
| Cellular Data Only | 0 | 0.0% |
| Satellite Internet | 0 | 0.0% |
| No Internet | 124 | 25.4% |
| Total | 489 | 100.0% |
Norvelt Summary
Norvelt, Pennsylvania is a small borough located in Westmoreland County, Pennsylvania. It is situated in the foothills of the Allegheny Mountains, approximately 30 miles southeast of Pittsburgh. The population of Norvelt was 1,845 at the 2010 census.
History
Norvelt was founded in 1934 as a planned community by the federal government. The town was created as part of President Franklin D. Roosevelt’s New Deal program, which was designed to help the nation recover from the Great Depression. The town was named after Eleanor Roosevelt, the president’s wife.
The town was designed to provide housing for coal miners who had been laid off due to the decline of the coal industry. The town was built on land that had been owned by the Mellon family, and the federal government purchased the land and built the town. The town was designed to be self-sufficient, with its own schools, stores, and other amenities.
Geography
Norvelt is located in Westmoreland County, Pennsylvania. It is situated in the foothills of the Allegheny Mountains, approximately 30 miles southeast of Pittsburgh. The borough is located in the Laurel Highlands region of Pennsylvania.
The borough has a total area of 0.7 square miles, all of which is land. The borough is bordered by the townships of Mount Pleasant, Donegal, and Hempfield.
Economy
The economy of Norvelt is largely based on agriculture and tourism. The town is home to several farms, which produce a variety of crops, including corn, soybeans, and hay. The town is also home to several wineries, which attract tourists from all over the region.
The town is also home to several small businesses, including a hardware store, a grocery store, and a restaurant. The town is also home to a post office and a library.
Demographics
As of the 2010 census, the population of Norvelt was 1,845. The racial makeup of the borough was 97.3% White, 0.7% African American, 0.2% Native American, 0.2% Asian, 0.2% from other races, and 1.4% from two or more races. Hispanic or Latino of any race were 0.7% of the population.
The median income for a household in the borough was $45,000, and the median income for a family was $50,000. The per capita income for the borough was $20,000. About 8.3% of families and 10.2% of the population were below the poverty line, including 14.3% of those under age 18 and 6.3% of those age 65 or over.
Common Questions
What is Per Capita Income in Norvelt?
Per Capita income in Norvelt is $34,338.
What is the Median Family Income in Norvelt?
Median Family Income in Norvelt is $75,227.
What is the Median Household income in Norvelt?
Median Household Income in Norvelt is $57,875.
What is Income or Wage Gap in Norvelt?
Income or Wage Gap in Norvelt is 41.8%.
Women in Norvelt earn 58.2 cents for every dollar earned by a man.
What is Inequality or Gini Index in Norvelt?
Inequality or Gini Index in Norvelt is 0.35.
What is the Total Population of Norvelt?
Total Population of Norvelt is 1,005.
What is the Total Male Population of Norvelt?
Total Male Population of Norvelt is 478.
What is the Total Female Population of Norvelt?
Total Female Population of Norvelt is 527.
What is the Ratio of Males per 100 Females in Norvelt?
There are 90.70 Males per 100 Females in Norvelt.
What is the Ratio of Females per 100 Males in Norvelt?
There are 110.25 Females per 100 Males in Norvelt.
What is the Median Population Age in Norvelt?
Median Population Age in Norvelt is 53.5 Years.
What is the Average Family Size in Norvelt
Average Family Size in Norvelt is 2.5 People.
What is the Average Household Size in Norvelt
Average Household Size in Norvelt is 2.0 People.
How Large is the Labor Force in Norvelt?
There are 469 People in the Labor Forcein in Norvelt.
What is the Percentage of People in the Labor Force in Norvelt?
52.1% of People are in the Labor Force in Norvelt.