Jim Thorpe borough, PA Map & Demographics
Jim Thorpe borough Overview
$35,515
PER CAPITA INCOME
$82,895
AVG FAMILY INCOME
$64,594
AVG HOUSEHOLD INCOME
33.1%
WAGE / INCOME GAP [ % ]
66.9¢/ $1
WAGE / INCOME GAP [ $ ]
0.37
INEQUALITY / GINI INDEX
4,532
TOTAL POPULATION
2,444
MALE POPULATION
2,088
FEMALE POPULATION
117.05
MALES / 100 FEMALES
85.43
FEMALES / 100 MALES
49.0
MEDIAN AGE
2.8
AVG FAMILY SIZE
2.3
AVG HOUSEHOLD SIZE
2,478
LABOR FORCE [ PEOPLE ]
64.1%
PERCENT IN LABOR FORCE
1.9%
UNEMPLOYMENT RATE
Income in Jim Thorpe borough
Income Overview in Jim Thorpe borough
Per Capita Income in Jim Thorpe borough is $35,515, while median incomes of families and households are $82,895 and $64,594 respectively.
| Characteristic | Number | Measure |
| Per Capita Income | 4,532 | $35,515 |
| Median Family Income | 1,272 | $82,895 |
| Mean Family Income | 1,272 | $92,395 |
| Median Household Income | 1,951 | $64,594 |
| Mean Household Income | 1,951 | $77,801 |
| Income Deficit | 1,272 | $0 |
| Wage / Income Gap (%) | 4,532 | 33.07% |
| Wage / Income Gap ($) | 4,532 | 66.93¢ per $1 |
| Gini / Inequality Index | 4,532 | 0.37 |
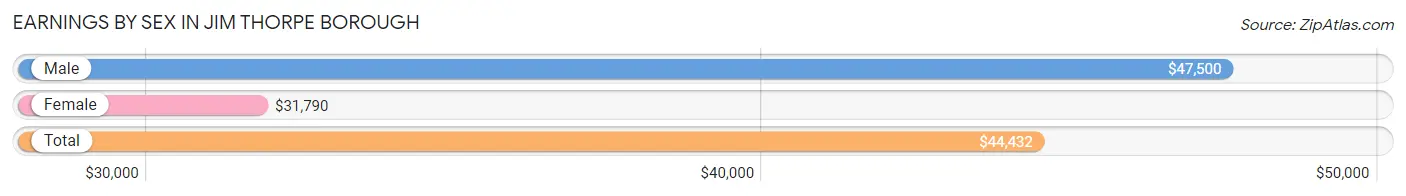
Earnings by Sex in Jim Thorpe borough
Average Earnings in Jim Thorpe borough are $44,432, $47,500 for men and $31,790 for women, a difference of 33.1%.
| Sex | Number | Average Earnings |
| Male | 1,476 (57.4%) | $47,500 |
| Female | 1,096 (42.6%) | $31,790 |
| Total | 2,572 (100.0%) | $44,432 |
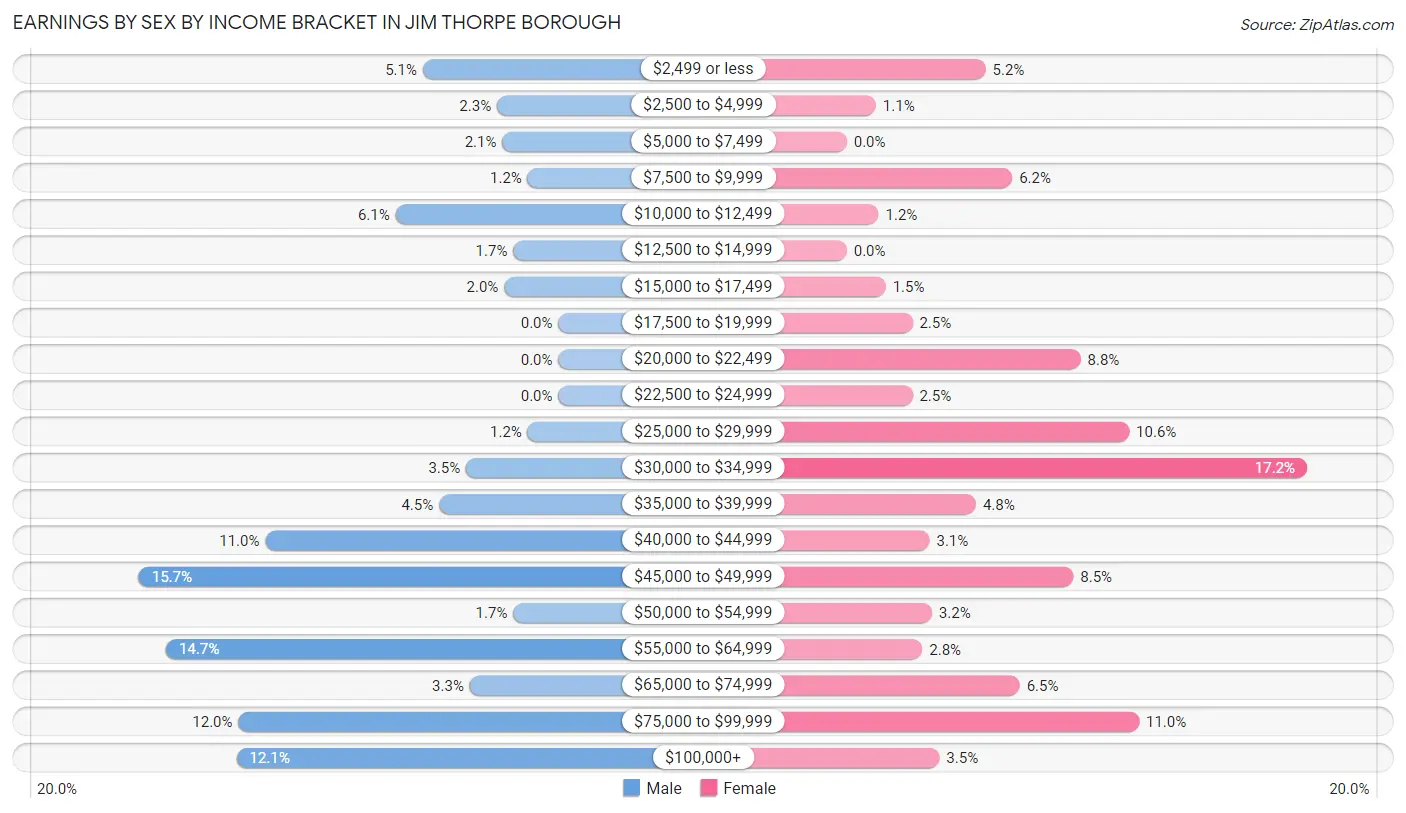
Earnings by Sex by Income Bracket in Jim Thorpe borough
The most common earnings brackets in Jim Thorpe borough are $45,000 to $49,999 for men (232 | 15.7%) and $30,000 to $34,999 for women (189 | 17.2%).
| Income | Male | Female |
| $2,499 or less | 75 (5.1%) | 57 (5.2%) |
| $2,500 to $4,999 | 34 (2.3%) | 12 (1.1%) |
| $5,000 to $7,499 | 31 (2.1%) | 0 (0.0%) |
| $7,500 to $9,999 | 17 (1.1%) | 68 (6.2%) |
| $10,000 to $12,499 | 90 (6.1%) | 13 (1.2%) |
| $12,500 to $14,999 | 25 (1.7%) | 0 (0.0%) |
| $15,000 to $17,499 | 30 (2.0%) | 16 (1.5%) |
| $17,500 to $19,999 | 0 (0.0%) | 27 (2.5%) |
| $20,000 to $22,499 | 0 (0.0%) | 96 (8.8%) |
| $22,500 to $24,999 | 0 (0.0%) | 27 (2.5%) |
| $25,000 to $29,999 | 17 (1.1%) | 116 (10.6%) |
| $30,000 to $34,999 | 51 (3.5%) | 189 (17.2%) |
| $35,000 to $39,999 | 66 (4.5%) | 53 (4.8%) |
| $40,000 to $44,999 | 162 (11.0%) | 34 (3.1%) |
| $45,000 to $49,999 | 232 (15.7%) | 93 (8.5%) |
| $50,000 to $54,999 | 25 (1.7%) | 35 (3.2%) |
| $55,000 to $64,999 | 217 (14.7%) | 31 (2.8%) |
| $65,000 to $74,999 | 49 (3.3%) | 71 (6.5%) |
| $75,000 to $99,999 | 177 (12.0%) | 120 (11.0%) |
| $100,000+ | 178 (12.1%) | 38 (3.5%) |
| Total | 1,476 (100.0%) | 1,096 (100.0%) |
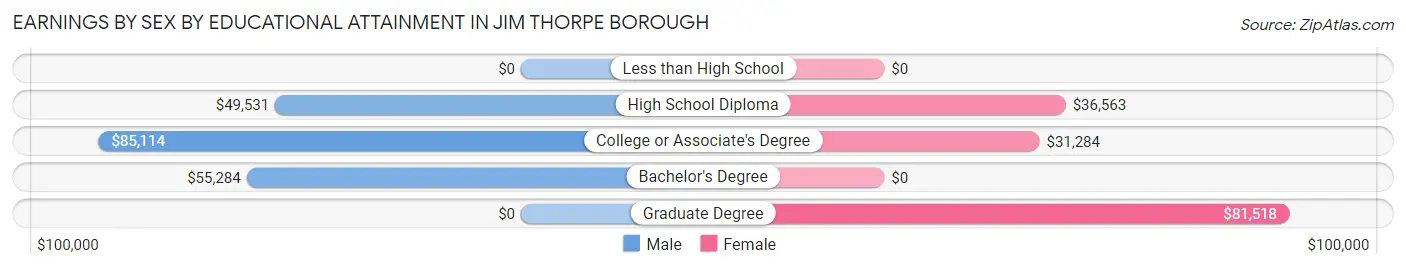
Earnings by Sex by Educational Attainment in Jim Thorpe borough
Average earnings in Jim Thorpe borough are $54,667 for men and $32,446 for women, a difference of 40.6%. Men with an educational attainment of college or associate's degree enjoy the highest average annual earnings of $85,114, while those with high school diploma education earn the least with $49,531. Women with an educational attainment of graduate degree earn the most with the average annual earnings of $81,518, while those with college or associate's degree education have the smallest earnings of $31,284.
| Educational Attainment | Male Income | Female Income |
| Less than High School | - | - |
| High School Diploma | $49,531 | $36,563 |
| College or Associate's Degree | $85,114 | $31,284 |
| Bachelor's Degree | $55,284 | $0 |
| Graduate Degree | - | - |
| Total | $54,667 | $32,446 |
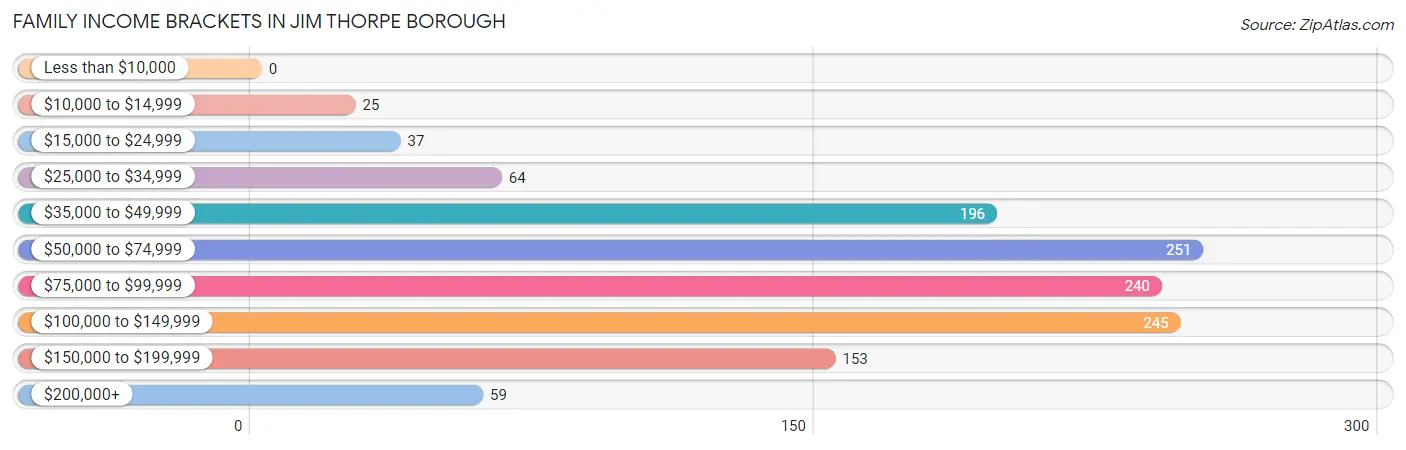
Family Income in Jim Thorpe borough
Family Income Brackets in Jim Thorpe borough
According to the Jim Thorpe borough family income data, there are 251 families falling into the $50,000 to $74,999 income range, which is the most common income bracket and makes up 19.7% of all families.
| Income Bracket | # Families | % Families |
| Less than $10,000 | 0 | 0.0% |
| $10,000 to $14,999 | 25 | 2.0% |
| $15,000 to $24,999 | 37 | 2.9% |
| $25,000 to $34,999 | 64 | 5.0% |
| $35,000 to $49,999 | 196 | 15.4% |
| $50,000 to $74,999 | 251 | 19.7% |
| $75,000 to $99,999 | 240 | 18.9% |
| $100,000 to $149,999 | 245 | 19.3% |
| $150,000 to $199,999 | 153 | 12.0% |
| $200,000+ | 59 | 4.6% |
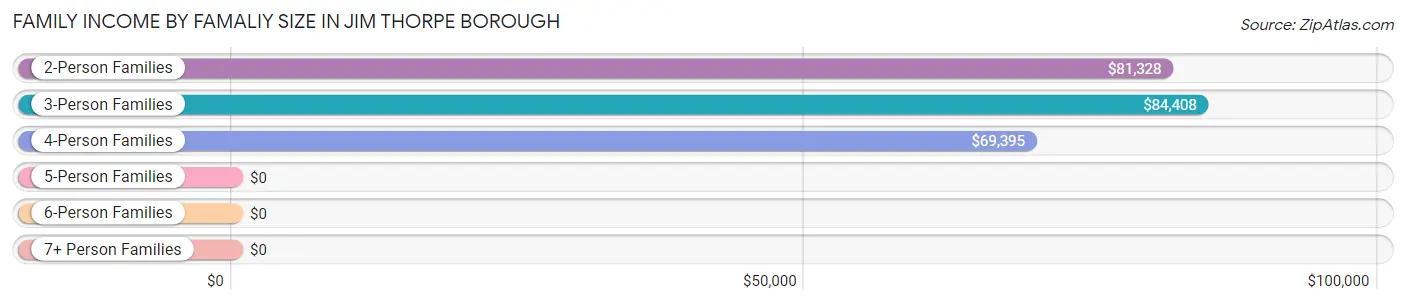
Family Income by Famaliy Size in Jim Thorpe borough
3-person families (262 | 20.6%) account for the highest median family income in Jim Thorpe borough with $84,408 per family, while 2-person families (786 | 61.8%) have the highest median income of $40,664 per family member.
| Income Bracket | # Families | Median Income |
| 2-Person Families | 786 (61.8%) | $81,328 |
| 3-Person Families | 262 (20.6%) | $84,408 |
| 4-Person Families | 193 (15.2%) | $69,395 |
| 5-Person Families | 31 (2.4%) | $0 |
| 6-Person Families | 0 (0.0%) | $0 |
| 7+ Person Families | 0 (0.0%) | $0 |
| Total | 1,272 (100.0%) | $82,895 |
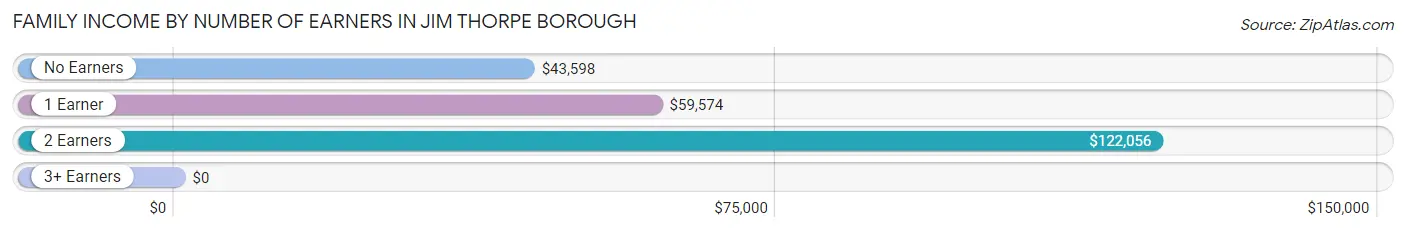
Family Income by Number of Earners in Jim Thorpe borough
| Number of Earners | # Families | Median Income |
| No Earners | 217 (17.1%) | $43,598 |
| 1 Earner | 446 (35.1%) | $59,574 |
| 2 Earners | 440 (34.6%) | $122,056 |
| 3+ Earners | 169 (13.3%) | $0 |
| Total | 1,272 (100.0%) | $82,895 |
Household Income in Jim Thorpe borough
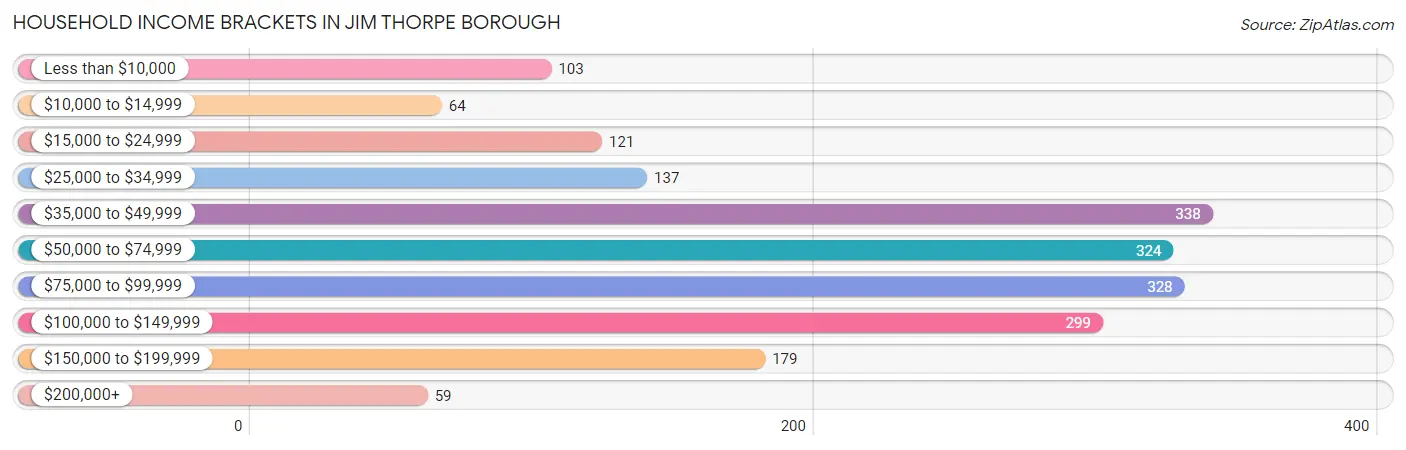
Household Income Brackets in Jim Thorpe borough
With 338 households falling in the category, the $35,000 to $49,999 income range is the most frequent in Jim Thorpe borough, accounting for 17.3% of all households. In contrast, only 59 households (3.0%) fall into the $200,000+ income bracket, making it the least populous group.
| Income Bracket | # Households | % Households |
| Less than $10,000 | 103 | 5.3% |
| $10,000 to $14,999 | 64 | 3.3% |
| $15,000 to $24,999 | 121 | 6.2% |
| $25,000 to $34,999 | 137 | 7.0% |
| $35,000 to $49,999 | 338 | 17.3% |
| $50,000 to $74,999 | 324 | 16.6% |
| $75,000 to $99,999 | 328 | 16.8% |
| $100,000 to $149,999 | 299 | 15.3% |
| $150,000 to $199,999 | 179 | 9.2% |
| $200,000+ | 59 | 3.0% |
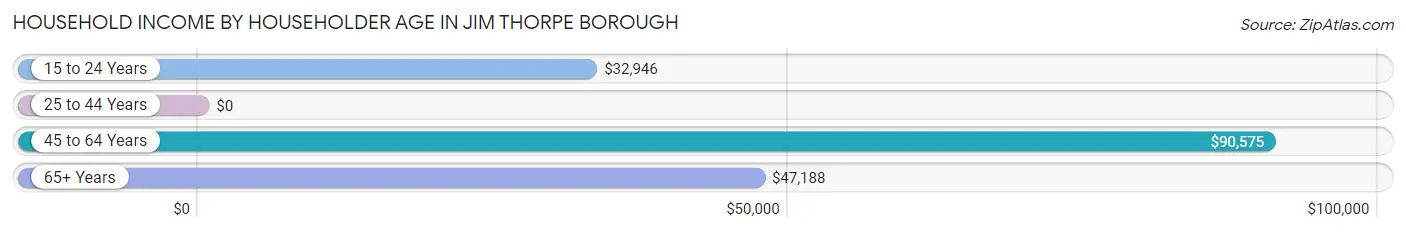
Household Income by Householder Age in Jim Thorpe borough
The median household income in Jim Thorpe borough is $64,594, with the highest median household income of $90,575 found in the 45 to 64 years age bracket for the primary householder. A total of 931 households (47.7%) fall into this category. Meanwhile, the 25 to 44 years age bracket for the primary householder has the lowest median household income of $0, with 296 households (15.2%) in this group.
| Income Bracket | # Households | Median Income |
| 15 to 24 Years | 55 (2.8%) | $32,946 |
| 25 to 44 Years | 296 (15.2%) | $0 |
| 45 to 64 Years | 931 (47.7%) | $90,575 |
| 65+ Years | 669 (34.3%) | $47,188 |
| Total | 1,951 (100.0%) | $64,594 |
Poverty in Jim Thorpe borough
Income Below Poverty by Sex and Age in Jim Thorpe borough
With 5.9% poverty level for males and 9.8% for females among the residents of Jim Thorpe borough, under 5 year old males and 12 to 14 year old females are the most vulnerable to poverty, with 49 males (73.1%) and 28 females (68.3%) in their respective age groups living below the poverty level.
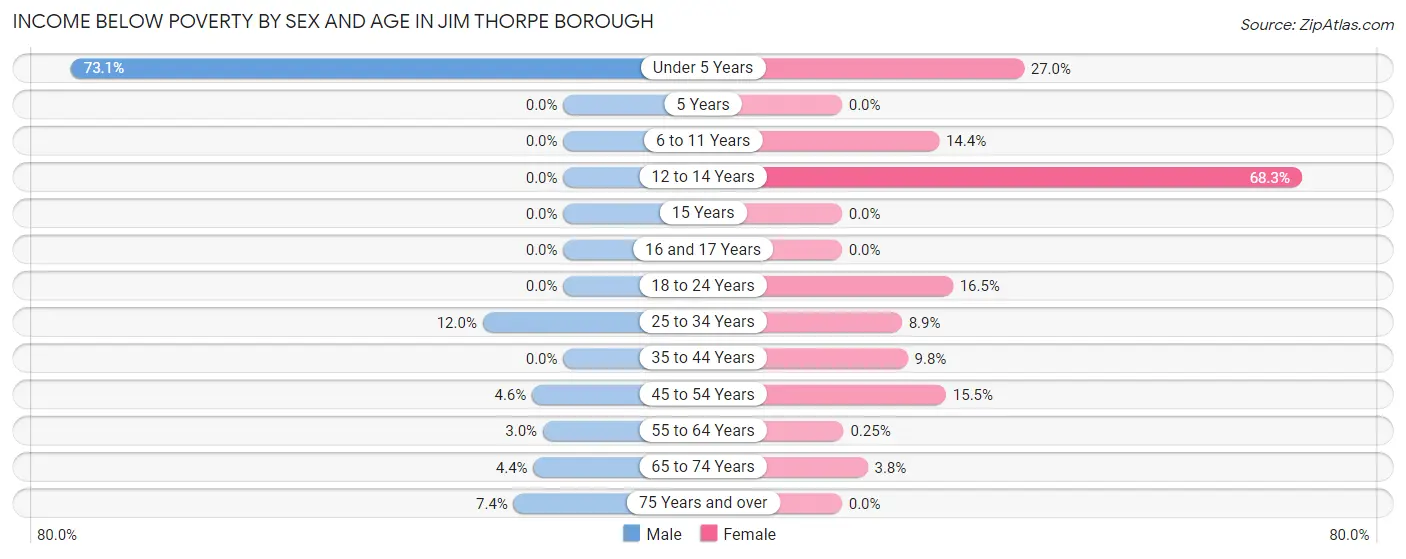
| Age Bracket | Male | Female |
| Under 5 Years | 49 (73.1%) | 40 (27.0%) |
| 5 Years | 0 (0.0%) | 0 (0.0%) |
| 6 to 11 Years | 0 (0.0%) | 14 (14.4%) |
| 12 to 14 Years | 0 (0.0%) | 28 (68.3%) |
| 15 Years | 0 (0.0%) | 0 (0.0%) |
| 16 and 17 Years | 0 (0.0%) | 0 (0.0%) |
| 18 to 24 Years | 0 (0.0%) | 14 (16.5%) |
| 25 to 34 Years | 37 (12.0%) | 25 (8.9%) |
| 35 to 44 Years | 0 (0.0%) | 13 (9.8%) |
| 45 to 54 Years | 15 (4.6%) | 57 (15.4%) |
| 55 to 64 Years | 15 (3.0%) | 1 (0.3%) |
| 65 to 74 Years | 12 (4.4%) | 13 (3.8%) |
| 75 Years and over | 14 (7.4%) | 0 (0.0%) |
| Total | 142 (5.9%) | 205 (9.8%) |
Income Above Poverty by Sex and Age in Jim Thorpe borough
According to the poverty statistics in Jim Thorpe borough, males aged 6 to 11 years and females aged 5 years are the age groups that are most secure financially, with 100.0% of males and 100.0% of females in these age groups living above the poverty line.
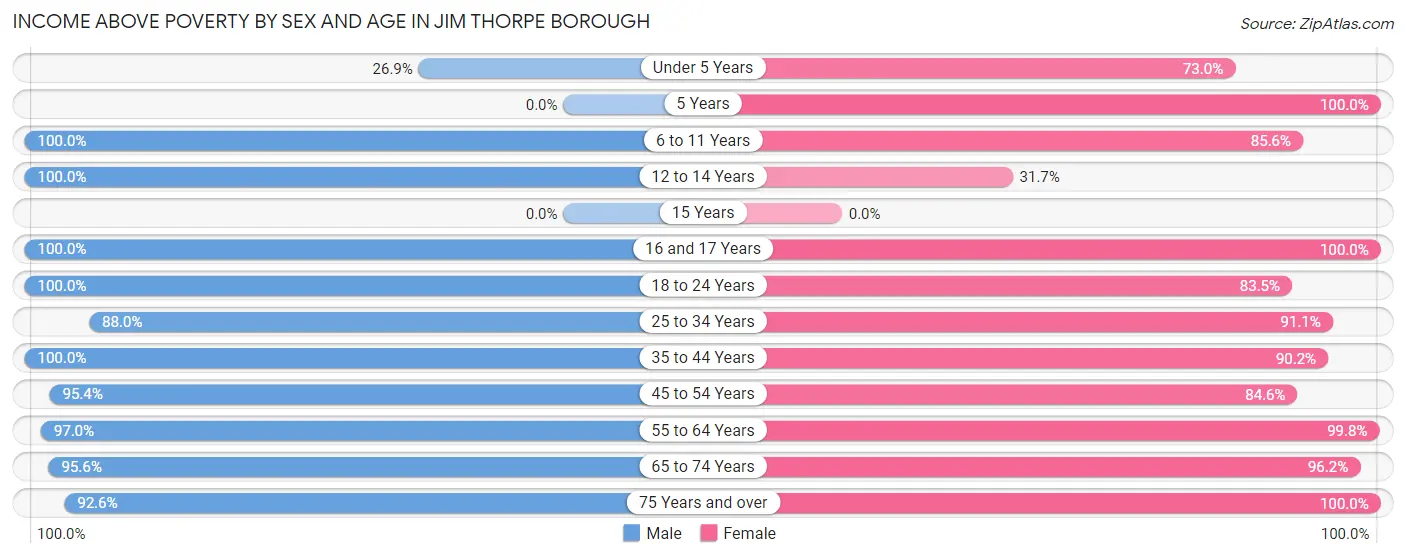
| Age Bracket | Male | Female |
| Under 5 Years | 18 (26.9%) | 108 (73.0%) |
| 5 Years | 0 (0.0%) | 16 (100.0%) |
| 6 to 11 Years | 235 (100.0%) | 83 (85.6%) |
| 12 to 14 Years | 31 (100.0%) | 13 (31.7%) |
| 15 Years | 0 (0.0%) | 0 (0.0%) |
| 16 and 17 Years | 100 (100.0%) | 36 (100.0%) |
| 18 to 24 Years | 152 (100.0%) | 71 (83.5%) |
| 25 to 34 Years | 272 (88.0%) | 256 (91.1%) |
| 35 to 44 Years | 241 (100.0%) | 120 (90.2%) |
| 45 to 54 Years | 308 (95.4%) | 312 (84.6%) |
| 55 to 64 Years | 480 (97.0%) | 402 (99.8%) |
| 65 to 74 Years | 258 (95.6%) | 327 (96.2%) |
| 75 Years and over | 176 (92.6%) | 139 (100.0%) |
| Total | 2,271 (94.1%) | 1,883 (90.2%) |
Income Below Poverty Among Married-Couple Families in Jim Thorpe borough
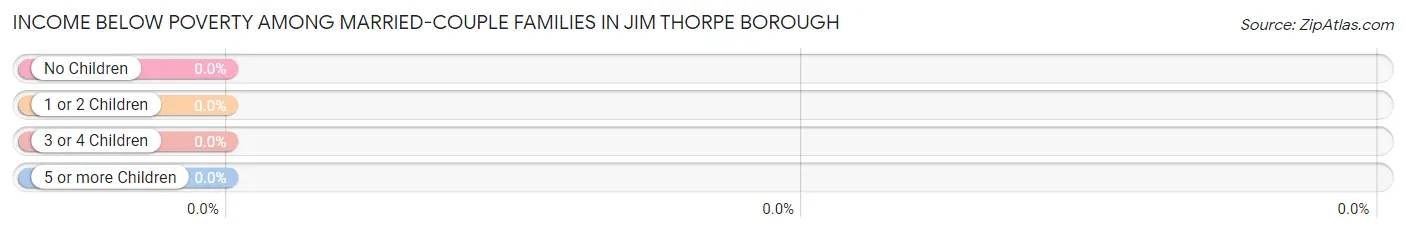
| Children | Above Poverty | Below Poverty |
| No Children | 592 (100.0%) | 0 (0.0%) |
| 1 or 2 Children | 134 (100.0%) | 0 (0.0%) |
| 3 or 4 Children | 31 (100.0%) | 0 (0.0%) |
| 5 or more Children | 0 (0.0%) | 0 (0.0%) |
| Total | 757 (100.0%) | 0 (0.0%) |
Income Below Poverty Among Single-Parent Households in Jim Thorpe borough
According to the poverty data in Jim Thorpe borough, 12.3% or 35 single-father households and 4.8% or 11 single-mother households are living below the poverty line. Among single-father households, those with 3 or 4 children have the highest poverty rate, with 35 households (100.0%) experiencing poverty. Likewise, among single-mother households, those with 1 or 2 children have the highest poverty rate, with 11 households (28.2%) falling below the poverty line.
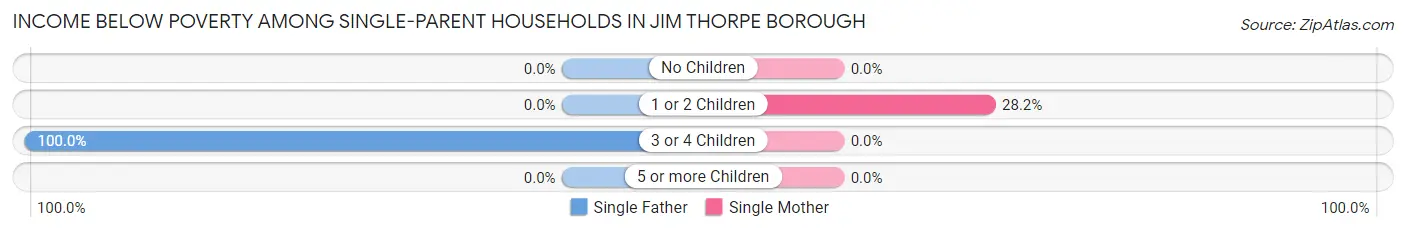
| Children | Single Father | Single Mother |
| No Children | 0 (0.0%) | 0 (0.0%) |
| 1 or 2 Children | 0 (0.0%) | 11 (28.2%) |
| 3 or 4 Children | 35 (100.0%) | 0 (0.0%) |
| 5 or more Children | 0 (0.0%) | 0 (0.0%) |
| Total | 35 (12.3%) | 11 (4.8%) |
Income Below Poverty Among Married-Couple vs Single-Parent Households in Jim Thorpe borough
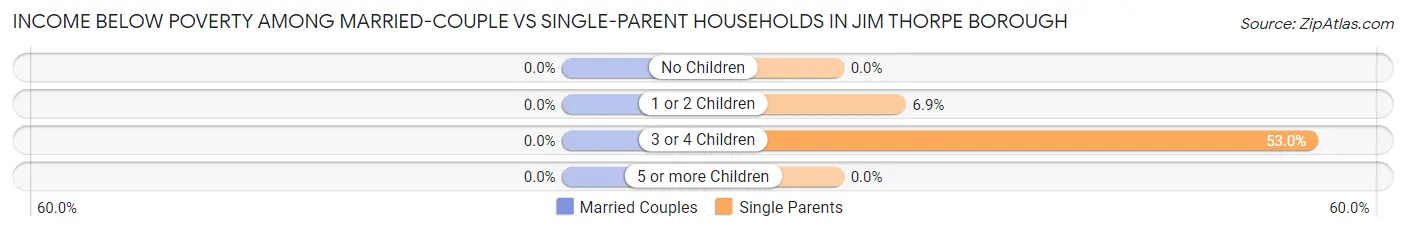
| Children | Married-Couple Families | Single-Parent Households |
| No Children | 0 (0.0%) | 0 (0.0%) |
| 1 or 2 Children | 0 (0.0%) | 11 (6.9%) |
| 3 or 4 Children | 0 (0.0%) | 35 (53.0%) |
| 5 or more Children | 0 (0.0%) | 0 (0.0%) |
| Total | 0 (0.0%) | 46 (8.9%) |
Race in Jim Thorpe borough
The most populous races in Jim Thorpe borough are White / Caucasian (4,463 | 98.5%), Hispanic or Latino (140 | 3.1%), and Black / African American (58 | 1.3%).
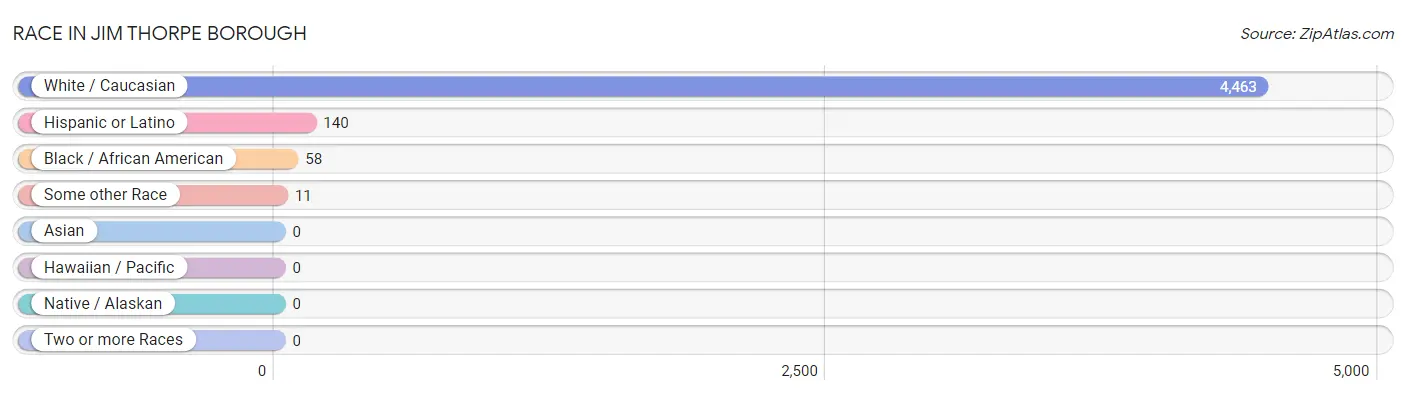
| Race | # Population | % Population |
| Asian | 0 | 0.0% |
| Black / African American | 58 | 1.3% |
| Hawaiian / Pacific | 0 | 0.0% |
| Hispanic or Latino | 140 | 3.1% |
| Native / Alaskan | 0 | 0.0% |
| White / Caucasian | 4,463 | 98.5% |
| Two or more Races | 0 | 0.0% |
| Some other Race | 11 | 0.2% |
| Total | 4,532 | 100.0% |
Ancestry in Jim Thorpe borough
The most populous ancestries reported in Jim Thorpe borough are German (1,865 | 41.1%), Irish (931 | 20.5%), Italian (628 | 13.9%), Polish (360 | 7.9%), and English (352 | 7.8%), together accounting for 91.3% of all Jim Thorpe borough residents.
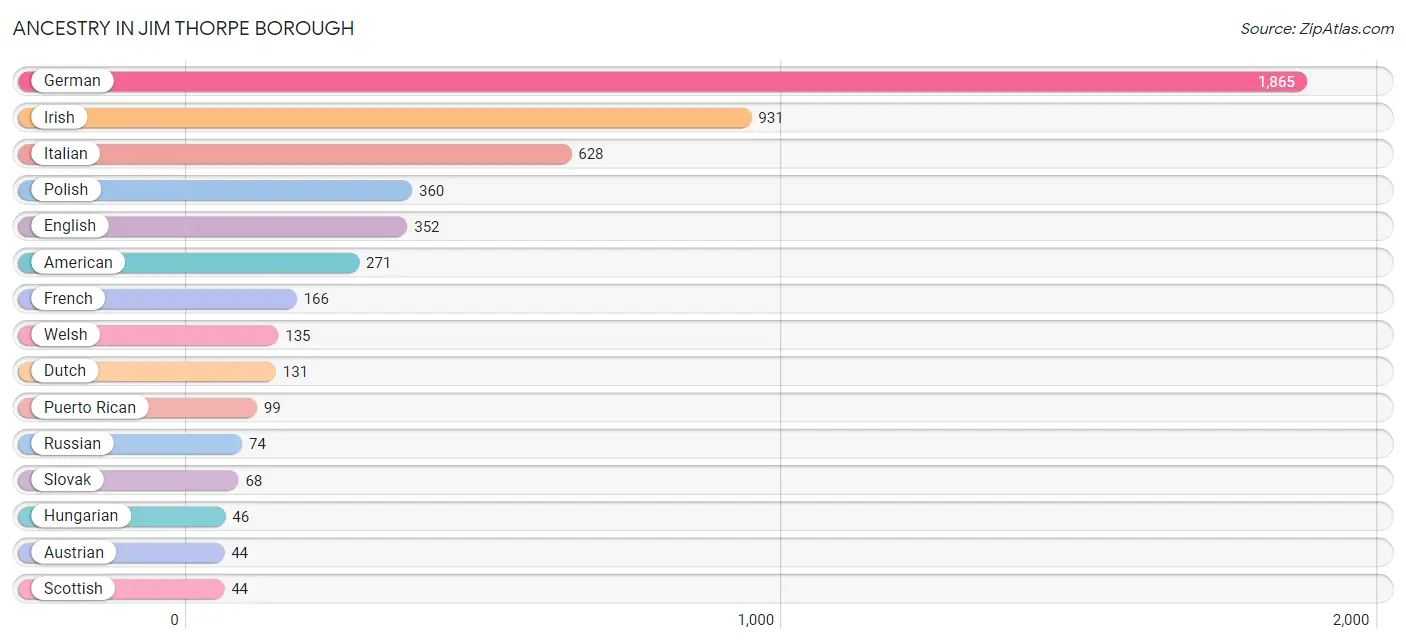
| Ancestry | # Population | % Population |
| American | 271 | 6.0% |
| Arab | 10 | 0.2% |
| Austrian | 44 | 1.0% |
| British | 42 | 0.9% |
| Croatian | 23 | 0.5% |
| Czechoslovakian | 15 | 0.3% |
| Danish | 10 | 0.2% |
| Dutch | 131 | 2.9% |
| English | 352 | 7.8% |
| French | 166 | 3.7% |
| German | 1,865 | 41.1% |
| Hungarian | 46 | 1.0% |
| Irish | 931 | 20.5% |
| Italian | 628 | 13.9% |
| Mexican | 9 | 0.2% |
| Norwegian | 11 | 0.2% |
| Pennsylvania German | 19 | 0.4% |
| Polish | 360 | 7.9% |
| Puerto Rican | 99 | 2.2% |
| Romanian | 15 | 0.3% |
| Russian | 74 | 1.6% |
| Scotch-Irish | 24 | 0.5% |
| Scottish | 44 | 1.0% |
| Slovak | 68 | 1.5% |
| Swiss | 10 | 0.2% |
| Syrian | 10 | 0.2% |
| Welsh | 135 | 3.0% | View All 27 Rows |
Immigrants in Jim Thorpe borough
The most numerous immigrant groups reported in Jim Thorpe borough came from Eastern Europe (17 | 0.4%), Europe (17 | 0.4%), and Poland (17 | 0.4%), together accounting for 1.1% of all Jim Thorpe borough residents.
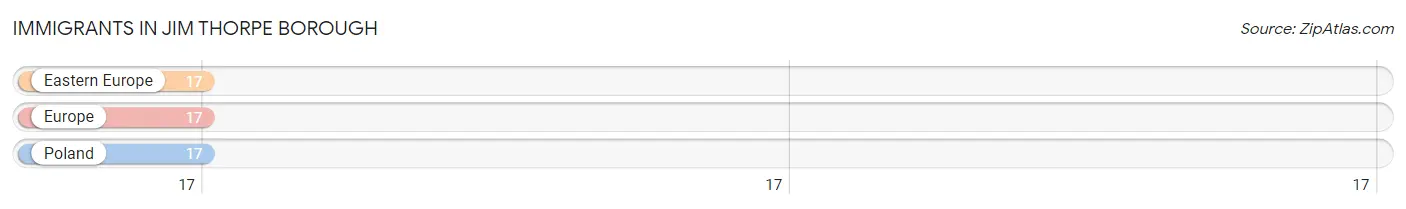
| Immigration Origin | # Population | % Population |
| Eastern Europe | 17 | 0.4% |
| Europe | 17 | 0.4% |
| Poland | 17 | 0.4% | View All 3 Rows |
Sex and Age in Jim Thorpe borough
Sex and Age in Jim Thorpe borough
The most populous age groups in Jim Thorpe borough are 60 to 64 Years (337 | 13.8%) for men and 30 to 34 Years (256 | 12.3%) for women.
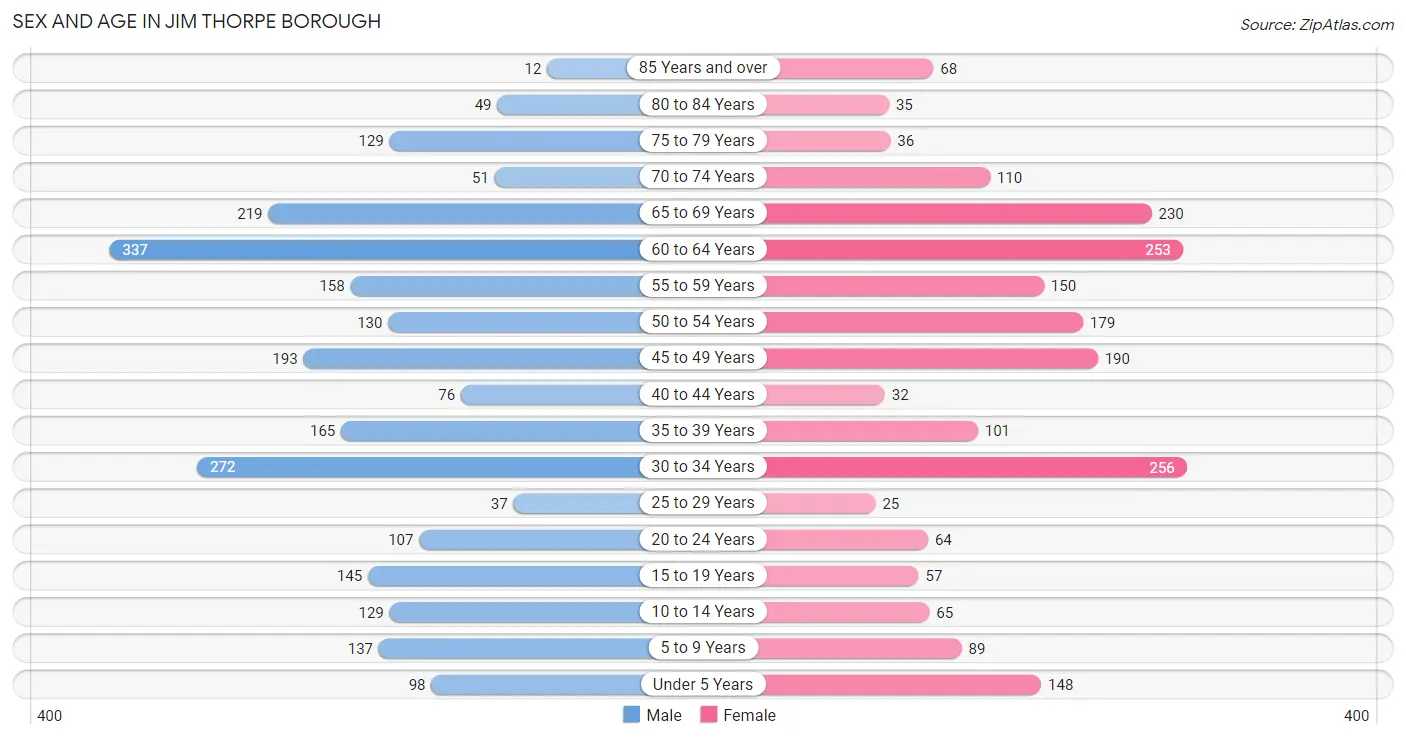
| Age Bracket | Male | Female |
| Under 5 Years | 98 (4.0%) | 148 (7.1%) |
| 5 to 9 Years | 137 (5.6%) | 89 (4.3%) |
| 10 to 14 Years | 129 (5.3%) | 65 (3.1%) |
| 15 to 19 Years | 145 (5.9%) | 57 (2.7%) |
| 20 to 24 Years | 107 (4.4%) | 64 (3.1%) |
| 25 to 29 Years | 37 (1.5%) | 25 (1.2%) |
| 30 to 34 Years | 272 (11.1%) | 256 (12.3%) |
| 35 to 39 Years | 165 (6.8%) | 101 (4.8%) |
| 40 to 44 Years | 76 (3.1%) | 32 (1.5%) |
| 45 to 49 Years | 193 (7.9%) | 190 (9.1%) |
| 50 to 54 Years | 130 (5.3%) | 179 (8.6%) |
| 55 to 59 Years | 158 (6.5%) | 150 (7.2%) |
| 60 to 64 Years | 337 (13.8%) | 253 (12.1%) |
| 65 to 69 Years | 219 (9.0%) | 230 (11.0%) |
| 70 to 74 Years | 51 (2.1%) | 110 (5.3%) |
| 75 to 79 Years | 129 (5.3%) | 36 (1.7%) |
| 80 to 84 Years | 49 (2.0%) | 35 (1.7%) |
| 85 Years and over | 12 (0.5%) | 68 (3.3%) |
| Total | 2,444 (100.0%) | 2,088 (100.0%) |
Families and Households in Jim Thorpe borough
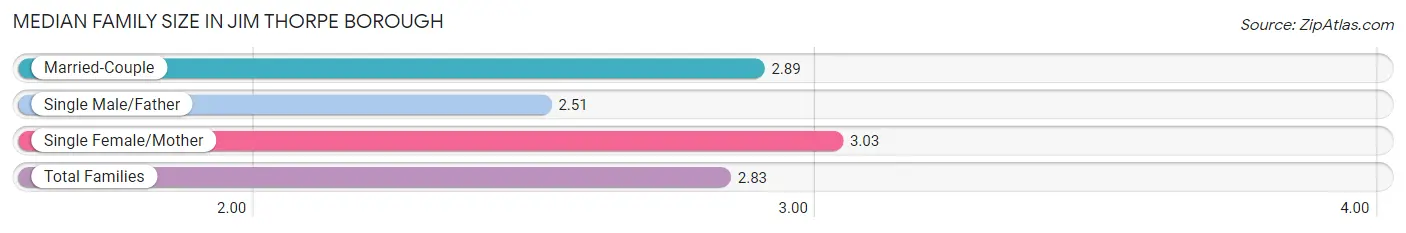
Median Family Size in Jim Thorpe borough
The median family size in Jim Thorpe borough is 2.83 persons per family, with single female/mother families (230 | 18.1%) accounting for the largest median family size of 3.03 persons per family. On the other hand, single male/father families (285 | 22.4%) represent the smallest median family size with 2.51 persons per family.
| Family Type | # Families | Family Size |
| Married-Couple | 757 (59.5%) | 2.89 |
| Single Male/Father | 285 (22.4%) | 2.51 |
| Single Female/Mother | 230 (18.1%) | 3.03 |
| Total Families | 1,272 (100.0%) | 2.83 |
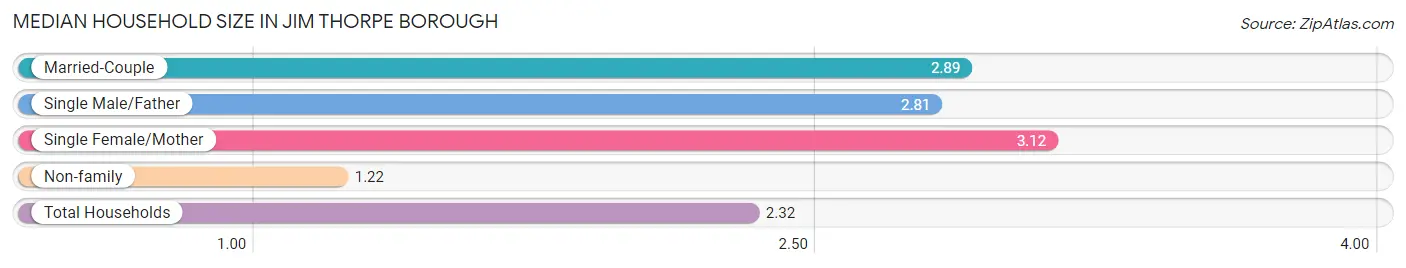
Median Household Size in Jim Thorpe borough
The median household size in Jim Thorpe borough is 2.32 persons per household, with single female/mother households (230 | 11.8%) accounting for the largest median household size of 3.12 persons per household. non-family households (679 | 34.8%) represent the smallest median household size with 1.22 persons per household.
| Household Type | # Households | Household Size |
| Married-Couple | 757 (38.8%) | 2.89 |
| Single Male/Father | 285 (14.6%) | 2.81 |
| Single Female/Mother | 230 (11.8%) | 3.12 |
| Non-family | 679 (34.8%) | 1.22 |
| Total Households | 1,951 (100.0%) | 2.32 |
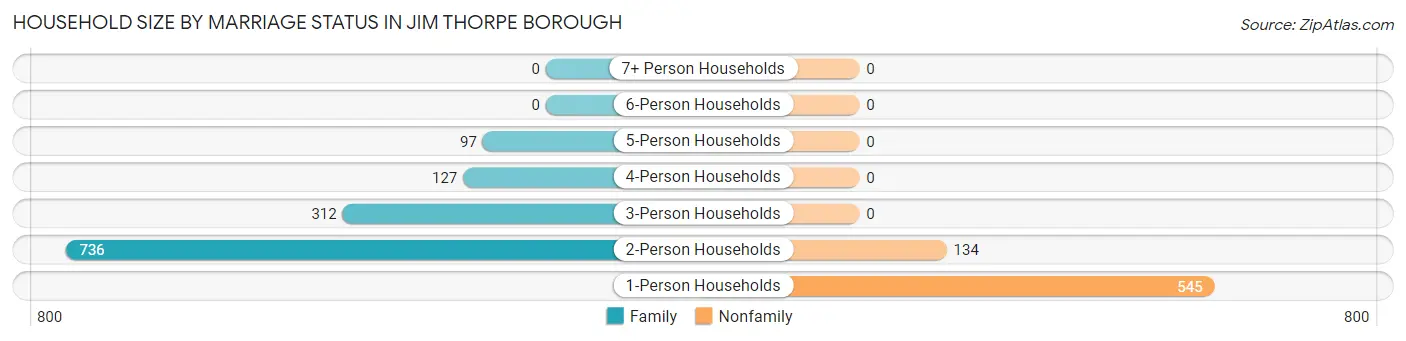
Household Size by Marriage Status in Jim Thorpe borough
Out of a total of 1,951 households in Jim Thorpe borough, 1,272 (65.2%) are family households, while 679 (34.8%) are nonfamily households. The most numerous type of family households are 2-person households, comprising 736, and the most common type of nonfamily households are 1-person households, comprising 545.
| Household Size | Family Households | Nonfamily Households |
| 1-Person Households | - | 545 (27.9%) |
| 2-Person Households | 736 (37.7%) | 134 (6.9%) |
| 3-Person Households | 312 (16.0%) | 0 (0.0%) |
| 4-Person Households | 127 (6.5%) | 0 (0.0%) |
| 5-Person Households | 97 (5.0%) | 0 (0.0%) |
| 6-Person Households | 0 (0.0%) | 0 (0.0%) |
| 7+ Person Households | 0 (0.0%) | 0 (0.0%) |
| Total | 1,272 (65.2%) | 679 (34.8%) |
Female Fertility in Jim Thorpe borough
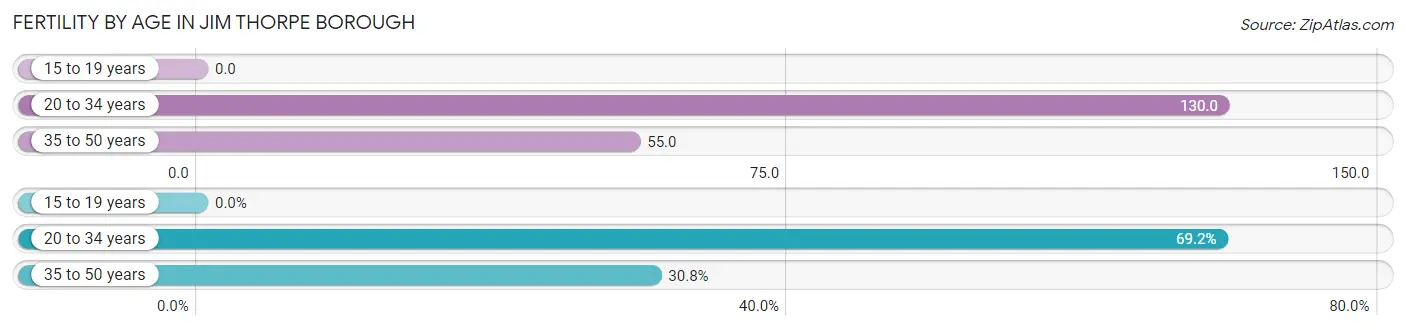
Fertility by Age in Jim Thorpe borough
Average fertility rate in Jim Thorpe borough is 85.0 births per 1,000 women. Women in the age bracket of 20 to 34 years have the highest fertility rate with 130.0 births per 1,000 women. Women in the age bracket of 20 to 34 years acount for 69.2% of all women with births.
| Age Bracket | Women with Births | Births / 1,000 Women |
| 15 to 19 years | 0 (0.0%) | 0.0 |
| 20 to 34 years | 45 (69.2%) | 130.0 |
| 35 to 50 years | 20 (30.8%) | 55.0 |
| Total | 65 (100.0%) | 85.0 |
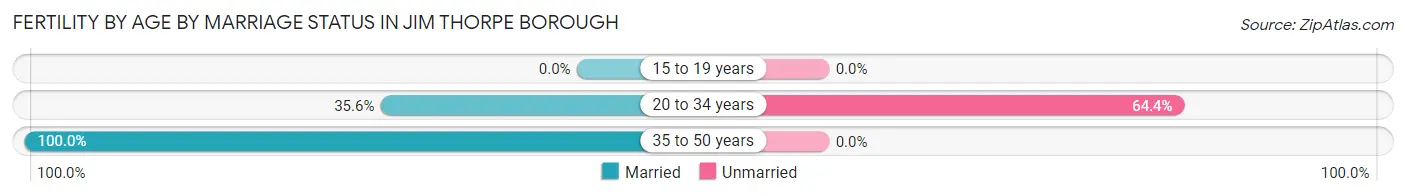
Fertility by Age by Marriage Status in Jim Thorpe borough
55.4% of women with births (65) in Jim Thorpe borough are married. The highest percentage of unmarried women with births falls into 20 to 34 years age bracket with 64.4% of them unmarried at the time of birth, while the lowest percentage of unmarried women with births belong to 35 to 50 years age bracket with 0.0% of them unmarried.
| Age Bracket | Married | Unmarried |
| 15 to 19 years | 0 (0.0%) | 0 (0.0%) |
| 20 to 34 years | 16 (35.6%) | 29 (64.4%) |
| 35 to 50 years | 20 (100.0%) | 0 (0.0%) |
| Total | 36 (55.4%) | 29 (44.6%) |
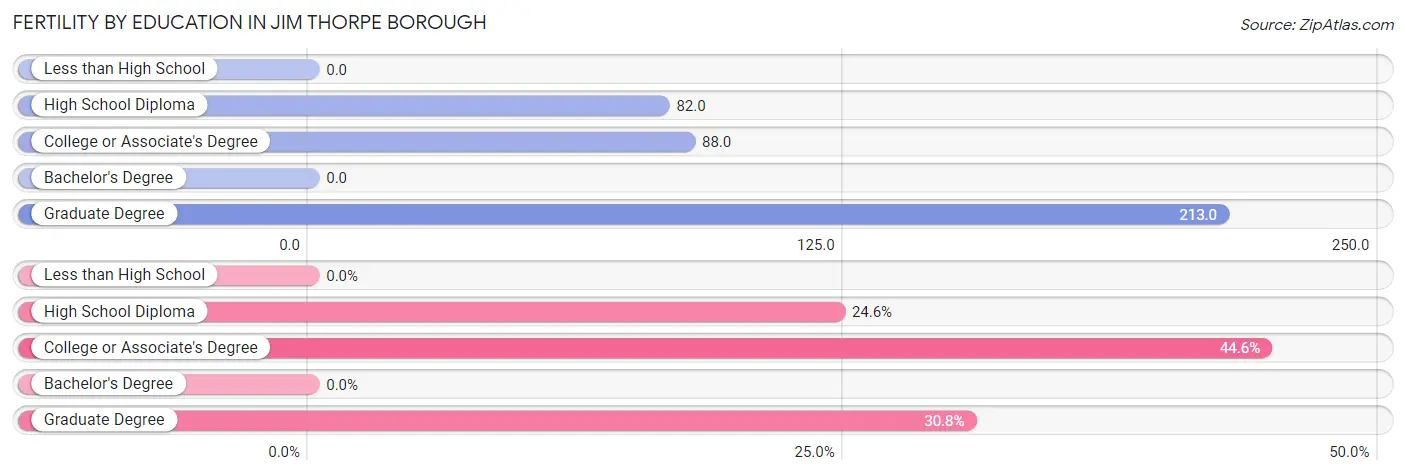
Fertility by Education in Jim Thorpe borough
| Educational Attainment | Women with Births | Births / 1,000 Women |
| Less than High School | 0 (0.0%) | 0.0 |
| High School Diploma | 16 (24.6%) | 82.0 |
| College or Associate's Degree | 29 (44.6%) | 88.0 |
| Bachelor's Degree | 0 (0.0%) | 0.0 |
| Graduate Degree | 20 (30.8%) | 213.0 |
| Total | 65 (100.0%) | 85.0 |
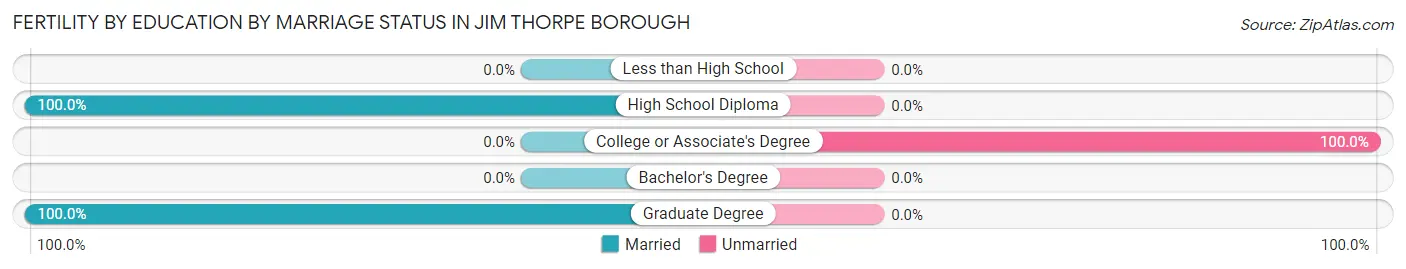
Fertility by Education by Marriage Status in Jim Thorpe borough
44.6% of women with births in Jim Thorpe borough are unmarried. Women with the educational attainment of high school diploma are most likely to be married with 100.0% of them married at childbirth, while women with the educational attainment of college or associate's degree are least likely to be married with 100.0% of them unmarried at childbirth.
| Educational Attainment | Married | Unmarried |
| Less than High School | 0 (0.0%) | 0 (0.0%) |
| High School Diploma | 16 (100.0%) | 0 (0.0%) |
| College or Associate's Degree | 0 (0.0%) | 29 (100.0%) |
| Bachelor's Degree | 0 (0.0%) | 0 (0.0%) |
| Graduate Degree | 20 (100.0%) | 0 (0.0%) |
| Total | 36 (55.4%) | 29 (44.6%) |
Employment Characteristics in Jim Thorpe borough
Employment by Class of Employer in Jim Thorpe borough
Among the 2,247 employed individuals in Jim Thorpe borough, private company employees (1,463 | 65.1%), not-for-profit organizations (279 | 12.4%), and local government employees (229 | 10.2%) make up the most common classes of employment.
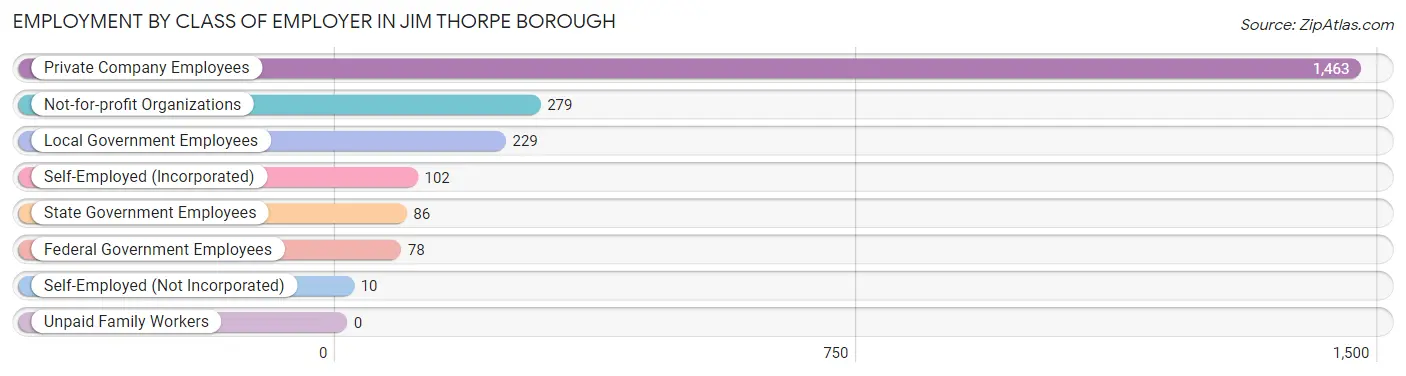
| Employer Class | # Employees | % Employees |
| Private Company Employees | 1,463 | 65.1% |
| Self-Employed (Incorporated) | 102 | 4.5% |
| Self-Employed (Not Incorporated) | 10 | 0.4% |
| Not-for-profit Organizations | 279 | 12.4% |
| Local Government Employees | 229 | 10.2% |
| State Government Employees | 86 | 3.8% |
| Federal Government Employees | 78 | 3.5% |
| Unpaid Family Workers | 0 | 0.0% |
| Total | 2,247 | 100.0% |
Employment Status by Age in Jim Thorpe borough
According to the labor force statistics for Jim Thorpe borough, out of the total population over 16 years of age (3,866), 64.1% or 2,478 individuals are in the labor force, with 1.9% or 47 of them unemployed. The age group with the highest labor force participation rate is 45 to 54 years, with 87.6% or 606 individuals in the labor force. Within the labor force, the 60 to 64 years age range has the highest percentage of unemployed individuals, with 12.7% or 47 of them being unemployed.
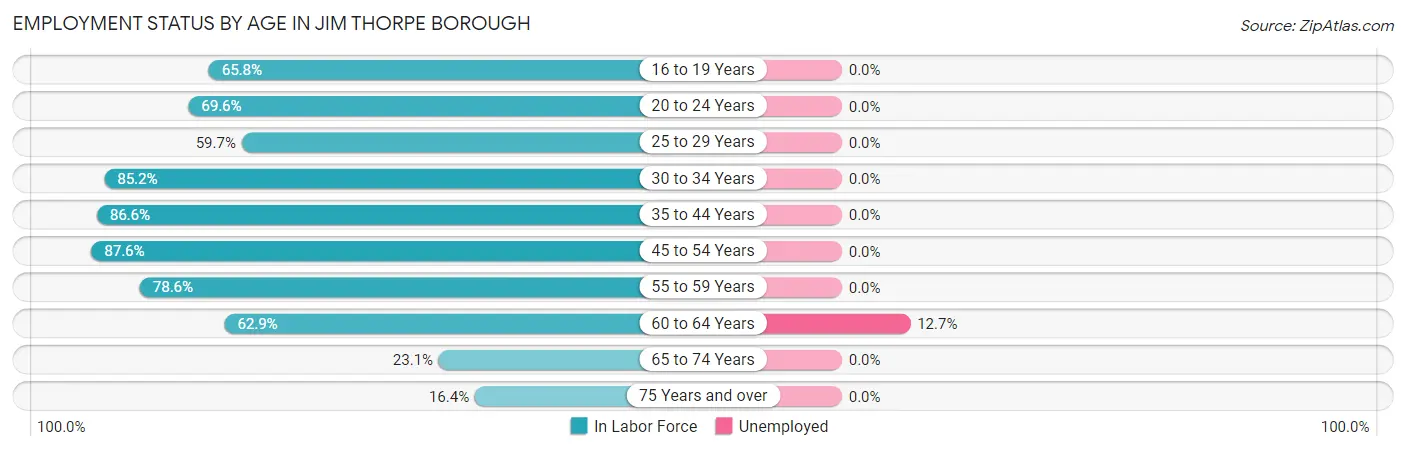
| Age Bracket | In Labor Force | Unemployed |
| 16 to 19 Years | 133 (65.8%) | 0 (0.0%) |
| 20 to 24 Years | 119 (69.6%) | 0 (0.0%) |
| 25 to 29 Years | 37 (59.7%) | 0 (0.0%) |
| 30 to 34 Years | 450 (85.2%) | 0 (0.0%) |
| 35 to 44 Years | 324 (86.6%) | 0 (0.0%) |
| 45 to 54 Years | 606 (87.6%) | 0 (0.0%) |
| 55 to 59 Years | 242 (78.6%) | 0 (0.0%) |
| 60 to 64 Years | 371 (62.9%) | 47 (12.7%) |
| 65 to 74 Years | 141 (23.1%) | 0 (0.0%) |
| 75 Years and over | 54 (16.4%) | 0 (0.0%) |
| Total | 2,478 (64.1%) | 47 (1.9%) |
Employment Status by Educational Attainment in Jim Thorpe borough
According to labor force statistics for Jim Thorpe borough, 79.5% of individuals (2,030) out of the total population between 25 and 64 years of age (2,554) are in the labor force, with 2.3% or 47 of them being unemployed. The group with the highest labor force participation rate are those with the educational attainment of bachelor's degree or higher, with 95.6% or 591 individuals in the labor force. Within the labor force, individuals with less than high school education have the highest percentage of unemployment, with 45.0% or 36 of them being unemployed.
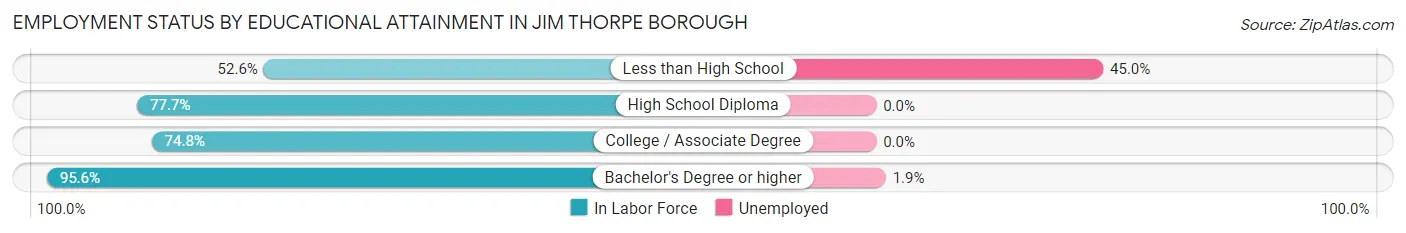
| Educational Attainment | In Labor Force | Unemployed |
| Less than High School | 80 (52.6%) | 68 (45.0%) |
| High School Diploma | 681 (77.7%) | 0 (0.0%) |
| College / Associate Degree | 678 (74.8%) | 0 (0.0%) |
| Bachelor's Degree or higher | 591 (95.6%) | 12 (1.9%) |
| Total | 2,030 (79.5%) | 59 (2.3%) |
Employment Occupations by Sex in Jim Thorpe borough
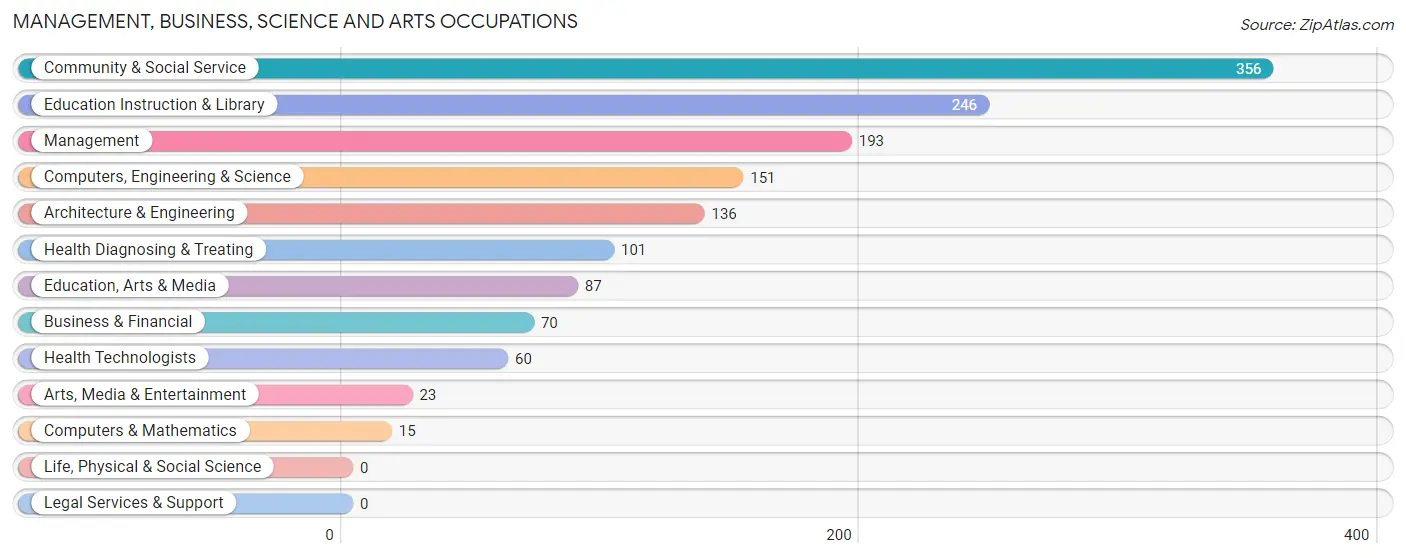
Management, Business, Science and Arts Occupations
The most common Management, Business, Science and Arts occupations in Jim Thorpe borough are Community & Social Service (356 | 14.6%), Education Instruction & Library (246 | 10.1%), Management (193 | 7.9%), Computers, Engineering & Science (151 | 6.2%), and Architecture & Engineering (136 | 5.6%).
Management, Business, Science and Arts Occupations by Sex
Within the Management, Business, Science and Arts occupations in Jim Thorpe borough, the most male-oriented occupations are Computers, Engineering & Science (100.0%), Computers & Mathematics (100.0%), and Architecture & Engineering (100.0%), while the most female-oriented occupations are Arts, Media & Entertainment (100.0%), Education Instruction & Library (85.0%), and Community & Social Service (73.3%).
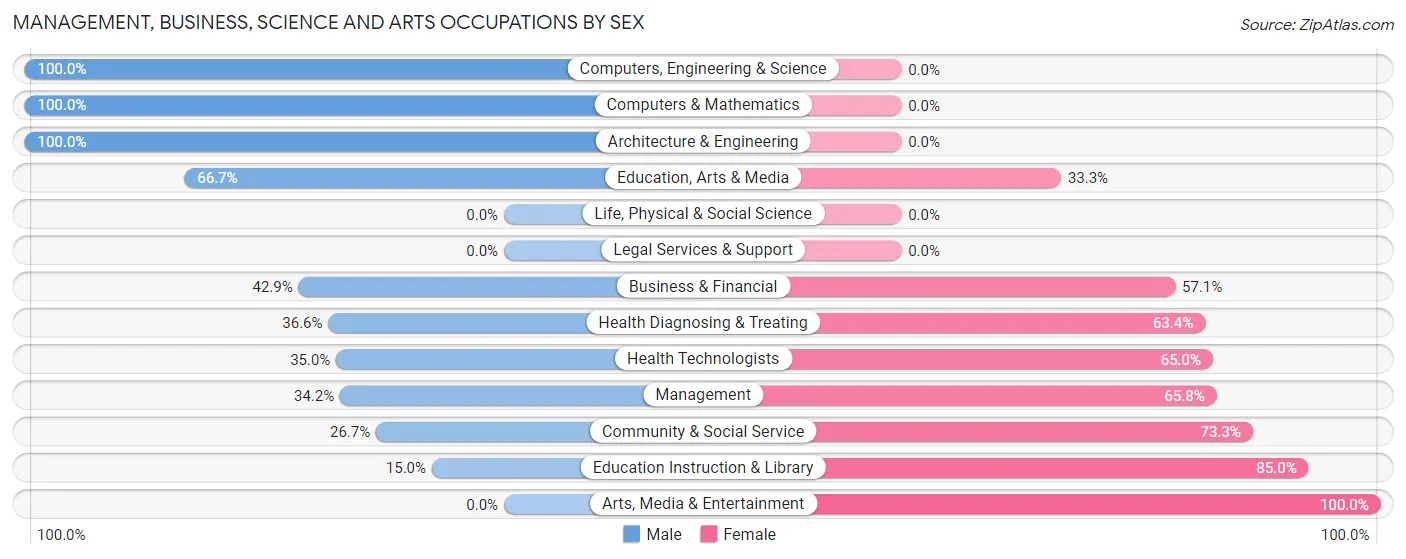
| Occupation | Male | Female |
| Management | 66 (34.2%) | 127 (65.8%) |
| Business & Financial | 30 (42.9%) | 40 (57.1%) |
| Computers, Engineering & Science | 151 (100.0%) | 0 (0.0%) |
| Computers & Mathematics | 15 (100.0%) | 0 (0.0%) |
| Architecture & Engineering | 136 (100.0%) | 0 (0.0%) |
| Life, Physical & Social Science | 0 (0.0%) | 0 (0.0%) |
| Community & Social Service | 95 (26.7%) | 261 (73.3%) |
| Education, Arts & Media | 58 (66.7%) | 29 (33.3%) |
| Legal Services & Support | 0 (0.0%) | 0 (0.0%) |
| Education Instruction & Library | 37 (15.0%) | 209 (85.0%) |
| Arts, Media & Entertainment | 0 (0.0%) | 23 (100.0%) |
| Health Diagnosing & Treating | 37 (36.6%) | 64 (63.4%) |
| Health Technologists | 21 (35.0%) | 39 (65.0%) |
| Total (Category) | 379 (43.5%) | 492 (56.5%) |
| Total (Overall) | 1,381 (56.8%) | 1,049 (43.2%) |
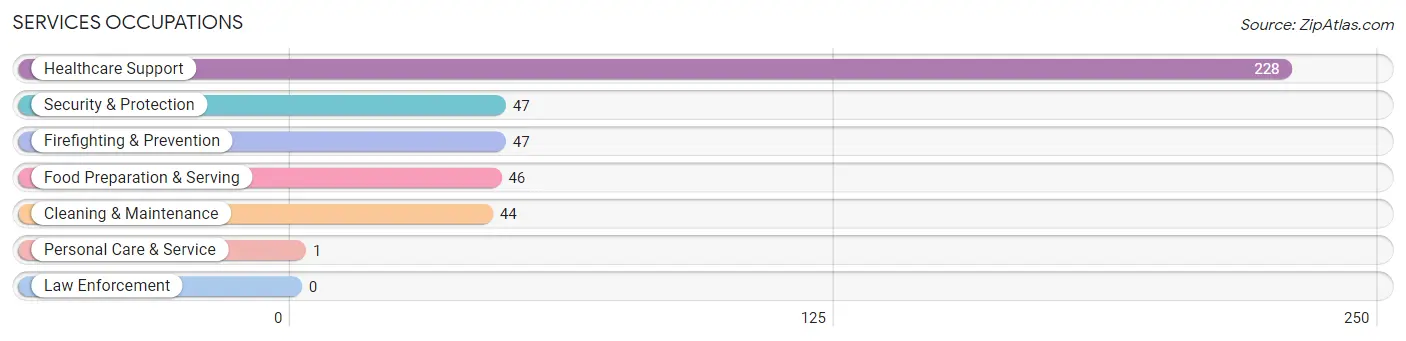
Services Occupations
The most common Services occupations in Jim Thorpe borough are Healthcare Support (228 | 9.4%), Security & Protection (47 | 1.9%), Firefighting & Prevention (47 | 1.9%), Food Preparation & Serving (46 | 1.9%), and Cleaning & Maintenance (44 | 1.8%).
Services Occupations by Sex
Within the Services occupations in Jim Thorpe borough, the most male-oriented occupations are Security & Protection (100.0%), Firefighting & Prevention (100.0%), and Cleaning & Maintenance (38.6%), while the most female-oriented occupations are Food Preparation & Serving (100.0%), Personal Care & Service (100.0%), and Healthcare Support (93.9%).
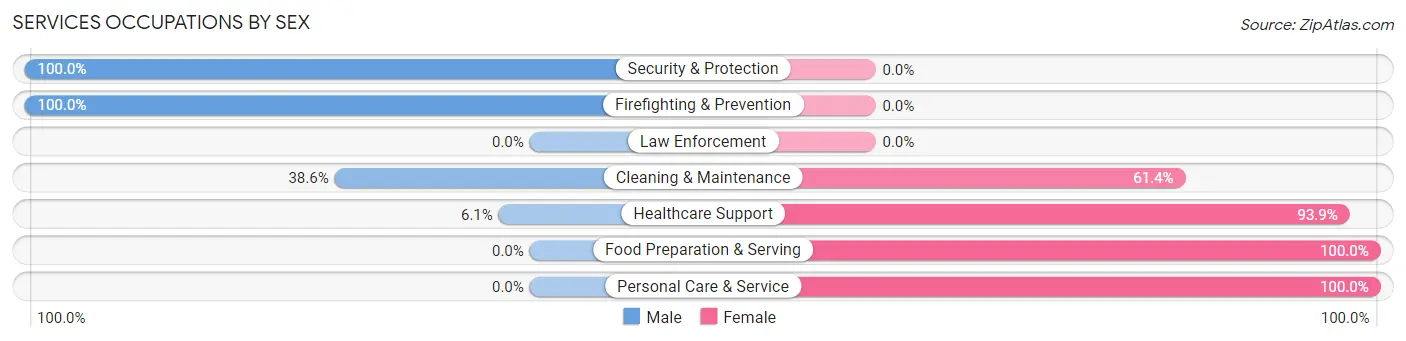
| Occupation | Male | Female |
| Healthcare Support | 14 (6.1%) | 214 (93.9%) |
| Security & Protection | 47 (100.0%) | 0 (0.0%) |
| Firefighting & Prevention | 47 (100.0%) | 0 (0.0%) |
| Law Enforcement | 0 (0.0%) | 0 (0.0%) |
| Food Preparation & Serving | 0 (0.0%) | 46 (100.0%) |
| Cleaning & Maintenance | 17 (38.6%) | 27 (61.4%) |
| Personal Care & Service | 0 (0.0%) | 1 (100.0%) |
| Total (Category) | 78 (21.3%) | 288 (78.7%) |
| Total (Overall) | 1,381 (56.8%) | 1,049 (43.2%) |
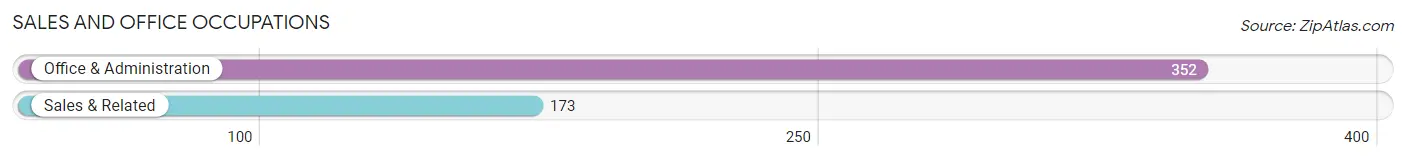
Sales and Office Occupations
The most common Sales and Office occupations in Jim Thorpe borough are Office & Administration (352 | 14.5%), and Sales & Related (173 | 7.1%).
Sales and Office Occupations by Sex
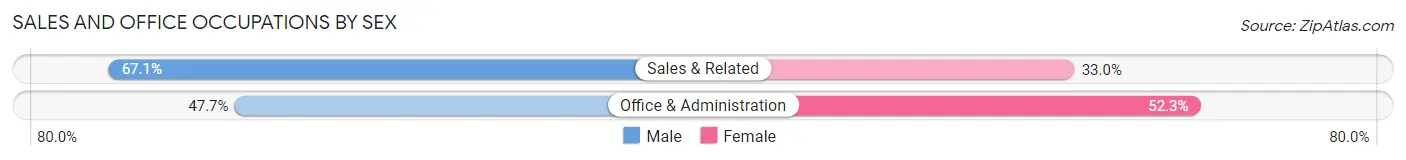
| Occupation | Male | Female |
| Sales & Related | 116 (67.0%) | 57 (33.0%) |
| Office & Administration | 168 (47.7%) | 184 (52.3%) |
| Total (Category) | 284 (54.1%) | 241 (45.9%) |
| Total (Overall) | 1,381 (56.8%) | 1,049 (43.2%) |
Natural Resources, Construction and Maintenance Occupations
The most common Natural Resources, Construction and Maintenance occupations in Jim Thorpe borough are Construction & Extraction (138 | 5.7%), and Installation, Maintenance & Repair (28 | 1.1%).
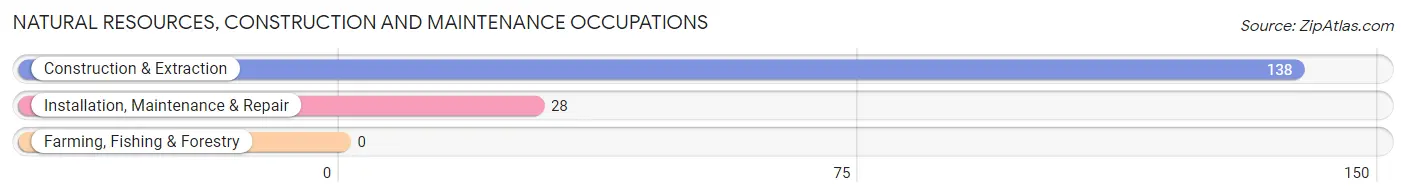
Natural Resources, Construction and Maintenance Occupations by Sex

| Occupation | Male | Female |
| Farming, Fishing & Forestry | 0 (0.0%) | 0 (0.0%) |
| Construction & Extraction | 138 (100.0%) | 0 (0.0%) |
| Installation, Maintenance & Repair | 28 (100.0%) | 0 (0.0%) |
| Total (Category) | 166 (100.0%) | 0 (0.0%) |
| Total (Overall) | 1,381 (56.8%) | 1,049 (43.2%) |
Production, Transportation and Moving Occupations
The most common Production, Transportation and Moving occupations in Jim Thorpe borough are Production (289 | 11.9%), Transportation (149 | 6.1%), and Material Moving (64 | 2.6%).
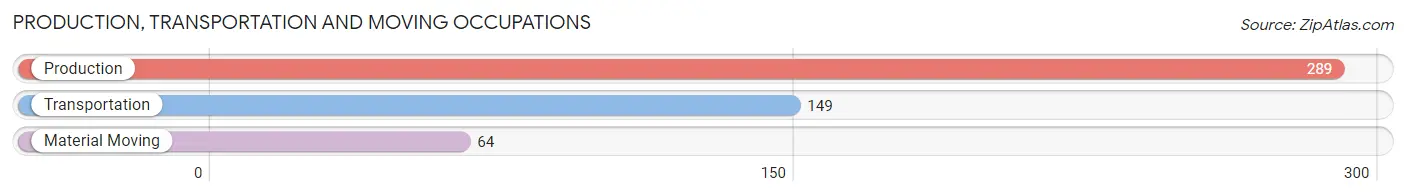
Production, Transportation and Moving Occupations by Sex
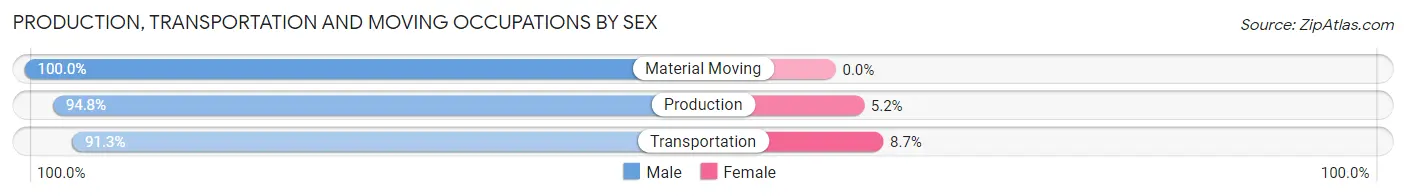
| Occupation | Male | Female |
| Production | 274 (94.8%) | 15 (5.2%) |
| Transportation | 136 (91.3%) | 13 (8.7%) |
| Material Moving | 64 (100.0%) | 0 (0.0%) |
| Total (Category) | 474 (94.4%) | 28 (5.6%) |
| Total (Overall) | 1,381 (56.8%) | 1,049 (43.2%) |
Employment Industries by Sex in Jim Thorpe borough
Employment Industries in Jim Thorpe borough
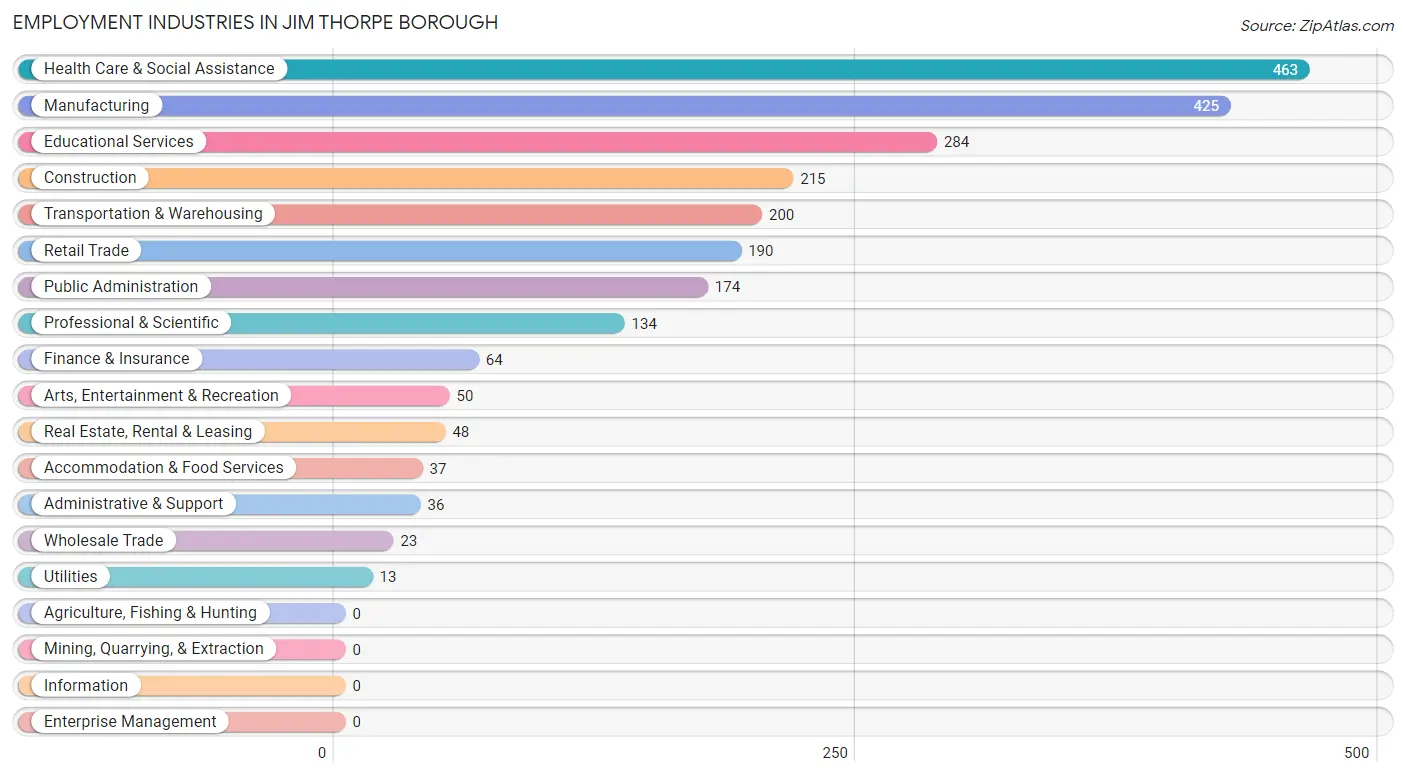
The major employment industries in Jim Thorpe borough include Health Care & Social Assistance (463 | 19.1%), Manufacturing (425 | 17.5%), Educational Services (284 | 11.7%), Construction (215 | 8.8%), and Transportation & Warehousing (200 | 8.2%).
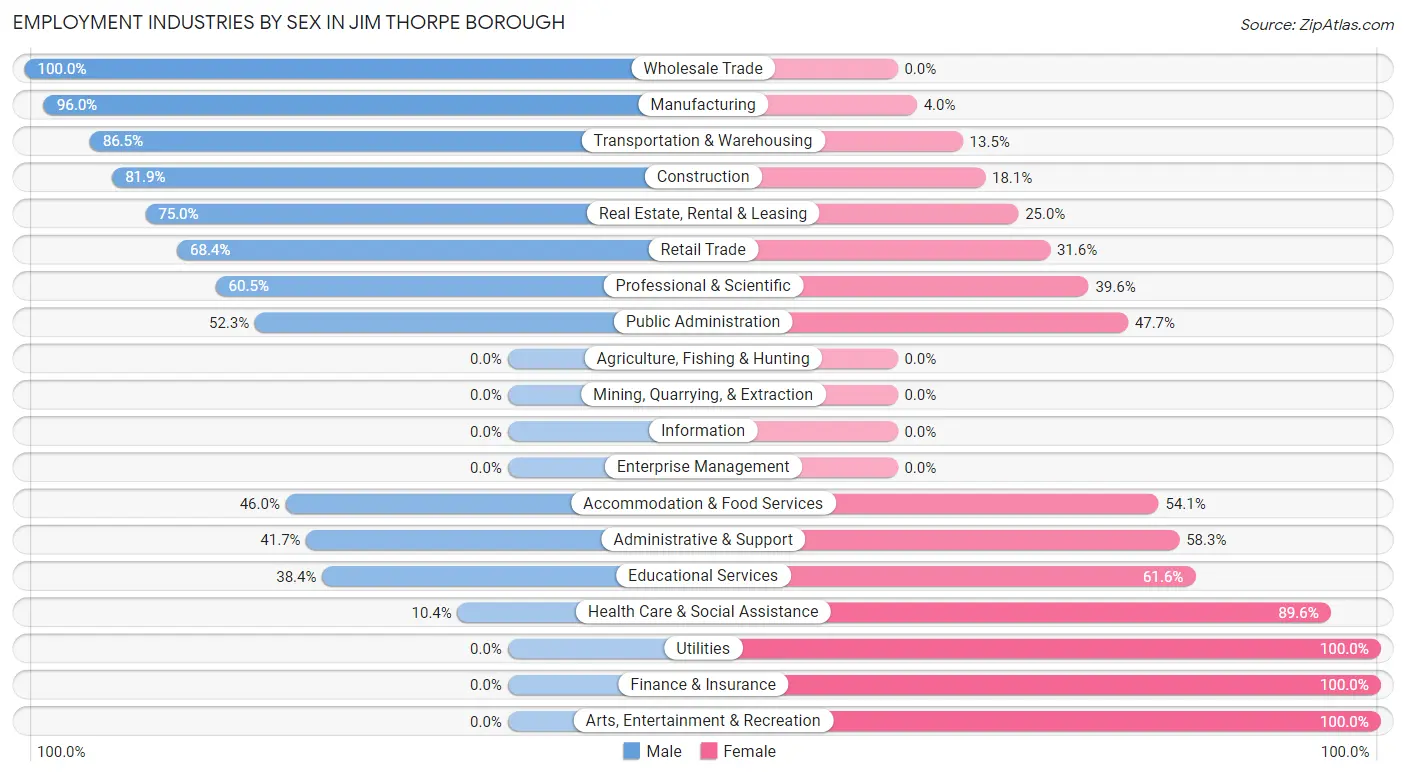
Employment Industries by Sex in Jim Thorpe borough
The Jim Thorpe borough industries that see more men than women are Wholesale Trade (100.0%), Manufacturing (96.0%), and Transportation & Warehousing (86.5%), whereas the industries that tend to have a higher number of women are Utilities (100.0%), Finance & Insurance (100.0%), and Arts, Entertainment & Recreation (100.0%).
| Industry | Male | Female |
| Agriculture, Fishing & Hunting | 0 (0.0%) | 0 (0.0%) |
| Mining, Quarrying, & Extraction | 0 (0.0%) | 0 (0.0%) |
| Construction | 176 (81.9%) | 39 (18.1%) |
| Manufacturing | 408 (96.0%) | 17 (4.0%) |
| Wholesale Trade | 23 (100.0%) | 0 (0.0%) |
| Retail Trade | 130 (68.4%) | 60 (31.6%) |
| Transportation & Warehousing | 173 (86.5%) | 27 (13.5%) |
| Utilities | 0 (0.0%) | 13 (100.0%) |
| Information | 0 (0.0%) | 0 (0.0%) |
| Finance & Insurance | 0 (0.0%) | 64 (100.0%) |
| Real Estate, Rental & Leasing | 36 (75.0%) | 12 (25.0%) |
| Professional & Scientific | 81 (60.5%) | 53 (39.6%) |
| Enterprise Management | 0 (0.0%) | 0 (0.0%) |
| Administrative & Support | 15 (41.7%) | 21 (58.3%) |
| Educational Services | 109 (38.4%) | 175 (61.6%) |
| Health Care & Social Assistance | 48 (10.4%) | 415 (89.6%) |
| Arts, Entertainment & Recreation | 0 (0.0%) | 50 (100.0%) |
| Accommodation & Food Services | 17 (46.0%) | 20 (54.0%) |
| Public Administration | 91 (52.3%) | 83 (47.7%) |
| Total | 1,381 (56.8%) | 1,049 (43.2%) |
Education in Jim Thorpe borough
School Enrollment in Jim Thorpe borough
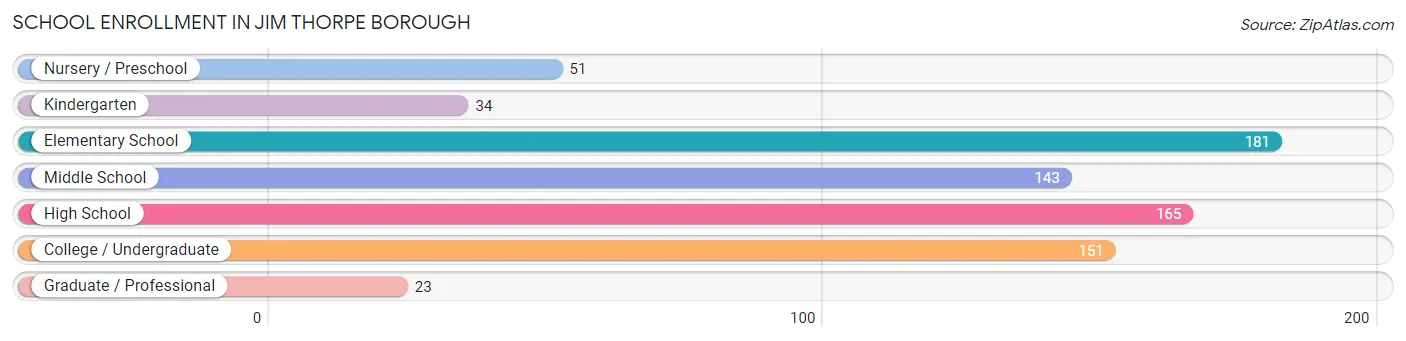
The most common levels of schooling among the 748 students in Jim Thorpe borough are elementary school (181 | 24.2%), high school (165 | 22.1%), and college / undergraduate (151 | 20.2%).
| School Level | # Students | % Students |
| Nursery / Preschool | 51 | 6.8% |
| Kindergarten | 34 | 4.5% |
| Elementary School | 181 | 24.2% |
| Middle School | 143 | 19.1% |
| High School | 165 | 22.1% |
| College / Undergraduate | 151 | 20.2% |
| Graduate / Professional | 23 | 3.1% |
| Total | 748 | 100.0% |
School Enrollment by Age by Funding Source in Jim Thorpe borough
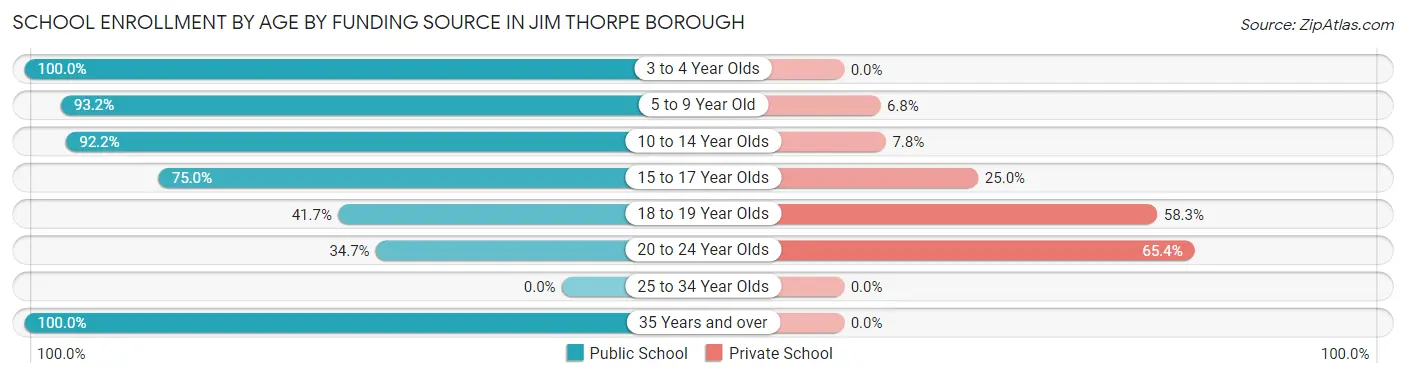
Out of a total of 748 students who are enrolled in schools in Jim Thorpe borough, 149 (19.9%) attend a private institution, while the remaining 599 (80.1%) are enrolled in public schools. The age group of 20 to 24 year olds has the highest likelihood of being enrolled in private schools, with 66 (65.3% in the age bracket) enrolled. Conversely, the age group of 3 to 4 year olds has the lowest likelihood of being enrolled in a private school, with 35 (100.0% in the age bracket) attending a public institution.
| Age Bracket | Public School | Private School |
| 3 to 4 Year Olds | 35 (100.0%) | 0 (0.0%) |
| 5 to 9 Year Old | 193 (93.2%) | 14 (6.8%) |
| 10 to 14 Year Olds | 166 (92.2%) | 14 (7.8%) |
| 15 to 17 Year Olds | 102 (75.0%) | 34 (25.0%) |
| 18 to 19 Year Olds | 15 (41.7%) | 21 (58.3%) |
| 20 to 24 Year Olds | 35 (34.6%) | 66 (65.3%) |
| 25 to 34 Year Olds | 0 (0.0%) | 0 (0.0%) |
| 35 Years and over | 53 (100.0%) | 0 (0.0%) |
| Total | 599 (80.1%) | 149 (19.9%) |
Educational Attainment by Field of Study in Jim Thorpe borough
Education (150 | 19.3%), business (133 | 17.1%), communications (95 | 12.2%), bio, nature & agricultural (79 | 10.1%), and visual & performing arts (70 | 9.0%) are the most common fields of study among 779 individuals in Jim Thorpe borough who have obtained a bachelor's degree or higher.
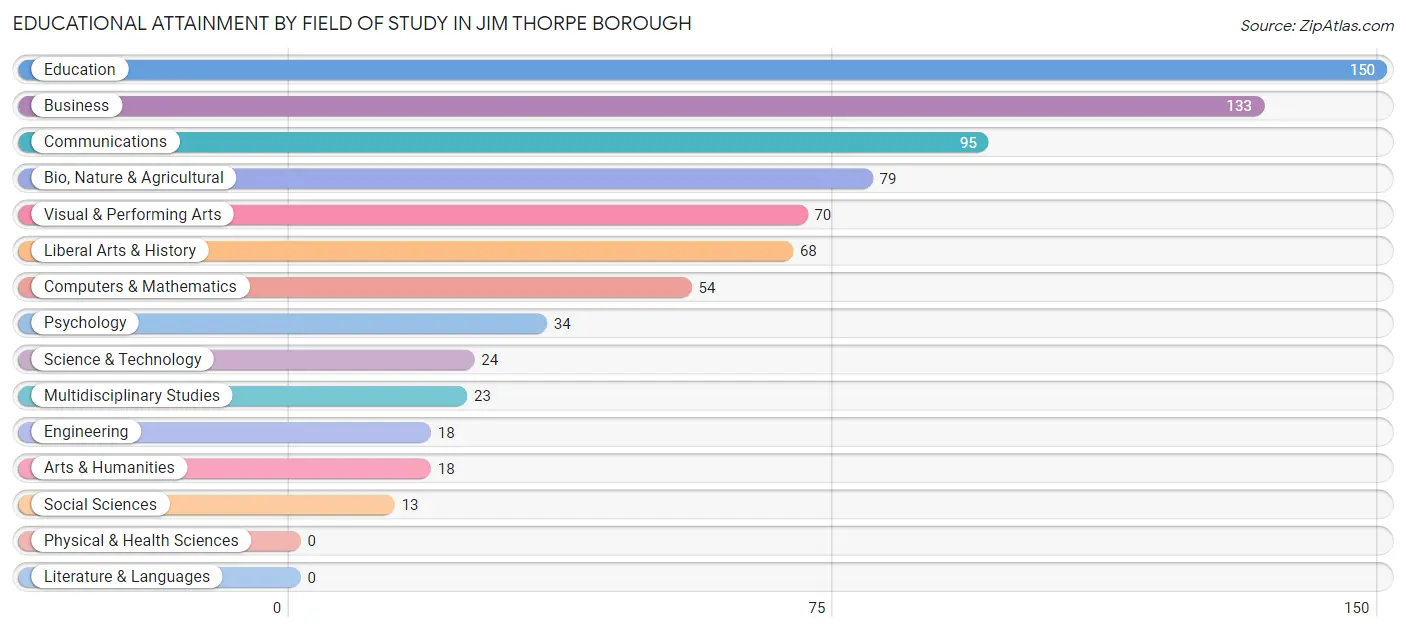
| Field of Study | # Graduates | % Graduates |
| Computers & Mathematics | 54 | 6.9% |
| Bio, Nature & Agricultural | 79 | 10.1% |
| Physical & Health Sciences | 0 | 0.0% |
| Psychology | 34 | 4.4% |
| Social Sciences | 13 | 1.7% |
| Engineering | 18 | 2.3% |
| Multidisciplinary Studies | 23 | 2.9% |
| Science & Technology | 24 | 3.1% |
| Business | 133 | 17.1% |
| Education | 150 | 19.3% |
| Literature & Languages | 0 | 0.0% |
| Liberal Arts & History | 68 | 8.7% |
| Visual & Performing Arts | 70 | 9.0% |
| Communications | 95 | 12.2% |
| Arts & Humanities | 18 | 2.3% |
| Total | 779 | 100.0% |
Transportation & Commute in Jim Thorpe borough
Vehicle Availability by Sex in Jim Thorpe borough
The most prevalent vehicle ownership categories in Jim Thorpe borough are males with 2 vehicles (534, accounting for 41.7%) and females with 2 vehicles (408, making up 55.3%).
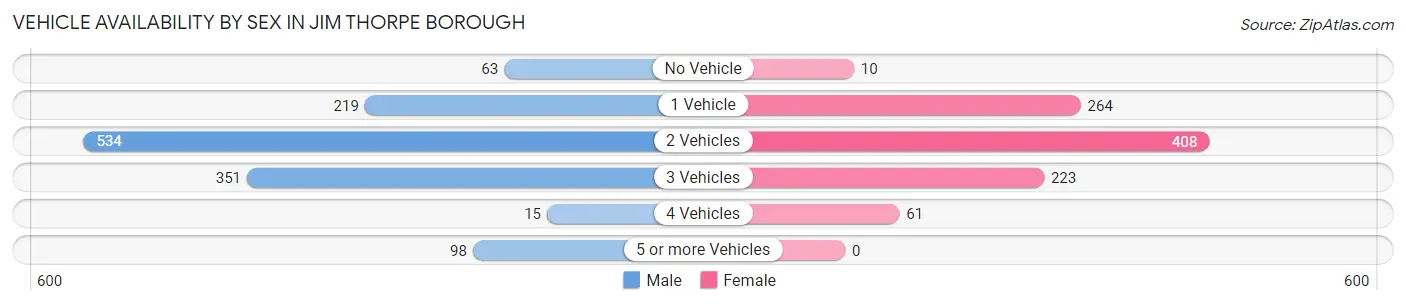
| Vehicles Available | Male | Female |
| No Vehicle | 63 (4.9%) | 10 (1.0%) |
| 1 Vehicle | 219 (17.1%) | 264 (27.3%) |
| 2 Vehicles | 534 (41.7%) | 408 (42.2%) |
| 3 Vehicles | 351 (27.4%) | 223 (23.1%) |
| 4 Vehicles | 15 (1.2%) | 61 (6.3%) |
| 5 or more Vehicles | 98 (7.7%) | 0 (0.0%) |
| Total | 1,280 (100.0%) | 966 (100.0%) |
Commute Time in Jim Thorpe borough
The most frequently occuring commute durations in Jim Thorpe borough are 5 to 9 minutes (454 commuters, 21.6%), 45 to 59 minutes (358 commuters, 17.0%), and 10 to 14 minutes (242 commuters, 11.5%).
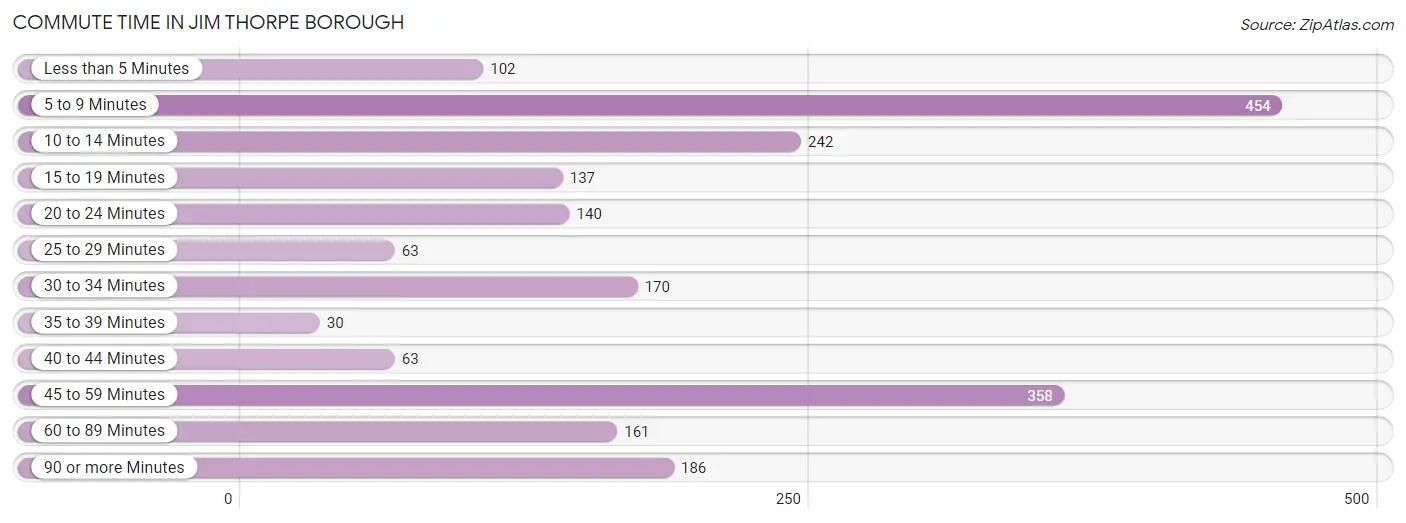
| Commute Time | # Commuters | % Commuters |
| Less than 5 Minutes | 102 | 4.8% |
| 5 to 9 Minutes | 454 | 21.6% |
| 10 to 14 Minutes | 242 | 11.5% |
| 15 to 19 Minutes | 137 | 6.5% |
| 20 to 24 Minutes | 140 | 6.7% |
| 25 to 29 Minutes | 63 | 3.0% |
| 30 to 34 Minutes | 170 | 8.1% |
| 35 to 39 Minutes | 30 | 1.4% |
| 40 to 44 Minutes | 63 | 3.0% |
| 45 to 59 Minutes | 358 | 17.0% |
| 60 to 89 Minutes | 161 | 7.6% |
| 90 or more Minutes | 186 | 8.8% |
Commute Time by Sex in Jim Thorpe borough
The most common commute times in Jim Thorpe borough are 45 to 59 minutes (295 commuters, 24.2%) for males and 10 to 14 minutes (192 commuters, 21.6%) for females.
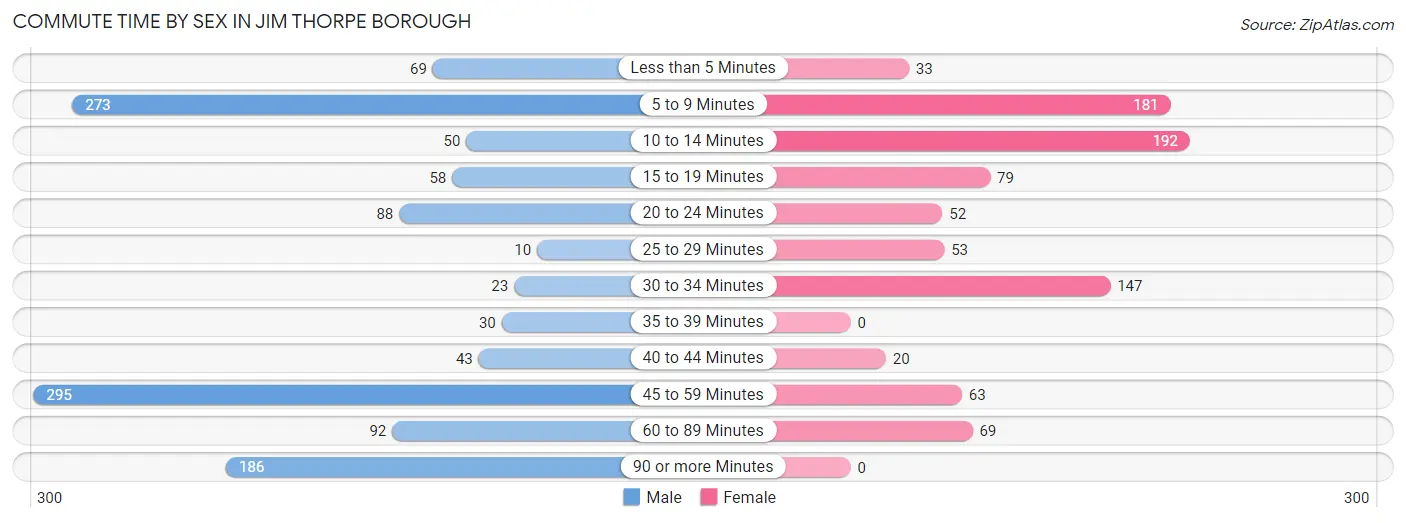
| Commute Time | Male | Female |
| Less than 5 Minutes | 69 (5.7%) | 33 (3.7%) |
| 5 to 9 Minutes | 273 (22.4%) | 181 (20.4%) |
| 10 to 14 Minutes | 50 (4.1%) | 192 (21.6%) |
| 15 to 19 Minutes | 58 (4.8%) | 79 (8.9%) |
| 20 to 24 Minutes | 88 (7.2%) | 52 (5.9%) |
| 25 to 29 Minutes | 10 (0.8%) | 53 (6.0%) |
| 30 to 34 Minutes | 23 (1.9%) | 147 (16.5%) |
| 35 to 39 Minutes | 30 (2.5%) | 0 (0.0%) |
| 40 to 44 Minutes | 43 (3.5%) | 20 (2.2%) |
| 45 to 59 Minutes | 295 (24.2%) | 63 (7.1%) |
| 60 to 89 Minutes | 92 (7.6%) | 69 (7.8%) |
| 90 or more Minutes | 186 (15.3%) | 0 (0.0%) |
Time of Departure to Work by Sex in Jim Thorpe borough
The most frequent times of departure to work in Jim Thorpe borough are 5:30 AM to 5:59 AM (193, 15.9%) for males and 9:00 AM to 9:59 AM (194, 21.8%) for females.
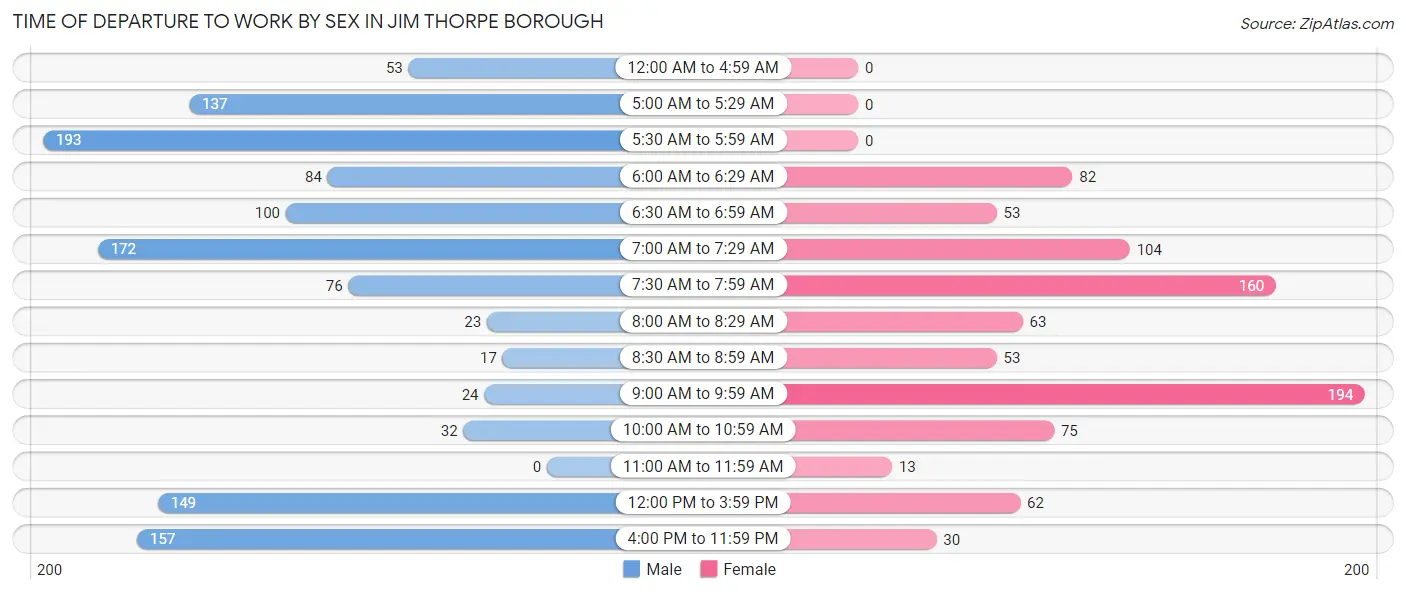
| Time of Departure | Male | Female |
| 12:00 AM to 4:59 AM | 53 (4.3%) | 0 (0.0%) |
| 5:00 AM to 5:29 AM | 137 (11.3%) | 0 (0.0%) |
| 5:30 AM to 5:59 AM | 193 (15.9%) | 0 (0.0%) |
| 6:00 AM to 6:29 AM | 84 (6.9%) | 82 (9.2%) |
| 6:30 AM to 6:59 AM | 100 (8.2%) | 53 (6.0%) |
| 7:00 AM to 7:29 AM | 172 (14.1%) | 104 (11.7%) |
| 7:30 AM to 7:59 AM | 76 (6.2%) | 160 (18.0%) |
| 8:00 AM to 8:29 AM | 23 (1.9%) | 63 (7.1%) |
| 8:30 AM to 8:59 AM | 17 (1.4%) | 53 (6.0%) |
| 9:00 AM to 9:59 AM | 24 (2.0%) | 194 (21.8%) |
| 10:00 AM to 10:59 AM | 32 (2.6%) | 75 (8.4%) |
| 11:00 AM to 11:59 AM | 0 (0.0%) | 13 (1.5%) |
| 12:00 PM to 3:59 PM | 149 (12.2%) | 62 (7.0%) |
| 4:00 PM to 11:59 PM | 157 (12.9%) | 30 (3.4%) |
| Total | 1,217 (100.0%) | 889 (100.0%) |
Housing Occupancy in Jim Thorpe borough
Occupancy by Ownership in Jim Thorpe borough
Of the total 1,951 dwellings in Jim Thorpe borough, owner-occupied units account for 1,607 (82.4%), while renter-occupied units make up 344 (17.6%).
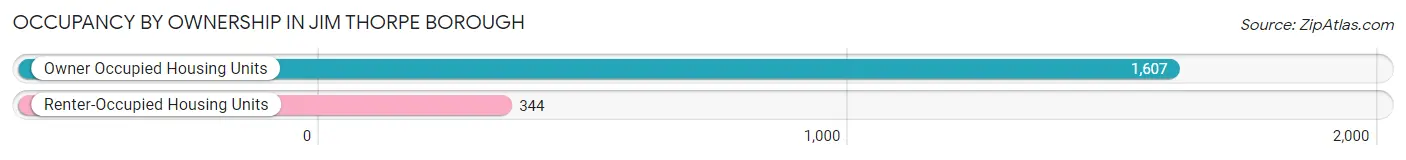
| Occupancy | # Housing Units | % Housing Units |
| Owner Occupied Housing Units | 1,607 | 82.4% |
| Renter-Occupied Housing Units | 344 | 17.6% |
| Total Occupied Housing Units | 1,951 | 100.0% |
Occupancy by Household Size in Jim Thorpe borough
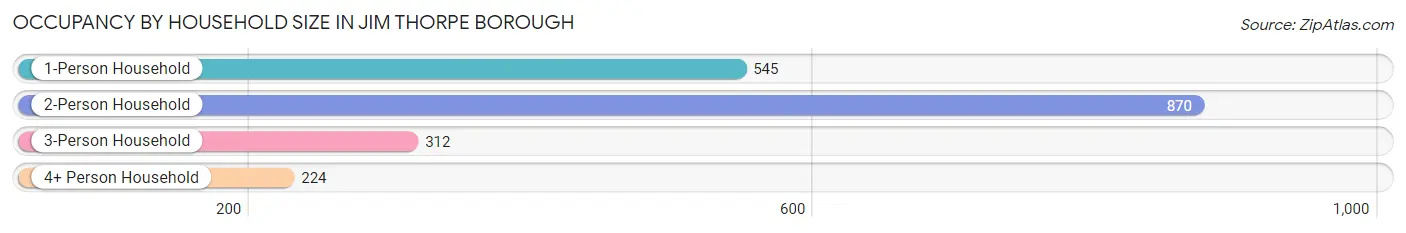
| Household Size | # Housing Units | % Housing Units |
| 1-Person Household | 545 | 27.9% |
| 2-Person Household | 870 | 44.6% |
| 3-Person Household | 312 | 16.0% |
| 4+ Person Household | 224 | 11.5% |
| Total Housing Units | 1,951 | 100.0% |
Occupancy by Ownership by Household Size in Jim Thorpe borough
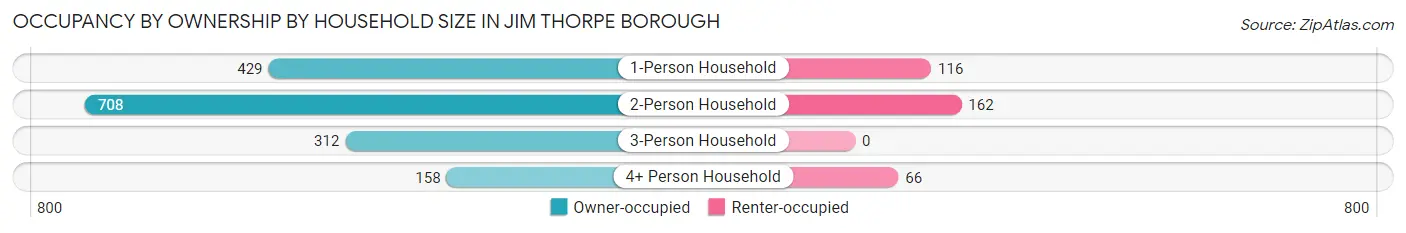
| Household Size | Owner-occupied | Renter-occupied |
| 1-Person Household | 429 (78.7%) | 116 (21.3%) |
| 2-Person Household | 708 (81.4%) | 162 (18.6%) |
| 3-Person Household | 312 (100.0%) | 0 (0.0%) |
| 4+ Person Household | 158 (70.5%) | 66 (29.5%) |
| Total Housing Units | 1,607 (82.4%) | 344 (17.6%) |
Occupancy by Educational Attainment in Jim Thorpe borough
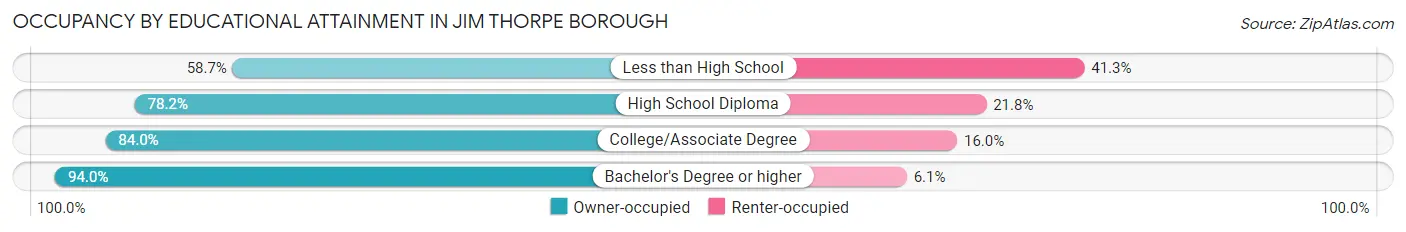
| Household Size | Owner-occupied | Renter-occupied |
| Less than High School | 84 (58.7%) | 59 (41.3%) |
| High School Diploma | 559 (78.2%) | 156 (21.8%) |
| College/Associate Degree | 529 (84.0%) | 101 (16.0%) |
| Bachelor's Degree or higher | 435 (94.0%) | 28 (6.0%) |
Occupancy by Age of Householder in Jim Thorpe borough
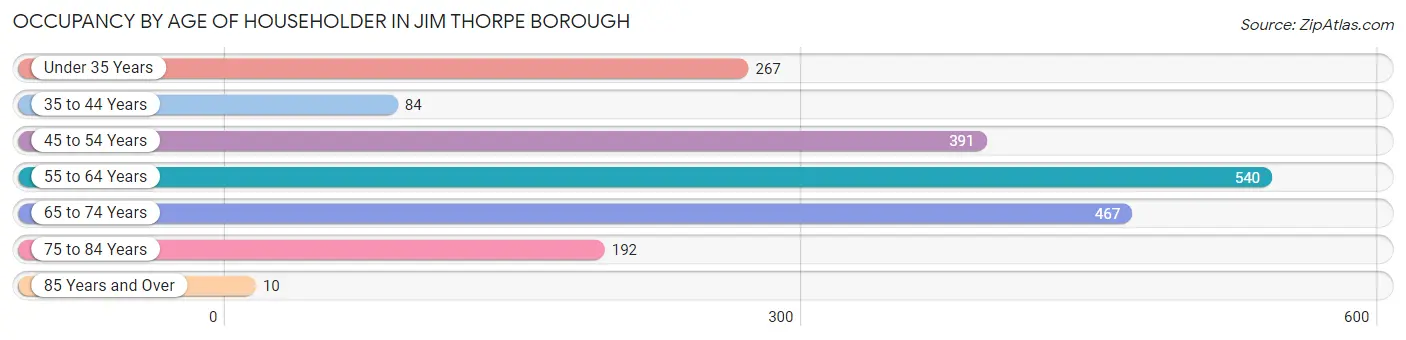
| Age Bracket | # Households | % Households |
| Under 35 Years | 267 | 13.7% |
| 35 to 44 Years | 84 | 4.3% |
| 45 to 54 Years | 391 | 20.0% |
| 55 to 64 Years | 540 | 27.7% |
| 65 to 74 Years | 467 | 23.9% |
| 75 to 84 Years | 192 | 9.8% |
| 85 Years and Over | 10 | 0.5% |
| Total | 1,951 | 100.0% |
Housing Finances in Jim Thorpe borough
Median Income by Occupancy in Jim Thorpe borough
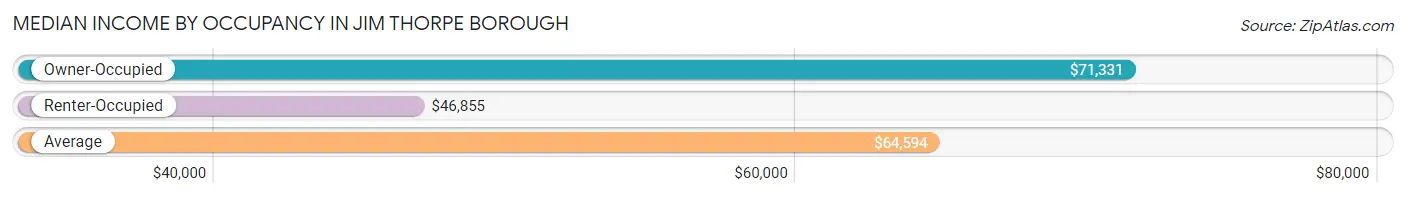
| Occupancy Type | # Households | Median Income |
| Owner-Occupied | 1,607 (82.4%) | $71,331 |
| Renter-Occupied | 344 (17.6%) | $46,855 |
| Average | 1,951 (100.0%) | $64,594 |
Occupancy by Householder Income Bracket in Jim Thorpe borough
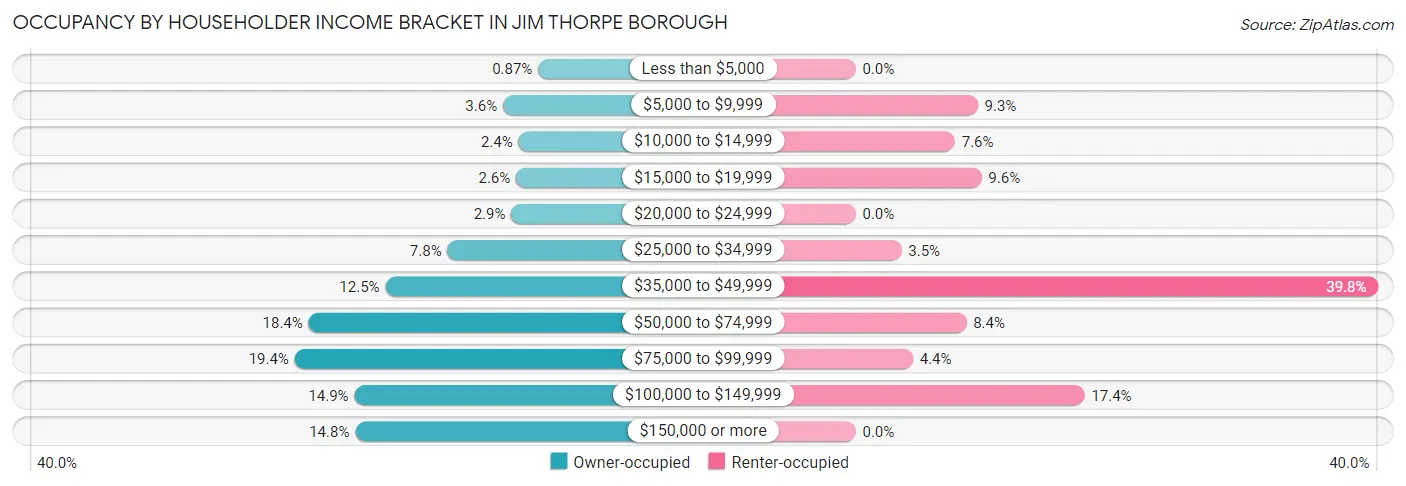
| Income Bracket | Owner-occupied | Renter-occupied |
| Less than $5,000 | 14 (0.9%) | 0 (0.0%) |
| $5,000 to $9,999 | 57 (3.5%) | 32 (9.3%) |
| $10,000 to $14,999 | 38 (2.4%) | 26 (7.6%) |
| $15,000 to $19,999 | 41 (2.5%) | 33 (9.6%) |
| $20,000 to $24,999 | 47 (2.9%) | 0 (0.0%) |
| $25,000 to $34,999 | 125 (7.8%) | 12 (3.5%) |
| $35,000 to $49,999 | 201 (12.5%) | 137 (39.8%) |
| $50,000 to $74,999 | 295 (18.4%) | 29 (8.4%) |
| $75,000 to $99,999 | 312 (19.4%) | 15 (4.4%) |
| $100,000 to $149,999 | 239 (14.9%) | 60 (17.4%) |
| $150,000 or more | 238 (14.8%) | 0 (0.0%) |
| Total | 1,607 (100.0%) | 344 (100.0%) |
Monthly Housing Cost Tiers in Jim Thorpe borough
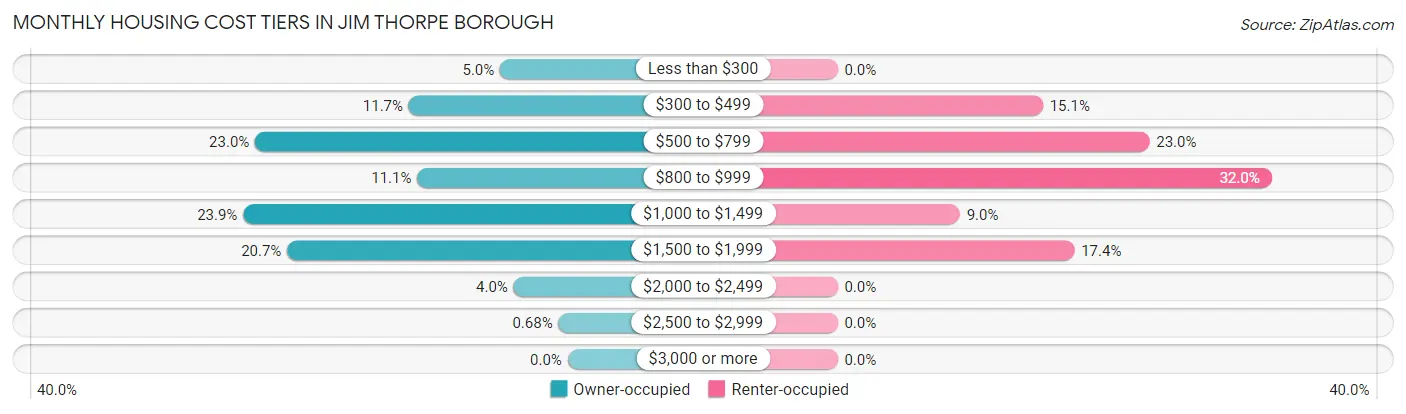
| Monthly Cost | Owner-occupied | Renter-occupied |
| Less than $300 | 80 (5.0%) | 0 (0.0%) |
| $300 to $499 | 188 (11.7%) | 52 (15.1%) |
| $500 to $799 | 370 (23.0%) | 79 (23.0%) |
| $800 to $999 | 178 (11.1%) | 110 (32.0%) |
| $1,000 to $1,499 | 384 (23.9%) | 31 (9.0%) |
| $1,500 to $1,999 | 332 (20.7%) | 60 (17.4%) |
| $2,000 to $2,499 | 64 (4.0%) | 0 (0.0%) |
| $2,500 to $2,999 | 11 (0.7%) | 0 (0.0%) |
| $3,000 or more | 0 (0.0%) | 0 (0.0%) |
| Total | 1,607 (100.0%) | 344 (100.0%) |
Physical Housing Characteristics in Jim Thorpe borough
Housing Structures in Jim Thorpe borough
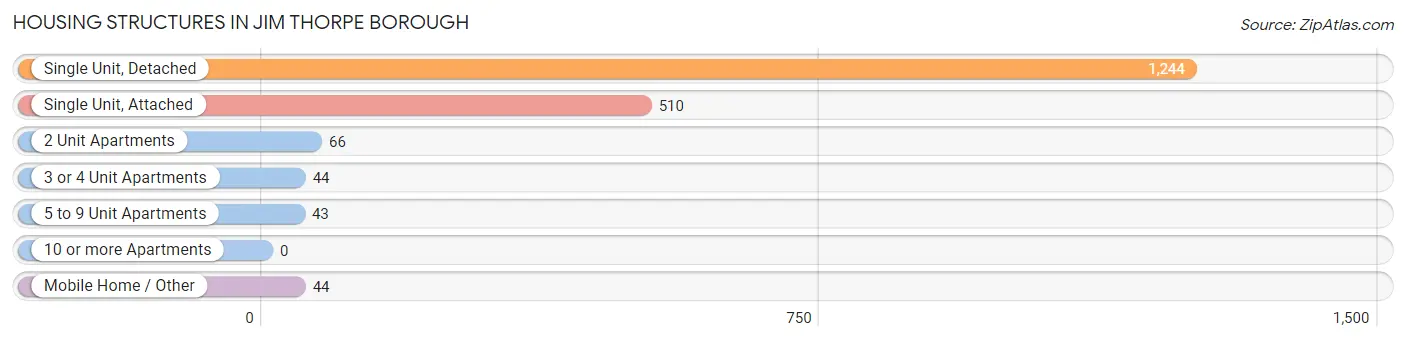
| Structure Type | # Housing Units | % Housing Units |
| Single Unit, Detached | 1,244 | 63.8% |
| Single Unit, Attached | 510 | 26.1% |
| 2 Unit Apartments | 66 | 3.4% |
| 3 or 4 Unit Apartments | 44 | 2.3% |
| 5 to 9 Unit Apartments | 43 | 2.2% |
| 10 or more Apartments | 0 | 0.0% |
| Mobile Home / Other | 44 | 2.3% |
| Total | 1,951 | 100.0% |
Housing Structures by Occupancy in Jim Thorpe borough
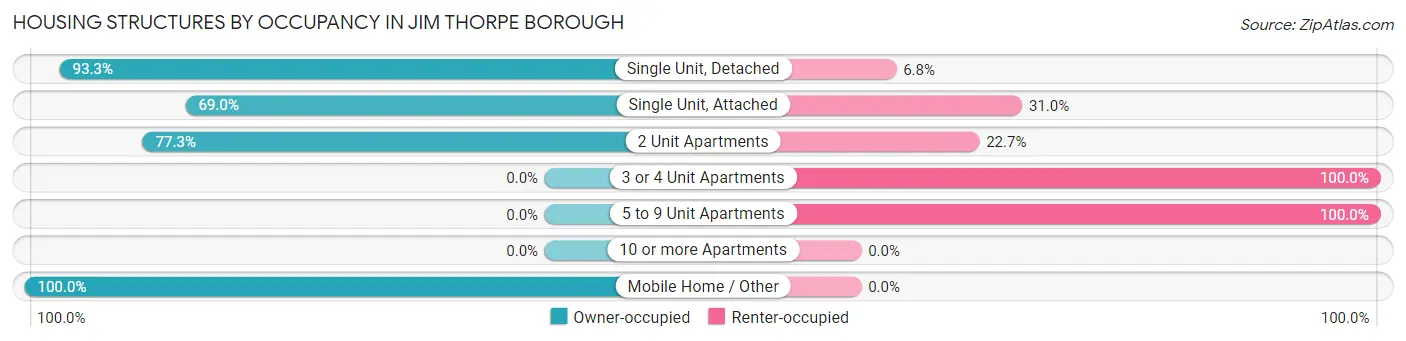
| Structure Type | Owner-occupied | Renter-occupied |
| Single Unit, Detached | 1,160 (93.2%) | 84 (6.8%) |
| Single Unit, Attached | 352 (69.0%) | 158 (31.0%) |
| 2 Unit Apartments | 51 (77.3%) | 15 (22.7%) |
| 3 or 4 Unit Apartments | 0 (0.0%) | 44 (100.0%) |
| 5 to 9 Unit Apartments | 0 (0.0%) | 43 (100.0%) |
| 10 or more Apartments | 0 (0.0%) | 0 (0.0%) |
| Mobile Home / Other | 44 (100.0%) | 0 (0.0%) |
| Total | 1,607 (82.4%) | 344 (17.6%) |
Housing Structures by Number of Rooms in Jim Thorpe borough
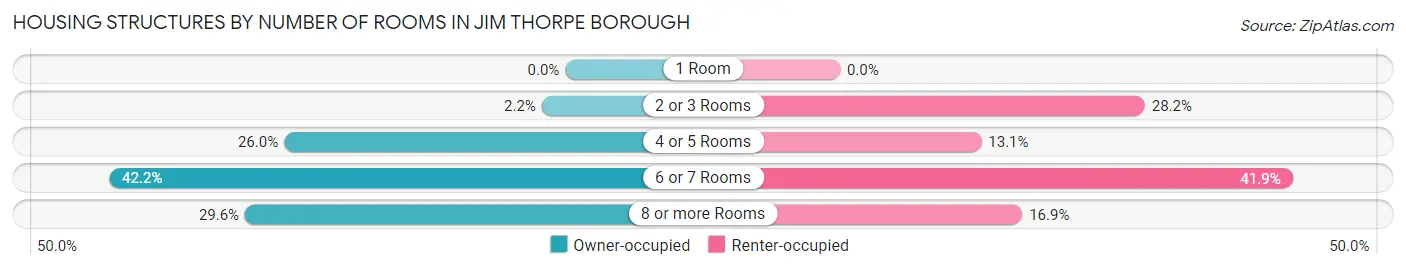
| Number of Rooms | Owner-occupied | Renter-occupied |
| 1 Room | 0 (0.0%) | 0 (0.0%) |
| 2 or 3 Rooms | 35 (2.2%) | 97 (28.2%) |
| 4 or 5 Rooms | 418 (26.0%) | 45 (13.1%) |
| 6 or 7 Rooms | 678 (42.2%) | 144 (41.9%) |
| 8 or more Rooms | 476 (29.6%) | 58 (16.9%) |
| Total | 1,607 (100.0%) | 344 (100.0%) |
Housing Structure by Heating Type in Jim Thorpe borough
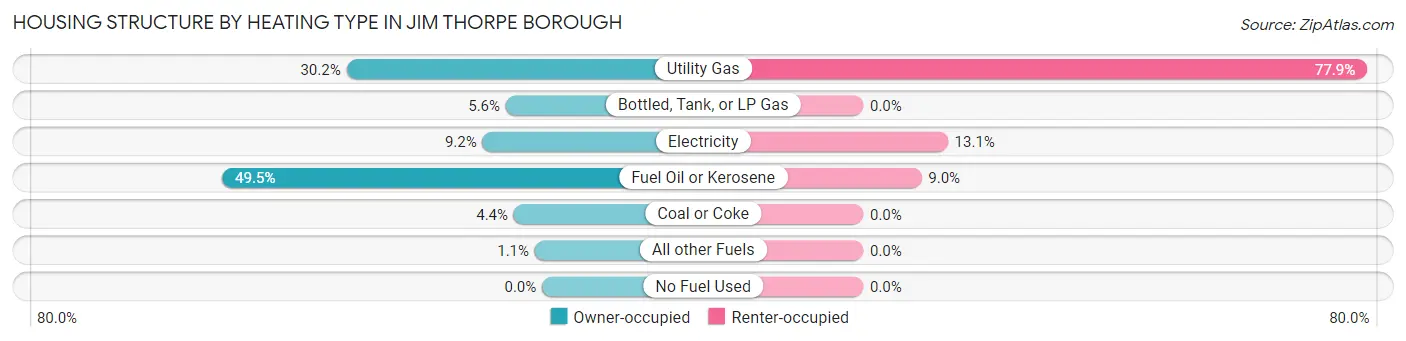
| Heating Type | Owner-occupied | Renter-occupied |
| Utility Gas | 486 (30.2%) | 268 (77.9%) |
| Bottled, Tank, or LP Gas | 90 (5.6%) | 0 (0.0%) |
| Electricity | 148 (9.2%) | 45 (13.1%) |
| Fuel Oil or Kerosene | 795 (49.5%) | 31 (9.0%) |
| Coal or Coke | 70 (4.4%) | 0 (0.0%) |
| All other Fuels | 18 (1.1%) | 0 (0.0%) |
| No Fuel Used | 0 (0.0%) | 0 (0.0%) |
| Total | 1,607 (100.0%) | 344 (100.0%) |
Household Vehicle Usage in Jim Thorpe borough
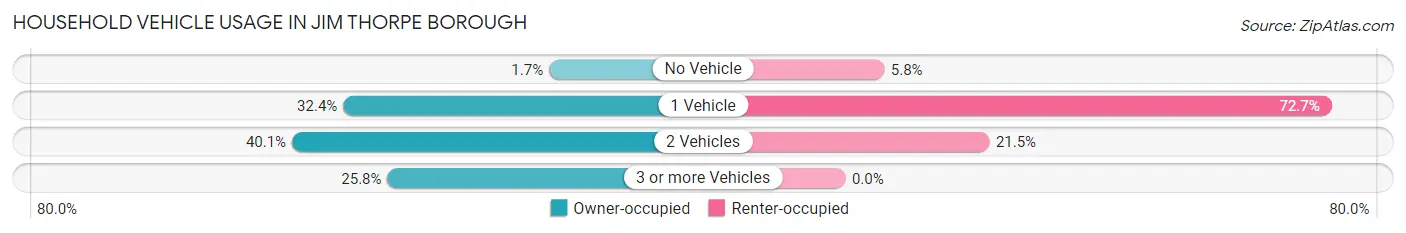
| Vehicles per Household | Owner-occupied | Renter-occupied |
| No Vehicle | 27 (1.7%) | 20 (5.8%) |
| 1 Vehicle | 521 (32.4%) | 250 (72.7%) |
| 2 Vehicles | 644 (40.1%) | 74 (21.5%) |
| 3 or more Vehicles | 415 (25.8%) | 0 (0.0%) |
| Total | 1,607 (100.0%) | 344 (100.0%) |
Real Estate & Mortgages in Jim Thorpe borough
Real Estate and Mortgage Overview in Jim Thorpe borough
| Characteristic | Without Mortgage | With Mortgage |
| Housing Units | 668 | 939 |
| Median Property Value | $213,700 | $161,400 |
| Median Household Income | $68,590 | $152 |
| Monthly Housing Costs | $600 | $0 |
| Real Estate Taxes | $2,750 | $0 |
Property Value by Mortgage Status in Jim Thorpe borough
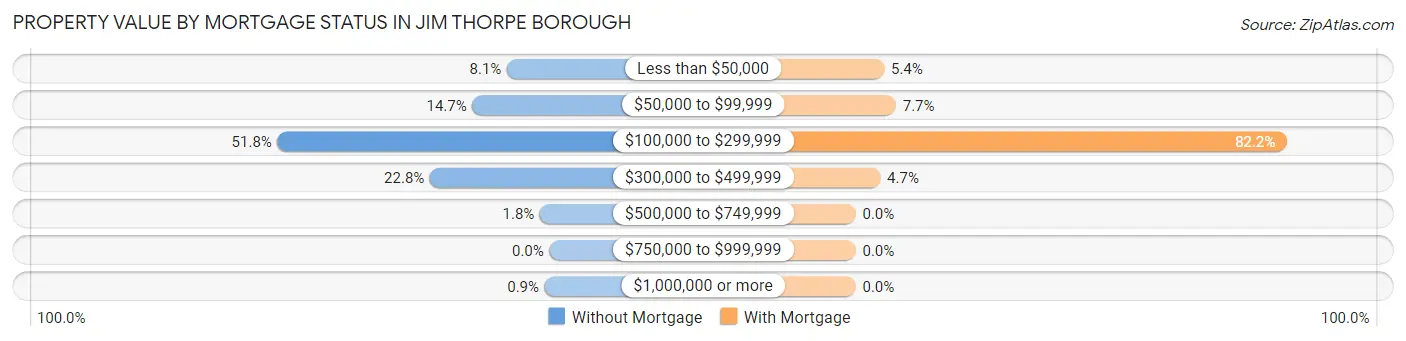
| Property Value | Without Mortgage | With Mortgage |
| Less than $50,000 | 54 (8.1%) | 51 (5.4%) |
| $50,000 to $99,999 | 98 (14.7%) | 72 (7.7%) |
| $100,000 to $299,999 | 346 (51.8%) | 772 (82.2%) |
| $300,000 to $499,999 | 152 (22.8%) | 44 (4.7%) |
| $500,000 to $749,999 | 12 (1.8%) | 0 (0.0%) |
| $750,000 to $999,999 | 0 (0.0%) | 0 (0.0%) |
| $1,000,000 or more | 6 (0.9%) | 0 (0.0%) |
| Total | 668 (100.0%) | 939 (100.0%) |
Household Income by Mortgage Status in Jim Thorpe borough
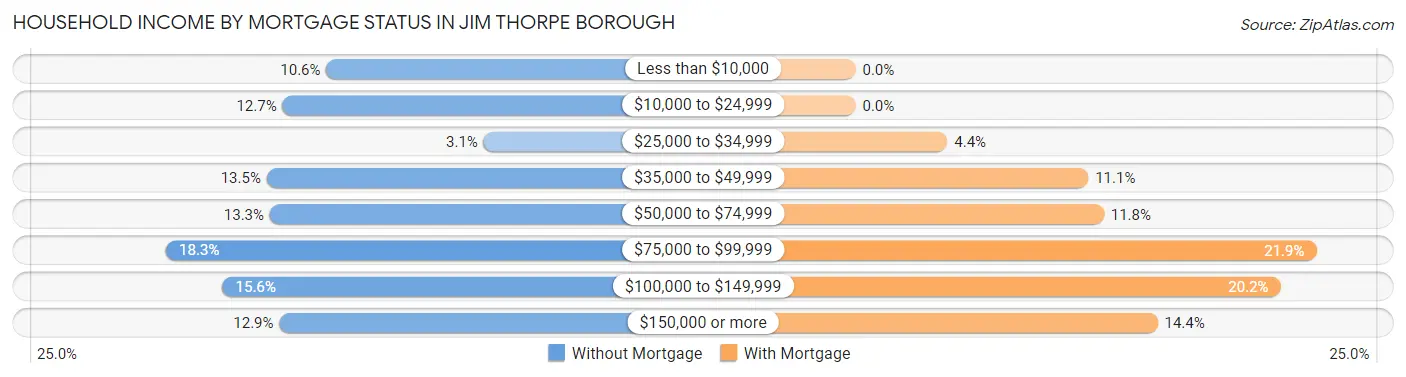
| Household Income | Without Mortgage | With Mortgage |
| Less than $10,000 | 71 (10.6%) | 0 (0.0%) |
| $10,000 to $24,999 | 85 (12.7%) | 0 (0.0%) |
| $25,000 to $34,999 | 21 (3.1%) | 41 (4.4%) |
| $35,000 to $49,999 | 90 (13.5%) | 104 (11.1%) |
| $50,000 to $74,999 | 89 (13.3%) | 111 (11.8%) |
| $75,000 to $99,999 | 122 (18.3%) | 206 (21.9%) |
| $100,000 to $149,999 | 104 (15.6%) | 190 (20.2%) |
| $150,000 or more | 86 (12.9%) | 135 (14.4%) |
| Total | 668 (100.0%) | 939 (100.0%) |
Property Value to Household Income Ratio in Jim Thorpe borough
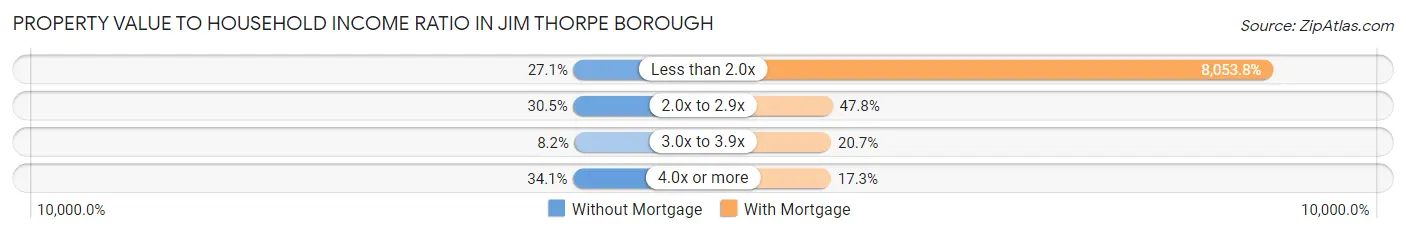
| Value-to-Income Ratio | Without Mortgage | With Mortgage |
| Less than 2.0x | 181 (27.1%) | 75,625 (8,053.8%) |
| 2.0x to 2.9x | 204 (30.5%) | 449 (47.8%) |
| 3.0x to 3.9x | 55 (8.2%) | 194 (20.7%) |
| 4.0x or more | 228 (34.1%) | 162 (17.2%) |
| Total | 668 (100.0%) | 939 (100.0%) |
Real Estate Taxes by Mortgage Status in Jim Thorpe borough
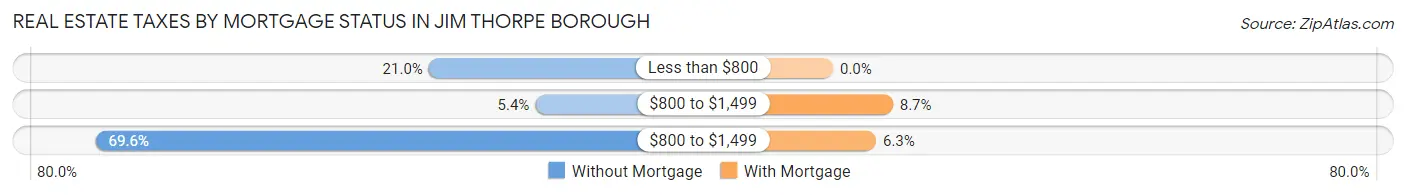
| Property Taxes | Without Mortgage | With Mortgage |
| Less than $800 | 140 (21.0%) | 0 (0.0%) |
| $800 to $1,499 | 36 (5.4%) | 82 (8.7%) |
| $800 to $1,499 | 465 (69.6%) | 59 (6.3%) |
| Total | 668 (100.0%) | 939 (100.0%) |
Health & Disability in Jim Thorpe borough
Health Insurance Coverage by Age in Jim Thorpe borough
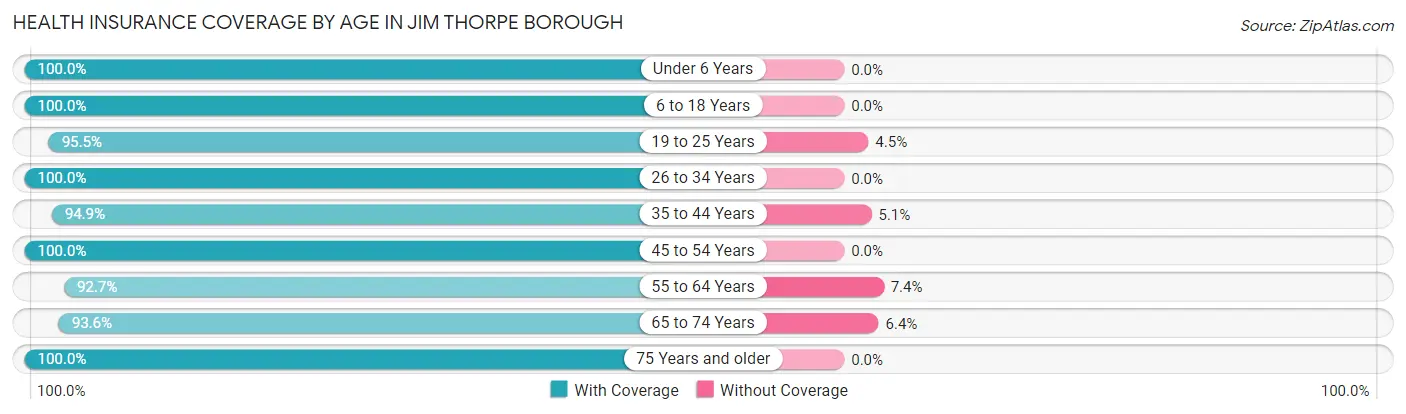
| Age Bracket | With Coverage | Without Coverage |
| Under 6 Years | 262 (100.0%) | 0 (0.0%) |
| 6 to 18 Years | 572 (100.0%) | 0 (0.0%) |
| 19 to 25 Years | 212 (95.5%) | 10 (4.5%) |
| 26 to 34 Years | 573 (100.0%) | 0 (0.0%) |
| 35 to 44 Years | 355 (94.9%) | 19 (5.1%) |
| 45 to 54 Years | 692 (100.0%) | 0 (0.0%) |
| 55 to 64 Years | 832 (92.6%) | 66 (7.3%) |
| 65 to 74 Years | 571 (93.6%) | 39 (6.4%) |
| 75 Years and older | 329 (100.0%) | 0 (0.0%) |
| Total | 4,398 (97.0%) | 134 (3.0%) |
Health Insurance Coverage by Citizenship Status in Jim Thorpe borough
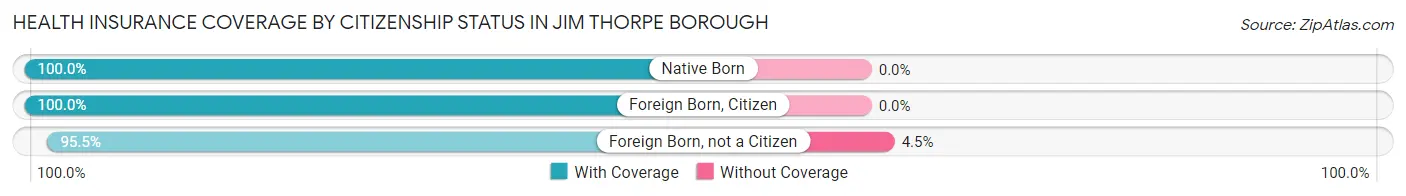
| Citizenship Status | With Coverage | Without Coverage |
| Native Born | 262 (100.0%) | 0 (0.0%) |
| Foreign Born, Citizen | 572 (100.0%) | 0 (0.0%) |
| Foreign Born, not a Citizen | 212 (95.5%) | 10 (4.5%) |
Health Insurance Coverage by Household Income in Jim Thorpe borough
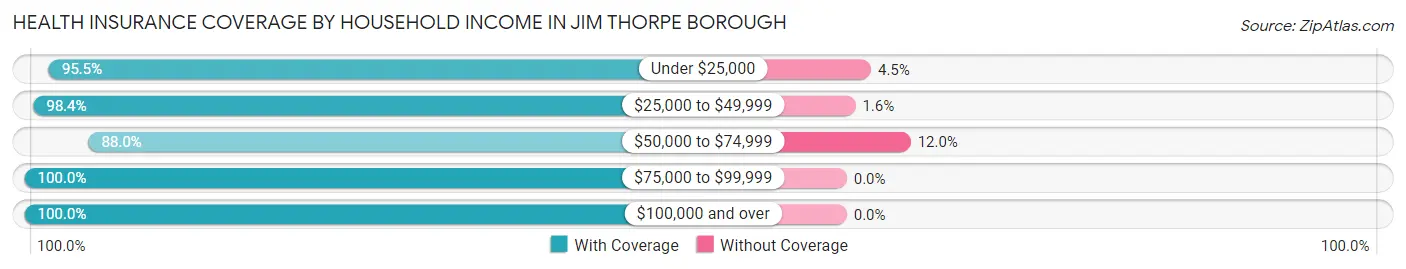
| Household Income | With Coverage | Without Coverage |
| Under $25,000 | 526 (95.5%) | 25 (4.5%) |
| $25,000 to $49,999 | 907 (98.4%) | 15 (1.6%) |
| $50,000 to $74,999 | 691 (88.0%) | 94 (12.0%) |
| $75,000 to $99,999 | 710 (100.0%) | 0 (0.0%) |
| $100,000 and over | 1,560 (100.0%) | 0 (0.0%) |
Public vs Private Health Insurance Coverage by Age in Jim Thorpe borough
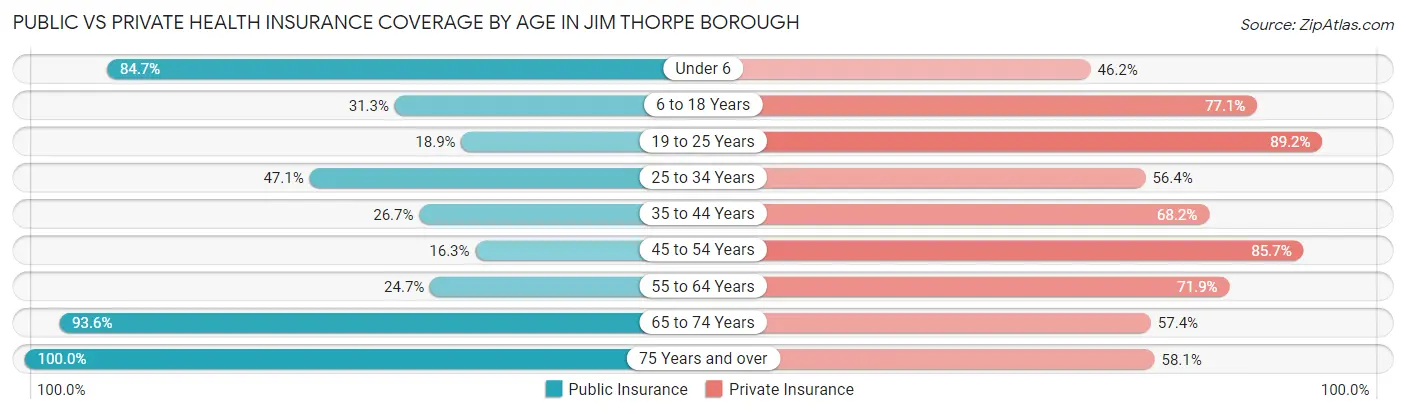
| Age Bracket | Public Insurance | Private Insurance |
| Under 6 | 222 (84.7%) | 121 (46.2%) |
| 6 to 18 Years | 179 (31.3%) | 441 (77.1%) |
| 19 to 25 Years | 42 (18.9%) | 198 (89.2%) |
| 25 to 34 Years | 270 (47.1%) | 323 (56.4%) |
| 35 to 44 Years | 100 (26.7%) | 255 (68.2%) |
| 45 to 54 Years | 113 (16.3%) | 593 (85.7%) |
| 55 to 64 Years | 222 (24.7%) | 646 (71.9%) |
| 65 to 74 Years | 571 (93.6%) | 350 (57.4%) |
| 75 Years and over | 329 (100.0%) | 191 (58.1%) |
| Total | 2,048 (45.2%) | 3,118 (68.8%) |
Disability Status by Sex by Age in Jim Thorpe borough
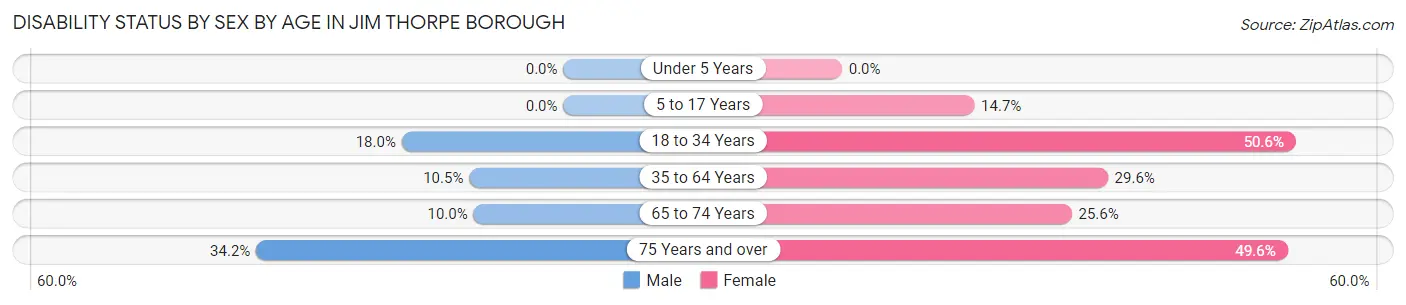
| Age Bracket | Male | Female |
| Under 5 Years | 0 (0.0%) | 0 (0.0%) |
| 5 to 17 Years | 0 (0.0%) | 28 (14.7%) |
| 18 to 34 Years | 83 (18.0%) | 185 (50.5%) |
| 35 to 64 Years | 111 (10.5%) | 268 (29.6%) |
| 65 to 74 Years | 27 (10.0%) | 87 (25.6%) |
| 75 Years and over | 65 (34.2%) | 69 (49.6%) |
Disability Class by Sex by Age in Jim Thorpe borough
Disability Class: Hearing Difficulty
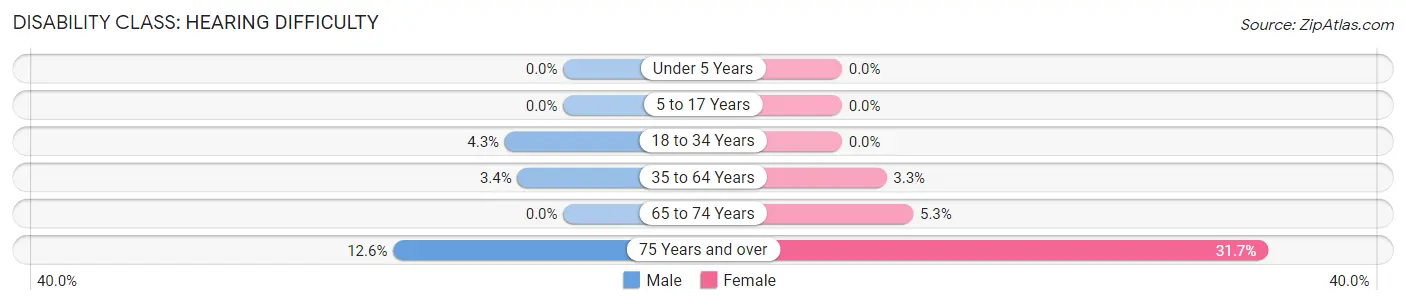
| Age Bracket | Male | Female |
| Under 5 Years | 0 (0.0%) | 0 (0.0%) |
| 5 to 17 Years | 0 (0.0%) | 0 (0.0%) |
| 18 to 34 Years | 20 (4.3%) | 0 (0.0%) |
| 35 to 64 Years | 36 (3.4%) | 30 (3.3%) |
| 65 to 74 Years | 0 (0.0%) | 18 (5.3%) |
| 75 Years and over | 24 (12.6%) | 44 (31.7%) |
Disability Class: Vision Difficulty
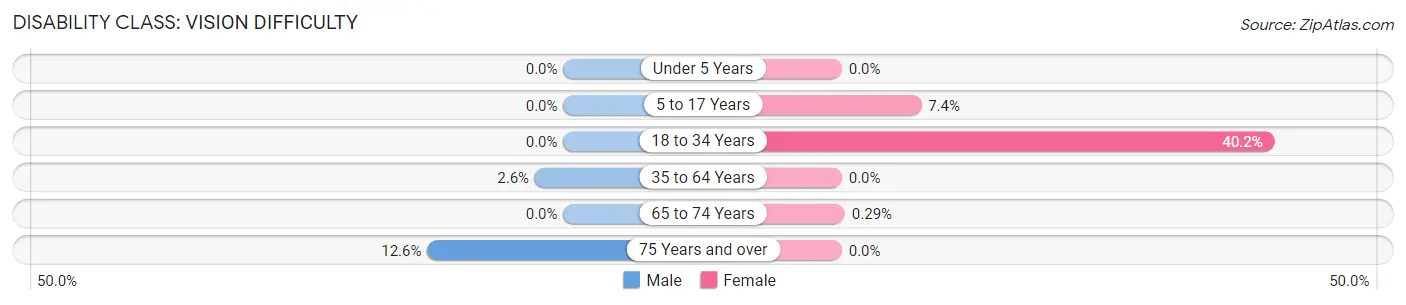
| Age Bracket | Male | Female |
| Under 5 Years | 0 (0.0%) | 0 (0.0%) |
| 5 to 17 Years | 0 (0.0%) | 14 (7.4%) |
| 18 to 34 Years | 0 (0.0%) | 147 (40.2%) |
| 35 to 64 Years | 28 (2.6%) | 0 (0.0%) |
| 65 to 74 Years | 0 (0.0%) | 1 (0.3%) |
| 75 Years and over | 24 (12.6%) | 0 (0.0%) |
Disability Class: Cognitive Difficulty
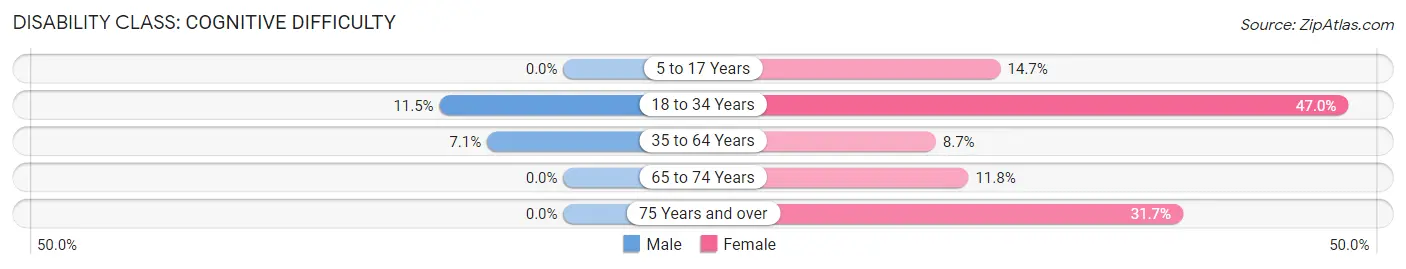
| Age Bracket | Male | Female |
| 5 to 17 Years | 0 (0.0%) | 28 (14.7%) |
| 18 to 34 Years | 53 (11.5%) | 172 (47.0%) |
| 35 to 64 Years | 75 (7.1%) | 79 (8.7%) |
| 65 to 74 Years | 0 (0.0%) | 40 (11.8%) |
| 75 Years and over | 0 (0.0%) | 44 (31.7%) |
Disability Class: Ambulatory Difficulty
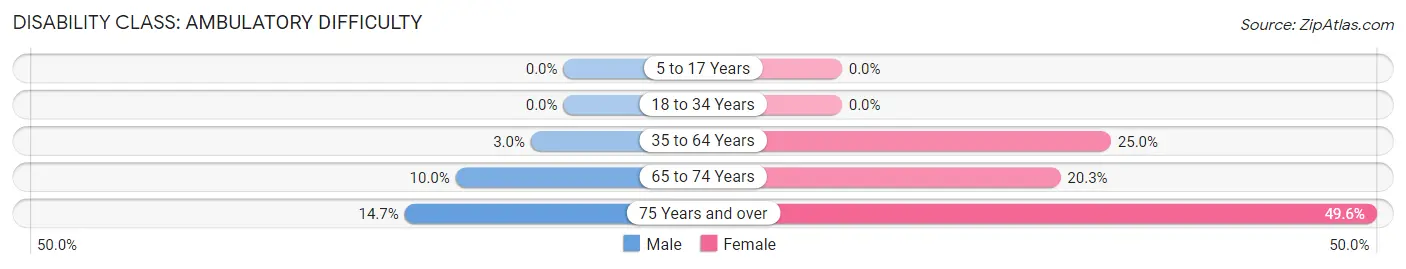
| Age Bracket | Male | Female |
| 5 to 17 Years | 0 (0.0%) | 0 (0.0%) |
| 18 to 34 Years | 0 (0.0%) | 0 (0.0%) |
| 35 to 64 Years | 32 (3.0%) | 226 (25.0%) |
| 65 to 74 Years | 27 (10.0%) | 69 (20.3%) |
| 75 Years and over | 28 (14.7%) | 69 (49.6%) |
Disability Class: Self-Care Difficulty
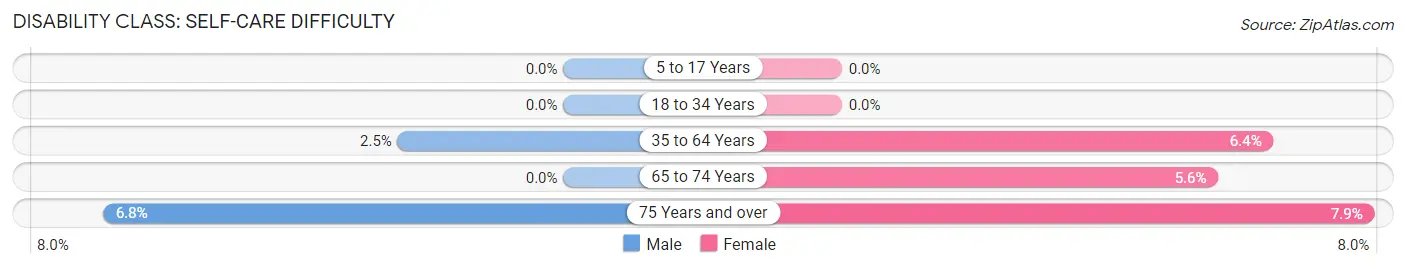
| Age Bracket | Male | Female |
| 5 to 17 Years | 0 (0.0%) | 0 (0.0%) |
| 18 to 34 Years | 0 (0.0%) | 0 (0.0%) |
| 35 to 64 Years | 26 (2.5%) | 58 (6.4%) |
| 65 to 74 Years | 0 (0.0%) | 19 (5.6%) |
| 75 Years and over | 13 (6.8%) | 11 (7.9%) |
Technology Access in Jim Thorpe borough
Computing Device Access in Jim Thorpe borough
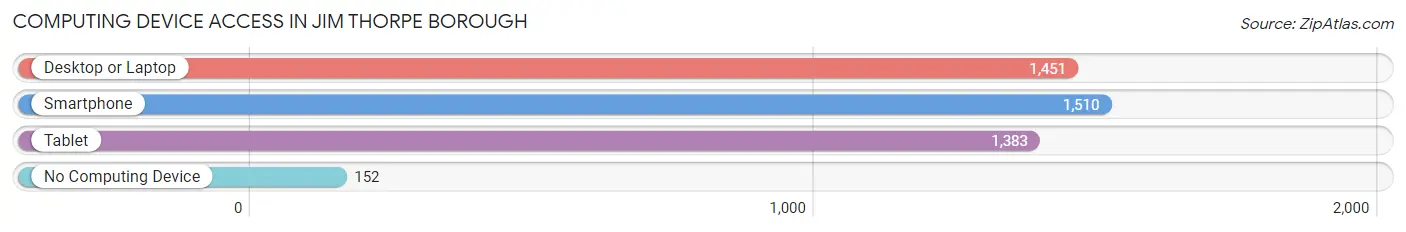
| Device Type | # Households | % Households |
| Desktop or Laptop | 1,451 | 74.4% |
| Smartphone | 1,510 | 77.4% |
| Tablet | 1,383 | 70.9% |
| No Computing Device | 152 | 7.8% |
| Total | 1,951 | 100.0% |
Internet Access in Jim Thorpe borough
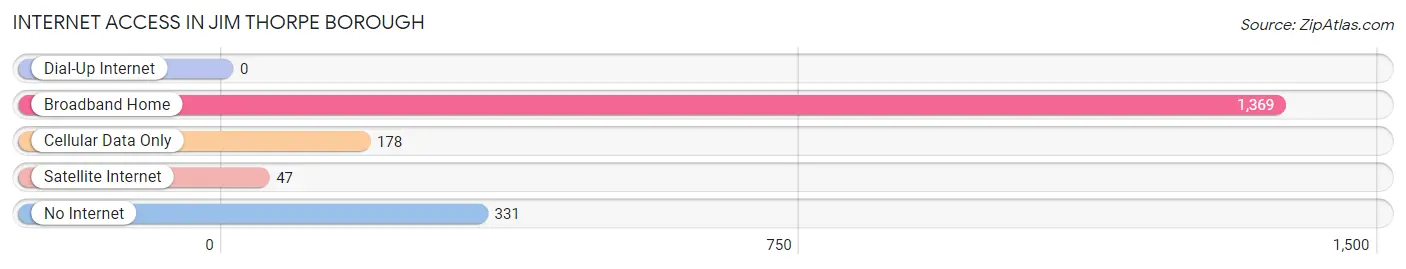
| Internet Type | # Households | % Households |
| Dial-Up Internet | 0 | 0.0% |
| Broadband Home | 1,369 | 70.2% |
| Cellular Data Only | 178 | 9.1% |
| Satellite Internet | 47 | 2.4% |
| No Internet | 331 | 17.0% |
| Total | 1,951 | 100.0% |
Jim Thorpe borough Summary
Introduction
Jim Thorpe Borough is a small borough located in Carbon County, Pennsylvania. It is situated in the Pocono Mountains region of the state and is known for its picturesque scenery and outdoor recreational activities. The borough is named after the famous Native American athlete, Jim Thorpe, who was born in the area. The borough has a population of approximately 4,800 people and covers an area of 1.2 square miles.
History
The area that is now Jim Thorpe Borough was originally inhabited by the Lenape Native Americans. The first European settlers arrived in the area in the late 1700s and the town was officially founded in 1818. The town was originally known as Mauch Chunk, which is a Native American term meaning “bear mountain.” The town was renamed in 1954 to honor the famous Native American athlete, Jim Thorpe.
Geography
Jim Thorpe Borough is located in Carbon County, Pennsylvania. It is situated in the Pocono Mountains region of the state and is known for its picturesque scenery and outdoor recreational activities. The borough is located at an elevation of 1,000 feet and covers an area of 1.2 square miles. The borough is bordered by the Lehigh River to the north and the Lehigh Gorge State Park to the south.
Climate
Jim Thorpe Borough has a humid continental climate, with cold winters and warm summers. The average annual temperature is around 50 degrees Fahrenheit, with temperatures ranging from an average low of 28 degrees Fahrenheit in the winter to an average high of 72 degrees Fahrenheit in the summer. The average annual precipitation is around 40 inches, with most of the precipitation occurring in the spring and summer months.
Economy
Jim Thorpe Borough’s economy is largely based on tourism. The borough is home to several popular attractions, including the Lehigh Gorge State Park, the Asa Packer Mansion, and the Jim Thorpe Memorial. The borough also has several restaurants, shops, and other businesses that cater to tourists. Additionally, the borough is home to several manufacturing and industrial businesses.
Demographics
As of the 2010 census, the population of Jim Thorpe Borough was 4,781. The racial makeup of the borough was 95.3% White, 1.2% African American, 0.3% Native American, 0.7% Asian, 0.1% Pacific Islander, 0.7% from other races, and 1.9% from two or more races. The median household income was $37,917 and the median family income was $45,938.
Conclusion
Jim Thorpe Borough is a small borough located in Carbon County, Pennsylvania. It is situated in the Pocono Mountains region of the state and is known for its picturesque scenery and outdoor recreational activities. The borough has a population of approximately 4,800 people and covers an area of 1.2 square miles. The economy of the borough is largely based on tourism, with several popular attractions, restaurants, shops, and other businesses catering to tourists. The racial makeup of the borough is predominantly White, with a median household income of $37,917 and a median family income of $45,938.
Common Questions
What is Per Capita Income in Jim Thorpe borough?
Per Capita income in Jim Thorpe borough is $35,515.
What is the Median Family Income in Jim Thorpe borough?
Median Family Income in Jim Thorpe borough is $82,895.
What is the Median Household income in Jim Thorpe borough?
Median Household Income in Jim Thorpe borough is $64,594.
What is Income or Wage Gap in Jim Thorpe borough?
Income or Wage Gap in Jim Thorpe borough is 33.1%.
Women in Jim Thorpe borough earn 66.9 cents for every dollar earned by a man.
What is Inequality or Gini Index in Jim Thorpe borough?
Inequality or Gini Index in Jim Thorpe borough is 0.37.
What is the Total Population of Jim Thorpe borough?
Total Population of Jim Thorpe borough is 4,532.
What is the Total Male Population of Jim Thorpe borough?
Total Male Population of Jim Thorpe borough is 2,444.
What is the Total Female Population of Jim Thorpe borough?
Total Female Population of Jim Thorpe borough is 2,088.
What is the Ratio of Males per 100 Females in Jim Thorpe borough?
There are 117.05 Males per 100 Females in Jim Thorpe borough.
What is the Ratio of Females per 100 Males in Jim Thorpe borough?
There are 85.43 Females per 100 Males in Jim Thorpe borough.
What is the Median Population Age in Jim Thorpe borough?
Median Population Age in Jim Thorpe borough is 49.0 Years.
What is the Average Family Size in Jim Thorpe borough
Average Family Size in Jim Thorpe borough is 2.8 People.
What is the Average Household Size in Jim Thorpe borough
Average Household Size in Jim Thorpe borough is 2.3 People.
How Large is the Labor Force in Jim Thorpe borough?
There are 2,478 People in the Labor Forcein in Jim Thorpe borough.
What is the Percentage of People in the Labor Force in Jim Thorpe borough?
64.1% of People are in the Labor Force in Jim Thorpe borough.
What is the Unemployment Rate in Jim Thorpe borough?
Unemployment Rate in Jim Thorpe borough is 1.9%.