Reading, OH Map & Demographics
Reading Map
Reading Overview
$35,637
PER CAPITA INCOME
$85,689
AVG FAMILY INCOME
$59,966
AVG HOUSEHOLD INCOME
15.4%
WAGE / INCOME GAP [ % ]
84.6¢/ $1
WAGE / INCOME GAP [ $ ]
0.41
INEQUALITY / GINI INDEX
10,527
TOTAL POPULATION
5,041
MALE POPULATION
5,486
FEMALE POPULATION
91.89
MALES / 100 FEMALES
108.83
FEMALES / 100 MALES
42.1
MEDIAN AGE
2.9
AVG FAMILY SIZE
2.1
AVG HOUSEHOLD SIZE
6,019
LABOR FORCE [ PEOPLE ]
68.8%
PERCENT IN LABOR FORCE
5.1%
UNEMPLOYMENT RATE
Reading Area Codes
Income in Reading
Income Overview in Reading
Per Capita Income in Reading is $35,637, while median incomes of families and households are $85,689 and $59,966 respectively.
| Characteristic | Number | Measure |
| Per Capita Income | 10,527 | $35,637 |
| Median Family Income | 2,579 | $85,689 |
| Mean Family Income | 2,579 | $96,217 |
| Median Household Income | 4,920 | $59,966 |
| Mean Household Income | 4,920 | $75,742 |
| Income Deficit | 2,579 | $0 |
| Wage / Income Gap (%) | 10,527 | 15.37% |
| Wage / Income Gap ($) | 10,527 | 84.63¢ per $1 |
| Gini / Inequality Index | 10,527 | 0.41 |
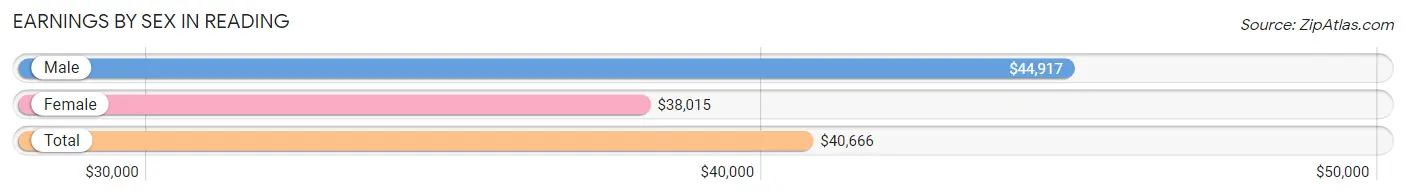
Earnings by Sex in Reading
Average Earnings in Reading are $40,666, $44,917 for men and $38,015 for women, a difference of 15.4%.
| Sex | Number | Average Earnings |
| Male | 3,035 (49.9%) | $44,917 |
| Female | 3,049 (50.1%) | $38,015 |
| Total | 6,084 (100.0%) | $40,666 |
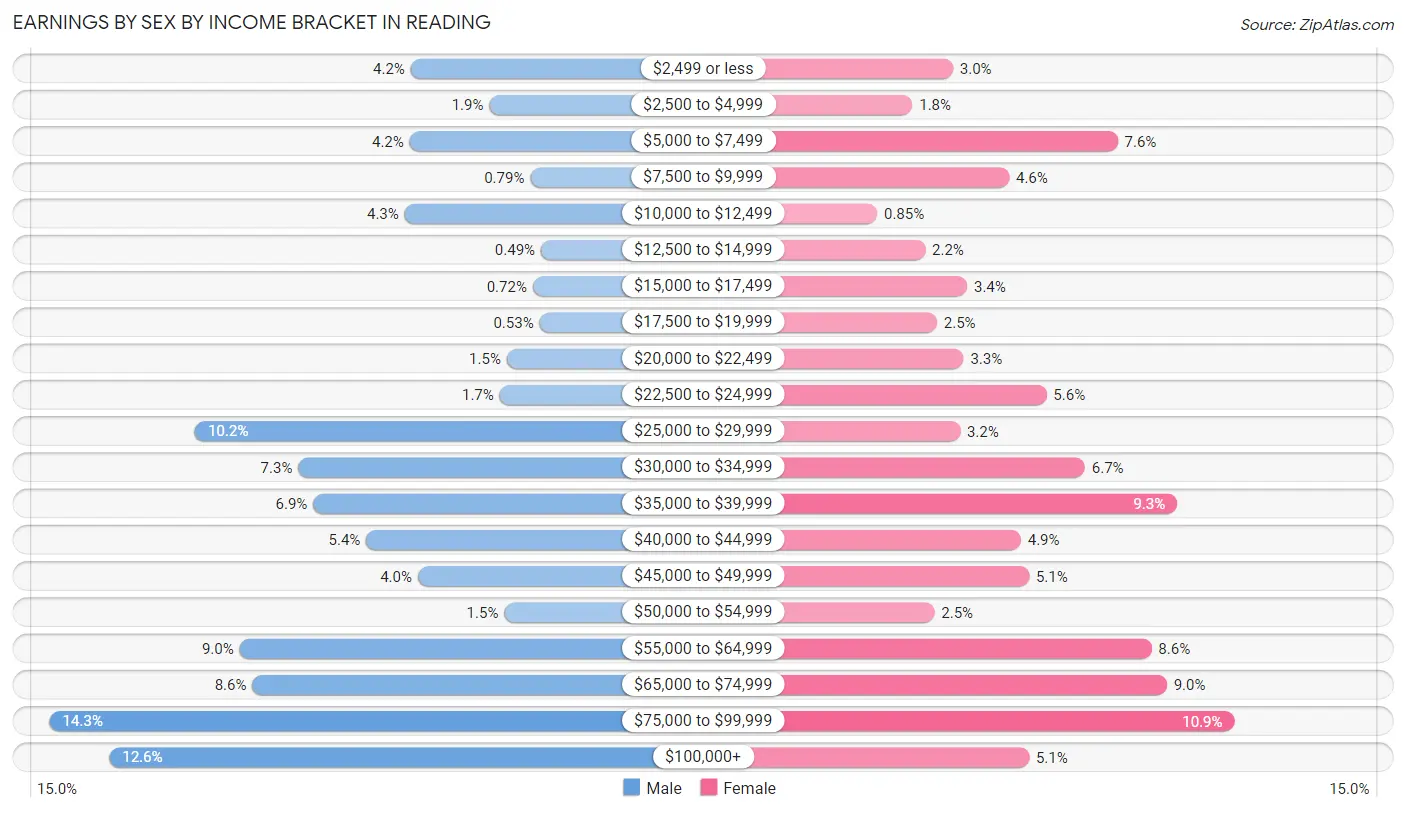
Earnings by Sex by Income Bracket in Reading
The most common earnings brackets in Reading are $75,000 to $99,999 for men (434 | 14.3%) and $75,000 to $99,999 for women (332 | 10.9%).
| Income | Male | Female |
| $2,499 or less | 126 (4.2%) | 91 (3.0%) |
| $2,500 to $4,999 | 59 (1.9%) | 56 (1.8%) |
| $5,000 to $7,499 | 127 (4.2%) | 232 (7.6%) |
| $7,500 to $9,999 | 24 (0.8%) | 139 (4.6%) |
| $10,000 to $12,499 | 131 (4.3%) | 26 (0.9%) |
| $12,500 to $14,999 | 15 (0.5%) | 67 (2.2%) |
| $15,000 to $17,499 | 22 (0.7%) | 103 (3.4%) |
| $17,500 to $19,999 | 16 (0.5%) | 77 (2.5%) |
| $20,000 to $22,499 | 44 (1.5%) | 100 (3.3%) |
| $22,500 to $24,999 | 50 (1.7%) | 171 (5.6%) |
| $25,000 to $29,999 | 310 (10.2%) | 97 (3.2%) |
| $30,000 to $34,999 | 222 (7.3%) | 204 (6.7%) |
| $35,000 to $39,999 | 209 (6.9%) | 283 (9.3%) |
| $40,000 to $44,999 | 164 (5.4%) | 149 (4.9%) |
| $45,000 to $49,999 | 120 (4.0%) | 156 (5.1%) |
| $50,000 to $54,999 | 46 (1.5%) | 75 (2.5%) |
| $55,000 to $64,999 | 272 (9.0%) | 261 (8.6%) |
| $65,000 to $74,999 | 261 (8.6%) | 274 (9.0%) |
| $75,000 to $99,999 | 434 (14.3%) | 332 (10.9%) |
| $100,000+ | 383 (12.6%) | 156 (5.1%) |
| Total | 3,035 (100.0%) | 3,049 (100.0%) |
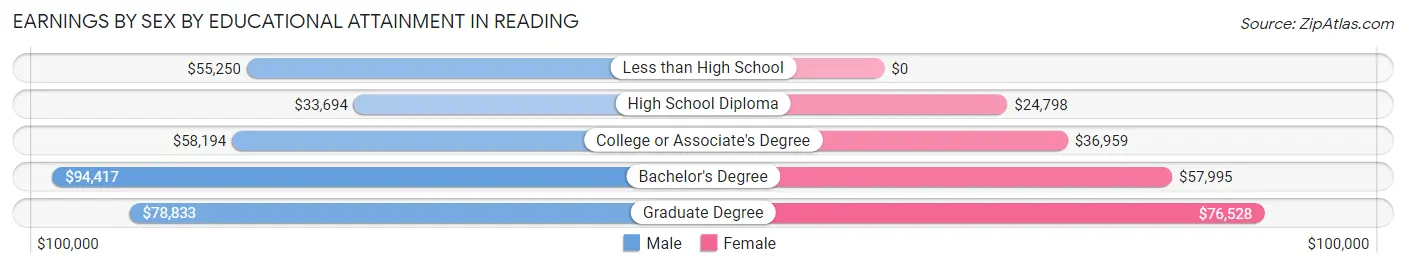
Earnings by Sex by Educational Attainment in Reading
Average earnings in Reading are $55,433 for men and $43,081 for women, a difference of 22.3%. Men with an educational attainment of bachelor's degree enjoy the highest average annual earnings of $94,417, while those with high school diploma education earn the least with $33,694. Women with an educational attainment of graduate degree earn the most with the average annual earnings of $76,528, while those with high school diploma education have the smallest earnings of $24,798.
| Educational Attainment | Male Income | Female Income |
| Less than High School | $55,250 | $0 |
| High School Diploma | $33,694 | $24,798 |
| College or Associate's Degree | $58,194 | $36,959 |
| Bachelor's Degree | $94,417 | $57,995 |
| Graduate Degree | $78,833 | $76,528 |
| Total | $55,433 | $43,081 |
Family Income in Reading
Family Income Brackets in Reading
According to the Reading family income data, there are 611 families falling into the $100,000 to $149,999 income range, which is the most common income bracket and makes up 23.7% of all families. Conversely, the less than $10,000 income bracket is the least frequent group with only 41 families (1.6%) belonging to this category.
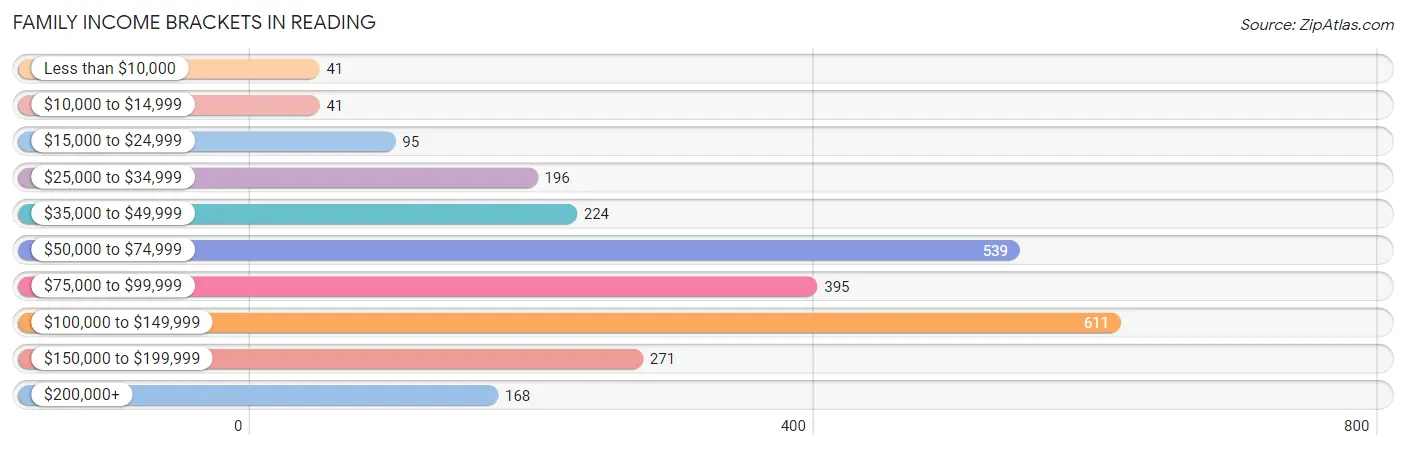
| Income Bracket | # Families | % Families |
| Less than $10,000 | 41 | 1.6% |
| $10,000 to $14,999 | 41 | 1.6% |
| $15,000 to $24,999 | 95 | 3.7% |
| $25,000 to $34,999 | 196 | 7.6% |
| $35,000 to $49,999 | 224 | 8.7% |
| $50,000 to $74,999 | 539 | 20.9% |
| $75,000 to $99,999 | 395 | 15.3% |
| $100,000 to $149,999 | 611 | 23.7% |
| $150,000 to $199,999 | 271 | 10.5% |
| $200,000+ | 168 | 6.5% |
Family Income by Famaliy Size in Reading
4-person families (424 | 16.4%) account for the highest median family income in Reading with $132,712 per family, while 3-person families (540 | 20.9%) have the highest median income of $40,882 per family member.
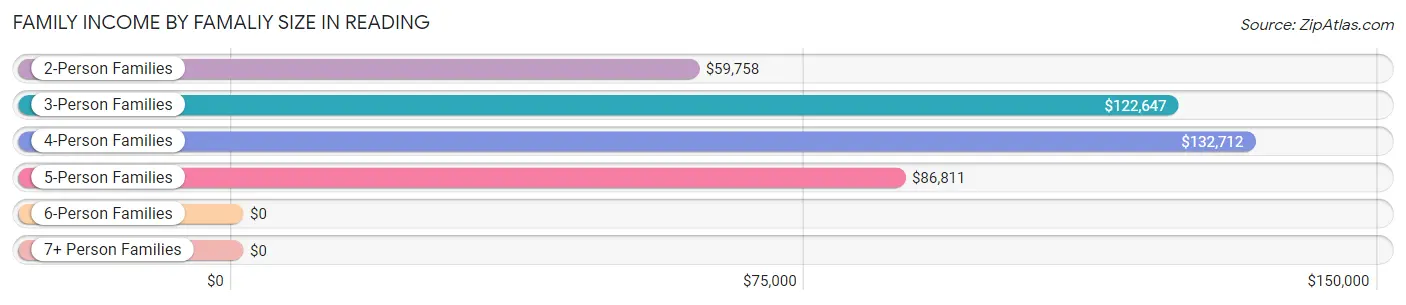
| Income Bracket | # Families | Median Income |
| 2-Person Families | 1,402 (54.4%) | $59,758 |
| 3-Person Families | 540 (20.9%) | $122,647 |
| 4-Person Families | 424 (16.4%) | $132,712 |
| 5-Person Families | 153 (5.9%) | $86,811 |
| 6-Person Families | 23 (0.9%) | $0 |
| 7+ Person Families | 37 (1.4%) | $0 |
| Total | 2,579 (100.0%) | $85,689 |
Family Income by Number of Earners in Reading
The median family income in Reading is $85,689, with families comprising 3+ earners (403) having the highest median family income of $135,069, while families with 1 earner (809) have the lowest median family income of $47,301, accounting for 15.6% and 31.4% of families, respectively.
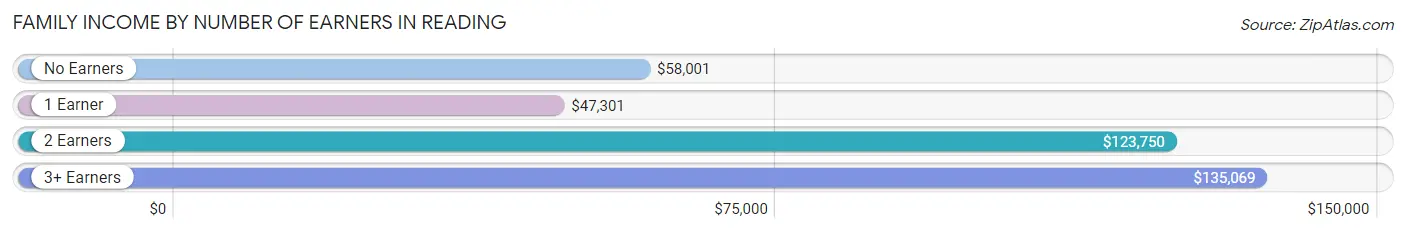
| Number of Earners | # Families | Median Income |
| No Earners | 497 (19.3%) | $58,001 |
| 1 Earner | 809 (31.4%) | $47,301 |
| 2 Earners | 870 (33.7%) | $123,750 |
| 3+ Earners | 403 (15.6%) | $135,069 |
| Total | 2,579 (100.0%) | $85,689 |
Household Income in Reading
Household Income Brackets in Reading
With 1,038 households falling in the category, the $50,000 to $74,999 income range is the most frequent in Reading, accounting for 21.1% of all households. In contrast, only 182 households (3.7%) fall into the $200,000+ income bracket, making it the least populous group.
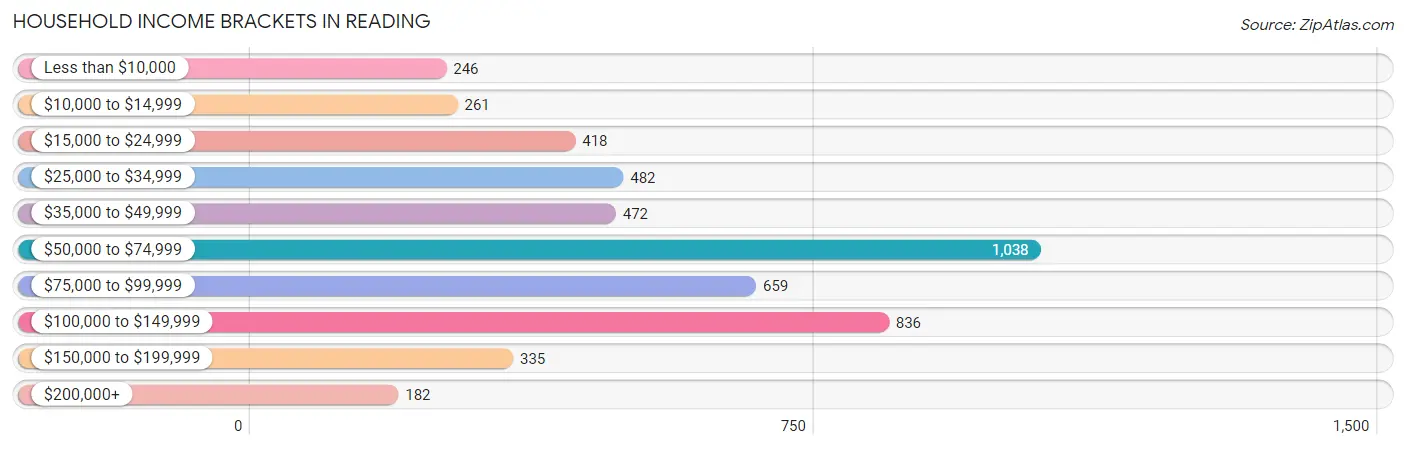
| Income Bracket | # Households | % Households |
| Less than $10,000 | 246 | 5.0% |
| $10,000 to $14,999 | 261 | 5.3% |
| $15,000 to $24,999 | 418 | 8.5% |
| $25,000 to $34,999 | 482 | 9.8% |
| $35,000 to $49,999 | 472 | 9.6% |
| $50,000 to $74,999 | 1,038 | 21.1% |
| $75,000 to $99,999 | 659 | 13.4% |
| $100,000 to $149,999 | 836 | 17.0% |
| $150,000 to $199,999 | 335 | 6.8% |
| $200,000+ | 182 | 3.7% |
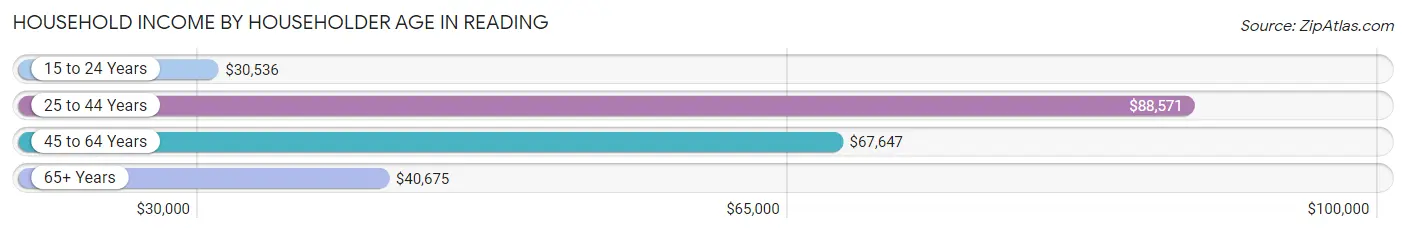
Household Income by Householder Age in Reading
The median household income in Reading is $59,966, with the highest median household income of $88,571 found in the 25 to 44 years age bracket for the primary householder. A total of 1,638 households (33.3%) fall into this category. Meanwhile, the 15 to 24 years age bracket for the primary householder has the lowest median household income of $30,536, with 131 households (2.7%) in this group.
| Income Bracket | # Households | Median Income |
| 15 to 24 Years | 131 (2.7%) | $30,536 |
| 25 to 44 Years | 1,638 (33.3%) | $88,571 |
| 45 to 64 Years | 1,844 (37.5%) | $67,647 |
| 65+ Years | 1,307 (26.6%) | $40,675 |
| Total | 4,920 (100.0%) | $59,966 |
Poverty in Reading
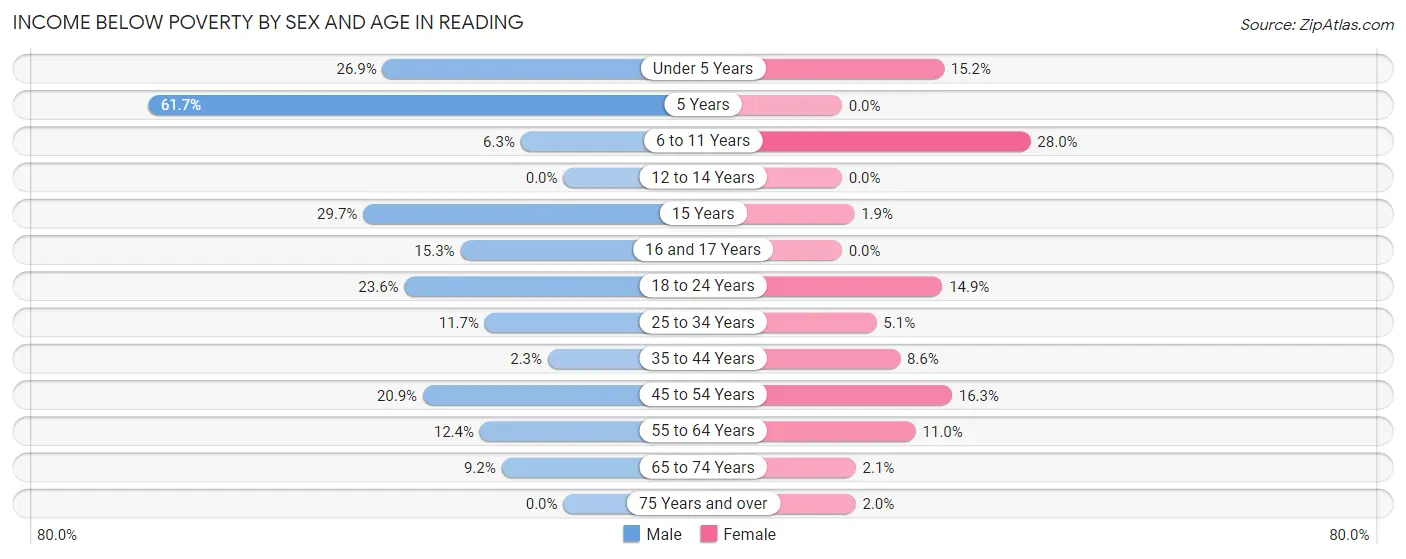
Income Below Poverty by Sex and Age in Reading
With 13.1% poverty level for males and 10.2% for females among the residents of Reading, 5 year old males and 6 to 11 year old females are the most vulnerable to poverty, with 29 males (61.7%) and 128 females (28.0%) in their respective age groups living below the poverty level.
| Age Bracket | Male | Female |
| Under 5 Years | 80 (26.9%) | 40 (15.1%) |
| 5 Years | 29 (61.7%) | 0 (0.0%) |
| 6 to 11 Years | 15 (6.3%) | 128 (28.0%) |
| 12 to 14 Years | 0 (0.0%) | 0 (0.0%) |
| 15 Years | 11 (29.7%) | 2 (1.8%) |
| 16 and 17 Years | 24 (15.3%) | 0 (0.0%) |
| 18 to 24 Years | 93 (23.6%) | 55 (14.9%) |
| 25 to 34 Years | 97 (11.7%) | 36 (5.1%) |
| 35 to 44 Years | 15 (2.3%) | 50 (8.6%) |
| 45 to 54 Years | 147 (20.8%) | 88 (16.3%) |
| 55 to 64 Years | 88 (12.4%) | 132 (11.0%) |
| 65 to 74 Years | 58 (9.2%) | 10 (2.1%) |
| 75 Years and over | 0 (0.0%) | 9 (2.0%) |
| Total | 657 (13.1%) | 550 (10.2%) |
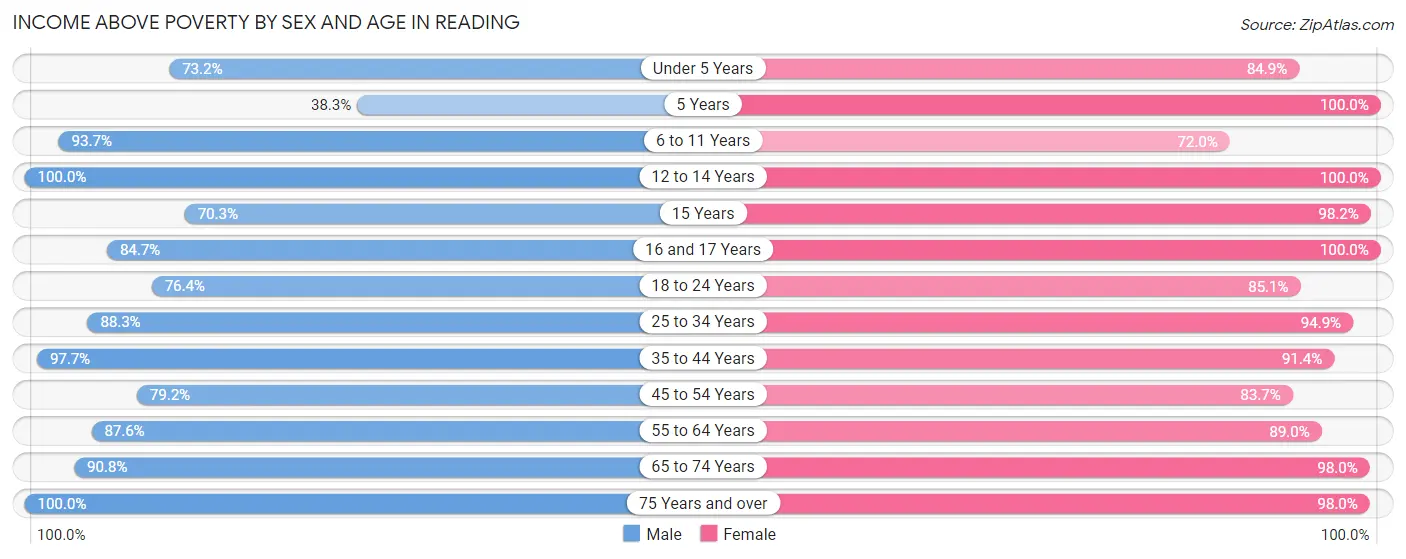
Income Above Poverty by Sex and Age in Reading
According to the poverty statistics in Reading, males aged 12 to 14 years and females aged 5 years are the age groups that are most secure financially, with 100.0% of males and 100.0% of females in these age groups living above the poverty line.
| Age Bracket | Male | Female |
| Under 5 Years | 218 (73.2%) | 224 (84.9%) |
| 5 Years | 18 (38.3%) | 31 (100.0%) |
| 6 to 11 Years | 222 (93.7%) | 329 (72.0%) |
| 12 to 14 Years | 162 (100.0%) | 95 (100.0%) |
| 15 Years | 26 (70.3%) | 106 (98.2%) |
| 16 and 17 Years | 133 (84.7%) | 117 (100.0%) |
| 18 to 24 Years | 301 (76.4%) | 314 (85.1%) |
| 25 to 34 Years | 734 (88.3%) | 665 (94.9%) |
| 35 to 44 Years | 638 (97.7%) | 529 (91.4%) |
| 45 to 54 Years | 558 (79.1%) | 451 (83.7%) |
| 55 to 64 Years | 621 (87.6%) | 1,072 (89.0%) |
| 65 to 74 Years | 574 (90.8%) | 478 (98.0%) |
| 75 Years and over | 173 (100.0%) | 433 (98.0%) |
| Total | 4,378 (87.0%) | 4,844 (89.8%) |
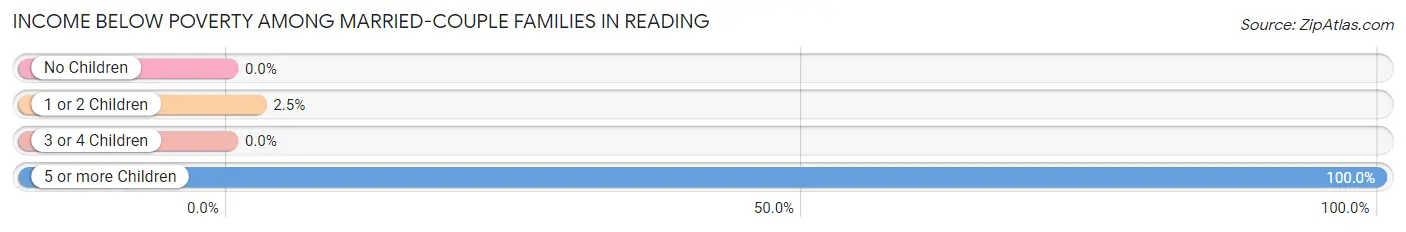
Income Below Poverty Among Married-Couple Families in Reading
The poverty statistics for married-couple families in Reading show that 2.1% or 39 of the total 1,847 families live below the poverty line. Families with 5 or more children have the highest poverty rate of 100.0%, comprising of 27 families. On the other hand, families with no children have the lowest poverty rate of 0.0%, which includes 0 families.
| Children | Above Poverty | Below Poverty |
| No Children | 1,238 (100.0%) | 0 (0.0%) |
| 1 or 2 Children | 473 (97.5%) | 12 (2.5%) |
| 3 or 4 Children | 97 (100.0%) | 0 (0.0%) |
| 5 or more Children | 0 (0.0%) | 27 (100.0%) |
| Total | 1,808 (97.9%) | 39 (2.1%) |
Income Below Poverty Among Single-Parent Households in Reading
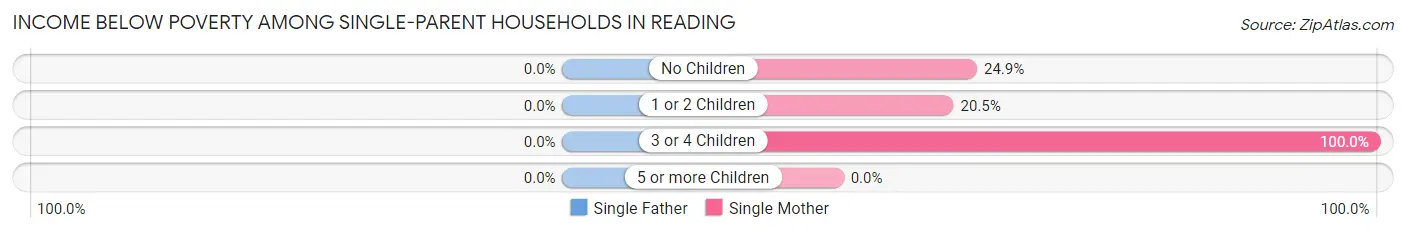
| Children | Single Father | Single Mother |
| No Children | 0 (0.0%) | 41 (24.8%) |
| 1 or 2 Children | 0 (0.0%) | 51 (20.5%) |
| 3 or 4 Children | 0 (0.0%) | 24 (100.0%) |
| 5 or more Children | 0 (0.0%) | 0 (0.0%) |
| Total | 0 (0.0%) | 116 (26.5%) |
Income Below Poverty Among Married-Couple vs Single-Parent Households in Reading
The poverty data for Reading shows that 39 of the married-couple family households (2.1%) and 116 of the single-parent households (15.9%) are living below the poverty level. Within the married-couple family households, those with 5 or more children have the highest poverty rate, with 27 households (100.0%) falling below the poverty line. Among the single-parent households, those with 3 or 4 children have the highest poverty rate, with 24 household (100.0%) living below poverty.
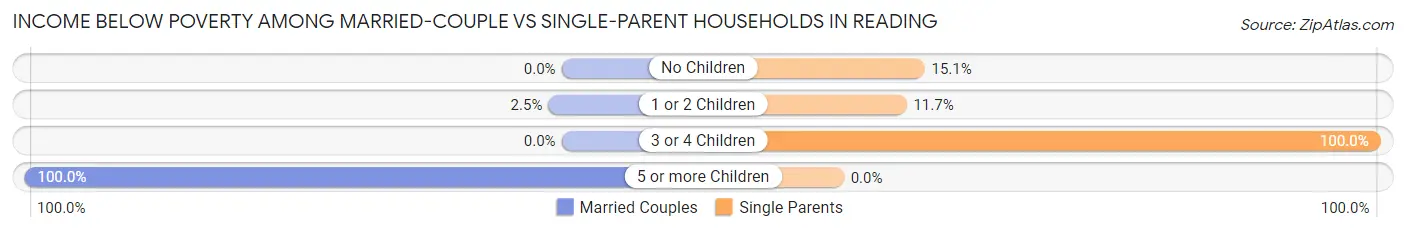
| Children | Married-Couple Families | Single-Parent Households |
| No Children | 0 (0.0%) | 41 (15.1%) |
| 1 or 2 Children | 12 (2.5%) | 51 (11.7%) |
| 3 or 4 Children | 0 (0.0%) | 24 (100.0%) |
| 5 or more Children | 27 (100.0%) | 0 (0.0%) |
| Total | 39 (2.1%) | 116 (15.9%) |
Race in Reading
The most populous races in Reading are White / Caucasian (8,917 | 84.7%), Black / African American (756 | 7.2%), and Hispanic or Latino (445 | 4.2%).
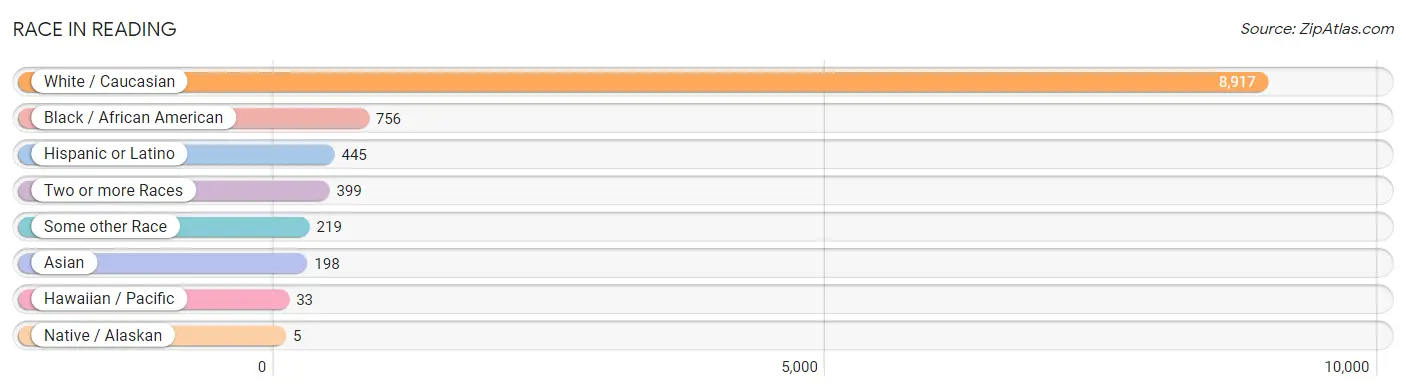
| Race | # Population | % Population |
| Asian | 198 | 1.9% |
| Black / African American | 756 | 7.2% |
| Hawaiian / Pacific | 33 | 0.3% |
| Hispanic or Latino | 445 | 4.2% |
| Native / Alaskan | 5 | 0.1% |
| White / Caucasian | 8,917 | 84.7% |
| Two or more Races | 399 | 3.8% |
| Some other Race | 219 | 2.1% |
| Total | 10,527 | 100.0% |
Ancestry in Reading
The most populous ancestries reported in Reading are German (3,253 | 30.9%), Irish (1,977 | 18.8%), English (1,005 | 9.6%), American (930 | 8.8%), and Italian (495 | 4.7%), together accounting for 72.8% of all Reading residents.
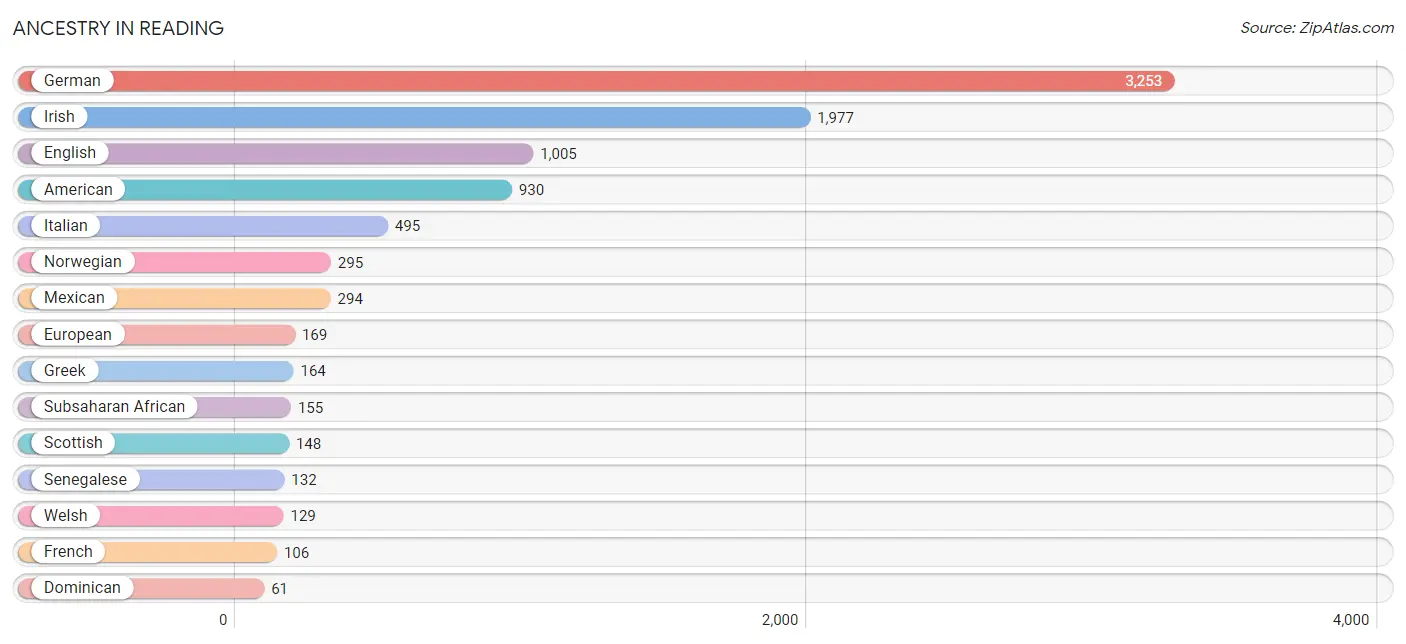
| Ancestry | # Population | % Population |
| African | 23 | 0.2% |
| American | 930 | 8.8% |
| Arab | 48 | 0.5% |
| British | 26 | 0.3% |
| Burmese | 35 | 0.3% |
| Canadian | 6 | 0.1% |
| Central American | 13 | 0.1% |
| Cherokee | 18 | 0.2% |
| Croatian | 30 | 0.3% |
| Czechoslovakian | 11 | 0.1% |
| Dominican | 61 | 0.6% |
| English | 1,005 | 9.6% |
| European | 169 | 1.6% |
| French | 106 | 1.0% |
| French Canadian | 13 | 0.1% |
| German | 3,253 | 30.9% |
| Greek | 164 | 1.6% |
| Guatemalan | 1 | 0.0% |
| Guyanese | 11 | 0.1% |
| Hungarian | 22 | 0.2% |
| Icelander | 17 | 0.2% |
| Irish | 1,977 | 18.8% |
| Iroquois | 8 | 0.1% |
| Israeli | 21 | 0.2% |
| Italian | 495 | 4.7% |
| Lebanese | 32 | 0.3% |
| Lithuanian | 3 | 0.0% |
| Mexican | 294 | 2.8% |
| Native Hawaiian | 33 | 0.3% |
| Norwegian | 295 | 2.8% |
| Peruvian | 57 | 0.5% |
| Polish | 53 | 0.5% |
| Portuguese | 10 | 0.1% |
| Russian | 26 | 0.3% |
| Salvadoran | 12 | 0.1% |
| Scandinavian | 27 | 0.3% |
| Scotch-Irish | 40 | 0.4% |
| Scottish | 148 | 1.4% |
| Senegalese | 132 | 1.3% |
| Slavic | 2 | 0.0% |
| South American | 57 | 0.5% |
| Subsaharan African | 155 | 1.5% |
| Swedish | 53 | 0.5% |
| Thai | 19 | 0.2% |
| Welsh | 129 | 1.2% | View All 45 Rows |
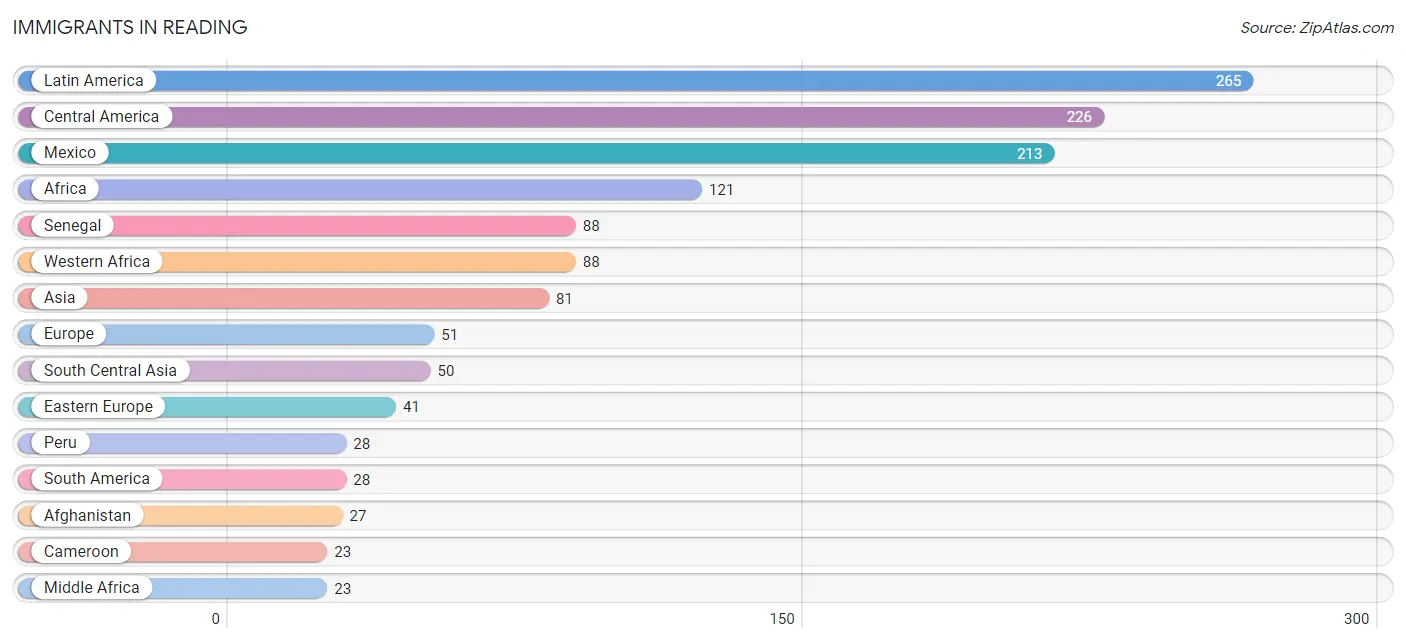
Immigrants in Reading
The most numerous immigrant groups reported in Reading came from Latin America (265 | 2.5%), Central America (226 | 2.1%), Mexico (213 | 2.0%), Africa (121 | 1.1%), and Senegal (88 | 0.8%), together accounting for 8.7% of all Reading residents.
| Immigration Origin | # Population | % Population |
| Afghanistan | 27 | 0.3% |
| Africa | 121 | 1.1% |
| Asia | 81 | 0.8% |
| Belarus | 13 | 0.1% |
| Cameroon | 23 | 0.2% |
| Caribbean | 11 | 0.1% |
| Central America | 226 | 2.1% |
| Croatia | 13 | 0.1% |
| Dominican Republic | 11 | 0.1% |
| Eastern Asia | 16 | 0.2% |
| Eastern Europe | 41 | 0.4% |
| El Salvador | 12 | 0.1% |
| Europe | 51 | 0.5% |
| Greece | 10 | 0.1% |
| Guatemala | 1 | 0.0% |
| Korea | 16 | 0.2% |
| Latin America | 265 | 2.5% |
| Lebanon | 15 | 0.1% |
| Mexico | 213 | 2.0% |
| Middle Africa | 23 | 0.2% |
| Pakistan | 23 | 0.2% |
| Peru | 28 | 0.3% |
| Russia | 15 | 0.1% |
| Senegal | 88 | 0.8% |
| South Africa | 10 | 0.1% |
| South America | 28 | 0.3% |
| South Central Asia | 50 | 0.5% |
| Southern Europe | 10 | 0.1% |
| Western Africa | 88 | 0.8% |
| Western Asia | 15 | 0.1% | View All 30 Rows |
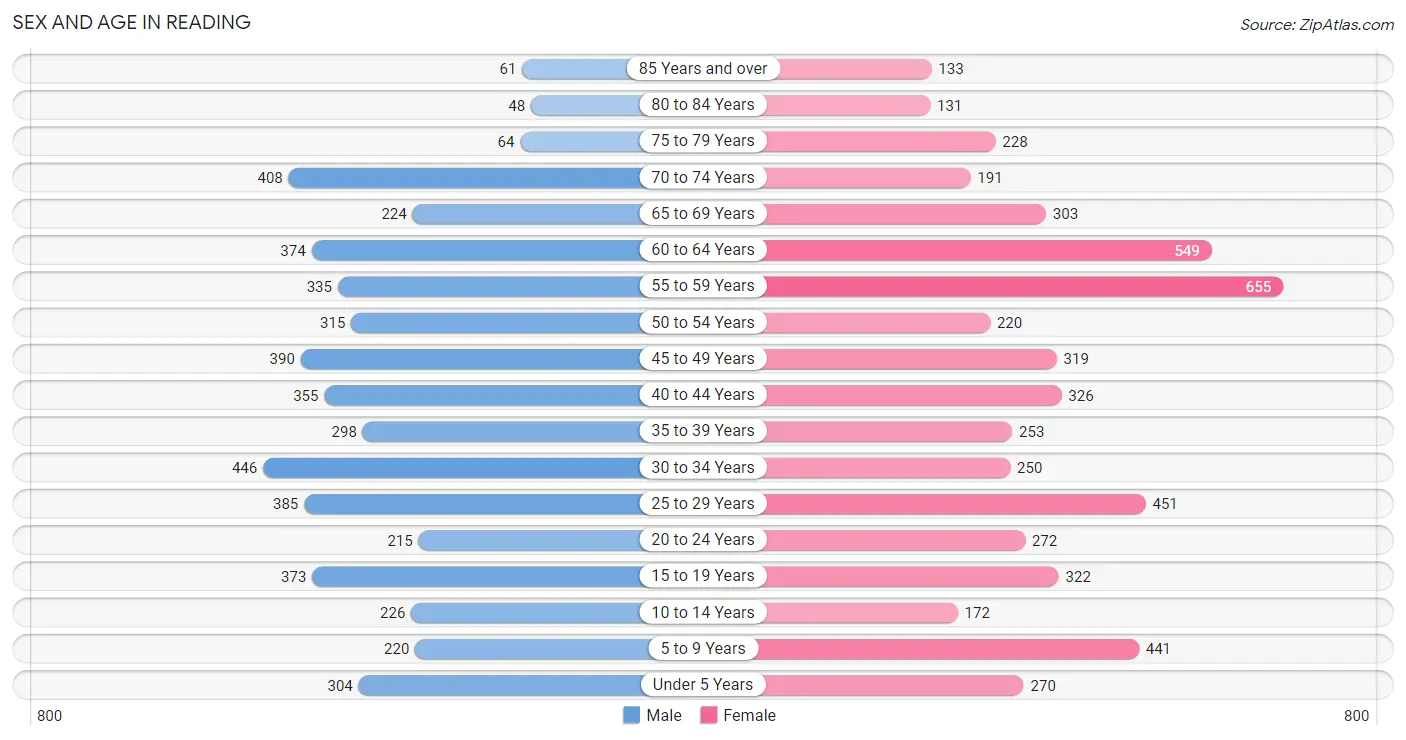
Sex and Age in Reading
Sex and Age in Reading
The most populous age groups in Reading are 30 to 34 Years (446 | 8.8%) for men and 55 to 59 Years (655 | 11.9%) for women.
| Age Bracket | Male | Female |
| Under 5 Years | 304 (6.0%) | 270 (4.9%) |
| 5 to 9 Years | 220 (4.4%) | 441 (8.0%) |
| 10 to 14 Years | 226 (4.5%) | 172 (3.1%) |
| 15 to 19 Years | 373 (7.4%) | 322 (5.9%) |
| 20 to 24 Years | 215 (4.3%) | 272 (5.0%) |
| 25 to 29 Years | 385 (7.6%) | 451 (8.2%) |
| 30 to 34 Years | 446 (8.8%) | 250 (4.6%) |
| 35 to 39 Years | 298 (5.9%) | 253 (4.6%) |
| 40 to 44 Years | 355 (7.0%) | 326 (5.9%) |
| 45 to 49 Years | 390 (7.7%) | 319 (5.8%) |
| 50 to 54 Years | 315 (6.2%) | 220 (4.0%) |
| 55 to 59 Years | 335 (6.7%) | 655 (11.9%) |
| 60 to 64 Years | 374 (7.4%) | 549 (10.0%) |
| 65 to 69 Years | 224 (4.4%) | 303 (5.5%) |
| 70 to 74 Years | 408 (8.1%) | 191 (3.5%) |
| 75 to 79 Years | 64 (1.3%) | 228 (4.2%) |
| 80 to 84 Years | 48 (0.9%) | 131 (2.4%) |
| 85 Years and over | 61 (1.2%) | 133 (2.4%) |
| Total | 5,041 (100.0%) | 5,486 (100.0%) |
Families and Households in Reading
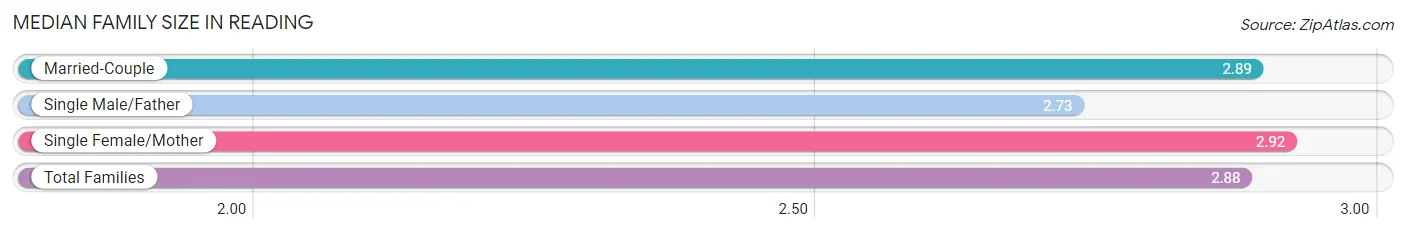
Median Family Size in Reading
The median family size in Reading is 2.88 persons per family, with single female/mother families (438 | 17.0%) accounting for the largest median family size of 2.92 persons per family. On the other hand, single male/father families (294 | 11.4%) represent the smallest median family size with 2.73 persons per family.
| Family Type | # Families | Family Size |
| Married-Couple | 1,847 (71.6%) | 2.89 |
| Single Male/Father | 294 (11.4%) | 2.73 |
| Single Female/Mother | 438 (17.0%) | 2.92 |
| Total Families | 2,579 (100.0%) | 2.88 |
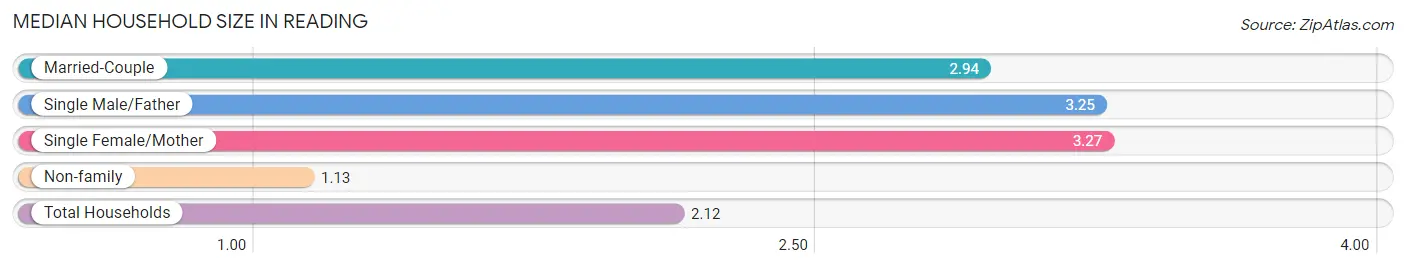
Median Household Size in Reading
The median household size in Reading is 2.12 persons per household, with single female/mother households (438 | 8.9%) accounting for the largest median household size of 3.27 persons per household. non-family households (2,341 | 47.6%) represent the smallest median household size with 1.13 persons per household.
| Household Type | # Households | Household Size |
| Married-Couple | 1,847 (37.5%) | 2.94 |
| Single Male/Father | 294 (6.0%) | 3.25 |
| Single Female/Mother | 438 (8.9%) | 3.27 |
| Non-family | 2,341 (47.6%) | 1.13 |
| Total Households | 4,920 (100.0%) | 2.12 |
Household Size by Marriage Status in Reading
Out of a total of 4,920 households in Reading, 2,579 (52.4%) are family households, while 2,341 (47.6%) are nonfamily households. The most numerous type of family households are 2-person households, comprising 1,240, and the most common type of nonfamily households are 1-person households, comprising 2,052.
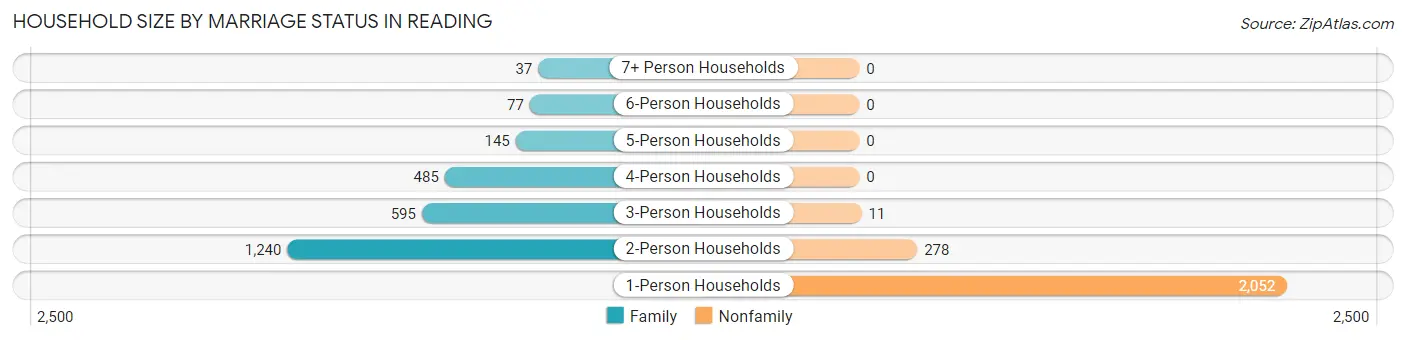
| Household Size | Family Households | Nonfamily Households |
| 1-Person Households | - | 2,052 (41.7%) |
| 2-Person Households | 1,240 (25.2%) | 278 (5.7%) |
| 3-Person Households | 595 (12.1%) | 11 (0.2%) |
| 4-Person Households | 485 (9.9%) | 0 (0.0%) |
| 5-Person Households | 145 (2.9%) | 0 (0.0%) |
| 6-Person Households | 77 (1.6%) | 0 (0.0%) |
| 7+ Person Households | 37 (0.7%) | 0 (0.0%) |
| Total | 2,579 (52.4%) | 2,341 (47.6%) |
Female Fertility in Reading
Fertility by Age in Reading
Average fertility rate in Reading is 30.0 births per 1,000 women. Women in the age bracket of 20 to 34 years have the highest fertility rate with 63.0 births per 1,000 women. Women in the age bracket of 20 to 34 years acount for 89.7% of all women with births.
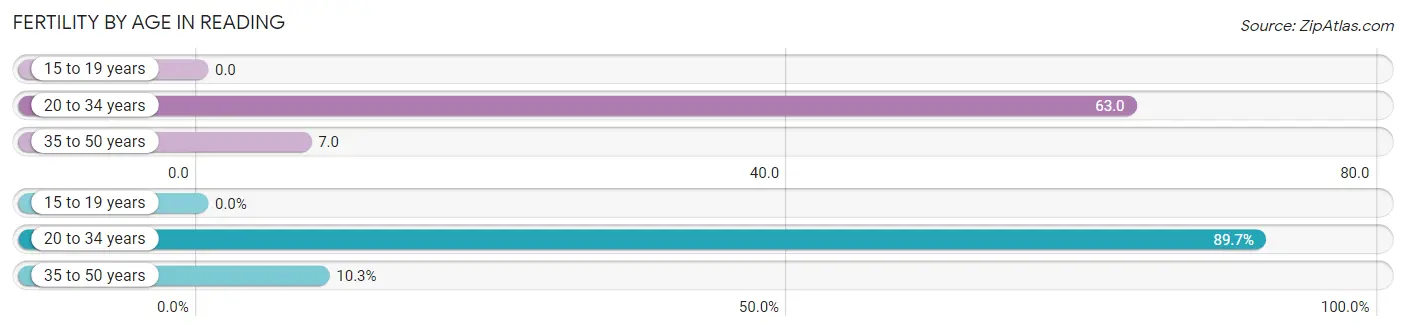
| Age Bracket | Women with Births | Births / 1,000 Women |
| 15 to 19 years | 0 (0.0%) | 0.0 |
| 20 to 34 years | 61 (89.7%) | 63.0 |
| 35 to 50 years | 7 (10.3%) | 7.0 |
| Total | 68 (100.0%) | 30.0 |
Fertility by Age by Marriage Status in Reading
57.4% of women with births (68) in Reading are married. The highest percentage of unmarried women with births falls into 20 to 34 years age bracket with 47.5% of them unmarried at the time of birth, while the lowest percentage of unmarried women with births belong to 35 to 50 years age bracket with 0.0% of them unmarried.
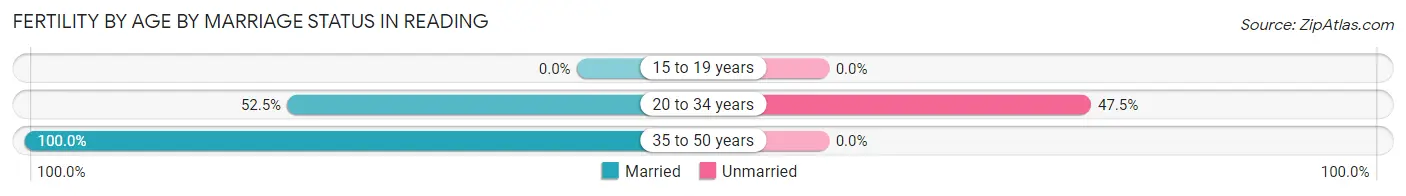
| Age Bracket | Married | Unmarried |
| 15 to 19 years | 0 (0.0%) | 0 (0.0%) |
| 20 to 34 years | 32 (52.5%) | 29 (47.5%) |
| 35 to 50 years | 7 (100.0%) | 0 (0.0%) |
| Total | 39 (57.4%) | 29 (42.6%) |
Fertility by Education in Reading
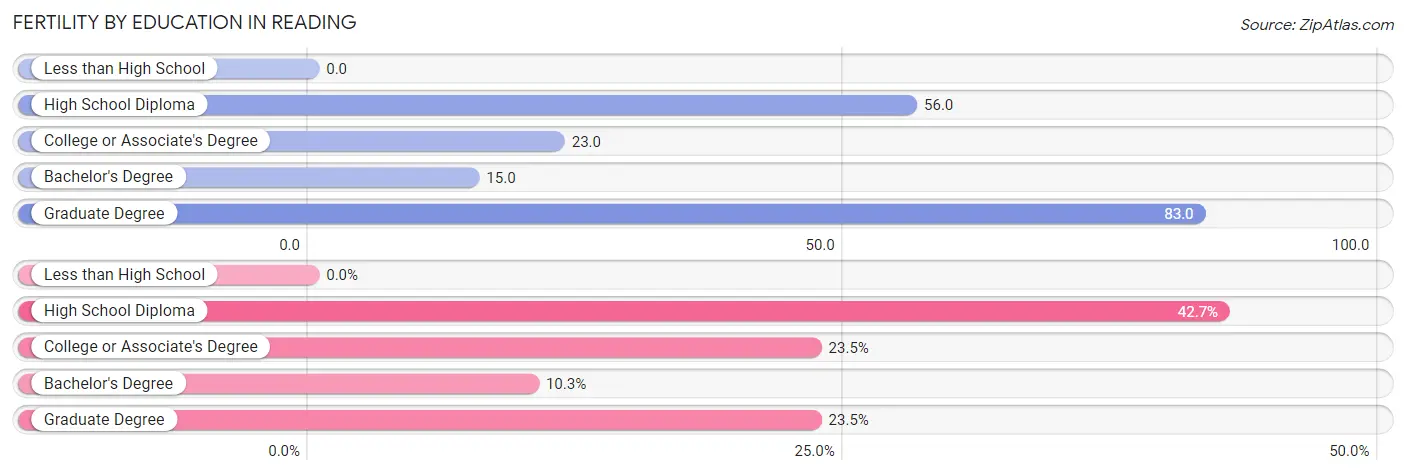
| Educational Attainment | Women with Births | Births / 1,000 Women |
| Less than High School | 0 (0.0%) | 0.0 |
| High School Diploma | 29 (42.6%) | 56.0 |
| College or Associate's Degree | 16 (23.5%) | 23.0 |
| Bachelor's Degree | 7 (10.3%) | 15.0 |
| Graduate Degree | 16 (23.5%) | 83.0 |
| Total | 68 (100.0%) | 30.0 |
Fertility by Education by Marriage Status in Reading
42.6% of women with births in Reading are unmarried. Women with the educational attainment of college or associate's degree are most likely to be married with 100.0% of them married at childbirth, while women with the educational attainment of high school diploma are least likely to be married with 100.0% of them unmarried at childbirth.
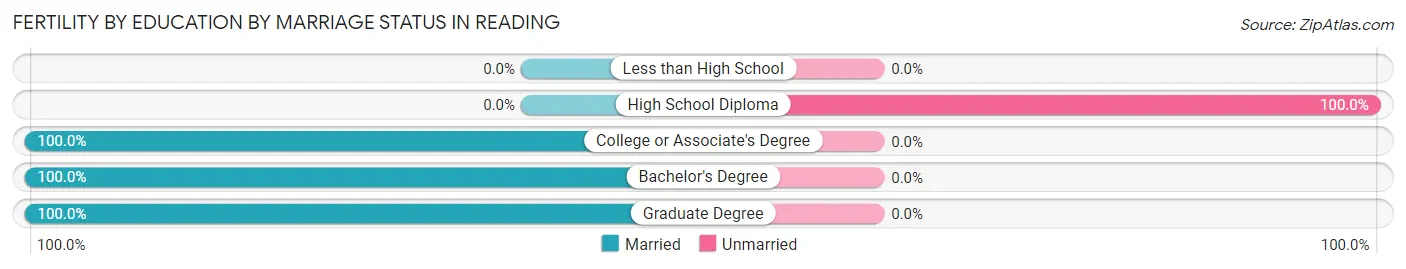
| Educational Attainment | Married | Unmarried |
| Less than High School | 0 (0.0%) | 0 (0.0%) |
| High School Diploma | 0 (0.0%) | 29 (100.0%) |
| College or Associate's Degree | 16 (100.0%) | 0 (0.0%) |
| Bachelor's Degree | 7 (100.0%) | 0 (0.0%) |
| Graduate Degree | 16 (100.0%) | 0 (0.0%) |
| Total | 39 (57.4%) | 29 (42.6%) |
Employment Characteristics in Reading
Employment by Class of Employer in Reading
Among the 5,609 employed individuals in Reading, private company employees (4,067 | 72.5%), not-for-profit organizations (631 | 11.3%), and local government employees (398 | 7.1%) make up the most common classes of employment.
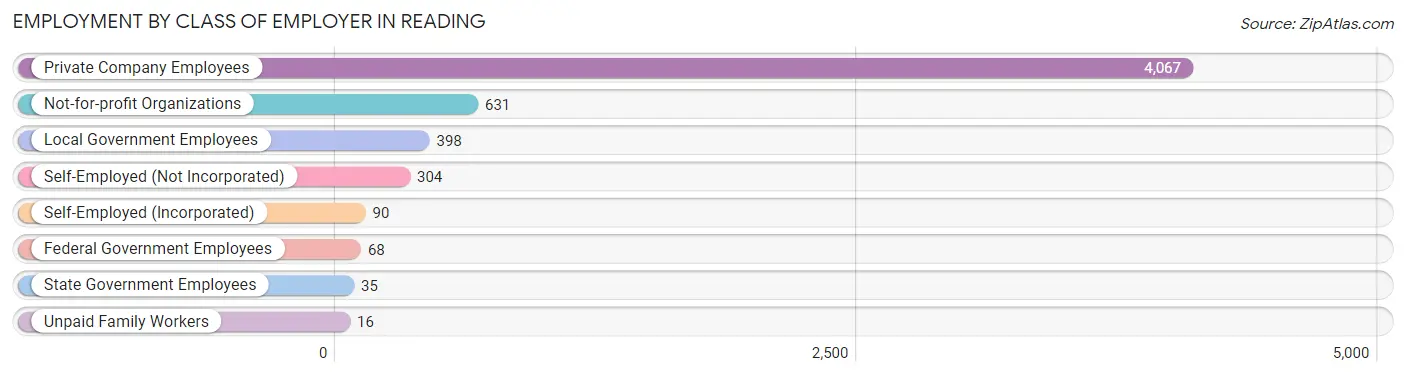
| Employer Class | # Employees | % Employees |
| Private Company Employees | 4,067 | 72.5% |
| Self-Employed (Incorporated) | 90 | 1.6% |
| Self-Employed (Not Incorporated) | 304 | 5.4% |
| Not-for-profit Organizations | 631 | 11.3% |
| Local Government Employees | 398 | 7.1% |
| State Government Employees | 35 | 0.6% |
| Federal Government Employees | 68 | 1.2% |
| Unpaid Family Workers | 16 | 0.3% |
| Total | 5,609 | 100.0% |
Employment Status by Age in Reading
According to the labor force statistics for Reading, out of the total population over 16 years of age (8,749), 68.8% or 6,019 individuals are in the labor force, with 5.1% or 307 of them unemployed. The age group with the highest labor force participation rate is 20 to 24 years, with 98.2% or 478 individuals in the labor force. Within the labor force, the 16 to 19 years age range has the highest percentage of unemployed individuals, with 32.3% or 100 of them being unemployed.
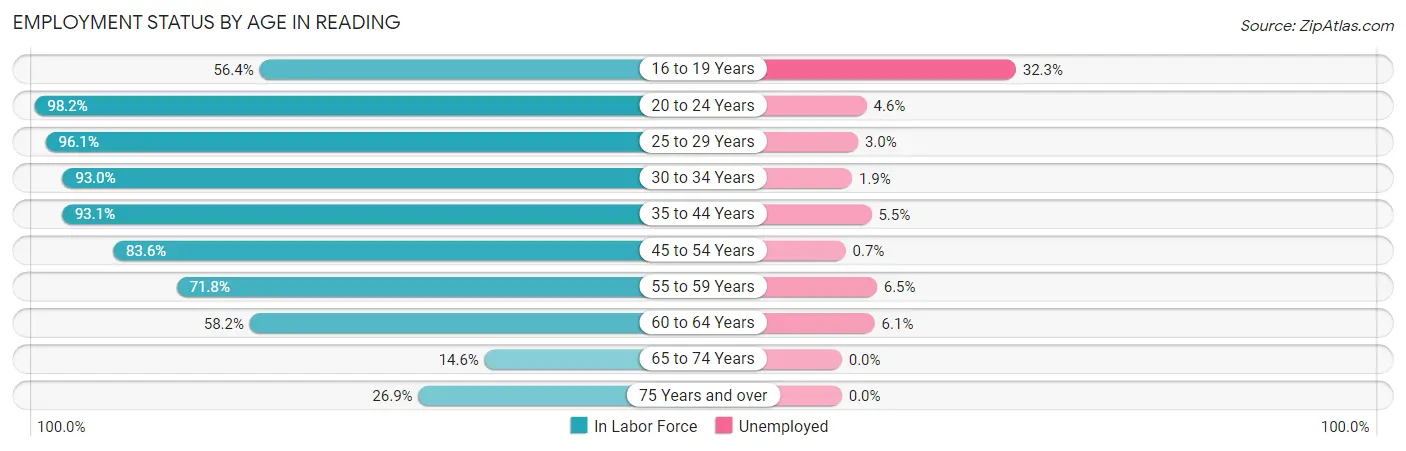
| Age Bracket | In Labor Force | Unemployed |
| 16 to 19 Years | 310 (56.4%) | 100 (32.3%) |
| 20 to 24 Years | 478 (98.2%) | 22 (4.6%) |
| 25 to 29 Years | 803 (96.1%) | 24 (3.0%) |
| 30 to 34 Years | 647 (93.0%) | 12 (1.9%) |
| 35 to 44 Years | 1,147 (93.1%) | 63 (5.5%) |
| 45 to 54 Years | 1,040 (83.6%) | 7 (0.7%) |
| 55 to 59 Years | 711 (71.8%) | 46 (6.5%) |
| 60 to 64 Years | 537 (58.2%) | 33 (6.1%) |
| 65 to 74 Years | 164 (14.6%) | 0 (0.0%) |
| 75 Years and over | 179 (26.9%) | 0 (0.0%) |
| Total | 6,019 (68.8%) | 307 (5.1%) |
Employment Status by Educational Attainment in Reading
According to labor force statistics for Reading, 82.5% of individuals (4,885) out of the total population between 25 and 64 years of age (5,921) are in the labor force, with 3.8% or 186 of them being unemployed. The group with the highest labor force participation rate are those with the educational attainment of bachelor's degree or higher, with 94.1% or 1,635 individuals in the labor force. Within the labor force, individuals with less than high school education have the highest percentage of unemployment, with 12.6% or 36 of them being unemployed.
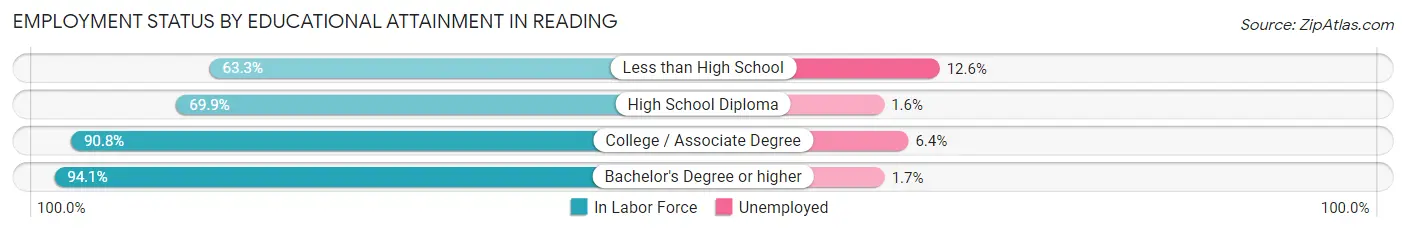
| Educational Attainment | In Labor Force | Unemployed |
| Less than High School | 286 (63.3%) | 57 (12.6%) |
| High School Diploma | 1,420 (69.9%) | 32 (1.6%) |
| College / Associate Degree | 1,545 (90.8%) | 109 (6.4%) |
| Bachelor's Degree or higher | 1,635 (94.1%) | 30 (1.7%) |
| Total | 4,885 (82.5%) | 225 (3.8%) |
Employment Occupations by Sex in Reading
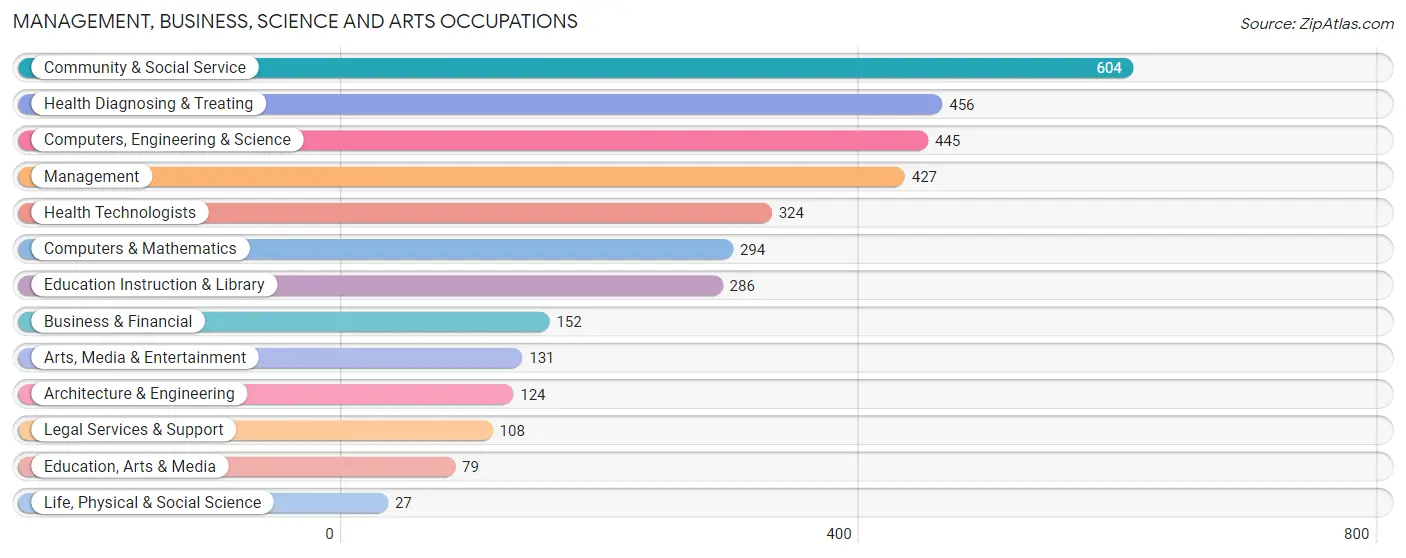
Management, Business, Science and Arts Occupations
The most common Management, Business, Science and Arts occupations in Reading are Community & Social Service (604 | 10.6%), Health Diagnosing & Treating (456 | 8.0%), Computers, Engineering & Science (445 | 7.8%), Management (427 | 7.5%), and Health Technologists (324 | 5.7%).
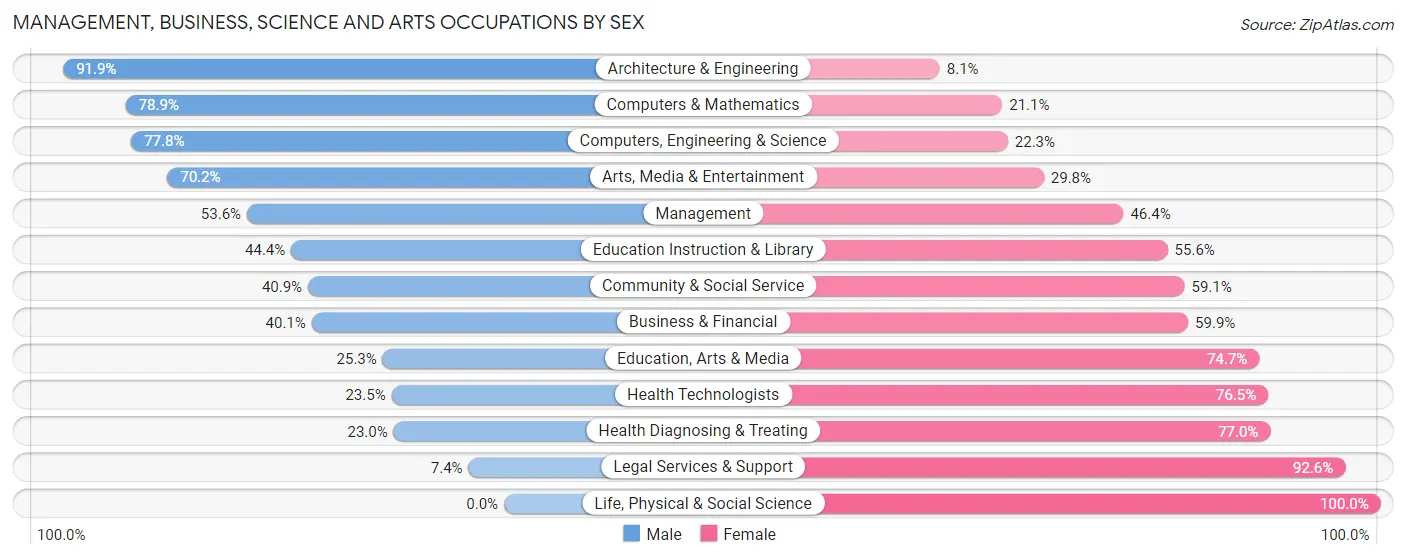
Management, Business, Science and Arts Occupations by Sex
Within the Management, Business, Science and Arts occupations in Reading, the most male-oriented occupations are Architecture & Engineering (91.9%), Computers & Mathematics (78.9%), and Computers, Engineering & Science (77.7%), while the most female-oriented occupations are Life, Physical & Social Science (100.0%), Legal Services & Support (92.6%), and Health Diagnosing & Treating (77.0%).
| Occupation | Male | Female |
| Management | 229 (53.6%) | 198 (46.4%) |
| Business & Financial | 61 (40.1%) | 91 (59.9%) |
| Computers, Engineering & Science | 346 (77.7%) | 99 (22.3%) |
| Computers & Mathematics | 232 (78.9%) | 62 (21.1%) |
| Architecture & Engineering | 114 (91.9%) | 10 (8.1%) |
| Life, Physical & Social Science | 0 (0.0%) | 27 (100.0%) |
| Community & Social Service | 247 (40.9%) | 357 (59.1%) |
| Education, Arts & Media | 20 (25.3%) | 59 (74.7%) |
| Legal Services & Support | 8 (7.4%) | 100 (92.6%) |
| Education Instruction & Library | 127 (44.4%) | 159 (55.6%) |
| Arts, Media & Entertainment | 92 (70.2%) | 39 (29.8%) |
| Health Diagnosing & Treating | 105 (23.0%) | 351 (77.0%) |
| Health Technologists | 76 (23.5%) | 248 (76.5%) |
| Total (Category) | 988 (47.4%) | 1,096 (52.6%) |
| Total (Overall) | 2,846 (49.8%) | 2,863 (50.1%) |
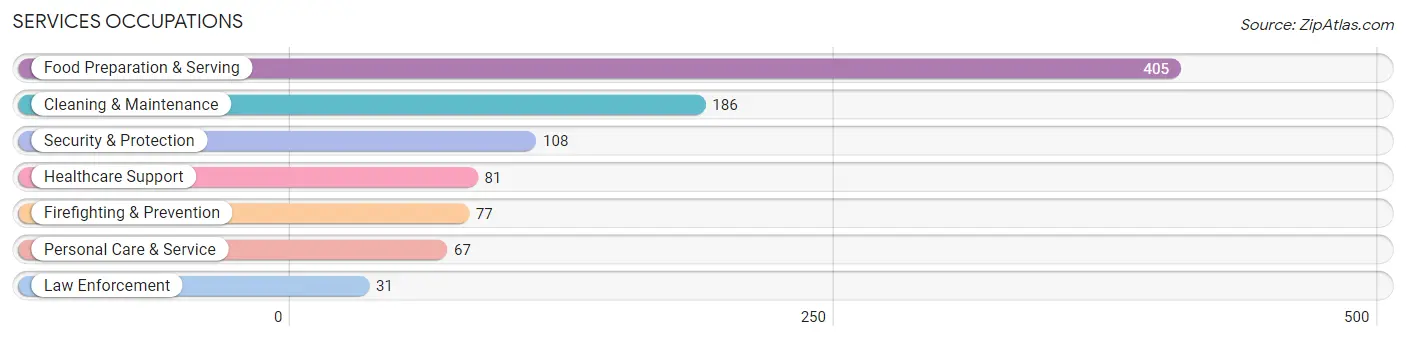
Services Occupations
The most common Services occupations in Reading are Food Preparation & Serving (405 | 7.1%), Cleaning & Maintenance (186 | 3.3%), Security & Protection (108 | 1.9%), Healthcare Support (81 | 1.4%), and Firefighting & Prevention (77 | 1.3%).
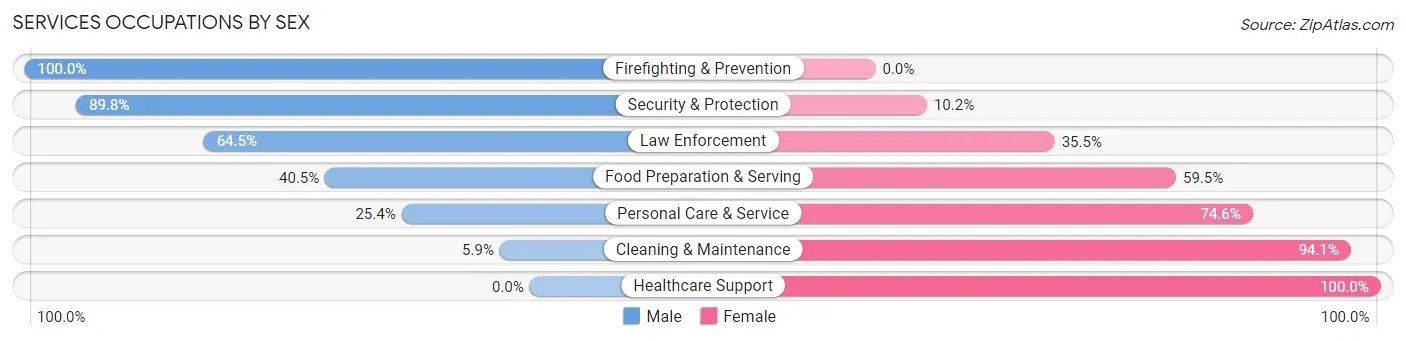
Services Occupations by Sex
Within the Services occupations in Reading, the most male-oriented occupations are Firefighting & Prevention (100.0%), Security & Protection (89.8%), and Law Enforcement (64.5%), while the most female-oriented occupations are Healthcare Support (100.0%), Cleaning & Maintenance (94.1%), and Personal Care & Service (74.6%).
| Occupation | Male | Female |
| Healthcare Support | 0 (0.0%) | 81 (100.0%) |
| Security & Protection | 97 (89.8%) | 11 (10.2%) |
| Firefighting & Prevention | 77 (100.0%) | 0 (0.0%) |
| Law Enforcement | 20 (64.5%) | 11 (35.5%) |
| Food Preparation & Serving | 164 (40.5%) | 241 (59.5%) |
| Cleaning & Maintenance | 11 (5.9%) | 175 (94.1%) |
| Personal Care & Service | 17 (25.4%) | 50 (74.6%) |
| Total (Category) | 289 (34.1%) | 558 (65.9%) |
| Total (Overall) | 2,846 (49.8%) | 2,863 (50.1%) |
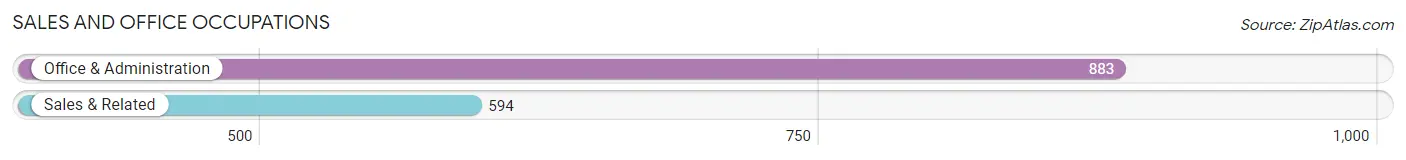
Sales and Office Occupations
The most common Sales and Office occupations in Reading are Office & Administration (883 | 15.5%), and Sales & Related (594 | 10.4%).
Sales and Office Occupations by Sex
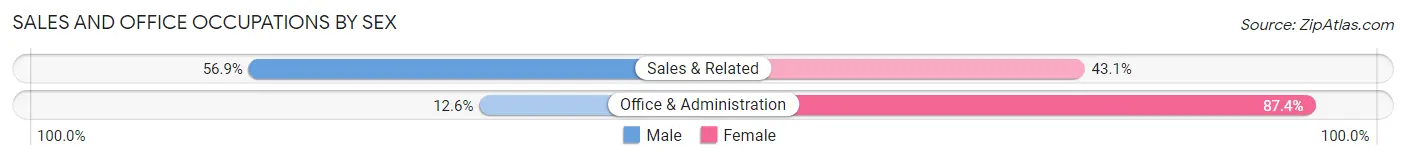
| Occupation | Male | Female |
| Sales & Related | 338 (56.9%) | 256 (43.1%) |
| Office & Administration | 111 (12.6%) | 772 (87.4%) |
| Total (Category) | 449 (30.4%) | 1,028 (69.6%) |
| Total (Overall) | 2,846 (49.8%) | 2,863 (50.1%) |
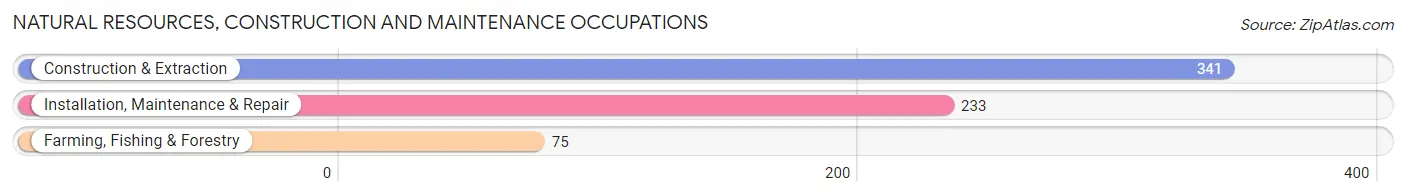
Natural Resources, Construction and Maintenance Occupations
The most common Natural Resources, Construction and Maintenance occupations in Reading are Construction & Extraction (341 | 6.0%), Installation, Maintenance & Repair (233 | 4.1%), and Farming, Fishing & Forestry (75 | 1.3%).
Natural Resources, Construction and Maintenance Occupations by Sex
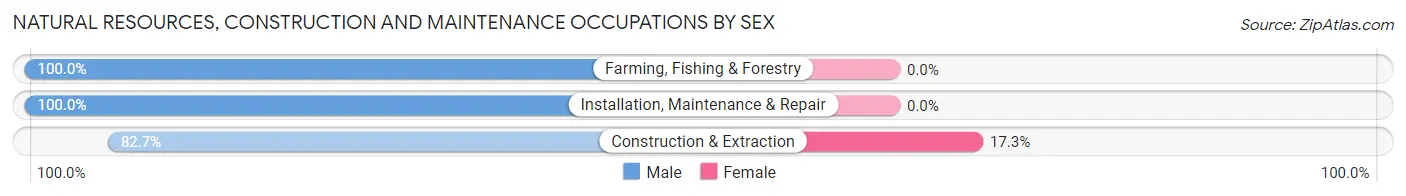
| Occupation | Male | Female |
| Farming, Fishing & Forestry | 75 (100.0%) | 0 (0.0%) |
| Construction & Extraction | 282 (82.7%) | 59 (17.3%) |
| Installation, Maintenance & Repair | 233 (100.0%) | 0 (0.0%) |
| Total (Category) | 590 (90.9%) | 59 (9.1%) |
| Total (Overall) | 2,846 (49.8%) | 2,863 (50.1%) |
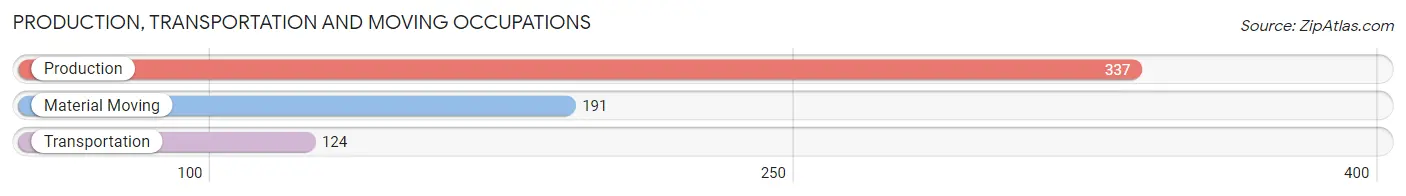
Production, Transportation and Moving Occupations
The most common Production, Transportation and Moving occupations in Reading are Production (337 | 5.9%), Material Moving (191 | 3.4%), and Transportation (124 | 2.2%).
Production, Transportation and Moving Occupations by Sex
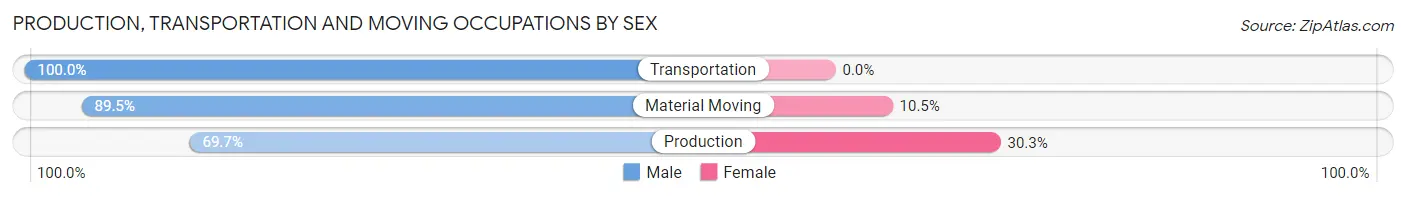
| Occupation | Male | Female |
| Production | 235 (69.7%) | 102 (30.3%) |
| Transportation | 124 (100.0%) | 0 (0.0%) |
| Material Moving | 171 (89.5%) | 20 (10.5%) |
| Total (Category) | 530 (81.3%) | 122 (18.7%) |
| Total (Overall) | 2,846 (49.8%) | 2,863 (50.1%) |
Employment Industries by Sex in Reading
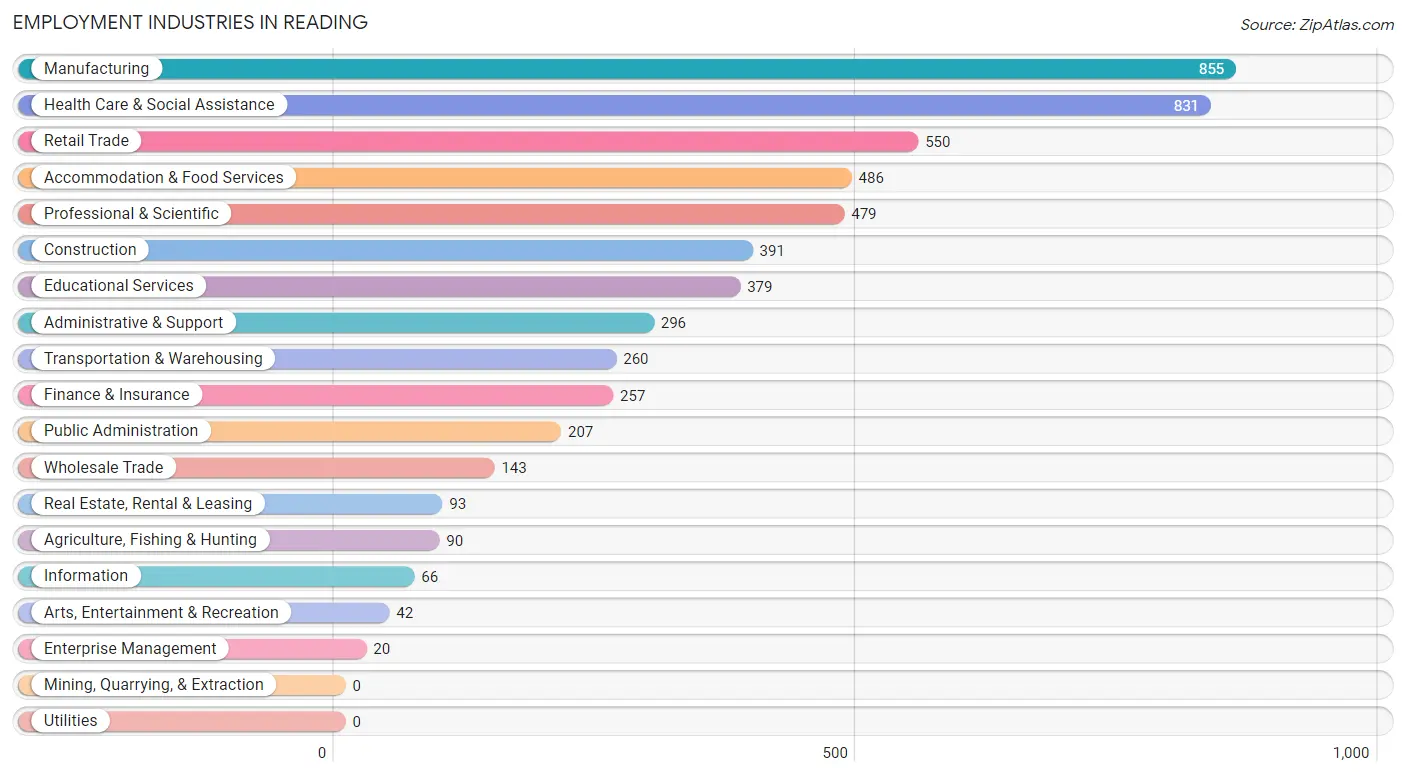
Employment Industries in Reading
The major employment industries in Reading include Manufacturing (855 | 15.0%), Health Care & Social Assistance (831 | 14.6%), Retail Trade (550 | 9.6%), Accommodation & Food Services (486 | 8.5%), and Professional & Scientific (479 | 8.4%).
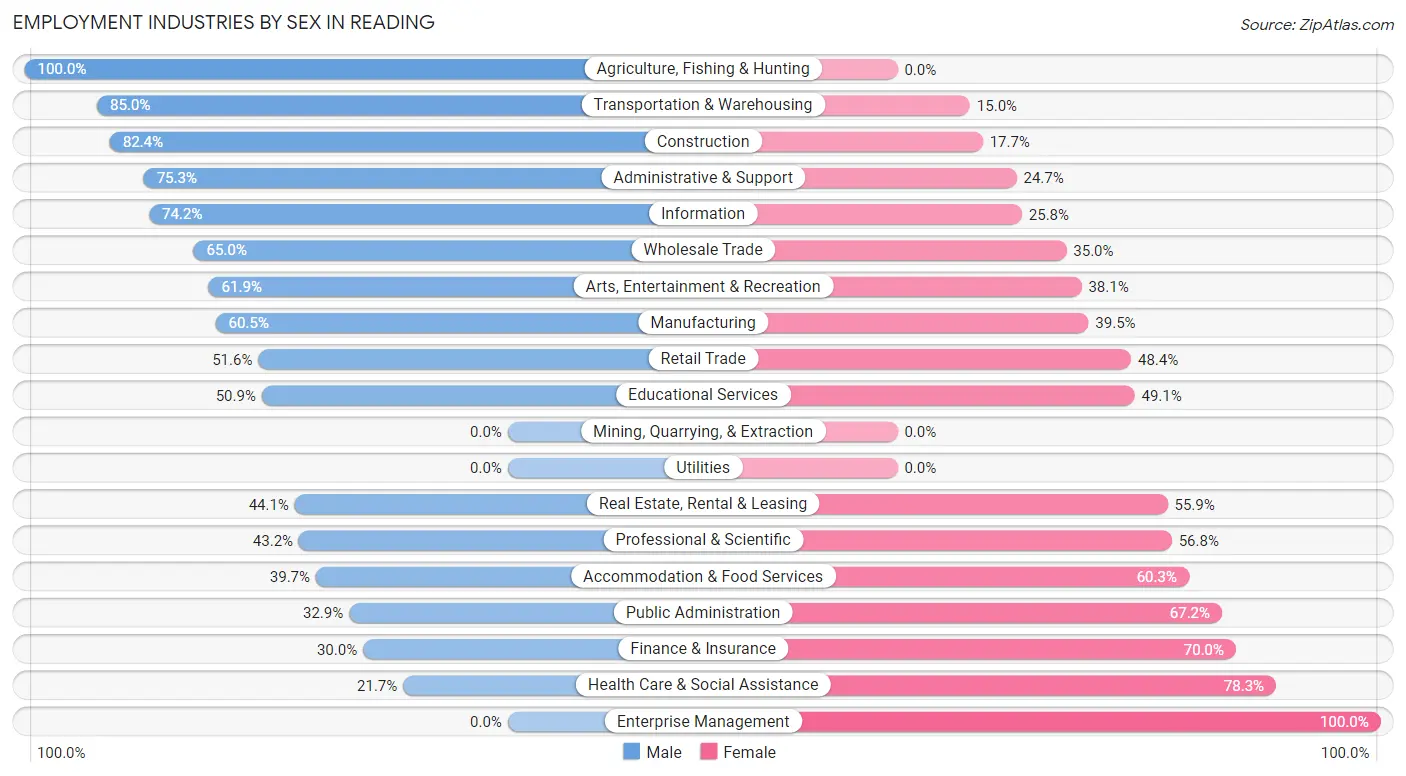
Employment Industries by Sex in Reading
The Reading industries that see more men than women are Agriculture, Fishing & Hunting (100.0%), Transportation & Warehousing (85.0%), and Construction (82.4%), whereas the industries that tend to have a higher number of women are Enterprise Management (100.0%), Health Care & Social Assistance (78.3%), and Finance & Insurance (70.0%).
| Industry | Male | Female |
| Agriculture, Fishing & Hunting | 90 (100.0%) | 0 (0.0%) |
| Mining, Quarrying, & Extraction | 0 (0.0%) | 0 (0.0%) |
| Construction | 322 (82.4%) | 69 (17.6%) |
| Manufacturing | 517 (60.5%) | 338 (39.5%) |
| Wholesale Trade | 93 (65.0%) | 50 (35.0%) |
| Retail Trade | 284 (51.6%) | 266 (48.4%) |
| Transportation & Warehousing | 221 (85.0%) | 39 (15.0%) |
| Utilities | 0 (0.0%) | 0 (0.0%) |
| Information | 49 (74.2%) | 17 (25.8%) |
| Finance & Insurance | 77 (30.0%) | 180 (70.0%) |
| Real Estate, Rental & Leasing | 41 (44.1%) | 52 (55.9%) |
| Professional & Scientific | 207 (43.2%) | 272 (56.8%) |
| Enterprise Management | 0 (0.0%) | 20 (100.0%) |
| Administrative & Support | 223 (75.3%) | 73 (24.7%) |
| Educational Services | 193 (50.9%) | 186 (49.1%) |
| Health Care & Social Assistance | 180 (21.7%) | 651 (78.3%) |
| Arts, Entertainment & Recreation | 26 (61.9%) | 16 (38.1%) |
| Accommodation & Food Services | 193 (39.7%) | 293 (60.3%) |
| Public Administration | 68 (32.9%) | 139 (67.1%) |
| Total | 2,846 (49.8%) | 2,863 (50.1%) |
Education in Reading
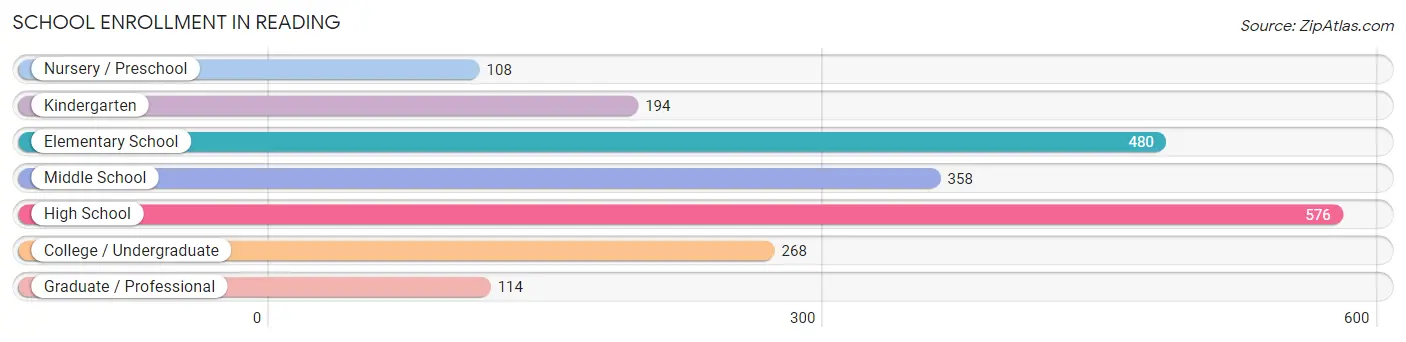
School Enrollment in Reading
The most common levels of schooling among the 2,098 students in Reading are high school (576 | 27.5%), elementary school (480 | 22.9%), and middle school (358 | 17.1%).
| School Level | # Students | % Students |
| Nursery / Preschool | 108 | 5.1% |
| Kindergarten | 194 | 9.2% |
| Elementary School | 480 | 22.9% |
| Middle School | 358 | 17.1% |
| High School | 576 | 27.5% |
| College / Undergraduate | 268 | 12.8% |
| Graduate / Professional | 114 | 5.4% |
| Total | 2,098 | 100.0% |
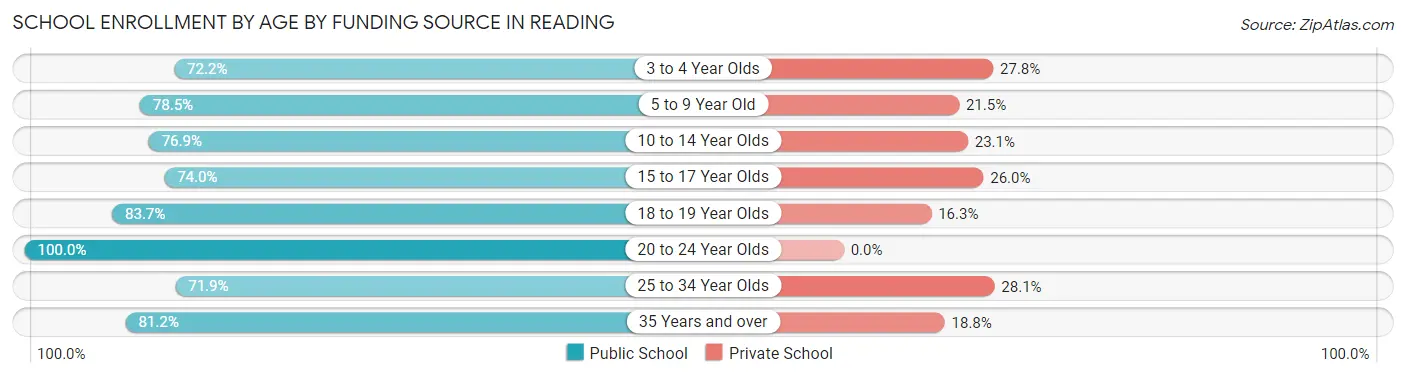
School Enrollment by Age by Funding Source in Reading
Out of a total of 2,098 students who are enrolled in schools in Reading, 459 (21.9%) attend a private institution, while the remaining 1,639 (78.1%) are enrolled in public schools. The age group of 25 to 34 year olds has the highest likelihood of being enrolled in private schools, with 41 (28.1% in the age bracket) enrolled. Conversely, the age group of 20 to 24 year olds has the lowest likelihood of being enrolled in a private school, with 103 (100.0% in the age bracket) attending a public institution.
| Age Bracket | Public School | Private School |
| 3 to 4 Year Olds | 70 (72.2%) | 27 (27.8%) |
| 5 to 9 Year Old | 519 (78.5%) | 142 (21.5%) |
| 10 to 14 Year Olds | 306 (76.9%) | 92 (23.1%) |
| 15 to 17 Year Olds | 310 (74.0%) | 109 (26.0%) |
| 18 to 19 Year Olds | 118 (83.7%) | 23 (16.3%) |
| 20 to 24 Year Olds | 103 (100.0%) | 0 (0.0%) |
| 25 to 34 Year Olds | 105 (71.9%) | 41 (28.1%) |
| 35 Years and over | 108 (81.2%) | 25 (18.8%) |
| Total | 1,639 (78.1%) | 459 (21.9%) |
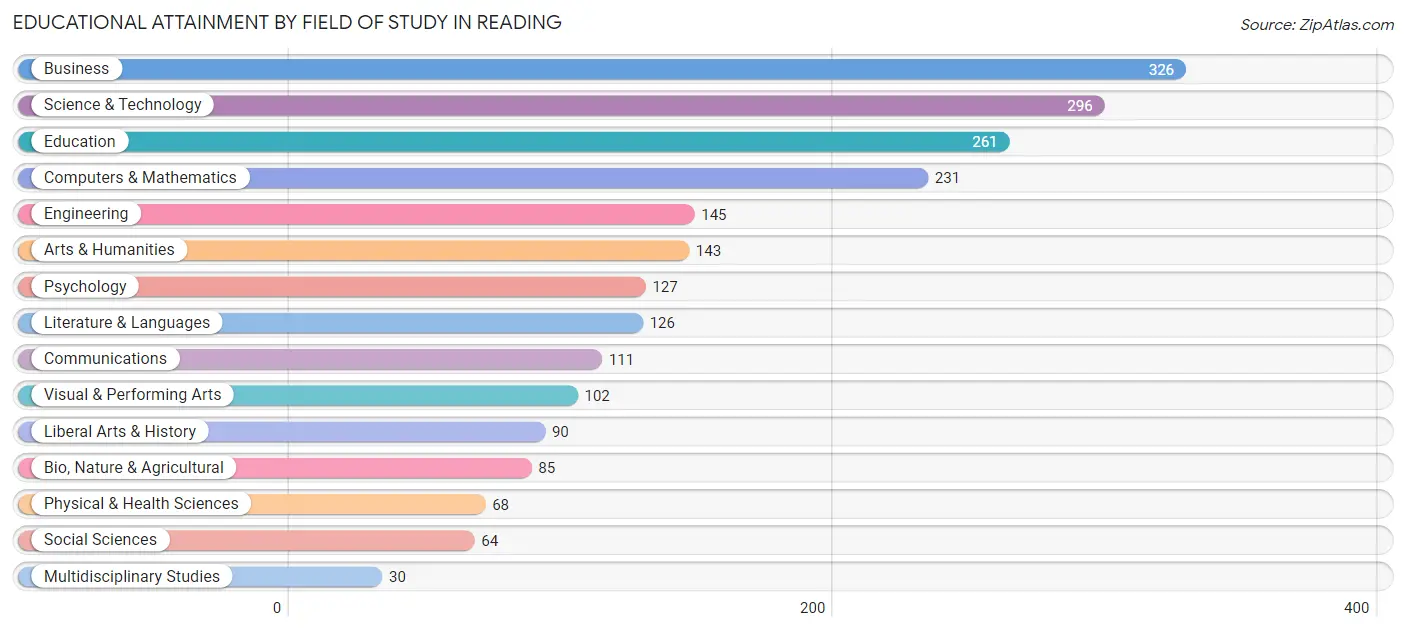
Educational Attainment by Field of Study in Reading
Business (326 | 14.8%), science & technology (296 | 13.4%), education (261 | 11.8%), computers & mathematics (231 | 10.5%), and engineering (145 | 6.6%) are the most common fields of study among 2,205 individuals in Reading who have obtained a bachelor's degree or higher.
| Field of Study | # Graduates | % Graduates |
| Computers & Mathematics | 231 | 10.5% |
| Bio, Nature & Agricultural | 85 | 3.8% |
| Physical & Health Sciences | 68 | 3.1% |
| Psychology | 127 | 5.8% |
| Social Sciences | 64 | 2.9% |
| Engineering | 145 | 6.6% |
| Multidisciplinary Studies | 30 | 1.4% |
| Science & Technology | 296 | 13.4% |
| Business | 326 | 14.8% |
| Education | 261 | 11.8% |
| Literature & Languages | 126 | 5.7% |
| Liberal Arts & History | 90 | 4.1% |
| Visual & Performing Arts | 102 | 4.6% |
| Communications | 111 | 5.0% |
| Arts & Humanities | 143 | 6.5% |
| Total | 2,205 | 100.0% |
Transportation & Commute in Reading
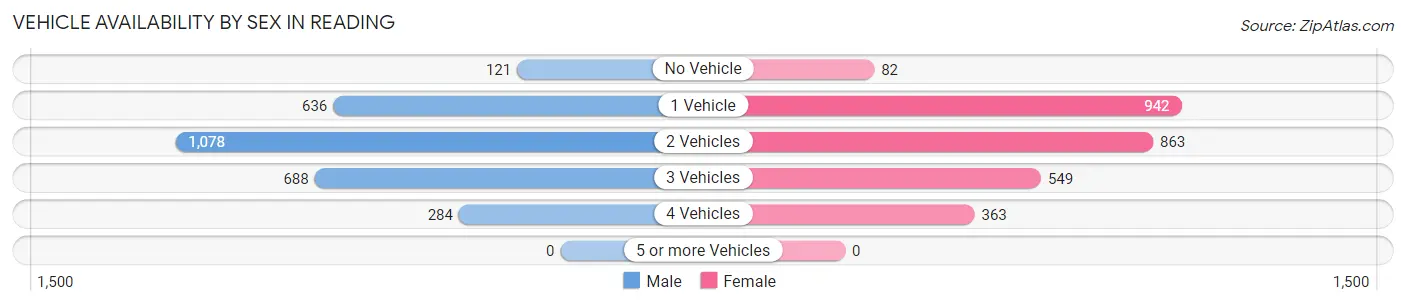
Vehicle Availability by Sex in Reading
The most prevalent vehicle ownership categories in Reading are males with 2 vehicles (1,078, accounting for 38.4%) and females with 2 vehicles (863, making up 38.5%).
| Vehicles Available | Male | Female |
| No Vehicle | 121 (4.3%) | 82 (2.9%) |
| 1 Vehicle | 636 (22.7%) | 942 (33.7%) |
| 2 Vehicles | 1,078 (38.4%) | 863 (30.8%) |
| 3 Vehicles | 688 (24.5%) | 549 (19.6%) |
| 4 Vehicles | 284 (10.1%) | 363 (13.0%) |
| 5 or more Vehicles | 0 (0.0%) | 0 (0.0%) |
| Total | 2,807 (100.0%) | 2,799 (100.0%) |
Commute Time in Reading
The most frequently occuring commute durations in Reading are 15 to 19 minutes (1,096 commuters, 22.2%), 10 to 14 minutes (899 commuters, 18.2%), and 20 to 24 minutes (883 commuters, 17.9%).
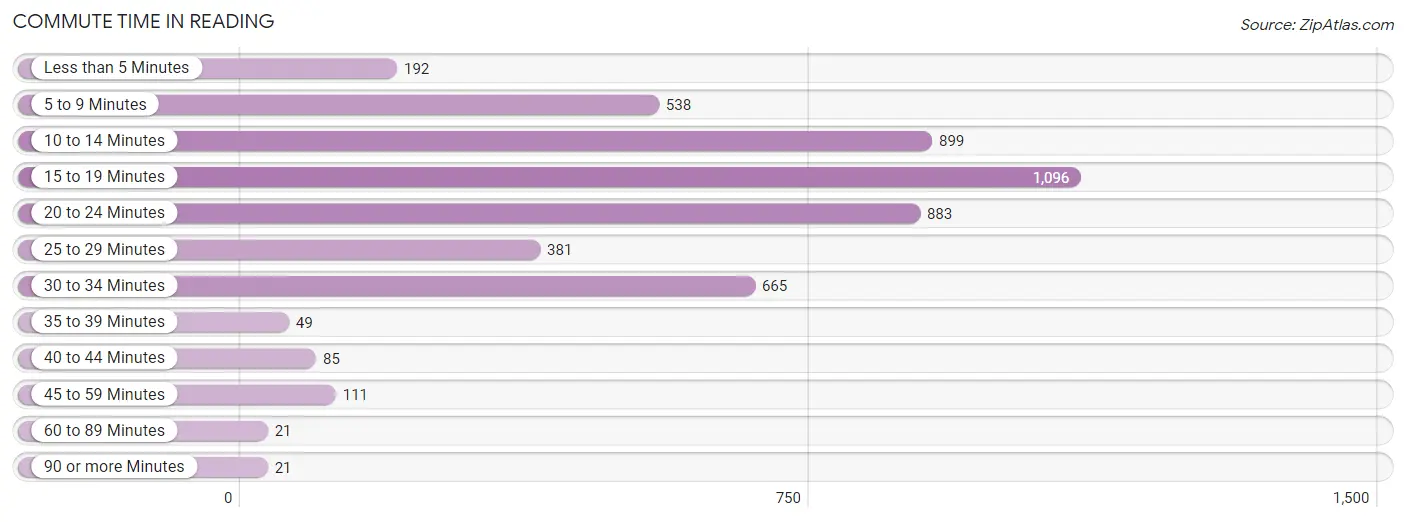
| Commute Time | # Commuters | % Commuters |
| Less than 5 Minutes | 192 | 3.9% |
| 5 to 9 Minutes | 538 | 10.9% |
| 10 to 14 Minutes | 899 | 18.2% |
| 15 to 19 Minutes | 1,096 | 22.2% |
| 20 to 24 Minutes | 883 | 17.9% |
| 25 to 29 Minutes | 381 | 7.7% |
| 30 to 34 Minutes | 665 | 13.5% |
| 35 to 39 Minutes | 49 | 1.0% |
| 40 to 44 Minutes | 85 | 1.7% |
| 45 to 59 Minutes | 111 | 2.2% |
| 60 to 89 Minutes | 21 | 0.4% |
| 90 or more Minutes | 21 | 0.4% |
Commute Time by Sex in Reading
The most common commute times in Reading are 10 to 14 minutes (567 commuters, 22.8%) for males and 15 to 19 minutes (644 commuters, 26.2%) for females.
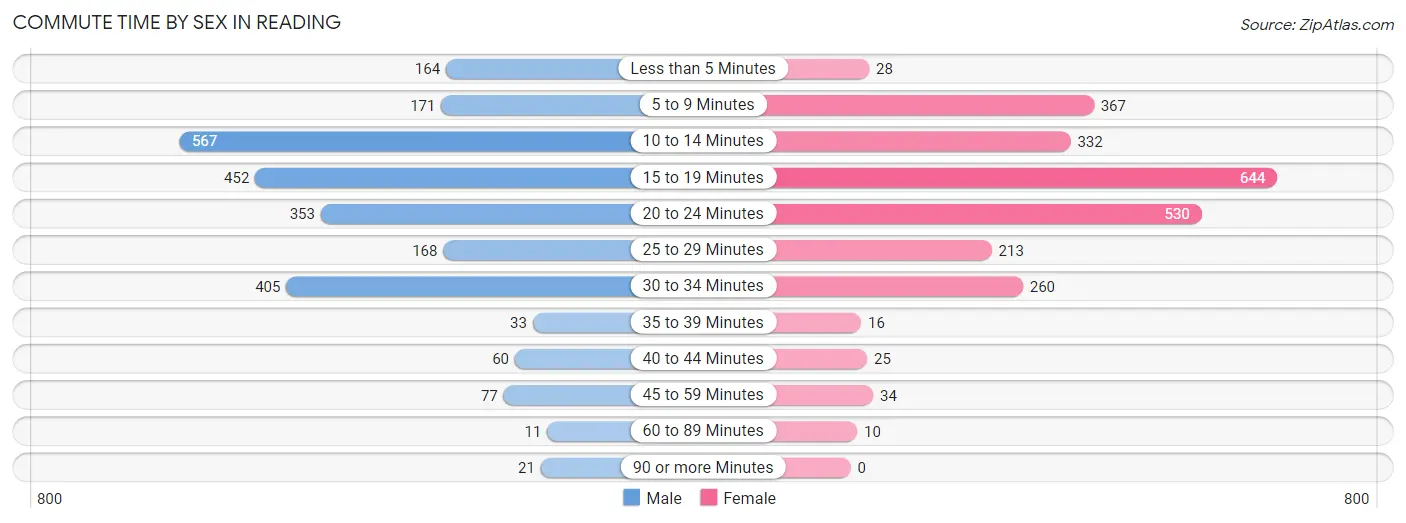
| Commute Time | Male | Female |
| Less than 5 Minutes | 164 (6.6%) | 28 (1.1%) |
| 5 to 9 Minutes | 171 (6.9%) | 367 (14.9%) |
| 10 to 14 Minutes | 567 (22.8%) | 332 (13.5%) |
| 15 to 19 Minutes | 452 (18.2%) | 644 (26.2%) |
| 20 to 24 Minutes | 353 (14.2%) | 530 (21.5%) |
| 25 to 29 Minutes | 168 (6.8%) | 213 (8.7%) |
| 30 to 34 Minutes | 405 (16.3%) | 260 (10.6%) |
| 35 to 39 Minutes | 33 (1.3%) | 16 (0.6%) |
| 40 to 44 Minutes | 60 (2.4%) | 25 (1.0%) |
| 45 to 59 Minutes | 77 (3.1%) | 34 (1.4%) |
| 60 to 89 Minutes | 11 (0.4%) | 10 (0.4%) |
| 90 or more Minutes | 21 (0.9%) | 0 (0.0%) |
Time of Departure to Work by Sex in Reading
The most frequent times of departure to work in Reading are 7:00 AM to 7:29 AM (497, 20.0%) for males and 7:30 AM to 7:59 AM (483, 19.6%) for females.
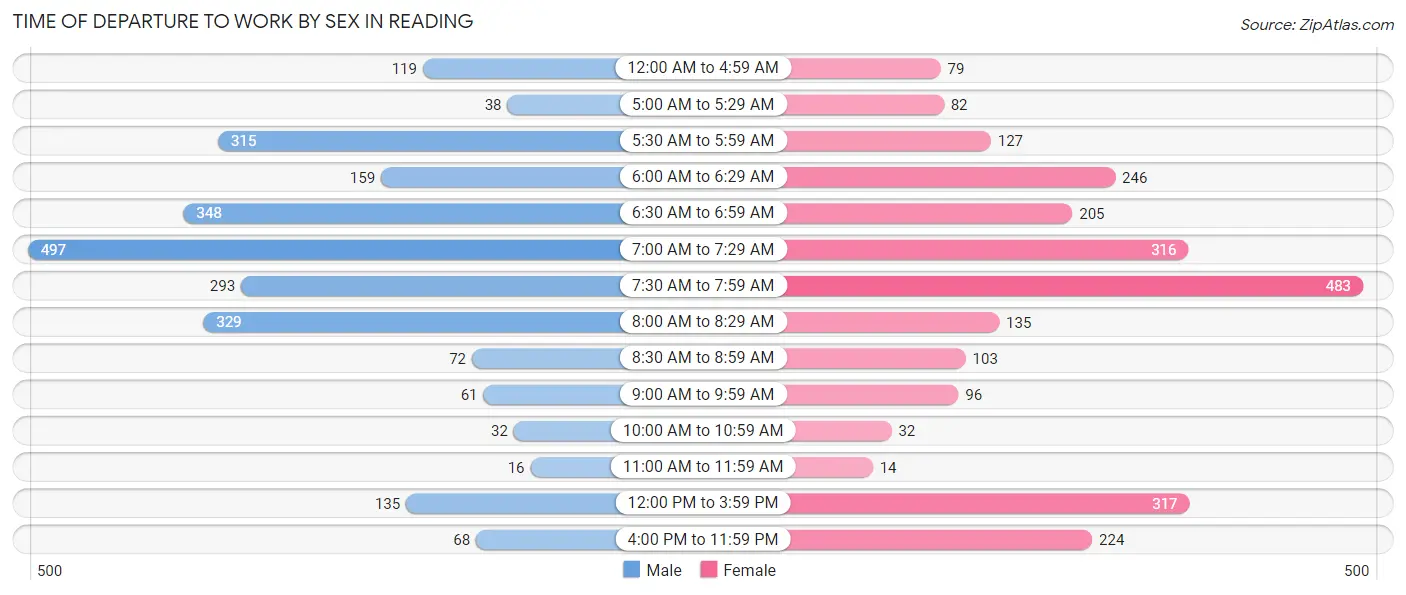
| Time of Departure | Male | Female |
| 12:00 AM to 4:59 AM | 119 (4.8%) | 79 (3.2%) |
| 5:00 AM to 5:29 AM | 38 (1.5%) | 82 (3.3%) |
| 5:30 AM to 5:59 AM | 315 (12.7%) | 127 (5.2%) |
| 6:00 AM to 6:29 AM | 159 (6.4%) | 246 (10.0%) |
| 6:30 AM to 6:59 AM | 348 (14.0%) | 205 (8.3%) |
| 7:00 AM to 7:29 AM | 497 (20.0%) | 316 (12.9%) |
| 7:30 AM to 7:59 AM | 293 (11.8%) | 483 (19.6%) |
| 8:00 AM to 8:29 AM | 329 (13.3%) | 135 (5.5%) |
| 8:30 AM to 8:59 AM | 72 (2.9%) | 103 (4.2%) |
| 9:00 AM to 9:59 AM | 61 (2.5%) | 96 (3.9%) |
| 10:00 AM to 10:59 AM | 32 (1.3%) | 32 (1.3%) |
| 11:00 AM to 11:59 AM | 16 (0.6%) | 14 (0.6%) |
| 12:00 PM to 3:59 PM | 135 (5.4%) | 317 (12.9%) |
| 4:00 PM to 11:59 PM | 68 (2.7%) | 224 (9.1%) |
| Total | 2,482 (100.0%) | 2,459 (100.0%) |
Housing Occupancy in Reading
Occupancy by Ownership in Reading
Of the total 4,920 dwellings in Reading, owner-occupied units account for 2,865 (58.2%), while renter-occupied units make up 2,055 (41.8%).
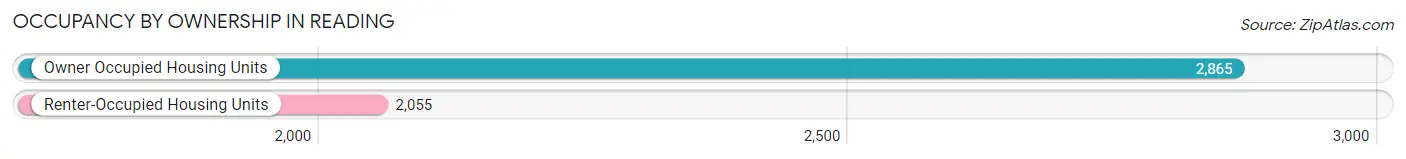
| Occupancy | # Housing Units | % Housing Units |
| Owner Occupied Housing Units | 2,865 | 58.2% |
| Renter-Occupied Housing Units | 2,055 | 41.8% |
| Total Occupied Housing Units | 4,920 | 100.0% |
Occupancy by Household Size in Reading
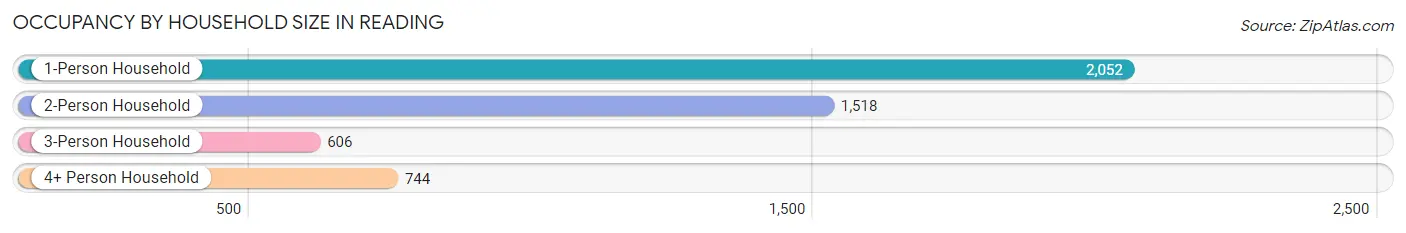
| Household Size | # Housing Units | % Housing Units |
| 1-Person Household | 2,052 | 41.7% |
| 2-Person Household | 1,518 | 30.8% |
| 3-Person Household | 606 | 12.3% |
| 4+ Person Household | 744 | 15.1% |
| Total Housing Units | 4,920 | 100.0% |
Occupancy by Ownership by Household Size in Reading
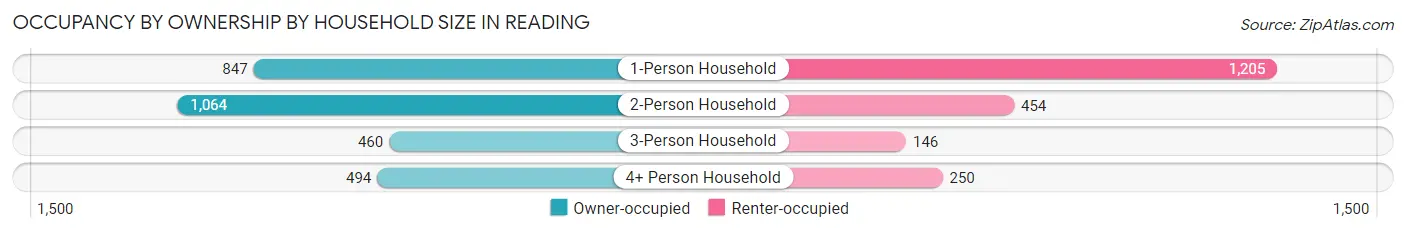
| Household Size | Owner-occupied | Renter-occupied |
| 1-Person Household | 847 (41.3%) | 1,205 (58.7%) |
| 2-Person Household | 1,064 (70.1%) | 454 (29.9%) |
| 3-Person Household | 460 (75.9%) | 146 (24.1%) |
| 4+ Person Household | 494 (66.4%) | 250 (33.6%) |
| Total Housing Units | 2,865 (58.2%) | 2,055 (41.8%) |
Occupancy by Educational Attainment in Reading
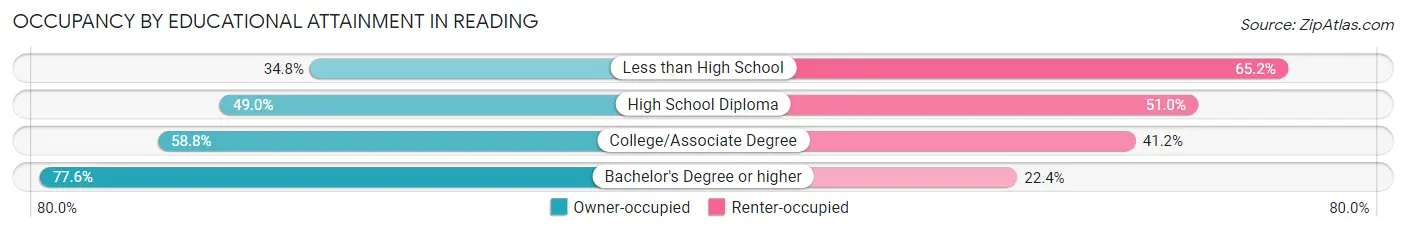
| Household Size | Owner-occupied | Renter-occupied |
| Less than High School | 137 (34.8%) | 257 (65.2%) |
| High School Diploma | 925 (49.0%) | 963 (51.0%) |
| College/Associate Degree | 764 (58.8%) | 535 (41.2%) |
| Bachelor's Degree or higher | 1,039 (77.6%) | 300 (22.4%) |
Occupancy by Age of Householder in Reading
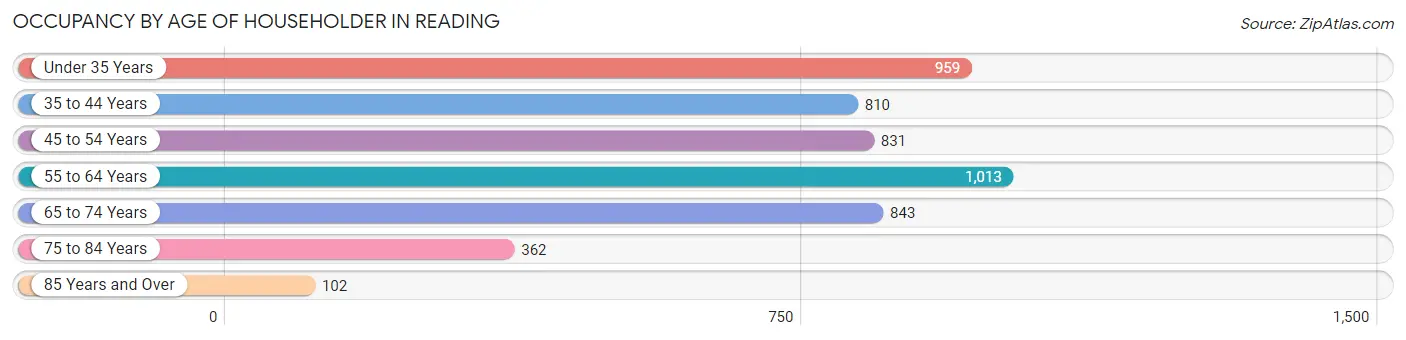
| Age Bracket | # Households | % Households |
| Under 35 Years | 959 | 19.5% |
| 35 to 44 Years | 810 | 16.5% |
| 45 to 54 Years | 831 | 16.9% |
| 55 to 64 Years | 1,013 | 20.6% |
| 65 to 74 Years | 843 | 17.1% |
| 75 to 84 Years | 362 | 7.4% |
| 85 Years and Over | 102 | 2.1% |
| Total | 4,920 | 100.0% |
Housing Finances in Reading
Median Income by Occupancy in Reading
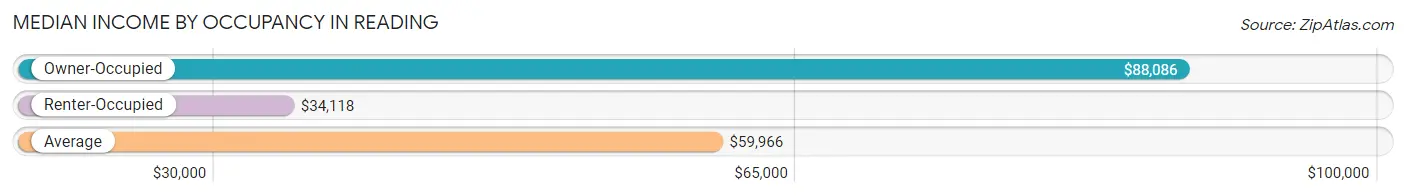
| Occupancy Type | # Households | Median Income |
| Owner-Occupied | 2,865 (58.2%) | $88,086 |
| Renter-Occupied | 2,055 (41.8%) | $34,118 |
| Average | 4,920 (100.0%) | $59,966 |
Occupancy by Householder Income Bracket in Reading
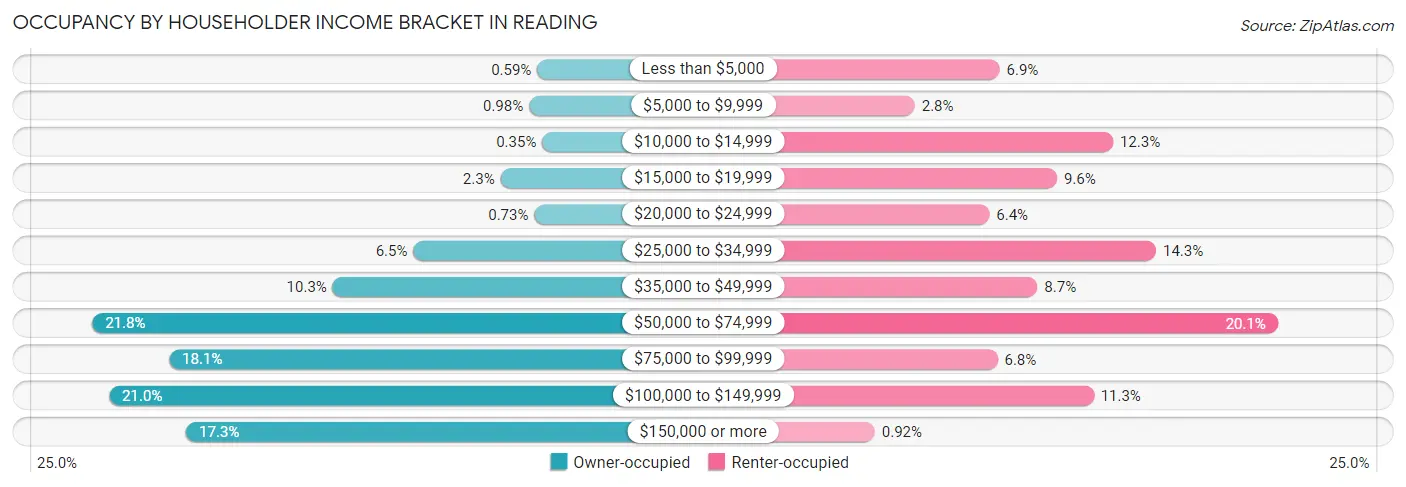
| Income Bracket | Owner-occupied | Renter-occupied |
| Less than $5,000 | 17 (0.6%) | 141 (6.9%) |
| $5,000 to $9,999 | 28 (1.0%) | 58 (2.8%) |
| $10,000 to $14,999 | 10 (0.4%) | 252 (12.3%) |
| $15,000 to $19,999 | 67 (2.3%) | 197 (9.6%) |
| $20,000 to $24,999 | 21 (0.7%) | 131 (6.4%) |
| $25,000 to $34,999 | 186 (6.5%) | 294 (14.3%) |
| $35,000 to $49,999 | 296 (10.3%) | 178 (8.7%) |
| $50,000 to $74,999 | 624 (21.8%) | 413 (20.1%) |
| $75,000 to $99,999 | 519 (18.1%) | 139 (6.8%) |
| $100,000 to $149,999 | 601 (21.0%) | 233 (11.3%) |
| $150,000 or more | 496 (17.3%) | 19 (0.9%) |
| Total | 2,865 (100.0%) | 2,055 (100.0%) |
Monthly Housing Cost Tiers in Reading
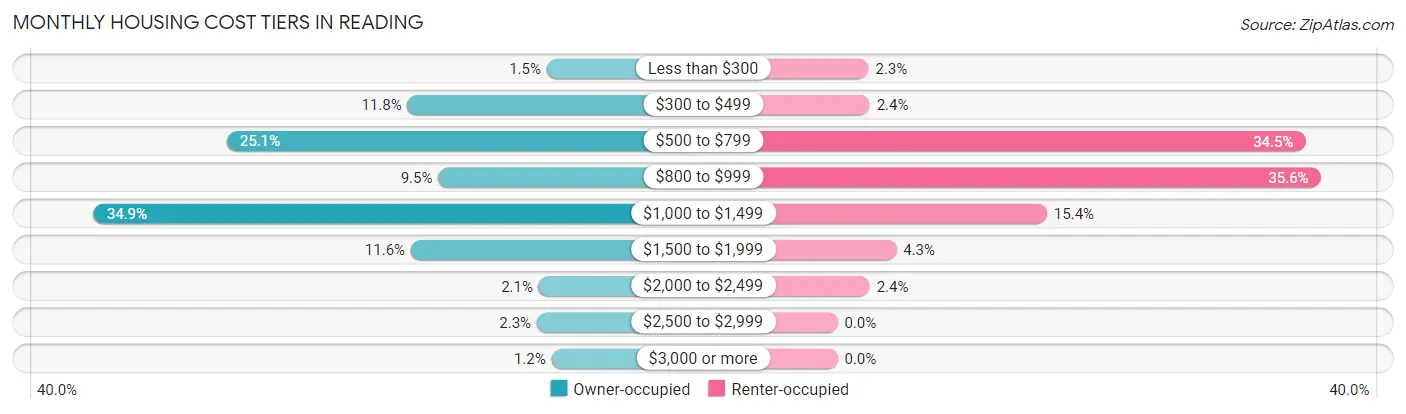
| Monthly Cost | Owner-occupied | Renter-occupied |
| Less than $300 | 44 (1.5%) | 47 (2.3%) |
| $300 to $499 | 338 (11.8%) | 49 (2.4%) |
| $500 to $799 | 719 (25.1%) | 708 (34.4%) |
| $800 to $999 | 273 (9.5%) | 731 (35.6%) |
| $1,000 to $1,499 | 1,000 (34.9%) | 317 (15.4%) |
| $1,500 to $1,999 | 331 (11.6%) | 89 (4.3%) |
| $2,000 to $2,499 | 61 (2.1%) | 49 (2.4%) |
| $2,500 to $2,999 | 65 (2.3%) | 0 (0.0%) |
| $3,000 or more | 34 (1.2%) | 0 (0.0%) |
| Total | 2,865 (100.0%) | 2,055 (100.0%) |
Physical Housing Characteristics in Reading
Housing Structures in Reading
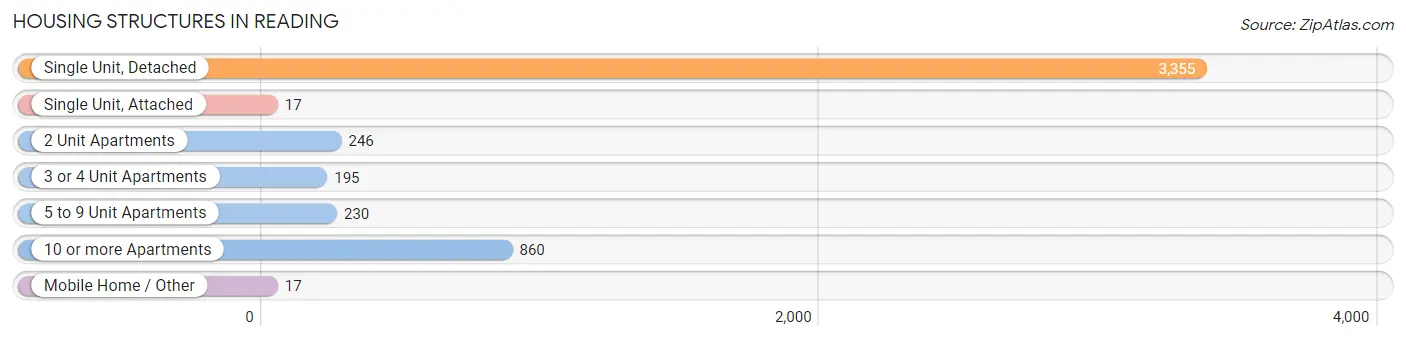
| Structure Type | # Housing Units | % Housing Units |
| Single Unit, Detached | 3,355 | 68.2% |
| Single Unit, Attached | 17 | 0.4% |
| 2 Unit Apartments | 246 | 5.0% |
| 3 or 4 Unit Apartments | 195 | 4.0% |
| 5 to 9 Unit Apartments | 230 | 4.7% |
| 10 or more Apartments | 860 | 17.5% |
| Mobile Home / Other | 17 | 0.4% |
| Total | 4,920 | 100.0% |
Housing Structures by Occupancy in Reading
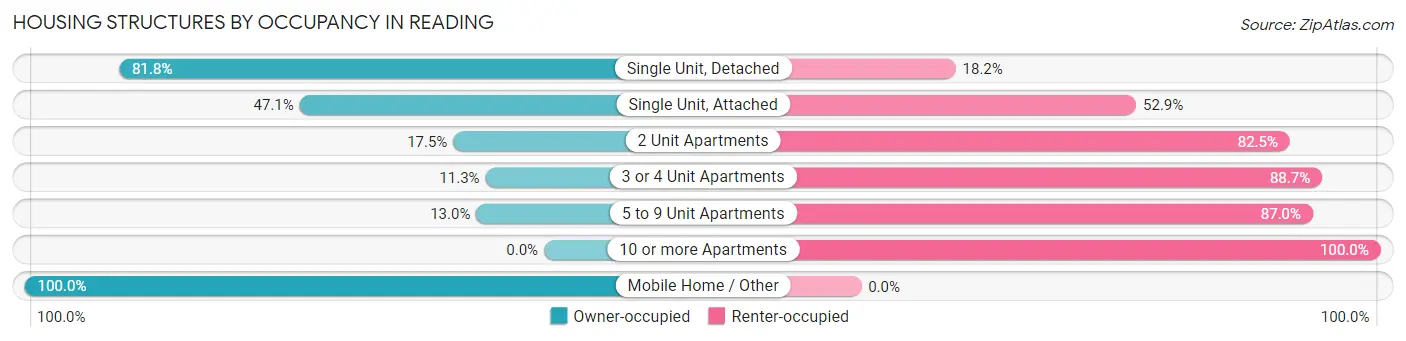
| Structure Type | Owner-occupied | Renter-occupied |
| Single Unit, Detached | 2,745 (81.8%) | 610 (18.2%) |
| Single Unit, Attached | 8 (47.1%) | 9 (52.9%) |
| 2 Unit Apartments | 43 (17.5%) | 203 (82.5%) |
| 3 or 4 Unit Apartments | 22 (11.3%) | 173 (88.7%) |
| 5 to 9 Unit Apartments | 30 (13.0%) | 200 (87.0%) |
| 10 or more Apartments | 0 (0.0%) | 860 (100.0%) |
| Mobile Home / Other | 17 (100.0%) | 0 (0.0%) |
| Total | 2,865 (58.2%) | 2,055 (41.8%) |
Housing Structures by Number of Rooms in Reading
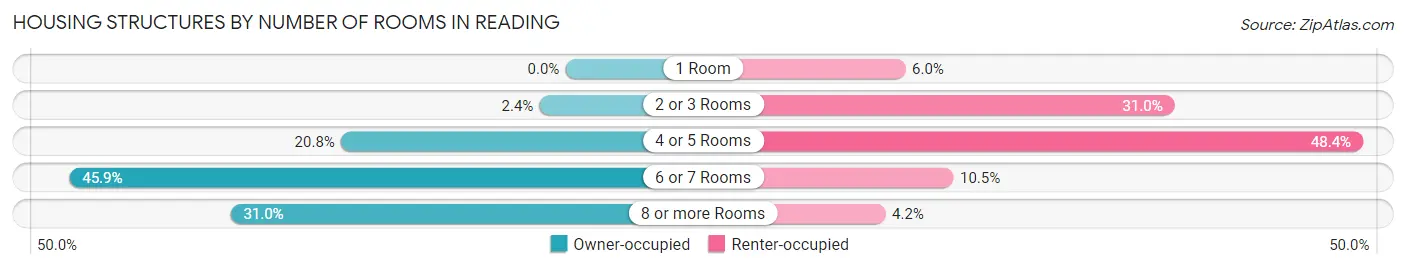
| Number of Rooms | Owner-occupied | Renter-occupied |
| 1 Room | 0 (0.0%) | 124 (6.0%) |
| 2 or 3 Rooms | 69 (2.4%) | 636 (30.9%) |
| 4 or 5 Rooms | 595 (20.8%) | 994 (48.4%) |
| 6 or 7 Rooms | 1,314 (45.9%) | 215 (10.5%) |
| 8 or more Rooms | 887 (31.0%) | 86 (4.2%) |
| Total | 2,865 (100.0%) | 2,055 (100.0%) |
Housing Structure by Heating Type in Reading
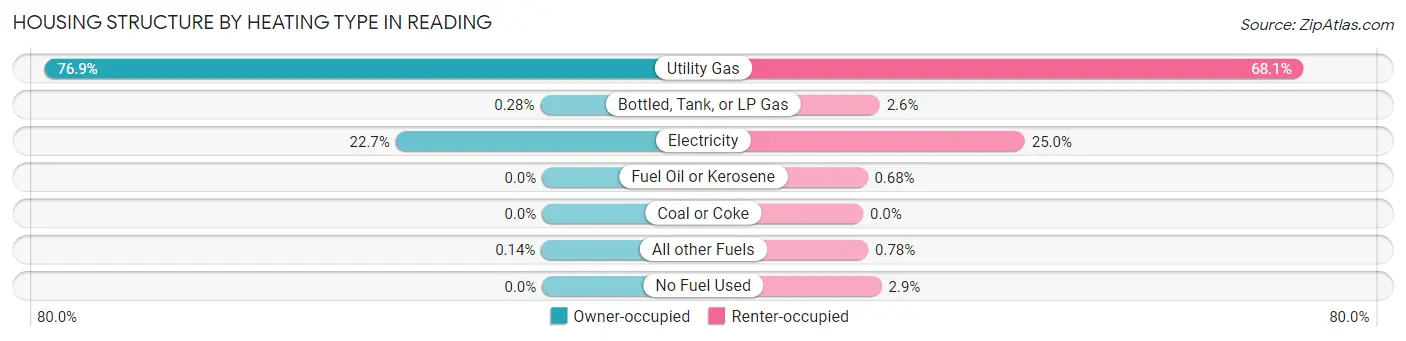
| Heating Type | Owner-occupied | Renter-occupied |
| Utility Gas | 2,204 (76.9%) | 1,399 (68.1%) |
| Bottled, Tank, or LP Gas | 8 (0.3%) | 53 (2.6%) |
| Electricity | 649 (22.7%) | 514 (25.0%) |
| Fuel Oil or Kerosene | 0 (0.0%) | 14 (0.7%) |
| Coal or Coke | 0 (0.0%) | 0 (0.0%) |
| All other Fuels | 4 (0.1%) | 16 (0.8%) |
| No Fuel Used | 0 (0.0%) | 59 (2.9%) |
| Total | 2,865 (100.0%) | 2,055 (100.0%) |
Household Vehicle Usage in Reading
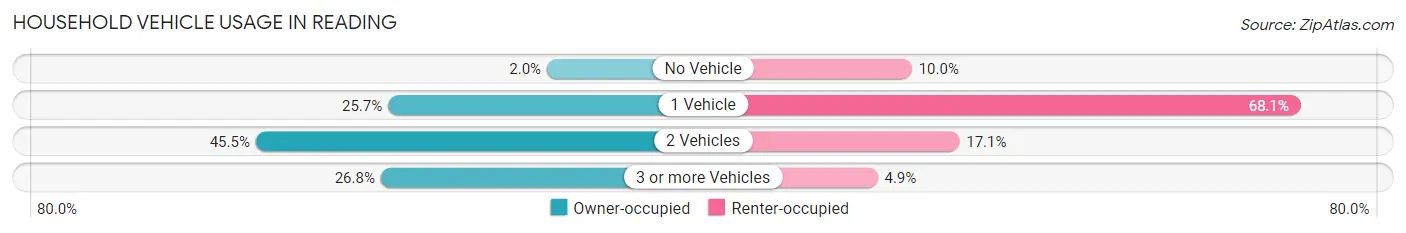
| Vehicles per Household | Owner-occupied | Renter-occupied |
| No Vehicle | 57 (2.0%) | 205 (10.0%) |
| 1 Vehicle | 737 (25.7%) | 1,399 (68.1%) |
| 2 Vehicles | 1,303 (45.5%) | 351 (17.1%) |
| 3 or more Vehicles | 768 (26.8%) | 100 (4.9%) |
| Total | 2,865 (100.0%) | 2,055 (100.0%) |
Real Estate & Mortgages in Reading
Real Estate and Mortgage Overview in Reading
| Characteristic | Without Mortgage | With Mortgage |
| Housing Units | 1,149 | 1,716 |
| Median Property Value | $154,400 | $181,100 |
| Median Household Income | $58,150 | $407 |
| Monthly Housing Costs | $552 | $34 |
| Real Estate Taxes | $2,172 | $18 |
Property Value by Mortgage Status in Reading
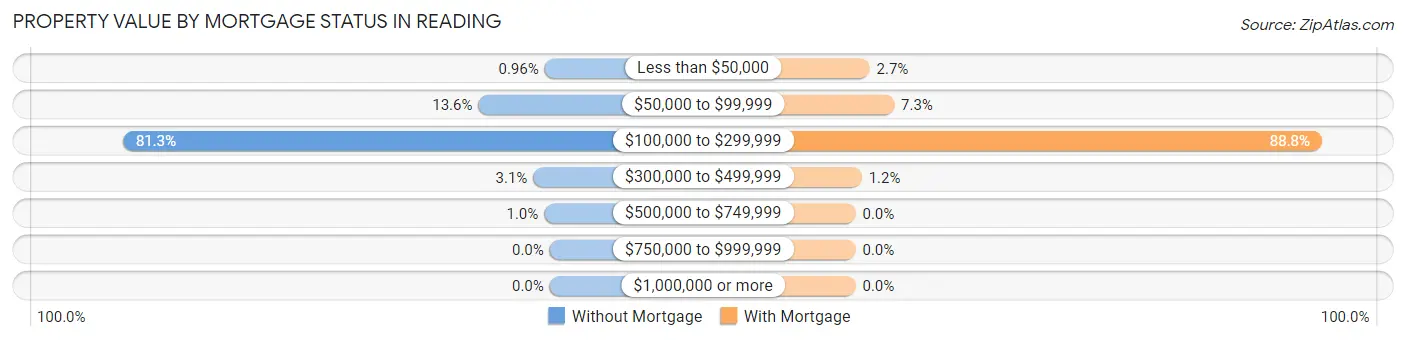
| Property Value | Without Mortgage | With Mortgage |
| Less than $50,000 | 11 (1.0%) | 46 (2.7%) |
| $50,000 to $99,999 | 156 (13.6%) | 126 (7.3%) |
| $100,000 to $299,999 | 934 (81.3%) | 1,524 (88.8%) |
| $300,000 to $499,999 | 36 (3.1%) | 20 (1.2%) |
| $500,000 to $749,999 | 12 (1.0%) | 0 (0.0%) |
| $750,000 to $999,999 | 0 (0.0%) | 0 (0.0%) |
| $1,000,000 or more | 0 (0.0%) | 0 (0.0%) |
| Total | 1,149 (100.0%) | 1,716 (100.0%) |
Household Income by Mortgage Status in Reading
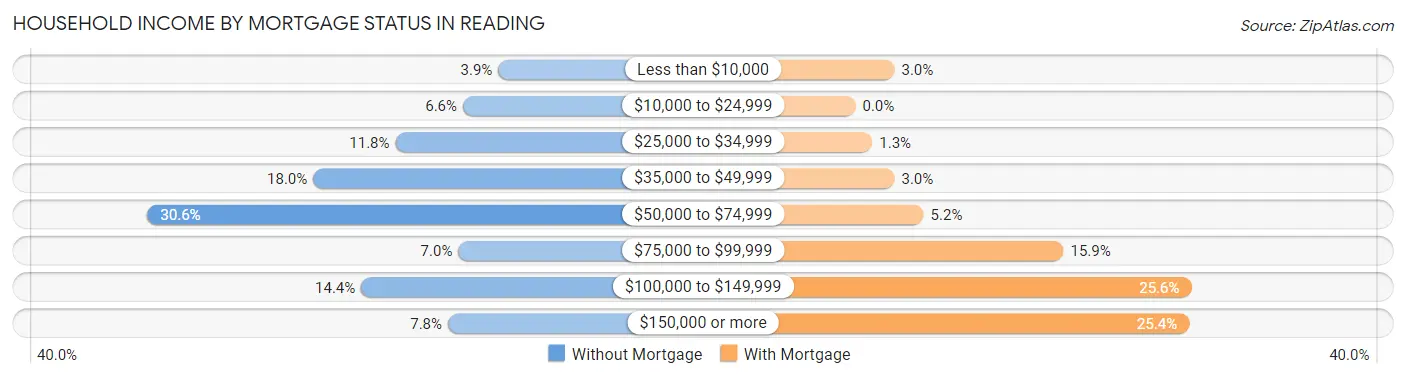
| Household Income | Without Mortgage | With Mortgage |
| Less than $10,000 | 45 (3.9%) | 51 (3.0%) |
| $10,000 to $24,999 | 76 (6.6%) | 0 (0.0%) |
| $25,000 to $34,999 | 135 (11.7%) | 22 (1.3%) |
| $35,000 to $49,999 | 207 (18.0%) | 51 (3.0%) |
| $50,000 to $74,999 | 352 (30.6%) | 89 (5.2%) |
| $75,000 to $99,999 | 80 (7.0%) | 272 (15.9%) |
| $100,000 to $149,999 | 165 (14.4%) | 439 (25.6%) |
| $150,000 or more | 89 (7.7%) | 436 (25.4%) |
| Total | 1,149 (100.0%) | 1,716 (100.0%) |
Property Value to Household Income Ratio in Reading
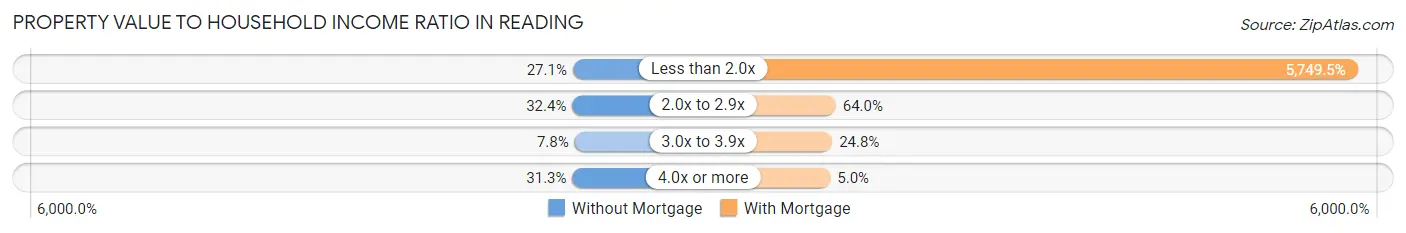
| Value-to-Income Ratio | Without Mortgage | With Mortgage |
| Less than 2.0x | 311 (27.1%) | 98,661 (5,749.5%) |
| 2.0x to 2.9x | 372 (32.4%) | 1,098 (64.0%) |
| 3.0x to 3.9x | 89 (7.7%) | 426 (24.8%) |
| 4.0x or more | 360 (31.3%) | 85 (5.0%) |
| Total | 1,149 (100.0%) | 1,716 (100.0%) |
Real Estate Taxes by Mortgage Status in Reading
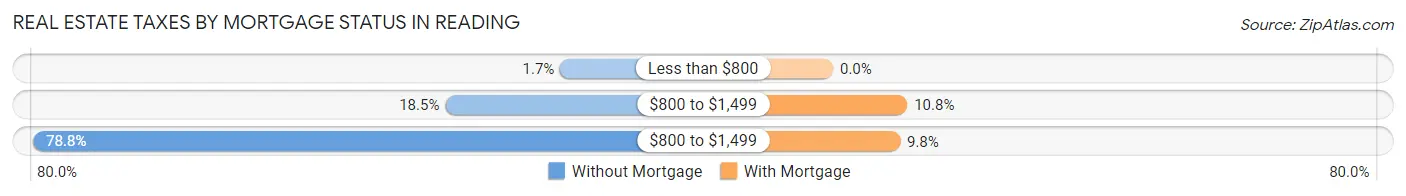
| Property Taxes | Without Mortgage | With Mortgage |
| Less than $800 | 20 (1.7%) | 0 (0.0%) |
| $800 to $1,499 | 213 (18.5%) | 186 (10.8%) |
| $800 to $1,499 | 905 (78.8%) | 168 (9.8%) |
| Total | 1,149 (100.0%) | 1,716 (100.0%) |
Health & Disability in Reading
Health Insurance Coverage by Age in Reading
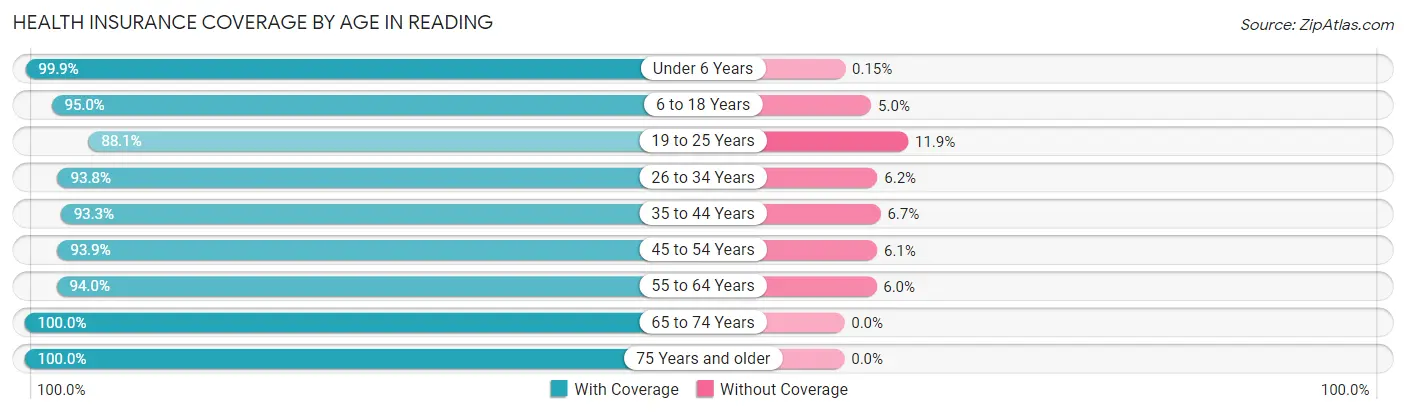
| Age Bracket | With Coverage | Without Coverage |
| Under 6 Years | 652 (99.9%) | 1 (0.2%) |
| 6 to 18 Years | 1,480 (95.0%) | 78 (5.0%) |
| 19 to 25 Years | 667 (88.1%) | 90 (11.9%) |
| 26 to 34 Years | 1,294 (93.8%) | 85 (6.2%) |
| 35 to 44 Years | 1,149 (93.3%) | 83 (6.7%) |
| 45 to 54 Years | 1,168 (93.9%) | 76 (6.1%) |
| 55 to 64 Years | 1,799 (94.0%) | 114 (6.0%) |
| 65 to 74 Years | 1,120 (100.0%) | 0 (0.0%) |
| 75 Years and older | 615 (100.0%) | 0 (0.0%) |
| Total | 9,944 (95.0%) | 527 (5.0%) |
Health Insurance Coverage by Citizenship Status in Reading
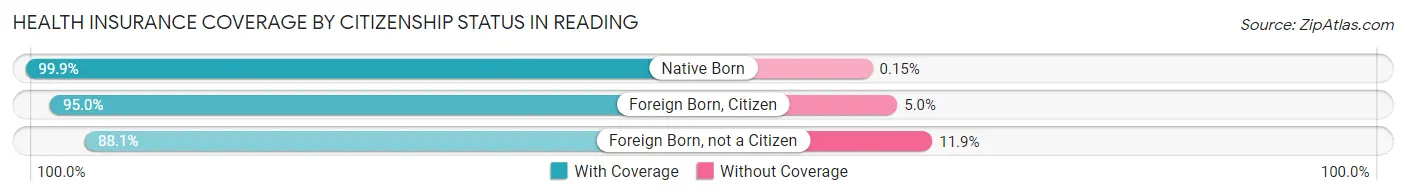
| Citizenship Status | With Coverage | Without Coverage |
| Native Born | 652 (99.9%) | 1 (0.2%) |
| Foreign Born, Citizen | 1,480 (95.0%) | 78 (5.0%) |
| Foreign Born, not a Citizen | 667 (88.1%) | 90 (11.9%) |
Health Insurance Coverage by Household Income in Reading
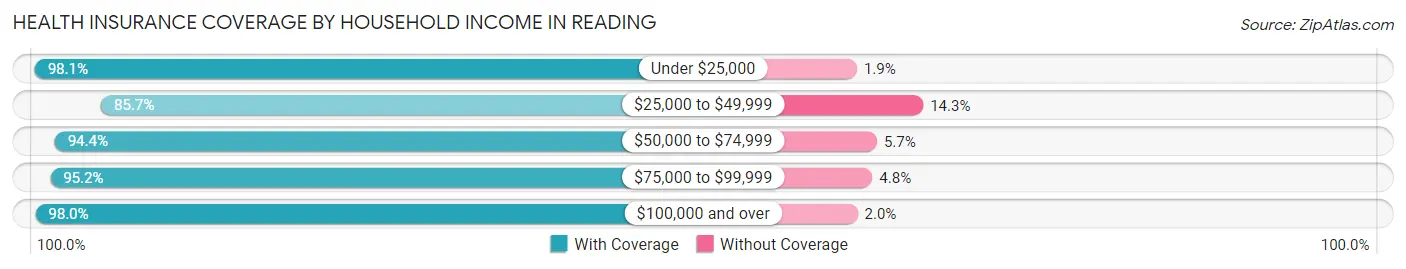
| Household Income | With Coverage | Without Coverage |
| Under $25,000 | 1,132 (98.1%) | 22 (1.9%) |
| $25,000 to $49,999 | 1,346 (85.7%) | 225 (14.3%) |
| $50,000 to $74,999 | 2,153 (94.4%) | 129 (5.7%) |
| $75,000 to $99,999 | 1,268 (95.2%) | 64 (4.8%) |
| $100,000 and over | 4,026 (98.0%) | 83 (2.0%) |
Public vs Private Health Insurance Coverage by Age in Reading
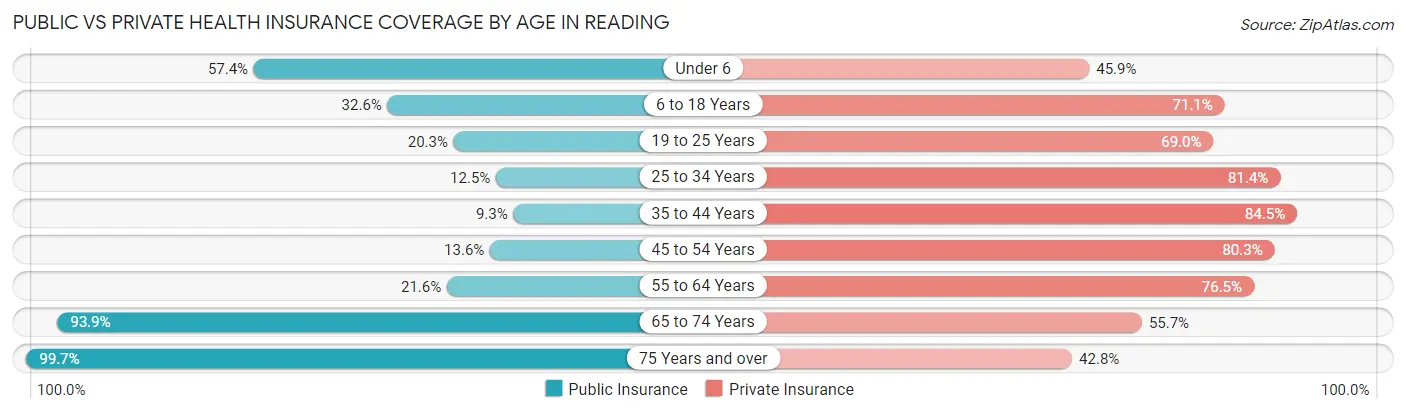
| Age Bracket | Public Insurance | Private Insurance |
| Under 6 | 375 (57.4%) | 300 (45.9%) |
| 6 to 18 Years | 508 (32.6%) | 1,107 (71.1%) |
| 19 to 25 Years | 154 (20.3%) | 522 (69.0%) |
| 25 to 34 Years | 172 (12.5%) | 1,122 (81.4%) |
| 35 to 44 Years | 114 (9.2%) | 1,041 (84.5%) |
| 45 to 54 Years | 169 (13.6%) | 999 (80.3%) |
| 55 to 64 Years | 413 (21.6%) | 1,463 (76.5%) |
| 65 to 74 Years | 1,052 (93.9%) | 624 (55.7%) |
| 75 Years and over | 613 (99.7%) | 263 (42.8%) |
| Total | 3,570 (34.1%) | 7,441 (71.1%) |
Disability Status by Sex by Age in Reading
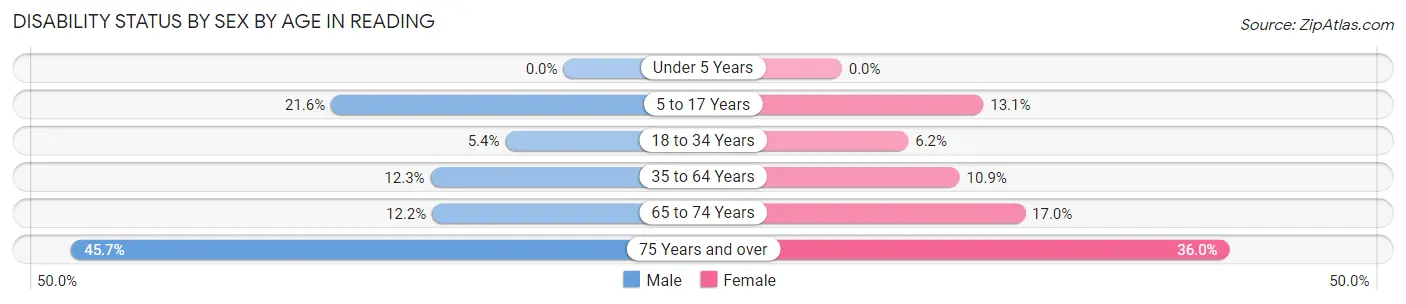
| Age Bracket | Male | Female |
| Under 5 Years | 0 (0.0%) | 0 (0.0%) |
| 5 to 17 Years | 138 (21.6%) | 110 (13.1%) |
| 18 to 34 Years | 66 (5.4%) | 66 (6.2%) |
| 35 to 64 Years | 255 (12.3%) | 254 (10.9%) |
| 65 to 74 Years | 77 (12.2%) | 83 (17.0%) |
| 75 Years and over | 79 (45.7%) | 159 (36.0%) |
Disability Class by Sex by Age in Reading
Disability Class: Hearing Difficulty
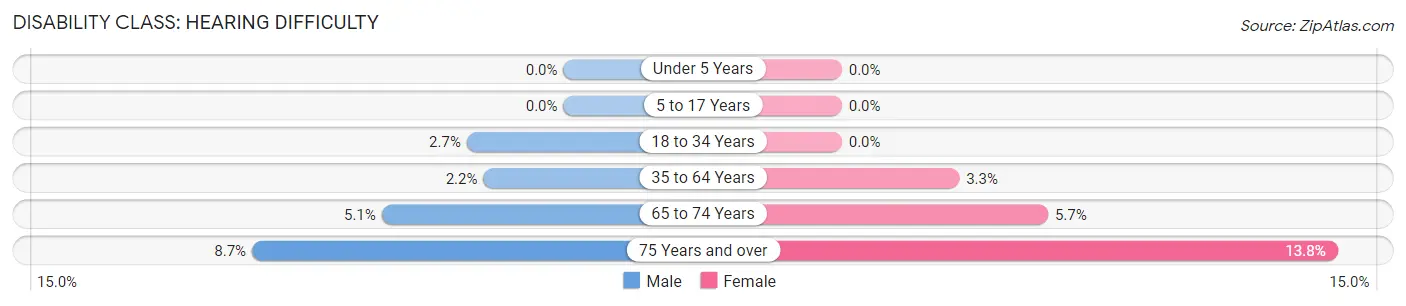
| Age Bracket | Male | Female |
| Under 5 Years | 0 (0.0%) | 0 (0.0%) |
| 5 to 17 Years | 0 (0.0%) | 0 (0.0%) |
| 18 to 34 Years | 33 (2.7%) | 0 (0.0%) |
| 35 to 64 Years | 46 (2.2%) | 76 (3.3%) |
| 65 to 74 Years | 32 (5.1%) | 28 (5.7%) |
| 75 Years and over | 15 (8.7%) | 61 (13.8%) |
Disability Class: Vision Difficulty
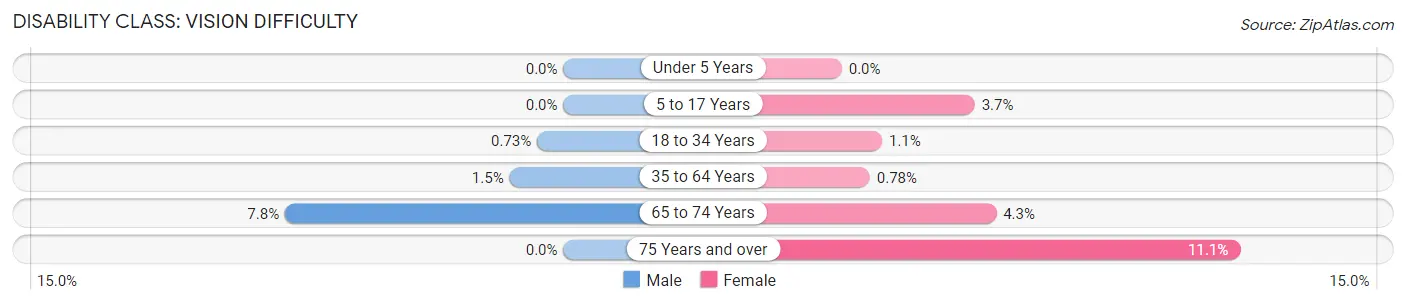
| Age Bracket | Male | Female |
| Under 5 Years | 0 (0.0%) | 0 (0.0%) |
| 5 to 17 Years | 0 (0.0%) | 31 (3.7%) |
| 18 to 34 Years | 9 (0.7%) | 12 (1.1%) |
| 35 to 64 Years | 31 (1.5%) | 18 (0.8%) |
| 65 to 74 Years | 49 (7.7%) | 21 (4.3%) |
| 75 Years and over | 0 (0.0%) | 49 (11.1%) |
Disability Class: Cognitive Difficulty
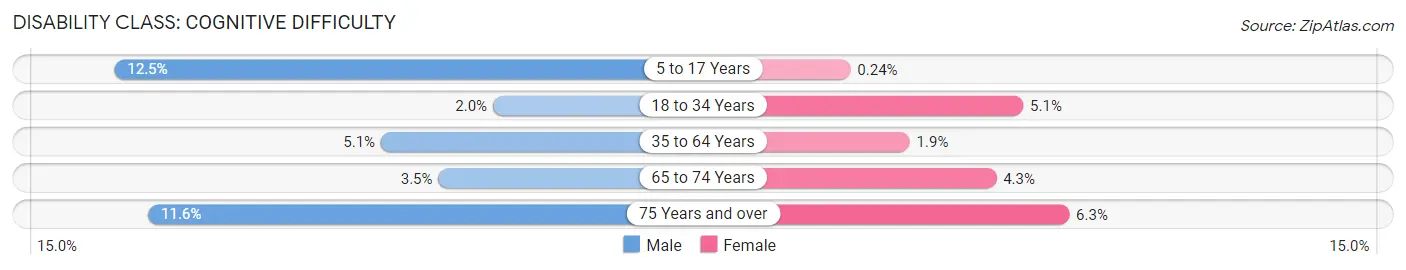
| Age Bracket | Male | Female |
| 5 to 17 Years | 80 (12.5%) | 2 (0.2%) |
| 18 to 34 Years | 24 (2.0%) | 54 (5.1%) |
| 35 to 64 Years | 105 (5.1%) | 44 (1.9%) |
| 65 to 74 Years | 22 (3.5%) | 21 (4.3%) |
| 75 Years and over | 20 (11.6%) | 28 (6.3%) |
Disability Class: Ambulatory Difficulty
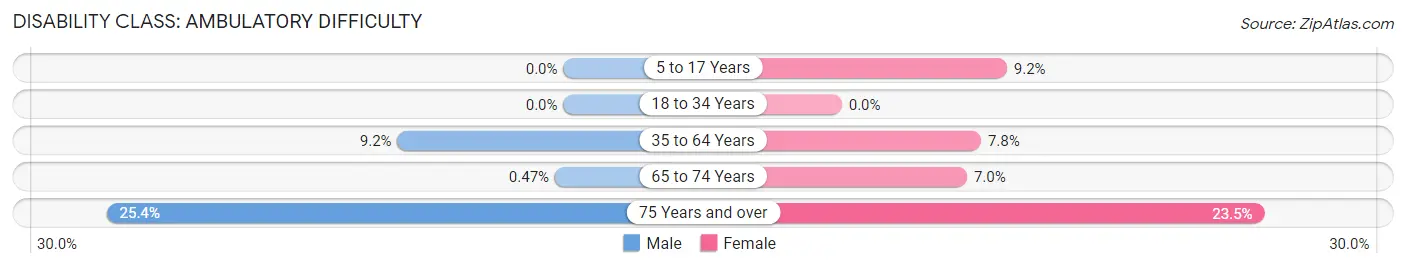
| Age Bracket | Male | Female |
| 5 to 17 Years | 0 (0.0%) | 77 (9.2%) |
| 18 to 34 Years | 0 (0.0%) | 0 (0.0%) |
| 35 to 64 Years | 191 (9.2%) | 180 (7.7%) |
| 65 to 74 Years | 3 (0.5%) | 34 (7.0%) |
| 75 Years and over | 44 (25.4%) | 104 (23.5%) |
Disability Class: Self-Care Difficulty
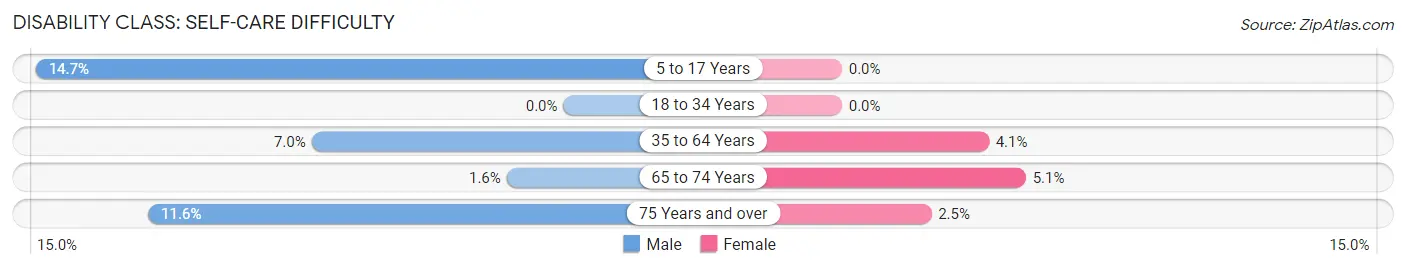
| Age Bracket | Male | Female |
| 5 to 17 Years | 94 (14.7%) | 0 (0.0%) |
| 18 to 34 Years | 0 (0.0%) | 0 (0.0%) |
| 35 to 64 Years | 145 (7.0%) | 95 (4.1%) |
| 65 to 74 Years | 10 (1.6%) | 25 (5.1%) |
| 75 Years and over | 20 (11.6%) | 11 (2.5%) |
Technology Access in Reading
Computing Device Access in Reading
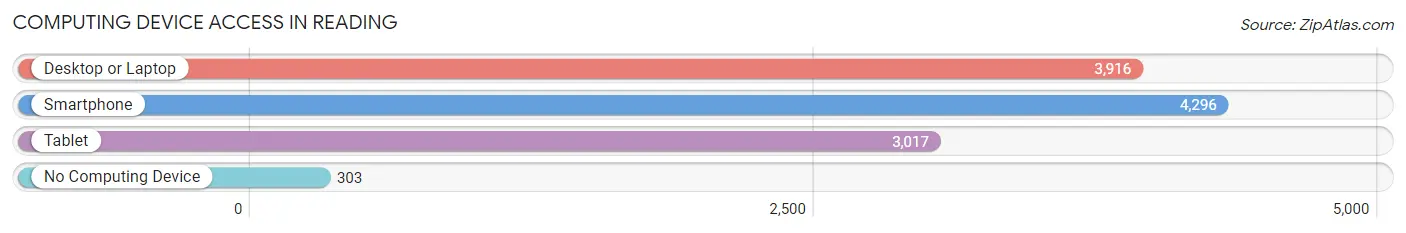
| Device Type | # Households | % Households |
| Desktop or Laptop | 3,916 | 79.6% |
| Smartphone | 4,296 | 87.3% |
| Tablet | 3,017 | 61.3% |
| No Computing Device | 303 | 6.2% |
| Total | 4,920 | 100.0% |
Internet Access in Reading
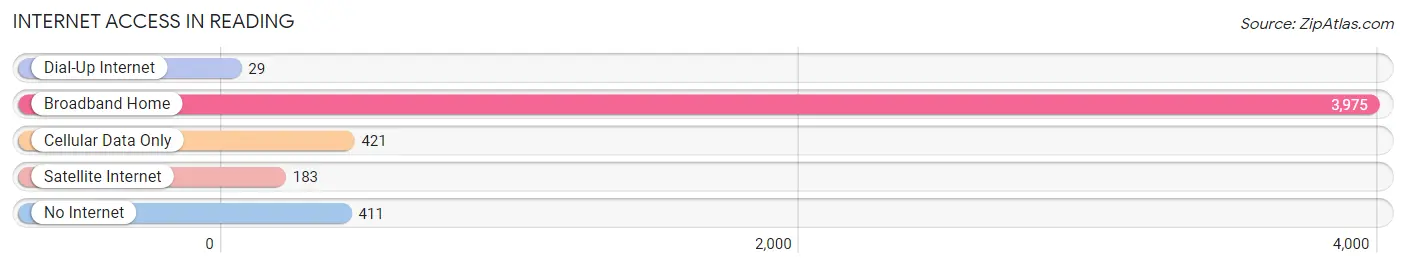
| Internet Type | # Households | % Households |
| Dial-Up Internet | 29 | 0.6% |
| Broadband Home | 3,975 | 80.8% |
| Cellular Data Only | 421 | 8.6% |
| Satellite Internet | 183 | 3.7% |
| No Internet | 411 | 8.4% |
| Total | 4,920 | 100.0% |
Reading Summary
Reading, Ohio is a city located in Hamilton County, Ohio, United States. It is situated along the Ohio River, approximately 25 miles northeast of Cincinnati. The city has a population of approximately 30,000 people and is part of the Greater Cincinnati metropolitan area.
History
The area that is now Reading was first settled in 1788 by a group of Quakers from Pennsylvania. The settlement was originally known as “Readingtown” and was named after the town of Reading in England. The town was incorporated in 1817 and was later renamed Reading.
In the 19th century, Reading was a major center for the production of woolen goods. The city was also home to several large manufacturing companies, including the Reading Stove Company, which produced stoves and other heating appliances.
Geography
Reading is located in the southwestern corner of Hamilton County, Ohio. It is situated along the Ohio River, approximately 25 miles northeast of Cincinnati. The city has a total area of 4.2 square miles, all of which is land.
The terrain of Reading is mostly flat, with some rolling hills in the northern and eastern parts of the city. The city is located in the humid continental climate zone, with hot, humid summers and cold, snowy winters.
Economy
Reading’s economy is largely based on manufacturing and retail. The city is home to several large manufacturing companies, including the Reading Stove Company, which produces stoves and other heating appliances. Other major employers in the city include the Reading Envelope Company, the Reading Foundry, and the Reading Machine Company.
The city also has a thriving retail sector, with several large shopping centers and malls located in the city. The city is also home to several restaurants, bars, and other entertainment venues.
Demographics
As of the 2010 census, the population of Reading was 30,072. The racial makeup of the city was 87.3% White, 8.2% African American, 0.3% Native American, 0.7% Asian, 0.1% Pacific Islander, and 2.4% from other races. Hispanic or Latino of any race were 2.7% of the population.
The median household income in Reading was $41,945, and the median family income was $50,945. The per capita income for the city was $20,945. About 11.3% of families and 14.2% of the population were below the poverty line, including 19.2% of those under age 18 and 8.2% of those age 65 or over.
Reading is served by the Reading Community City School District. The district has four elementary schools, one middle school, and one high school. The city is also home to several private schools, including the Reading Montessori School and the Reading Christian Academy.
Common Questions
What is Per Capita Income in Reading?
Per Capita income in Reading is $35,637.
What is the Median Family Income in Reading?
Median Family Income in Reading is $85,689.
What is the Median Household income in Reading?
Median Household Income in Reading is $59,966.
What is Income or Wage Gap in Reading?
Income or Wage Gap in Reading is 15.4%.
Women in Reading earn 84.6 cents for every dollar earned by a man.
What is Inequality or Gini Index in Reading?
Inequality or Gini Index in Reading is 0.41.
What is the Total Population of Reading?
Total Population of Reading is 10,527.
What is the Total Male Population of Reading?
Total Male Population of Reading is 5,041.
What is the Total Female Population of Reading?
Total Female Population of Reading is 5,486.
What is the Ratio of Males per 100 Females in Reading?
There are 91.89 Males per 100 Females in Reading.
What is the Ratio of Females per 100 Males in Reading?
There are 108.83 Females per 100 Males in Reading.
What is the Median Population Age in Reading?
Median Population Age in Reading is 42.1 Years.
What is the Average Family Size in Reading
Average Family Size in Reading is 2.9 People.
What is the Average Household Size in Reading
Average Household Size in Reading is 2.1 People.
How Large is the Labor Force in Reading?
There are 6,019 People in the Labor Forcein in Reading.
What is the Percentage of People in the Labor Force in Reading?
68.8% of People are in the Labor Force in Reading.
What is the Unemployment Rate in Reading?
Unemployment Rate in Reading is 5.1%.