Hamilton, OH Map & Demographics
Hamilton Map
Hamilton Overview
$27,526
PER CAPITA INCOME
$62,579
AVG FAMILY INCOME
$52,995
AVG HOUSEHOLD INCOME
26.3%
WAGE / INCOME GAP [ % ]
73.7¢/ $1
WAGE / INCOME GAP [ $ ]
$13,568
FAMILY INCOME DEFICIT
0.43
INEQUALITY / GINI INDEX
63,149
TOTAL POPULATION
30,500
MALE POPULATION
32,649
FEMALE POPULATION
93.42
MALES / 100 FEMALES
107.05
FEMALES / 100 MALES
35.1
MEDIAN AGE
3.1
AVG FAMILY SIZE
2.5
AVG HOUSEHOLD SIZE
30,070
LABOR FORCE [ PEOPLE ]
60.5%
PERCENT IN LABOR FORCE
7.0%
UNEMPLOYMENT RATE
Hamilton Area Codes
Income in Hamilton
Income Overview in Hamilton
Per Capita Income in Hamilton is $27,526, while median incomes of families and households are $62,579 and $52,995 respectively.
| Characteristic | Number | Measure |
| Per Capita Income | 63,149 | $27,526 |
| Median Family Income | 14,794 | $62,579 |
| Mean Family Income | 14,794 | $74,515 |
| Median Household Income | 24,700 | $52,995 |
| Mean Household Income | 24,700 | $66,932 |
| Income Deficit | 14,794 | $13,568 |
| Wage / Income Gap (%) | 63,149 | 26.27% |
| Wage / Income Gap ($) | 63,149 | 73.73¢ per $1 |
| Gini / Inequality Index | 63,149 | 0.43 |
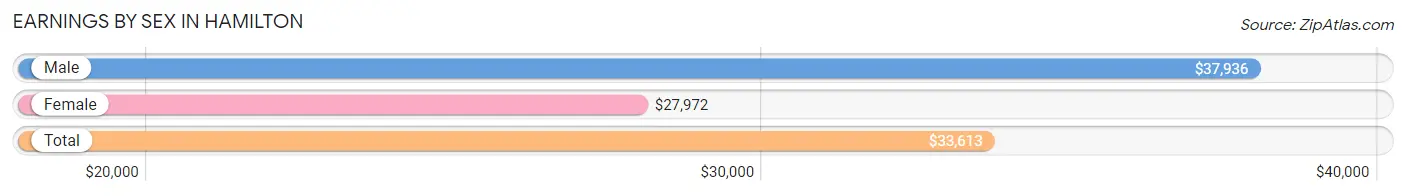
Earnings by Sex in Hamilton
Average Earnings in Hamilton are $33,613, $37,936 for men and $27,972 for women, a difference of 26.3%.
| Sex | Number | Average Earnings |
| Male | 15,567 (50.0%) | $37,936 |
| Female | 15,561 (50.0%) | $27,972 |
| Total | 31,128 (100.0%) | $33,613 |
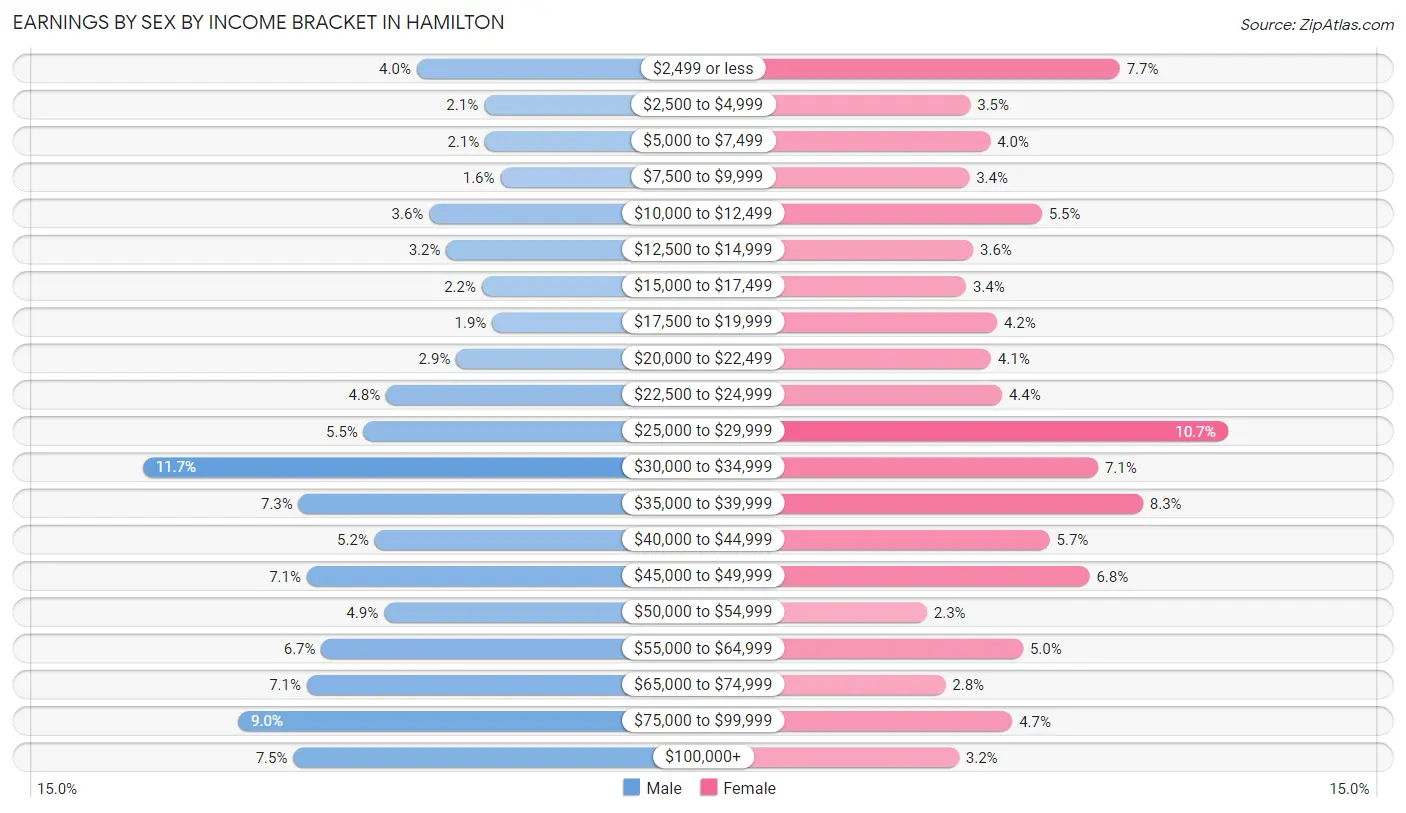
Earnings by Sex by Income Bracket in Hamilton
The most common earnings brackets in Hamilton are $30,000 to $34,999 for men (1,818 | 11.7%) and $25,000 to $29,999 for women (1,665 | 10.7%).
| Income | Male | Female |
| $2,499 or less | 619 (4.0%) | 1,194 (7.7%) |
| $2,500 to $4,999 | 325 (2.1%) | 540 (3.5%) |
| $5,000 to $7,499 | 320 (2.1%) | 627 (4.0%) |
| $7,500 to $9,999 | 254 (1.6%) | 535 (3.4%) |
| $10,000 to $12,499 | 565 (3.6%) | 852 (5.5%) |
| $12,500 to $14,999 | 491 (3.2%) | 553 (3.5%) |
| $15,000 to $17,499 | 334 (2.1%) | 521 (3.4%) |
| $17,500 to $19,999 | 289 (1.9%) | 657 (4.2%) |
| $20,000 to $22,499 | 447 (2.9%) | 630 (4.1%) |
| $22,500 to $24,999 | 753 (4.8%) | 679 (4.4%) |
| $25,000 to $29,999 | 852 (5.5%) | 1,665 (10.7%) |
| $30,000 to $34,999 | 1,818 (11.7%) | 1,099 (7.1%) |
| $35,000 to $39,999 | 1,136 (7.3%) | 1,294 (8.3%) |
| $40,000 to $44,999 | 803 (5.2%) | 887 (5.7%) |
| $45,000 to $49,999 | 1,101 (7.1%) | 1,062 (6.8%) |
| $50,000 to $54,999 | 763 (4.9%) | 350 (2.2%) |
| $55,000 to $64,999 | 1,036 (6.7%) | 771 (5.0%) |
| $65,000 to $74,999 | 1,100 (7.1%) | 431 (2.8%) |
| $75,000 to $99,999 | 1,401 (9.0%) | 724 (4.6%) |
| $100,000+ | 1,160 (7.4%) | 490 (3.2%) |
| Total | 15,567 (100.0%) | 15,561 (100.0%) |
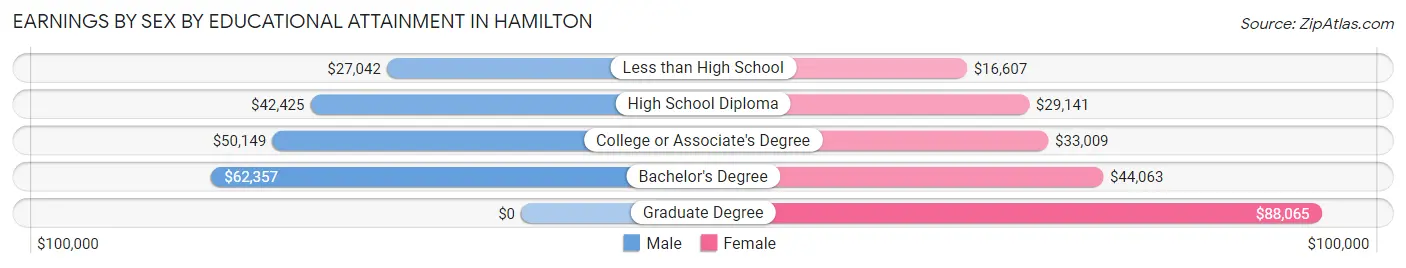
Earnings by Sex by Educational Attainment in Hamilton
Average earnings in Hamilton are $44,102 for men and $33,595 for women, a difference of 23.8%. Men with an educational attainment of bachelor's degree enjoy the highest average annual earnings of $62,357, while those with less than high school education earn the least with $27,042. Women with an educational attainment of graduate degree earn the most with the average annual earnings of $88,065, while those with less than high school education have the smallest earnings of $16,607.
| Educational Attainment | Male Income | Female Income |
| Less than High School | $27,042 | $16,607 |
| High School Diploma | $42,425 | $29,141 |
| College or Associate's Degree | $50,149 | $33,009 |
| Bachelor's Degree | $62,357 | $44,063 |
| Graduate Degree | - | - |
| Total | $44,102 | $33,595 |
Family Income in Hamilton
Family Income Brackets in Hamilton
According to the Hamilton family income data, there are 3,003 families falling into the $50,000 to $74,999 income range, which is the most common income bracket and makes up 20.3% of all families. Conversely, the $10,000 to $14,999 income bracket is the least frequent group with only 355 families (2.4%) belonging to this category.
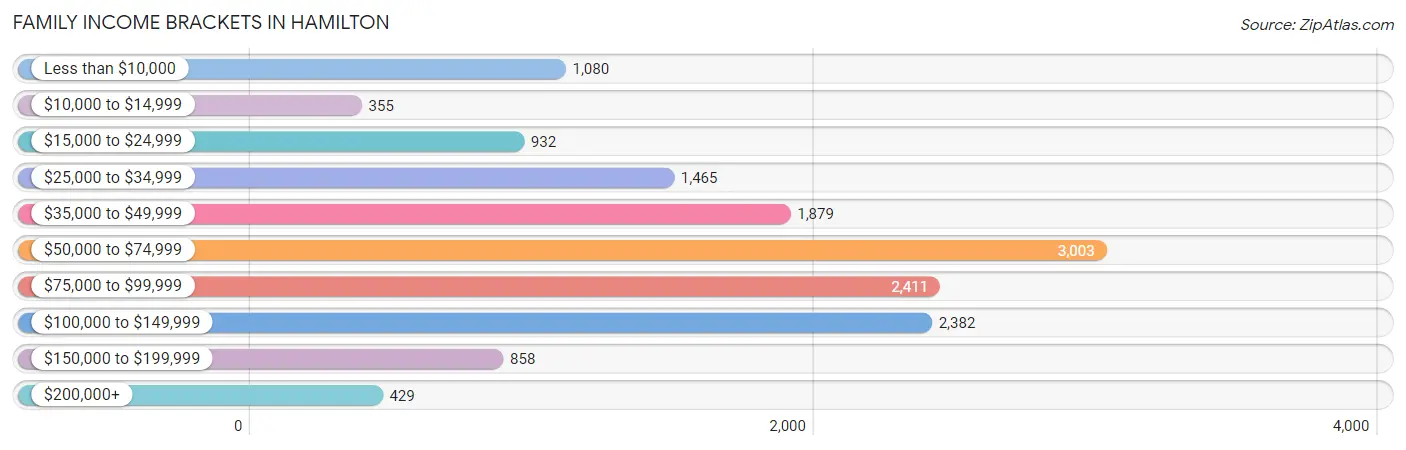
| Income Bracket | # Families | % Families |
| Less than $10,000 | 1,080 | 7.3% |
| $10,000 to $14,999 | 355 | 2.4% |
| $15,000 to $24,999 | 932 | 6.3% |
| $25,000 to $34,999 | 1,465 | 9.9% |
| $35,000 to $49,999 | 1,879 | 12.7% |
| $50,000 to $74,999 | 3,003 | 20.3% |
| $75,000 to $99,999 | 2,411 | 16.3% |
| $100,000 to $149,999 | 2,382 | 16.1% |
| $150,000 to $199,999 | 858 | 5.8% |
| $200,000+ | 429 | 2.9% |
Family Income by Famaliy Size in Hamilton
7+ person families (232 | 1.6%) account for the highest median family income in Hamilton with $116,136 per family, while 2-person families (7,004 | 47.3%) have the highest median income of $29,379 per family member.
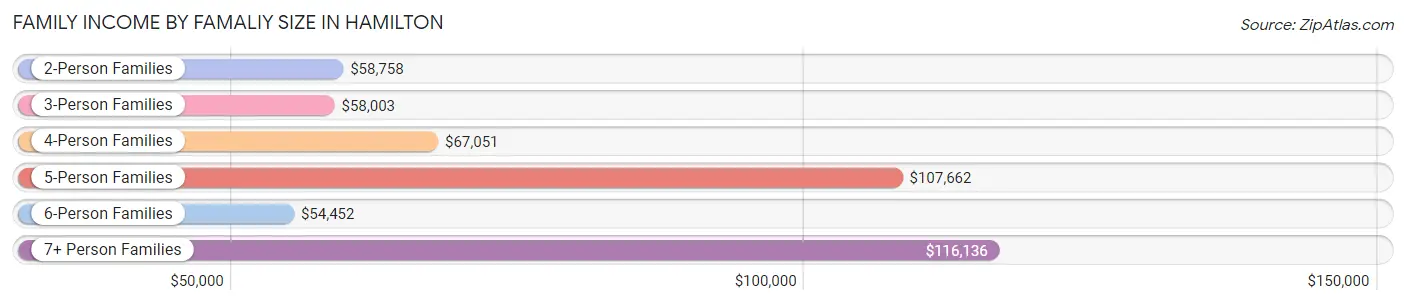
| Income Bracket | # Families | Median Income |
| 2-Person Families | 7,004 (47.3%) | $58,758 |
| 3-Person Families | 3,411 (23.1%) | $58,003 |
| 4-Person Families | 2,710 (18.3%) | $67,051 |
| 5-Person Families | 1,060 (7.2%) | $107,662 |
| 6-Person Families | 377 (2.5%) | $54,452 |
| 7+ Person Families | 232 (1.6%) | $116,136 |
| Total | 14,794 (100.0%) | $62,579 |
Family Income by Number of Earners in Hamilton
The median family income in Hamilton is $62,579, with families comprising 3+ earners (1,225) having the highest median family income of $111,115, while families with no earners (2,635) have the lowest median family income of $30,938, accounting for 8.3% and 17.8% of families, respectively.
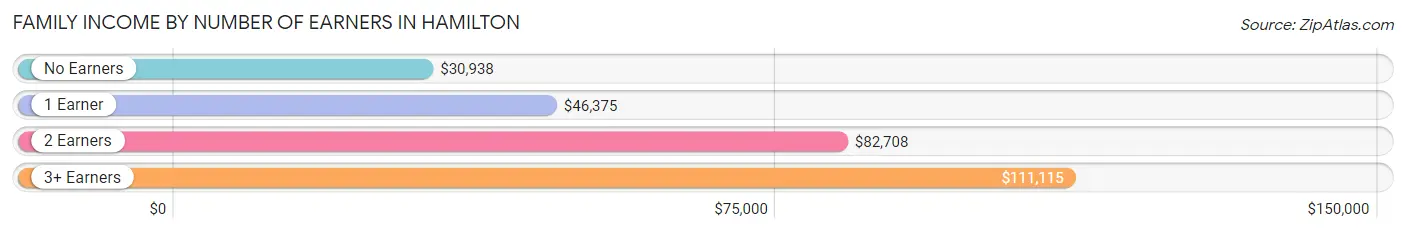
| Number of Earners | # Families | Median Income |
| No Earners | 2,635 (17.8%) | $30,938 |
| 1 Earner | 5,585 (37.8%) | $46,375 |
| 2 Earners | 5,349 (36.2%) | $82,708 |
| 3+ Earners | 1,225 (8.3%) | $111,115 |
| Total | 14,794 (100.0%) | $62,579 |
Household Income in Hamilton
Household Income Brackets in Hamilton
With 4,841 households falling in the category, the $50,000 to $74,999 income range is the most frequent in Hamilton, accounting for 19.6% of all households. In contrast, only 618 households (2.5%) fall into the $200,000+ income bracket, making it the least populous group.
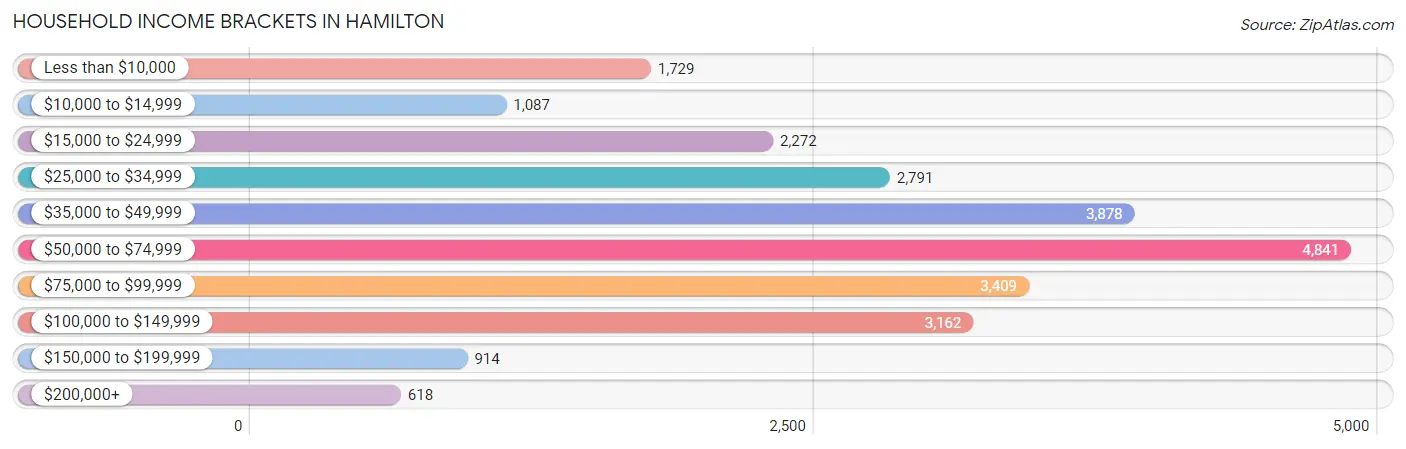
| Income Bracket | # Households | % Households |
| Less than $10,000 | 1,729 | 7.0% |
| $10,000 to $14,999 | 1,087 | 4.4% |
| $15,000 to $24,999 | 2,272 | 9.2% |
| $25,000 to $34,999 | 2,791 | 11.3% |
| $35,000 to $49,999 | 3,878 | 15.7% |
| $50,000 to $74,999 | 4,841 | 19.6% |
| $75,000 to $99,999 | 3,409 | 13.8% |
| $100,000 to $149,999 | 3,162 | 12.8% |
| $150,000 to $199,999 | 914 | 3.7% |
| $200,000+ | 618 | 2.5% |
Household Income by Householder Age in Hamilton
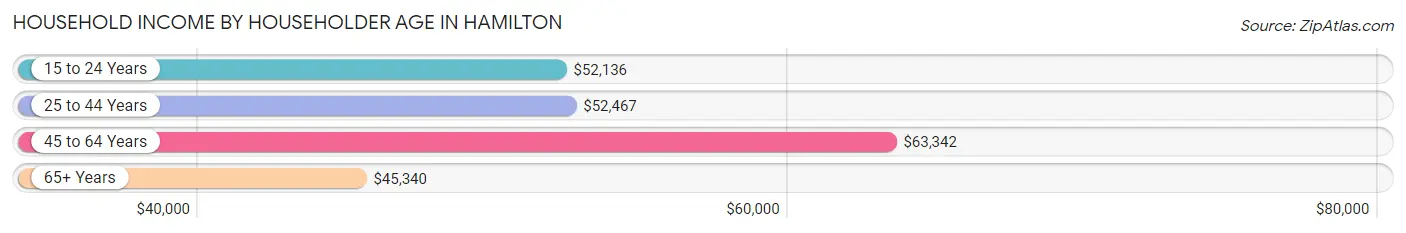
The median household income in Hamilton is $52,995, with the highest median household income of $63,342 found in the 45 to 64 years age bracket for the primary householder. A total of 8,326 households (33.7%) fall into this category. Meanwhile, the 65+ years age bracket for the primary householder has the lowest median household income of $45,340, with 6,521 households (26.4%) in this group.
| Income Bracket | # Households | Median Income |
| 15 to 24 Years | 1,392 (5.6%) | $52,136 |
| 25 to 44 Years | 8,461 (34.3%) | $52,467 |
| 45 to 64 Years | 8,326 (33.7%) | $63,342 |
| 65+ Years | 6,521 (26.4%) | $45,340 |
| Total | 24,700 (100.0%) | $52,995 |
Poverty in Hamilton
Income Below Poverty by Sex and Age in Hamilton
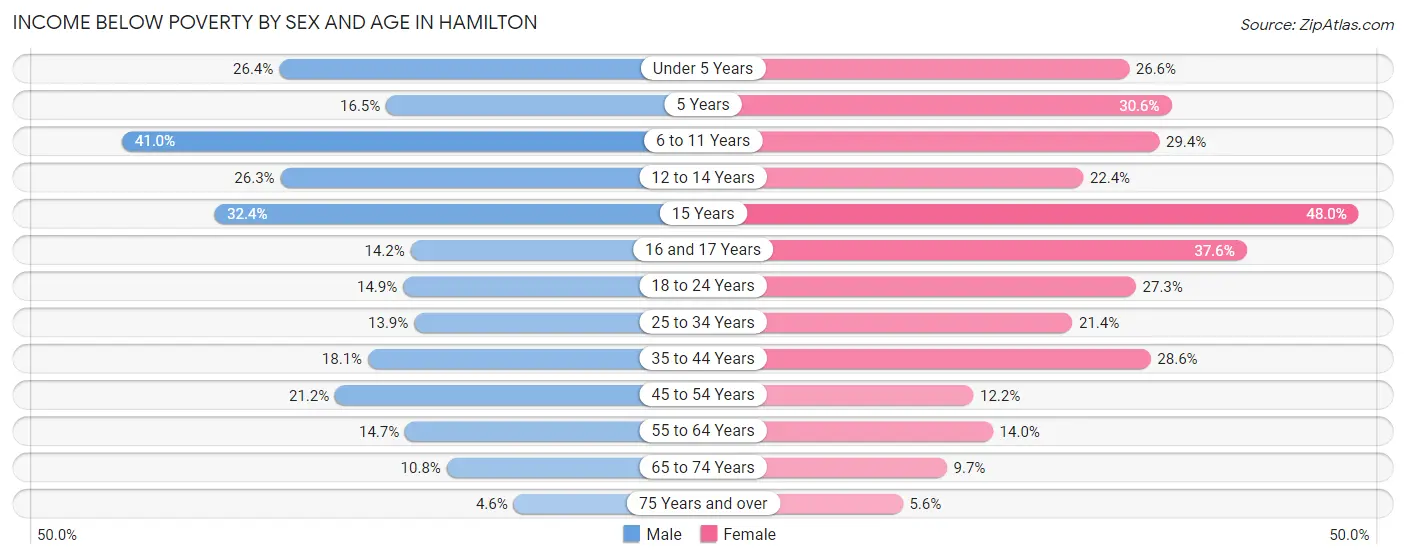
With 18.6% poverty level for males and 20.6% for females among the residents of Hamilton, 6 to 11 year old males and 15 year old females are the most vulnerable to poverty, with 959 males (41.0%) and 212 females (48.0%) in their respective age groups living below the poverty level.
| Age Bracket | Male | Female |
| Under 5 Years | 505 (26.4%) | 540 (26.6%) |
| 5 Years | 76 (16.5%) | 148 (30.6%) |
| 6 to 11 Years | 959 (41.0%) | 633 (29.4%) |
| 12 to 14 Years | 402 (26.3%) | 329 (22.4%) |
| 15 Years | 129 (32.4%) | 212 (48.0%) |
| 16 and 17 Years | 98 (14.2%) | 225 (37.6%) |
| 18 to 24 Years | 487 (14.9%) | 987 (27.3%) |
| 25 to 34 Years | 651 (13.9%) | 1,024 (21.4%) |
| 35 to 44 Years | 616 (18.1%) | 1,104 (28.6%) |
| 45 to 54 Years | 724 (21.2%) | 373 (12.2%) |
| 55 to 64 Years | 530 (14.7%) | 573 (14.0%) |
| 65 to 74 Years | 270 (10.8%) | 302 (9.7%) |
| 75 Years and over | 60 (4.6%) | 130 (5.6%) |
| Total | 5,507 (18.6%) | 6,580 (20.6%) |
Income Above Poverty by Sex and Age in Hamilton
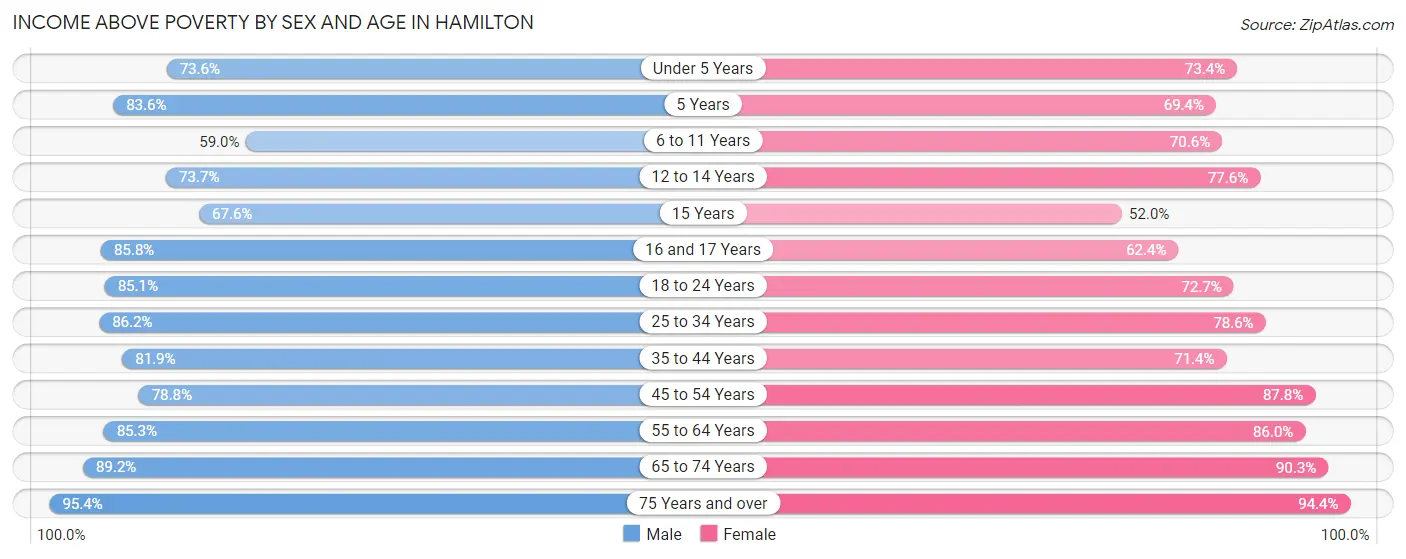
According to the poverty statistics in Hamilton, males aged 75 years and over and females aged 75 years and over are the age groups that are most secure financially, with 95.4% of males and 94.4% of females in these age groups living above the poverty line.
| Age Bracket | Male | Female |
| Under 5 Years | 1,409 (73.6%) | 1,487 (73.4%) |
| 5 Years | 386 (83.6%) | 336 (69.4%) |
| 6 to 11 Years | 1,382 (59.0%) | 1,517 (70.6%) |
| 12 to 14 Years | 1,129 (73.7%) | 1,141 (77.6%) |
| 15 Years | 269 (67.6%) | 230 (52.0%) |
| 16 and 17 Years | 593 (85.8%) | 374 (62.4%) |
| 18 to 24 Years | 2,786 (85.1%) | 2,633 (72.7%) |
| 25 to 34 Years | 4,048 (86.2%) | 3,767 (78.6%) |
| 35 to 44 Years | 2,779 (81.9%) | 2,751 (71.4%) |
| 45 to 54 Years | 2,693 (78.8%) | 2,689 (87.8%) |
| 55 to 64 Years | 3,078 (85.3%) | 3,521 (86.0%) |
| 65 to 74 Years | 2,224 (89.2%) | 2,802 (90.3%) |
| 75 Years and over | 1,240 (95.4%) | 2,181 (94.4%) |
| Total | 24,016 (81.4%) | 25,429 (79.4%) |
Income Below Poverty Among Married-Couple Families in Hamilton
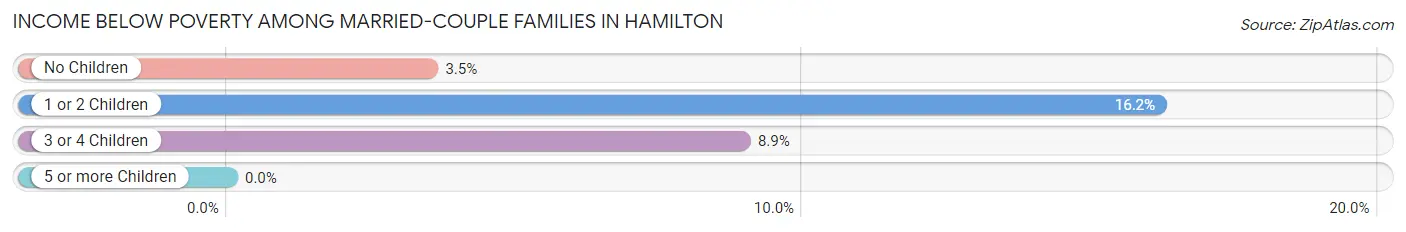
The poverty statistics for married-couple families in Hamilton show that 8.3% or 751 of the total 9,083 families live below the poverty line. Families with 1 or 2 children have the highest poverty rate of 16.2%, comprising of 497 families. On the other hand, families with 5 or more children have the lowest poverty rate of 0.0%, which includes 0 families.
| Children | Above Poverty | Below Poverty |
| No Children | 4,921 (96.5%) | 178 (3.5%) |
| 1 or 2 Children | 2,576 (83.8%) | 497 (16.2%) |
| 3 or 4 Children | 775 (91.1%) | 76 (8.9%) |
| 5 or more Children | 60 (100.0%) | 0 (0.0%) |
| Total | 8,332 (91.7%) | 751 (8.3%) |
Income Below Poverty Among Single-Parent Households in Hamilton
According to the poverty data in Hamilton, 9.5% or 145 single-father households and 33.4% or 1,396 single-mother households are living below the poverty line. Among single-father households, those with 5 or more children have the highest poverty rate, with 2 households (100.0%) experiencing poverty. Likewise, among single-mother households, those with 5 or more children have the highest poverty rate, with 54 households (100.0%) falling below the poverty line.
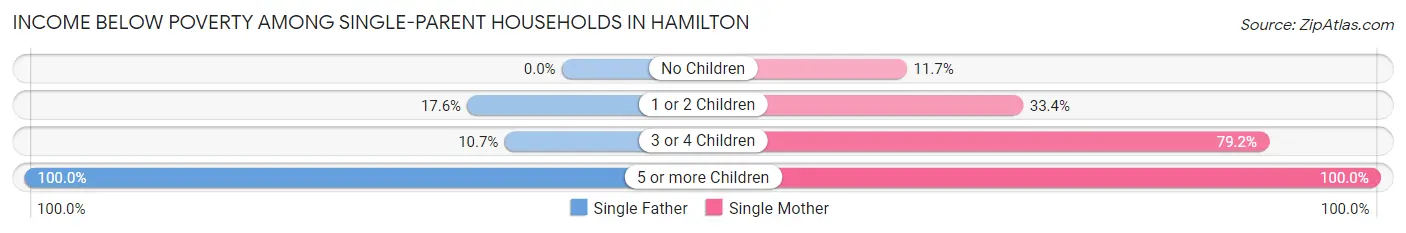
| Children | Single Father | Single Mother |
| No Children | 0 (0.0%) | 153 (11.7%) |
| 1 or 2 Children | 127 (17.6%) | 763 (33.4%) |
| 3 or 4 Children | 16 (10.7%) | 426 (79.2%) |
| 5 or more Children | 2 (100.0%) | 54 (100.0%) |
| Total | 145 (9.5%) | 1,396 (33.4%) |
Income Below Poverty Among Married-Couple vs Single-Parent Households in Hamilton
The poverty data for Hamilton shows that 751 of the married-couple family households (8.3%) and 1,541 of the single-parent households (27.0%) are living below the poverty level. Within the married-couple family households, those with 1 or 2 children have the highest poverty rate, with 497 households (16.2%) falling below the poverty line. Among the single-parent households, those with 5 or more children have the highest poverty rate, with 56 household (100.0%) living below poverty.
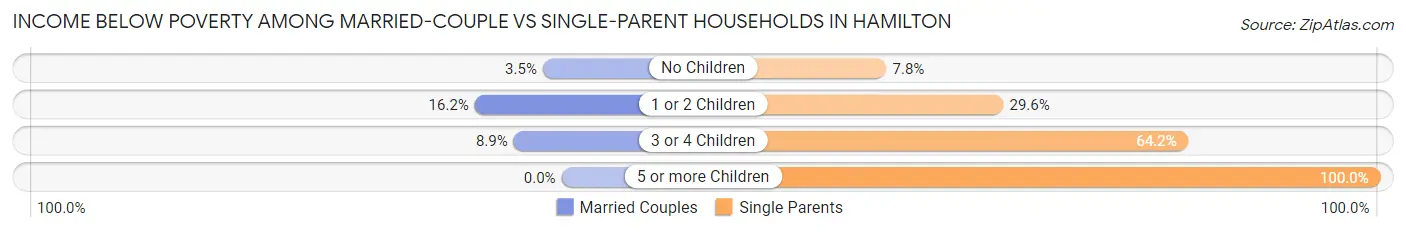
| Children | Married-Couple Families | Single-Parent Households |
| No Children | 178 (3.5%) | 153 (7.8%) |
| 1 or 2 Children | 497 (16.2%) | 890 (29.6%) |
| 3 or 4 Children | 76 (8.9%) | 442 (64.2%) |
| 5 or more Children | 0 (0.0%) | 56 (100.0%) |
| Total | 751 (8.3%) | 1,541 (27.0%) |
Race in Hamilton
The most populous races in Hamilton are White / Caucasian (50,398 | 79.8%), Hispanic or Latino (5,898 | 9.3%), and Black / African American (5,608 | 8.9%).
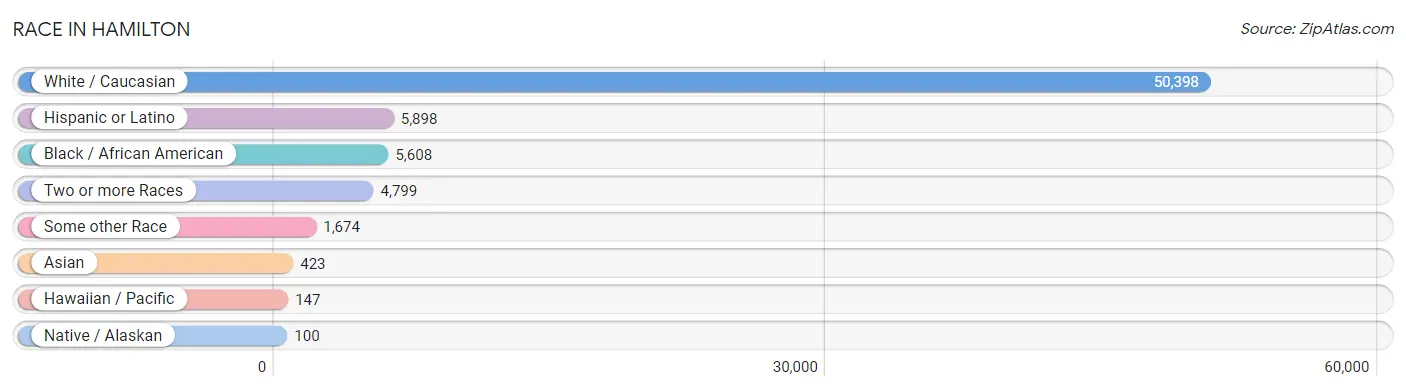
| Race | # Population | % Population |
| Asian | 423 | 0.7% |
| Black / African American | 5,608 | 8.9% |
| Hawaiian / Pacific | 147 | 0.2% |
| Hispanic or Latino | 5,898 | 9.3% |
| Native / Alaskan | 100 | 0.2% |
| White / Caucasian | 50,398 | 79.8% |
| Two or more Races | 4,799 | 7.6% |
| Some other Race | 1,674 | 2.6% |
| Total | 63,149 | 100.0% |
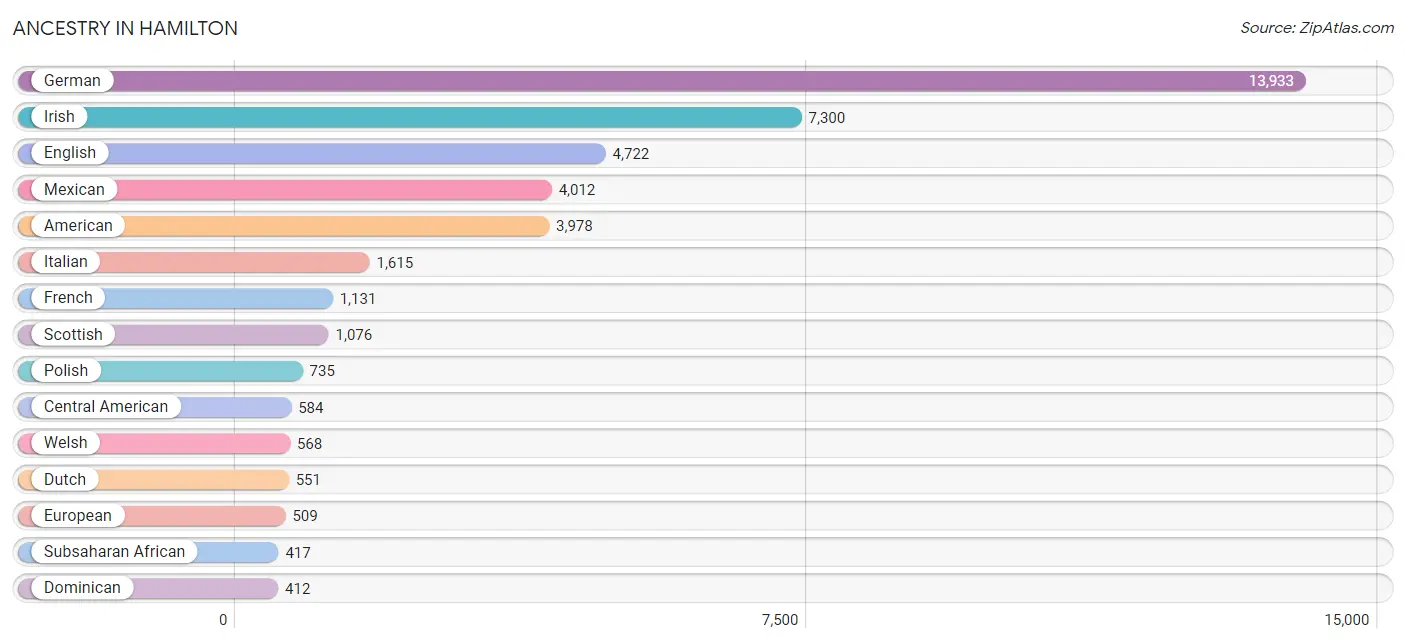
Ancestry in Hamilton
The most populous ancestries reported in Hamilton are German (13,933 | 22.1%), Irish (7,300 | 11.6%), English (4,722 | 7.5%), Mexican (4,012 | 6.4%), and American (3,978 | 6.3%), together accounting for 53.8% of all Hamilton residents.
| Ancestry | # Population | % Population |
| African | 347 | 0.5% |
| American | 3,978 | 6.3% |
| Arab | 87 | 0.1% |
| Armenian | 68 | 0.1% |
| Austrian | 18 | 0.0% |
| Belgian | 19 | 0.0% |
| Bhutanese | 198 | 0.3% |
| Blackfeet | 54 | 0.1% |
| Brazilian | 4 | 0.0% |
| British | 329 | 0.5% |
| Burmese | 98 | 0.2% |
| Canadian | 71 | 0.1% |
| Celtic | 16 | 0.0% |
| Central American | 584 | 0.9% |
| Cherokee | 185 | 0.3% |
| Chippewa | 11 | 0.0% |
| Colombian | 49 | 0.1% |
| Costa Rican | 7 | 0.0% |
| Croatian | 7 | 0.0% |
| Cuban | 143 | 0.2% |
| Czech | 34 | 0.1% |
| Czechoslovakian | 27 | 0.0% |
| Danish | 34 | 0.1% |
| Dominican | 412 | 0.6% |
| Dutch | 551 | 0.9% |
| Eastern European | 43 | 0.1% |
| Ecuadorian | 20 | 0.0% |
| Egyptian | 30 | 0.1% |
| English | 4,722 | 7.5% |
| European | 509 | 0.8% |
| Finnish | 53 | 0.1% |
| French | 1,131 | 1.8% |
| French Canadian | 17 | 0.0% |
| German | 13,933 | 22.1% |
| Ghanaian | 51 | 0.1% |
| Greek | 103 | 0.2% |
| Guatemalan | 137 | 0.2% |
| Haitian | 19 | 0.0% |
| Honduran | 136 | 0.2% |
| Hopi | 3 | 0.0% |
| Hungarian | 186 | 0.3% |
| Icelander | 12 | 0.0% |
| Indian (Asian) | 53 | 0.1% |
| Irish | 7,300 | 11.6% |
| Iroquois | 10 | 0.0% |
| Israeli | 19 | 0.0% |
| Italian | 1,615 | 2.6% |
| Jamaican | 149 | 0.2% |
| Japanese | 14 | 0.0% |
| Jordanian | 4 | 0.0% |
| Korean | 168 | 0.3% |
| Lebanese | 32 | 0.1% |
| Lithuanian | 35 | 0.1% |
| Mexican | 4,012 | 6.4% |
| Mexican American Indian | 58 | 0.1% |
| Moroccan | 19 | 0.0% |
| Native Hawaiian | 13 | 0.0% |
| Navajo | 94 | 0.2% |
| Nigerian | 19 | 0.0% |
| Northern European | 112 | 0.2% |
| Norwegian | 119 | 0.2% |
| Pakistani | 13 | 0.0% |
| Paraguayan | 7 | 0.0% |
| Pennsylvania German | 27 | 0.0% |
| Polish | 735 | 1.2% |
| Portuguese | 22 | 0.0% |
| Puerto Rican | 330 | 0.5% |
| Russian | 45 | 0.1% |
| Salvadoran | 304 | 0.5% |
| Scandinavian | 16 | 0.0% |
| Scotch-Irish | 357 | 0.6% |
| Scottish | 1,076 | 1.7% |
| Serbian | 2 | 0.0% |
| Slavic | 5 | 0.0% |
| Slovak | 48 | 0.1% |
| South American | 76 | 0.1% |
| Spaniard | 162 | 0.3% |
| Spanish | 17 | 0.0% |
| Spanish American | 8 | 0.0% |
| Sri Lankan | 46 | 0.1% |
| Subsaharan African | 417 | 0.7% |
| Swedish | 197 | 0.3% |
| Swiss | 130 | 0.2% |
| Thai | 17 | 0.0% |
| Welsh | 568 | 0.9% | View All 85 Rows |
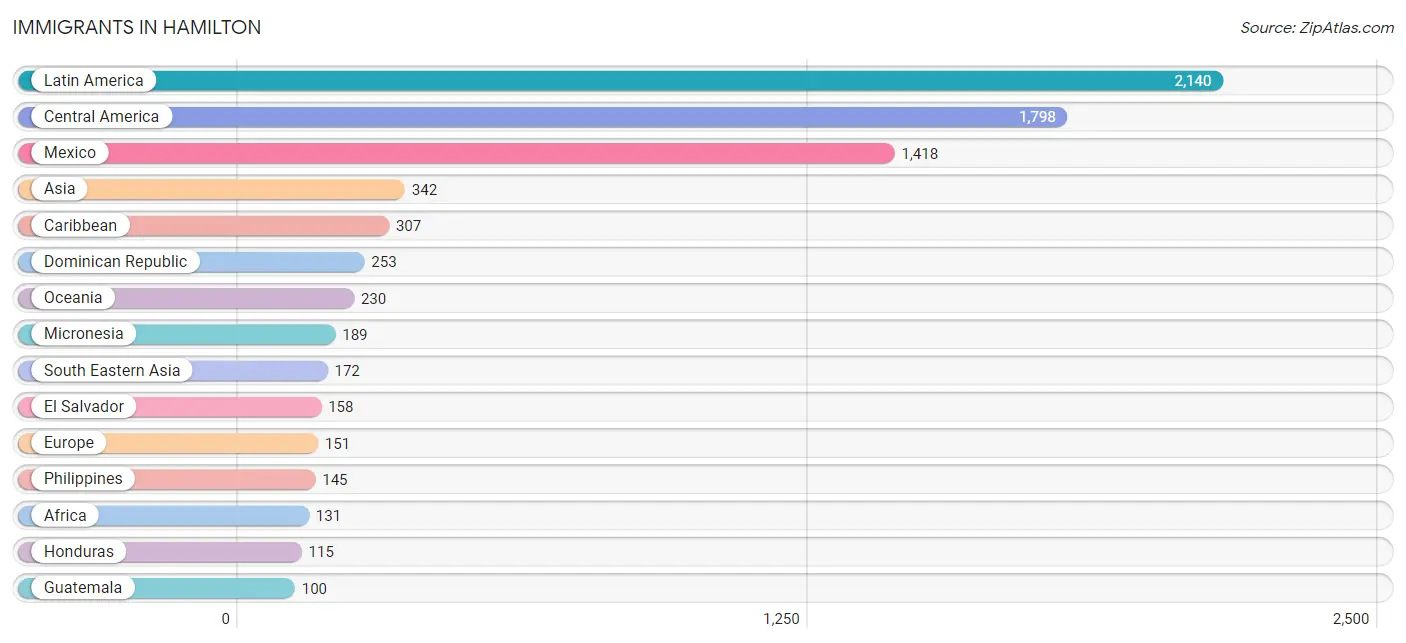
Immigrants in Hamilton
The most numerous immigrant groups reported in Hamilton came from Latin America (2,140 | 3.4%), Central America (1,798 | 2.9%), Mexico (1,418 | 2.2%), Asia (342 | 0.5%), and Caribbean (307 | 0.5%), together accounting for 9.5% of all Hamilton residents.
| Immigration Origin | # Population | % Population |
| Africa | 131 | 0.2% |
| Asia | 342 | 0.5% |
| Australia | 41 | 0.1% |
| Brazil | 10 | 0.0% |
| Cambodia | 14 | 0.0% |
| Canada | 11 | 0.0% |
| Caribbean | 307 | 0.5% |
| Central America | 1,798 | 2.9% |
| Colombia | 13 | 0.0% |
| Costa Rica | 7 | 0.0% |
| Cuba | 54 | 0.1% |
| Dominican Republic | 253 | 0.4% |
| Eastern Africa | 8 | 0.0% |
| Eastern Asia | 97 | 0.2% |
| El Salvador | 158 | 0.3% |
| Europe | 151 | 0.2% |
| Germany | 36 | 0.1% |
| Ghana | 85 | 0.1% |
| Guatemala | 100 | 0.2% |
| Honduras | 115 | 0.2% |
| India | 17 | 0.0% |
| Israel | 19 | 0.0% |
| Italy | 28 | 0.0% |
| Japan | 83 | 0.1% |
| Korea | 14 | 0.0% |
| Latin America | 2,140 | 3.4% |
| Mexico | 1,418 | 2.2% |
| Micronesia | 189 | 0.3% |
| Nepal | 37 | 0.1% |
| Netherlands | 19 | 0.0% |
| Northern Europe | 29 | 0.1% |
| Oceania | 230 | 0.4% |
| Peru | 5 | 0.0% |
| Philippines | 145 | 0.2% |
| Portugal | 11 | 0.0% |
| South America | 35 | 0.1% |
| South Central Asia | 54 | 0.1% |
| South Eastern Asia | 172 | 0.3% |
| Southern Europe | 67 | 0.1% |
| Spain | 28 | 0.0% |
| Thailand | 13 | 0.0% |
| Western Africa | 85 | 0.1% |
| Western Asia | 19 | 0.0% |
| Western Europe | 55 | 0.1% | View All 44 Rows |
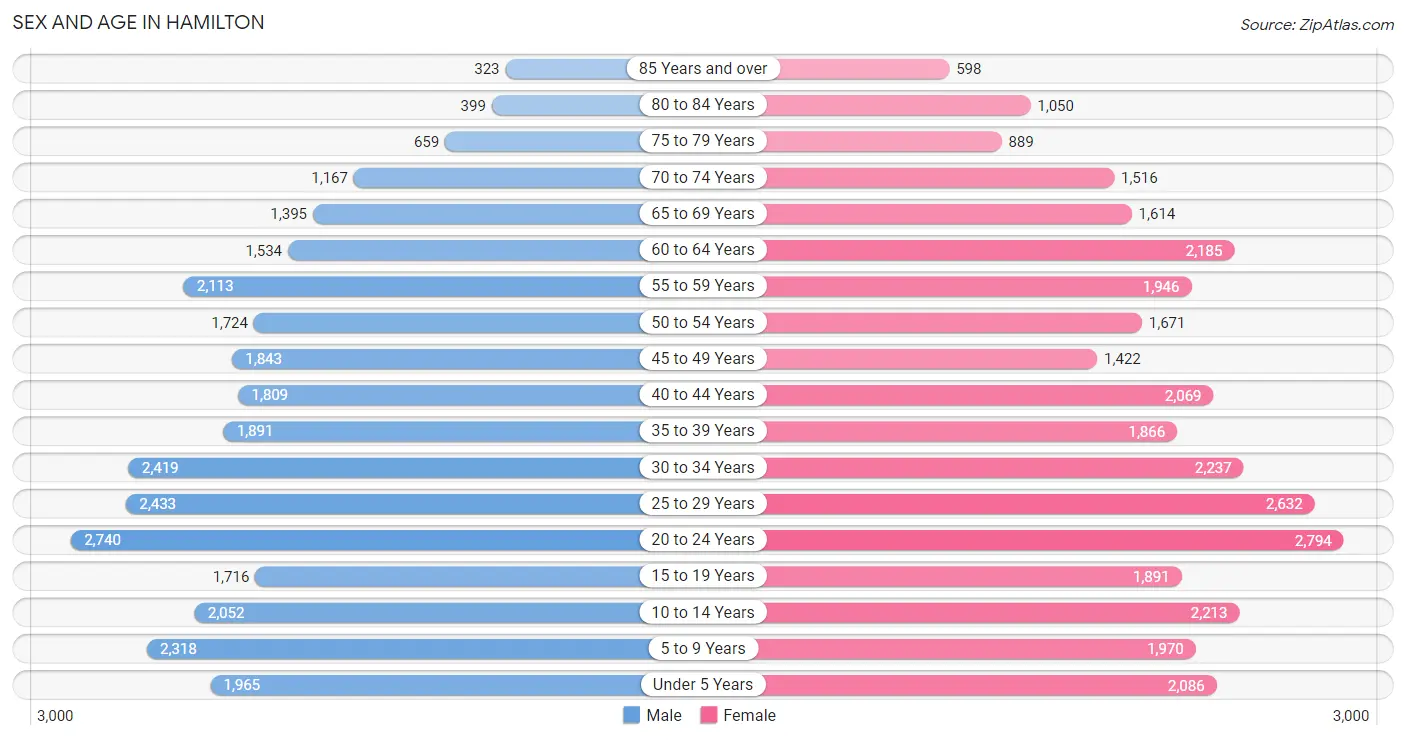
Sex and Age in Hamilton
Sex and Age in Hamilton
The most populous age groups in Hamilton are 20 to 24 Years (2,740 | 9.0%) for men and 20 to 24 Years (2,794 | 8.6%) for women.
| Age Bracket | Male | Female |
| Under 5 Years | 1,965 (6.4%) | 2,086 (6.4%) |
| 5 to 9 Years | 2,318 (7.6%) | 1,970 (6.0%) |
| 10 to 14 Years | 2,052 (6.7%) | 2,213 (6.8%) |
| 15 to 19 Years | 1,716 (5.6%) | 1,891 (5.8%) |
| 20 to 24 Years | 2,740 (9.0%) | 2,794 (8.6%) |
| 25 to 29 Years | 2,433 (8.0%) | 2,632 (8.1%) |
| 30 to 34 Years | 2,419 (7.9%) | 2,237 (6.9%) |
| 35 to 39 Years | 1,891 (6.2%) | 1,866 (5.7%) |
| 40 to 44 Years | 1,809 (5.9%) | 2,069 (6.3%) |
| 45 to 49 Years | 1,843 (6.0%) | 1,422 (4.4%) |
| 50 to 54 Years | 1,724 (5.7%) | 1,671 (5.1%) |
| 55 to 59 Years | 2,113 (6.9%) | 1,946 (6.0%) |
| 60 to 64 Years | 1,534 (5.0%) | 2,185 (6.7%) |
| 65 to 69 Years | 1,395 (4.6%) | 1,614 (4.9%) |
| 70 to 74 Years | 1,167 (3.8%) | 1,516 (4.6%) |
| 75 to 79 Years | 659 (2.2%) | 889 (2.7%) |
| 80 to 84 Years | 399 (1.3%) | 1,050 (3.2%) |
| 85 Years and over | 323 (1.1%) | 598 (1.8%) |
| Total | 30,500 (100.0%) | 32,649 (100.0%) |
Families and Households in Hamilton
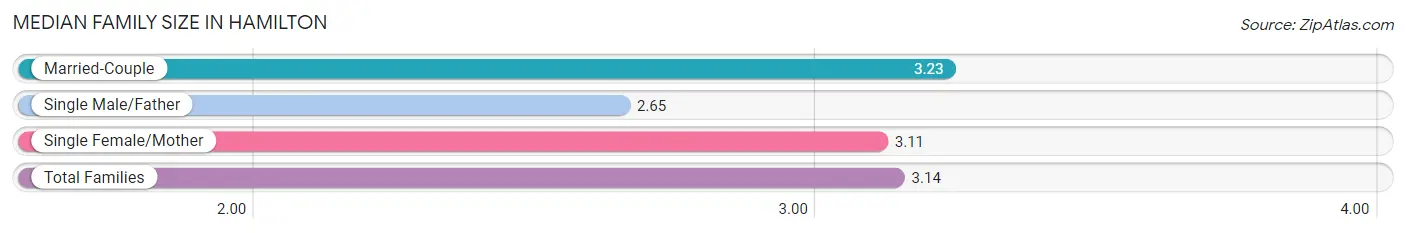
Median Family Size in Hamilton
The median family size in Hamilton is 3.14 persons per family, with married-couple families (9,083 | 61.4%) accounting for the largest median family size of 3.23 persons per family. On the other hand, single male/father families (1,525 | 10.3%) represent the smallest median family size with 2.65 persons per family.
| Family Type | # Families | Family Size |
| Married-Couple | 9,083 (61.4%) | 3.23 |
| Single Male/Father | 1,525 (10.3%) | 2.65 |
| Single Female/Mother | 4,186 (28.3%) | 3.11 |
| Total Families | 14,794 (100.0%) | 3.14 |
Median Household Size in Hamilton
The median household size in Hamilton is 2.49 persons per household, with single female/mother households (4,186 | 17.0%) accounting for the largest median household size of 3.44 persons per household. non-family households (9,906 | 40.1%) represent the smallest median household size with 1.30 persons per household.

| Household Type | # Households | Household Size |
| Married-Couple | 9,083 (36.8%) | 3.24 |
| Single Male/Father | 1,525 (6.2%) | 3.09 |
| Single Female/Mother | 4,186 (17.0%) | 3.44 |
| Non-family | 9,906 (40.1%) | 1.30 |
| Total Households | 24,700 (100.0%) | 2.49 |
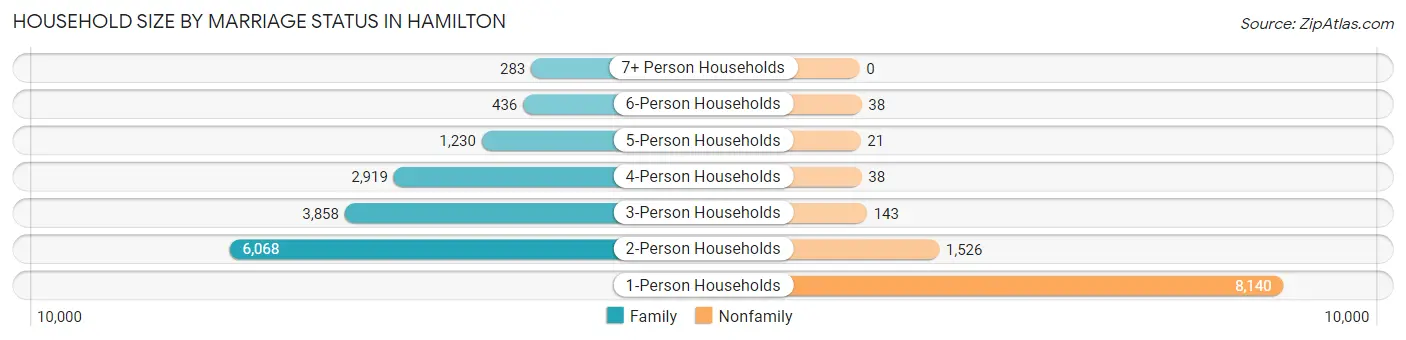
Household Size by Marriage Status in Hamilton
Out of a total of 24,700 households in Hamilton, 14,794 (59.9%) are family households, while 9,906 (40.1%) are nonfamily households. The most numerous type of family households are 2-person households, comprising 6,068, and the most common type of nonfamily households are 1-person households, comprising 8,140.
| Household Size | Family Households | Nonfamily Households |
| 1-Person Households | - | 8,140 (33.0%) |
| 2-Person Households | 6,068 (24.6%) | 1,526 (6.2%) |
| 3-Person Households | 3,858 (15.6%) | 143 (0.6%) |
| 4-Person Households | 2,919 (11.8%) | 38 (0.2%) |
| 5-Person Households | 1,230 (5.0%) | 21 (0.1%) |
| 6-Person Households | 436 (1.8%) | 38 (0.2%) |
| 7+ Person Households | 283 (1.1%) | 0 (0.0%) |
| Total | 14,794 (59.9%) | 9,906 (40.1%) |
Female Fertility in Hamilton
Fertility by Age in Hamilton
Average fertility rate in Hamilton is 65.0 births per 1,000 women. Women in the age bracket of 20 to 34 years have the highest fertility rate with 108.0 births per 1,000 women. Women in the age bracket of 20 to 34 years acount for 82.7% of all women with births.
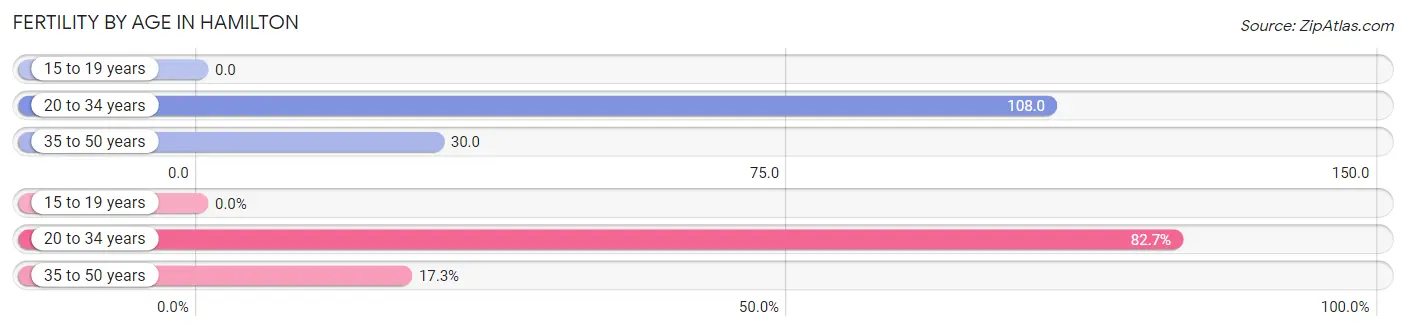
| Age Bracket | Women with Births | Births / 1,000 Women |
| 15 to 19 years | 0 (0.0%) | 0.0 |
| 20 to 34 years | 827 (82.7%) | 108.0 |
| 35 to 50 years | 173 (17.3%) | 30.0 |
| Total | 1,000 (100.0%) | 65.0 |
Fertility by Age by Marriage Status in Hamilton
50.8% of women with births (1,000) in Hamilton are married. The highest percentage of unmarried women with births falls into 20 to 34 years age bracket with 56.7% of them unmarried at the time of birth, while the lowest percentage of unmarried women with births belong to 35 to 50 years age bracket with 13.3% of them unmarried.
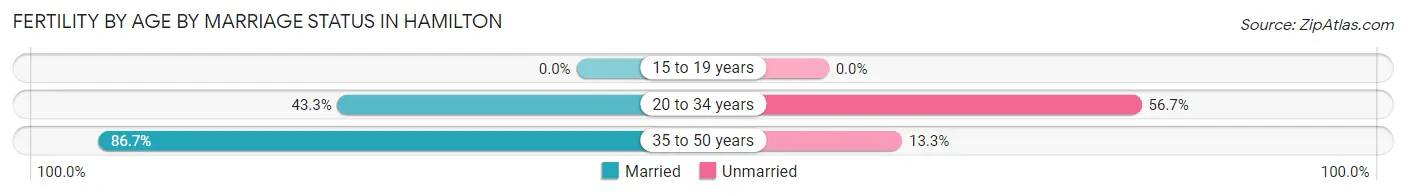
| Age Bracket | Married | Unmarried |
| 15 to 19 years | 0 (0.0%) | 0 (0.0%) |
| 20 to 34 years | 358 (43.3%) | 469 (56.7%) |
| 35 to 50 years | 150 (86.7%) | 23 (13.3%) |
| Total | 508 (50.8%) | 492 (49.2%) |
Fertility by Education in Hamilton
Average fertility rate in Hamilton is 65.0 births per 1,000 women. Women with the education attainment of graduate degree have the highest fertility rate of 139.0 births per 1,000 women, while women with the education attainment of less than high school have the lowest fertility at 20.0 births per 1,000 women. Women with the education attainment of high school diploma represent 66.7% of all women with births.
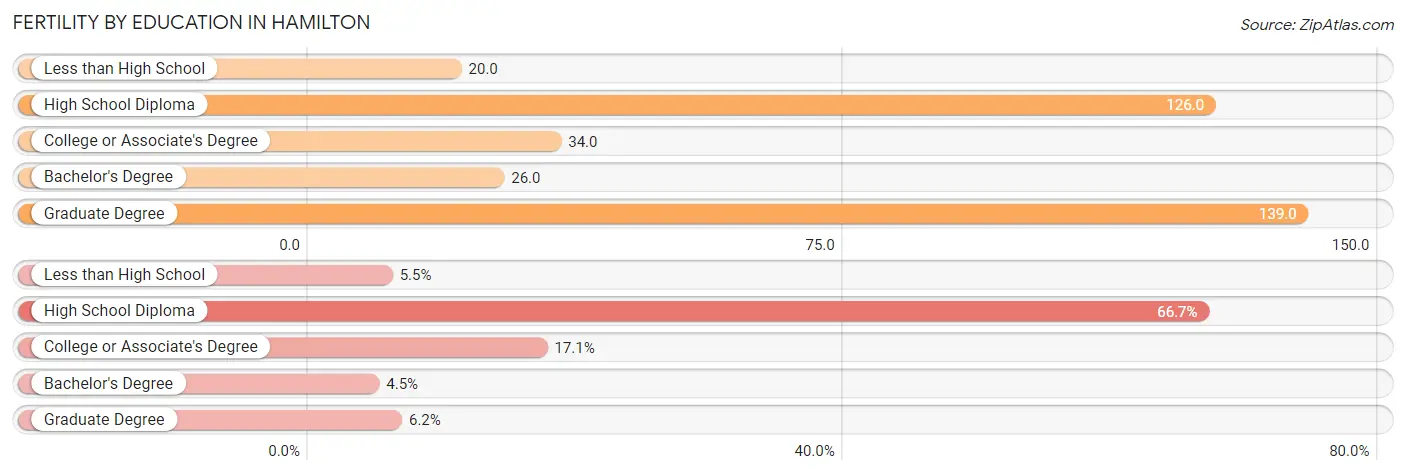
| Educational Attainment | Women with Births | Births / 1,000 Women |
| Less than High School | 55 (5.5%) | 20.0 |
| High School Diploma | 667 (66.7%) | 126.0 |
| College or Associate's Degree | 171 (17.1%) | 34.0 |
| Bachelor's Degree | 45 (4.5%) | 26.0 |
| Graduate Degree | 62 (6.2%) | 139.0 |
| Total | 1,000 (100.0%) | 65.0 |
Fertility by Education by Marriage Status in Hamilton
49.2% of women with births in Hamilton are unmarried. Women with the educational attainment of graduate degree are most likely to be married with 87.1% of them married at childbirth, while women with the educational attainment of high school diploma are least likely to be married with 54.1% of them unmarried at childbirth.
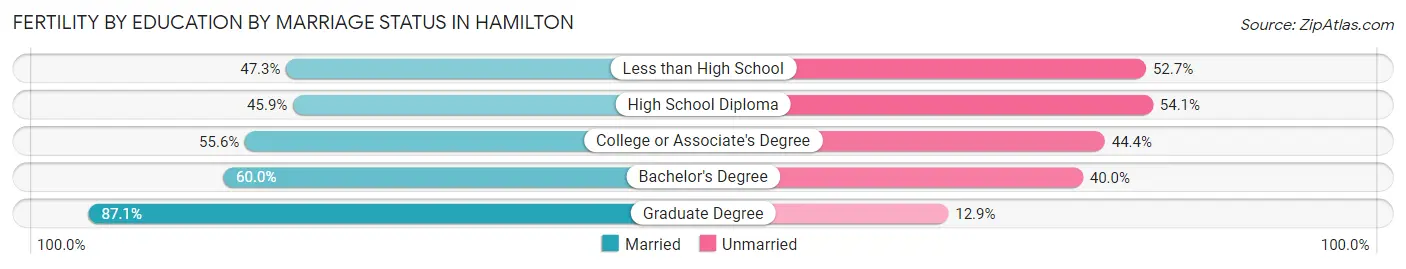
| Educational Attainment | Married | Unmarried |
| Less than High School | 26 (47.3%) | 29 (52.7%) |
| High School Diploma | 306 (45.9%) | 361 (54.1%) |
| College or Associate's Degree | 95 (55.6%) | 76 (44.4%) |
| Bachelor's Degree | 27 (60.0%) | 18 (40.0%) |
| Graduate Degree | 54 (87.1%) | 8 (12.9%) |
| Total | 508 (50.8%) | 492 (49.2%) |
Employment Characteristics in Hamilton
Employment by Class of Employer in Hamilton
Among the 27,412 employed individuals in Hamilton, private company employees (20,450 | 74.6%), not-for-profit organizations (2,325 | 8.5%), and local government employees (1,642 | 6.0%) make up the most common classes of employment.
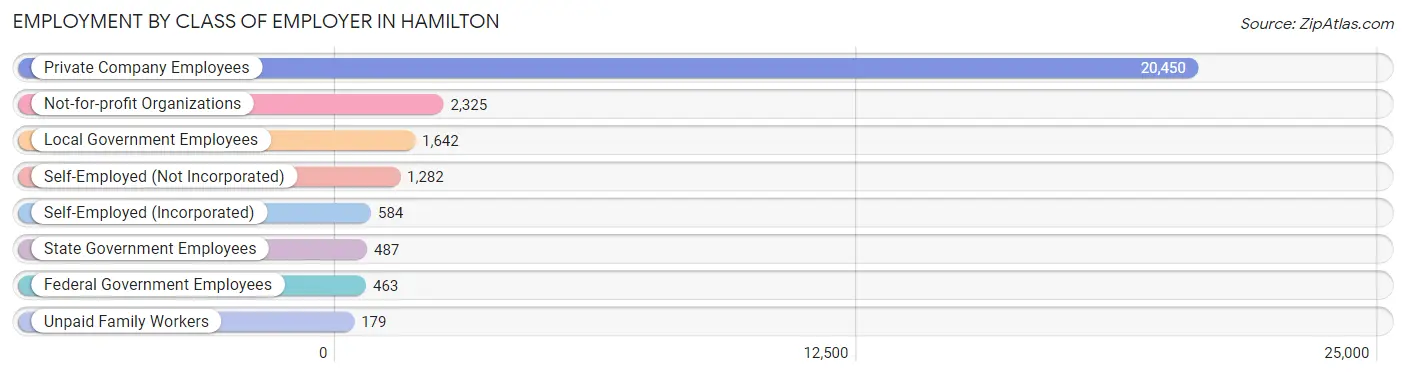
| Employer Class | # Employees | % Employees |
| Private Company Employees | 20,450 | 74.6% |
| Self-Employed (Incorporated) | 584 | 2.1% |
| Self-Employed (Not Incorporated) | 1,282 | 4.7% |
| Not-for-profit Organizations | 2,325 | 8.5% |
| Local Government Employees | 1,642 | 6.0% |
| State Government Employees | 487 | 1.8% |
| Federal Government Employees | 463 | 1.7% |
| Unpaid Family Workers | 179 | 0.6% |
| Total | 27,412 | 100.0% |
Employment Status by Age in Hamilton
According to the labor force statistics for Hamilton, out of the total population over 16 years of age (49,702), 60.5% or 30,070 individuals are in the labor force, with 7.0% or 2,105 of them unemployed. The age group with the highest labor force participation rate is 25 to 29 years, with 85.1% or 4,310 individuals in the labor force. Within the labor force, the 16 to 19 years age range has the highest percentage of unemployed individuals, with 20.0% or 272 of them being unemployed.
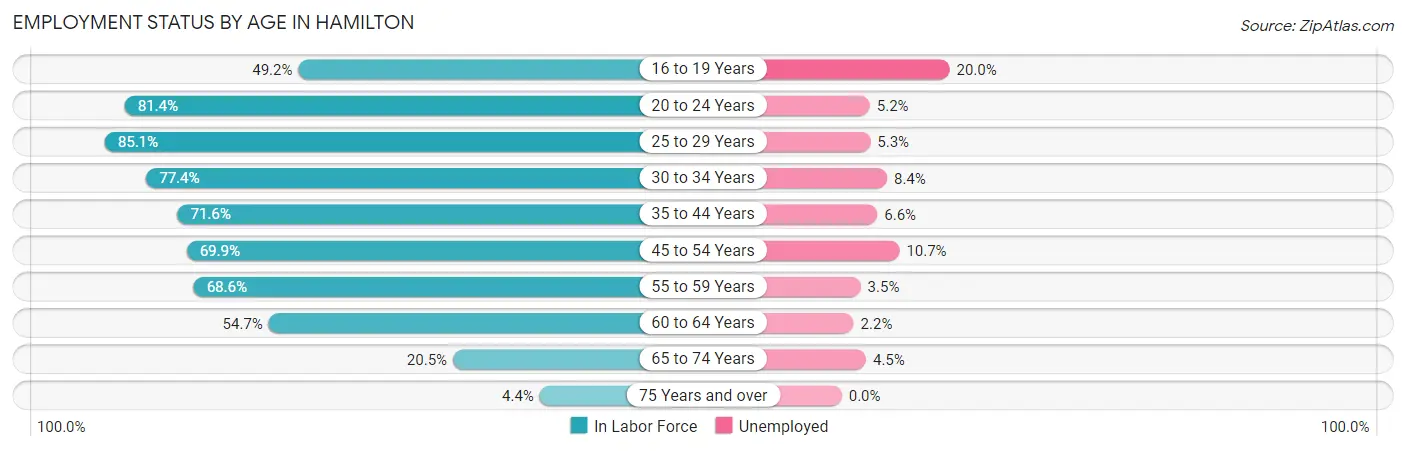
| Age Bracket | In Labor Force | Unemployed |
| 16 to 19 Years | 1,360 (49.2%) | 272 (20.0%) |
| 20 to 24 Years | 4,505 (81.4%) | 234 (5.2%) |
| 25 to 29 Years | 4,310 (85.1%) | 228 (5.3%) |
| 30 to 34 Years | 3,604 (77.4%) | 303 (8.4%) |
| 35 to 44 Years | 5,467 (71.6%) | 361 (6.6%) |
| 45 to 54 Years | 4,655 (69.9%) | 498 (10.7%) |
| 55 to 59 Years | 2,784 (68.6%) | 97 (3.5%) |
| 60 to 64 Years | 2,034 (54.7%) | 45 (2.2%) |
| 65 to 74 Years | 1,167 (20.5%) | 53 (4.5%) |
| 75 Years and over | 172 (4.4%) | 0 (0.0%) |
| Total | 30,070 (60.5%) | 2,105 (7.0%) |
Employment Status by Educational Attainment in Hamilton
According to labor force statistics for Hamilton, 71.9% of individuals (22,860) out of the total population between 25 and 64 years of age (31,794) are in the labor force, with 6.7% or 1,532 of them being unemployed. The group with the highest labor force participation rate are those with the educational attainment of bachelor's degree or higher, with 83.6% or 3,789 individuals in the labor force. Within the labor force, individuals with less than high school education have the highest percentage of unemployment, with 15.5% or 379 of them being unemployed.
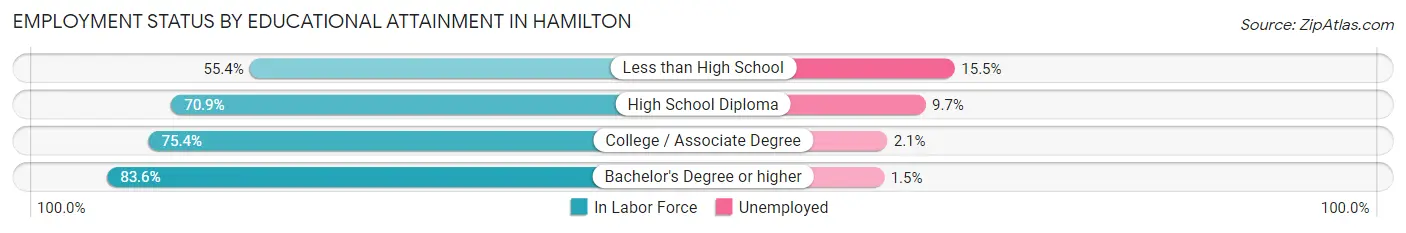
| Educational Attainment | In Labor Force | Unemployed |
| Less than High School | 2,442 (55.4%) | 683 (15.5%) |
| High School Diploma | 9,708 (70.9%) | 1,328 (9.7%) |
| College / Associate Degree | 6,907 (75.4%) | 192 (2.1%) |
| Bachelor's Degree or higher | 3,789 (83.6%) | 68 (1.5%) |
| Total | 22,860 (71.9%) | 2,130 (6.7%) |
Employment Occupations by Sex in Hamilton
Management, Business, Science and Arts Occupations
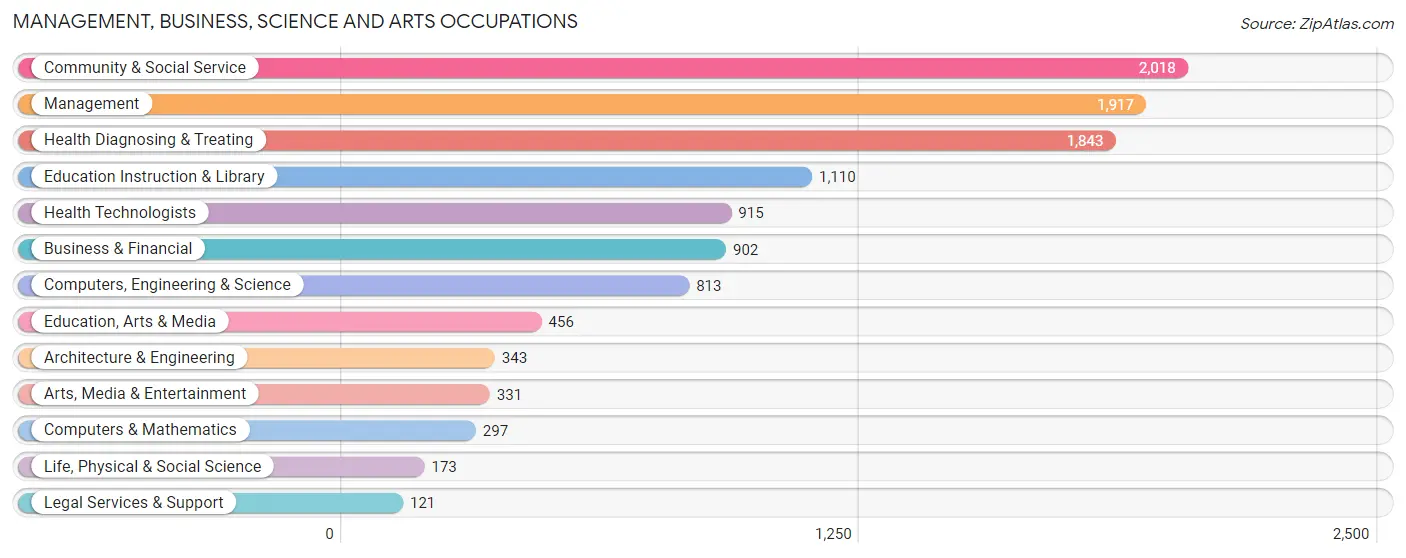
The most common Management, Business, Science and Arts occupations in Hamilton are Community & Social Service (2,018 | 7.2%), Management (1,917 | 6.9%), Health Diagnosing & Treating (1,843 | 6.6%), Education Instruction & Library (1,110 | 4.0%), and Health Technologists (915 | 3.3%).
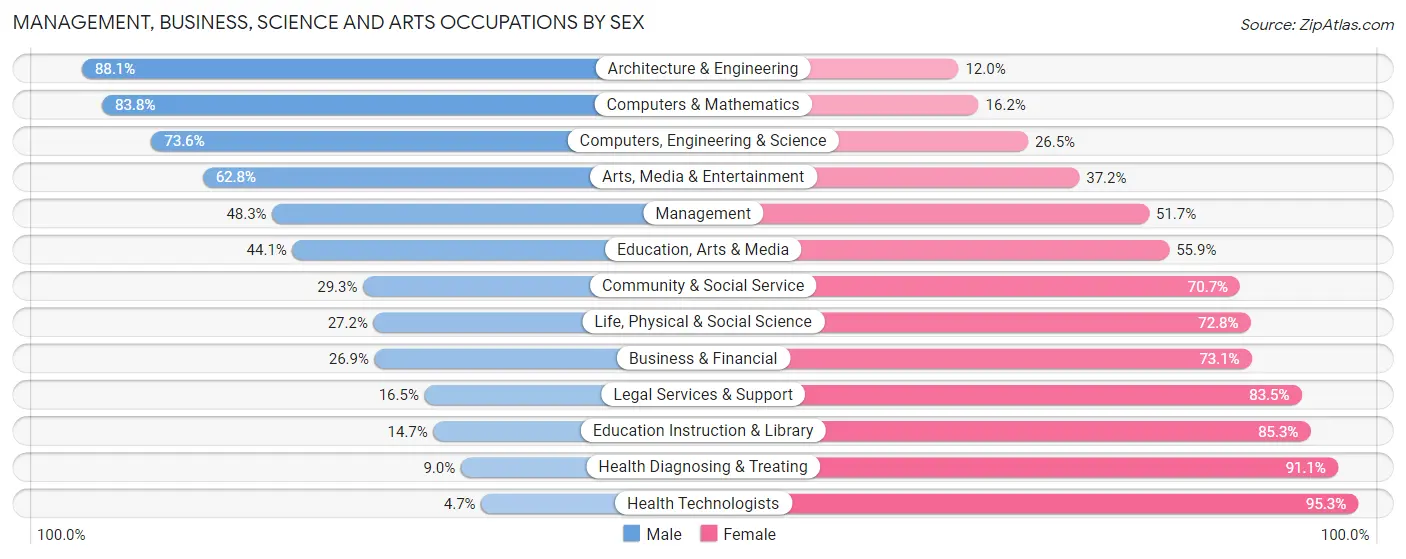
Management, Business, Science and Arts Occupations by Sex
Within the Management, Business, Science and Arts occupations in Hamilton, the most male-oriented occupations are Architecture & Engineering (88.0%), Computers & Mathematics (83.8%), and Computers, Engineering & Science (73.6%), while the most female-oriented occupations are Health Technologists (95.3%), Health Diagnosing & Treating (91.0%), and Education Instruction & Library (85.3%).
| Occupation | Male | Female |
| Management | 926 (48.3%) | 991 (51.7%) |
| Business & Financial | 243 (26.9%) | 659 (73.1%) |
| Computers, Engineering & Science | 598 (73.6%) | 215 (26.5%) |
| Computers & Mathematics | 249 (83.8%) | 48 (16.2%) |
| Architecture & Engineering | 302 (88.0%) | 41 (11.9%) |
| Life, Physical & Social Science | 47 (27.2%) | 126 (72.8%) |
| Community & Social Service | 592 (29.3%) | 1,426 (70.7%) |
| Education, Arts & Media | 201 (44.1%) | 255 (55.9%) |
| Legal Services & Support | 20 (16.5%) | 101 (83.5%) |
| Education Instruction & Library | 163 (14.7%) | 947 (85.3%) |
| Arts, Media & Entertainment | 208 (62.8%) | 123 (37.2%) |
| Health Diagnosing & Treating | 165 (8.9%) | 1,678 (91.0%) |
| Health Technologists | 43 (4.7%) | 872 (95.3%) |
| Total (Category) | 2,524 (33.7%) | 4,969 (66.3%) |
| Total (Overall) | 14,116 (50.5%) | 13,847 (49.5%) |
Services Occupations
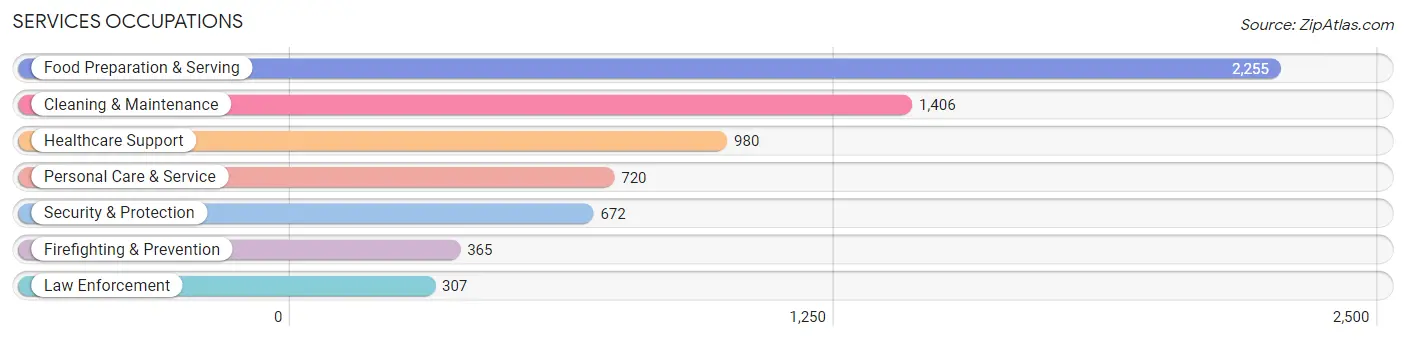
The most common Services occupations in Hamilton are Food Preparation & Serving (2,255 | 8.1%), Cleaning & Maintenance (1,406 | 5.0%), Healthcare Support (980 | 3.5%), Personal Care & Service (720 | 2.6%), and Security & Protection (672 | 2.4%).
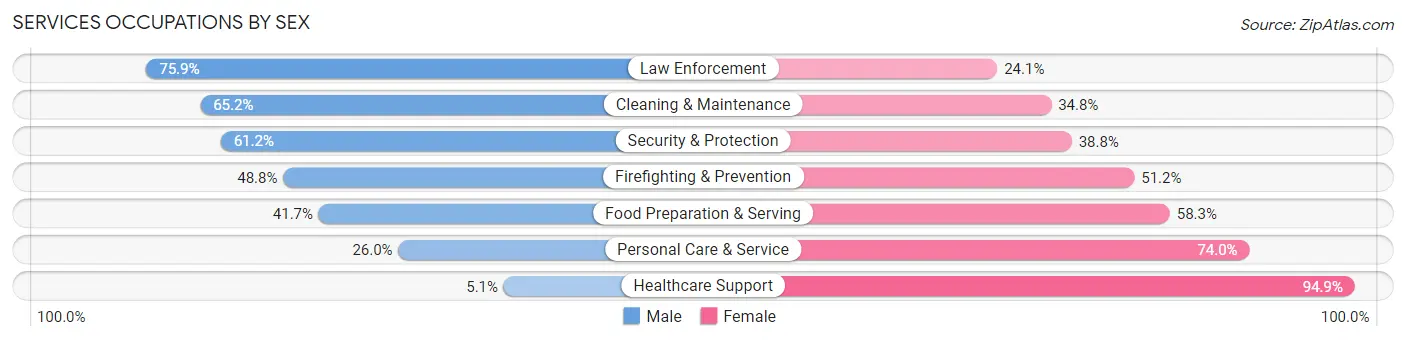
Services Occupations by Sex
Within the Services occupations in Hamilton, the most male-oriented occupations are Law Enforcement (75.9%), Cleaning & Maintenance (65.2%), and Security & Protection (61.2%), while the most female-oriented occupations are Healthcare Support (94.9%), Personal Care & Service (74.0%), and Food Preparation & Serving (58.3%).
| Occupation | Male | Female |
| Healthcare Support | 50 (5.1%) | 930 (94.9%) |
| Security & Protection | 411 (61.2%) | 261 (38.8%) |
| Firefighting & Prevention | 178 (48.8%) | 187 (51.2%) |
| Law Enforcement | 233 (75.9%) | 74 (24.1%) |
| Food Preparation & Serving | 941 (41.7%) | 1,314 (58.3%) |
| Cleaning & Maintenance | 917 (65.2%) | 489 (34.8%) |
| Personal Care & Service | 187 (26.0%) | 533 (74.0%) |
| Total (Category) | 2,506 (41.5%) | 3,527 (58.5%) |
| Total (Overall) | 14,116 (50.5%) | 13,847 (49.5%) |
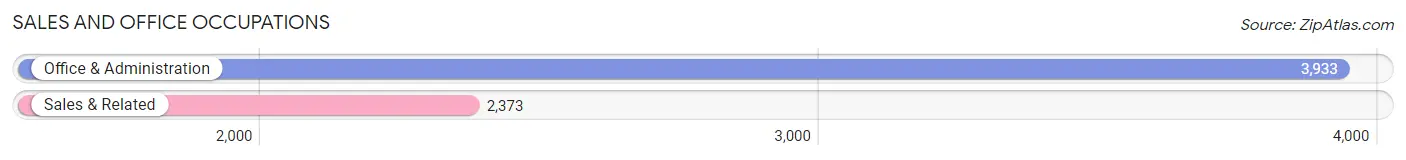
Sales and Office Occupations
The most common Sales and Office occupations in Hamilton are Office & Administration (3,933 | 14.1%), and Sales & Related (2,373 | 8.5%).
Sales and Office Occupations by Sex
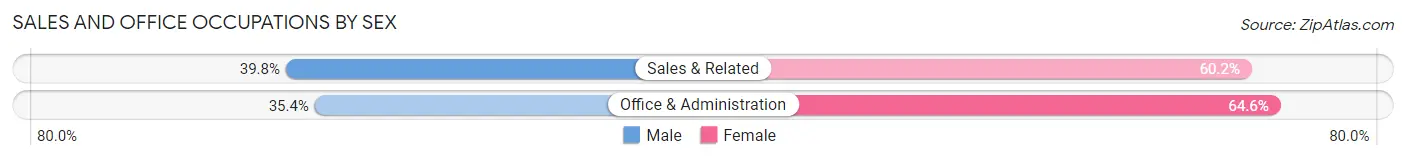
| Occupation | Male | Female |
| Sales & Related | 945 (39.8%) | 1,428 (60.2%) |
| Office & Administration | 1,391 (35.4%) | 2,542 (64.6%) |
| Total (Category) | 2,336 (37.0%) | 3,970 (63.0%) |
| Total (Overall) | 14,116 (50.5%) | 13,847 (49.5%) |
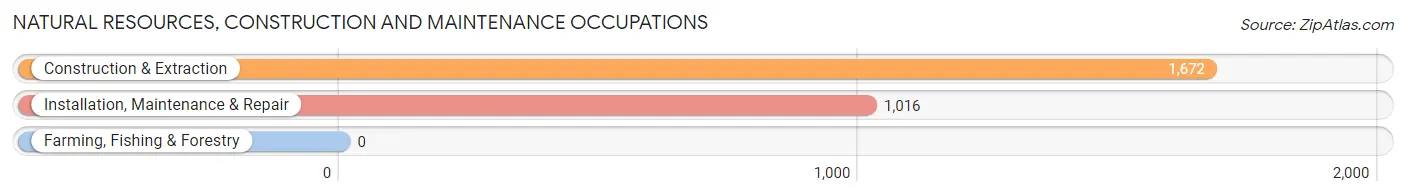
Natural Resources, Construction and Maintenance Occupations
The most common Natural Resources, Construction and Maintenance occupations in Hamilton are Construction & Extraction (1,672 | 6.0%), and Installation, Maintenance & Repair (1,016 | 3.6%).
Natural Resources, Construction and Maintenance Occupations by Sex
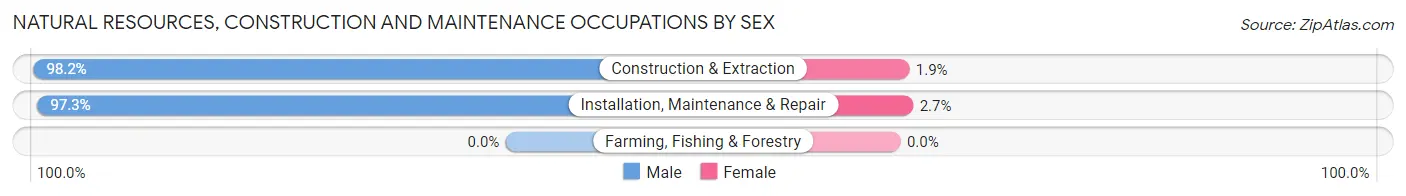
| Occupation | Male | Female |
| Farming, Fishing & Forestry | 0 (0.0%) | 0 (0.0%) |
| Construction & Extraction | 1,641 (98.2%) | 31 (1.8%) |
| Installation, Maintenance & Repair | 989 (97.3%) | 27 (2.7%) |
| Total (Category) | 2,630 (97.8%) | 58 (2.2%) |
| Total (Overall) | 14,116 (50.5%) | 13,847 (49.5%) |
Production, Transportation and Moving Occupations
The most common Production, Transportation and Moving occupations in Hamilton are Production (2,659 | 9.5%), Material Moving (1,562 | 5.6%), and Transportation (1,222 | 4.4%).

Production, Transportation and Moving Occupations by Sex
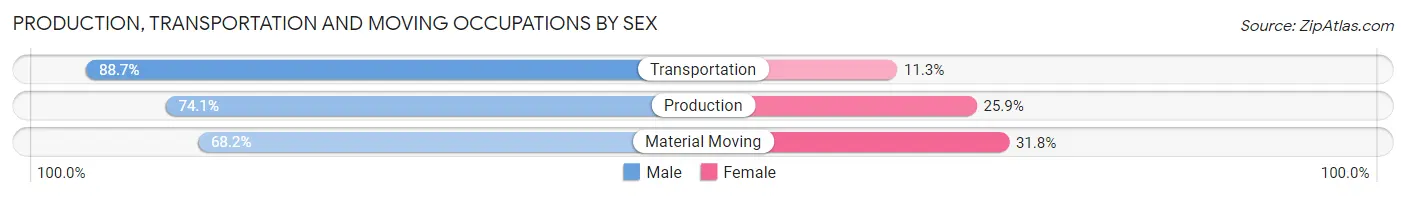
| Occupation | Male | Female |
| Production | 1,971 (74.1%) | 688 (25.9%) |
| Transportation | 1,084 (88.7%) | 138 (11.3%) |
| Material Moving | 1,065 (68.2%) | 497 (31.8%) |
| Total (Category) | 4,120 (75.7%) | 1,323 (24.3%) |
| Total (Overall) | 14,116 (50.5%) | 13,847 (49.5%) |
Employment Industries by Sex in Hamilton
Employment Industries in Hamilton
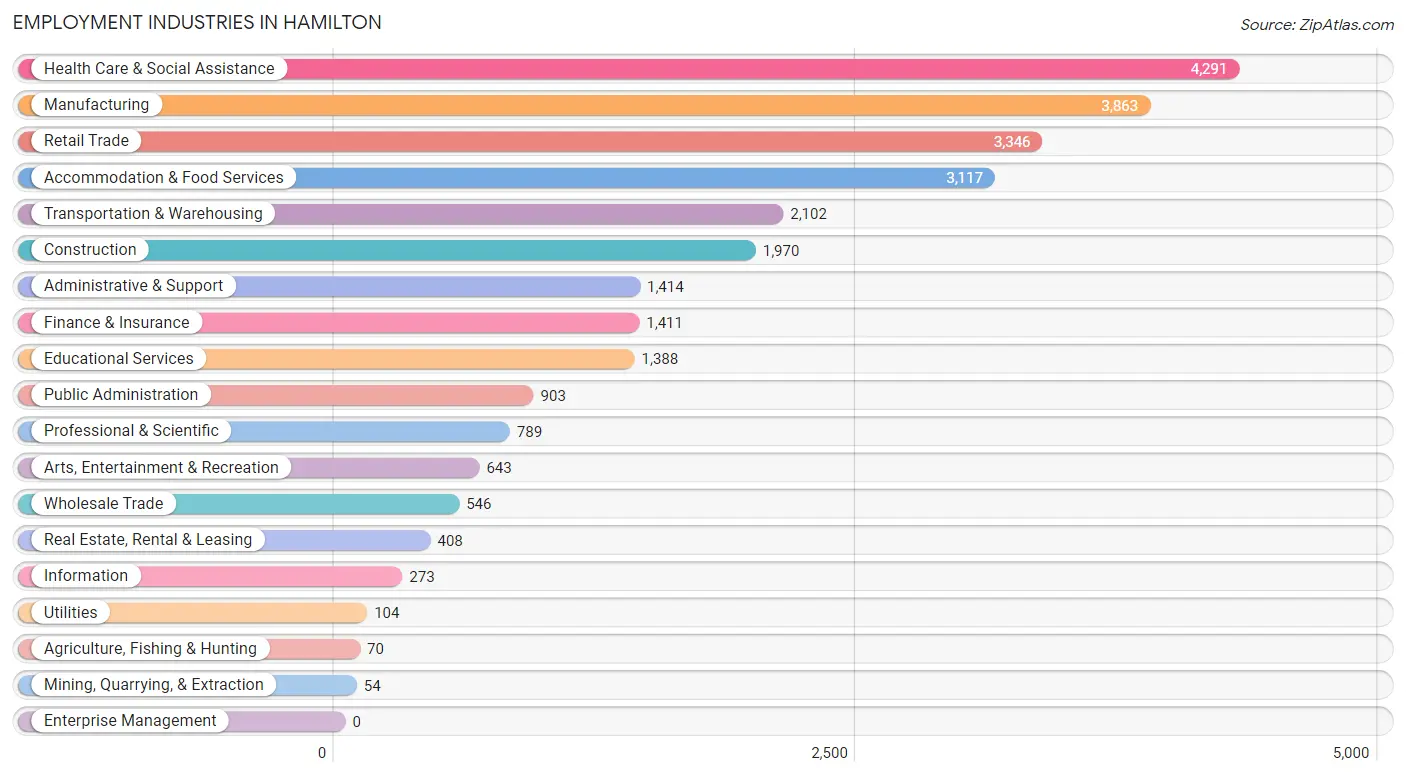
The major employment industries in Hamilton include Health Care & Social Assistance (4,291 | 15.3%), Manufacturing (3,863 | 13.8%), Retail Trade (3,346 | 12.0%), Accommodation & Food Services (3,117 | 11.2%), and Transportation & Warehousing (2,102 | 7.5%).
Employment Industries by Sex in Hamilton
The Hamilton industries that see more men than women are Agriculture, Fishing & Hunting (100.0%), Mining, Quarrying, & Extraction (100.0%), and Utilities (100.0%), whereas the industries that tend to have a higher number of women are Health Care & Social Assistance (88.0%), Finance & Insurance (86.9%), and Educational Services (76.2%).
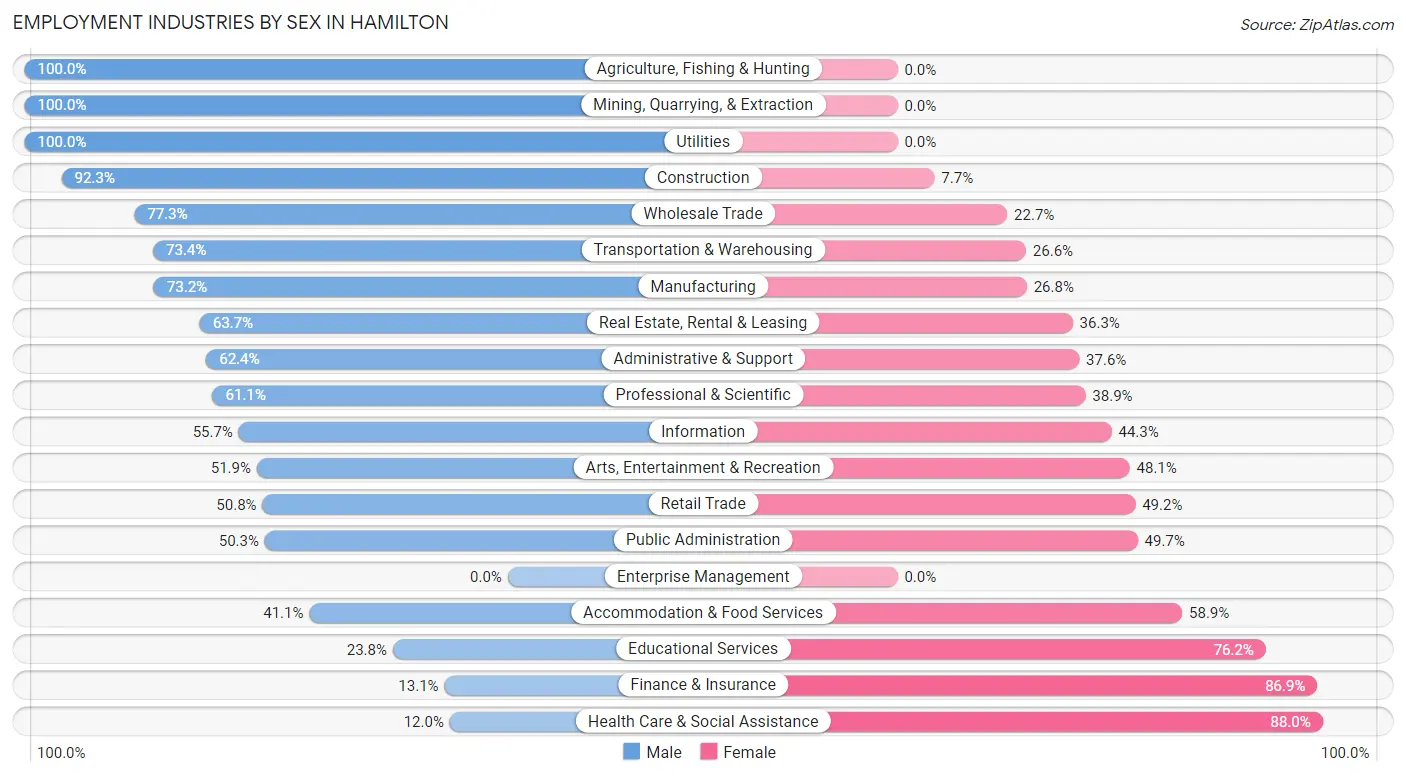
| Industry | Male | Female |
| Agriculture, Fishing & Hunting | 70 (100.0%) | 0 (0.0%) |
| Mining, Quarrying, & Extraction | 54 (100.0%) | 0 (0.0%) |
| Construction | 1,819 (92.3%) | 151 (7.7%) |
| Manufacturing | 2,829 (73.2%) | 1,034 (26.8%) |
| Wholesale Trade | 422 (77.3%) | 124 (22.7%) |
| Retail Trade | 1,699 (50.8%) | 1,647 (49.2%) |
| Transportation & Warehousing | 1,543 (73.4%) | 559 (26.6%) |
| Utilities | 104 (100.0%) | 0 (0.0%) |
| Information | 152 (55.7%) | 121 (44.3%) |
| Finance & Insurance | 185 (13.1%) | 1,226 (86.9%) |
| Real Estate, Rental & Leasing | 260 (63.7%) | 148 (36.3%) |
| Professional & Scientific | 482 (61.1%) | 307 (38.9%) |
| Enterprise Management | 0 (0.0%) | 0 (0.0%) |
| Administrative & Support | 882 (62.4%) | 532 (37.6%) |
| Educational Services | 330 (23.8%) | 1,058 (76.2%) |
| Health Care & Social Assistance | 515 (12.0%) | 3,776 (88.0%) |
| Arts, Entertainment & Recreation | 334 (51.9%) | 309 (48.1%) |
| Accommodation & Food Services | 1,280 (41.1%) | 1,837 (58.9%) |
| Public Administration | 454 (50.3%) | 449 (49.7%) |
| Total | 14,116 (50.5%) | 13,847 (49.5%) |
Education in Hamilton
School Enrollment in Hamilton
The most common levels of schooling among the 14,044 students in Hamilton are middle school (3,492 | 24.9%), high school (3,092 | 22.0%), and elementary school (3,000 | 21.4%).
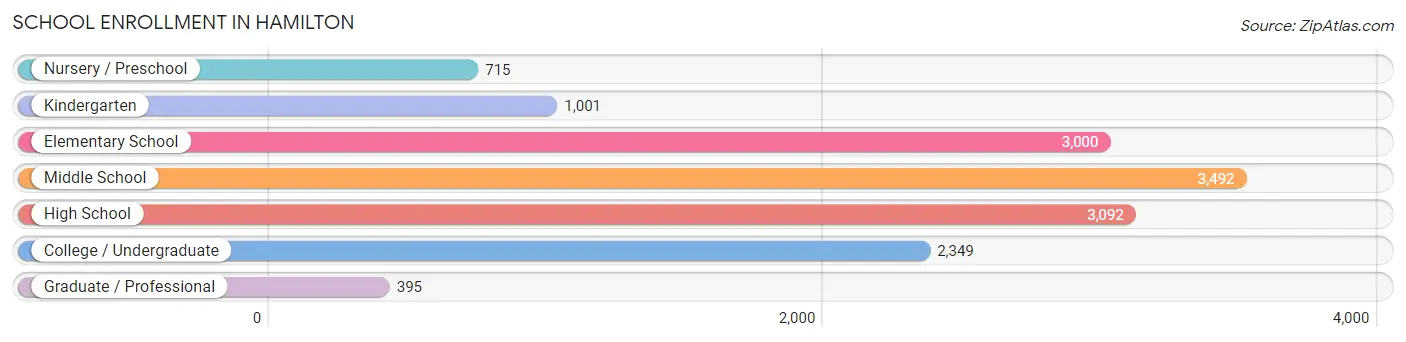
| School Level | # Students | % Students |
| Nursery / Preschool | 715 | 5.1% |
| Kindergarten | 1,001 | 7.1% |
| Elementary School | 3,000 | 21.4% |
| Middle School | 3,492 | 24.9% |
| High School | 3,092 | 22.0% |
| College / Undergraduate | 2,349 | 16.7% |
| Graduate / Professional | 395 | 2.8% |
| Total | 14,044 | 100.0% |
School Enrollment by Age by Funding Source in Hamilton
Out of a total of 14,044 students who are enrolled in schools in Hamilton, 1,615 (11.5%) attend a private institution, while the remaining 12,429 (88.5%) are enrolled in public schools. The age group of 20 to 24 year olds has the highest likelihood of being enrolled in private schools, with 276 (23.2% in the age bracket) enrolled. Conversely, the age group of 10 to 14 year olds has the lowest likelihood of being enrolled in a private school, with 4,010 (94.0% in the age bracket) attending a public institution.
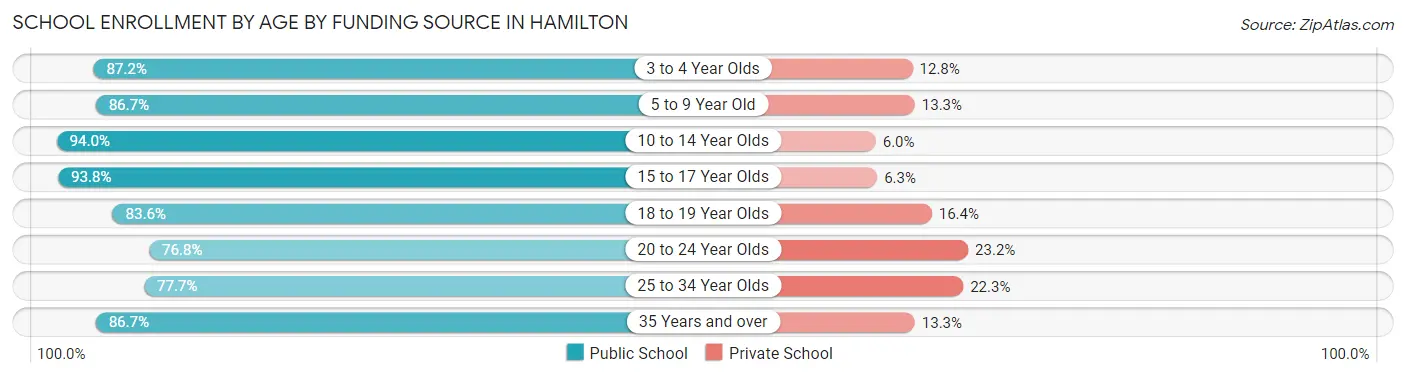
| Age Bracket | Public School | Private School |
| 3 to 4 Year Olds | 482 (87.2%) | 71 (12.8%) |
| 5 to 9 Year Old | 3,421 (86.7%) | 523 (13.3%) |
| 10 to 14 Year Olds | 4,010 (94.0%) | 255 (6.0%) |
| 15 to 17 Year Olds | 1,980 (93.8%) | 132 (6.2%) |
| 18 to 19 Year Olds | 545 (83.6%) | 107 (16.4%) |
| 20 to 24 Year Olds | 914 (76.8%) | 276 (23.2%) |
| 25 to 34 Year Olds | 698 (77.7%) | 200 (22.3%) |
| 35 Years and over | 373 (86.7%) | 57 (13.3%) |
| Total | 12,429 (88.5%) | 1,615 (11.5%) |
Educational Attainment by Field of Study in Hamilton
Business (1,433 | 20.9%), education (1,255 | 18.3%), science & technology (749 | 10.9%), communications (464 | 6.8%), and arts & humanities (460 | 6.7%) are the most common fields of study among 6,845 individuals in Hamilton who have obtained a bachelor's degree or higher.
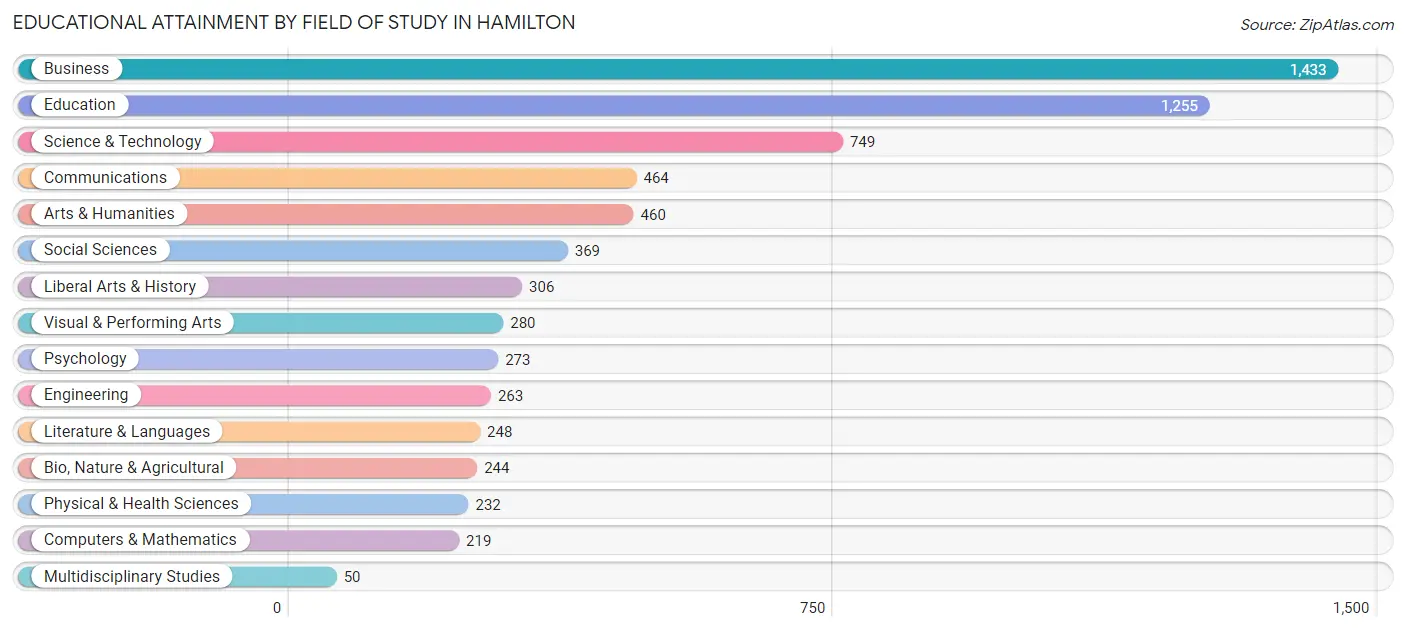
| Field of Study | # Graduates | % Graduates |
| Computers & Mathematics | 219 | 3.2% |
| Bio, Nature & Agricultural | 244 | 3.6% |
| Physical & Health Sciences | 232 | 3.4% |
| Psychology | 273 | 4.0% |
| Social Sciences | 369 | 5.4% |
| Engineering | 263 | 3.8% |
| Multidisciplinary Studies | 50 | 0.7% |
| Science & Technology | 749 | 10.9% |
| Business | 1,433 | 20.9% |
| Education | 1,255 | 18.3% |
| Literature & Languages | 248 | 3.6% |
| Liberal Arts & History | 306 | 4.5% |
| Visual & Performing Arts | 280 | 4.1% |
| Communications | 464 | 6.8% |
| Arts & Humanities | 460 | 6.7% |
| Total | 6,845 | 100.0% |
Transportation & Commute in Hamilton
Vehicle Availability by Sex in Hamilton
The most prevalent vehicle ownership categories in Hamilton are males with 2 vehicles (6,117, accounting for 44.2%) and females with 2 vehicles (6,175, making up 45.3%).
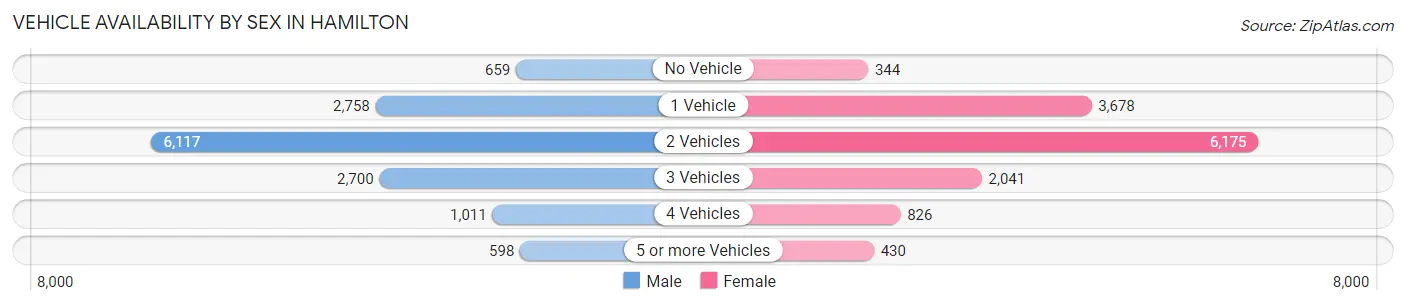
| Vehicles Available | Male | Female |
| No Vehicle | 659 (4.8%) | 344 (2.5%) |
| 1 Vehicle | 2,758 (19.9%) | 3,678 (27.3%) |
| 2 Vehicles | 6,117 (44.2%) | 6,175 (45.8%) |
| 3 Vehicles | 2,700 (19.5%) | 2,041 (15.1%) |
| 4 Vehicles | 1,011 (7.3%) | 826 (6.1%) |
| 5 or more Vehicles | 598 (4.3%) | 430 (3.2%) |
| Total | 13,843 (100.0%) | 13,494 (100.0%) |
Commute Time in Hamilton
The most frequently occuring commute durations in Hamilton are 20 to 24 minutes (4,320 commuters, 16.7%), 10 to 14 minutes (3,641 commuters, 14.1%), and 30 to 34 minutes (3,489 commuters, 13.5%).
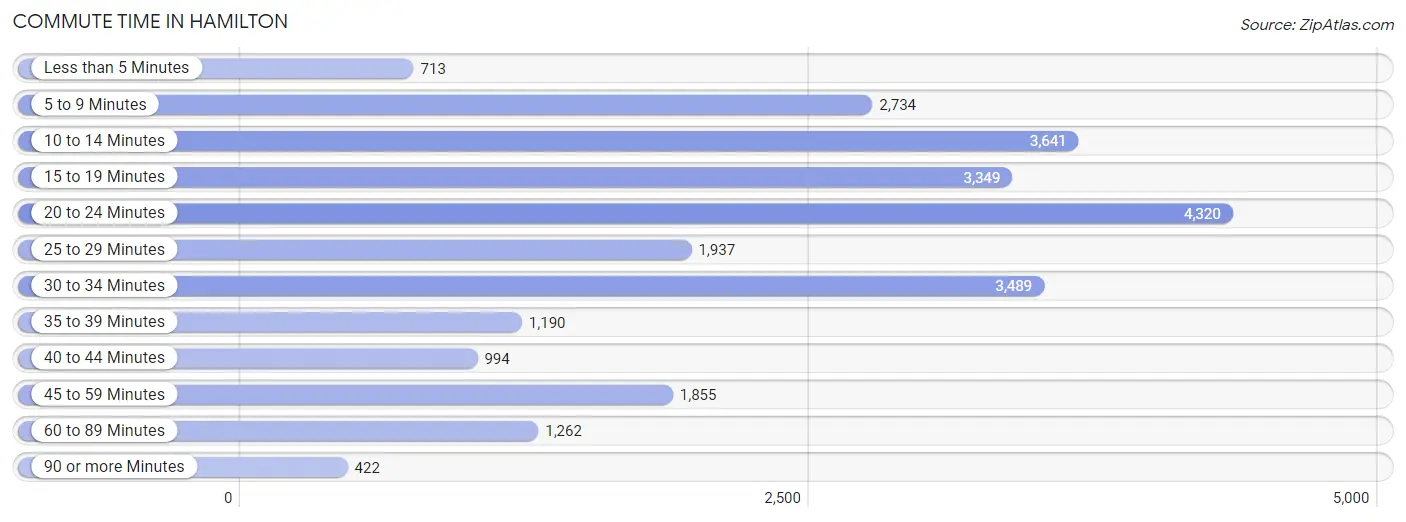
| Commute Time | # Commuters | % Commuters |
| Less than 5 Minutes | 713 | 2.8% |
| 5 to 9 Minutes | 2,734 | 10.5% |
| 10 to 14 Minutes | 3,641 | 14.1% |
| 15 to 19 Minutes | 3,349 | 12.9% |
| 20 to 24 Minutes | 4,320 | 16.7% |
| 25 to 29 Minutes | 1,937 | 7.5% |
| 30 to 34 Minutes | 3,489 | 13.5% |
| 35 to 39 Minutes | 1,190 | 4.6% |
| 40 to 44 Minutes | 994 | 3.8% |
| 45 to 59 Minutes | 1,855 | 7.2% |
| 60 to 89 Minutes | 1,262 | 4.9% |
| 90 or more Minutes | 422 | 1.6% |
Commute Time by Sex in Hamilton
The most common commute times in Hamilton are 30 to 34 minutes (2,183 commuters, 16.5%) for males and 20 to 24 minutes (2,204 commuters, 17.4%) for females.
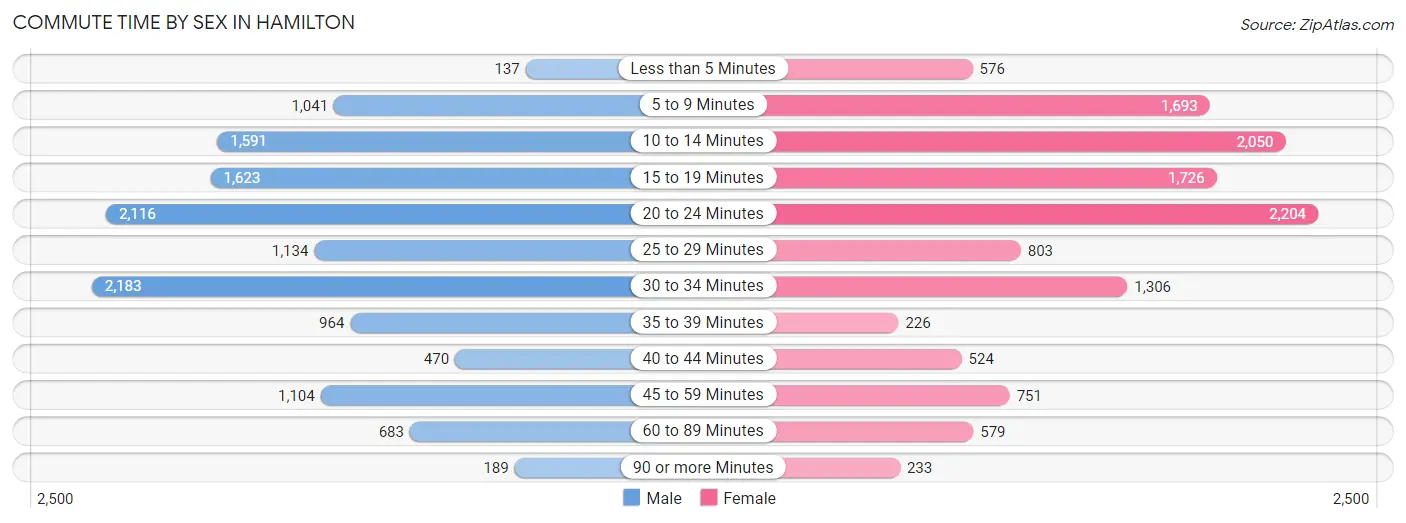
| Commute Time | Male | Female |
| Less than 5 Minutes | 137 (1.0%) | 576 (4.5%) |
| 5 to 9 Minutes | 1,041 (7.9%) | 1,693 (13.4%) |
| 10 to 14 Minutes | 1,591 (12.0%) | 2,050 (16.2%) |
| 15 to 19 Minutes | 1,623 (12.3%) | 1,726 (13.6%) |
| 20 to 24 Minutes | 2,116 (16.0%) | 2,204 (17.4%) |
| 25 to 29 Minutes | 1,134 (8.6%) | 803 (6.3%) |
| 30 to 34 Minutes | 2,183 (16.5%) | 1,306 (10.3%) |
| 35 to 39 Minutes | 964 (7.3%) | 226 (1.8%) |
| 40 to 44 Minutes | 470 (3.5%) | 524 (4.1%) |
| 45 to 59 Minutes | 1,104 (8.3%) | 751 (5.9%) |
| 60 to 89 Minutes | 683 (5.2%) | 579 (4.6%) |
| 90 or more Minutes | 189 (1.4%) | 233 (1.8%) |
Time of Departure to Work by Sex in Hamilton
The most frequent times of departure to work in Hamilton are 7:00 AM to 7:29 AM (1,848, 14.0%) for males and 7:00 AM to 7:29 AM (1,773, 14.0%) for females.
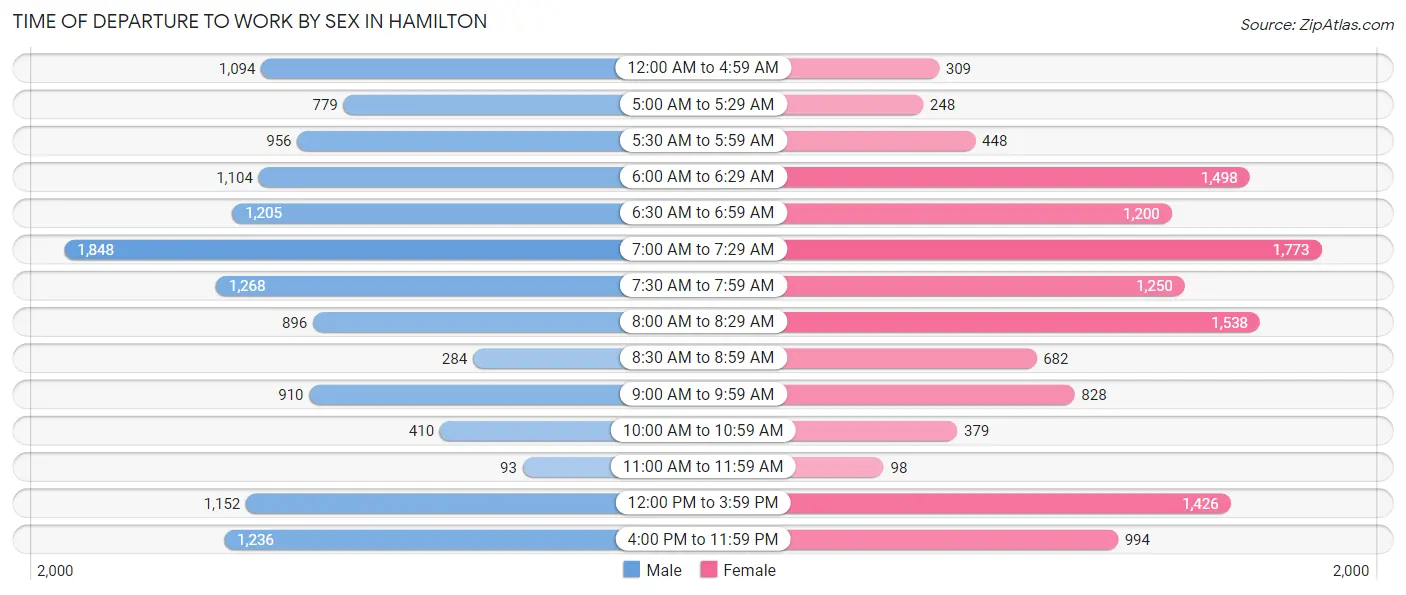
| Time of Departure | Male | Female |
| 12:00 AM to 4:59 AM | 1,094 (8.3%) | 309 (2.4%) |
| 5:00 AM to 5:29 AM | 779 (5.9%) | 248 (2.0%) |
| 5:30 AM to 5:59 AM | 956 (7.2%) | 448 (3.5%) |
| 6:00 AM to 6:29 AM | 1,104 (8.3%) | 1,498 (11.8%) |
| 6:30 AM to 6:59 AM | 1,205 (9.1%) | 1,200 (9.5%) |
| 7:00 AM to 7:29 AM | 1,848 (14.0%) | 1,773 (14.0%) |
| 7:30 AM to 7:59 AM | 1,268 (9.6%) | 1,250 (9.9%) |
| 8:00 AM to 8:29 AM | 896 (6.8%) | 1,538 (12.1%) |
| 8:30 AM to 8:59 AM | 284 (2.1%) | 682 (5.4%) |
| 9:00 AM to 9:59 AM | 910 (6.9%) | 828 (6.5%) |
| 10:00 AM to 10:59 AM | 410 (3.1%) | 379 (3.0%) |
| 11:00 AM to 11:59 AM | 93 (0.7%) | 98 (0.8%) |
| 12:00 PM to 3:59 PM | 1,152 (8.7%) | 1,426 (11.3%) |
| 4:00 PM to 11:59 PM | 1,236 (9.3%) | 994 (7.8%) |
| Total | 13,235 (100.0%) | 12,671 (100.0%) |
Housing Occupancy in Hamilton
Occupancy by Ownership in Hamilton
Of the total 24,700 dwellings in Hamilton, owner-occupied units account for 13,486 (54.6%), while renter-occupied units make up 11,214 (45.4%).
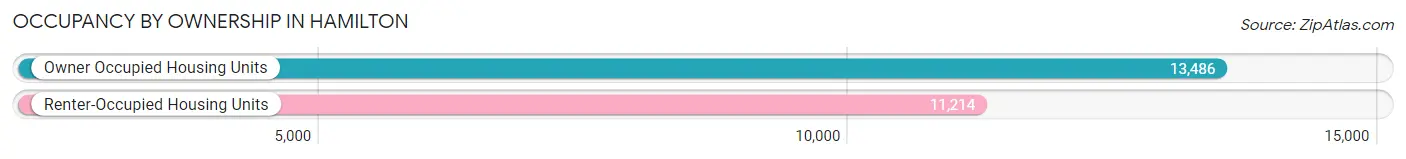
| Occupancy | # Housing Units | % Housing Units |
| Owner Occupied Housing Units | 13,486 | 54.6% |
| Renter-Occupied Housing Units | 11,214 | 45.4% |
| Total Occupied Housing Units | 24,700 | 100.0% |
Occupancy by Household Size in Hamilton
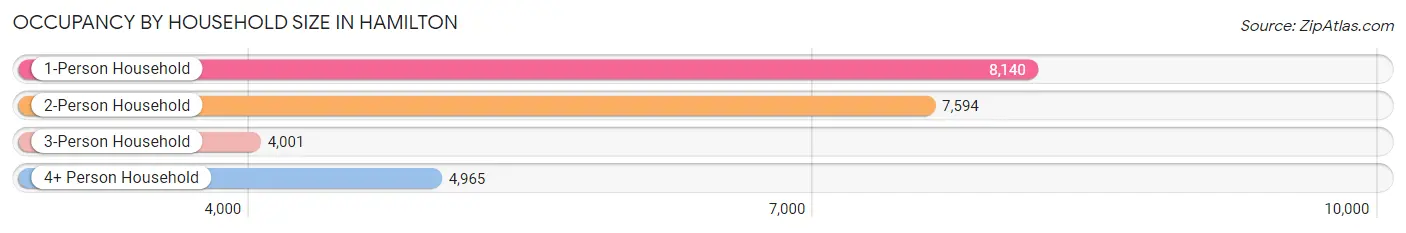
| Household Size | # Housing Units | % Housing Units |
| 1-Person Household | 8,140 | 33.0% |
| 2-Person Household | 7,594 | 30.7% |
| 3-Person Household | 4,001 | 16.2% |
| 4+ Person Household | 4,965 | 20.1% |
| Total Housing Units | 24,700 | 100.0% |
Occupancy by Ownership by Household Size in Hamilton
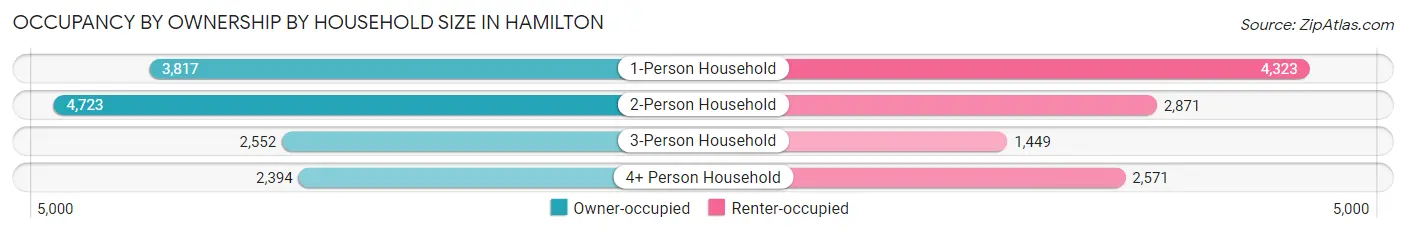
| Household Size | Owner-occupied | Renter-occupied |
| 1-Person Household | 3,817 (46.9%) | 4,323 (53.1%) |
| 2-Person Household | 4,723 (62.2%) | 2,871 (37.8%) |
| 3-Person Household | 2,552 (63.8%) | 1,449 (36.2%) |
| 4+ Person Household | 2,394 (48.2%) | 2,571 (51.8%) |
| Total Housing Units | 13,486 (54.6%) | 11,214 (45.4%) |
Occupancy by Educational Attainment in Hamilton
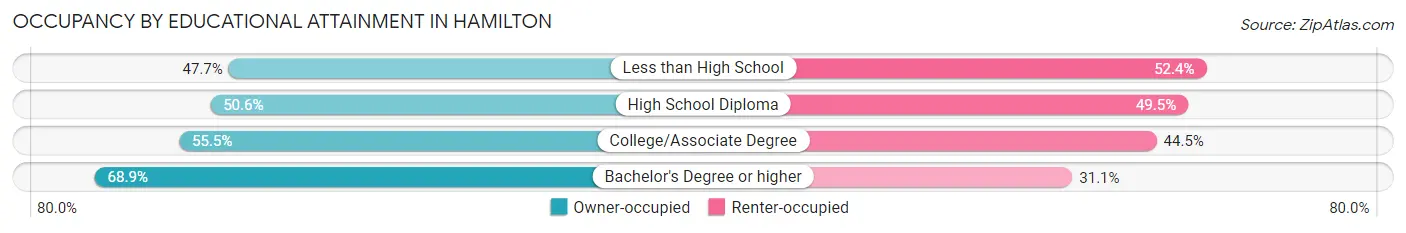
| Household Size | Owner-occupied | Renter-occupied |
| Less than High School | 1,427 (47.6%) | 1,568 (52.3%) |
| High School Diploma | 5,130 (50.5%) | 5,018 (49.4%) |
| College/Associate Degree | 4,282 (55.5%) | 3,432 (44.5%) |
| Bachelor's Degree or higher | 2,647 (68.9%) | 1,196 (31.1%) |
Occupancy by Age of Householder in Hamilton
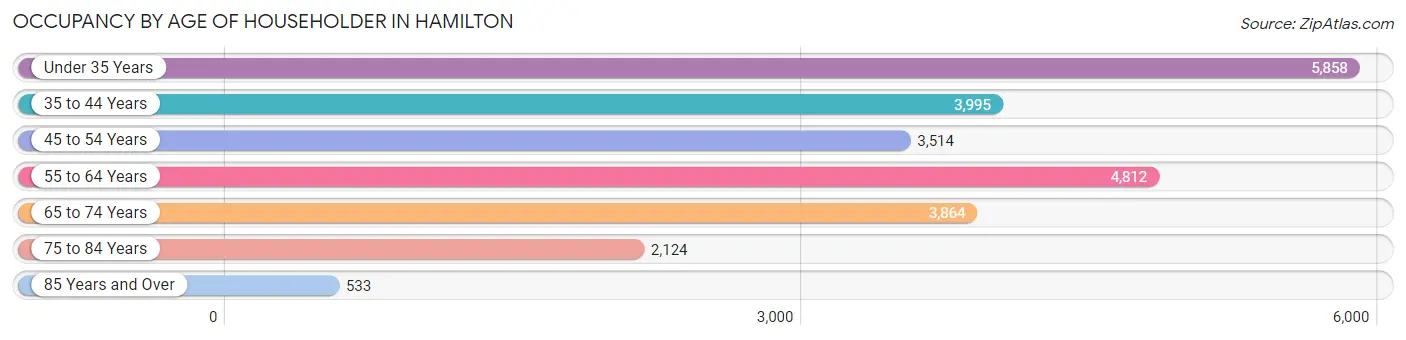
| Age Bracket | # Households | % Households |
| Under 35 Years | 5,858 | 23.7% |
| 35 to 44 Years | 3,995 | 16.2% |
| 45 to 54 Years | 3,514 | 14.2% |
| 55 to 64 Years | 4,812 | 19.5% |
| 65 to 74 Years | 3,864 | 15.6% |
| 75 to 84 Years | 2,124 | 8.6% |
| 85 Years and Over | 533 | 2.2% |
| Total | 24,700 | 100.0% |
Housing Finances in Hamilton
Median Income by Occupancy in Hamilton
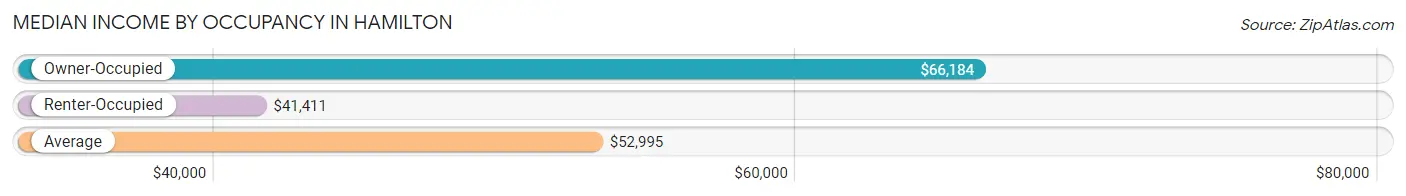
| Occupancy Type | # Households | Median Income |
| Owner-Occupied | 13,486 (54.6%) | $66,184 |
| Renter-Occupied | 11,214 (45.4%) | $41,411 |
| Average | 24,700 (100.0%) | $52,995 |
Occupancy by Householder Income Bracket in Hamilton
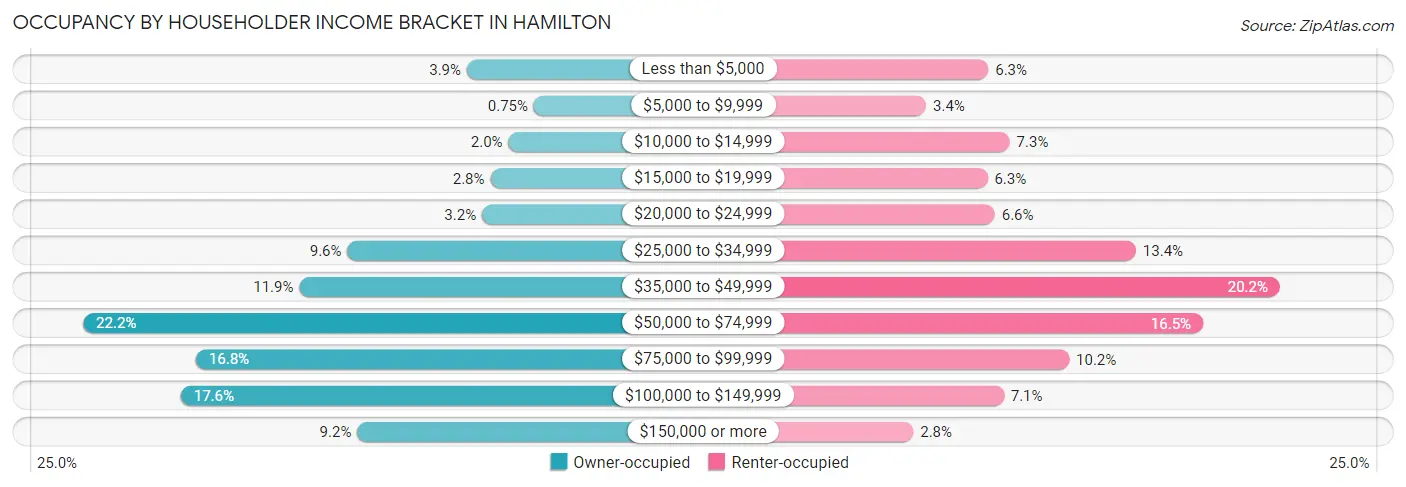
| Income Bracket | Owner-occupied | Renter-occupied |
| Less than $5,000 | 531 (3.9%) | 709 (6.3%) |
| $5,000 to $9,999 | 101 (0.7%) | 377 (3.4%) |
| $10,000 to $14,999 | 264 (2.0%) | 823 (7.3%) |
| $15,000 to $19,999 | 380 (2.8%) | 704 (6.3%) |
| $20,000 to $24,999 | 434 (3.2%) | 744 (6.6%) |
| $25,000 to $34,999 | 1,299 (9.6%) | 1,497 (13.4%) |
| $35,000 to $49,999 | 1,608 (11.9%) | 2,265 (20.2%) |
| $50,000 to $74,999 | 2,995 (22.2%) | 1,855 (16.5%) |
| $75,000 to $99,999 | 2,271 (16.8%) | 1,140 (10.2%) |
| $100,000 to $149,999 | 2,368 (17.6%) | 792 (7.1%) |
| $150,000 or more | 1,235 (9.2%) | 308 (2.8%) |
| Total | 13,486 (100.0%) | 11,214 (100.0%) |
Monthly Housing Cost Tiers in Hamilton
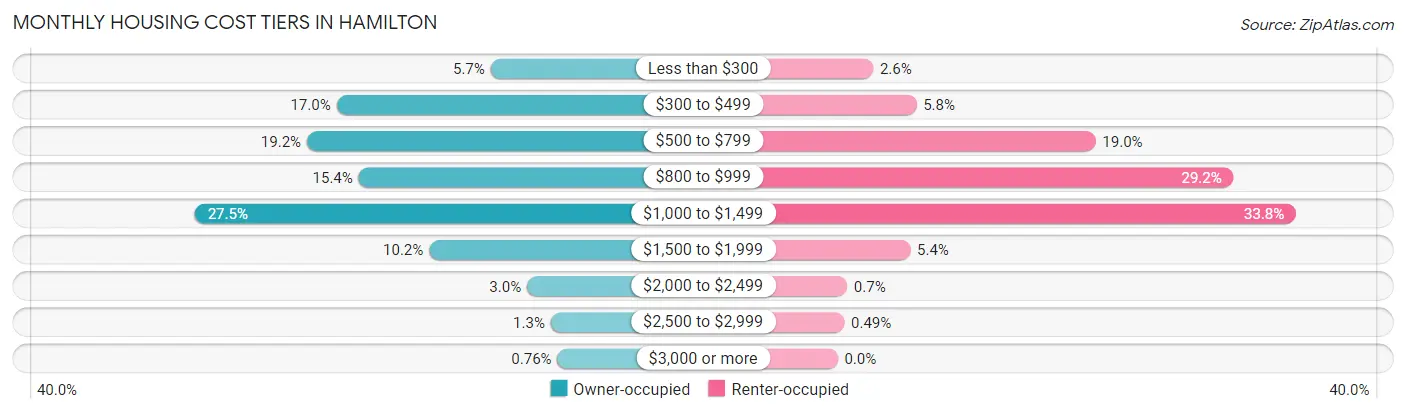
| Monthly Cost | Owner-occupied | Renter-occupied |
| Less than $300 | 766 (5.7%) | 294 (2.6%) |
| $300 to $499 | 2,297 (17.0%) | 650 (5.8%) |
| $500 to $799 | 2,590 (19.2%) | 2,131 (19.0%) |
| $800 to $999 | 2,077 (15.4%) | 3,271 (29.2%) |
| $1,000 to $1,499 | 3,704 (27.5%) | 3,788 (33.8%) |
| $1,500 to $1,999 | 1,377 (10.2%) | 600 (5.3%) |
| $2,000 to $2,499 | 404 (3.0%) | 78 (0.7%) |
| $2,500 to $2,999 | 168 (1.3%) | 55 (0.5%) |
| $3,000 or more | 103 (0.8%) | 0 (0.0%) |
| Total | 13,486 (100.0%) | 11,214 (100.0%) |
Physical Housing Characteristics in Hamilton
Housing Structures in Hamilton
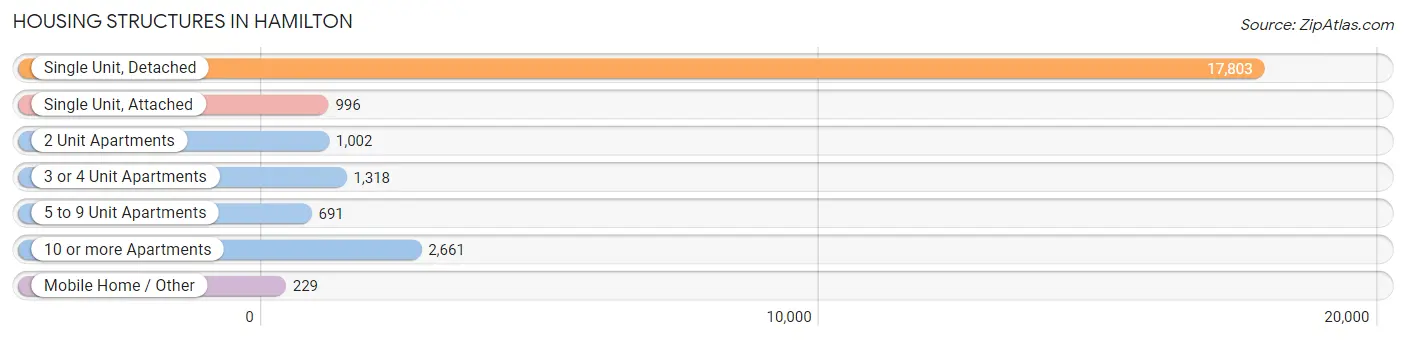
| Structure Type | # Housing Units | % Housing Units |
| Single Unit, Detached | 17,803 | 72.1% |
| Single Unit, Attached | 996 | 4.0% |
| 2 Unit Apartments | 1,002 | 4.1% |
| 3 or 4 Unit Apartments | 1,318 | 5.3% |
| 5 to 9 Unit Apartments | 691 | 2.8% |
| 10 or more Apartments | 2,661 | 10.8% |
| Mobile Home / Other | 229 | 0.9% |
| Total | 24,700 | 100.0% |
Housing Structures by Occupancy in Hamilton
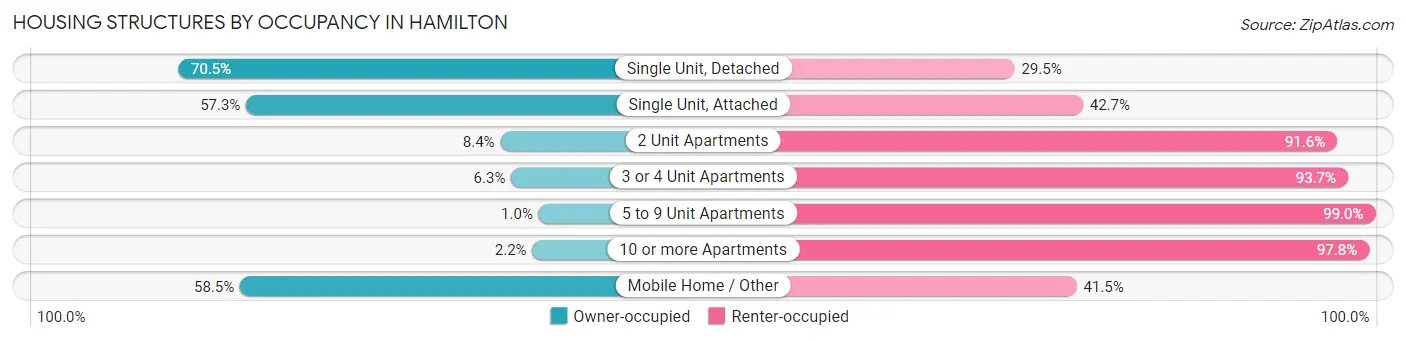
| Structure Type | Owner-occupied | Renter-occupied |
| Single Unit, Detached | 12,548 (70.5%) | 5,255 (29.5%) |
| Single Unit, Attached | 571 (57.3%) | 425 (42.7%) |
| 2 Unit Apartments | 84 (8.4%) | 918 (91.6%) |
| 3 or 4 Unit Apartments | 83 (6.3%) | 1,235 (93.7%) |
| 5 to 9 Unit Apartments | 7 (1.0%) | 684 (99.0%) |
| 10 or more Apartments | 59 (2.2%) | 2,602 (97.8%) |
| Mobile Home / Other | 134 (58.5%) | 95 (41.5%) |
| Total | 13,486 (54.6%) | 11,214 (45.4%) |
Housing Structures by Number of Rooms in Hamilton
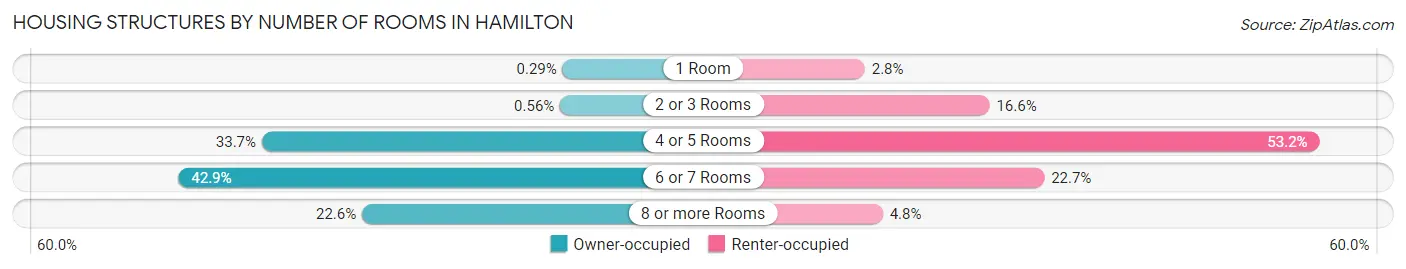
| Number of Rooms | Owner-occupied | Renter-occupied |
| 1 Room | 39 (0.3%) | 310 (2.8%) |
| 2 or 3 Rooms | 76 (0.6%) | 1,862 (16.6%) |
| 4 or 5 Rooms | 4,541 (33.7%) | 5,967 (53.2%) |
| 6 or 7 Rooms | 5,789 (42.9%) | 2,542 (22.7%) |
| 8 or more Rooms | 3,041 (22.6%) | 533 (4.8%) |
| Total | 13,486 (100.0%) | 11,214 (100.0%) |
Housing Structure by Heating Type in Hamilton
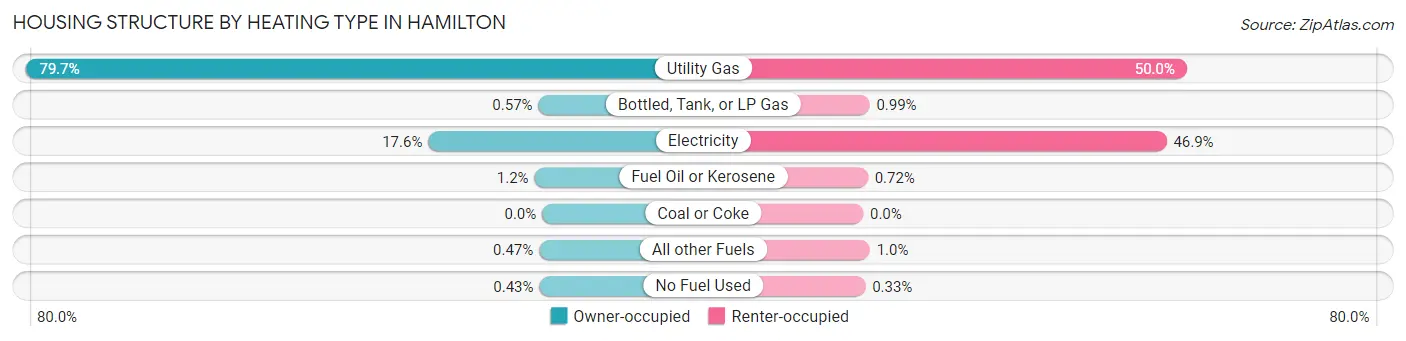
| Heating Type | Owner-occupied | Renter-occupied |
| Utility Gas | 10,753 (79.7%) | 5,611 (50.0%) |
| Bottled, Tank, or LP Gas | 77 (0.6%) | 111 (1.0%) |
| Electricity | 2,374 (17.6%) | 5,259 (46.9%) |
| Fuel Oil or Kerosene | 160 (1.2%) | 81 (0.7%) |
| Coal or Coke | 0 (0.0%) | 0 (0.0%) |
| All other Fuels | 64 (0.5%) | 115 (1.0%) |
| No Fuel Used | 58 (0.4%) | 37 (0.3%) |
| Total | 13,486 (100.0%) | 11,214 (100.0%) |
Household Vehicle Usage in Hamilton
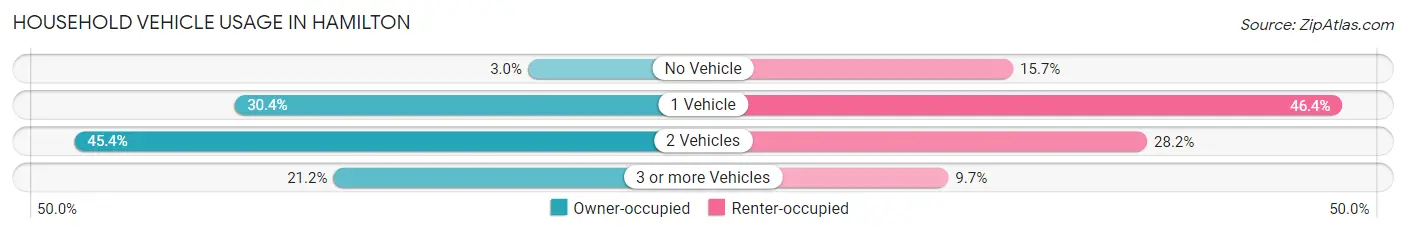
| Vehicles per Household | Owner-occupied | Renter-occupied |
| No Vehicle | 408 (3.0%) | 1,761 (15.7%) |
| 1 Vehicle | 4,104 (30.4%) | 5,207 (46.4%) |
| 2 Vehicles | 6,116 (45.4%) | 3,163 (28.2%) |
| 3 or more Vehicles | 2,858 (21.2%) | 1,083 (9.7%) |
| Total | 13,486 (100.0%) | 11,214 (100.0%) |
Real Estate & Mortgages in Hamilton
Real Estate and Mortgage Overview in Hamilton
| Characteristic | Without Mortgage | With Mortgage |
| Housing Units | 5,498 | 7,988 |
| Median Property Value | $137,500 | $143,000 |
| Median Household Income | $57,271 | $761 |
| Monthly Housing Costs | $478 | $103 |
| Real Estate Taxes | $1,584 | $253 |
Property Value by Mortgage Status in Hamilton
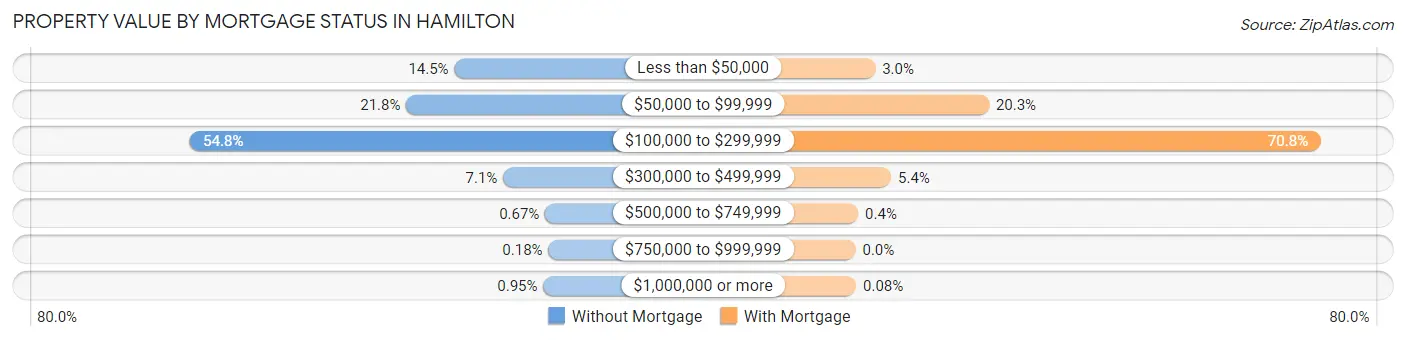
| Property Value | Without Mortgage | With Mortgage |
| Less than $50,000 | 797 (14.5%) | 240 (3.0%) |
| $50,000 to $99,999 | 1,201 (21.8%) | 1,624 (20.3%) |
| $100,000 to $299,999 | 3,012 (54.8%) | 5,653 (70.8%) |
| $300,000 to $499,999 | 389 (7.1%) | 433 (5.4%) |
| $500,000 to $749,999 | 37 (0.7%) | 32 (0.4%) |
| $750,000 to $999,999 | 10 (0.2%) | 0 (0.0%) |
| $1,000,000 or more | 52 (0.9%) | 6 (0.1%) |
| Total | 5,498 (100.0%) | 7,988 (100.0%) |
Household Income by Mortgage Status in Hamilton
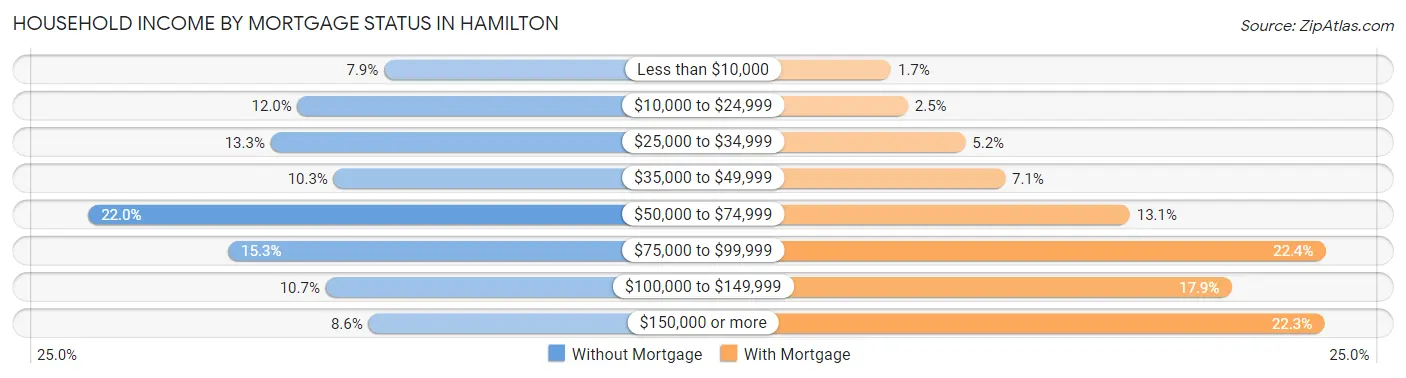
| Household Income | Without Mortgage | With Mortgage |
| Less than $10,000 | 433 (7.9%) | 135 (1.7%) |
| $10,000 to $24,999 | 660 (12.0%) | 199 (2.5%) |
| $25,000 to $34,999 | 730 (13.3%) | 418 (5.2%) |
| $35,000 to $49,999 | 565 (10.3%) | 569 (7.1%) |
| $50,000 to $74,999 | 1,208 (22.0%) | 1,043 (13.1%) |
| $75,000 to $99,999 | 842 (15.3%) | 1,787 (22.4%) |
| $100,000 to $149,999 | 586 (10.7%) | 1,429 (17.9%) |
| $150,000 or more | 474 (8.6%) | 1,782 (22.3%) |
| Total | 5,498 (100.0%) | 7,988 (100.0%) |
Property Value to Household Income Ratio in Hamilton
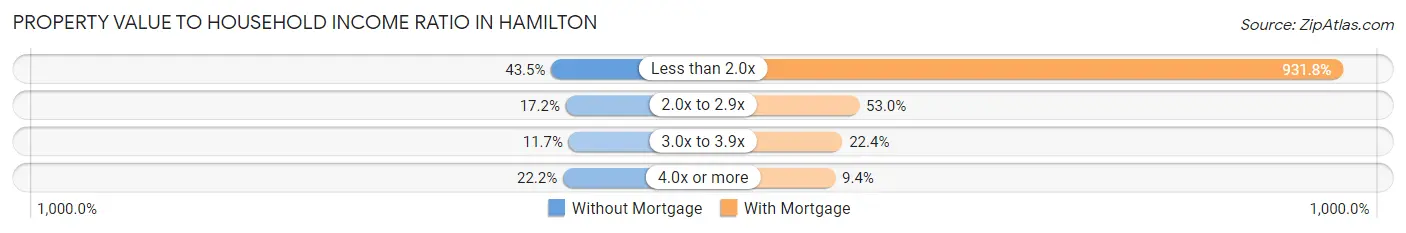
| Value-to-Income Ratio | Without Mortgage | With Mortgage |
| Less than 2.0x | 2,391 (43.5%) | 74,433 (931.8%) |
| 2.0x to 2.9x | 946 (17.2%) | 4,235 (53.0%) |
| 3.0x to 3.9x | 643 (11.7%) | 1,789 (22.4%) |
| 4.0x or more | 1,220 (22.2%) | 753 (9.4%) |
| Total | 5,498 (100.0%) | 7,988 (100.0%) |
Real Estate Taxes by Mortgage Status in Hamilton
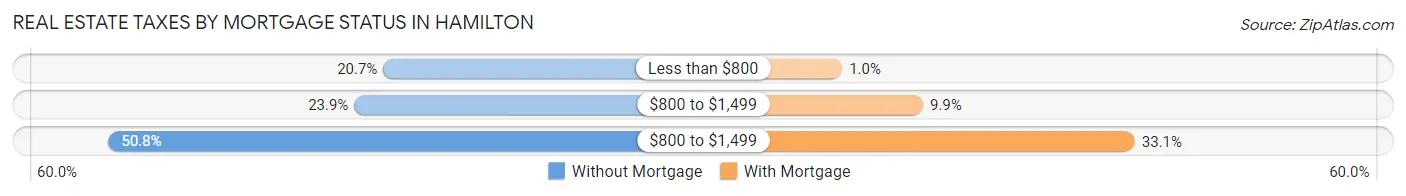
| Property Taxes | Without Mortgage | With Mortgage |
| Less than $800 | 1,138 (20.7%) | 81 (1.0%) |
| $800 to $1,499 | 1,313 (23.9%) | 788 (9.9%) |
| $800 to $1,499 | 2,794 (50.8%) | 2,642 (33.1%) |
| Total | 5,498 (100.0%) | 7,988 (100.0%) |
Health & Disability in Hamilton
Health Insurance Coverage by Age in Hamilton
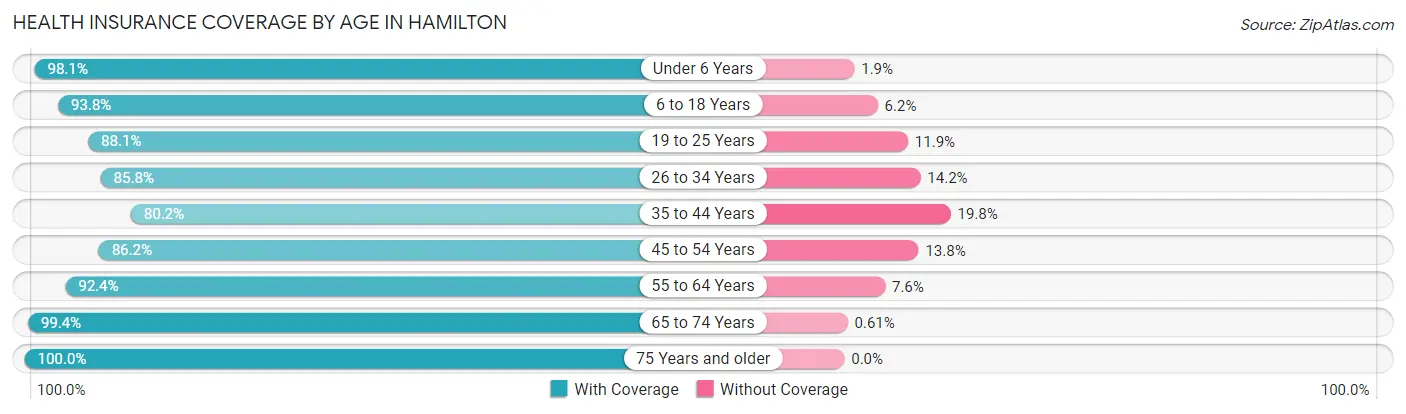
| Age Bracket | With Coverage | Without Coverage |
| Under 6 Years | 4,916 (98.1%) | 93 (1.9%) |
| 6 to 18 Years | 9,816 (93.8%) | 651 (6.2%) |
| 19 to 25 Years | 6,372 (88.1%) | 857 (11.9%) |
| 26 to 34 Years | 7,223 (85.8%) | 1,194 (14.2%) |
| 35 to 44 Years | 5,813 (80.2%) | 1,437 (19.8%) |
| 45 to 54 Years | 5,583 (86.2%) | 896 (13.8%) |
| 55 to 64 Years | 7,117 (92.4%) | 585 (7.6%) |
| 65 to 74 Years | 5,564 (99.4%) | 34 (0.6%) |
| 75 Years and older | 3,611 (100.0%) | 0 (0.0%) |
| Total | 56,015 (90.7%) | 5,747 (9.3%) |
Health Insurance Coverage by Citizenship Status in Hamilton
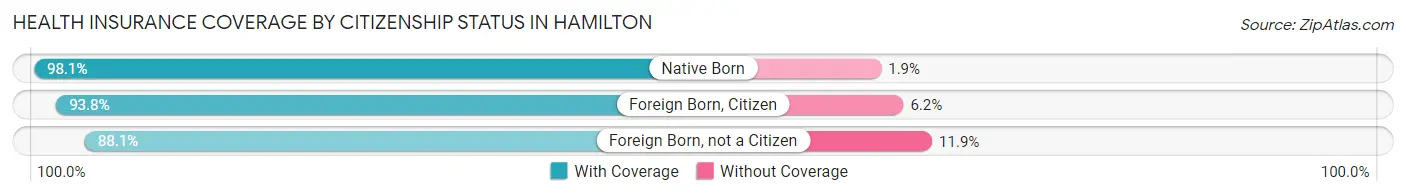
| Citizenship Status | With Coverage | Without Coverage |
| Native Born | 4,916 (98.1%) | 93 (1.9%) |
| Foreign Born, Citizen | 9,816 (93.8%) | 651 (6.2%) |
| Foreign Born, not a Citizen | 6,372 (88.1%) | 857 (11.9%) |
Health Insurance Coverage by Household Income in Hamilton
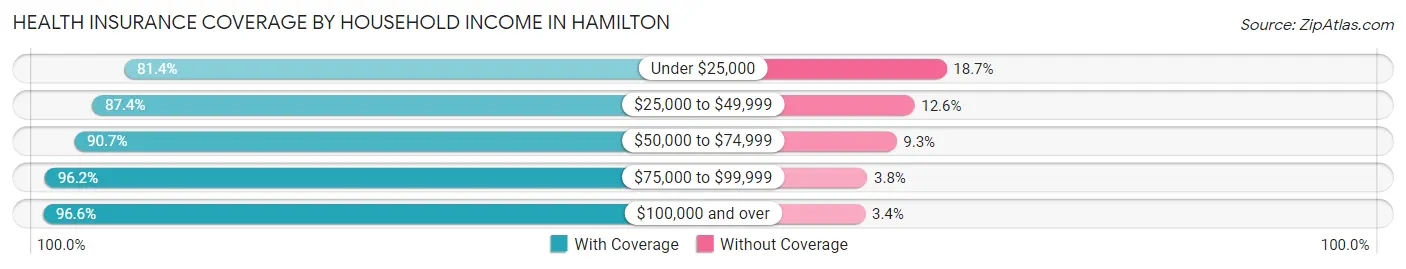
| Household Income | With Coverage | Without Coverage |
| Under $25,000 | 8,056 (81.4%) | 1,847 (18.6%) |
| $25,000 to $49,999 | 12,609 (87.4%) | 1,824 (12.6%) |
| $50,000 to $74,999 | 11,944 (90.7%) | 1,222 (9.3%) |
| $75,000 to $99,999 | 8,728 (96.2%) | 345 (3.8%) |
| $100,000 and over | 14,305 (96.6%) | 507 (3.4%) |
Public vs Private Health Insurance Coverage by Age in Hamilton
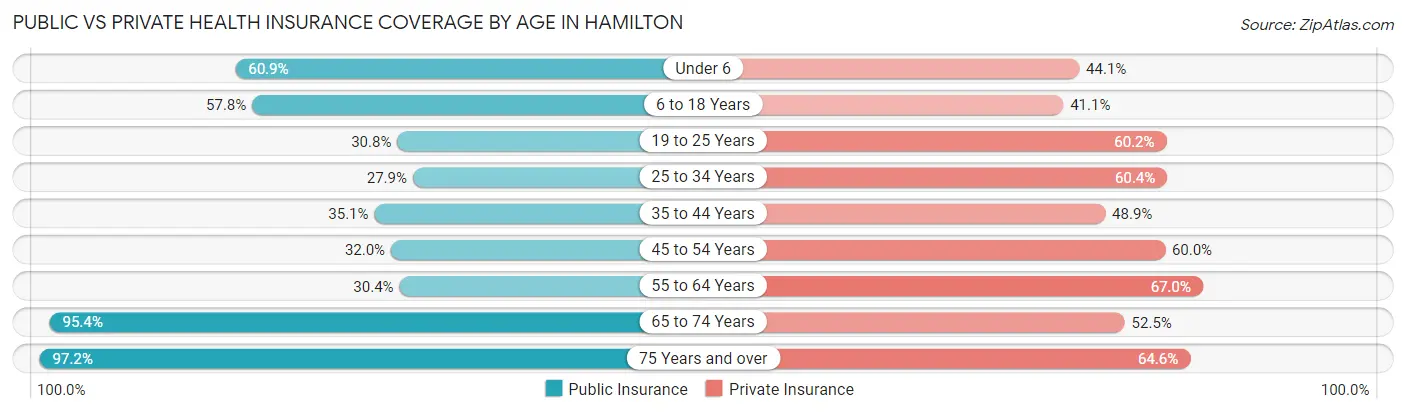
| Age Bracket | Public Insurance | Private Insurance |
| Under 6 | 3,050 (60.9%) | 2,207 (44.1%) |
| 6 to 18 Years | 6,047 (57.8%) | 4,302 (41.1%) |
| 19 to 25 Years | 2,229 (30.8%) | 4,355 (60.2%) |
| 25 to 34 Years | 2,352 (27.9%) | 5,082 (60.4%) |
| 35 to 44 Years | 2,543 (35.1%) | 3,544 (48.9%) |
| 45 to 54 Years | 2,073 (32.0%) | 3,886 (60.0%) |
| 55 to 64 Years | 2,344 (30.4%) | 5,160 (67.0%) |
| 65 to 74 Years | 5,339 (95.4%) | 2,939 (52.5%) |
| 75 Years and over | 3,511 (97.2%) | 2,334 (64.6%) |
| Total | 29,488 (47.7%) | 33,809 (54.7%) |
Disability Status by Sex by Age in Hamilton
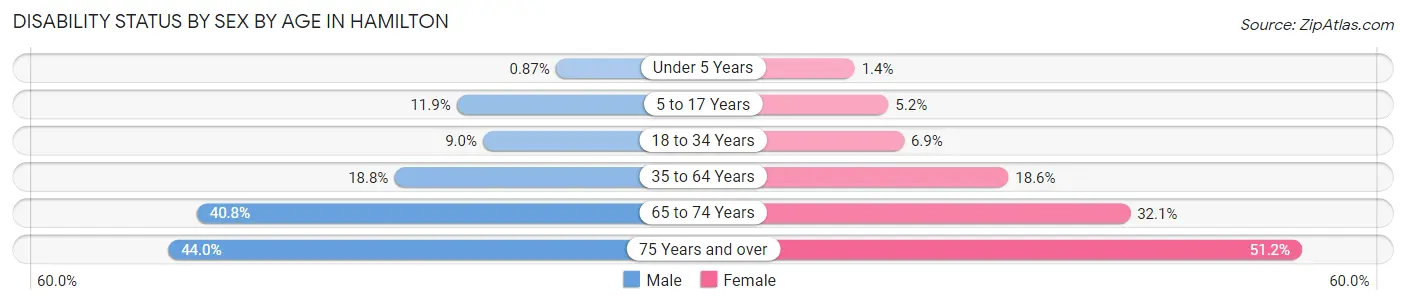
| Age Bracket | Male | Female |
| Under 5 Years | 17 (0.9%) | 30 (1.4%) |
| 5 to 17 Years | 649 (11.9%) | 271 (5.2%) |
| 18 to 34 Years | 715 (9.0%) | 583 (6.9%) |
| 35 to 64 Years | 1,963 (18.8%) | 2,043 (18.5%) |
| 65 to 74 Years | 1,018 (40.8%) | 997 (32.1%) |
| 75 Years and over | 572 (44.0%) | 1,184 (51.2%) |
Disability Class by Sex by Age in Hamilton
Disability Class: Hearing Difficulty
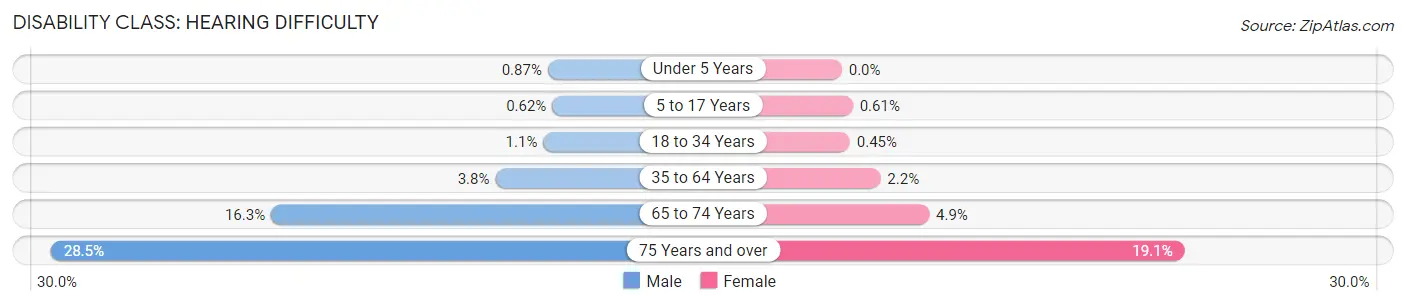
| Age Bracket | Male | Female |
| Under 5 Years | 17 (0.9%) | 0 (0.0%) |
| 5 to 17 Years | 34 (0.6%) | 32 (0.6%) |
| 18 to 34 Years | 89 (1.1%) | 38 (0.4%) |
| 35 to 64 Years | 395 (3.8%) | 237 (2.1%) |
| 65 to 74 Years | 406 (16.3%) | 151 (4.9%) |
| 75 Years and over | 371 (28.5%) | 441 (19.1%) |
Disability Class: Vision Difficulty
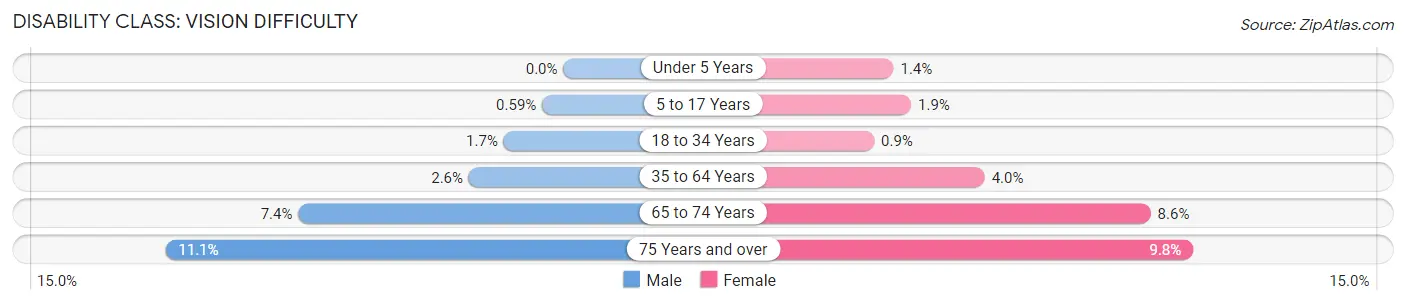
| Age Bracket | Male | Female |
| Under 5 Years | 0 (0.0%) | 30 (1.4%) |
| 5 to 17 Years | 32 (0.6%) | 101 (1.9%) |
| 18 to 34 Years | 132 (1.7%) | 76 (0.9%) |
| 35 to 64 Years | 274 (2.6%) | 438 (4.0%) |
| 65 to 74 Years | 184 (7.4%) | 267 (8.6%) |
| 75 Years and over | 144 (11.1%) | 226 (9.8%) |
Disability Class: Cognitive Difficulty

| Age Bracket | Male | Female |
| 5 to 17 Years | 507 (9.3%) | 202 (3.9%) |
| 18 to 34 Years | 524 (6.6%) | 389 (4.6%) |
| 35 to 64 Years | 850 (8.2%) | 806 (7.3%) |
| 65 to 74 Years | 337 (13.5%) | 300 (9.7%) |
| 75 Years and over | 79 (6.1%) | 225 (9.7%) |
Disability Class: Ambulatory Difficulty
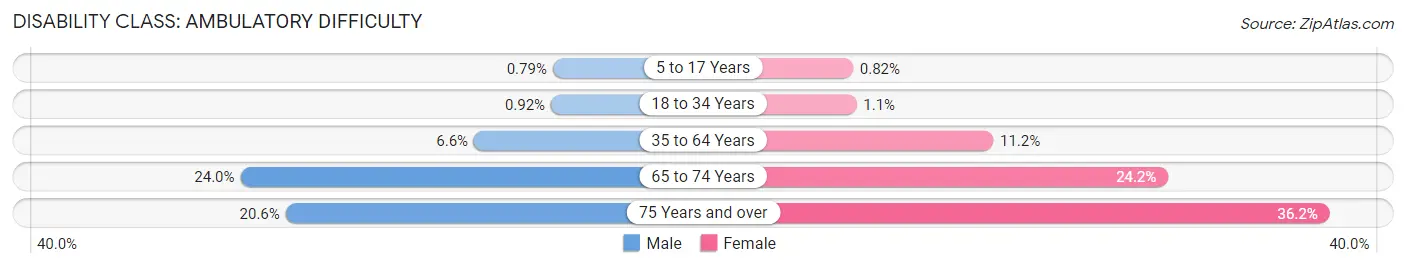
| Age Bracket | Male | Female |
| 5 to 17 Years | 43 (0.8%) | 43 (0.8%) |
| 18 to 34 Years | 73 (0.9%) | 91 (1.1%) |
| 35 to 64 Years | 692 (6.6%) | 1,237 (11.2%) |
| 65 to 74 Years | 598 (24.0%) | 752 (24.2%) |
| 75 Years and over | 268 (20.6%) | 837 (36.2%) |
Disability Class: Self-Care Difficulty
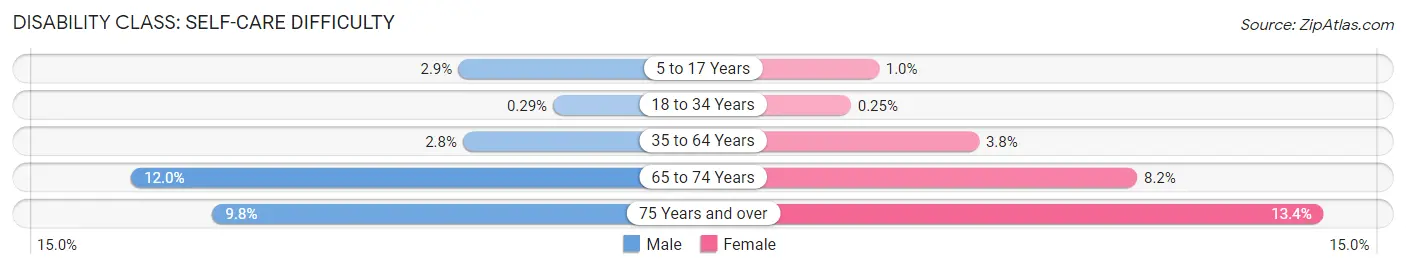
| Age Bracket | Male | Female |
| 5 to 17 Years | 160 (2.9%) | 54 (1.0%) |
| 18 to 34 Years | 23 (0.3%) | 21 (0.3%) |
| 35 to 64 Years | 292 (2.8%) | 421 (3.8%) |
| 65 to 74 Years | 300 (12.0%) | 255 (8.2%) |
| 75 Years and over | 127 (9.8%) | 310 (13.4%) |
Technology Access in Hamilton
Computing Device Access in Hamilton
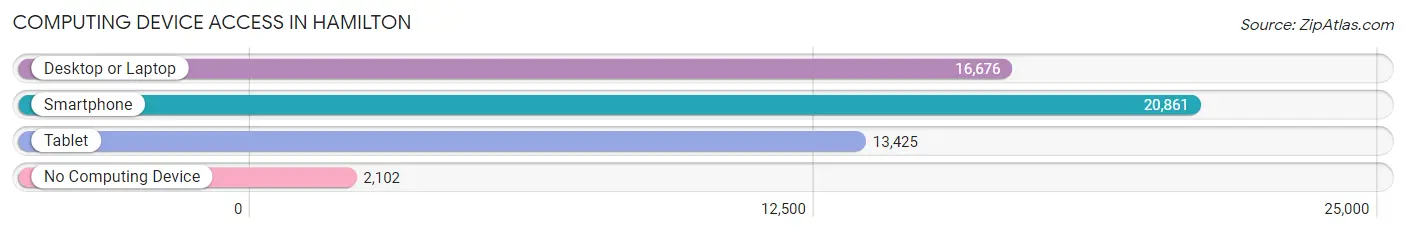
| Device Type | # Households | % Households |
| Desktop or Laptop | 16,676 | 67.5% |
| Smartphone | 20,861 | 84.5% |
| Tablet | 13,425 | 54.3% |
| No Computing Device | 2,102 | 8.5% |
| Total | 24,700 | 100.0% |
Internet Access in Hamilton
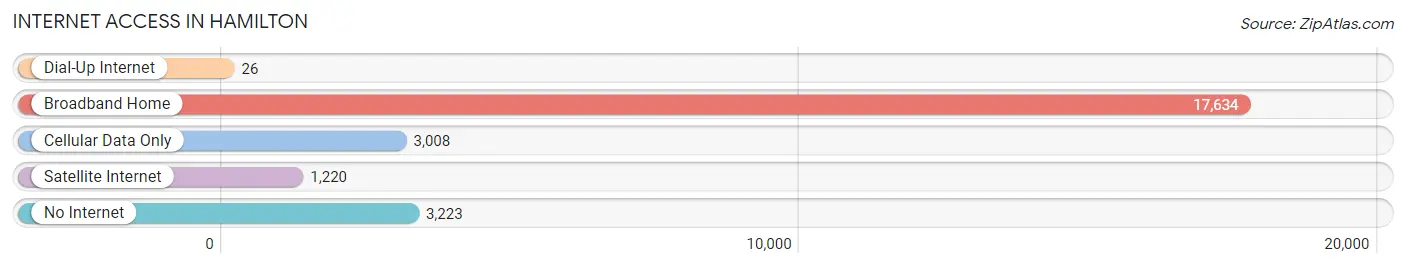
| Internet Type | # Households | % Households |
| Dial-Up Internet | 26 | 0.1% |
| Broadband Home | 17,634 | 71.4% |
| Cellular Data Only | 3,008 | 12.2% |
| Satellite Internet | 1,220 | 4.9% |
| No Internet | 3,223 | 13.1% |
| Total | 24,700 | 100.0% |
Hamilton Summary
Hamilton, Ohio is a city located in Butler County, Ohio, United States. It is the county seat of Butler County and is located along the Great Miami River. The city has a population of 62,477 as of the 2010 census, making it the largest city in the county.
History
The area that is now Hamilton was first settled in 1794 by Colonel Richard Butler, a Revolutionary War veteran. The city was named after Alexander Hamilton, the first Secretary of the Treasury. The city was incorporated in 1810 and became the county seat of Butler County in 1803.
In the early 19th century, Hamilton was a major center for manufacturing and industry. The city was home to several factories, including the Hamilton Carriage Works, which produced carriages and wagons. The city also had a large number of foundries and machine shops.
In the late 19th century, Hamilton became a major railroad hub. The city was home to several major railroads, including the Cincinnati, Hamilton & Dayton Railroad, the Cincinnati, Hamilton & Dayton Railway, and the Cincinnati, Hamilton & Dayton Railway & Bridge Company.
Geography
Hamilton is located in southwestern Ohio, approximately 25 miles north of Cincinnati. The city is situated along the Great Miami River and is surrounded by several smaller towns and villages. The city has a total area of 16.2 square miles, of which 16.1 square miles is land and 0.1 square miles is water.
Economy
Hamilton is a major economic center in southwestern Ohio. The city is home to several major employers, including AK Steel, Miami University Hamilton Campus, and the Hamilton City School District. The city also has a large number of small businesses, including restaurants, retail stores, and professional services.
The city is also home to several major shopping centers, including the Hamilton Mall and the Hamilton Towne Center. The city is also home to several major medical centers, including the Fort Hamilton Hospital and the Hamilton Medical Center.
Demographics
As of the 2010 census, the population of Hamilton was 62,477. The racial makeup of the city was 79.2% White, 14.3% African American, 0.3% Native American, 1.2% Asian, 0.1% Pacific Islander, 2.2% from other races, and 2.9% from two or more races. Hispanic or Latino of any race were 4.7% of the population.
The median income for a household in the city was $37,945, and the median income for a family was $45,945. The per capita income for the city was $20,845. About 15.2% of families and 19.2% of the population were below the poverty line, including 28.2% of those under age 18 and 8.7% of those age 65 or over.
Hamilton is a diverse city with a variety of cultures and backgrounds. The city is home to a large number of immigrants, including those from Mexico, India, and the Middle East. The city also has a large number of African American and Hispanic residents.
Common Questions
What is Per Capita Income in Hamilton?
Per Capita income in Hamilton is $27,526.
What is the Median Family Income in Hamilton?
Median Family Income in Hamilton is $62,579.
What is the Median Household income in Hamilton?
Median Household Income in Hamilton is $52,995.
What is Income or Wage Gap in Hamilton?
Income or Wage Gap in Hamilton is 26.3%.
Women in Hamilton earn 73.7 cents for every dollar earned by a man.
What is Family Income Deficit in Hamilton?
Family Income Deficit in Hamilton is $13,568.
Families that are below poverty line in Hamilton earn $13,568 less on average than the poverty threshold level.
What is Inequality or Gini Index in Hamilton?
Inequality or Gini Index in Hamilton is 0.43.
What is the Total Population of Hamilton?
Total Population of Hamilton is 63,149.
What is the Total Male Population of Hamilton?
Total Male Population of Hamilton is 30,500.
What is the Total Female Population of Hamilton?
Total Female Population of Hamilton is 32,649.
What is the Ratio of Males per 100 Females in Hamilton?
There are 93.42 Males per 100 Females in Hamilton.
What is the Ratio of Females per 100 Males in Hamilton?
There are 107.05 Females per 100 Males in Hamilton.
What is the Median Population Age in Hamilton?
Median Population Age in Hamilton is 35.1 Years.
What is the Average Family Size in Hamilton
Average Family Size in Hamilton is 3.1 People.
What is the Average Household Size in Hamilton
Average Household Size in Hamilton is 2.5 People.
How Large is the Labor Force in Hamilton?
There are 30,070 People in the Labor Forcein in Hamilton.
What is the Percentage of People in the Labor Force in Hamilton?
60.5% of People are in the Labor Force in Hamilton.
What is the Unemployment Rate in Hamilton?
Unemployment Rate in Hamilton is 7.0%.