Massillon, OH Map & Demographics
Massillon Map
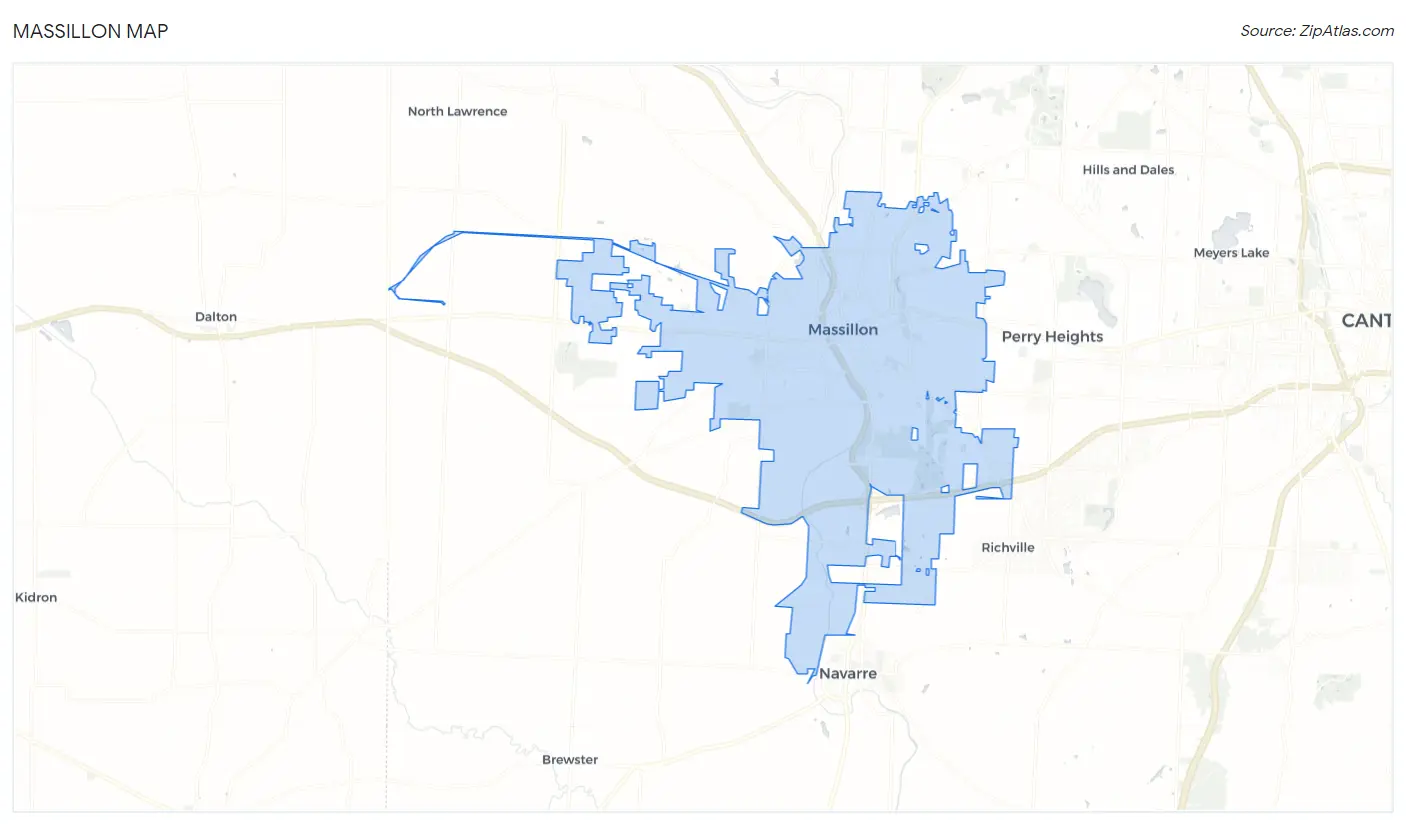
Massillon Overview
$29,859
PER CAPITA INCOME
$64,906
AVG FAMILY INCOME
$53,699
AVG HOUSEHOLD INCOME
19.8%
WAGE / INCOME GAP [ % ]
80.2¢/ $1
WAGE / INCOME GAP [ $ ]
$10,335
FAMILY INCOME DEFICIT
0.40
INEQUALITY / GINI INDEX
32,179
TOTAL POPULATION
15,895
MALE POPULATION
16,284
FEMALE POPULATION
97.61
MALES / 100 FEMALES
102.45
FEMALES / 100 MALES
40.8
MEDIAN AGE
2.8
AVG FAMILY SIZE
2.2
AVG HOUSEHOLD SIZE
16,776
LABOR FORCE [ PEOPLE ]
63.4%
PERCENT IN LABOR FORCE
3.9%
UNEMPLOYMENT RATE
Income in Massillon
Income Overview in Massillon
Per Capita Income in Massillon is $29,859, while median incomes of families and households are $64,906 and $53,699 respectively.
| Characteristic | Number | Measure |
| Per Capita Income | 32,179 | $29,859 |
| Median Family Income | 8,337 | $64,906 |
| Mean Family Income | 8,337 | $78,389 |
| Median Household Income | 13,974 | $53,699 |
| Mean Household Income | 13,974 | $67,130 |
| Income Deficit | 8,337 | $10,335 |
| Wage / Income Gap (%) | 32,179 | 19.78% |
| Wage / Income Gap ($) | 32,179 | 80.22¢ per $1 |
| Gini / Inequality Index | 32,179 | 0.40 |
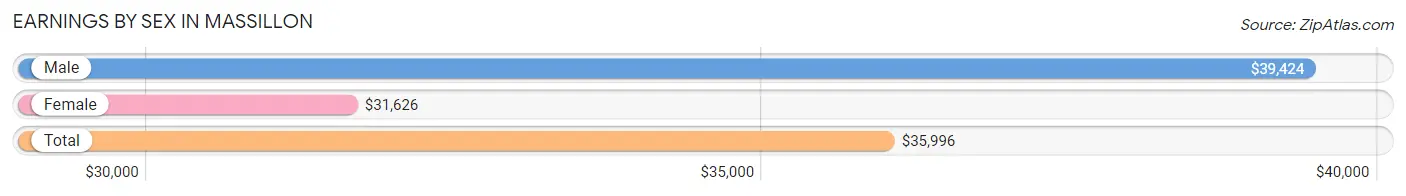
Earnings by Sex in Massillon
Average Earnings in Massillon are $35,996, $39,424 for men and $31,626 for women, a difference of 19.8%.
| Sex | Number | Average Earnings |
| Male | 9,350 (53.6%) | $39,424 |
| Female | 8,091 (46.4%) | $31,626 |
| Total | 17,441 (100.0%) | $35,996 |
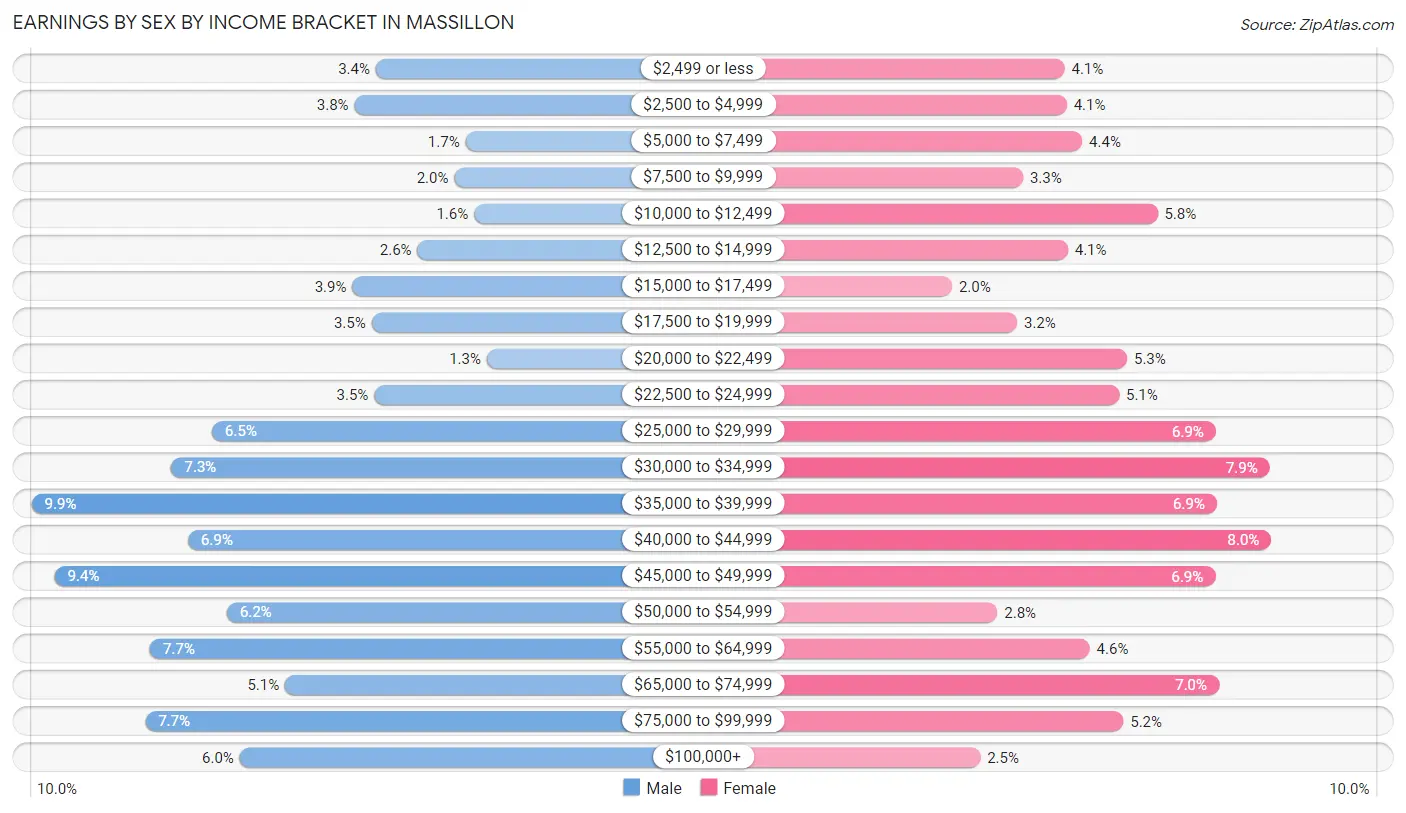
Earnings by Sex by Income Bracket in Massillon
The most common earnings brackets in Massillon are $35,000 to $39,999 for men (923 | 9.9%) and $40,000 to $44,999 for women (643 | 8.0%).
| Income | Male | Female |
| $2,499 or less | 320 (3.4%) | 330 (4.1%) |
| $2,500 to $4,999 | 357 (3.8%) | 333 (4.1%) |
| $5,000 to $7,499 | 163 (1.7%) | 357 (4.4%) |
| $7,500 to $9,999 | 182 (1.9%) | 267 (3.3%) |
| $10,000 to $12,499 | 148 (1.6%) | 471 (5.8%) |
| $12,500 to $14,999 | 247 (2.6%) | 335 (4.1%) |
| $15,000 to $17,499 | 361 (3.9%) | 159 (2.0%) |
| $17,500 to $19,999 | 327 (3.5%) | 258 (3.2%) |
| $20,000 to $22,499 | 125 (1.3%) | 425 (5.2%) |
| $22,500 to $24,999 | 323 (3.5%) | 413 (5.1%) |
| $25,000 to $29,999 | 607 (6.5%) | 559 (6.9%) |
| $30,000 to $34,999 | 678 (7.2%) | 641 (7.9%) |
| $35,000 to $39,999 | 923 (9.9%) | 561 (6.9%) |
| $40,000 to $44,999 | 649 (6.9%) | 643 (8.0%) |
| $45,000 to $49,999 | 883 (9.4%) | 558 (6.9%) |
| $50,000 to $54,999 | 581 (6.2%) | 228 (2.8%) |
| $55,000 to $64,999 | 715 (7.6%) | 368 (4.5%) |
| $65,000 to $74,999 | 479 (5.1%) | 564 (7.0%) |
| $75,000 to $99,999 | 724 (7.7%) | 419 (5.2%) |
| $100,000+ | 558 (6.0%) | 202 (2.5%) |
| Total | 9,350 (100.0%) | 8,091 (100.0%) |
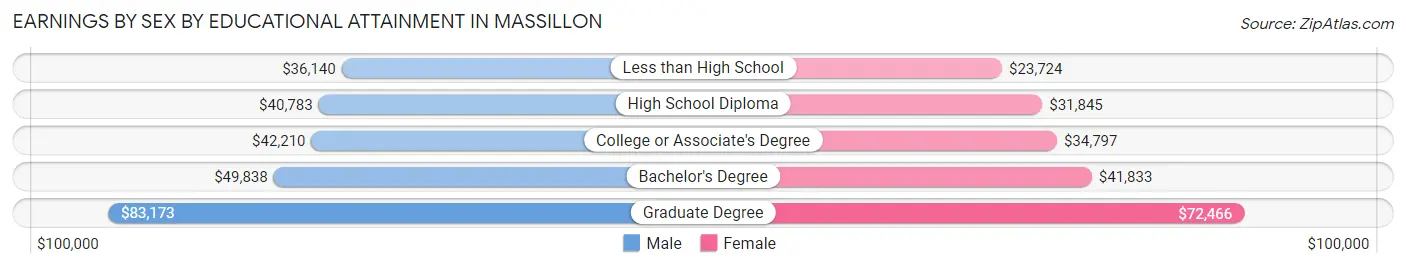
Earnings by Sex by Educational Attainment in Massillon
Average earnings in Massillon are $42,749 for men and $34,974 for women, a difference of 18.2%. Men with an educational attainment of graduate degree enjoy the highest average annual earnings of $83,173, while those with less than high school education earn the least with $36,140. Women with an educational attainment of graduate degree earn the most with the average annual earnings of $72,466, while those with less than high school education have the smallest earnings of $23,724.
| Educational Attainment | Male Income | Female Income |
| Less than High School | $36,140 | $23,724 |
| High School Diploma | $40,783 | $31,845 |
| College or Associate's Degree | $42,210 | $34,797 |
| Bachelor's Degree | $49,838 | $41,833 |
| Graduate Degree | $83,173 | $72,466 |
| Total | $42,749 | $34,974 |
Family Income in Massillon
Family Income Brackets in Massillon
According to the Massillon family income data, there are 1,826 families falling into the $50,000 to $74,999 income range, which is the most common income bracket and makes up 21.9% of all families. Conversely, the $200,000+ income bracket is the least frequent group with only 233 families (2.8%) belonging to this category.
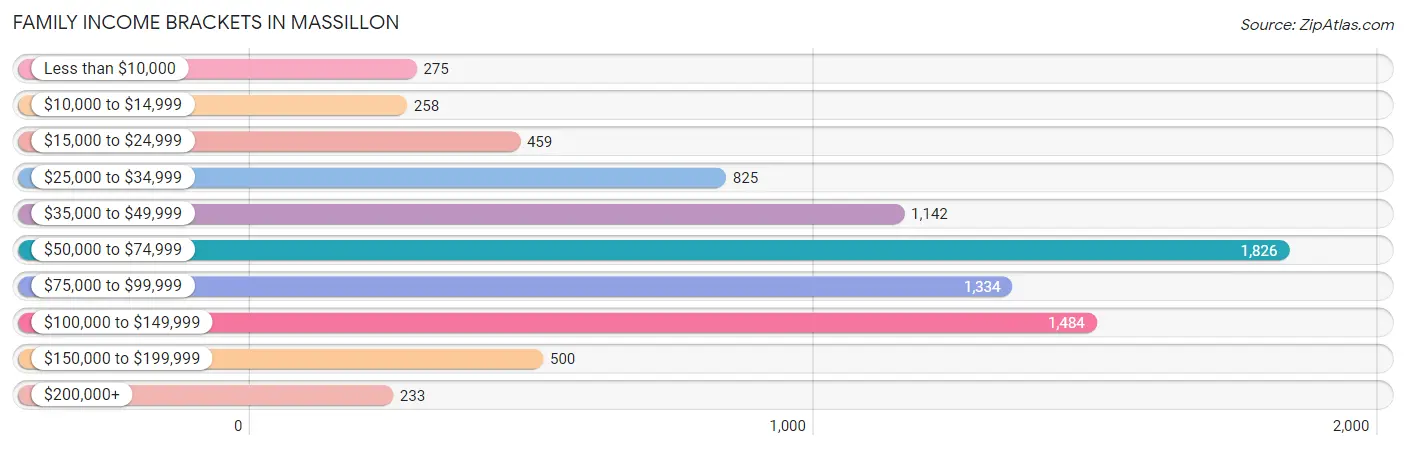
| Income Bracket | # Families | % Families |
| Less than $10,000 | 275 | 3.3% |
| $10,000 to $14,999 | 258 | 3.1% |
| $15,000 to $24,999 | 459 | 5.5% |
| $25,000 to $34,999 | 825 | 9.9% |
| $35,000 to $49,999 | 1,142 | 13.7% |
| $50,000 to $74,999 | 1,826 | 21.9% |
| $75,000 to $99,999 | 1,334 | 16.0% |
| $100,000 to $149,999 | 1,484 | 17.8% |
| $150,000 to $199,999 | 500 | 6.0% |
| $200,000+ | 233 | 2.8% |
Family Income by Famaliy Size in Massillon
7+ person families (56 | 0.7%) account for the highest median family income in Massillon with $116,500 per family, while 2-person families (4,655 | 55.8%) have the highest median income of $30,617 per family member.
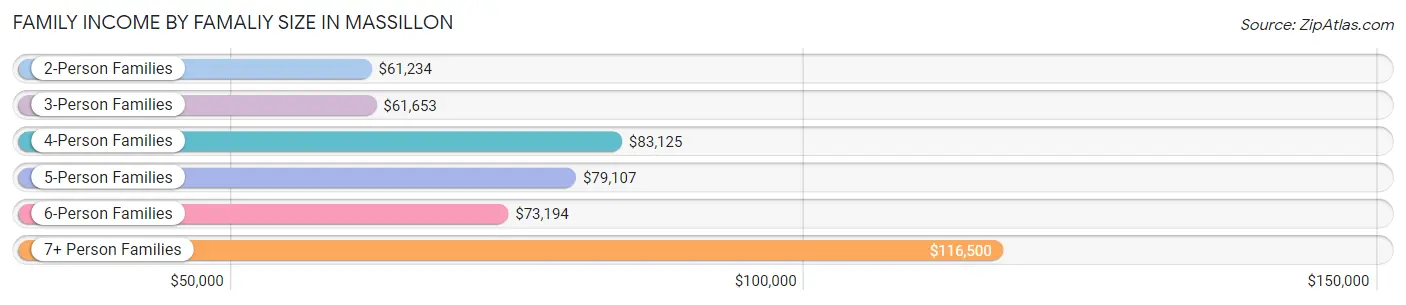
| Income Bracket | # Families | Median Income |
| 2-Person Families | 4,655 (55.8%) | $61,234 |
| 3-Person Families | 1,649 (19.8%) | $61,653 |
| 4-Person Families | 1,484 (17.8%) | $83,125 |
| 5-Person Families | 412 (4.9%) | $79,107 |
| 6-Person Families | 81 (1.0%) | $73,194 |
| 7+ Person Families | 56 (0.7%) | $116,500 |
| Total | 8,337 (100.0%) | $64,906 |
Family Income by Number of Earners in Massillon
The median family income in Massillon is $64,906, with families comprising 3+ earners (808) having the highest median family income of $120,929, while families with no earners (1,393) have the lowest median family income of $32,445, accounting for 9.7% and 16.7% of families, respectively.
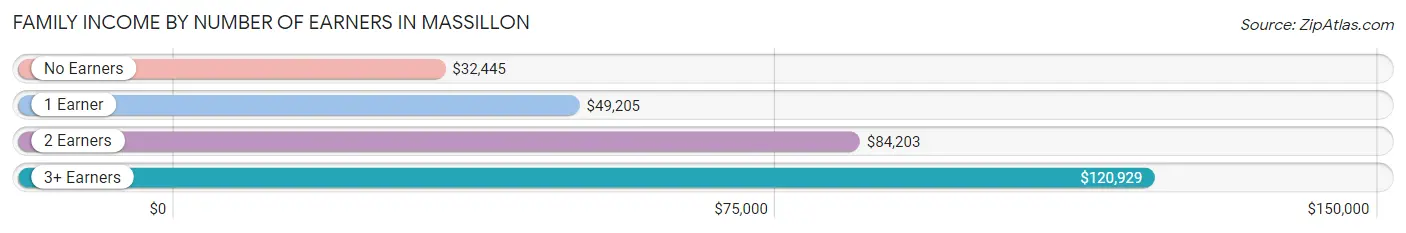
| Number of Earners | # Families | Median Income |
| No Earners | 1,393 (16.7%) | $32,445 |
| 1 Earner | 2,741 (32.9%) | $49,205 |
| 2 Earners | 3,395 (40.7%) | $84,203 |
| 3+ Earners | 808 (9.7%) | $120,929 |
| Total | 8,337 (100.0%) | $64,906 |
Household Income in Massillon
Household Income Brackets in Massillon
With 2,823 households falling in the category, the $50,000 to $74,999 income range is the most frequent in Massillon, accounting for 20.2% of all households. In contrast, only 252 households (1.8%) fall into the $200,000+ income bracket, making it the least populous group.
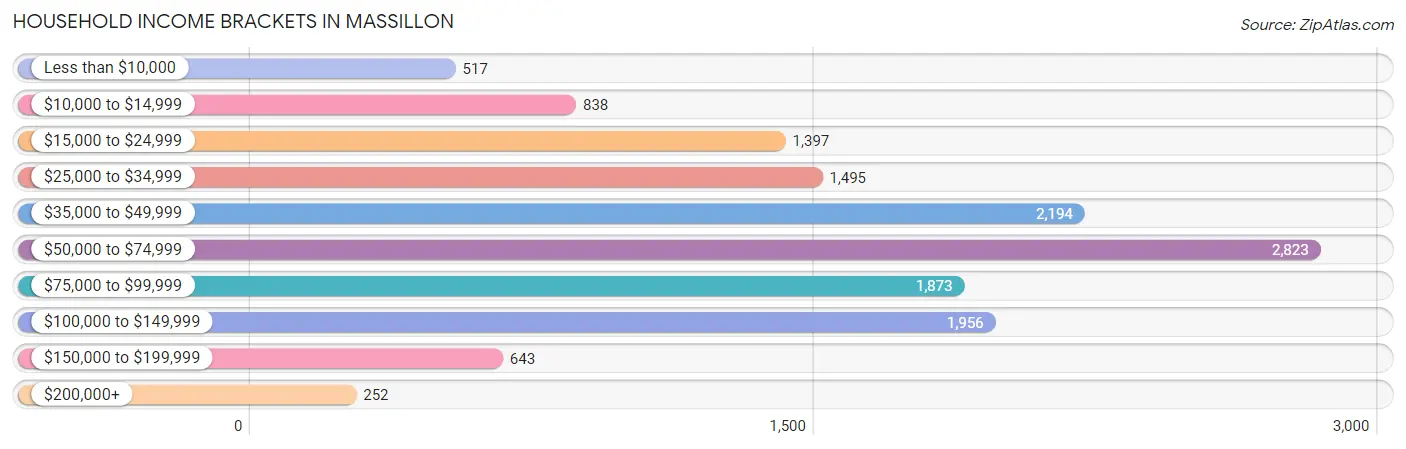
| Income Bracket | # Households | % Households |
| Less than $10,000 | 517 | 3.7% |
| $10,000 to $14,999 | 838 | 6.0% |
| $15,000 to $24,999 | 1,397 | 10.0% |
| $25,000 to $34,999 | 1,495 | 10.7% |
| $35,000 to $49,999 | 2,194 | 15.7% |
| $50,000 to $74,999 | 2,823 | 20.2% |
| $75,000 to $99,999 | 1,873 | 13.4% |
| $100,000 to $149,999 | 1,956 | 14.0% |
| $150,000 to $199,999 | 643 | 4.6% |
| $200,000+ | 252 | 1.8% |
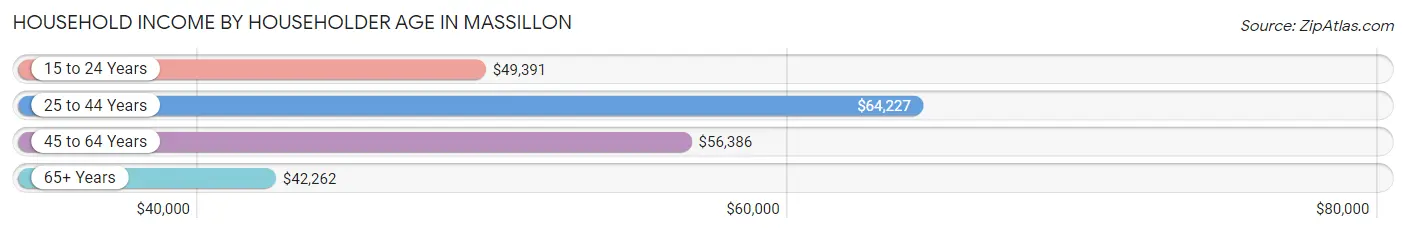
Household Income by Householder Age in Massillon
The median household income in Massillon is $53,699, with the highest median household income of $64,227 found in the 25 to 44 years age bracket for the primary householder. A total of 4,875 households (34.9%) fall into this category. Meanwhile, the 65+ years age bracket for the primary householder has the lowest median household income of $42,262, with 4,014 households (28.7%) in this group.
| Income Bracket | # Households | Median Income |
| 15 to 24 Years | 325 (2.3%) | $49,391 |
| 25 to 44 Years | 4,875 (34.9%) | $64,227 |
| 45 to 64 Years | 4,760 (34.1%) | $56,386 |
| 65+ Years | 4,014 (28.7%) | $42,262 |
| Total | 13,974 (100.0%) | $53,699 |
Poverty in Massillon
Income Below Poverty by Sex and Age in Massillon
With 12.2% poverty level for males and 16.7% for females among the residents of Massillon, 6 to 11 year old males and 6 to 11 year old females are the most vulnerable to poverty, with 381 males (30.7%) and 287 females (27.7%) in their respective age groups living below the poverty level.
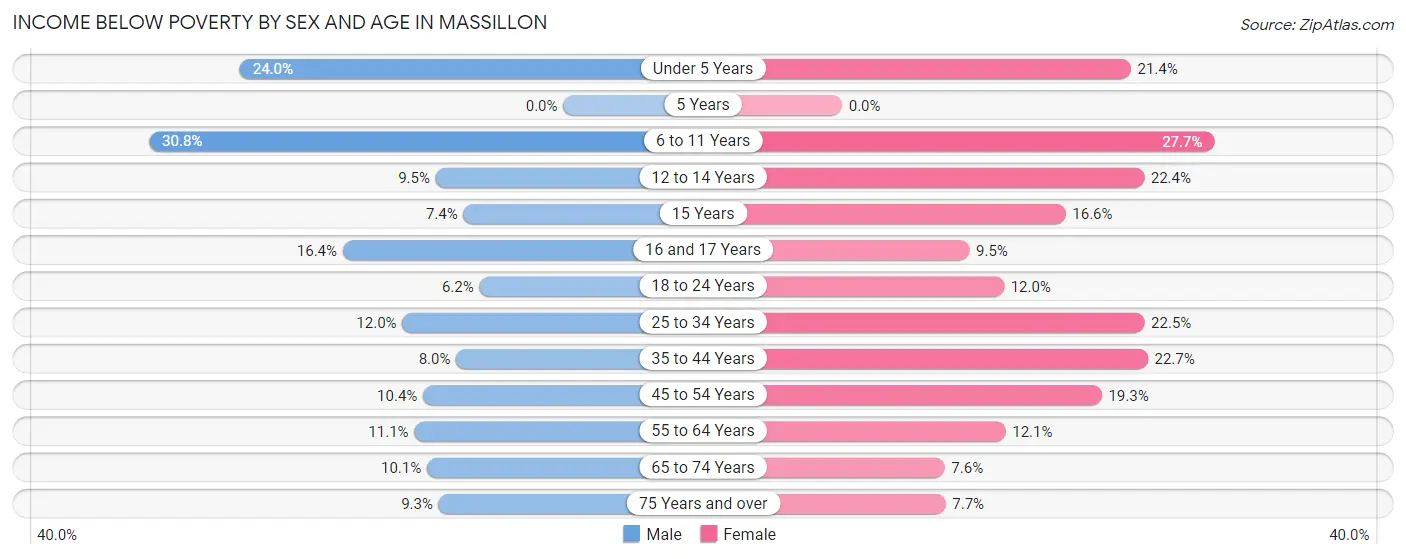
| Age Bracket | Male | Female |
| Under 5 Years | 203 (24.0%) | 194 (21.4%) |
| 5 Years | 0 (0.0%) | 0 (0.0%) |
| 6 to 11 Years | 381 (30.7%) | 287 (27.7%) |
| 12 to 14 Years | 34 (9.5%) | 128 (22.4%) |
| 15 Years | 18 (7.4%) | 43 (16.6%) |
| 16 and 17 Years | 55 (16.4%) | 26 (9.5%) |
| 18 to 24 Years | 74 (6.2%) | 131 (12.0%) |
| 25 to 34 Years | 277 (11.9%) | 469 (22.5%) |
| 35 to 44 Years | 186 (8.0%) | 531 (22.7%) |
| 45 to 54 Years | 196 (10.4%) | 323 (19.3%) |
| 55 to 64 Years | 222 (11.1%) | 269 (12.1%) |
| 65 to 74 Years | 164 (10.1%) | 156 (7.6%) |
| 75 Years and over | 103 (9.2%) | 107 (7.7%) |
| Total | 1,913 (12.2%) | 2,664 (16.7%) |
Income Above Poverty by Sex and Age in Massillon
According to the poverty statistics in Massillon, males aged 5 years and females aged 5 years are the age groups that are most secure financially, with 100.0% of males and 100.0% of females in these age groups living above the poverty line.
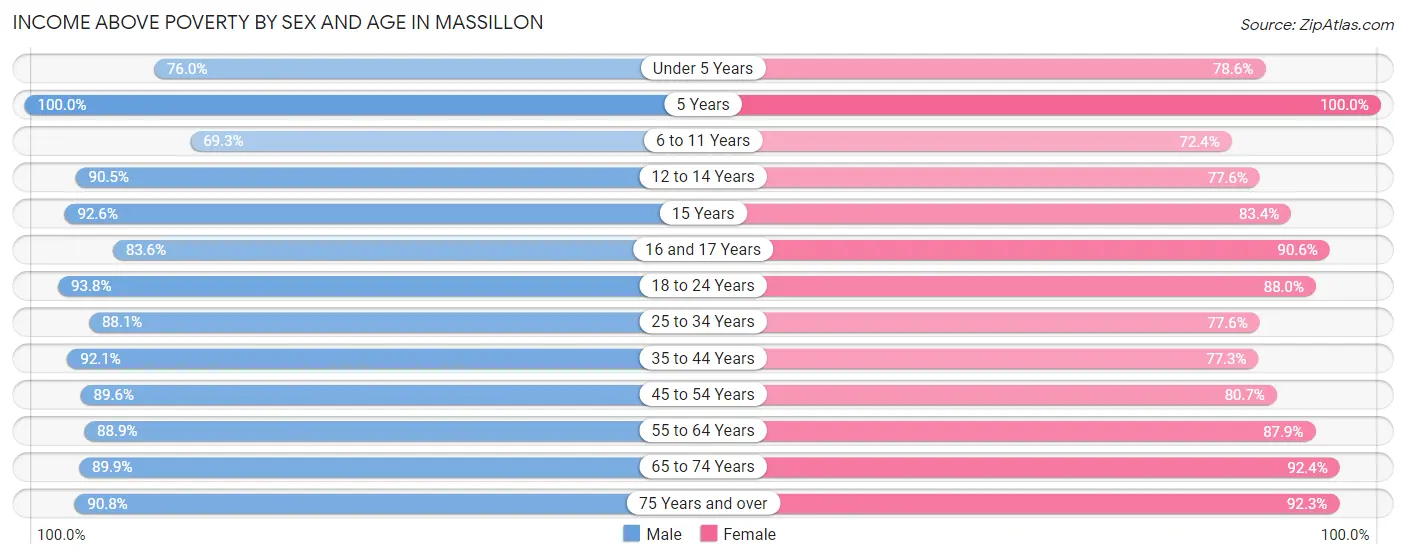
| Age Bracket | Male | Female |
| Under 5 Years | 642 (76.0%) | 711 (78.6%) |
| 5 Years | 132 (100.0%) | 69 (100.0%) |
| 6 to 11 Years | 858 (69.3%) | 751 (72.4%) |
| 12 to 14 Years | 325 (90.5%) | 443 (77.6%) |
| 15 Years | 225 (92.6%) | 216 (83.4%) |
| 16 and 17 Years | 281 (83.6%) | 249 (90.5%) |
| 18 to 24 Years | 1,115 (93.8%) | 959 (88.0%) |
| 25 to 34 Years | 2,041 (88.0%) | 1,620 (77.5%) |
| 35 to 44 Years | 2,155 (92.0%) | 1,808 (77.3%) |
| 45 to 54 Years | 1,687 (89.6%) | 1,352 (80.7%) |
| 55 to 64 Years | 1,785 (88.9%) | 1,946 (87.9%) |
| 65 to 74 Years | 1,457 (89.9%) | 1,890 (92.4%) |
| 75 Years and over | 1,011 (90.7%) | 1,285 (92.3%) |
| Total | 13,714 (87.8%) | 13,299 (83.3%) |
Income Below Poverty Among Married-Couple Families in Massillon
The poverty statistics for married-couple families in Massillon show that 3.0% or 163 of the total 5,452 families live below the poverty line. Families with 3 or 4 children have the highest poverty rate of 9.2%, comprising of 29 families. On the other hand, families with 5 or more children have the lowest poverty rate of 0.0%, which includes 0 families.
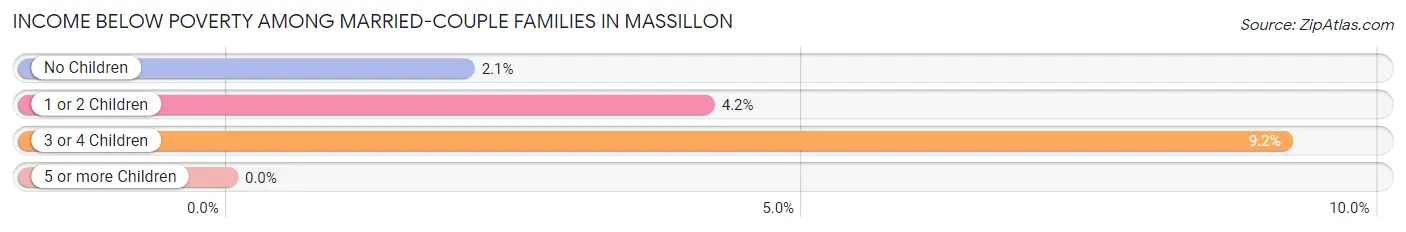
| Children | Above Poverty | Below Poverty |
| No Children | 3,668 (97.9%) | 77 (2.1%) |
| 1 or 2 Children | 1,317 (95.9%) | 57 (4.2%) |
| 3 or 4 Children | 287 (90.8%) | 29 (9.2%) |
| 5 or more Children | 17 (100.0%) | 0 (0.0%) |
| Total | 5,289 (97.0%) | 163 (3.0%) |
Income Below Poverty Among Single-Parent Households in Massillon
According to the poverty data in Massillon, 11.3% or 103 single-father households and 29.4% or 580 single-mother households are living below the poverty line. Among single-father households, those with 1 or 2 children have the highest poverty rate, with 77 households (15.6%) experiencing poverty. Likewise, among single-mother households, those with 3 or 4 children have the highest poverty rate, with 173 households (68.6%) falling below the poverty line.
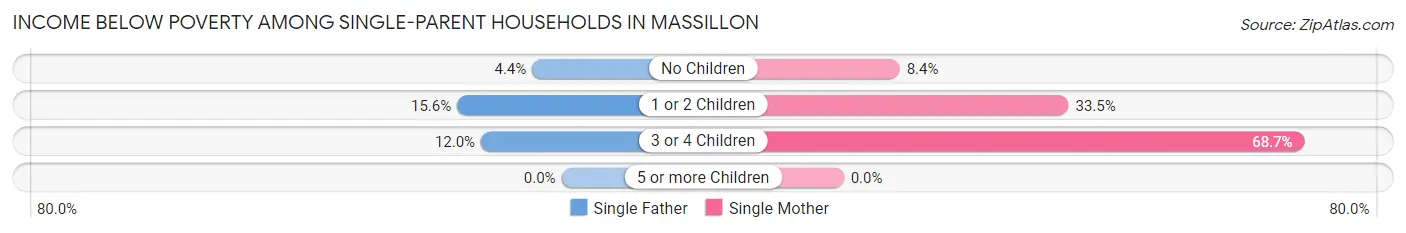
| Children | Single Father | Single Mother |
| No Children | 14 (4.4%) | 56 (8.4%) |
| 1 or 2 Children | 77 (15.6%) | 351 (33.5%) |
| 3 or 4 Children | 12 (12.0%) | 173 (68.6%) |
| 5 or more Children | 0 (0.0%) | 0 (0.0%) |
| Total | 103 (11.3%) | 580 (29.4%) |
Income Below Poverty Among Married-Couple vs Single-Parent Households in Massillon
The poverty data for Massillon shows that 163 of the married-couple family households (3.0%) and 683 of the single-parent households (23.7%) are living below the poverty level. Within the married-couple family households, those with 3 or 4 children have the highest poverty rate, with 29 households (9.2%) falling below the poverty line. Among the single-parent households, those with 3 or 4 children have the highest poverty rate, with 185 household (52.6%) living below poverty.
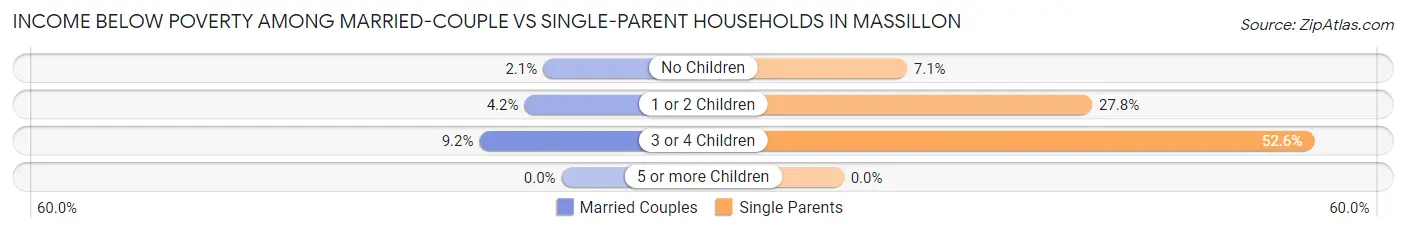
| Children | Married-Couple Families | Single-Parent Households |
| No Children | 77 (2.1%) | 70 (7.1%) |
| 1 or 2 Children | 57 (4.2%) | 428 (27.8%) |
| 3 or 4 Children | 29 (9.2%) | 185 (52.6%) |
| 5 or more Children | 0 (0.0%) | 0 (0.0%) |
| Total | 163 (3.0%) | 683 (23.7%) |
Race in Massillon
The most populous races in Massillon are White / Caucasian (27,450 | 85.3%), Black / African American (2,316 | 7.2%), and Two or more Races (1,966 | 6.1%).
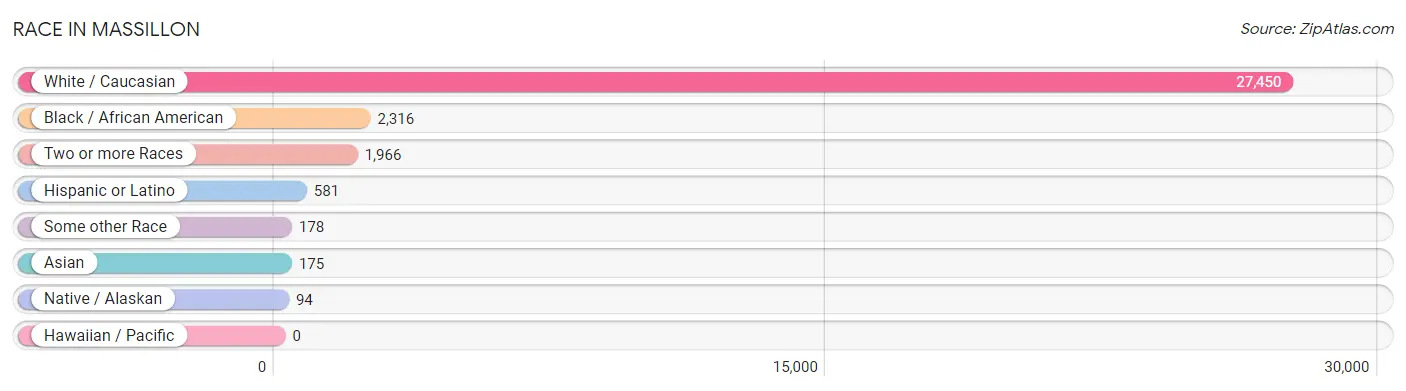
| Race | # Population | % Population |
| Asian | 175 | 0.5% |
| Black / African American | 2,316 | 7.2% |
| Hawaiian / Pacific | 0 | 0.0% |
| Hispanic or Latino | 581 | 1.8% |
| Native / Alaskan | 94 | 0.3% |
| White / Caucasian | 27,450 | 85.3% |
| Two or more Races | 1,966 | 6.1% |
| Some other Race | 178 | 0.5% |
| Total | 32,179 | 100.0% |
Ancestry in Massillon
The most populous ancestries reported in Massillon are German (9,746 | 30.3%), Irish (4,312 | 13.4%), English (2,762 | 8.6%), Italian (2,309 | 7.2%), and American (1,643 | 5.1%), together accounting for 64.6% of all Massillon residents.

| Ancestry | # Population | % Population |
| African | 618 | 1.9% |
| American | 1,643 | 5.1% |
| Arab | 187 | 0.6% |
| Argentinean | 40 | 0.1% |
| Austrian | 110 | 0.3% |
| Bhutanese | 29 | 0.1% |
| Blackfeet | 7 | 0.0% |
| British | 246 | 0.8% |
| Bulgarian | 25 | 0.1% |
| Canadian | 53 | 0.2% |
| Cape Verdean | 8 | 0.0% |
| Celtic | 5 | 0.0% |
| Central American | 103 | 0.3% |
| Central American Indian | 81 | 0.3% |
| Cherokee | 181 | 0.6% |
| Cheyenne | 42 | 0.1% |
| Chippewa | 54 | 0.2% |
| Choctaw | 15 | 0.1% |
| Comanche | 6 | 0.0% |
| Costa Rican | 15 | 0.1% |
| Creek | 26 | 0.1% |
| Croatian | 96 | 0.3% |
| Cuban | 60 | 0.2% |
| Czech | 59 | 0.2% |
| Czechoslovakian | 99 | 0.3% |
| Danish | 37 | 0.1% |
| Delaware | 15 | 0.1% |
| Dutch | 458 | 1.4% |
| Eastern European | 79 | 0.3% |
| English | 2,762 | 8.6% |
| European | 397 | 1.2% |
| French | 649 | 2.0% |
| French Canadian | 28 | 0.1% |
| German | 9,746 | 30.3% |
| German Russian | 4 | 0.0% |
| Greek | 371 | 1.1% |
| Guatemalan | 88 | 0.3% |
| Hungarian | 580 | 1.8% |
| Indian (Asian) | 113 | 0.4% |
| Inupiat | 35 | 0.1% |
| Irish | 4,312 | 13.4% |
| Italian | 2,309 | 7.2% |
| Jamaican | 51 | 0.2% |
| Korean | 174 | 0.5% |
| Latvian | 28 | 0.1% |
| Lebanese | 119 | 0.4% |
| Lithuanian | 18 | 0.1% |
| Mexican | 168 | 0.5% |
| Nigerian | 37 | 0.1% |
| Northern European | 25 | 0.1% |
| Norwegian | 24 | 0.1% |
| Pennsylvania German | 108 | 0.3% |
| Polish | 761 | 2.4% |
| Portuguese | 130 | 0.4% |
| Potawatomi | 26 | 0.1% |
| Puerto Rican | 110 | 0.3% |
| Romanian | 201 | 0.6% |
| Russian | 61 | 0.2% |
| Scandinavian | 61 | 0.2% |
| Scotch-Irish | 388 | 1.2% |
| Scottish | 477 | 1.5% |
| Serbian | 260 | 0.8% |
| Sioux | 17 | 0.1% |
| Slavic | 34 | 0.1% |
| Slovak | 394 | 1.2% |
| Slovene | 41 | 0.1% |
| South American | 40 | 0.1% |
| Spanish | 52 | 0.2% |
| Subsaharan African | 663 | 2.1% |
| Swedish | 133 | 0.4% |
| Swiss | 529 | 1.6% |
| Syrian | 23 | 0.1% |
| Ukrainian | 55 | 0.2% |
| Vietnamese | 22 | 0.1% |
| Welsh | 383 | 1.2% |
| Yugoslavian | 24 | 0.1% | View All 76 Rows |
Immigrants in Massillon
The most numerous immigrant groups reported in Massillon came from Asia (187 | 0.6%), Europe (151 | 0.5%), Eastern Asia (133 | 0.4%), China (113 | 0.4%), and Latin America (113 | 0.4%), together accounting for 2.2% of all Massillon residents.
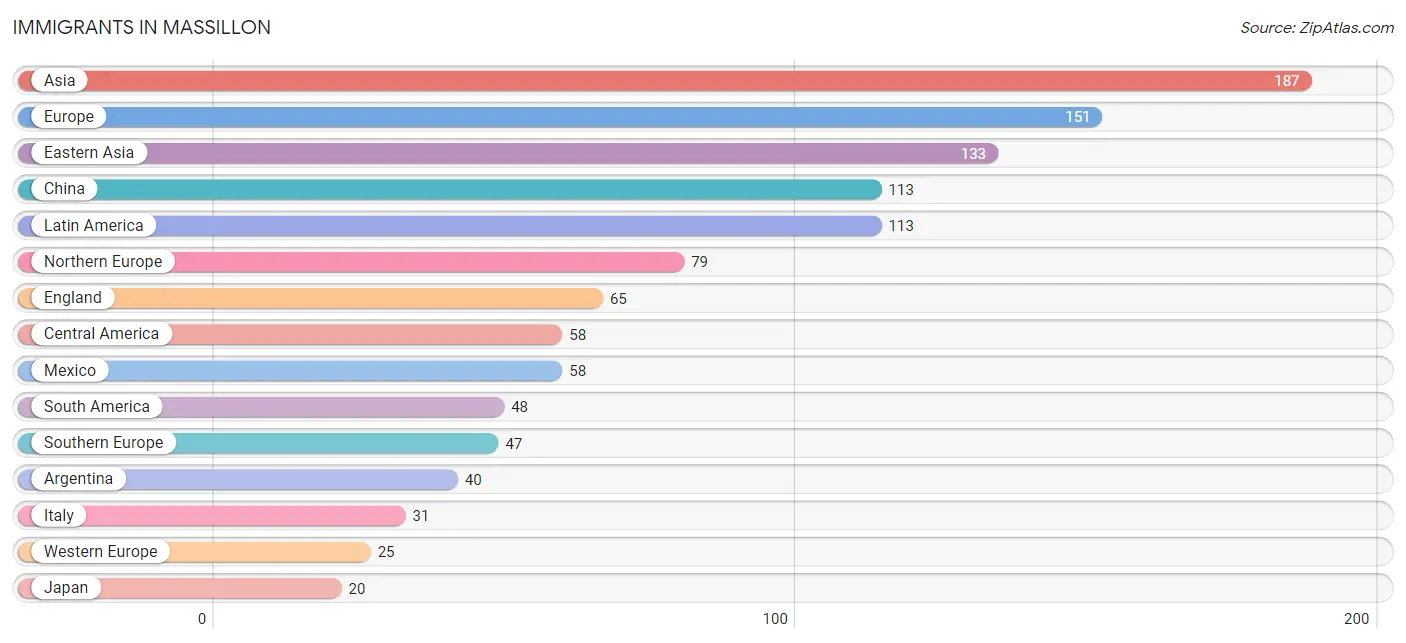
| Immigration Origin | # Population | % Population |
| Argentina | 40 | 0.1% |
| Asia | 187 | 0.6% |
| Canada | 9 | 0.0% |
| Caribbean | 7 | 0.0% |
| Central America | 58 | 0.2% |
| China | 113 | 0.4% |
| Cuba | 7 | 0.0% |
| Eastern Asia | 133 | 0.4% |
| England | 65 | 0.2% |
| Europe | 151 | 0.5% |
| France | 12 | 0.0% |
| Germany | 13 | 0.0% |
| Italy | 31 | 0.1% |
| Japan | 20 | 0.1% |
| Kuwait | 8 | 0.0% |
| Latin America | 113 | 0.4% |
| Lebanon | 10 | 0.0% |
| Mexico | 58 | 0.2% |
| Northern Europe | 79 | 0.3% |
| Philippines | 20 | 0.1% |
| Portugal | 16 | 0.1% |
| South America | 48 | 0.2% |
| South Eastern Asia | 20 | 0.1% |
| Southern Europe | 47 | 0.2% |
| Venezuela | 8 | 0.0% |
| Western Asia | 18 | 0.1% |
| Western Europe | 25 | 0.1% | View All 27 Rows |
Sex and Age in Massillon
Sex and Age in Massillon
The most populous age groups in Massillon are 35 to 39 Years (1,270 | 8.0%) for men and 35 to 39 Years (1,295 | 8.0%) for women.
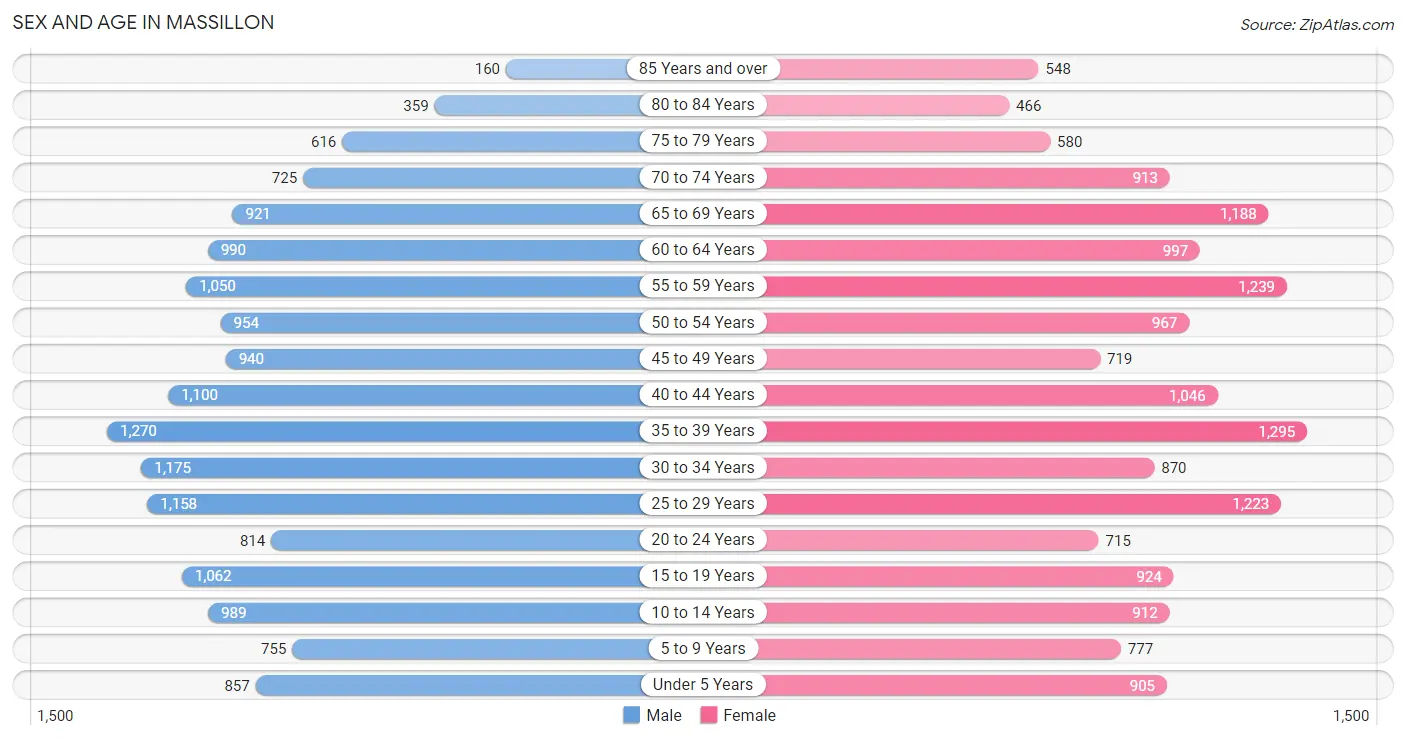
| Age Bracket | Male | Female |
| Under 5 Years | 857 (5.4%) | 905 (5.6%) |
| 5 to 9 Years | 755 (4.8%) | 777 (4.8%) |
| 10 to 14 Years | 989 (6.2%) | 912 (5.6%) |
| 15 to 19 Years | 1,062 (6.7%) | 924 (5.7%) |
| 20 to 24 Years | 814 (5.1%) | 715 (4.4%) |
| 25 to 29 Years | 1,158 (7.3%) | 1,223 (7.5%) |
| 30 to 34 Years | 1,175 (7.4%) | 870 (5.3%) |
| 35 to 39 Years | 1,270 (8.0%) | 1,295 (8.0%) |
| 40 to 44 Years | 1,100 (6.9%) | 1,046 (6.4%) |
| 45 to 49 Years | 940 (5.9%) | 719 (4.4%) |
| 50 to 54 Years | 954 (6.0%) | 967 (5.9%) |
| 55 to 59 Years | 1,050 (6.6%) | 1,239 (7.6%) |
| 60 to 64 Years | 990 (6.2%) | 997 (6.1%) |
| 65 to 69 Years | 921 (5.8%) | 1,188 (7.3%) |
| 70 to 74 Years | 725 (4.6%) | 913 (5.6%) |
| 75 to 79 Years | 616 (3.9%) | 580 (3.6%) |
| 80 to 84 Years | 359 (2.3%) | 466 (2.9%) |
| 85 Years and over | 160 (1.0%) | 548 (3.4%) |
| Total | 15,895 (100.0%) | 16,284 (100.0%) |
Families and Households in Massillon
Median Family Size in Massillon
The median family size in Massillon is 2.81 persons per family, with single male/father families (915 | 11.0%) accounting for the largest median family size of 2.9 persons per family. On the other hand, single female/mother families (1,970 | 23.6%) represent the smallest median family size with 2.67 persons per family.
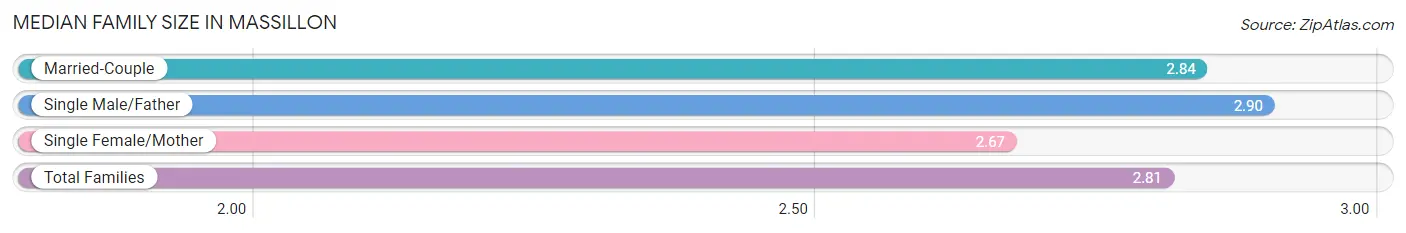
| Family Type | # Families | Family Size |
| Married-Couple | 5,452 (65.4%) | 2.84 |
| Single Male/Father | 915 (11.0%) | 2.90 |
| Single Female/Mother | 1,970 (23.6%) | 2.67 |
| Total Families | 8,337 (100.0%) | 2.81 |
Median Household Size in Massillon
The median household size in Massillon is 2.25 persons per household, with single male/father households (915 | 6.6%) accounting for the largest median household size of 3.5 persons per household. non-family households (5,637 | 40.3%) represent the smallest median household size with 1.24 persons per household.
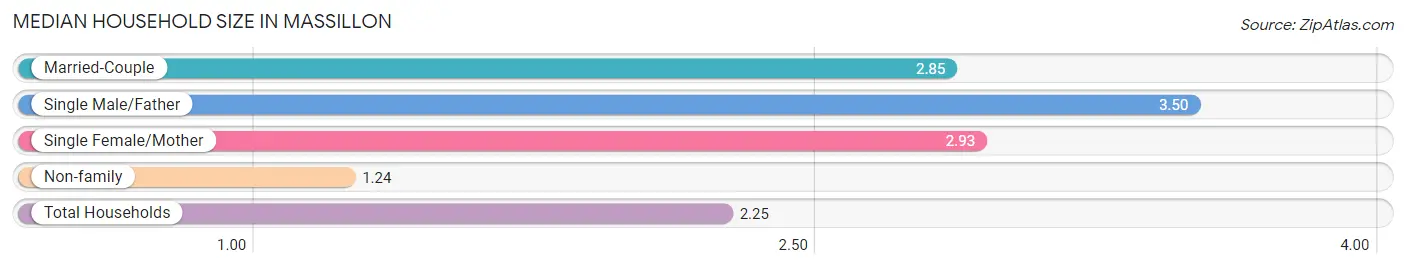
| Household Type | # Households | Household Size |
| Married-Couple | 5,452 (39.0%) | 2.85 |
| Single Male/Father | 915 (6.6%) | 3.50 |
| Single Female/Mother | 1,970 (14.1%) | 2.93 |
| Non-family | 5,637 (40.3%) | 1.24 |
| Total Households | 13,974 (100.0%) | 2.25 |
Household Size by Marriage Status in Massillon
Out of a total of 13,974 households in Massillon, 8,337 (59.7%) are family households, while 5,637 (40.3%) are nonfamily households. The most numerous type of family households are 2-person households, comprising 4,200, and the most common type of nonfamily households are 1-person households, comprising 4,469.
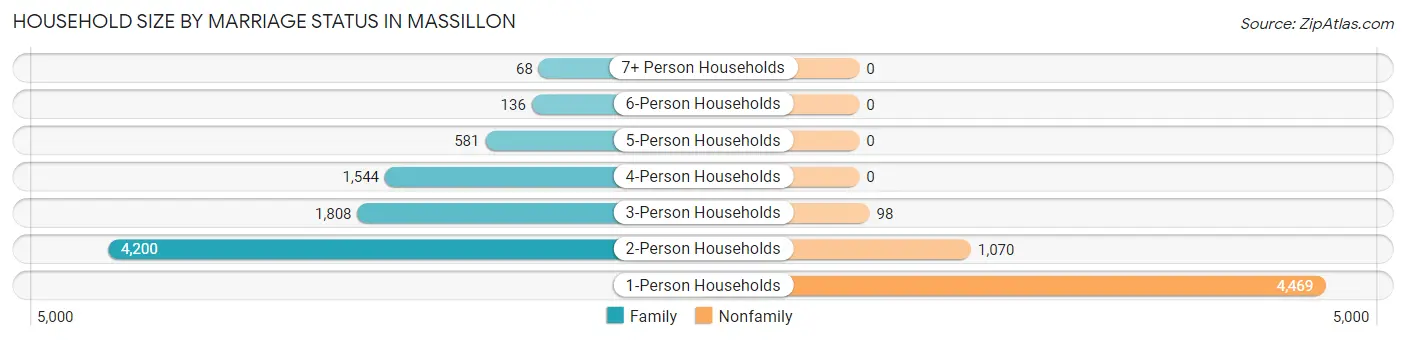
| Household Size | Family Households | Nonfamily Households |
| 1-Person Households | - | 4,469 (32.0%) |
| 2-Person Households | 4,200 (30.1%) | 1,070 (7.7%) |
| 3-Person Households | 1,808 (12.9%) | 98 (0.7%) |
| 4-Person Households | 1,544 (11.1%) | 0 (0.0%) |
| 5-Person Households | 581 (4.2%) | 0 (0.0%) |
| 6-Person Households | 136 (1.0%) | 0 (0.0%) |
| 7+ Person Households | 68 (0.5%) | 0 (0.0%) |
| Total | 8,337 (59.7%) | 5,637 (40.3%) |
Female Fertility in Massillon
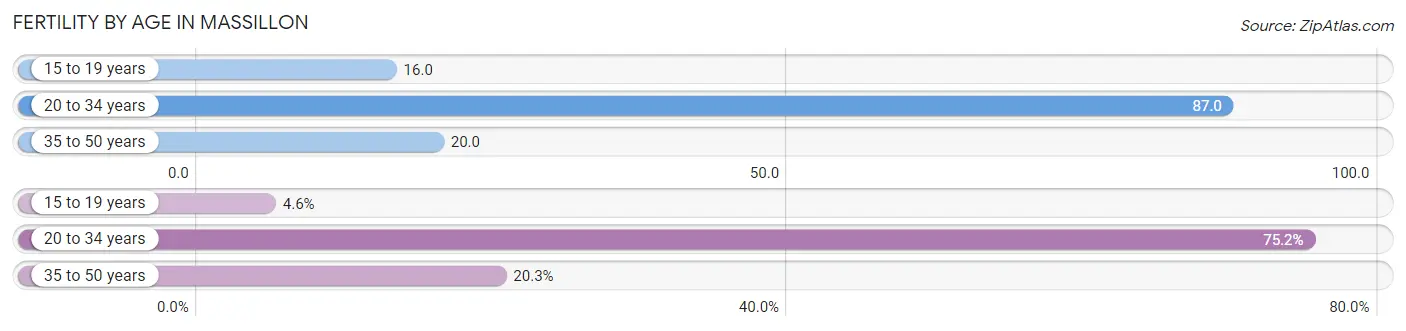
Fertility by Age in Massillon
Average fertility rate in Massillon is 47.0 births per 1,000 women. Women in the age bracket of 20 to 34 years have the highest fertility rate with 87.0 births per 1,000 women. Women in the age bracket of 20 to 34 years acount for 75.1% of all women with births.
| Age Bracket | Women with Births | Births / 1,000 Women |
| 15 to 19 years | 15 (4.6%) | 16.0 |
| 20 to 34 years | 245 (75.1%) | 87.0 |
| 35 to 50 years | 66 (20.3%) | 20.0 |
| Total | 326 (100.0%) | 47.0 |
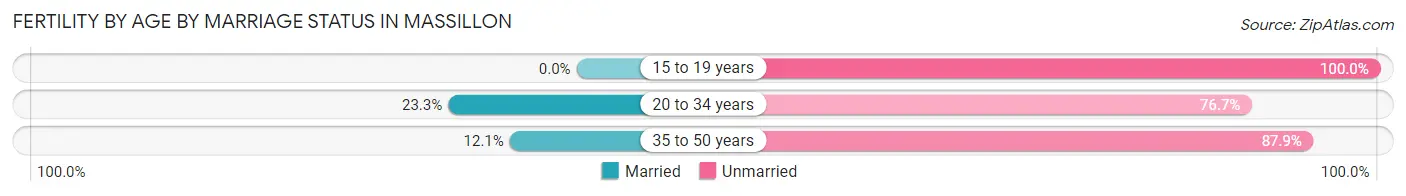
Fertility by Age by Marriage Status in Massillon
19.9% of women with births (326) in Massillon are married. The highest percentage of unmarried women with births falls into 15 to 19 years age bracket with 100.0% of them unmarried at the time of birth, while the lowest percentage of unmarried women with births belong to 20 to 34 years age bracket with 76.7% of them unmarried.
| Age Bracket | Married | Unmarried |
| 15 to 19 years | 0 (0.0%) | 15 (100.0%) |
| 20 to 34 years | 57 (23.3%) | 188 (76.7%) |
| 35 to 50 years | 8 (12.1%) | 58 (87.9%) |
| Total | 65 (19.9%) | 261 (80.1%) |
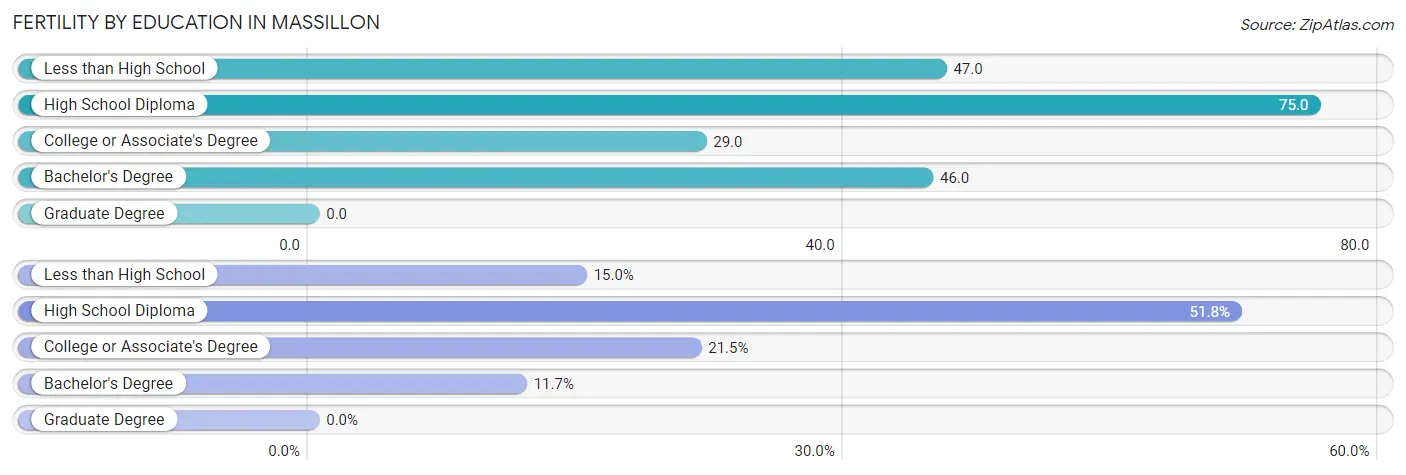
Fertility by Education in Massillon
| Educational Attainment | Women with Births | Births / 1,000 Women |
| Less than High School | 49 (15.0%) | 47.0 |
| High School Diploma | 169 (51.8%) | 75.0 |
| College or Associate's Degree | 70 (21.5%) | 29.0 |
| Bachelor's Degree | 38 (11.7%) | 46.0 |
| Graduate Degree | 0 (0.0%) | 0.0 |
| Total | 326 (100.0%) | 47.0 |
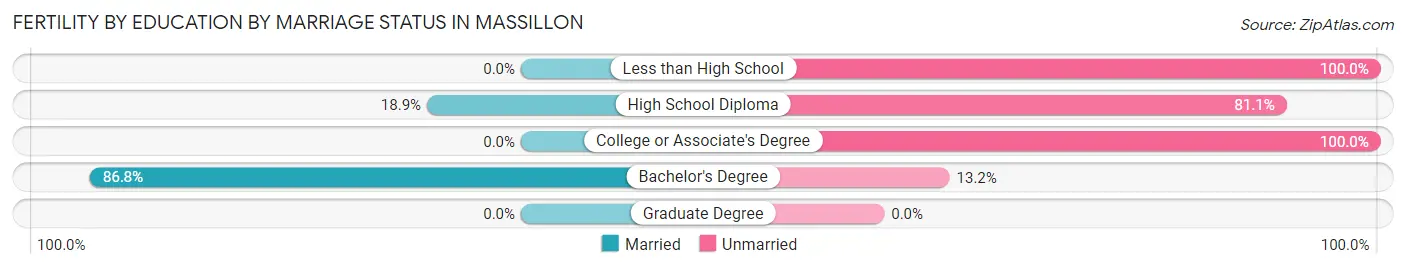
Fertility by Education by Marriage Status in Massillon
80.1% of women with births in Massillon are unmarried. Women with the educational attainment of bachelor's degree are most likely to be married with 86.8% of them married at childbirth, while women with the educational attainment of less than high school are least likely to be married with 100.0% of them unmarried at childbirth.
| Educational Attainment | Married | Unmarried |
| Less than High School | 0 (0.0%) | 49 (100.0%) |
| High School Diploma | 32 (18.9%) | 137 (81.1%) |
| College or Associate's Degree | 0 (0.0%) | 70 (100.0%) |
| Bachelor's Degree | 33 (86.8%) | 5 (13.2%) |
| Graduate Degree | 0 (0.0%) | 0 (0.0%) |
| Total | 65 (19.9%) | 261 (80.1%) |
Employment Characteristics in Massillon
Employment by Class of Employer in Massillon
Among the 15,894 employed individuals in Massillon, private company employees (11,931 | 75.1%), local government employees (1,113 | 7.0%), and not-for-profit organizations (1,079 | 6.8%) make up the most common classes of employment.
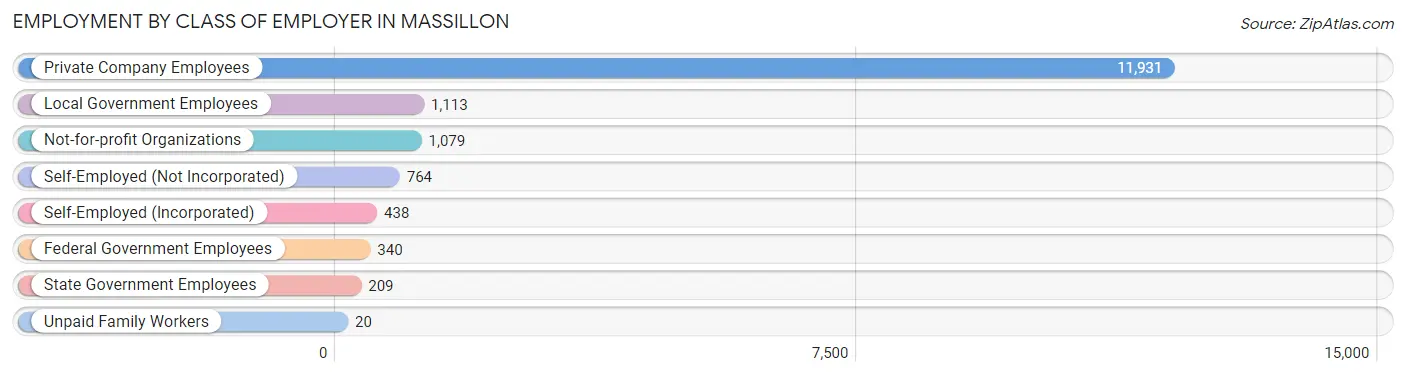
| Employer Class | # Employees | % Employees |
| Private Company Employees | 11,931 | 75.1% |
| Self-Employed (Incorporated) | 438 | 2.8% |
| Self-Employed (Not Incorporated) | 764 | 4.8% |
| Not-for-profit Organizations | 1,079 | 6.8% |
| Local Government Employees | 1,113 | 7.0% |
| State Government Employees | 209 | 1.3% |
| Federal Government Employees | 340 | 2.1% |
| Unpaid Family Workers | 20 | 0.1% |
| Total | 15,894 | 100.0% |
Employment Status by Age in Massillon
According to the labor force statistics for Massillon, out of the total population over 16 years of age (26,460), 63.4% or 16,776 individuals are in the labor force, with 3.9% or 654 of them unemployed. The age group with the highest labor force participation rate is 35 to 44 years, with 86.9% or 4,094 individuals in the labor force. Within the labor force, the 16 to 19 years age range has the highest percentage of unemployed individuals, with 10.7% or 88 of them being unemployed.
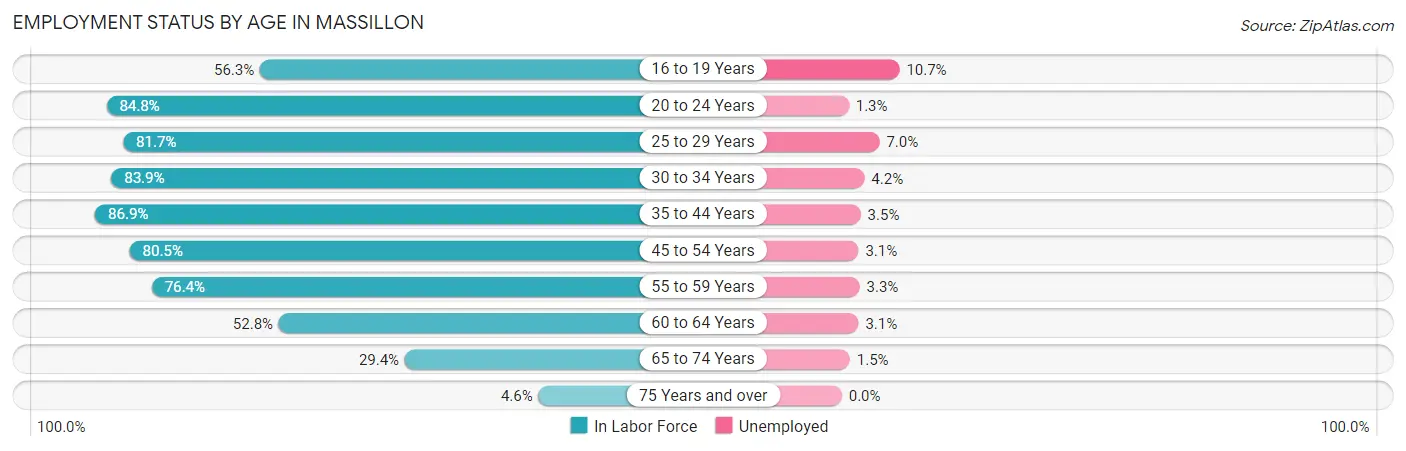
| Age Bracket | In Labor Force | Unemployed |
| 16 to 19 Years | 823 (56.3%) | 88 (10.7%) |
| 20 to 24 Years | 1,297 (84.8%) | 17 (1.3%) |
| 25 to 29 Years | 1,945 (81.7%) | 136 (7.0%) |
| 30 to 34 Years | 1,716 (83.9%) | 72 (4.2%) |
| 35 to 44 Years | 4,094 (86.9%) | 143 (3.5%) |
| 45 to 54 Years | 2,882 (80.5%) | 89 (3.1%) |
| 55 to 59 Years | 1,749 (76.4%) | 58 (3.3%) |
| 60 to 64 Years | 1,049 (52.8%) | 33 (3.1%) |
| 65 to 74 Years | 1,102 (29.4%) | 17 (1.5%) |
| 75 Years and over | 126 (4.6%) | 0 (0.0%) |
| Total | 16,776 (63.4%) | 654 (3.9%) |
Employment Status by Educational Attainment in Massillon
According to labor force statistics for Massillon, 79.1% of individuals (13,441) out of the total population between 25 and 64 years of age (16,993) are in the labor force, with 3.9% or 524 of them being unemployed. The group with the highest labor force participation rate are those with the educational attainment of bachelor's degree or higher, with 86.6% or 2,588 individuals in the labor force. Within the labor force, individuals with less than high school education have the highest percentage of unemployment, with 15.6% or 112 of them being unemployed.
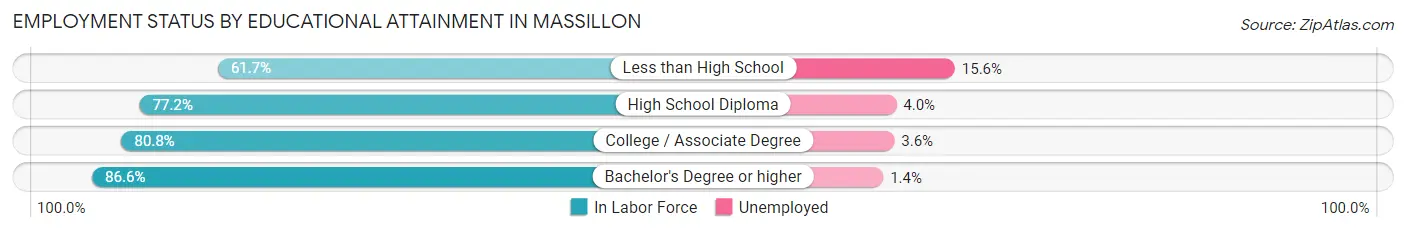
| Educational Attainment | In Labor Force | Unemployed |
| Less than High School | 718 (61.7%) | 181 (15.6%) |
| High School Diploma | 5,233 (77.2%) | 271 (4.0%) |
| College / Associate Degree | 4,900 (80.8%) | 218 (3.6%) |
| Bachelor's Degree or higher | 2,588 (86.6%) | 42 (1.4%) |
| Total | 13,441 (79.1%) | 663 (3.9%) |
Employment Occupations by Sex in Massillon
Management, Business, Science and Arts Occupations
The most common Management, Business, Science and Arts occupations in Massillon are Management (1,491 | 9.2%), Community & Social Service (1,215 | 7.5%), Education Instruction & Library (820 | 5.1%), Business & Financial (573 | 3.5%), and Health Diagnosing & Treating (571 | 3.5%).
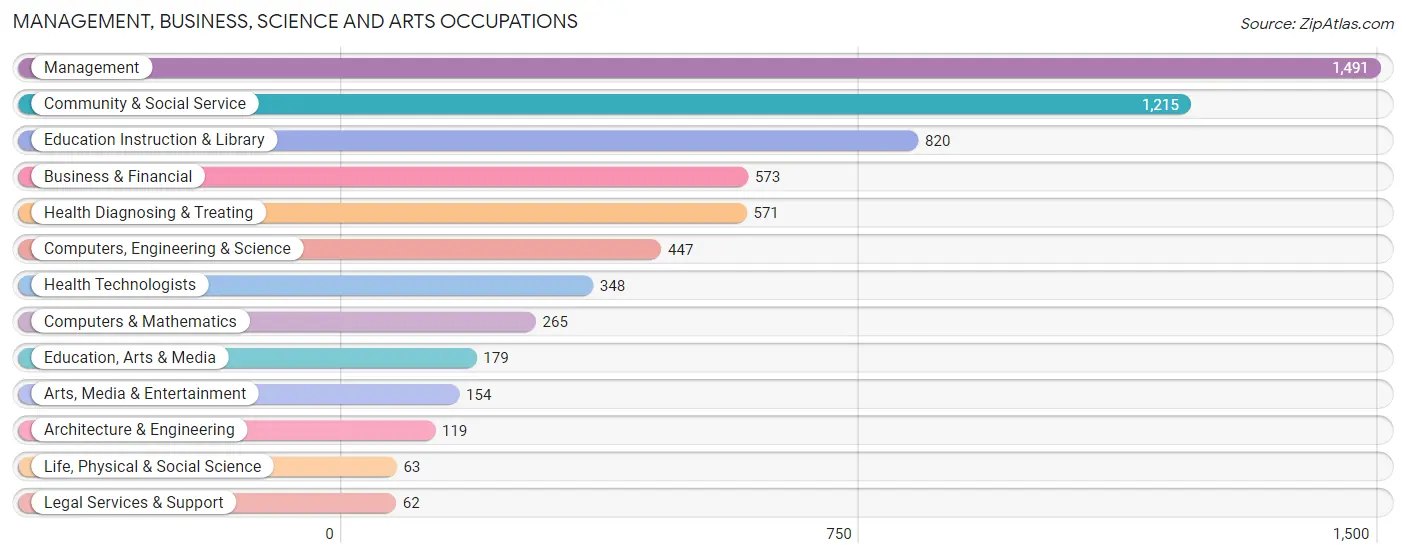
Management, Business, Science and Arts Occupations by Sex
Within the Management, Business, Science and Arts occupations in Massillon, the most male-oriented occupations are Management (67.9%), Computers & Mathematics (64.1%), and Computers, Engineering & Science (60.4%), while the most female-oriented occupations are Health Technologists (88.5%), Health Diagnosing & Treating (86.2%), and Education Instruction & Library (73.4%).
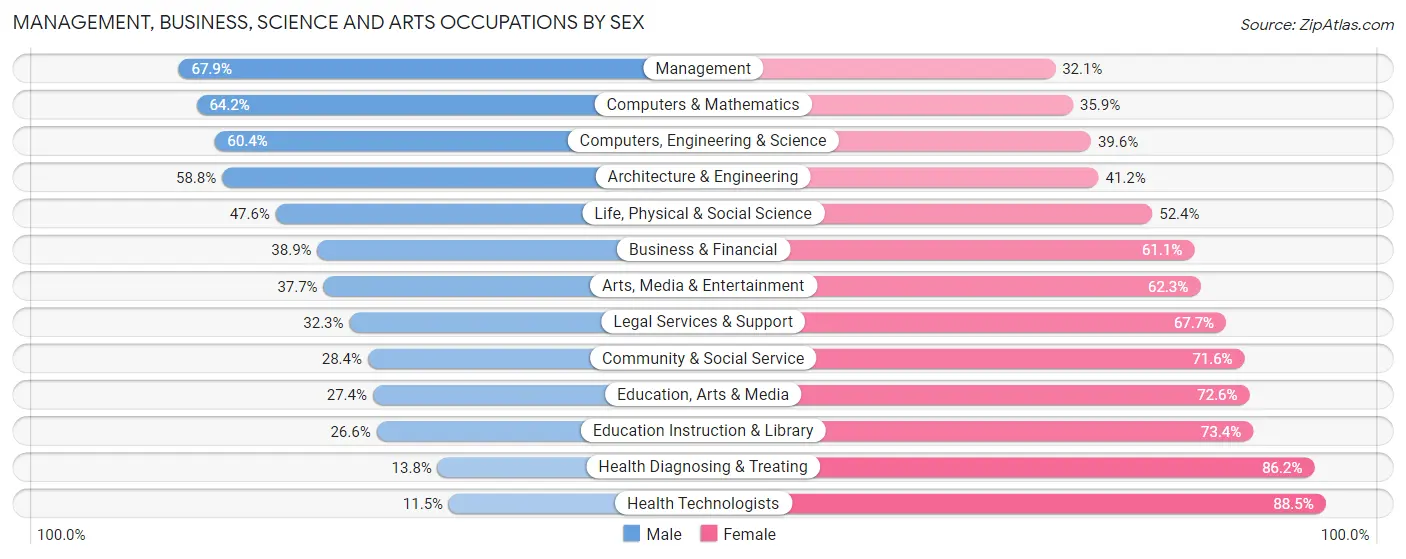
| Occupation | Male | Female |
| Management | 1,012 (67.9%) | 479 (32.1%) |
| Business & Financial | 223 (38.9%) | 350 (61.1%) |
| Computers, Engineering & Science | 270 (60.4%) | 177 (39.6%) |
| Computers & Mathematics | 170 (64.1%) | 95 (35.8%) |
| Architecture & Engineering | 70 (58.8%) | 49 (41.2%) |
| Life, Physical & Social Science | 30 (47.6%) | 33 (52.4%) |
| Community & Social Service | 345 (28.4%) | 870 (71.6%) |
| Education, Arts & Media | 49 (27.4%) | 130 (72.6%) |
| Legal Services & Support | 20 (32.3%) | 42 (67.7%) |
| Education Instruction & Library | 218 (26.6%) | 602 (73.4%) |
| Arts, Media & Entertainment | 58 (37.7%) | 96 (62.3%) |
| Health Diagnosing & Treating | 79 (13.8%) | 492 (86.2%) |
| Health Technologists | 40 (11.5%) | 308 (88.5%) |
| Total (Category) | 1,929 (44.9%) | 2,368 (55.1%) |
| Total (Overall) | 8,698 (53.9%) | 7,430 (46.1%) |
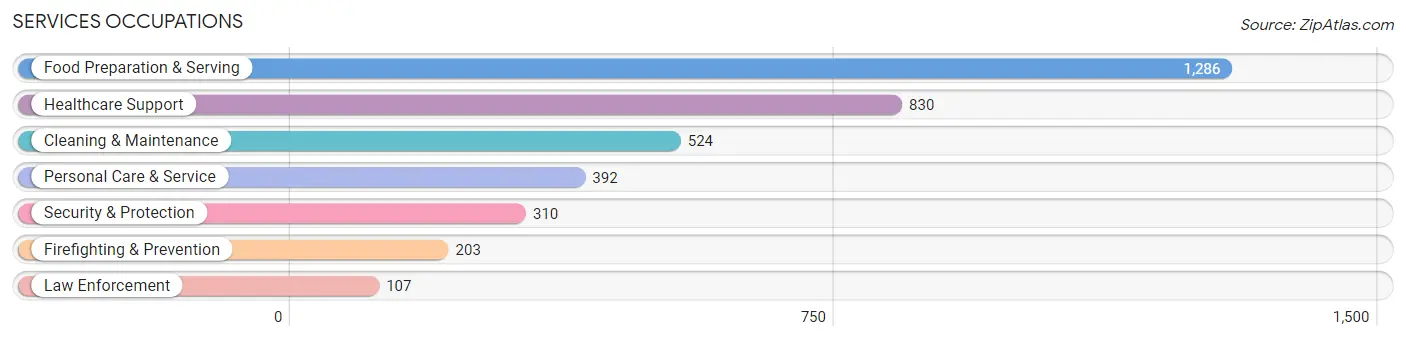
Services Occupations
The most common Services occupations in Massillon are Food Preparation & Serving (1,286 | 8.0%), Healthcare Support (830 | 5.1%), Cleaning & Maintenance (524 | 3.3%), Personal Care & Service (392 | 2.4%), and Security & Protection (310 | 1.9%).
Services Occupations by Sex
Within the Services occupations in Massillon, the most male-oriented occupations are Firefighting & Prevention (95.6%), Security & Protection (94.2%), and Law Enforcement (91.6%), while the most female-oriented occupations are Personal Care & Service (93.1%), Healthcare Support (87.5%), and Food Preparation & Serving (63.5%).
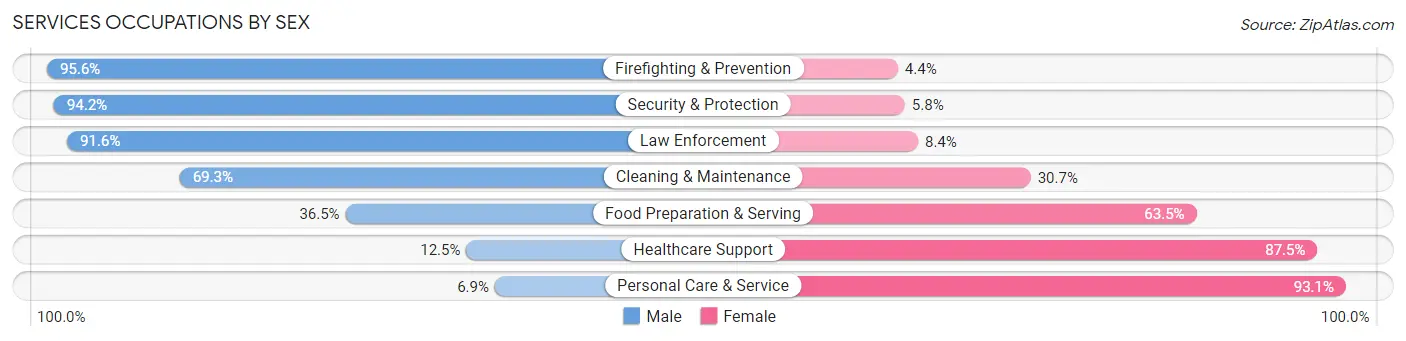
| Occupation | Male | Female |
| Healthcare Support | 104 (12.5%) | 726 (87.5%) |
| Security & Protection | 292 (94.2%) | 18 (5.8%) |
| Firefighting & Prevention | 194 (95.6%) | 9 (4.4%) |
| Law Enforcement | 98 (91.6%) | 9 (8.4%) |
| Food Preparation & Serving | 469 (36.5%) | 817 (63.5%) |
| Cleaning & Maintenance | 363 (69.3%) | 161 (30.7%) |
| Personal Care & Service | 27 (6.9%) | 365 (93.1%) |
| Total (Category) | 1,255 (37.6%) | 2,087 (62.5%) |
| Total (Overall) | 8,698 (53.9%) | 7,430 (46.1%) |
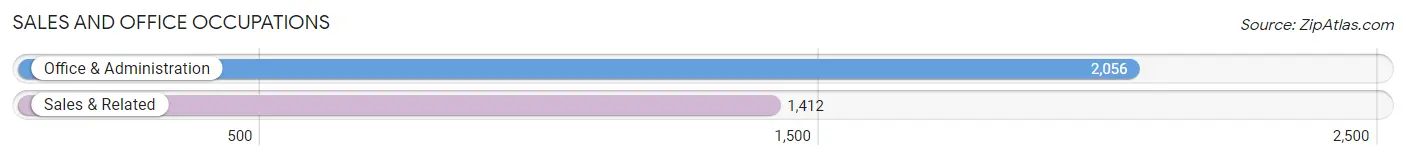
Sales and Office Occupations
The most common Sales and Office occupations in Massillon are Office & Administration (2,056 | 12.8%), and Sales & Related (1,412 | 8.7%).
Sales and Office Occupations by Sex
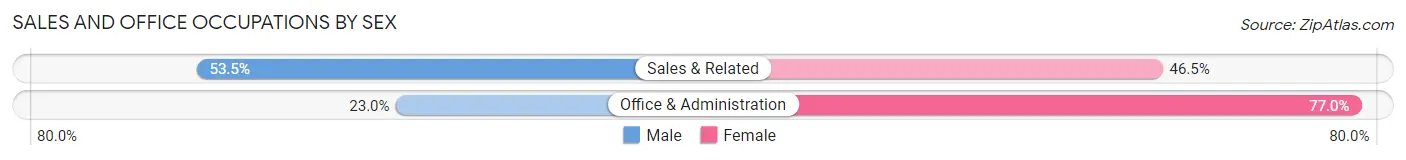
| Occupation | Male | Female |
| Sales & Related | 756 (53.5%) | 656 (46.5%) |
| Office & Administration | 472 (23.0%) | 1,584 (77.0%) |
| Total (Category) | 1,228 (35.4%) | 2,240 (64.6%) |
| Total (Overall) | 8,698 (53.9%) | 7,430 (46.1%) |
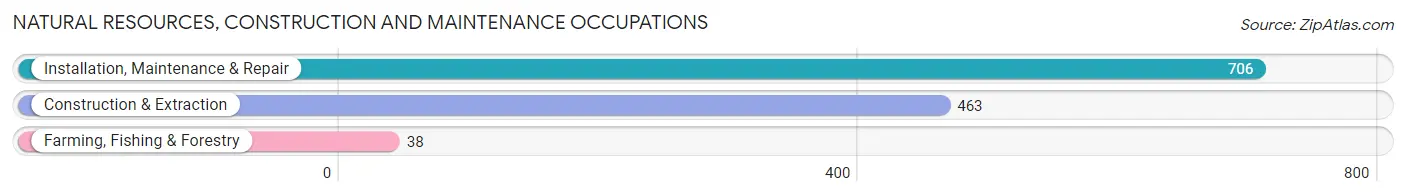
Natural Resources, Construction and Maintenance Occupations
The most common Natural Resources, Construction and Maintenance occupations in Massillon are Installation, Maintenance & Repair (706 | 4.4%), Construction & Extraction (463 | 2.9%), and Farming, Fishing & Forestry (38 | 0.2%).
Natural Resources, Construction and Maintenance Occupations by Sex
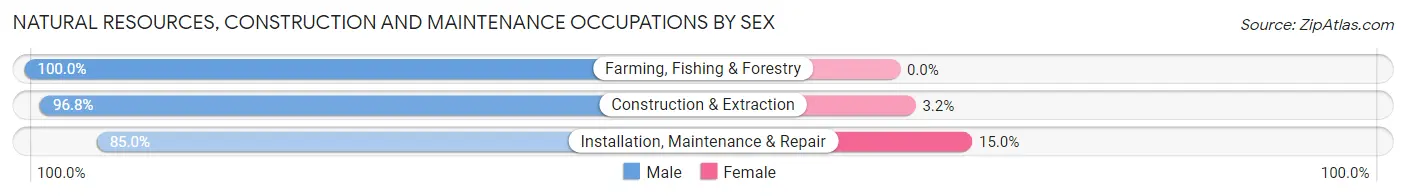
| Occupation | Male | Female |
| Farming, Fishing & Forestry | 38 (100.0%) | 0 (0.0%) |
| Construction & Extraction | 448 (96.8%) | 15 (3.2%) |
| Installation, Maintenance & Repair | 600 (85.0%) | 106 (15.0%) |
| Total (Category) | 1,086 (90.0%) | 121 (10.0%) |
| Total (Overall) | 8,698 (53.9%) | 7,430 (46.1%) |
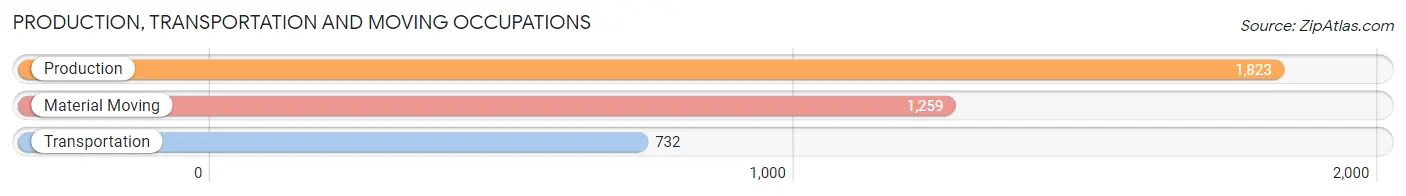
Production, Transportation and Moving Occupations
The most common Production, Transportation and Moving occupations in Massillon are Production (1,823 | 11.3%), Material Moving (1,259 | 7.8%), and Transportation (732 | 4.5%).
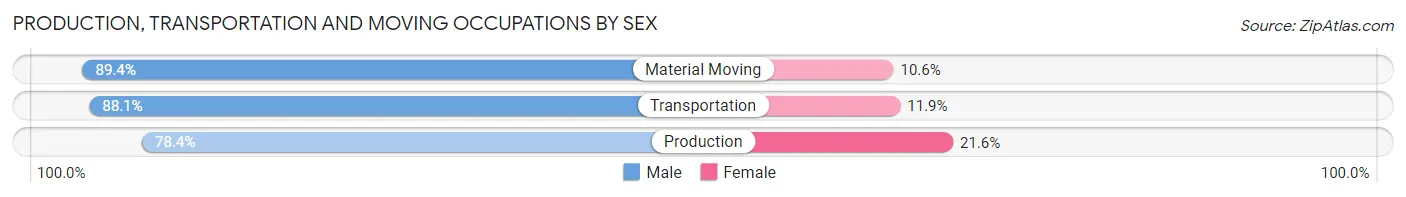
Production, Transportation and Moving Occupations by Sex
| Occupation | Male | Female |
| Production | 1,430 (78.4%) | 393 (21.6%) |
| Transportation | 645 (88.1%) | 87 (11.9%) |
| Material Moving | 1,125 (89.4%) | 134 (10.6%) |
| Total (Category) | 3,200 (83.9%) | 614 (16.1%) |
| Total (Overall) | 8,698 (53.9%) | 7,430 (46.1%) |
Employment Industries by Sex in Massillon
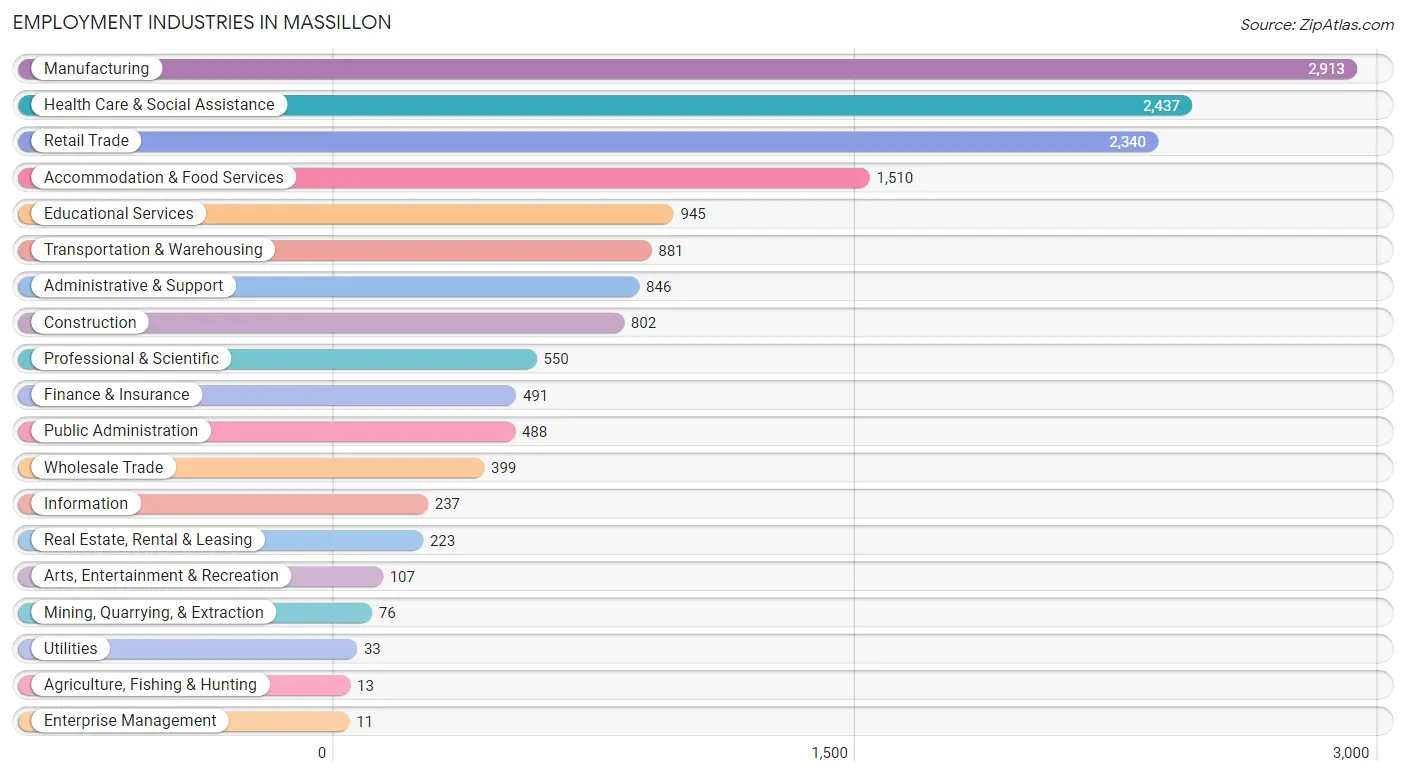
Employment Industries in Massillon
The major employment industries in Massillon include Manufacturing (2,913 | 18.1%), Health Care & Social Assistance (2,437 | 15.1%), Retail Trade (2,340 | 14.5%), Accommodation & Food Services (1,510 | 9.4%), and Educational Services (945 | 5.9%).
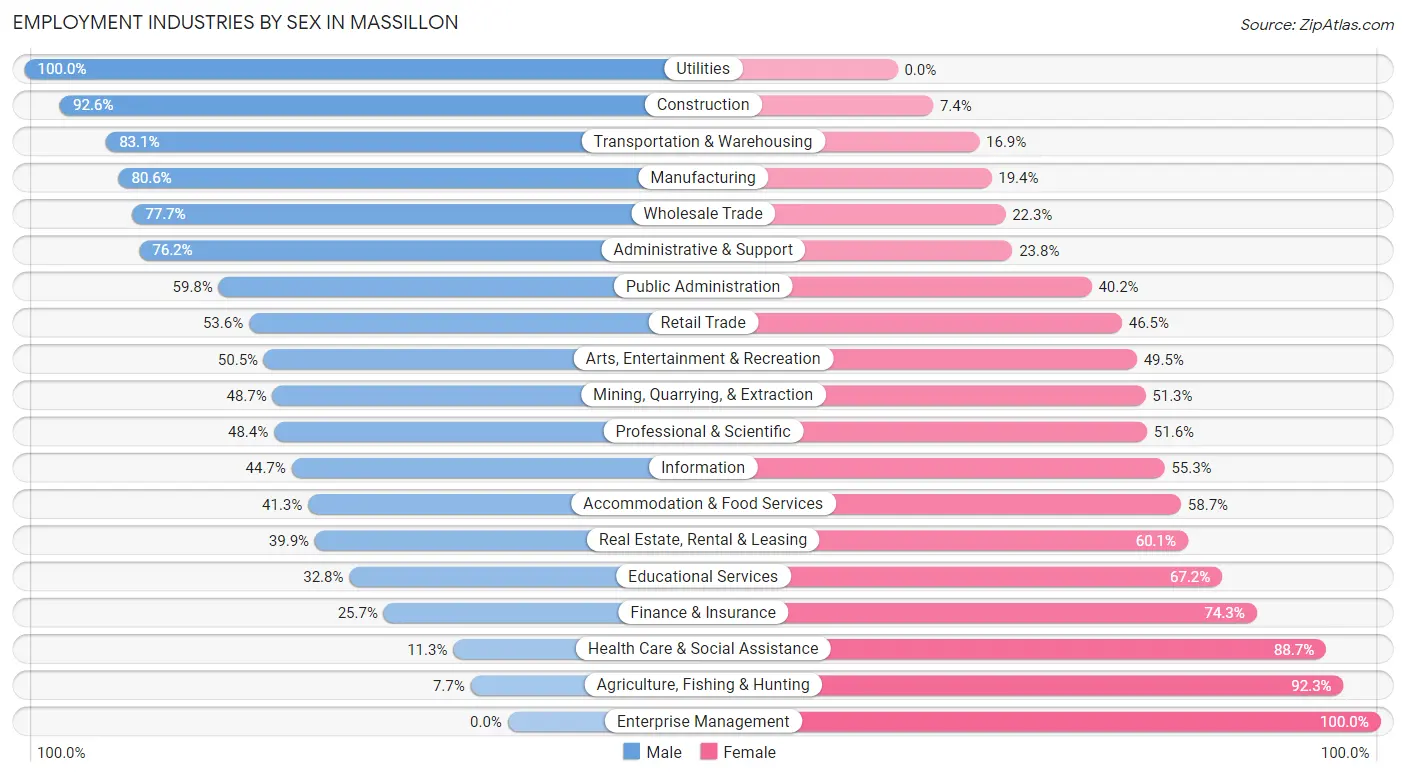
Employment Industries by Sex in Massillon
The Massillon industries that see more men than women are Utilities (100.0%), Construction (92.6%), and Transportation & Warehousing (83.1%), whereas the industries that tend to have a higher number of women are Enterprise Management (100.0%), Agriculture, Fishing & Hunting (92.3%), and Health Care & Social Assistance (88.7%).
| Industry | Male | Female |
| Agriculture, Fishing & Hunting | 1 (7.7%) | 12 (92.3%) |
| Mining, Quarrying, & Extraction | 37 (48.7%) | 39 (51.3%) |
| Construction | 743 (92.6%) | 59 (7.4%) |
| Manufacturing | 2,347 (80.6%) | 566 (19.4%) |
| Wholesale Trade | 310 (77.7%) | 89 (22.3%) |
| Retail Trade | 1,253 (53.5%) | 1,087 (46.5%) |
| Transportation & Warehousing | 732 (83.1%) | 149 (16.9%) |
| Utilities | 33 (100.0%) | 0 (0.0%) |
| Information | 106 (44.7%) | 131 (55.3%) |
| Finance & Insurance | 126 (25.7%) | 365 (74.3%) |
| Real Estate, Rental & Leasing | 89 (39.9%) | 134 (60.1%) |
| Professional & Scientific | 266 (48.4%) | 284 (51.6%) |
| Enterprise Management | 0 (0.0%) | 11 (100.0%) |
| Administrative & Support | 645 (76.2%) | 201 (23.8%) |
| Educational Services | 310 (32.8%) | 635 (67.2%) |
| Health Care & Social Assistance | 275 (11.3%) | 2,162 (88.7%) |
| Arts, Entertainment & Recreation | 54 (50.5%) | 53 (49.5%) |
| Accommodation & Food Services | 624 (41.3%) | 886 (58.7%) |
| Public Administration | 292 (59.8%) | 196 (40.2%) |
| Total | 8,698 (53.9%) | 7,430 (46.1%) |
Education in Massillon
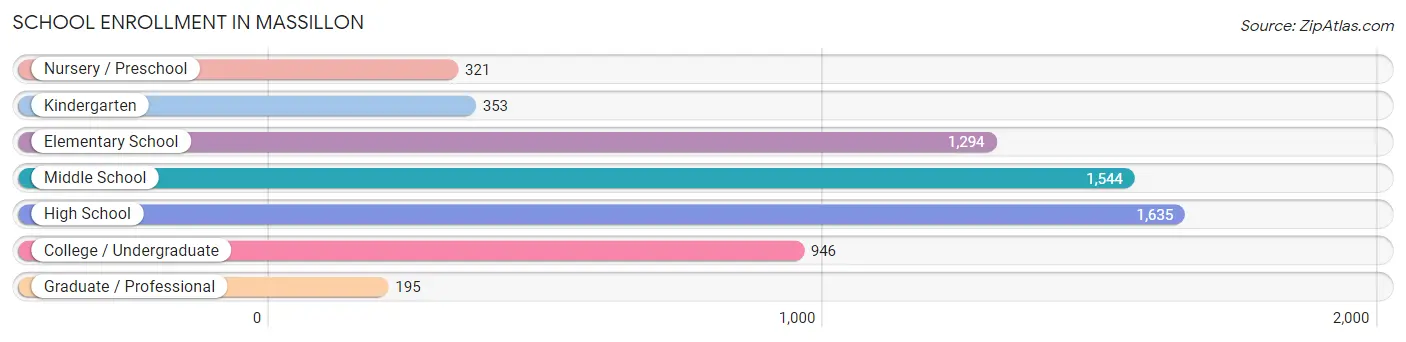
School Enrollment in Massillon
The most common levels of schooling among the 6,288 students in Massillon are high school (1,635 | 26.0%), middle school (1,544 | 24.5%), and elementary school (1,294 | 20.6%).
| School Level | # Students | % Students |
| Nursery / Preschool | 321 | 5.1% |
| Kindergarten | 353 | 5.6% |
| Elementary School | 1,294 | 20.6% |
| Middle School | 1,544 | 24.5% |
| High School | 1,635 | 26.0% |
| College / Undergraduate | 946 | 15.0% |
| Graduate / Professional | 195 | 3.1% |
| Total | 6,288 | 100.0% |
School Enrollment by Age by Funding Source in Massillon
Out of a total of 6,288 students who are enrolled in schools in Massillon, 786 (12.5%) attend a private institution, while the remaining 5,502 (87.5%) are enrolled in public schools. The age group of 35 years and over has the highest likelihood of being enrolled in private schools, with 107 (46.3% in the age bracket) enrolled. Conversely, the age group of 18 to 19 year olds has the lowest likelihood of being enrolled in a private school, with 549 (98.9% in the age bracket) attending a public institution.
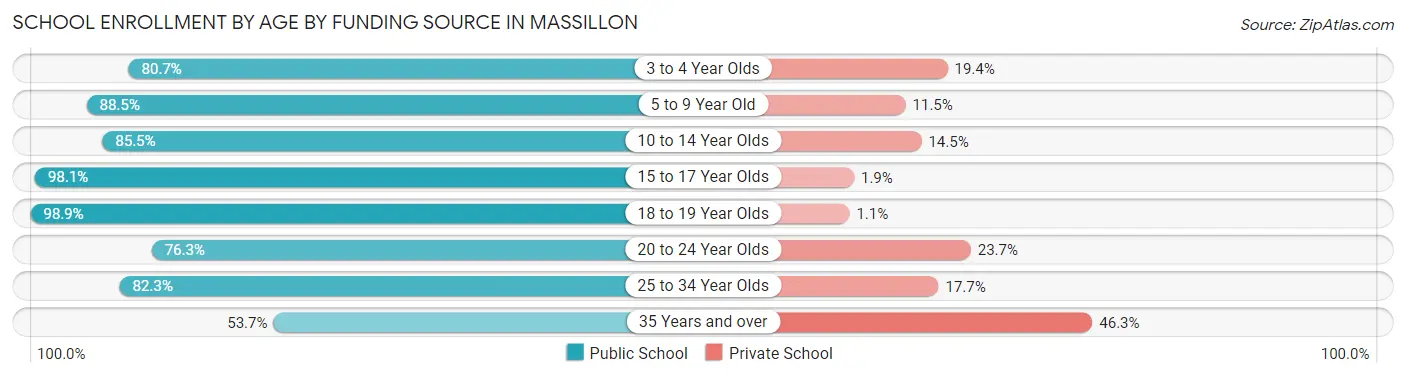
| Age Bracket | Public School | Private School |
| 3 to 4 Year Olds | 250 (80.6%) | 60 (19.4%) |
| 5 to 9 Year Old | 1,250 (88.5%) | 163 (11.5%) |
| 10 to 14 Year Olds | 1,611 (85.5%) | 273 (14.5%) |
| 15 to 17 Year Olds | 1,118 (98.1%) | 22 (1.9%) |
| 18 to 19 Year Olds | 549 (98.9%) | 6 (1.1%) |
| 20 to 24 Year Olds | 274 (76.3%) | 85 (23.7%) |
| 25 to 34 Year Olds | 326 (82.3%) | 70 (17.7%) |
| 35 Years and over | 124 (53.7%) | 107 (46.3%) |
| Total | 5,502 (87.5%) | 786 (12.5%) |
Educational Attainment by Field of Study in Massillon
Business (983 | 23.9%), education (904 | 22.0%), science & technology (600 | 14.6%), arts & humanities (255 | 6.2%), and visual & performing arts (206 | 5.0%) are the most common fields of study among 4,113 individuals in Massillon who have obtained a bachelor's degree or higher.
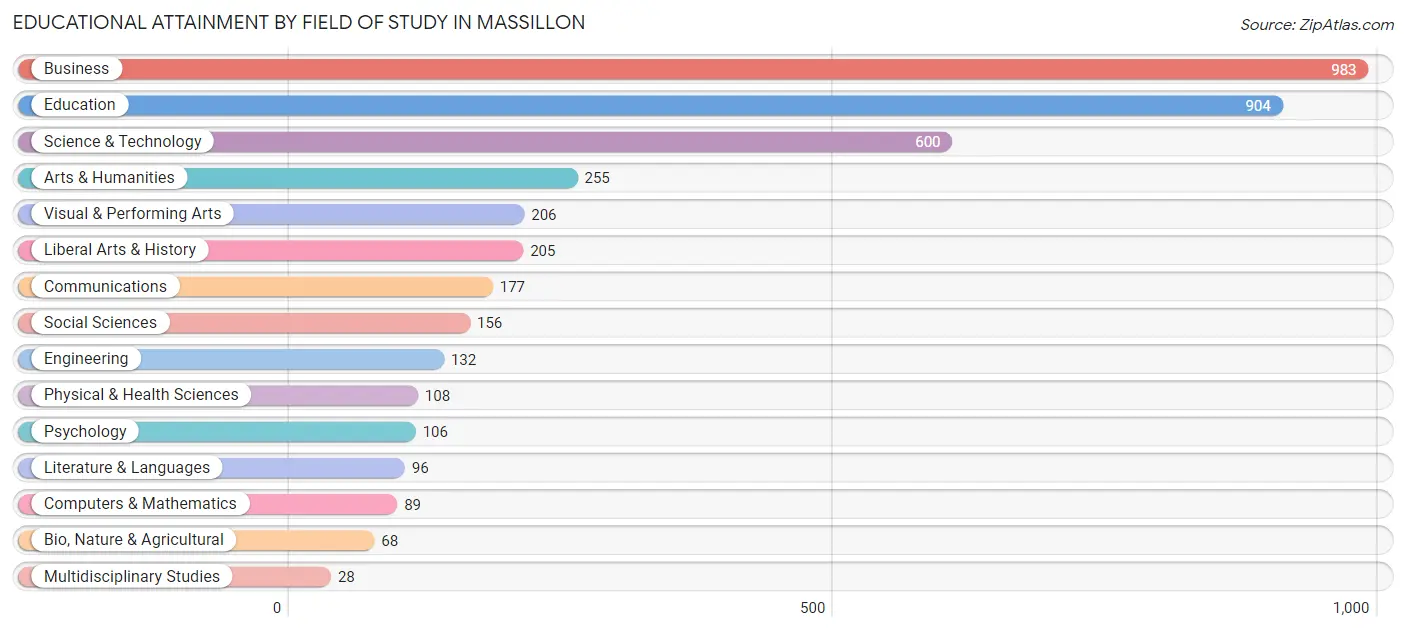
| Field of Study | # Graduates | % Graduates |
| Computers & Mathematics | 89 | 2.2% |
| Bio, Nature & Agricultural | 68 | 1.7% |
| Physical & Health Sciences | 108 | 2.6% |
| Psychology | 106 | 2.6% |
| Social Sciences | 156 | 3.8% |
| Engineering | 132 | 3.2% |
| Multidisciplinary Studies | 28 | 0.7% |
| Science & Technology | 600 | 14.6% |
| Business | 983 | 23.9% |
| Education | 904 | 22.0% |
| Literature & Languages | 96 | 2.3% |
| Liberal Arts & History | 205 | 5.0% |
| Visual & Performing Arts | 206 | 5.0% |
| Communications | 177 | 4.3% |
| Arts & Humanities | 255 | 6.2% |
| Total | 4,113 | 100.0% |
Transportation & Commute in Massillon
Vehicle Availability by Sex in Massillon
The most prevalent vehicle ownership categories in Massillon are males with 2 vehicles (3,852, accounting for 45.1%) and females with 2 vehicles (3,289, making up 52.6%).
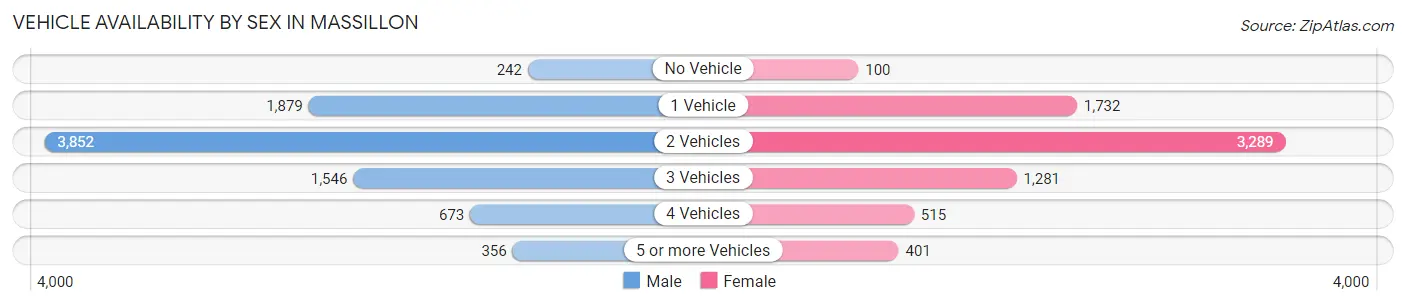
| Vehicles Available | Male | Female |
| No Vehicle | 242 (2.8%) | 100 (1.4%) |
| 1 Vehicle | 1,879 (22.0%) | 1,732 (23.7%) |
| 2 Vehicles | 3,852 (45.1%) | 3,289 (44.9%) |
| 3 Vehicles | 1,546 (18.1%) | 1,281 (17.5%) |
| 4 Vehicles | 673 (7.9%) | 515 (7.0%) |
| 5 or more Vehicles | 356 (4.2%) | 401 (5.5%) |
| Total | 8,548 (100.0%) | 7,318 (100.0%) |
Commute Time in Massillon
The most frequently occuring commute durations in Massillon are 15 to 19 minutes (2,643 commuters, 18.0%), 10 to 14 minutes (2,398 commuters, 16.3%), and 20 to 24 minutes (2,238 commuters, 15.2%).
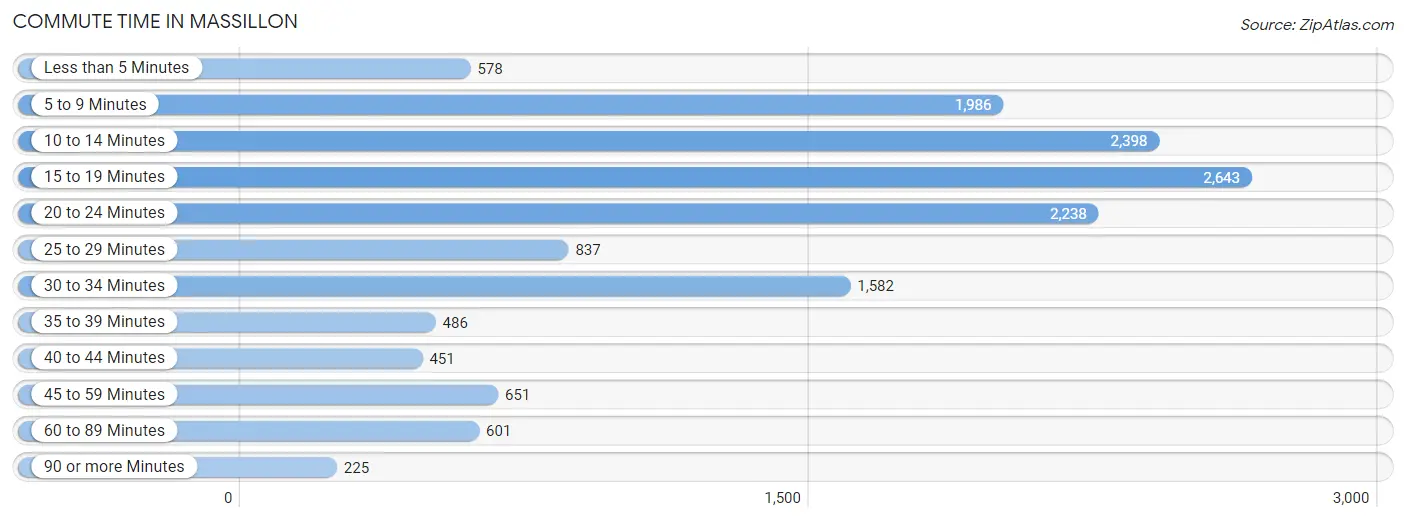
| Commute Time | # Commuters | % Commuters |
| Less than 5 Minutes | 578 | 3.9% |
| 5 to 9 Minutes | 1,986 | 13.5% |
| 10 to 14 Minutes | 2,398 | 16.3% |
| 15 to 19 Minutes | 2,643 | 18.0% |
| 20 to 24 Minutes | 2,238 | 15.2% |
| 25 to 29 Minutes | 837 | 5.7% |
| 30 to 34 Minutes | 1,582 | 10.8% |
| 35 to 39 Minutes | 486 | 3.3% |
| 40 to 44 Minutes | 451 | 3.1% |
| 45 to 59 Minutes | 651 | 4.4% |
| 60 to 89 Minutes | 601 | 4.1% |
| 90 or more Minutes | 225 | 1.5% |
Commute Time by Sex in Massillon
The most common commute times in Massillon are 10 to 14 minutes (1,358 commuters, 16.8%) for males and 15 to 19 minutes (1,436 commuters, 21.7%) for females.
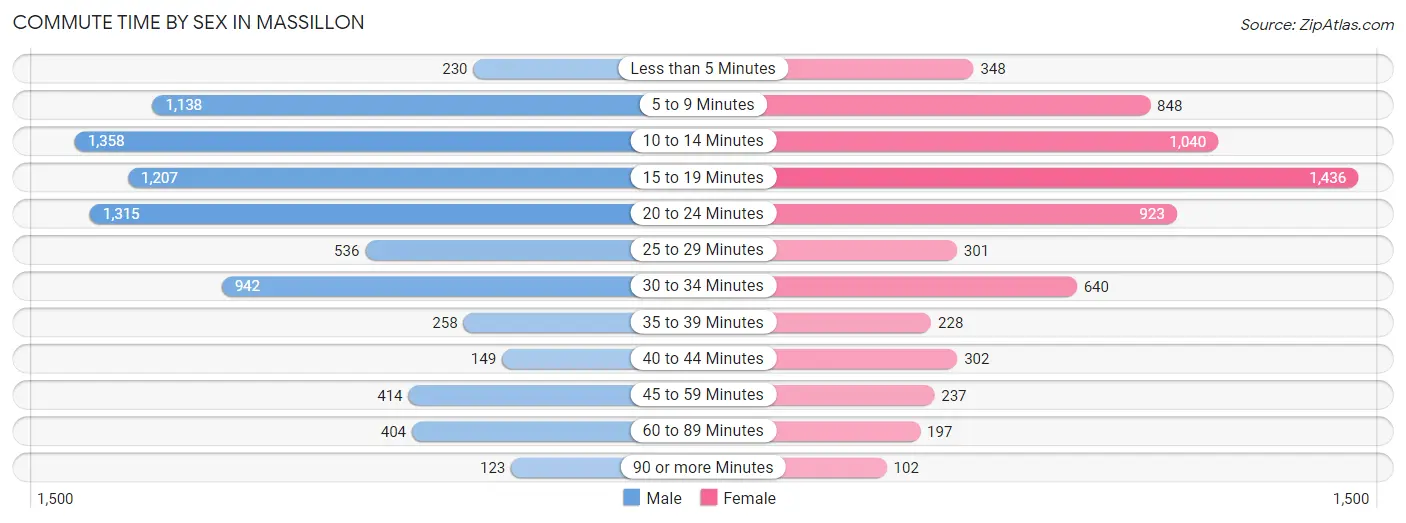
| Commute Time | Male | Female |
| Less than 5 Minutes | 230 (2.9%) | 348 (5.3%) |
| 5 to 9 Minutes | 1,138 (14.1%) | 848 (12.8%) |
| 10 to 14 Minutes | 1,358 (16.8%) | 1,040 (15.8%) |
| 15 to 19 Minutes | 1,207 (14.9%) | 1,436 (21.7%) |
| 20 to 24 Minutes | 1,315 (16.3%) | 923 (14.0%) |
| 25 to 29 Minutes | 536 (6.6%) | 301 (4.6%) |
| 30 to 34 Minutes | 942 (11.7%) | 640 (9.7%) |
| 35 to 39 Minutes | 258 (3.2%) | 228 (3.5%) |
| 40 to 44 Minutes | 149 (1.8%) | 302 (4.6%) |
| 45 to 59 Minutes | 414 (5.1%) | 237 (3.6%) |
| 60 to 89 Minutes | 404 (5.0%) | 197 (3.0%) |
| 90 or more Minutes | 123 (1.5%) | 102 (1.5%) |
Time of Departure to Work by Sex in Massillon
The most frequent times of departure to work in Massillon are 6:30 AM to 6:59 AM (1,197, 14.8%) for males and 7:00 AM to 7:29 AM (859, 13.0%) for females.
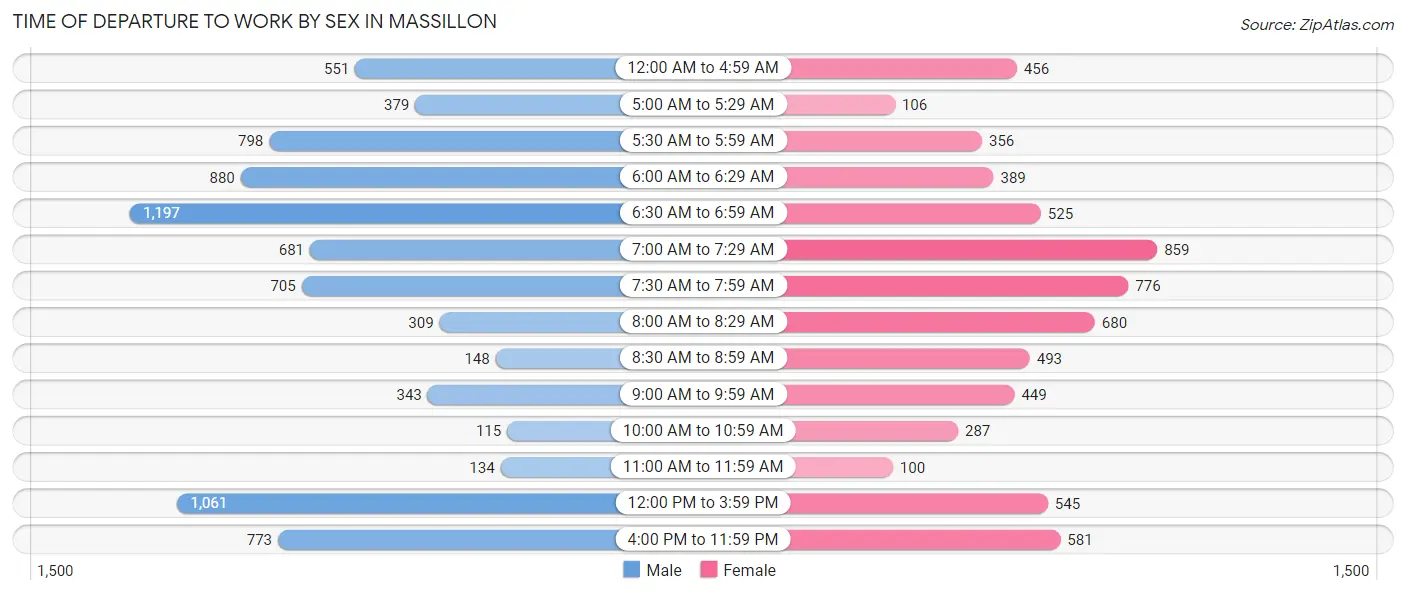
| Time of Departure | Male | Female |
| 12:00 AM to 4:59 AM | 551 (6.8%) | 456 (6.9%) |
| 5:00 AM to 5:29 AM | 379 (4.7%) | 106 (1.6%) |
| 5:30 AM to 5:59 AM | 798 (9.9%) | 356 (5.4%) |
| 6:00 AM to 6:29 AM | 880 (10.9%) | 389 (5.9%) |
| 6:30 AM to 6:59 AM | 1,197 (14.8%) | 525 (8.0%) |
| 7:00 AM to 7:29 AM | 681 (8.4%) | 859 (13.0%) |
| 7:30 AM to 7:59 AM | 705 (8.7%) | 776 (11.7%) |
| 8:00 AM to 8:29 AM | 309 (3.8%) | 680 (10.3%) |
| 8:30 AM to 8:59 AM | 148 (1.8%) | 493 (7.5%) |
| 9:00 AM to 9:59 AM | 343 (4.3%) | 449 (6.8%) |
| 10:00 AM to 10:59 AM | 115 (1.4%) | 287 (4.3%) |
| 11:00 AM to 11:59 AM | 134 (1.7%) | 100 (1.5%) |
| 12:00 PM to 3:59 PM | 1,061 (13.1%) | 545 (8.3%) |
| 4:00 PM to 11:59 PM | 773 (9.6%) | 581 (8.8%) |
| Total | 8,074 (100.0%) | 6,602 (100.0%) |
Housing Occupancy in Massillon
Occupancy by Ownership in Massillon
Of the total 13,974 dwellings in Massillon, owner-occupied units account for 8,652 (61.9%), while renter-occupied units make up 5,322 (38.1%).
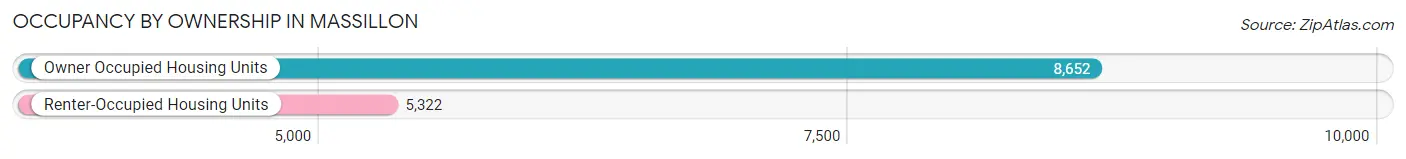
| Occupancy | # Housing Units | % Housing Units |
| Owner Occupied Housing Units | 8,652 | 61.9% |
| Renter-Occupied Housing Units | 5,322 | 38.1% |
| Total Occupied Housing Units | 13,974 | 100.0% |
Occupancy by Household Size in Massillon
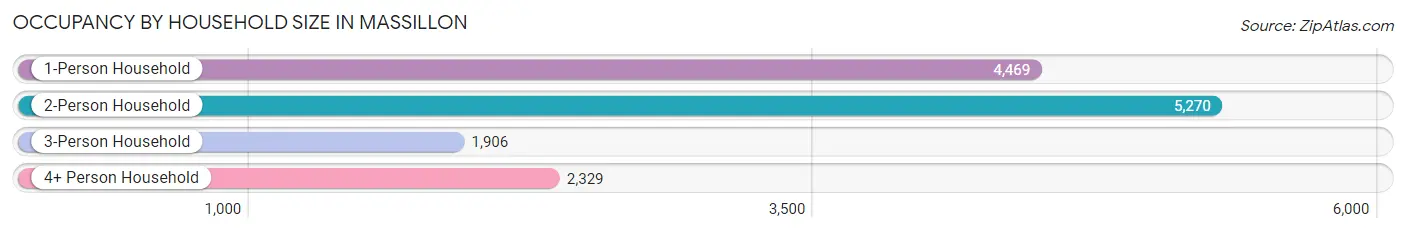
| Household Size | # Housing Units | % Housing Units |
| 1-Person Household | 4,469 | 32.0% |
| 2-Person Household | 5,270 | 37.7% |
| 3-Person Household | 1,906 | 13.6% |
| 4+ Person Household | 2,329 | 16.7% |
| Total Housing Units | 13,974 | 100.0% |
Occupancy by Ownership by Household Size in Massillon
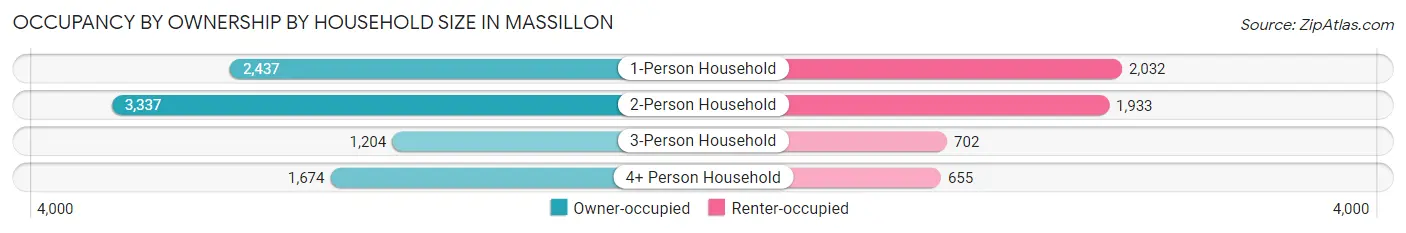
| Household Size | Owner-occupied | Renter-occupied |
| 1-Person Household | 2,437 (54.5%) | 2,032 (45.5%) |
| 2-Person Household | 3,337 (63.3%) | 1,933 (36.7%) |
| 3-Person Household | 1,204 (63.2%) | 702 (36.8%) |
| 4+ Person Household | 1,674 (71.9%) | 655 (28.1%) |
| Total Housing Units | 8,652 (61.9%) | 5,322 (38.1%) |
Occupancy by Educational Attainment in Massillon
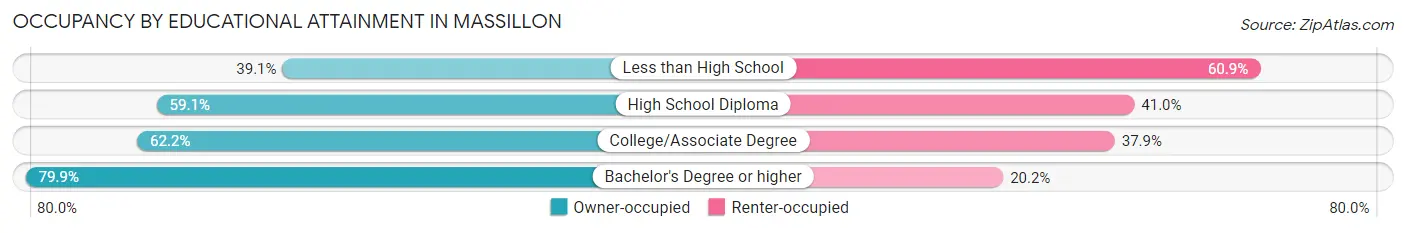
| Household Size | Owner-occupied | Renter-occupied |
| Less than High School | 435 (39.1%) | 677 (60.9%) |
| High School Diploma | 3,344 (59.1%) | 2,319 (40.9%) |
| College/Associate Degree | 3,074 (62.2%) | 1,872 (37.9%) |
| Bachelor's Degree or higher | 1,799 (79.8%) | 454 (20.2%) |
Occupancy by Age of Householder in Massillon
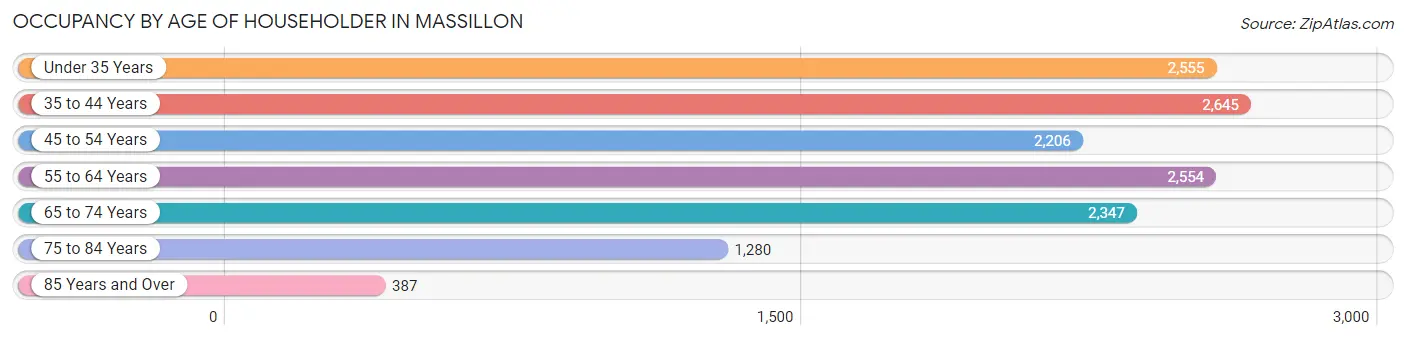
| Age Bracket | # Households | % Households |
| Under 35 Years | 2,555 | 18.3% |
| 35 to 44 Years | 2,645 | 18.9% |
| 45 to 54 Years | 2,206 | 15.8% |
| 55 to 64 Years | 2,554 | 18.3% |
| 65 to 74 Years | 2,347 | 16.8% |
| 75 to 84 Years | 1,280 | 9.2% |
| 85 Years and Over | 387 | 2.8% |
| Total | 13,974 | 100.0% |
Housing Finances in Massillon
Median Income by Occupancy in Massillon
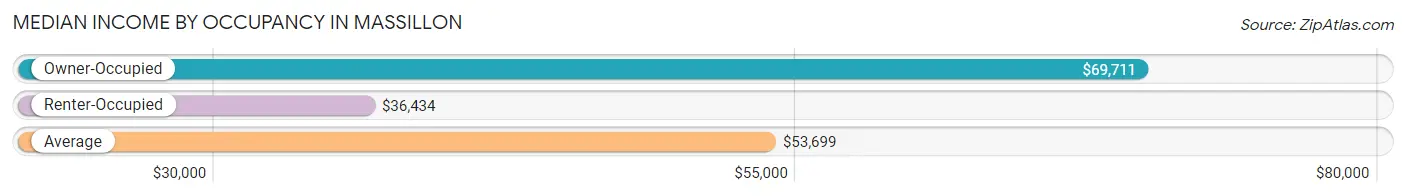
| Occupancy Type | # Households | Median Income |
| Owner-Occupied | 8,652 (61.9%) | $69,711 |
| Renter-Occupied | 5,322 (38.1%) | $36,434 |
| Average | 13,974 (100.0%) | $53,699 |
Occupancy by Householder Income Bracket in Massillon
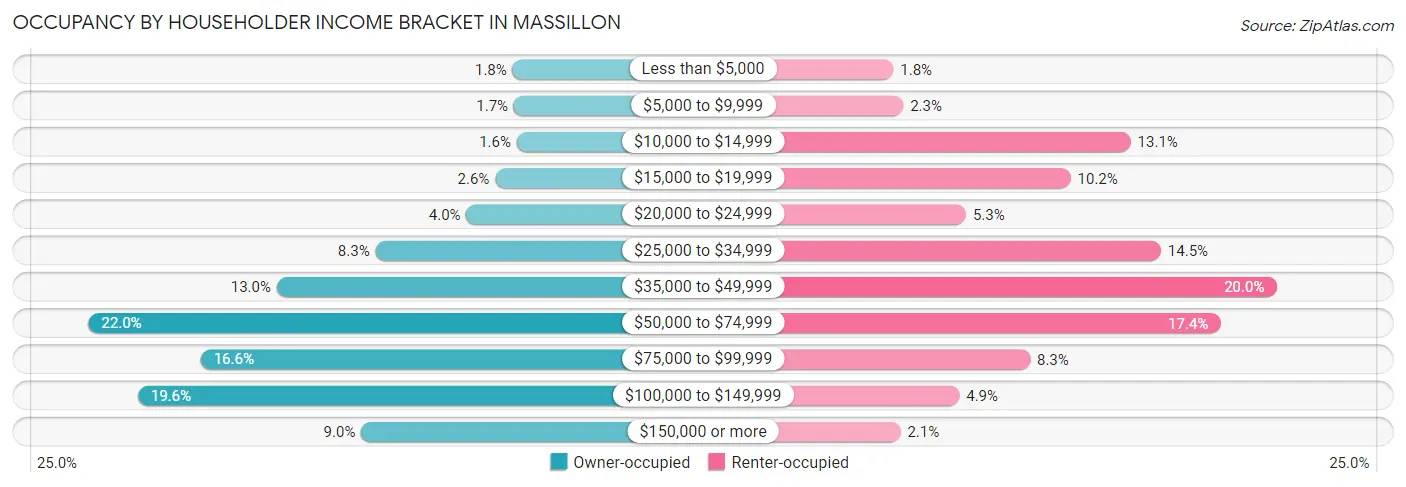
| Income Bracket | Owner-occupied | Renter-occupied |
| Less than $5,000 | 152 (1.8%) | 96 (1.8%) |
| $5,000 to $9,999 | 147 (1.7%) | 121 (2.3%) |
| $10,000 to $14,999 | 135 (1.6%) | 697 (13.1%) |
| $15,000 to $19,999 | 224 (2.6%) | 545 (10.2%) |
| $20,000 to $24,999 | 343 (4.0%) | 280 (5.3%) |
| $25,000 to $34,999 | 717 (8.3%) | 774 (14.5%) |
| $35,000 to $49,999 | 1,124 (13.0%) | 1,066 (20.0%) |
| $50,000 to $74,999 | 1,900 (22.0%) | 924 (17.4%) |
| $75,000 to $99,999 | 1,437 (16.6%) | 442 (8.3%) |
| $100,000 to $149,999 | 1,697 (19.6%) | 263 (4.9%) |
| $150,000 or more | 776 (9.0%) | 114 (2.1%) |
| Total | 8,652 (100.0%) | 5,322 (100.0%) |
Monthly Housing Cost Tiers in Massillon
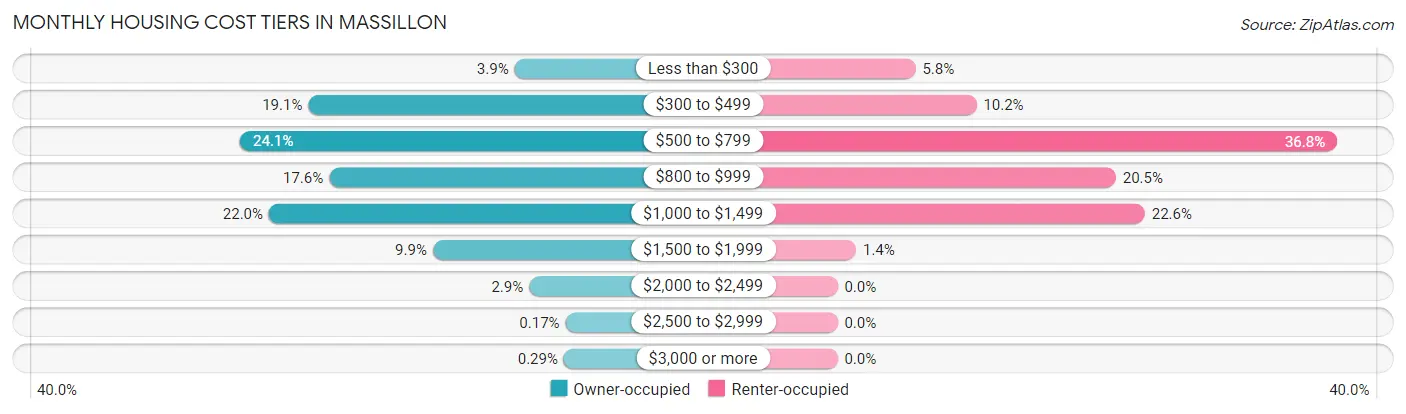
| Monthly Cost | Owner-occupied | Renter-occupied |
| Less than $300 | 339 (3.9%) | 306 (5.8%) |
| $300 to $499 | 1,653 (19.1%) | 545 (10.2%) |
| $500 to $799 | 2,088 (24.1%) | 1,958 (36.8%) |
| $800 to $999 | 1,521 (17.6%) | 1,091 (20.5%) |
| $1,000 to $1,499 | 1,904 (22.0%) | 1,205 (22.6%) |
| $1,500 to $1,999 | 860 (9.9%) | 73 (1.4%) |
| $2,000 to $2,499 | 247 (2.9%) | 0 (0.0%) |
| $2,500 to $2,999 | 15 (0.2%) | 0 (0.0%) |
| $3,000 or more | 25 (0.3%) | 0 (0.0%) |
| Total | 8,652 (100.0%) | 5,322 (100.0%) |
Physical Housing Characteristics in Massillon
Housing Structures in Massillon
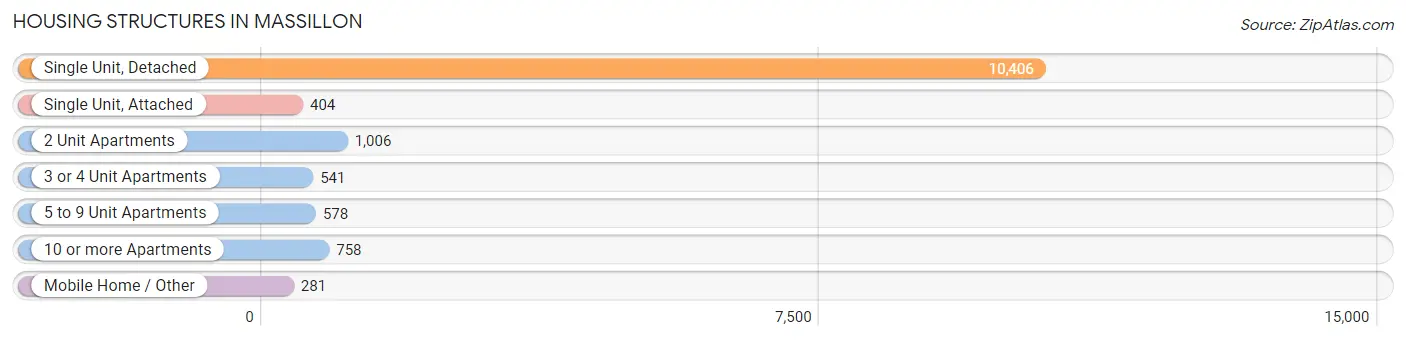
| Structure Type | # Housing Units | % Housing Units |
| Single Unit, Detached | 10,406 | 74.5% |
| Single Unit, Attached | 404 | 2.9% |
| 2 Unit Apartments | 1,006 | 7.2% |
| 3 or 4 Unit Apartments | 541 | 3.9% |
| 5 to 9 Unit Apartments | 578 | 4.1% |
| 10 or more Apartments | 758 | 5.4% |
| Mobile Home / Other | 281 | 2.0% |
| Total | 13,974 | 100.0% |
Housing Structures by Occupancy in Massillon
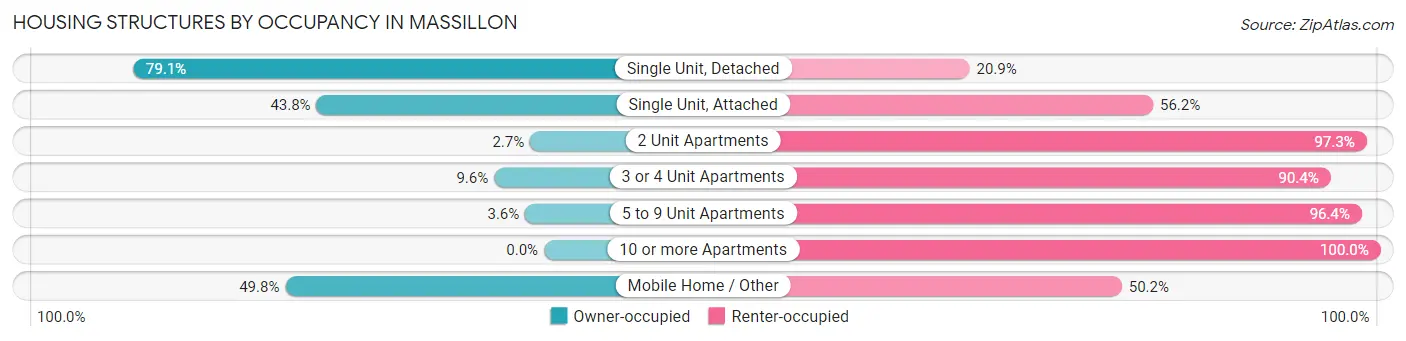
| Structure Type | Owner-occupied | Renter-occupied |
| Single Unit, Detached | 8,235 (79.1%) | 2,171 (20.9%) |
| Single Unit, Attached | 177 (43.8%) | 227 (56.2%) |
| 2 Unit Apartments | 27 (2.7%) | 979 (97.3%) |
| 3 or 4 Unit Apartments | 52 (9.6%) | 489 (90.4%) |
| 5 to 9 Unit Apartments | 21 (3.6%) | 557 (96.4%) |
| 10 or more Apartments | 0 (0.0%) | 758 (100.0%) |
| Mobile Home / Other | 140 (49.8%) | 141 (50.2%) |
| Total | 8,652 (61.9%) | 5,322 (38.1%) |
Housing Structures by Number of Rooms in Massillon
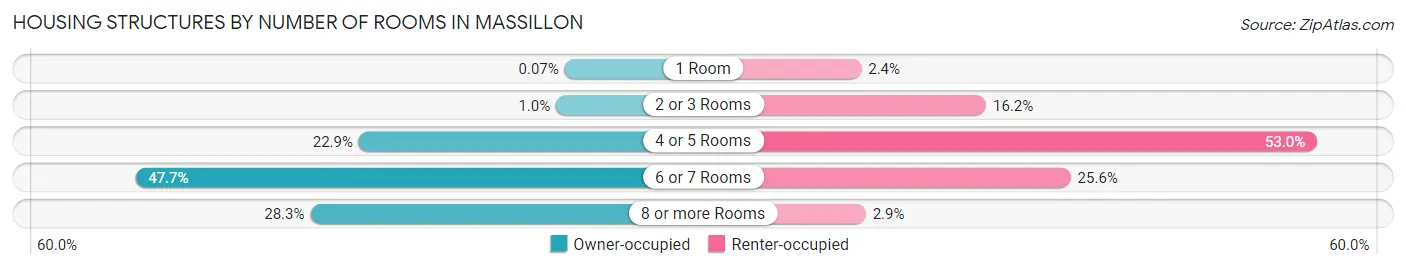
| Number of Rooms | Owner-occupied | Renter-occupied |
| 1 Room | 6 (0.1%) | 126 (2.4%) |
| 2 or 3 Rooms | 88 (1.0%) | 863 (16.2%) |
| 4 or 5 Rooms | 1,982 (22.9%) | 2,818 (52.9%) |
| 6 or 7 Rooms | 4,128 (47.7%) | 1,363 (25.6%) |
| 8 or more Rooms | 2,448 (28.3%) | 152 (2.9%) |
| Total | 8,652 (100.0%) | 5,322 (100.0%) |
Housing Structure by Heating Type in Massillon
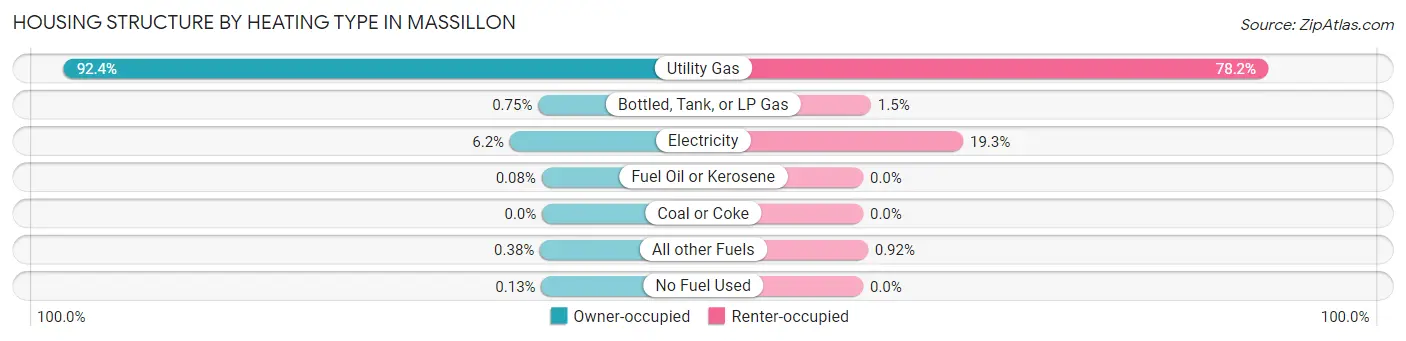
| Heating Type | Owner-occupied | Renter-occupied |
| Utility Gas | 7,998 (92.4%) | 4,163 (78.2%) |
| Bottled, Tank, or LP Gas | 65 (0.7%) | 81 (1.5%) |
| Electricity | 538 (6.2%) | 1,029 (19.3%) |
| Fuel Oil or Kerosene | 7 (0.1%) | 0 (0.0%) |
| Coal or Coke | 0 (0.0%) | 0 (0.0%) |
| All other Fuels | 33 (0.4%) | 49 (0.9%) |
| No Fuel Used | 11 (0.1%) | 0 (0.0%) |
| Total | 8,652 (100.0%) | 5,322 (100.0%) |
Household Vehicle Usage in Massillon
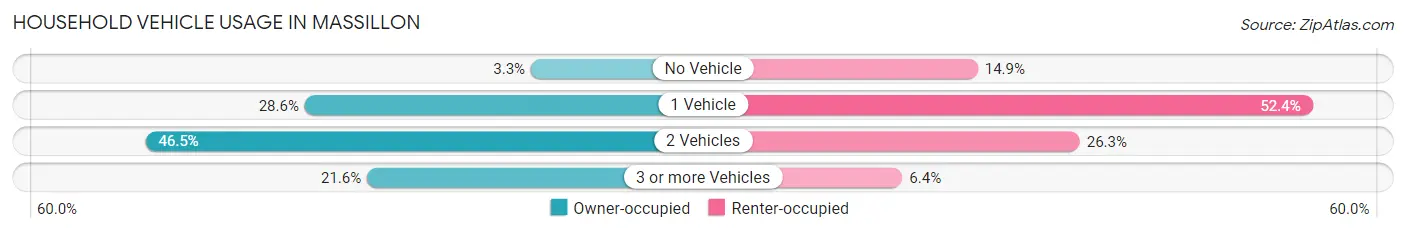
| Vehicles per Household | Owner-occupied | Renter-occupied |
| No Vehicle | 284 (3.3%) | 792 (14.9%) |
| 1 Vehicle | 2,476 (28.6%) | 2,787 (52.4%) |
| 2 Vehicles | 4,020 (46.5%) | 1,400 (26.3%) |
| 3 or more Vehicles | 1,872 (21.6%) | 343 (6.4%) |
| Total | 8,652 (100.0%) | 5,322 (100.0%) |
Real Estate & Mortgages in Massillon
Real Estate and Mortgage Overview in Massillon
| Characteristic | Without Mortgage | With Mortgage |
| Housing Units | 3,146 | 5,506 |
| Median Property Value | $125,600 | $131,200 |
| Median Household Income | $54,737 | $563 |
| Monthly Housing Costs | $460 | $25 |
| Real Estate Taxes | $1,819 | $127 |
Property Value by Mortgage Status in Massillon
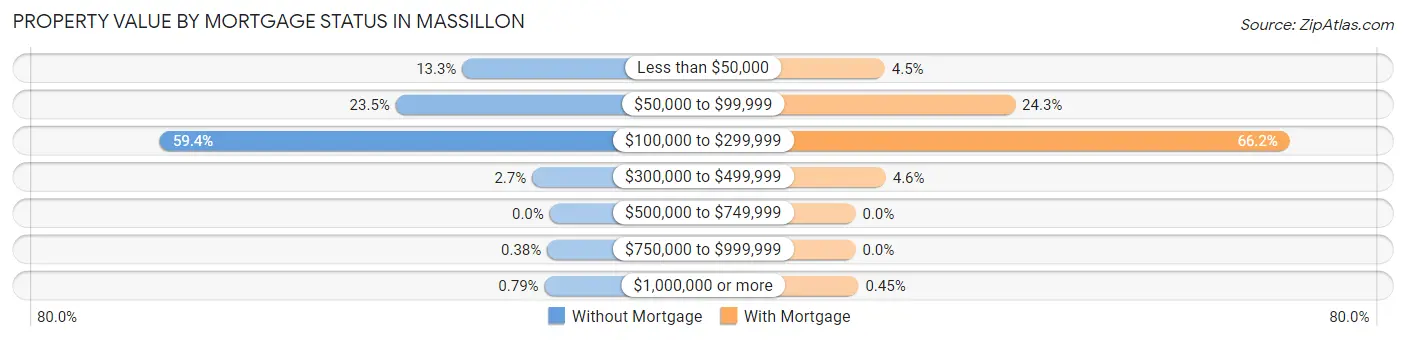
| Property Value | Without Mortgage | With Mortgage |
| Less than $50,000 | 419 (13.3%) | 246 (4.5%) |
| $50,000 to $99,999 | 738 (23.5%) | 1,339 (24.3%) |
| $100,000 to $299,999 | 1,868 (59.4%) | 3,642 (66.1%) |
| $300,000 to $499,999 | 84 (2.7%) | 254 (4.6%) |
| $500,000 to $749,999 | 0 (0.0%) | 0 (0.0%) |
| $750,000 to $999,999 | 12 (0.4%) | 0 (0.0%) |
| $1,000,000 or more | 25 (0.8%) | 25 (0.4%) |
| Total | 3,146 (100.0%) | 5,506 (100.0%) |
Household Income by Mortgage Status in Massillon
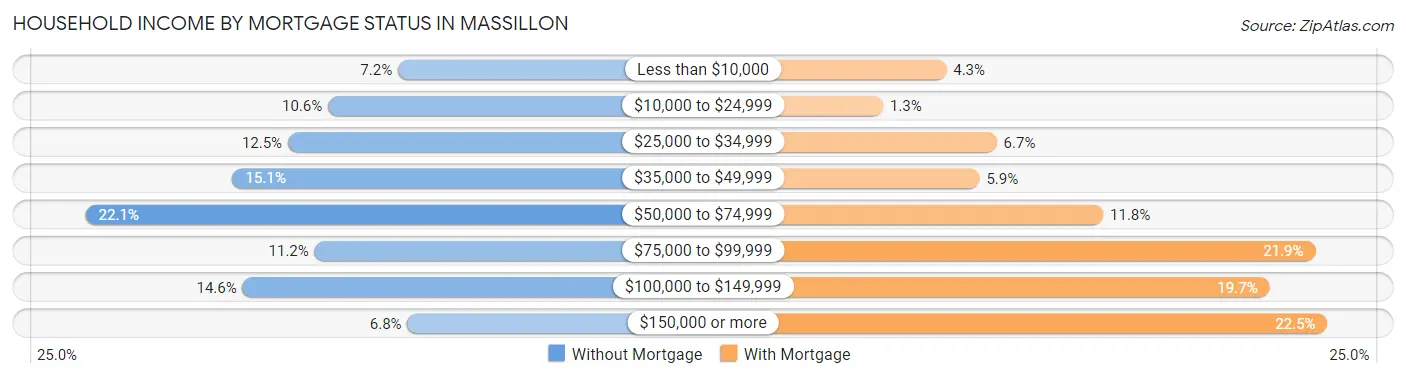
| Household Income | Without Mortgage | With Mortgage |
| Less than $10,000 | 227 (7.2%) | 238 (4.3%) |
| $10,000 to $24,999 | 332 (10.5%) | 72 (1.3%) |
| $25,000 to $34,999 | 392 (12.5%) | 370 (6.7%) |
| $35,000 to $49,999 | 475 (15.1%) | 325 (5.9%) |
| $50,000 to $74,999 | 695 (22.1%) | 649 (11.8%) |
| $75,000 to $99,999 | 352 (11.2%) | 1,205 (21.9%) |
| $100,000 to $149,999 | 460 (14.6%) | 1,085 (19.7%) |
| $150,000 or more | 213 (6.8%) | 1,237 (22.5%) |
| Total | 3,146 (100.0%) | 5,506 (100.0%) |
Property Value to Household Income Ratio in Massillon
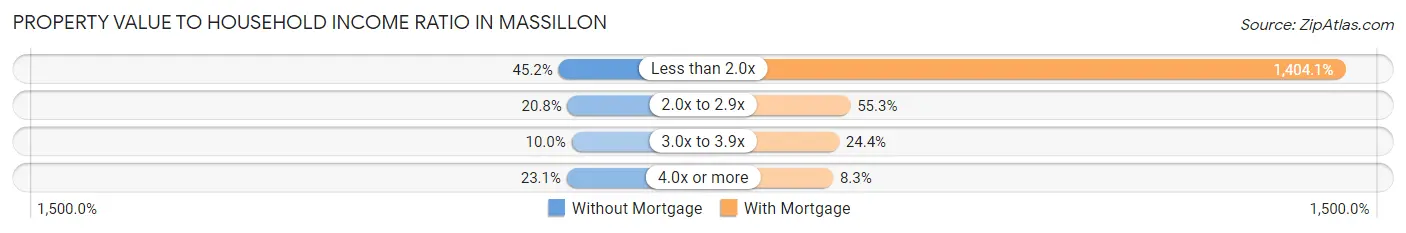
| Value-to-Income Ratio | Without Mortgage | With Mortgage |
| Less than 2.0x | 1,422 (45.2%) | 77,308 (1,404.1%) |
| 2.0x to 2.9x | 654 (20.8%) | 3,047 (55.3%) |
| 3.0x to 3.9x | 313 (10.0%) | 1,345 (24.4%) |
| 4.0x or more | 725 (23.1%) | 456 (8.3%) |
| Total | 3,146 (100.0%) | 5,506 (100.0%) |
Real Estate Taxes by Mortgage Status in Massillon
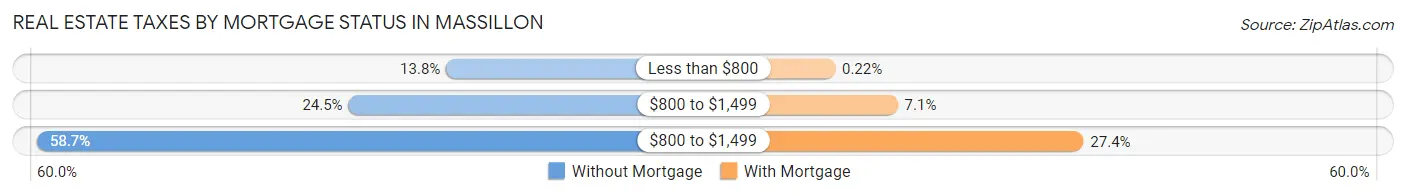
| Property Taxes | Without Mortgage | With Mortgage |
| Less than $800 | 434 (13.8%) | 12 (0.2%) |
| $800 to $1,499 | 771 (24.5%) | 390 (7.1%) |
| $800 to $1,499 | 1,845 (58.7%) | 1,511 (27.4%) |
| Total | 3,146 (100.0%) | 5,506 (100.0%) |
Health & Disability in Massillon
Health Insurance Coverage by Age in Massillon
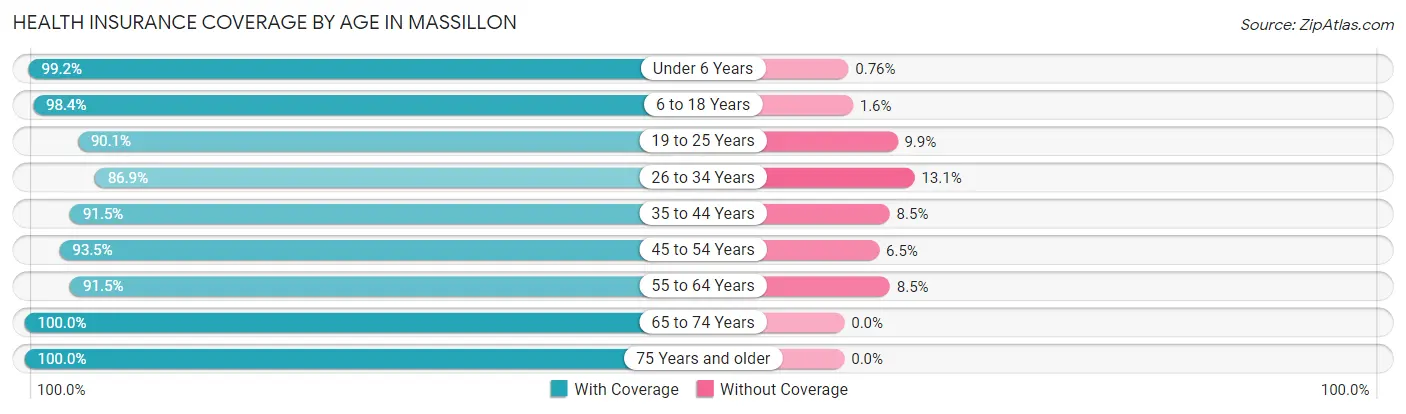
| Age Bracket | With Coverage | Without Coverage |
| Under 6 Years | 1,959 (99.2%) | 15 (0.8%) |
| 6 to 18 Years | 4,737 (98.4%) | 76 (1.6%) |
| 19 to 25 Years | 1,873 (90.1%) | 206 (9.9%) |
| 26 to 34 Years | 3,597 (86.9%) | 542 (13.1%) |
| 35 to 44 Years | 4,284 (91.5%) | 396 (8.5%) |
| 45 to 54 Years | 3,327 (93.5%) | 231 (6.5%) |
| 55 to 64 Years | 3,863 (91.5%) | 359 (8.5%) |
| 65 to 74 Years | 3,667 (100.0%) | 0 (0.0%) |
| 75 Years and older | 2,506 (100.0%) | 0 (0.0%) |
| Total | 29,813 (94.2%) | 1,825 (5.8%) |
Health Insurance Coverage by Citizenship Status in Massillon
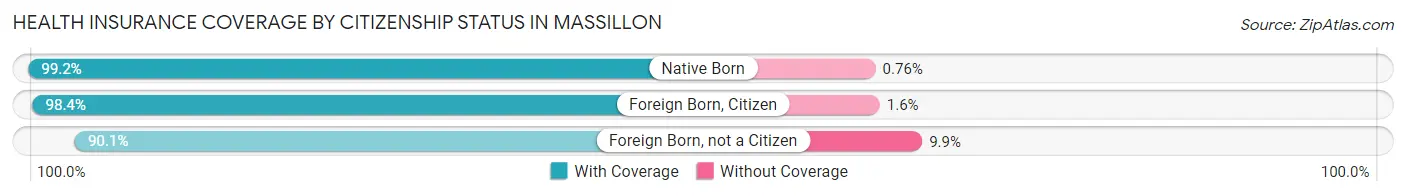
| Citizenship Status | With Coverage | Without Coverage |
| Native Born | 1,959 (99.2%) | 15 (0.8%) |
| Foreign Born, Citizen | 4,737 (98.4%) | 76 (1.6%) |
| Foreign Born, not a Citizen | 1,873 (90.1%) | 206 (9.9%) |
Health Insurance Coverage by Household Income in Massillon
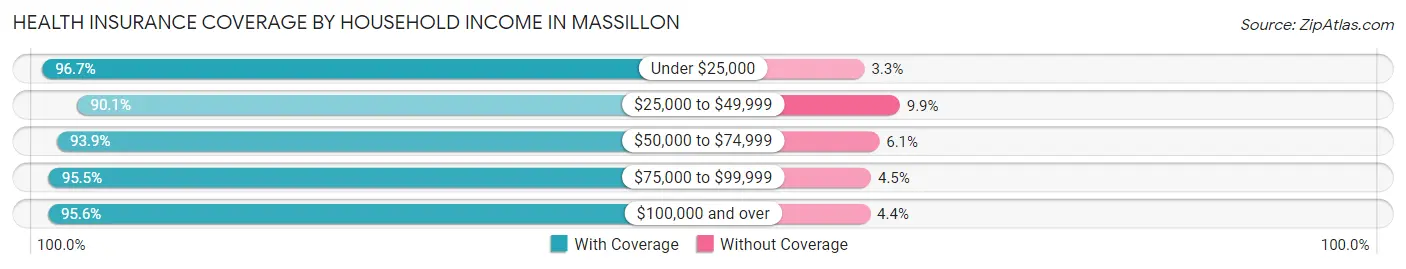
| Household Income | With Coverage | Without Coverage |
| Under $25,000 | 4,445 (96.7%) | 152 (3.3%) |
| $25,000 to $49,999 | 6,096 (90.1%) | 672 (9.9%) |
| $50,000 to $74,999 | 6,126 (93.9%) | 397 (6.1%) |
| $75,000 to $99,999 | 4,796 (95.5%) | 228 (4.5%) |
| $100,000 and over | 8,188 (95.6%) | 375 (4.4%) |
Public vs Private Health Insurance Coverage by Age in Massillon
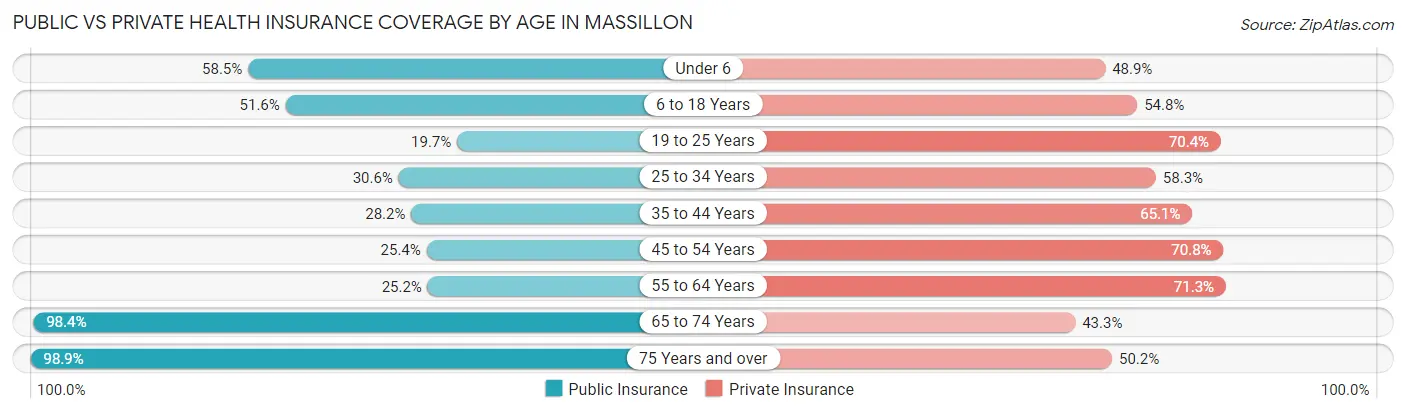
| Age Bracket | Public Insurance | Private Insurance |
| Under 6 | 1,155 (58.5%) | 965 (48.9%) |
| 6 to 18 Years | 2,481 (51.5%) | 2,639 (54.8%) |
| 19 to 25 Years | 410 (19.7%) | 1,463 (70.4%) |
| 25 to 34 Years | 1,265 (30.6%) | 2,413 (58.3%) |
| 35 to 44 Years | 1,321 (28.2%) | 3,045 (65.1%) |
| 45 to 54 Years | 903 (25.4%) | 2,520 (70.8%) |
| 55 to 64 Years | 1,063 (25.2%) | 3,010 (71.3%) |
| 65 to 74 Years | 3,608 (98.4%) | 1,589 (43.3%) |
| 75 Years and over | 2,479 (98.9%) | 1,257 (50.2%) |
| Total | 14,685 (46.4%) | 18,901 (59.7%) |
Disability Status by Sex by Age in Massillon

| Age Bracket | Male | Female |
| Under 5 Years | 0 (0.0%) | 3 (0.3%) |
| 5 to 17 Years | 272 (11.7%) | 138 (6.2%) |
| 18 to 34 Years | 454 (12.9%) | 197 (6.2%) |
| 35 to 64 Years | 813 (13.1%) | 1,107 (17.8%) |
| 65 to 74 Years | 475 (29.3%) | 487 (23.8%) |
| 75 Years and over | 570 (51.2%) | 675 (48.5%) |
Disability Class by Sex by Age in Massillon
Disability Class: Hearing Difficulty
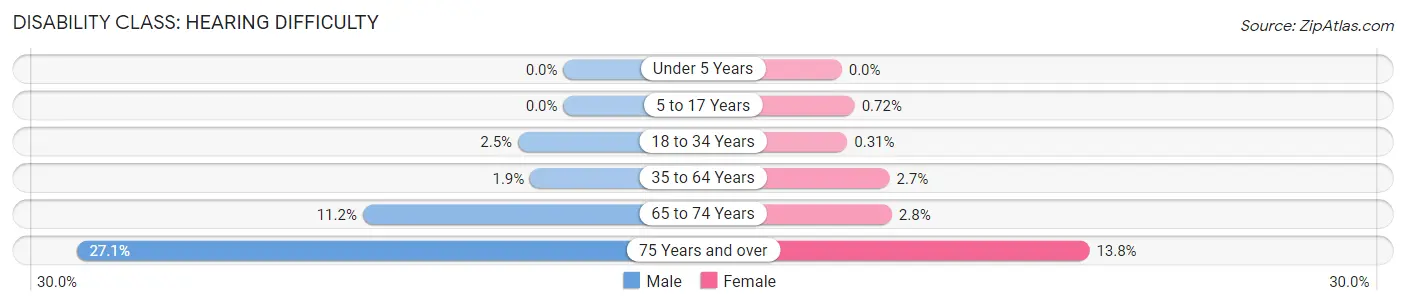
| Age Bracket | Male | Female |
| Under 5 Years | 0 (0.0%) | 0 (0.0%) |
| 5 to 17 Years | 0 (0.0%) | 16 (0.7%) |
| 18 to 34 Years | 89 (2.5%) | 10 (0.3%) |
| 35 to 64 Years | 115 (1.8%) | 166 (2.7%) |
| 65 to 74 Years | 181 (11.2%) | 57 (2.8%) |
| 75 Years and over | 302 (27.1%) | 192 (13.8%) |
Disability Class: Vision Difficulty
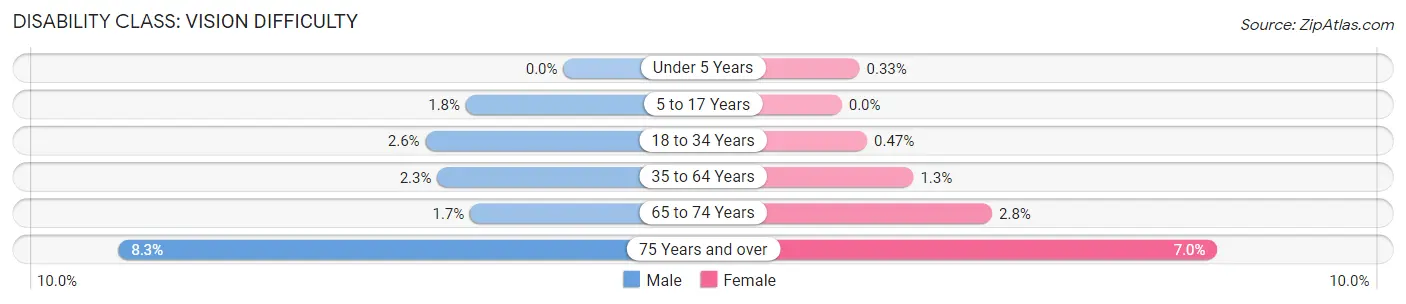
| Age Bracket | Male | Female |
| Under 5 Years | 0 (0.0%) | 3 (0.3%) |
| 5 to 17 Years | 42 (1.8%) | 0 (0.0%) |
| 18 to 34 Years | 90 (2.6%) | 15 (0.5%) |
| 35 to 64 Years | 146 (2.3%) | 83 (1.3%) |
| 65 to 74 Years | 28 (1.7%) | 57 (2.8%) |
| 75 Years and over | 92 (8.3%) | 97 (7.0%) |
Disability Class: Cognitive Difficulty
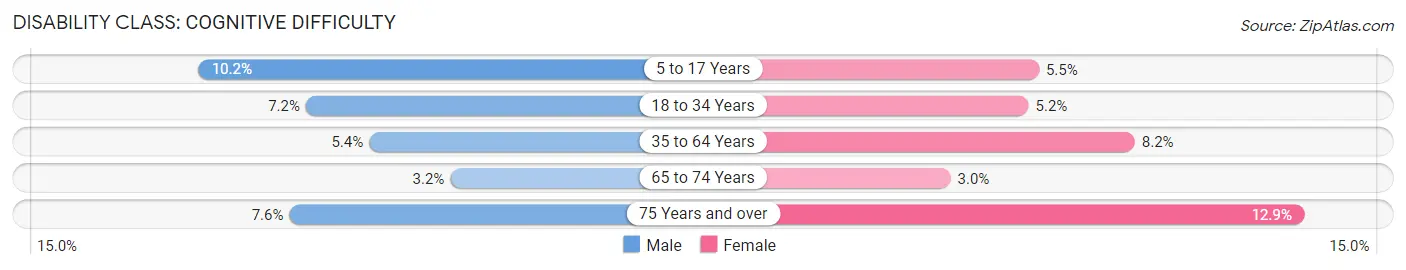
| Age Bracket | Male | Female |
| 5 to 17 Years | 235 (10.2%) | 122 (5.5%) |
| 18 to 34 Years | 252 (7.2%) | 166 (5.2%) |
| 35 to 64 Years | 337 (5.4%) | 508 (8.2%) |
| 65 to 74 Years | 51 (3.2%) | 62 (3.0%) |
| 75 Years and over | 85 (7.6%) | 179 (12.9%) |
Disability Class: Ambulatory Difficulty
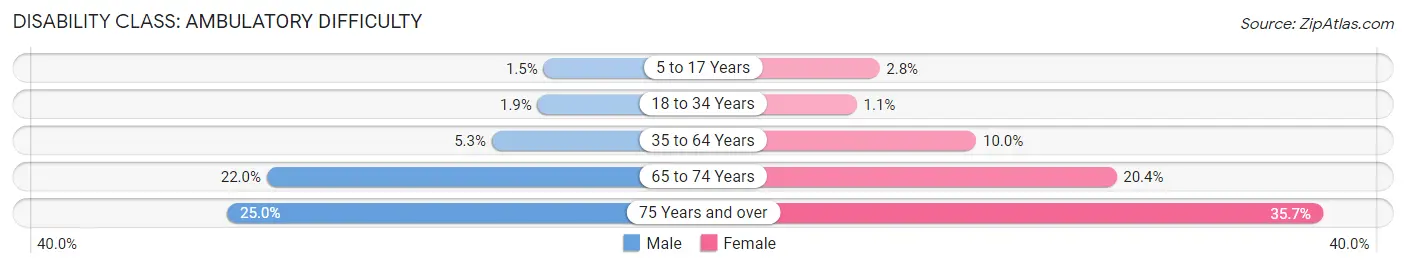
| Age Bracket | Male | Female |
| 5 to 17 Years | 34 (1.5%) | 62 (2.8%) |
| 18 to 34 Years | 67 (1.9%) | 35 (1.1%) |
| 35 to 64 Years | 331 (5.3%) | 621 (10.0%) |
| 65 to 74 Years | 357 (22.0%) | 417 (20.4%) |
| 75 Years and over | 278 (25.0%) | 497 (35.7%) |
Disability Class: Self-Care Difficulty
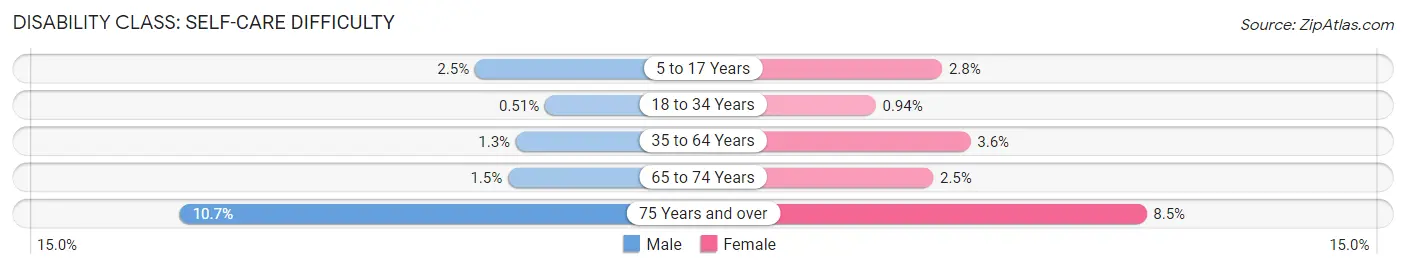
| Age Bracket | Male | Female |
| 5 to 17 Years | 57 (2.5%) | 62 (2.8%) |
| 18 to 34 Years | 18 (0.5%) | 30 (0.9%) |
| 35 to 64 Years | 82 (1.3%) | 223 (3.6%) |
| 65 to 74 Years | 25 (1.5%) | 52 (2.5%) |
| 75 Years and over | 119 (10.7%) | 118 (8.5%) |
Technology Access in Massillon
Computing Device Access in Massillon
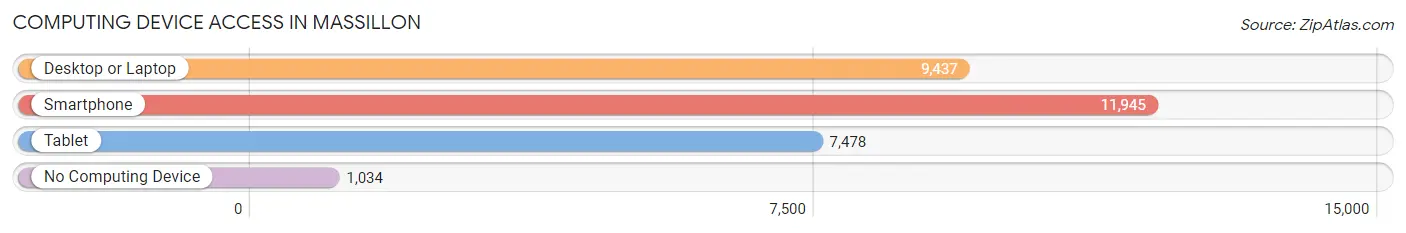
| Device Type | # Households | % Households |
| Desktop or Laptop | 9,437 | 67.5% |
| Smartphone | 11,945 | 85.5% |
| Tablet | 7,478 | 53.5% |
| No Computing Device | 1,034 | 7.4% |
| Total | 13,974 | 100.0% |
Internet Access in Massillon
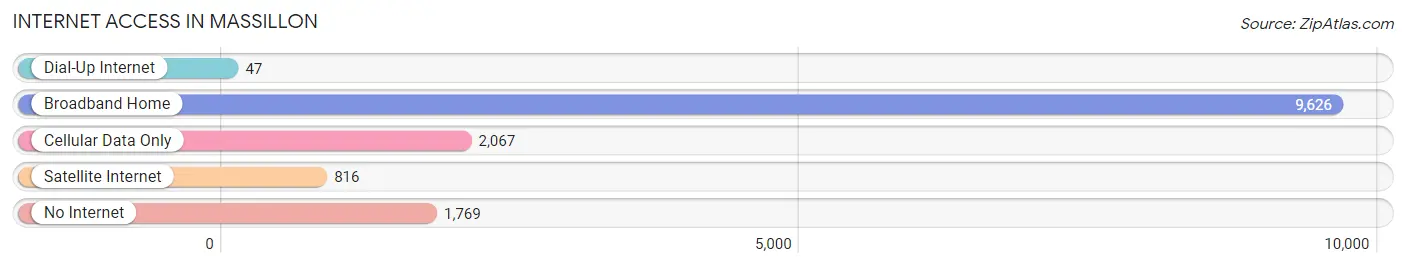
| Internet Type | # Households | % Households |
| Dial-Up Internet | 47 | 0.3% |
| Broadband Home | 9,626 | 68.9% |
| Cellular Data Only | 2,067 | 14.8% |
| Satellite Internet | 816 | 5.8% |
| No Internet | 1,769 | 12.7% |
| Total | 13,974 | 100.0% |
Massillon Summary
History
Massillon, Ohio is a city located in Stark County, Ohio, United States. It is located along the Tuscarawas River, approximately 30 miles south of Akron and 60 miles south of Cleveland. The city was founded in 1812 by James Duncan, a Revolutionary War veteran, and was named after Jean Baptiste Massillon, a French Catholic bishop.
Massillon was originally a farming community, but it quickly grew into a manufacturing center due to its location on the Tuscarawas River. The city was home to several factories, including the Massillon Iron Works, which produced iron products for the Union Army during the Civil War. The city also became a major hub for the railroad industry, with the Pennsylvania Railroad and the Baltimore & Ohio Railroad both having lines that ran through the city.
The city experienced a period of rapid growth in the late 19th and early 20th centuries, with the population increasing from 4,000 in 1880 to over 20,000 by 1910. This growth was largely due to the influx of immigrants from Europe, particularly from Germany and Italy. The city also became a major center for the steel industry, with the Republic Steel Corporation establishing a plant in the city in 1901.
Geography
Massillon is located in northeastern Ohio, approximately 30 miles south of Akron and 60 miles south of Cleveland. The city is situated along the Tuscarawas River, which flows through the city from west to east. The city is located in the Appalachian Plateau region of Ohio, and is characterized by rolling hills and valleys.
The city has a total area of 11.7 square miles, of which 11.3 square miles is land and 0.4 square miles is water. The city is located in the Eastern Time Zone and observes Daylight Saving Time.
Economy
Massillon’s economy is largely based on manufacturing and services. The city is home to several large manufacturing companies, including Republic Steel Corporation, which produces steel products, and the Massillon Iron Works, which produces iron products. The city is also home to several service-based businesses, including healthcare, retail, and hospitality.
The city’s unemployment rate was 4.2% in 2019, which is lower than the national average of 3.7%. The median household income in Massillon was $45,845 in 2019, which is lower than the national average of $61,937.
Demographics
As of the 2019 census, Massillon had a population of 32,817. The city has a population density of 2,811 people per square mile. The racial makeup of the city is 87.2% White, 8.2% African American, 0.7% Asian, 0.3% Native American, and 3.6% from other races.
The median age in Massillon is 40.2 years, and the gender ratio is 48.7% male and 51.3% female. The city has a foreign-born population of 5.3%, with the largest groups being from Mexico (2.2%), India (1.2%), and Germany (0.7%).
The largest religious group in Massillon is Catholic, with 28.3% of the population identifying as Catholic. Other religious groups include Protestant (21.2%), non-religious (17.2%), and other (33.3%).
Massillon is served by the Massillon City School District, which consists of seven elementary schools, two middle schools, and one high school. The city is also home to several higher education institutions, including Walsh University and Stark State College.
Common Questions
What is Per Capita Income in Massillon?
Per Capita income in Massillon is $29,859.
What is the Median Family Income in Massillon?
Median Family Income in Massillon is $64,906.
What is the Median Household income in Massillon?
Median Household Income in Massillon is $53,699.
What is Income or Wage Gap in Massillon?
Income or Wage Gap in Massillon is 19.8%.
Women in Massillon earn 80.2 cents for every dollar earned by a man.
What is Family Income Deficit in Massillon?
Family Income Deficit in Massillon is $10,335.
Families that are below poverty line in Massillon earn $10,335 less on average than the poverty threshold level.
What is Inequality or Gini Index in Massillon?
Inequality or Gini Index in Massillon is 0.40.
What is the Total Population of Massillon?
Total Population of Massillon is 32,179.
What is the Total Male Population of Massillon?
Total Male Population of Massillon is 15,895.
What is the Total Female Population of Massillon?
Total Female Population of Massillon is 16,284.
What is the Ratio of Males per 100 Females in Massillon?
There are 97.61 Males per 100 Females in Massillon.
What is the Ratio of Females per 100 Males in Massillon?
There are 102.45 Females per 100 Males in Massillon.
What is the Median Population Age in Massillon?
Median Population Age in Massillon is 40.8 Years.
What is the Average Family Size in Massillon
Average Family Size in Massillon is 2.8 People.
What is the Average Household Size in Massillon
Average Household Size in Massillon is 2.2 People.
How Large is the Labor Force in Massillon?
There are 16,776 People in the Labor Forcein in Massillon.
What is the Percentage of People in the Labor Force in Massillon?
63.4% of People are in the Labor Force in Massillon.
What is the Unemployment Rate in Massillon?
Unemployment Rate in Massillon is 3.9%.