Newark, OH Map & Demographics
Newark Map
Newark Overview
$30,791
PER CAPITA INCOME
$71,720
AVG FAMILY INCOME
$56,284
AVG HOUSEHOLD INCOME
27.8%
WAGE / INCOME GAP [ % ]
72.2¢/ $1
WAGE / INCOME GAP [ $ ]
$12,304
FAMILY INCOME DEFICIT
0.45
INEQUALITY / GINI INDEX
50,062
TOTAL POPULATION
24,250
MALE POPULATION
25,812
FEMALE POPULATION
93.95
MALES / 100 FEMALES
106.44
FEMALES / 100 MALES
38.5
MEDIAN AGE
3.1
AVG FAMILY SIZE
2.4
AVG HOUSEHOLD SIZE
24,157
LABOR FORCE [ PEOPLE ]
60.0%
PERCENT IN LABOR FORCE
4.0%
UNEMPLOYMENT RATE
Newark Zip Codes
Newark Area Codes
Income in Newark
Income Overview in Newark
Per Capita Income in Newark is $30,791, while median incomes of families and households are $71,720 and $56,284 respectively.
| Characteristic | Number | Measure |
| Per Capita Income | 50,062 | $30,791 |
| Median Family Income | 12,062 | $71,720 |
| Mean Family Income | 12,062 | $91,697 |
| Median Household Income | 20,206 | $56,284 |
| Mean Household Income | 20,206 | $72,866 |
| Income Deficit | 12,062 | $12,304 |
| Wage / Income Gap (%) | 50,062 | 27.80% |
| Wage / Income Gap ($) | 50,062 | 72.20¢ per $1 |
| Gini / Inequality Index | 50,062 | 0.45 |
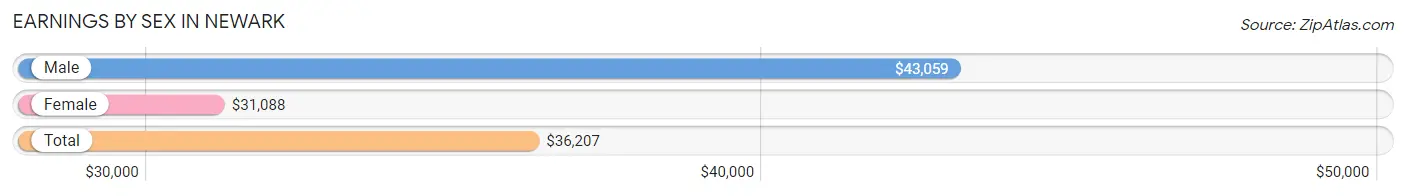
Earnings by Sex in Newark
Average Earnings in Newark are $36,207, $43,059 for men and $31,088 for women, a difference of 27.8%.
| Sex | Number | Average Earnings |
| Male | 12,963 (50.7%) | $43,059 |
| Female | 12,618 (49.3%) | $31,088 |
| Total | 25,581 (100.0%) | $36,207 |
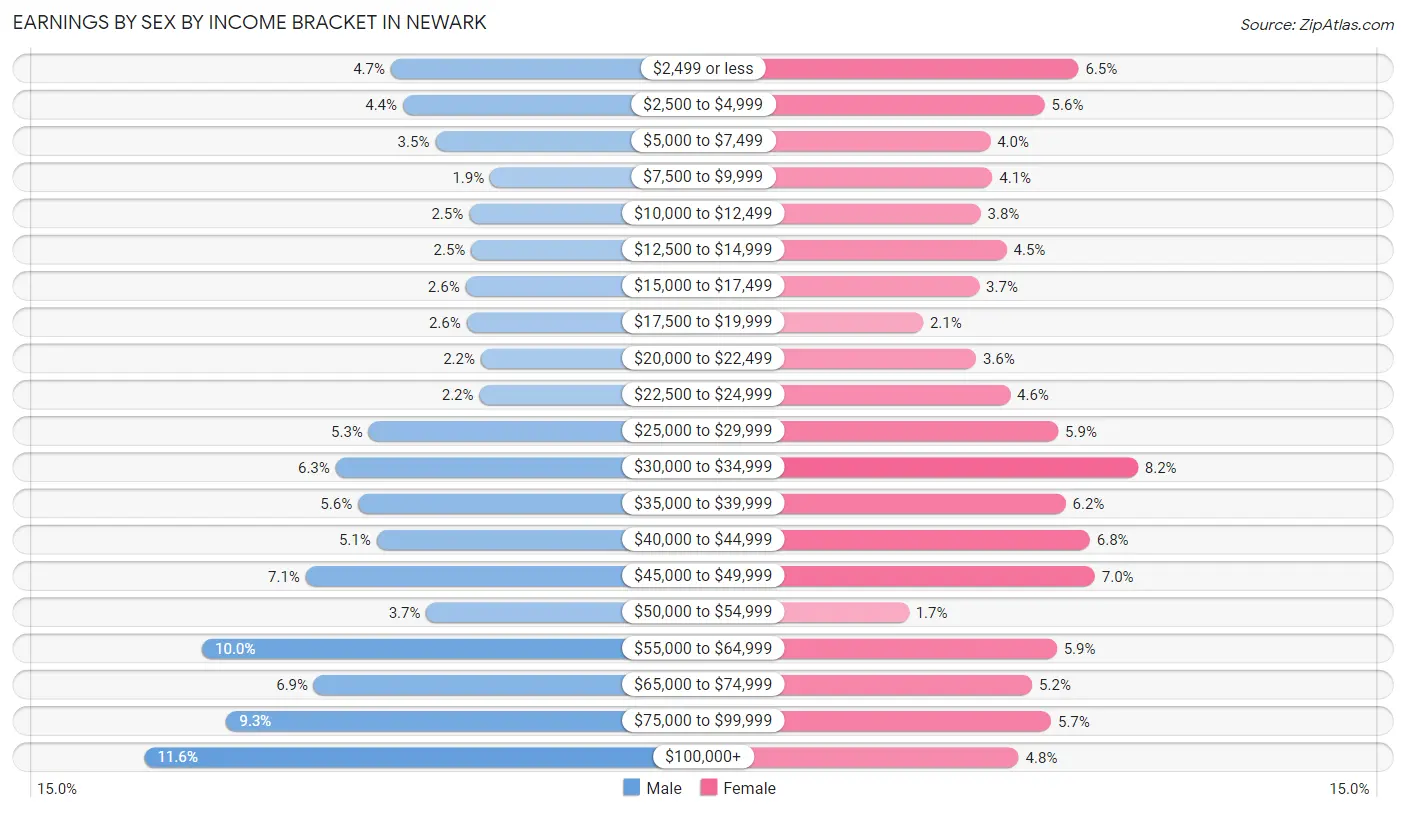
Earnings by Sex by Income Bracket in Newark
The most common earnings brackets in Newark are $100,000+ for men (1,507 | 11.6%) and $30,000 to $34,999 for women (1,032 | 8.2%).
| Income | Male | Female |
| $2,499 or less | 611 (4.7%) | 821 (6.5%) |
| $2,500 to $4,999 | 567 (4.4%) | 701 (5.6%) |
| $5,000 to $7,499 | 449 (3.5%) | 509 (4.0%) |
| $7,500 to $9,999 | 249 (1.9%) | 516 (4.1%) |
| $10,000 to $12,499 | 326 (2.5%) | 475 (3.8%) |
| $12,500 to $14,999 | 317 (2.5%) | 566 (4.5%) |
| $15,000 to $17,499 | 338 (2.6%) | 470 (3.7%) |
| $17,500 to $19,999 | 335 (2.6%) | 270 (2.1%) |
| $20,000 to $22,499 | 282 (2.2%) | 458 (3.6%) |
| $22,500 to $24,999 | 288 (2.2%) | 579 (4.6%) |
| $25,000 to $29,999 | 691 (5.3%) | 749 (5.9%) |
| $30,000 to $34,999 | 811 (6.3%) | 1,032 (8.2%) |
| $35,000 to $39,999 | 730 (5.6%) | 776 (6.1%) |
| $40,000 to $44,999 | 663 (5.1%) | 862 (6.8%) |
| $45,000 to $49,999 | 920 (7.1%) | 879 (7.0%) |
| $50,000 to $54,999 | 481 (3.7%) | 220 (1.7%) |
| $55,000 to $64,999 | 1,298 (10.0%) | 745 (5.9%) |
| $65,000 to $74,999 | 891 (6.9%) | 657 (5.2%) |
| $75,000 to $99,999 | 1,209 (9.3%) | 724 (5.7%) |
| $100,000+ | 1,507 (11.6%) | 609 (4.8%) |
| Total | 12,963 (100.0%) | 12,618 (100.0%) |
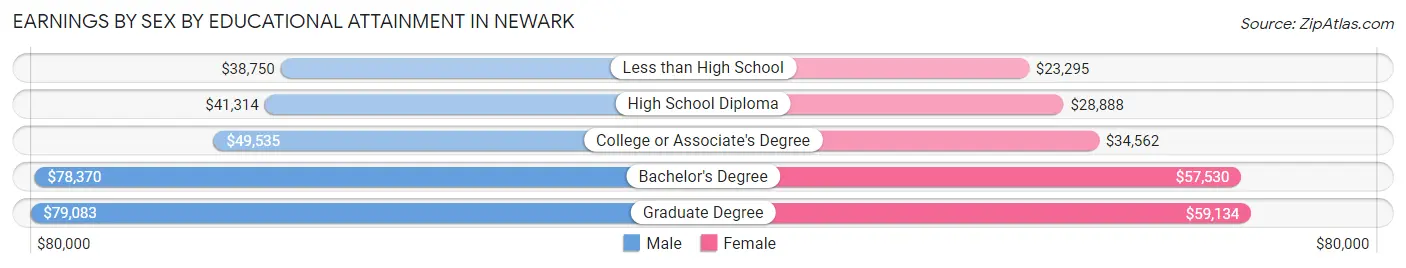
Earnings by Sex by Educational Attainment in Newark
Average earnings in Newark are $49,253 for men and $36,448 for women, a difference of 26.0%. Men with an educational attainment of graduate degree enjoy the highest average annual earnings of $79,083, while those with less than high school education earn the least with $38,750. Women with an educational attainment of graduate degree earn the most with the average annual earnings of $59,134, while those with less than high school education have the smallest earnings of $23,295.
| Educational Attainment | Male Income | Female Income |
| Less than High School | $38,750 | $23,295 |
| High School Diploma | $41,314 | $28,888 |
| College or Associate's Degree | $49,535 | $34,562 |
| Bachelor's Degree | $78,370 | $57,530 |
| Graduate Degree | $79,083 | $59,134 |
| Total | $49,253 | $36,448 |
Family Income in Newark
Family Income Brackets in Newark
According to the Newark family income data, there are 2,364 families falling into the $50,000 to $74,999 income range, which is the most common income bracket and makes up 19.6% of all families. Conversely, the $10,000 to $14,999 income bracket is the least frequent group with only 374 families (3.1%) belonging to this category.
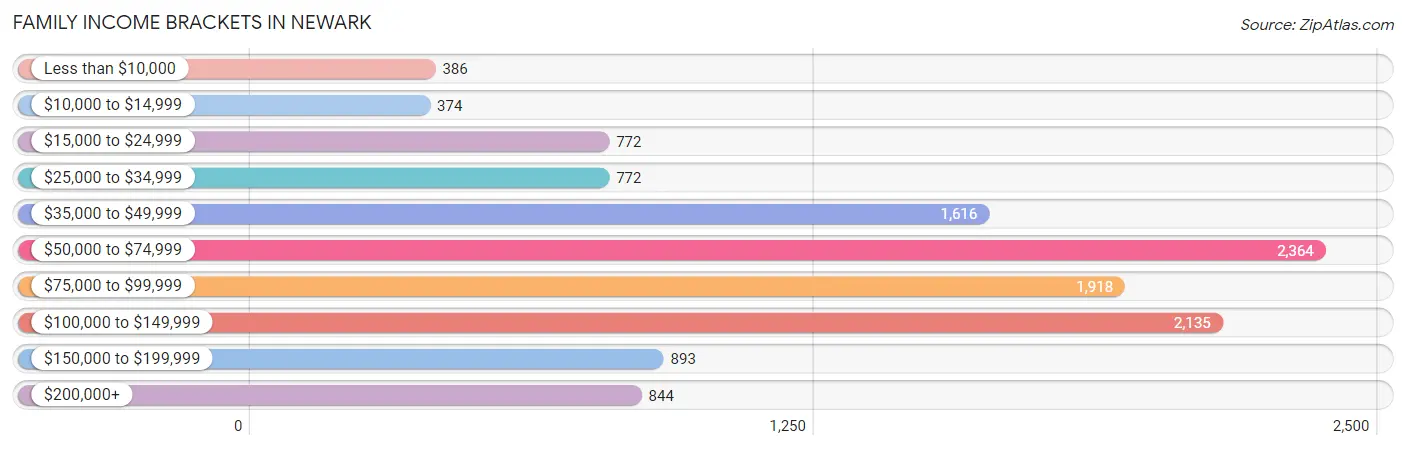
| Income Bracket | # Families | % Families |
| Less than $10,000 | 386 | 3.2% |
| $10,000 to $14,999 | 374 | 3.1% |
| $15,000 to $24,999 | 772 | 6.4% |
| $25,000 to $34,999 | 772 | 6.4% |
| $35,000 to $49,999 | 1,616 | 13.4% |
| $50,000 to $74,999 | 2,364 | 19.6% |
| $75,000 to $99,999 | 1,918 | 15.9% |
| $100,000 to $149,999 | 2,135 | 17.7% |
| $150,000 to $199,999 | 893 | 7.4% |
| $200,000+ | 844 | 7.0% |
Family Income by Famaliy Size in Newark
7+ person families (146 | 1.2%) account for the highest median family income in Newark with $128,514 per family, while 2-person families (5,654 | 46.9%) have the highest median income of $31,210 per family member.
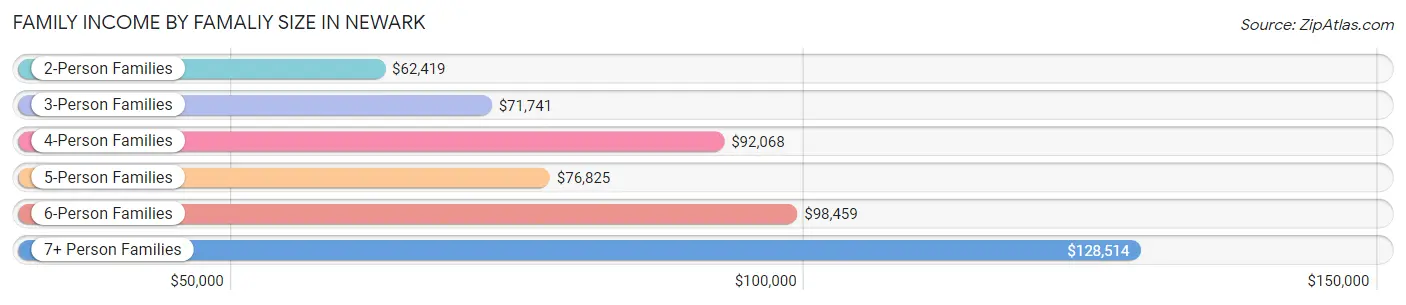
| Income Bracket | # Families | Median Income |
| 2-Person Families | 5,654 (46.9%) | $62,419 |
| 3-Person Families | 2,683 (22.2%) | $71,741 |
| 4-Person Families | 2,145 (17.8%) | $92,068 |
| 5-Person Families | 1,087 (9.0%) | $76,825 |
| 6-Person Families | 347 (2.9%) | $98,459 |
| 7+ Person Families | 146 (1.2%) | $128,514 |
| Total | 12,062 (100.0%) | $71,720 |
Family Income by Number of Earners in Newark
The median family income in Newark is $71,720, with families comprising 3+ earners (1,299) having the highest median family income of $143,872, while families with no earners (1,896) have the lowest median family income of $44,415, accounting for 10.8% and 15.7% of families, respectively.
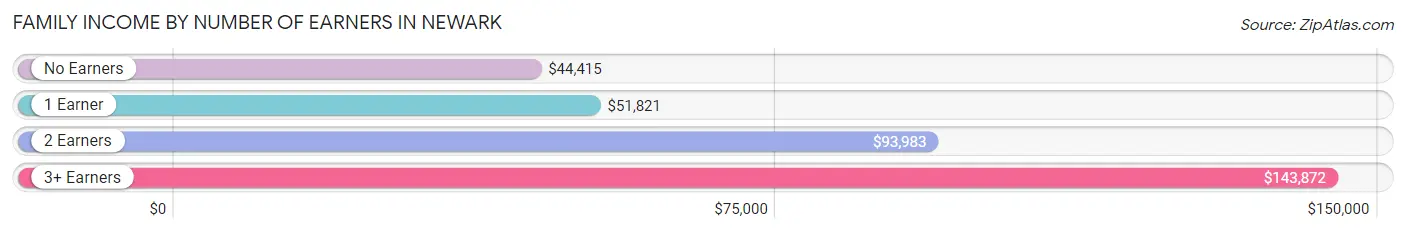
| Number of Earners | # Families | Median Income |
| No Earners | 1,896 (15.7%) | $44,415 |
| 1 Earner | 4,362 (36.2%) | $51,821 |
| 2 Earners | 4,505 (37.3%) | $93,983 |
| 3+ Earners | 1,299 (10.8%) | $143,872 |
| Total | 12,062 (100.0%) | $71,720 |
Household Income in Newark
Household Income Brackets in Newark
With 3,799 households falling in the category, the $50,000 to $74,999 income range is the most frequent in Newark, accounting for 18.8% of all households. In contrast, only 909 households (4.5%) fall into the $150,000 to $199,999 income bracket, making it the least populous group.
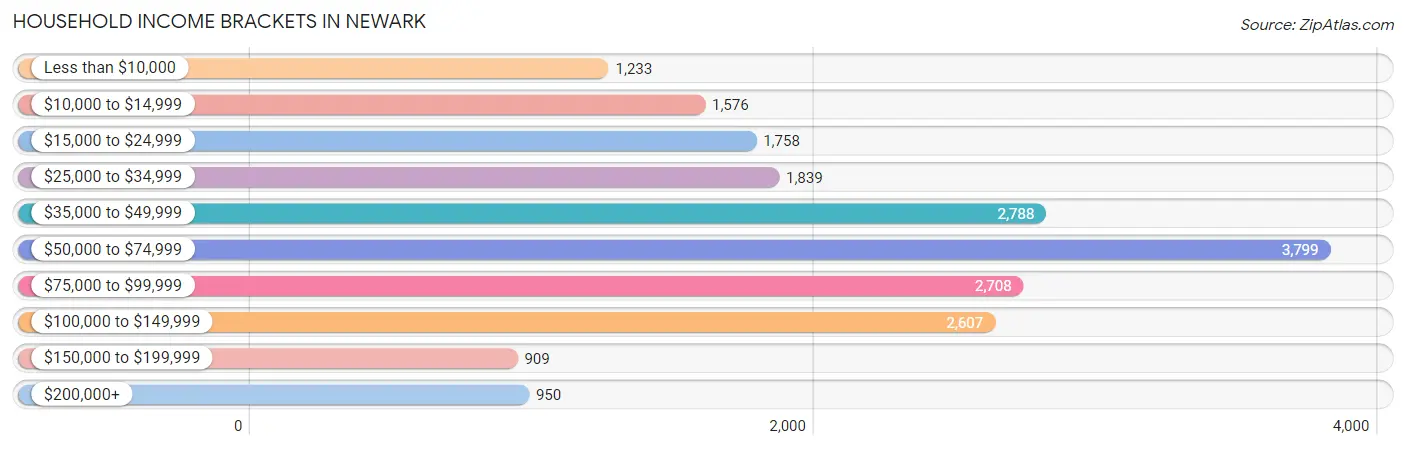
| Income Bracket | # Households | % Households |
| Less than $10,000 | 1,233 | 6.1% |
| $10,000 to $14,999 | 1,576 | 7.8% |
| $15,000 to $24,999 | 1,758 | 8.7% |
| $25,000 to $34,999 | 1,839 | 9.1% |
| $35,000 to $49,999 | 2,788 | 13.8% |
| $50,000 to $74,999 | 3,799 | 18.8% |
| $75,000 to $99,999 | 2,708 | 13.4% |
| $100,000 to $149,999 | 2,607 | 12.9% |
| $150,000 to $199,999 | 909 | 4.5% |
| $200,000+ | 950 | 4.7% |
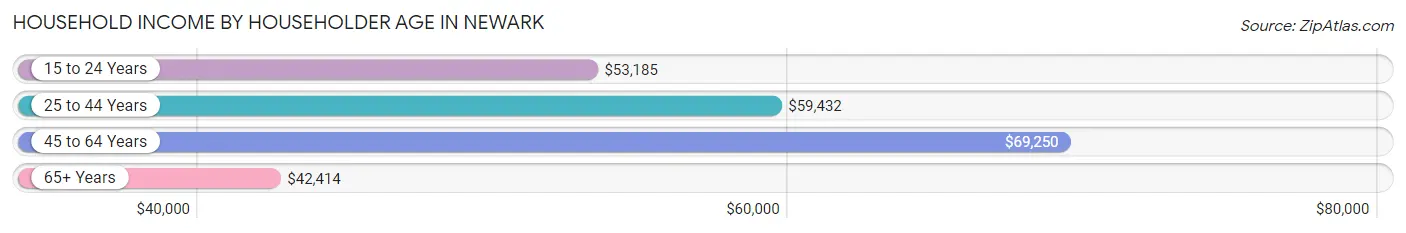
Household Income by Householder Age in Newark
The median household income in Newark is $56,284, with the highest median household income of $69,250 found in the 45 to 64 years age bracket for the primary householder. A total of 7,562 households (37.4%) fall into this category. Meanwhile, the 65+ years age bracket for the primary householder has the lowest median household income of $42,414, with 5,195 households (25.7%) in this group.
| Income Bracket | # Households | Median Income |
| 15 to 24 Years | 1,176 (5.8%) | $53,185 |
| 25 to 44 Years | 6,273 (31.0%) | $59,432 |
| 45 to 64 Years | 7,562 (37.4%) | $69,250 |
| 65+ Years | 5,195 (25.7%) | $42,414 |
| Total | 20,206 (100.0%) | $56,284 |
Poverty in Newark
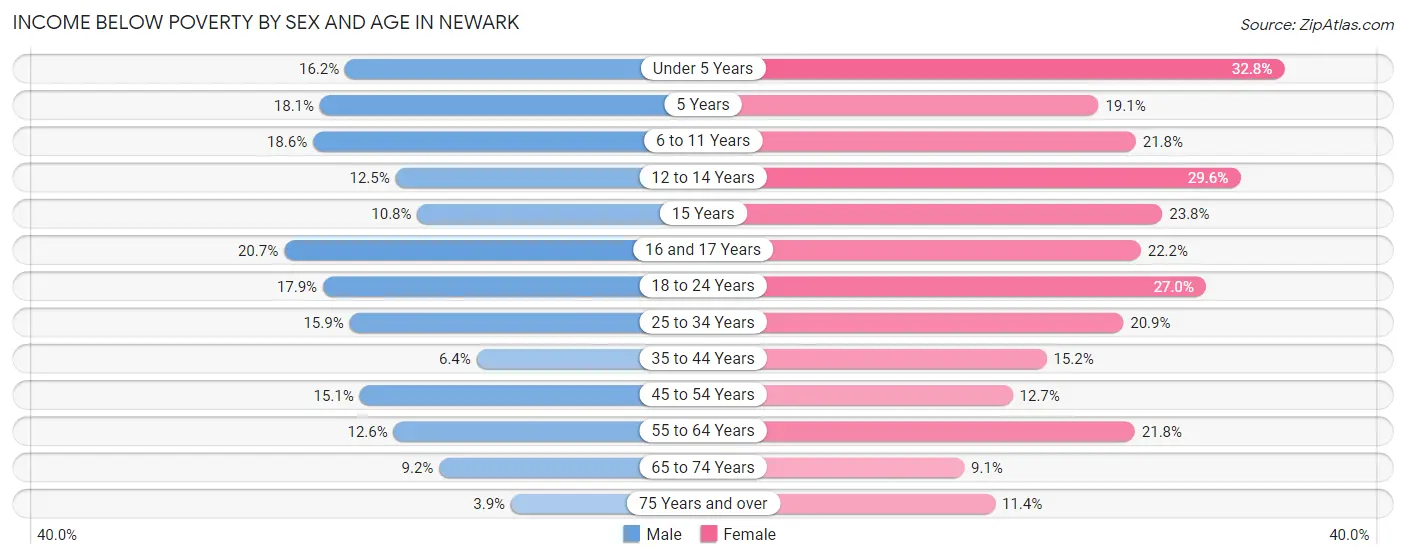
Income Below Poverty by Sex and Age in Newark
With 13.4% poverty level for males and 19.1% for females among the residents of Newark, 16 and 17 year old males and under 5 year old females are the most vulnerable to poverty, with 124 males (20.7%) and 459 females (32.8%) in their respective age groups living below the poverty level.
| Age Bracket | Male | Female |
| Under 5 Years | 202 (16.2%) | 459 (32.8%) |
| 5 Years | 66 (18.1%) | 81 (19.1%) |
| 6 to 11 Years | 335 (18.6%) | 346 (21.8%) |
| 12 to 14 Years | 128 (12.5%) | 316 (29.6%) |
| 15 Years | 27 (10.8%) | 94 (23.8%) |
| 16 and 17 Years | 124 (20.7%) | 139 (22.2%) |
| 18 to 24 Years | 482 (17.8%) | 680 (27.0%) |
| 25 to 34 Years | 497 (15.9%) | 668 (20.9%) |
| 35 to 44 Years | 173 (6.4%) | 510 (15.2%) |
| 45 to 54 Years | 492 (15.1%) | 367 (12.7%) |
| 55 to 64 Years | 409 (12.6%) | 662 (21.8%) |
| 65 to 74 Years | 181 (9.2%) | 227 (9.1%) |
| 75 Years and over | 54 (3.9%) | 246 (11.4%) |
| Total | 3,170 (13.4%) | 4,795 (19.1%) |
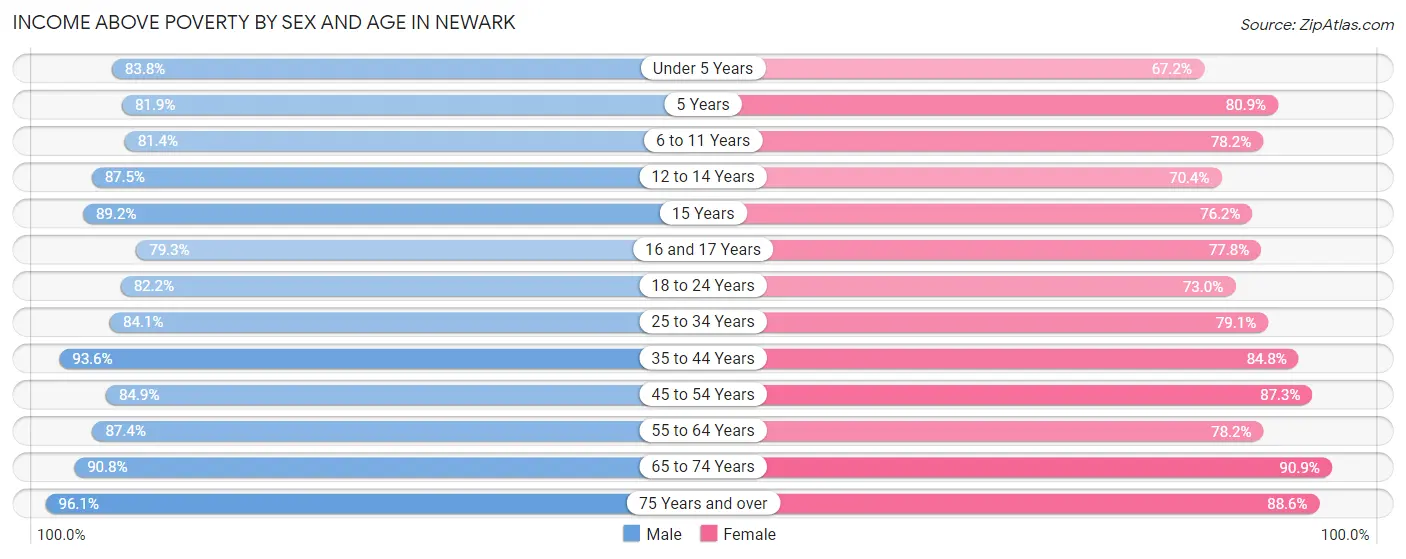
Income Above Poverty by Sex and Age in Newark
According to the poverty statistics in Newark, males aged 75 years and over and females aged 65 to 74 years are the age groups that are most secure financially, with 96.1% of males and 90.9% of females in these age groups living above the poverty line.
| Age Bracket | Male | Female |
| Under 5 Years | 1,044 (83.8%) | 939 (67.2%) |
| 5 Years | 299 (81.9%) | 344 (80.9%) |
| 6 to 11 Years | 1,467 (81.4%) | 1,239 (78.2%) |
| 12 to 14 Years | 899 (87.5%) | 753 (70.4%) |
| 15 Years | 222 (89.2%) | 301 (76.2%) |
| 16 and 17 Years | 474 (79.3%) | 487 (77.8%) |
| 18 to 24 Years | 2,219 (82.2%) | 1,837 (73.0%) |
| 25 to 34 Years | 2,632 (84.1%) | 2,528 (79.1%) |
| 35 to 44 Years | 2,512 (93.6%) | 2,845 (84.8%) |
| 45 to 54 Years | 2,759 (84.9%) | 2,528 (87.3%) |
| 55 to 64 Years | 2,834 (87.4%) | 2,380 (78.2%) |
| 65 to 74 Years | 1,783 (90.8%) | 2,272 (90.9%) |
| 75 Years and over | 1,334 (96.1%) | 1,915 (88.6%) |
| Total | 20,478 (86.6%) | 20,368 (80.9%) |
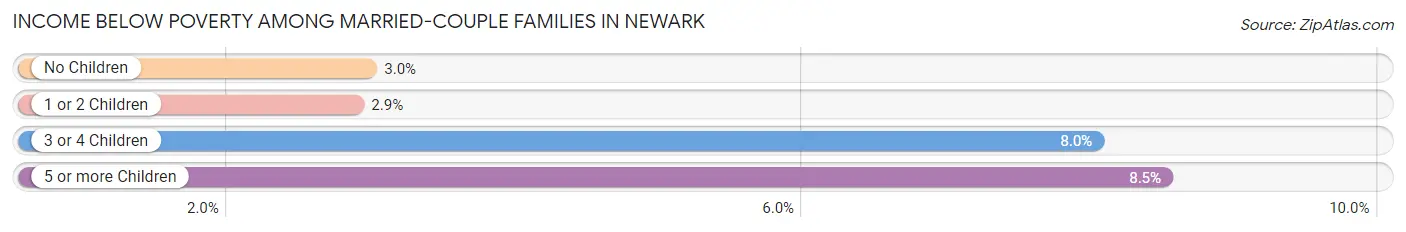
Income Below Poverty Among Married-Couple Families in Newark
The poverty statistics for married-couple families in Newark show that 3.4% or 279 of the total 8,125 families live below the poverty line. Families with 5 or more children have the highest poverty rate of 8.5%, comprising of 8 families. On the other hand, families with 1 or 2 children have the lowest poverty rate of 2.9%, which includes 73 families.
| Children | Above Poverty | Below Poverty |
| No Children | 4,670 (97.0%) | 143 (3.0%) |
| 1 or 2 Children | 2,460 (97.1%) | 73 (2.9%) |
| 3 or 4 Children | 630 (92.0%) | 55 (8.0%) |
| 5 or more Children | 86 (91.5%) | 8 (8.5%) |
| Total | 7,846 (96.6%) | 279 (3.4%) |
Income Below Poverty Among Single-Parent Households in Newark
According to the poverty data in Newark, 12.4% or 130 single-father households and 31.2% or 900 single-mother households are living below the poverty line. Among single-father households, those with 1 or 2 children have the highest poverty rate, with 95 households (14.9%) experiencing poverty. Likewise, among single-mother households, those with 3 or 4 children have the highest poverty rate, with 471 households (90.1%) falling below the poverty line.
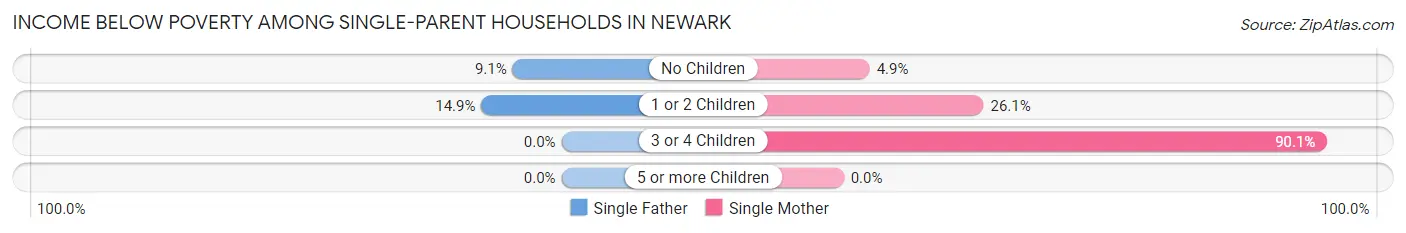
| Children | Single Father | Single Mother |
| No Children | 35 (9.1%) | 43 (4.9%) |
| 1 or 2 Children | 95 (14.9%) | 386 (26.1%) |
| 3 or 4 Children | 0 (0.0%) | 471 (90.1%) |
| 5 or more Children | 0 (0.0%) | 0 (0.0%) |
| Total | 130 (12.4%) | 900 (31.2%) |
Income Below Poverty Among Married-Couple vs Single-Parent Households in Newark
The poverty data for Newark shows that 279 of the married-couple family households (3.4%) and 1,030 of the single-parent households (26.2%) are living below the poverty level. Within the married-couple family households, those with 5 or more children have the highest poverty rate, with 8 households (8.5%) falling below the poverty line. Among the single-parent households, those with 3 or 4 children have the highest poverty rate, with 471 household (85.3%) living below poverty.
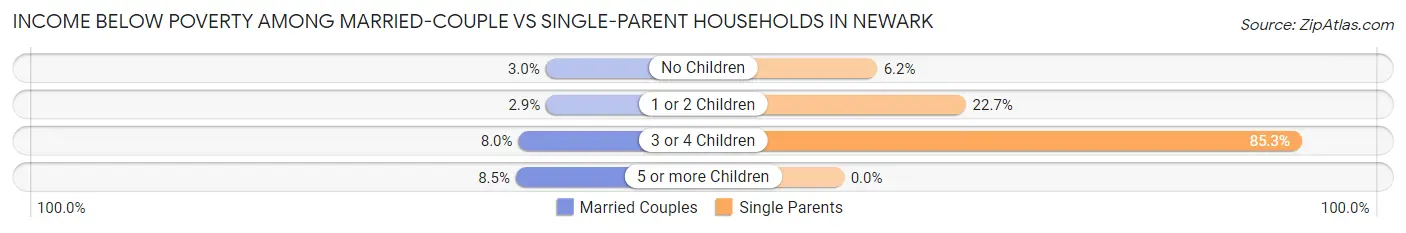
| Children | Married-Couple Families | Single-Parent Households |
| No Children | 143 (3.0%) | 78 (6.1%) |
| 1 or 2 Children | 73 (2.9%) | 481 (22.7%) |
| 3 or 4 Children | 55 (8.0%) | 471 (85.3%) |
| 5 or more Children | 8 (8.5%) | 0 (0.0%) |
| Total | 279 (3.4%) | 1,030 (26.2%) |
Race in Newark
The most populous races in Newark are White / Caucasian (44,780 | 89.4%), Two or more Races (2,633 | 5.3%), and Black / African American (1,674 | 3.3%).
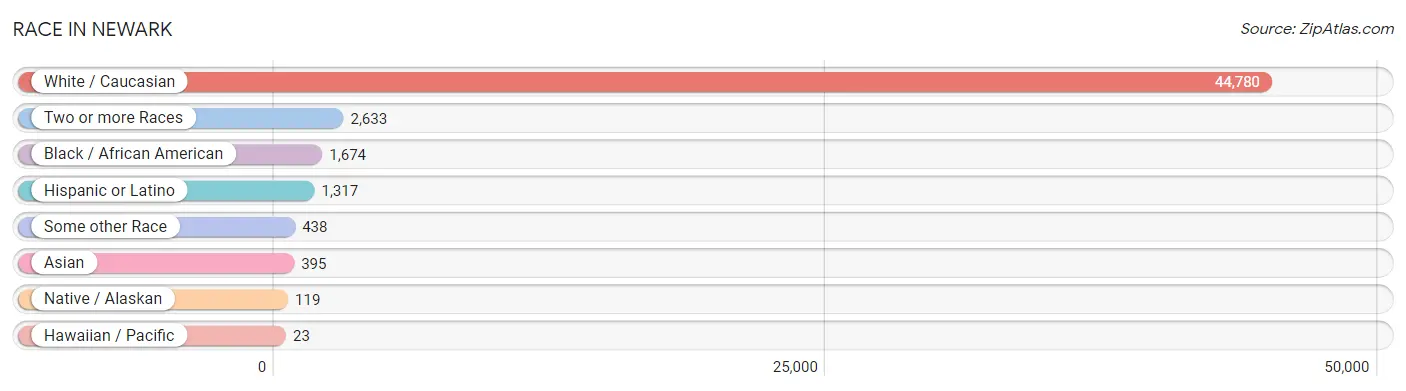
| Race | # Population | % Population |
| Asian | 395 | 0.8% |
| Black / African American | 1,674 | 3.3% |
| Hawaiian / Pacific | 23 | 0.1% |
| Hispanic or Latino | 1,317 | 2.6% |
| Native / Alaskan | 119 | 0.2% |
| White / Caucasian | 44,780 | 89.4% |
| Two or more Races | 2,633 | 5.3% |
| Some other Race | 438 | 0.9% |
| Total | 50,062 | 100.0% |
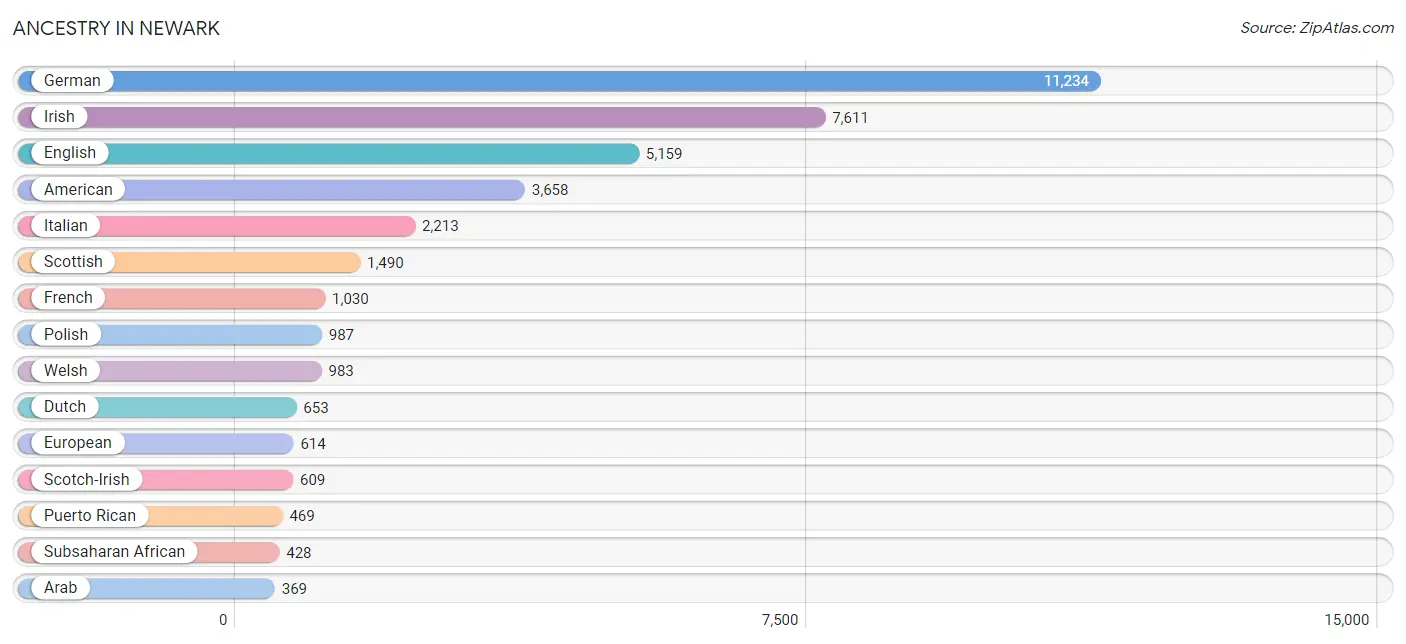
Ancestry in Newark
The most populous ancestries reported in Newark are German (11,234 | 22.4%), Irish (7,611 | 15.2%), English (5,159 | 10.3%), American (3,658 | 7.3%), and Italian (2,213 | 4.4%), together accounting for 59.7% of all Newark residents.
| Ancestry | # Population | % Population |
| African | 220 | 0.4% |
| American | 3,658 | 7.3% |
| Arab | 369 | 0.7% |
| Armenian | 6 | 0.0% |
| Austrian | 106 | 0.2% |
| Barbadian | 20 | 0.0% |
| Belgian | 50 | 0.1% |
| Bhutanese | 89 | 0.2% |
| Blackfeet | 58 | 0.1% |
| British | 180 | 0.4% |
| Burmese | 64 | 0.1% |
| Canadian | 16 | 0.0% |
| Central American | 145 | 0.3% |
| Cherokee | 195 | 0.4% |
| Chilean | 3 | 0.0% |
| Choctaw | 32 | 0.1% |
| Colombian | 56 | 0.1% |
| Costa Rican | 102 | 0.2% |
| Croatian | 50 | 0.1% |
| Czech | 138 | 0.3% |
| Czechoslovakian | 11 | 0.0% |
| Danish | 133 | 0.3% |
| Delaware | 6 | 0.0% |
| Dominican | 77 | 0.2% |
| Dutch | 653 | 1.3% |
| Eastern European | 67 | 0.1% |
| English | 5,159 | 10.3% |
| European | 614 | 1.2% |
| Filipino | 11 | 0.0% |
| French | 1,030 | 2.1% |
| French Canadian | 45 | 0.1% |
| German | 11,234 | 22.4% |
| Greek | 49 | 0.1% |
| Guamanian / Chamorro | 42 | 0.1% |
| Hungarian | 311 | 0.6% |
| Indian (Asian) | 51 | 0.1% |
| Irish | 7,611 | 15.2% |
| Israeli | 6 | 0.0% |
| Italian | 2,213 | 4.4% |
| Jordanian | 11 | 0.0% |
| Korean | 190 | 0.4% |
| Lithuanian | 51 | 0.1% |
| Luxembourger | 7 | 0.0% |
| Macedonian | 4 | 0.0% |
| Mexican | 353 | 0.7% |
| Mexican American Indian | 57 | 0.1% |
| Northern European | 90 | 0.2% |
| Norwegian | 190 | 0.4% |
| Palestinian | 11 | 0.0% |
| Panamanian | 24 | 0.1% |
| Pennsylvania German | 54 | 0.1% |
| Polish | 987 | 2.0% |
| Portuguese | 14 | 0.0% |
| Puerto Rican | 469 | 0.9% |
| Romanian | 18 | 0.0% |
| Russian | 205 | 0.4% |
| Salvadoran | 19 | 0.0% |
| Samoan | 75 | 0.2% |
| Scandinavian | 196 | 0.4% |
| Scotch-Irish | 609 | 1.2% |
| Scottish | 1,490 | 3.0% |
| Serbian | 131 | 0.3% |
| Sioux | 55 | 0.1% |
| Slovak | 191 | 0.4% |
| Slovene | 28 | 0.1% |
| South African | 12 | 0.0% |
| South American | 79 | 0.2% |
| Spanish | 106 | 0.2% |
| Sri Lankan | 18 | 0.0% |
| Subsaharan African | 428 | 0.9% |
| Swedish | 360 | 0.7% |
| Swiss | 106 | 0.2% |
| Thai | 172 | 0.3% |
| Trinidadian and Tobagonian | 75 | 0.2% |
| Ukrainian | 46 | 0.1% |
| Uruguayan | 20 | 0.0% |
| Welsh | 983 | 2.0% |
| Yugoslavian | 7 | 0.0% | View All 78 Rows |
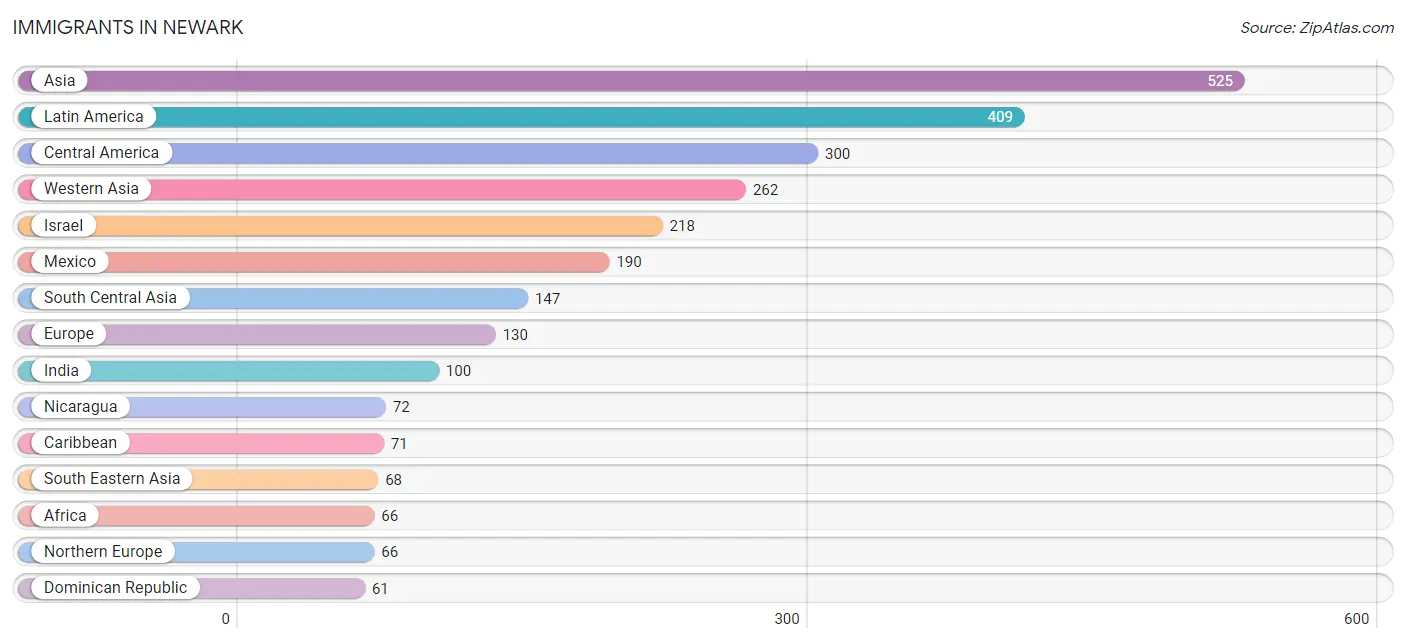
Immigrants in Newark
The most numerous immigrant groups reported in Newark came from Asia (525 | 1.1%), Latin America (409 | 0.8%), Central America (300 | 0.6%), Western Asia (262 | 0.5%), and Israel (218 | 0.4%), together accounting for 3.4% of all Newark residents.
| Immigration Origin | # Population | % Population |
| Africa | 66 | 0.1% |
| Asia | 525 | 1.1% |
| Belgium | 16 | 0.0% |
| Canada | 60 | 0.1% |
| Caribbean | 71 | 0.1% |
| Central America | 300 | 0.6% |
| Chile | 3 | 0.0% |
| China | 33 | 0.1% |
| Colombia | 15 | 0.0% |
| Costa Rica | 14 | 0.0% |
| Dominican Republic | 61 | 0.1% |
| Eastern Africa | 12 | 0.0% |
| Eastern Asia | 48 | 0.1% |
| Eastern Europe | 11 | 0.0% |
| England | 42 | 0.1% |
| Europe | 130 | 0.3% |
| France | 6 | 0.0% |
| Germany | 30 | 0.1% |
| India | 100 | 0.2% |
| Israel | 218 | 0.4% |
| Italy | 1 | 0.0% |
| Jordan | 21 | 0.0% |
| Kazakhstan | 42 | 0.1% |
| Korea | 15 | 0.0% |
| Kuwait | 23 | 0.1% |
| Latin America | 409 | 0.8% |
| Mexico | 190 | 0.4% |
| Nicaragua | 72 | 0.1% |
| Northern Europe | 66 | 0.1% |
| Pakistan | 5 | 0.0% |
| Panama | 24 | 0.1% |
| Philippines | 53 | 0.1% |
| Scotland | 24 | 0.1% |
| South America | 38 | 0.1% |
| South Central Asia | 147 | 0.3% |
| South Eastern Asia | 68 | 0.1% |
| Southern Europe | 1 | 0.0% |
| St. Vincent and the Grenadines | 10 | 0.0% |
| Uruguay | 20 | 0.0% |
| Vietnam | 15 | 0.0% |
| Western Africa | 54 | 0.1% |
| Western Asia | 262 | 0.5% |
| Western Europe | 52 | 0.1% | View All 43 Rows |
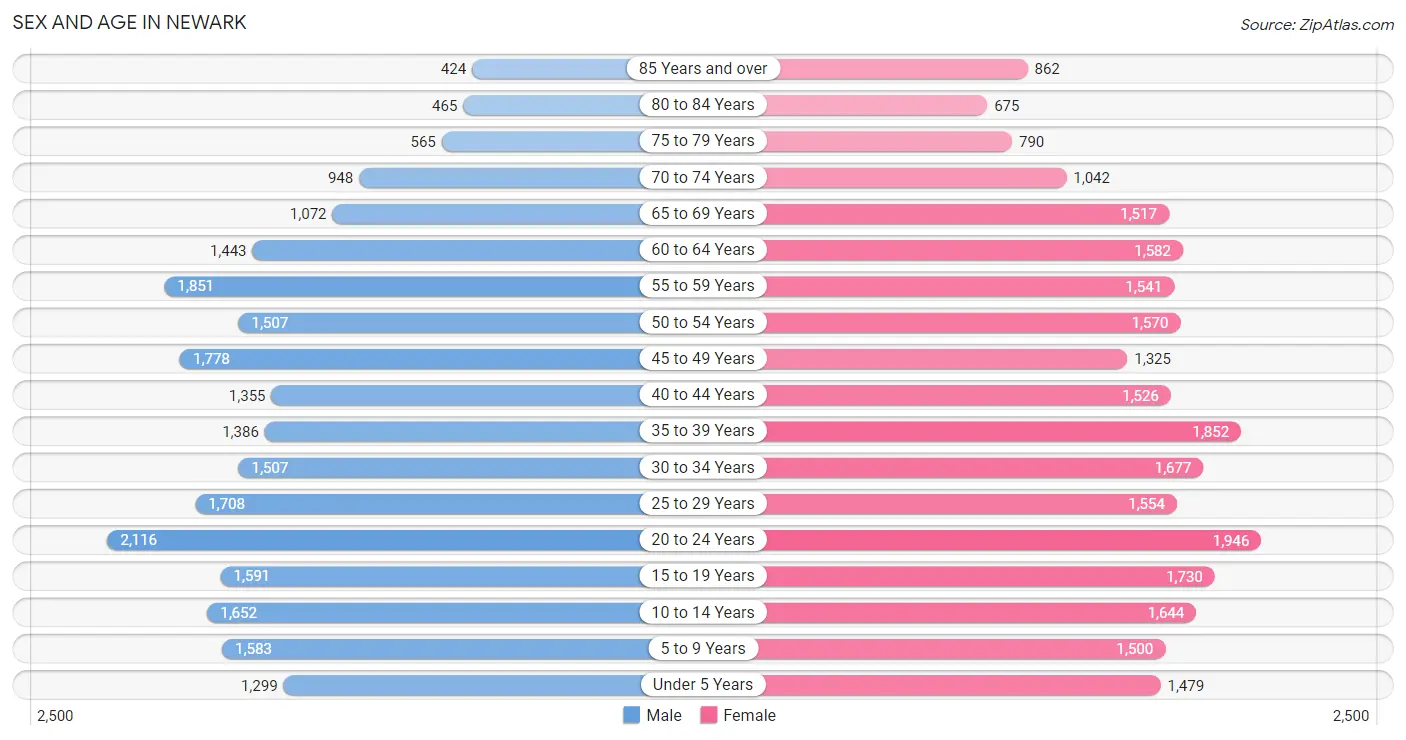
Sex and Age in Newark
Sex and Age in Newark
The most populous age groups in Newark are 20 to 24 Years (2,116 | 8.7%) for men and 20 to 24 Years (1,946 | 7.5%) for women.
| Age Bracket | Male | Female |
| Under 5 Years | 1,299 (5.4%) | 1,479 (5.7%) |
| 5 to 9 Years | 1,583 (6.5%) | 1,500 (5.8%) |
| 10 to 14 Years | 1,652 (6.8%) | 1,644 (6.4%) |
| 15 to 19 Years | 1,591 (6.6%) | 1,730 (6.7%) |
| 20 to 24 Years | 2,116 (8.7%) | 1,946 (7.5%) |
| 25 to 29 Years | 1,708 (7.0%) | 1,554 (6.0%) |
| 30 to 34 Years | 1,507 (6.2%) | 1,677 (6.5%) |
| 35 to 39 Years | 1,386 (5.7%) | 1,852 (7.2%) |
| 40 to 44 Years | 1,355 (5.6%) | 1,526 (5.9%) |
| 45 to 49 Years | 1,778 (7.3%) | 1,325 (5.1%) |
| 50 to 54 Years | 1,507 (6.2%) | 1,570 (6.1%) |
| 55 to 59 Years | 1,851 (7.6%) | 1,541 (6.0%) |
| 60 to 64 Years | 1,443 (5.9%) | 1,582 (6.1%) |
| 65 to 69 Years | 1,072 (4.4%) | 1,517 (5.9%) |
| 70 to 74 Years | 948 (3.9%) | 1,042 (4.0%) |
| 75 to 79 Years | 565 (2.3%) | 790 (3.1%) |
| 80 to 84 Years | 465 (1.9%) | 675 (2.6%) |
| 85 Years and over | 424 (1.8%) | 862 (3.3%) |
| Total | 24,250 (100.0%) | 25,812 (100.0%) |
Families and Households in Newark
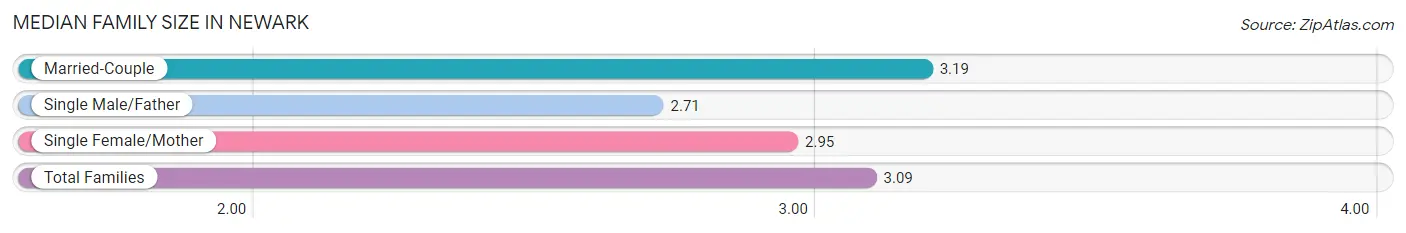
Median Family Size in Newark
The median family size in Newark is 3.09 persons per family, with married-couple families (8,125 | 67.4%) accounting for the largest median family size of 3.19 persons per family. On the other hand, single male/father families (1,049 | 8.7%) represent the smallest median family size with 2.71 persons per family.
| Family Type | # Families | Family Size |
| Married-Couple | 8,125 (67.4%) | 3.19 |
| Single Male/Father | 1,049 (8.7%) | 2.71 |
| Single Female/Mother | 2,888 (23.9%) | 2.95 |
| Total Families | 12,062 (100.0%) | 3.09 |
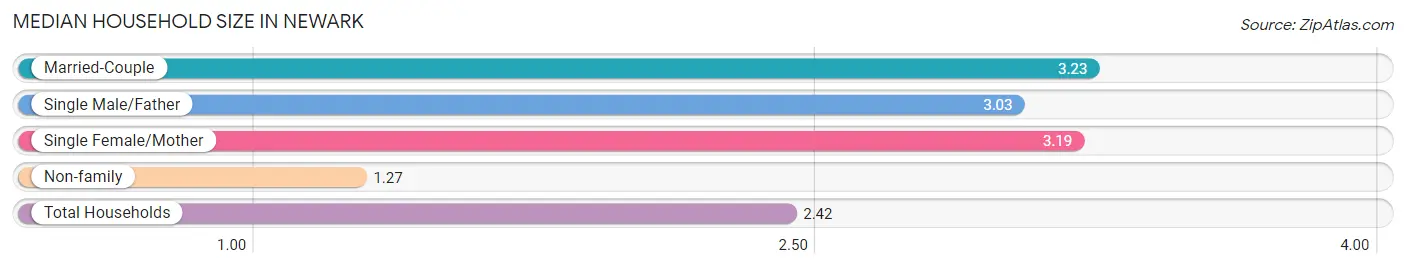
Median Household Size in Newark
The median household size in Newark is 2.42 persons per household, with married-couple households (8,125 | 40.2%) accounting for the largest median household size of 3.23 persons per household. non-family households (8,144 | 40.3%) represent the smallest median household size with 1.27 persons per household.
| Household Type | # Households | Household Size |
| Married-Couple | 8,125 (40.2%) | 3.23 |
| Single Male/Father | 1,049 (5.2%) | 3.03 |
| Single Female/Mother | 2,888 (14.3%) | 3.19 |
| Non-family | 8,144 (40.3%) | 1.27 |
| Total Households | 20,206 (100.0%) | 2.42 |
Household Size by Marriage Status in Newark
Out of a total of 20,206 households in Newark, 12,062 (59.7%) are family households, while 8,144 (40.3%) are nonfamily households. The most numerous type of family households are 2-person households, comprising 5,239, and the most common type of nonfamily households are 1-person households, comprising 6,511.
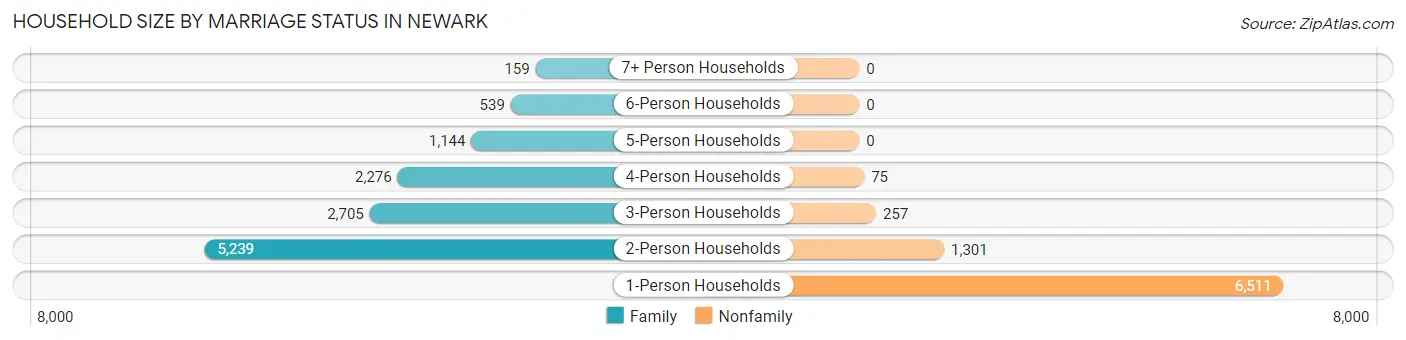
| Household Size | Family Households | Nonfamily Households |
| 1-Person Households | - | 6,511 (32.2%) |
| 2-Person Households | 5,239 (25.9%) | 1,301 (6.4%) |
| 3-Person Households | 2,705 (13.4%) | 257 (1.3%) |
| 4-Person Households | 2,276 (11.3%) | 75 (0.4%) |
| 5-Person Households | 1,144 (5.7%) | 0 (0.0%) |
| 6-Person Households | 539 (2.7%) | 0 (0.0%) |
| 7+ Person Households | 159 (0.8%) | 0 (0.0%) |
| Total | 12,062 (59.7%) | 8,144 (40.3%) |
Female Fertility in Newark
Fertility by Age in Newark
Average fertility rate in Newark is 51.0 births per 1,000 women. Women in the age bracket of 20 to 34 years have the highest fertility rate with 89.0 births per 1,000 women. Women in the age bracket of 20 to 34 years acount for 75.0% of all women with births.
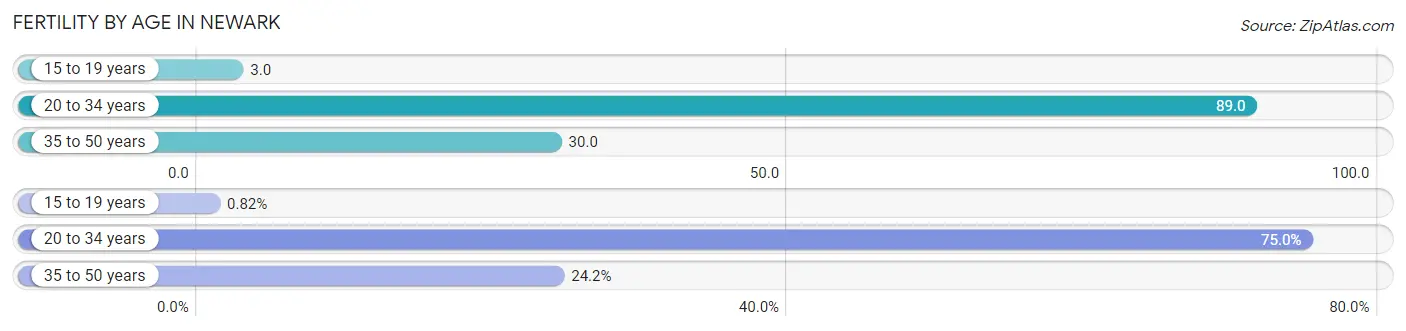
| Age Bracket | Women with Births | Births / 1,000 Women |
| 15 to 19 years | 5 (0.8%) | 3.0 |
| 20 to 34 years | 459 (75.0%) | 89.0 |
| 35 to 50 years | 148 (24.2%) | 30.0 |
| Total | 612 (100.0%) | 51.0 |
Fertility by Age by Marriage Status in Newark
57.4% of women with births (612) in Newark are married. The highest percentage of unmarried women with births falls into 15 to 19 years age bracket with 100.0% of them unmarried at the time of birth, while the lowest percentage of unmarried women with births belong to 35 to 50 years age bracket with 0.0% of them unmarried.
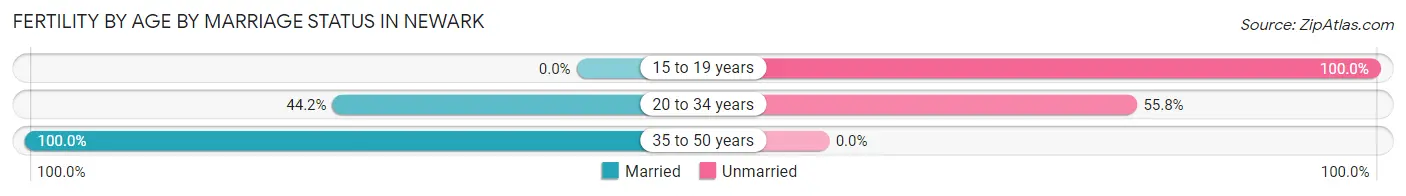
| Age Bracket | Married | Unmarried |
| 15 to 19 years | 0 (0.0%) | 5 (100.0%) |
| 20 to 34 years | 203 (44.2%) | 256 (55.8%) |
| 35 to 50 years | 148 (100.0%) | 0 (0.0%) |
| Total | 351 (57.4%) | 261 (42.6%) |
Fertility by Education in Newark
Average fertility rate in Newark is 51.0 births per 1,000 women. Women with the education attainment of college or associate's degree have the highest fertility rate of 82.0 births per 1,000 women, while women with the education attainment of high school diploma have the lowest fertility at 31.0 births per 1,000 women. Women with the education attainment of college or associate's degree represent 52.8% of all women with births.
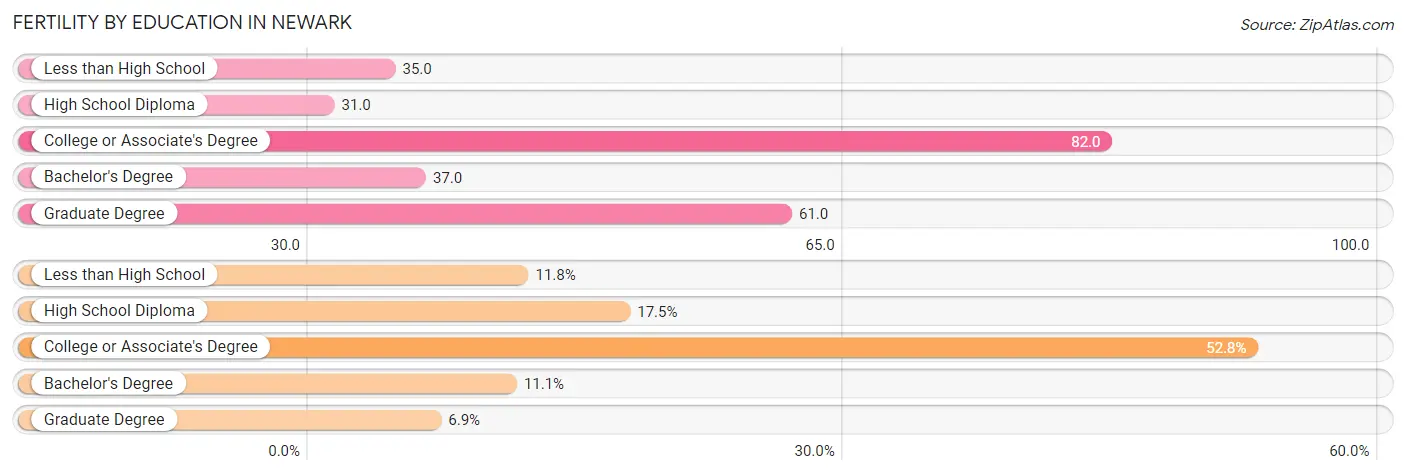
| Educational Attainment | Women with Births | Births / 1,000 Women |
| Less than High School | 72 (11.8%) | 35.0 |
| High School Diploma | 107 (17.5%) | 31.0 |
| College or Associate's Degree | 323 (52.8%) | 82.0 |
| Bachelor's Degree | 68 (11.1%) | 37.0 |
| Graduate Degree | 42 (6.9%) | 61.0 |
| Total | 612 (100.0%) | 51.0 |
Fertility by Education by Marriage Status in Newark
42.6% of women with births in Newark are unmarried. Women with the educational attainment of bachelor's degree are most likely to be married with 100.0% of them married at childbirth, while women with the educational attainment of college or associate's degree are least likely to be married with 62.8% of them unmarried at childbirth.
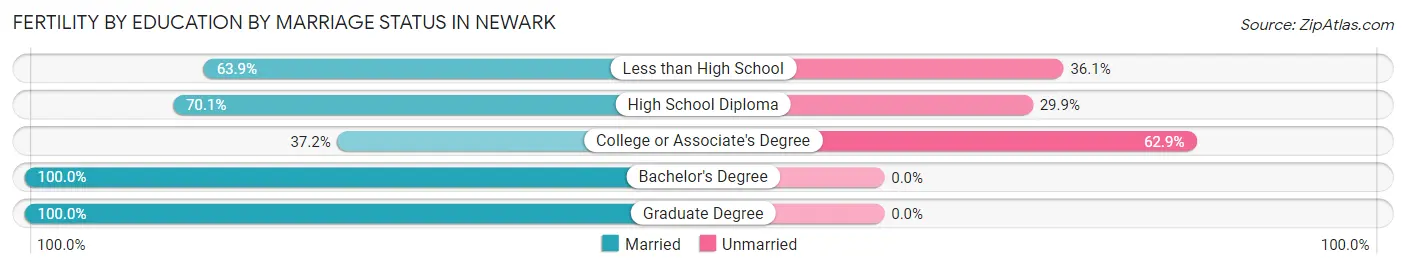
| Educational Attainment | Married | Unmarried |
| Less than High School | 46 (63.9%) | 26 (36.1%) |
| High School Diploma | 75 (70.1%) | 32 (29.9%) |
| College or Associate's Degree | 120 (37.1%) | 203 (62.8%) |
| Bachelor's Degree | 68 (100.0%) | 0 (0.0%) |
| Graduate Degree | 42 (100.0%) | 0 (0.0%) |
| Total | 351 (57.4%) | 261 (42.6%) |
Employment Characteristics in Newark
Employment by Class of Employer in Newark
Among the 22,741 employed individuals in Newark, private company employees (16,180 | 71.2%), not-for-profit organizations (2,450 | 10.8%), and local government employees (1,851 | 8.1%) make up the most common classes of employment.
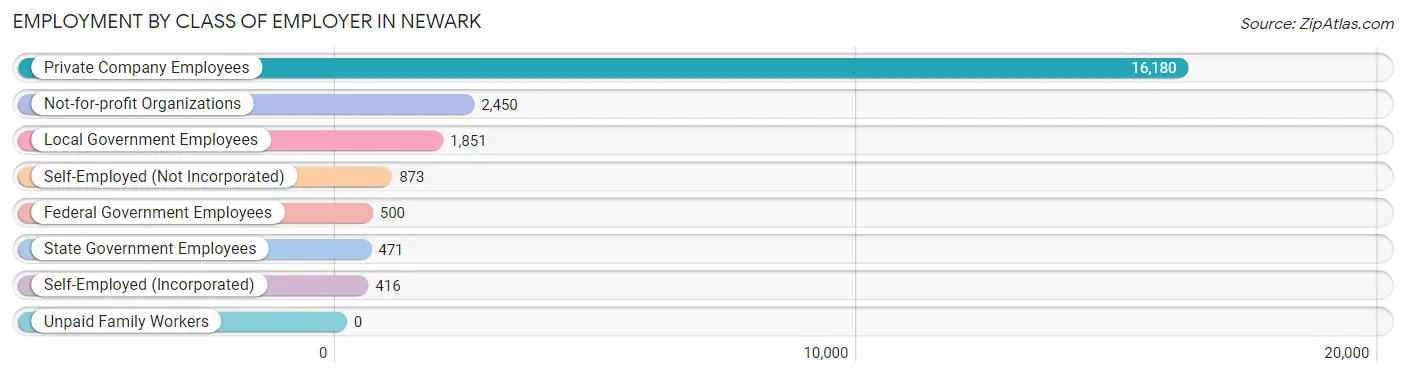
| Employer Class | # Employees | % Employees |
| Private Company Employees | 16,180 | 71.2% |
| Self-Employed (Incorporated) | 416 | 1.8% |
| Self-Employed (Not Incorporated) | 873 | 3.8% |
| Not-for-profit Organizations | 2,450 | 10.8% |
| Local Government Employees | 1,851 | 8.1% |
| State Government Employees | 471 | 2.1% |
| Federal Government Employees | 500 | 2.2% |
| Unpaid Family Workers | 0 | 0.0% |
| Total | 22,741 | 100.0% |
Employment Status by Age in Newark
According to the labor force statistics for Newark, out of the total population over 16 years of age (40,261), 60.0% or 24,157 individuals are in the labor force, with 4.0% or 966 of them unemployed. The age group with the highest labor force participation rate is 30 to 34 years, with 84.0% or 2,675 individuals in the labor force. Within the labor force, the 20 to 24 years age range has the highest percentage of unemployed individuals, with 8.4% or 273 of them being unemployed.
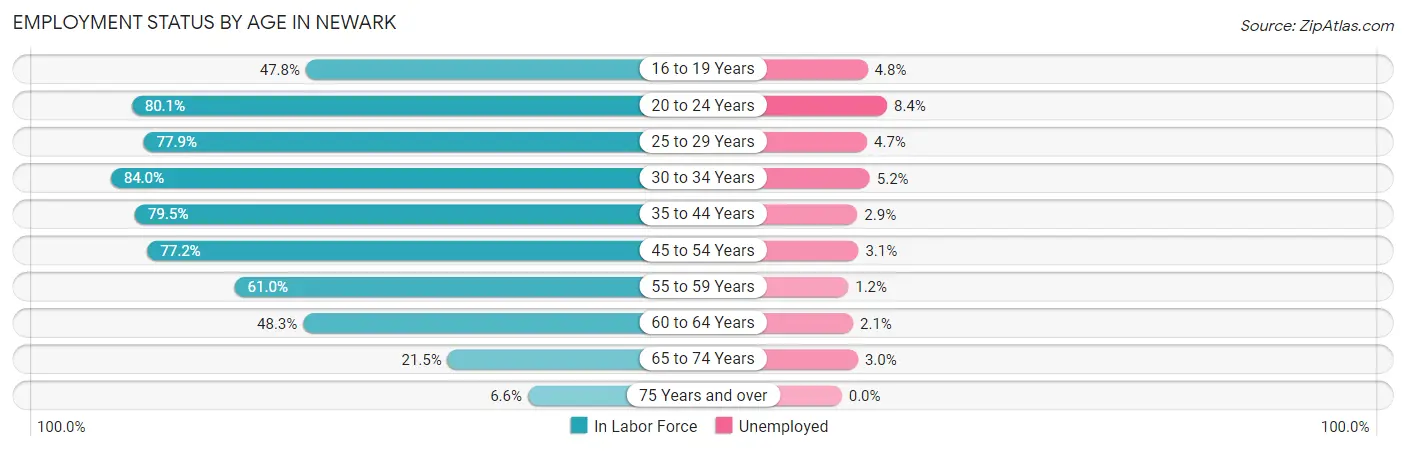
| Age Bracket | In Labor Force | Unemployed |
| 16 to 19 Years | 1,280 (47.8%) | 61 (4.8%) |
| 20 to 24 Years | 3,254 (80.1%) | 273 (8.4%) |
| 25 to 29 Years | 2,541 (77.9%) | 119 (4.7%) |
| 30 to 34 Years | 2,675 (84.0%) | 139 (5.2%) |
| 35 to 44 Years | 4,865 (79.5%) | 141 (2.9%) |
| 45 to 54 Years | 4,771 (77.2%) | 148 (3.1%) |
| 55 to 59 Years | 2,069 (61.0%) | 25 (1.2%) |
| 60 to 64 Years | 1,461 (48.3%) | 31 (2.1%) |
| 65 to 74 Years | 984 (21.5%) | 30 (3.0%) |
| 75 Years and over | 250 (6.6%) | 0 (0.0%) |
| Total | 24,157 (60.0%) | 966 (4.0%) |
Employment Status by Educational Attainment in Newark
According to labor force statistics for Newark, 73.1% of individuals (18,393) out of the total population between 25 and 64 years of age (25,162) are in the labor force, with 3.3% or 607 of them being unemployed. The group with the highest labor force participation rate are those with the educational attainment of bachelor's degree or higher, with 83.0% or 5,140 individuals in the labor force. Within the labor force, individuals with less than high school education have the highest percentage of unemployment, with 17.2% or 152 of them being unemployed.
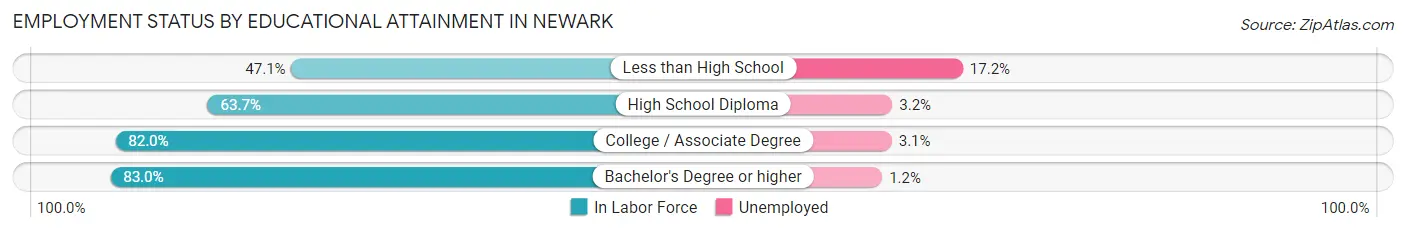
| Educational Attainment | In Labor Force | Unemployed |
| Less than High School | 886 (47.1%) | 324 (17.2%) |
| High School Diploma | 5,766 (63.7%) | 290 (3.2%) |
| College / Associate Degree | 6,589 (82.0%) | 249 (3.1%) |
| Bachelor's Degree or higher | 5,140 (83.0%) | 74 (1.2%) |
| Total | 18,393 (73.1%) | 830 (3.3%) |
Employment Occupations by Sex in Newark
Management, Business, Science and Arts Occupations
The most common Management, Business, Science and Arts occupations in Newark are Management (1,818 | 7.8%), Community & Social Service (1,703 | 7.3%), Business & Financial (1,270 | 5.5%), Computers, Engineering & Science (1,229 | 5.3%), and Health Diagnosing & Treating (1,045 | 4.5%).
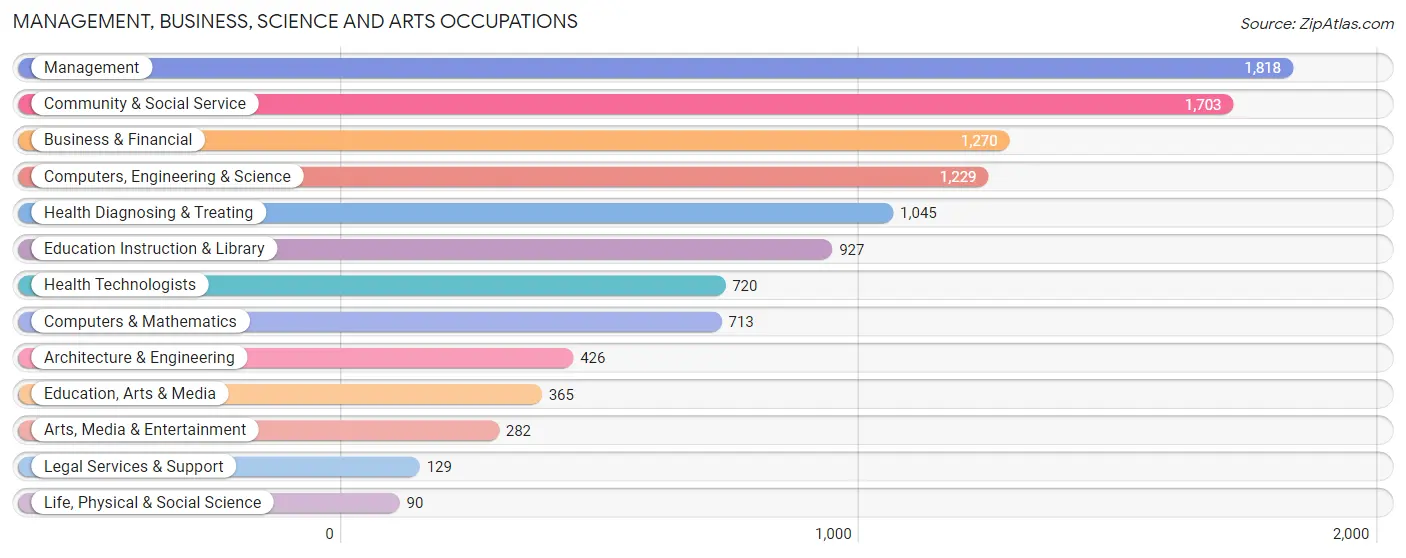
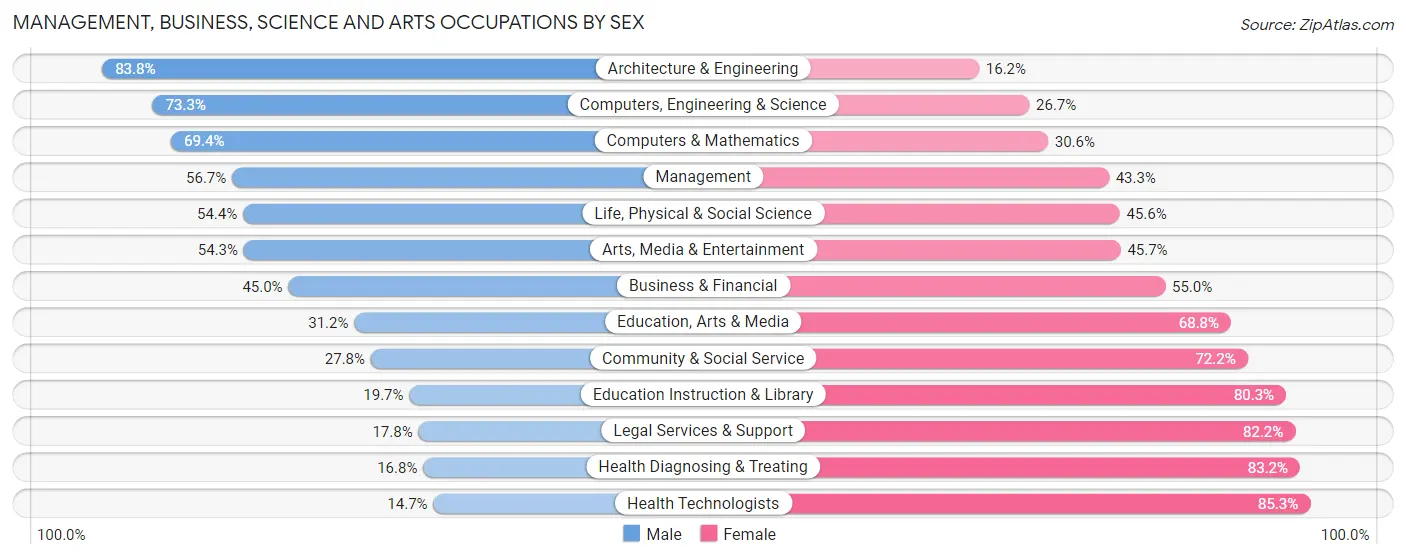
Management, Business, Science and Arts Occupations by Sex
Within the Management, Business, Science and Arts occupations in Newark, the most male-oriented occupations are Architecture & Engineering (83.8%), Computers, Engineering & Science (73.3%), and Computers & Mathematics (69.4%), while the most female-oriented occupations are Health Technologists (85.3%), Health Diagnosing & Treating (83.2%), and Legal Services & Support (82.2%).
| Occupation | Male | Female |
| Management | 1,031 (56.7%) | 787 (43.3%) |
| Business & Financial | 571 (45.0%) | 699 (55.0%) |
| Computers, Engineering & Science | 901 (73.3%) | 328 (26.7%) |
| Computers & Mathematics | 495 (69.4%) | 218 (30.6%) |
| Architecture & Engineering | 357 (83.8%) | 69 (16.2%) |
| Life, Physical & Social Science | 49 (54.4%) | 41 (45.6%) |
| Community & Social Service | 473 (27.8%) | 1,230 (72.2%) |
| Education, Arts & Media | 114 (31.2%) | 251 (68.8%) |
| Legal Services & Support | 23 (17.8%) | 106 (82.2%) |
| Education Instruction & Library | 183 (19.7%) | 744 (80.3%) |
| Arts, Media & Entertainment | 153 (54.3%) | 129 (45.7%) |
| Health Diagnosing & Treating | 176 (16.8%) | 869 (83.2%) |
| Health Technologists | 106 (14.7%) | 614 (85.3%) |
| Total (Category) | 3,152 (44.6%) | 3,913 (55.4%) |
| Total (Overall) | 11,724 (50.6%) | 11,462 (49.4%) |
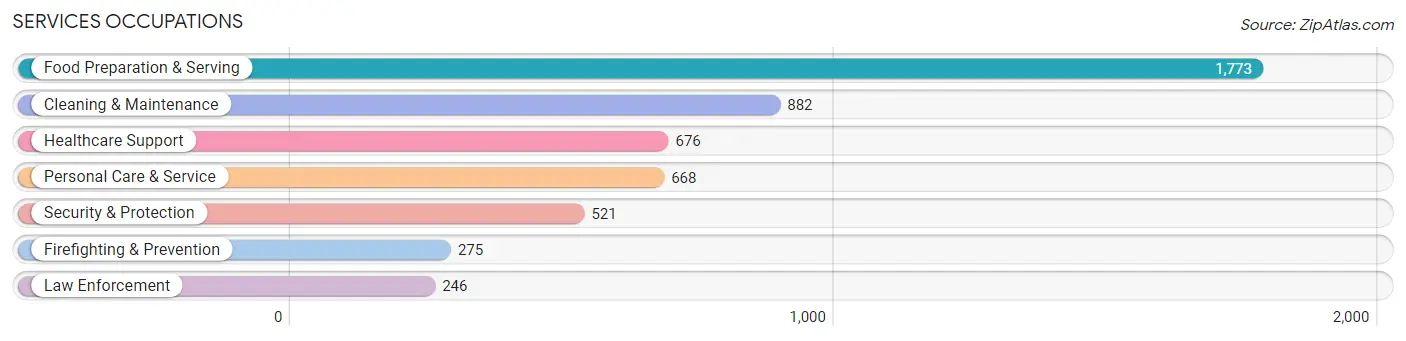
Services Occupations
The most common Services occupations in Newark are Food Preparation & Serving (1,773 | 7.6%), Cleaning & Maintenance (882 | 3.8%), Healthcare Support (676 | 2.9%), Personal Care & Service (668 | 2.9%), and Security & Protection (521 | 2.2%).
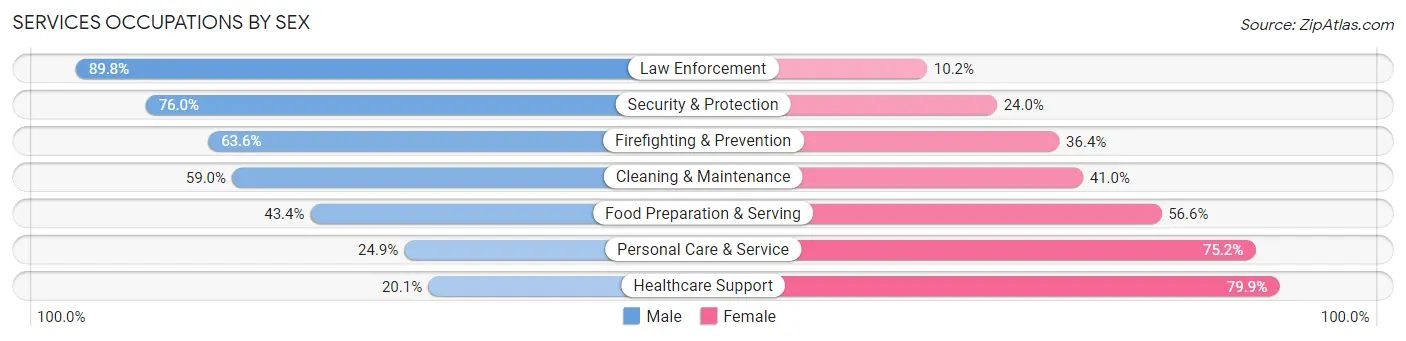
Services Occupations by Sex
Within the Services occupations in Newark, the most male-oriented occupations are Law Enforcement (89.8%), Security & Protection (76.0%), and Firefighting & Prevention (63.6%), while the most female-oriented occupations are Healthcare Support (79.9%), Personal Care & Service (75.1%), and Food Preparation & Serving (56.6%).
| Occupation | Male | Female |
| Healthcare Support | 136 (20.1%) | 540 (79.9%) |
| Security & Protection | 396 (76.0%) | 125 (24.0%) |
| Firefighting & Prevention | 175 (63.6%) | 100 (36.4%) |
| Law Enforcement | 221 (89.8%) | 25 (10.2%) |
| Food Preparation & Serving | 770 (43.4%) | 1,003 (56.6%) |
| Cleaning & Maintenance | 520 (59.0%) | 362 (41.0%) |
| Personal Care & Service | 166 (24.8%) | 502 (75.1%) |
| Total (Category) | 1,988 (44.0%) | 2,532 (56.0%) |
| Total (Overall) | 11,724 (50.6%) | 11,462 (49.4%) |
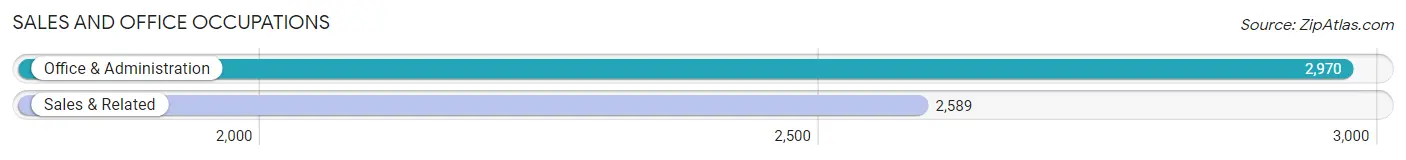
Sales and Office Occupations
The most common Sales and Office occupations in Newark are Office & Administration (2,970 | 12.8%), and Sales & Related (2,589 | 11.2%).
Sales and Office Occupations by Sex
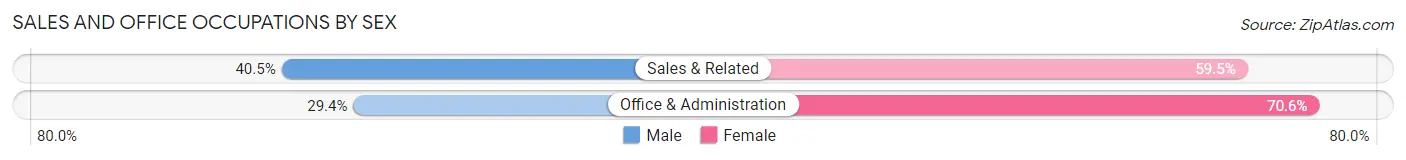
| Occupation | Male | Female |
| Sales & Related | 1,048 (40.5%) | 1,541 (59.5%) |
| Office & Administration | 874 (29.4%) | 2,096 (70.6%) |
| Total (Category) | 1,922 (34.6%) | 3,637 (65.4%) |
| Total (Overall) | 11,724 (50.6%) | 11,462 (49.4%) |
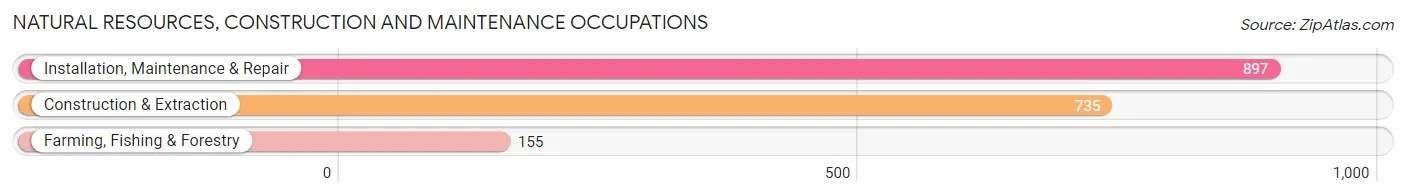
Natural Resources, Construction and Maintenance Occupations
The most common Natural Resources, Construction and Maintenance occupations in Newark are Installation, Maintenance & Repair (897 | 3.9%), Construction & Extraction (735 | 3.2%), and Farming, Fishing & Forestry (155 | 0.7%).
Natural Resources, Construction and Maintenance Occupations by Sex
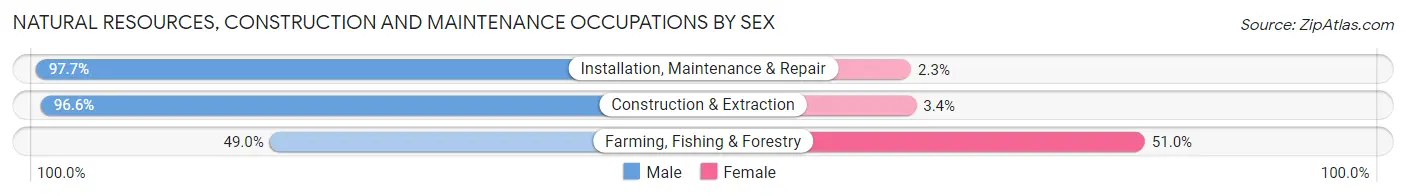
| Occupation | Male | Female |
| Farming, Fishing & Forestry | 76 (49.0%) | 79 (51.0%) |
| Construction & Extraction | 710 (96.6%) | 25 (3.4%) |
| Installation, Maintenance & Repair | 876 (97.7%) | 21 (2.3%) |
| Total (Category) | 1,662 (93.0%) | 125 (7.0%) |
| Total (Overall) | 11,724 (50.6%) | 11,462 (49.4%) |
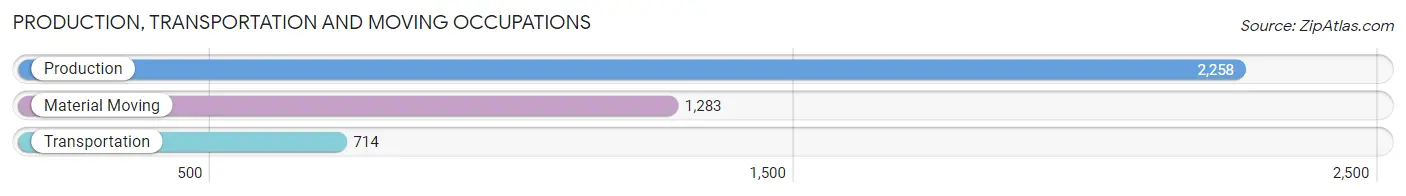
Production, Transportation and Moving Occupations
The most common Production, Transportation and Moving occupations in Newark are Production (2,258 | 9.7%), Material Moving (1,283 | 5.5%), and Transportation (714 | 3.1%).
Production, Transportation and Moving Occupations by Sex
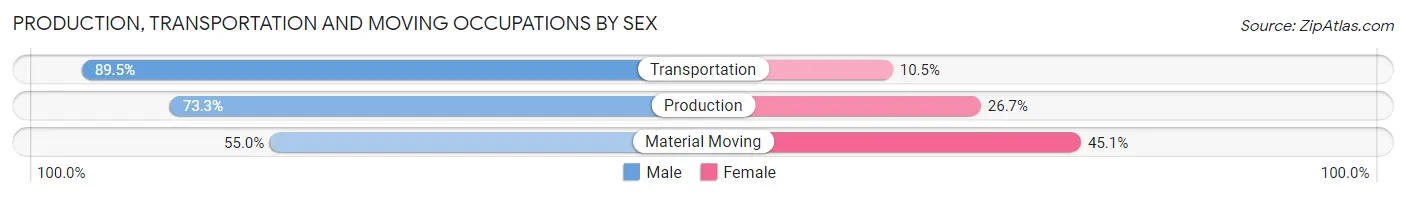
| Occupation | Male | Female |
| Production | 1,656 (73.3%) | 602 (26.7%) |
| Transportation | 639 (89.5%) | 75 (10.5%) |
| Material Moving | 705 (54.9%) | 578 (45.1%) |
| Total (Category) | 3,000 (70.5%) | 1,255 (29.5%) |
| Total (Overall) | 11,724 (50.6%) | 11,462 (49.4%) |
Employment Industries by Sex in Newark
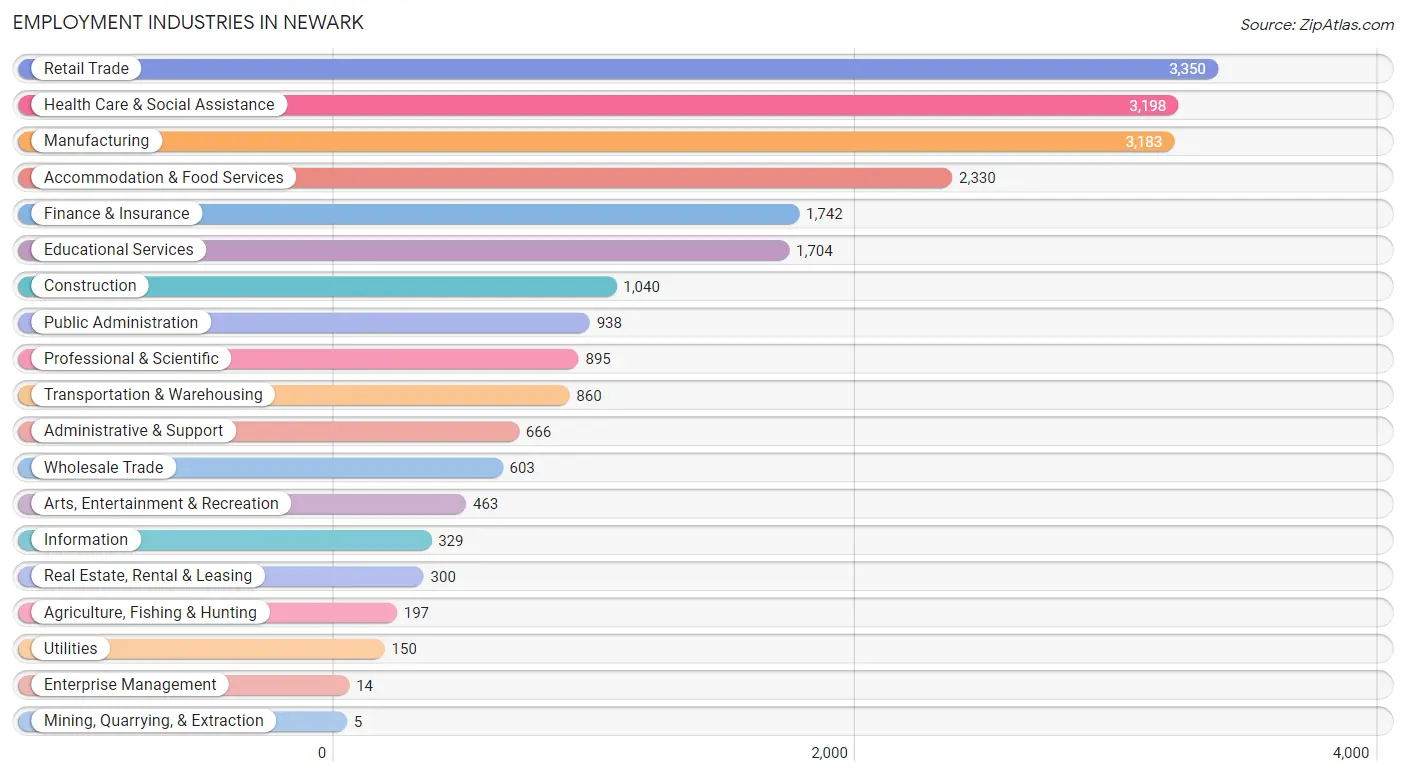
Employment Industries in Newark
The major employment industries in Newark include Retail Trade (3,350 | 14.4%), Health Care & Social Assistance (3,198 | 13.8%), Manufacturing (3,183 | 13.7%), Accommodation & Food Services (2,330 | 10.1%), and Finance & Insurance (1,742 | 7.5%).
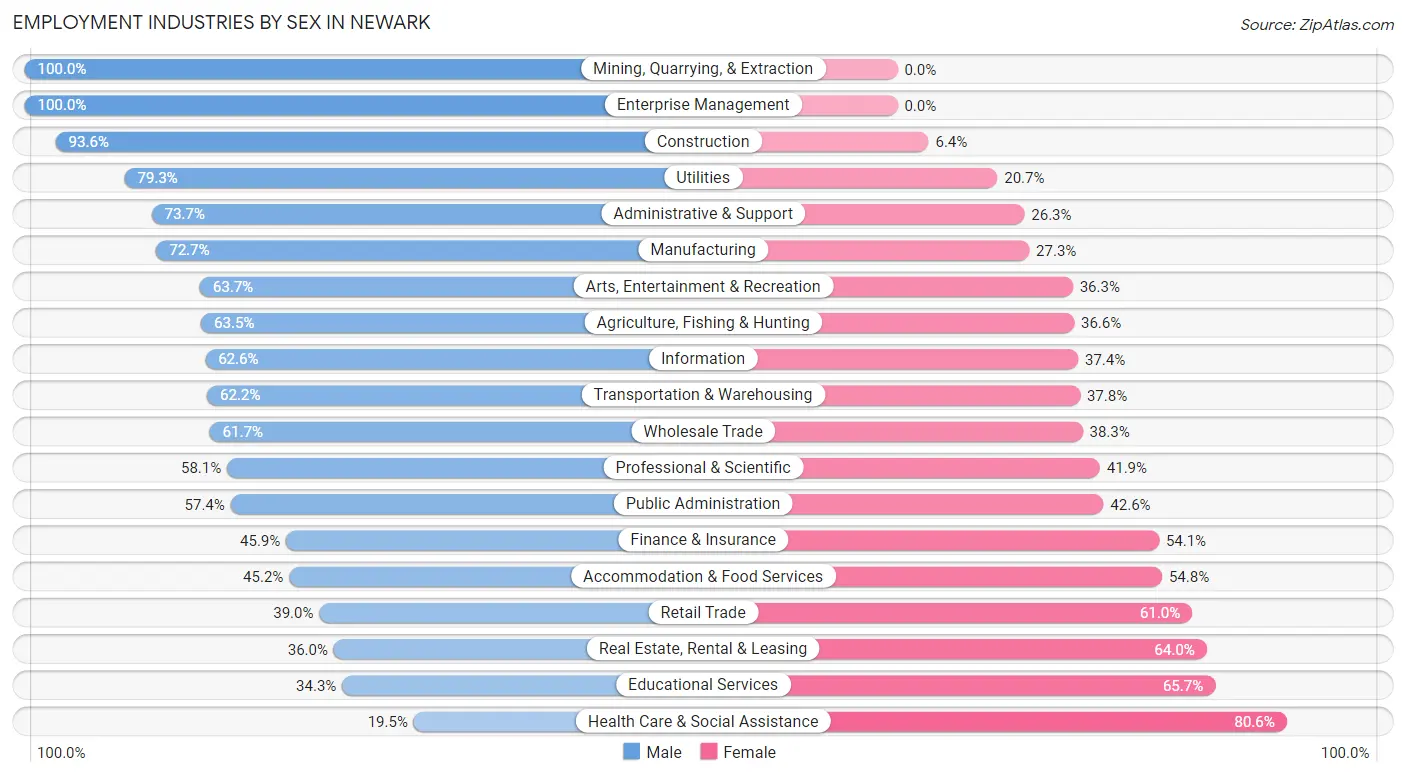
Employment Industries by Sex in Newark
The Newark industries that see more men than women are Mining, Quarrying, & Extraction (100.0%), Enterprise Management (100.0%), and Construction (93.6%), whereas the industries that tend to have a higher number of women are Health Care & Social Assistance (80.5%), Educational Services (65.7%), and Real Estate, Rental & Leasing (64.0%).
| Industry | Male | Female |
| Agriculture, Fishing & Hunting | 125 (63.4%) | 72 (36.5%) |
| Mining, Quarrying, & Extraction | 5 (100.0%) | 0 (0.0%) |
| Construction | 973 (93.6%) | 67 (6.4%) |
| Manufacturing | 2,315 (72.7%) | 868 (27.3%) |
| Wholesale Trade | 372 (61.7%) | 231 (38.3%) |
| Retail Trade | 1,307 (39.0%) | 2,043 (61.0%) |
| Transportation & Warehousing | 535 (62.2%) | 325 (37.8%) |
| Utilities | 119 (79.3%) | 31 (20.7%) |
| Information | 206 (62.6%) | 123 (37.4%) |
| Finance & Insurance | 799 (45.9%) | 943 (54.1%) |
| Real Estate, Rental & Leasing | 108 (36.0%) | 192 (64.0%) |
| Professional & Scientific | 520 (58.1%) | 375 (41.9%) |
| Enterprise Management | 14 (100.0%) | 0 (0.0%) |
| Administrative & Support | 491 (73.7%) | 175 (26.3%) |
| Educational Services | 584 (34.3%) | 1,120 (65.7%) |
| Health Care & Social Assistance | 622 (19.5%) | 2,576 (80.5%) |
| Arts, Entertainment & Recreation | 295 (63.7%) | 168 (36.3%) |
| Accommodation & Food Services | 1,054 (45.2%) | 1,276 (54.8%) |
| Public Administration | 538 (57.4%) | 400 (42.6%) |
| Total | 11,724 (50.6%) | 11,462 (49.4%) |
Education in Newark
School Enrollment in Newark
The most common levels of schooling among the 11,669 students in Newark are high school (2,656 | 22.8%), middle school (2,540 | 21.8%), and college / undergraduate (2,407 | 20.6%).
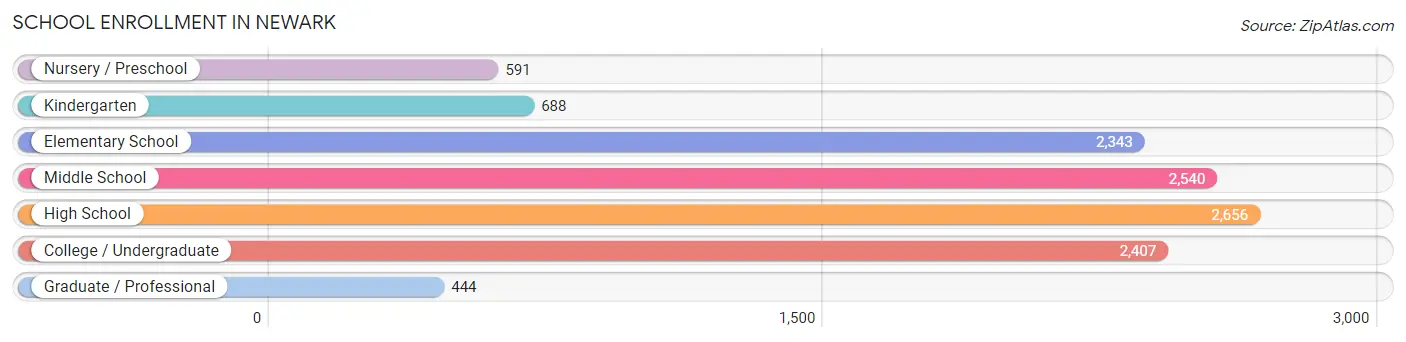
| School Level | # Students | % Students |
| Nursery / Preschool | 591 | 5.1% |
| Kindergarten | 688 | 5.9% |
| Elementary School | 2,343 | 20.1% |
| Middle School | 2,540 | 21.8% |
| High School | 2,656 | 22.8% |
| College / Undergraduate | 2,407 | 20.6% |
| Graduate / Professional | 444 | 3.8% |
| Total | 11,669 | 100.0% |
School Enrollment by Age by Funding Source in Newark
Out of a total of 11,669 students who are enrolled in schools in Newark, 1,435 (12.3%) attend a private institution, while the remaining 10,234 (87.7%) are enrolled in public schools. The age group of 35 years and over has the highest likelihood of being enrolled in private schools, with 131 (26.6% in the age bracket) enrolled. Conversely, the age group of 10 to 14 year olds has the lowest likelihood of being enrolled in a private school, with 3,022 (93.6% in the age bracket) attending a public institution.
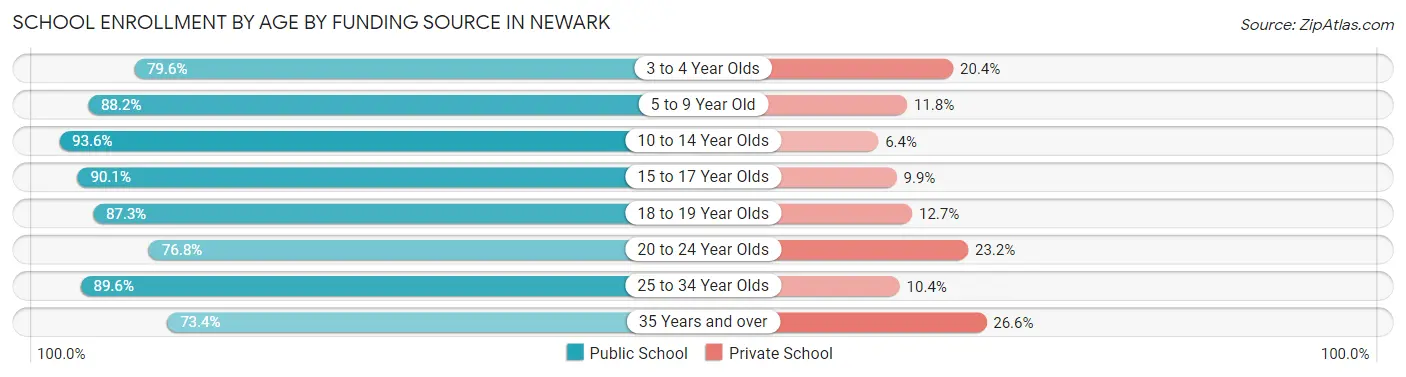
| Age Bracket | Public School | Private School |
| 3 to 4 Year Olds | 379 (79.6%) | 97 (20.4%) |
| 5 to 9 Year Old | 2,427 (88.2%) | 325 (11.8%) |
| 10 to 14 Year Olds | 3,022 (93.6%) | 208 (6.4%) |
| 15 to 17 Year Olds | 1,664 (90.1%) | 182 (9.9%) |
| 18 to 19 Year Olds | 904 (87.3%) | 132 (12.7%) |
| 20 to 24 Year Olds | 1,035 (76.8%) | 312 (23.2%) |
| 25 to 34 Year Olds | 438 (89.6%) | 51 (10.4%) |
| 35 Years and over | 362 (73.4%) | 131 (26.6%) |
| Total | 10,234 (87.7%) | 1,435 (12.3%) |
Educational Attainment by Field of Study in Newark
Business (2,069 | 25.3%), education (1,275 | 15.6%), science & technology (840 | 10.3%), bio, nature & agricultural (522 | 6.4%), and arts & humanities (473 | 5.8%) are the most common fields of study among 8,188 individuals in Newark who have obtained a bachelor's degree or higher.
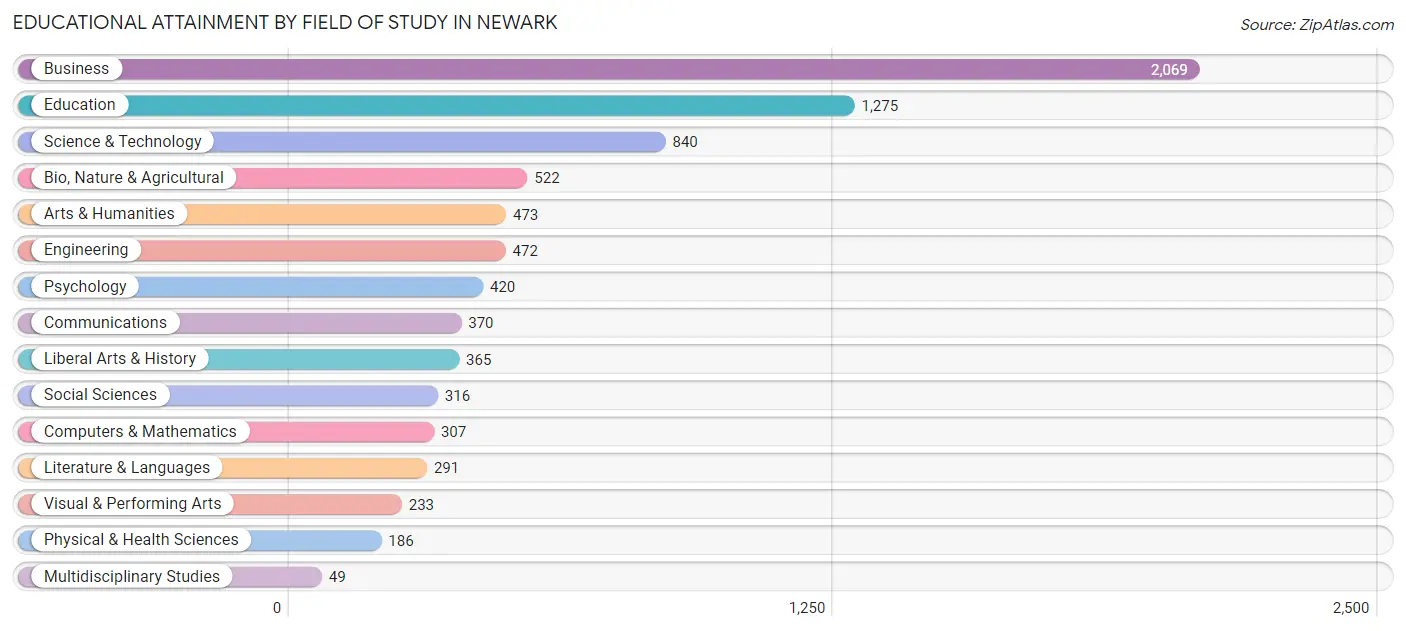
| Field of Study | # Graduates | % Graduates |
| Computers & Mathematics | 307 | 3.7% |
| Bio, Nature & Agricultural | 522 | 6.4% |
| Physical & Health Sciences | 186 | 2.3% |
| Psychology | 420 | 5.1% |
| Social Sciences | 316 | 3.9% |
| Engineering | 472 | 5.8% |
| Multidisciplinary Studies | 49 | 0.6% |
| Science & Technology | 840 | 10.3% |
| Business | 2,069 | 25.3% |
| Education | 1,275 | 15.6% |
| Literature & Languages | 291 | 3.5% |
| Liberal Arts & History | 365 | 4.5% |
| Visual & Performing Arts | 233 | 2.9% |
| Communications | 370 | 4.5% |
| Arts & Humanities | 473 | 5.8% |
| Total | 8,188 | 100.0% |
Transportation & Commute in Newark
Vehicle Availability by Sex in Newark
The most prevalent vehicle ownership categories in Newark are males with 2 vehicles (4,604, accounting for 40.3%) and females with 2 vehicles (4,411, making up 41.3%).
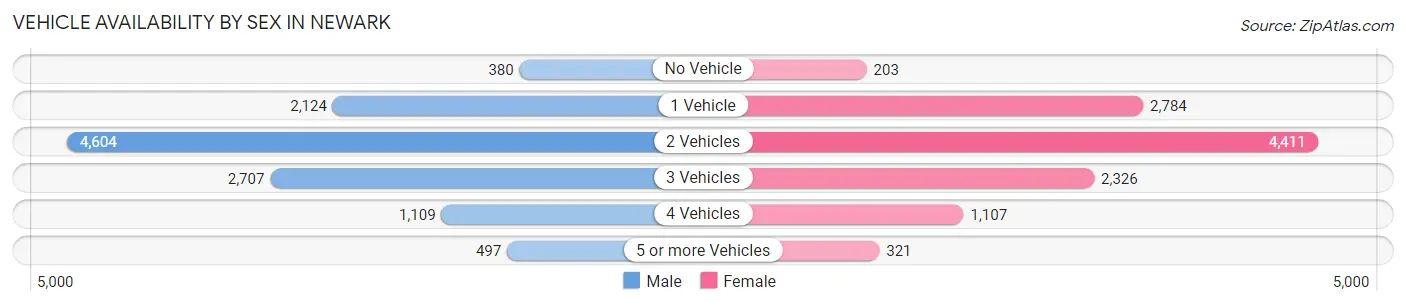
| Vehicles Available | Male | Female |
| No Vehicle | 380 (3.3%) | 203 (1.8%) |
| 1 Vehicle | 2,124 (18.6%) | 2,784 (25.0%) |
| 2 Vehicles | 4,604 (40.3%) | 4,411 (39.6%) |
| 3 Vehicles | 2,707 (23.7%) | 2,326 (20.9%) |
| 4 Vehicles | 1,109 (9.7%) | 1,107 (9.9%) |
| 5 or more Vehicles | 497 (4.3%) | 321 (2.9%) |
| Total | 11,421 (100.0%) | 11,152 (100.0%) |
Commute Time in Newark
The most frequently occuring commute durations in Newark are 10 to 14 minutes (4,777 commuters, 23.1%), 15 to 19 minutes (3,010 commuters, 14.5%), and 5 to 9 minutes (2,996 commuters, 14.5%).
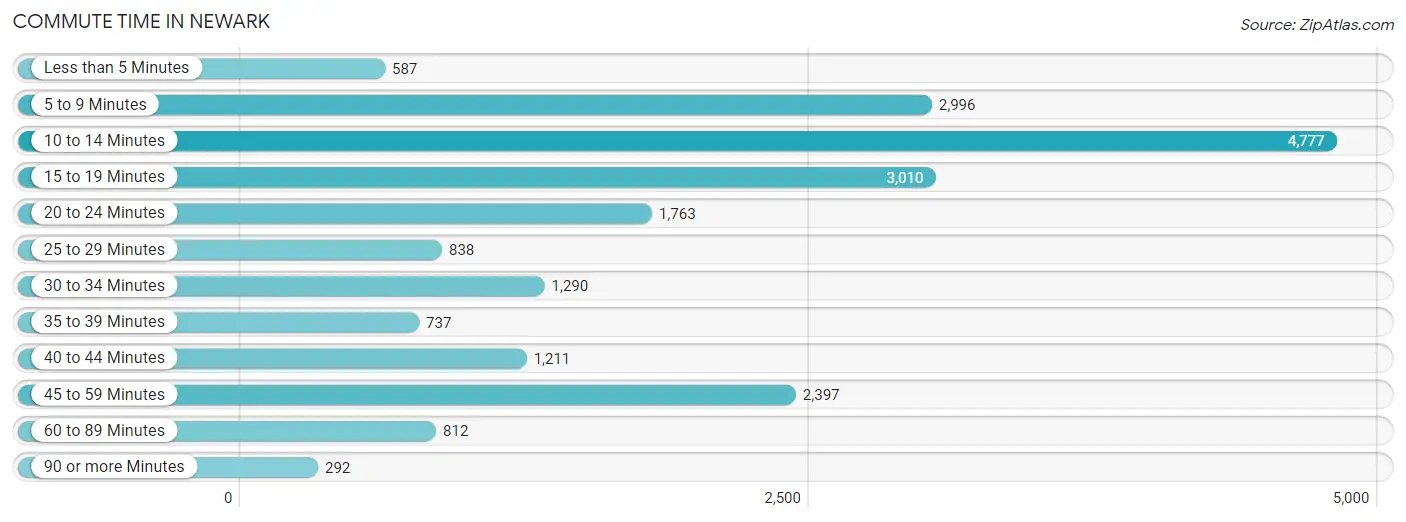
| Commute Time | # Commuters | % Commuters |
| Less than 5 Minutes | 587 | 2.8% |
| 5 to 9 Minutes | 2,996 | 14.5% |
| 10 to 14 Minutes | 4,777 | 23.1% |
| 15 to 19 Minutes | 3,010 | 14.5% |
| 20 to 24 Minutes | 1,763 | 8.5% |
| 25 to 29 Minutes | 838 | 4.1% |
| 30 to 34 Minutes | 1,290 | 6.2% |
| 35 to 39 Minutes | 737 | 3.6% |
| 40 to 44 Minutes | 1,211 | 5.9% |
| 45 to 59 Minutes | 2,397 | 11.6% |
| 60 to 89 Minutes | 812 | 3.9% |
| 90 or more Minutes | 292 | 1.4% |
Commute Time by Sex in Newark
The most common commute times in Newark are 10 to 14 minutes (1,777 commuters, 16.7%) for males and 10 to 14 minutes (3,000 commuters, 29.7%) for females.
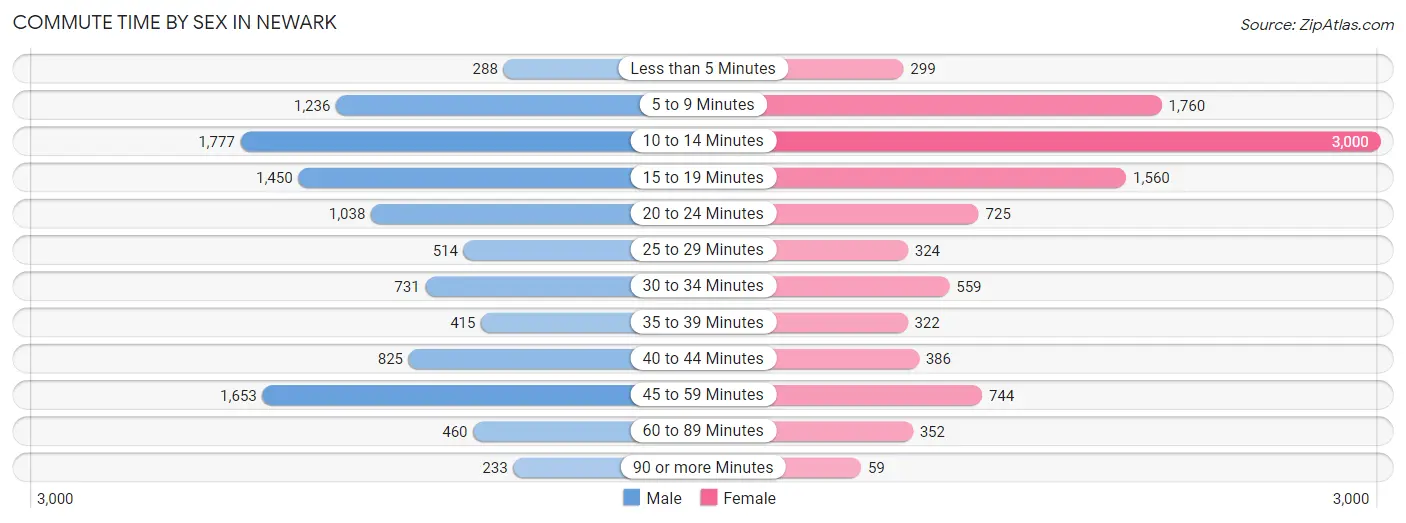
| Commute Time | Male | Female |
| Less than 5 Minutes | 288 (2.7%) | 299 (3.0%) |
| 5 to 9 Minutes | 1,236 (11.6%) | 1,760 (17.4%) |
| 10 to 14 Minutes | 1,777 (16.7%) | 3,000 (29.7%) |
| 15 to 19 Minutes | 1,450 (13.7%) | 1,560 (15.5%) |
| 20 to 24 Minutes | 1,038 (9.8%) | 725 (7.2%) |
| 25 to 29 Minutes | 514 (4.8%) | 324 (3.2%) |
| 30 to 34 Minutes | 731 (6.9%) | 559 (5.5%) |
| 35 to 39 Minutes | 415 (3.9%) | 322 (3.2%) |
| 40 to 44 Minutes | 825 (7.8%) | 386 (3.8%) |
| 45 to 59 Minutes | 1,653 (15.6%) | 744 (7.4%) |
| 60 to 89 Minutes | 460 (4.3%) | 352 (3.5%) |
| 90 or more Minutes | 233 (2.2%) | 59 (0.6%) |
Time of Departure to Work by Sex in Newark
The most frequent times of departure to work in Newark are 4:00 PM to 11:59 PM (1,240, 11.7%) for males and 7:00 AM to 7:29 AM (1,203, 11.9%) for females.
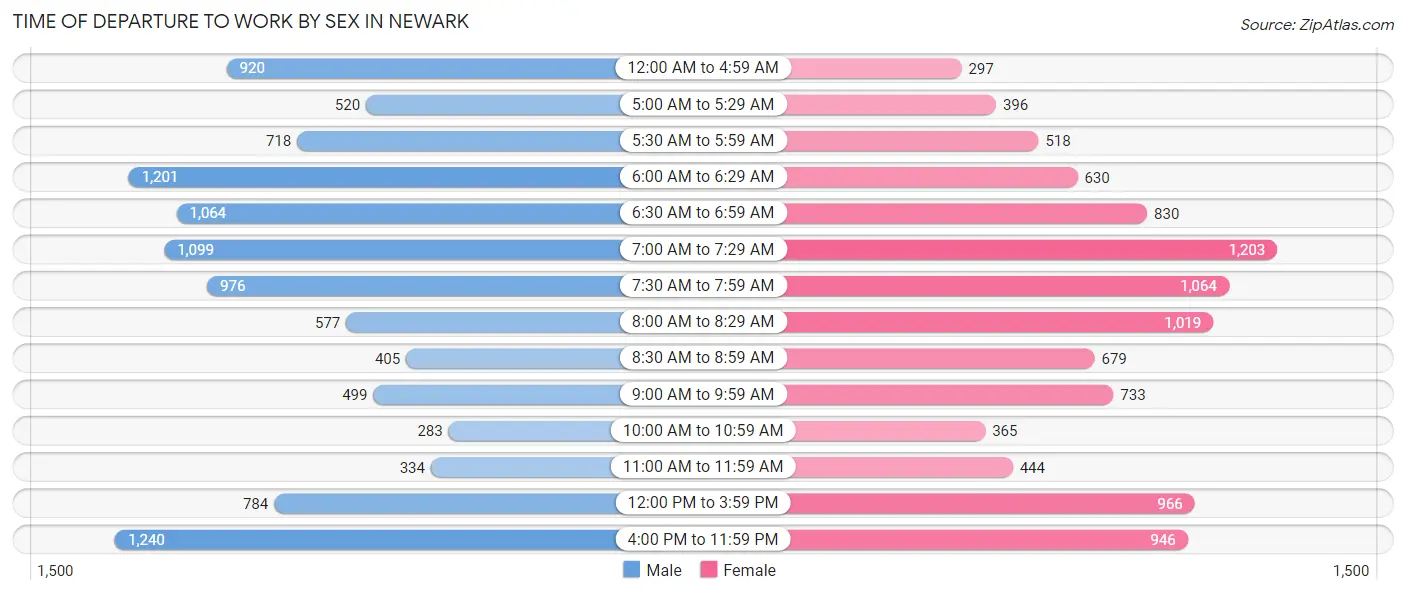
| Time of Departure | Male | Female |
| 12:00 AM to 4:59 AM | 920 (8.7%) | 297 (2.9%) |
| 5:00 AM to 5:29 AM | 520 (4.9%) | 396 (3.9%) |
| 5:30 AM to 5:59 AM | 718 (6.8%) | 518 (5.1%) |
| 6:00 AM to 6:29 AM | 1,201 (11.3%) | 630 (6.2%) |
| 6:30 AM to 6:59 AM | 1,064 (10.0%) | 830 (8.2%) |
| 7:00 AM to 7:29 AM | 1,099 (10.3%) | 1,203 (11.9%) |
| 7:30 AM to 7:59 AM | 976 (9.2%) | 1,064 (10.5%) |
| 8:00 AM to 8:29 AM | 577 (5.4%) | 1,019 (10.1%) |
| 8:30 AM to 8:59 AM | 405 (3.8%) | 679 (6.7%) |
| 9:00 AM to 9:59 AM | 499 (4.7%) | 733 (7.3%) |
| 10:00 AM to 10:59 AM | 283 (2.7%) | 365 (3.6%) |
| 11:00 AM to 11:59 AM | 334 (3.2%) | 444 (4.4%) |
| 12:00 PM to 3:59 PM | 784 (7.4%) | 966 (9.6%) |
| 4:00 PM to 11:59 PM | 1,240 (11.7%) | 946 (9.4%) |
| Total | 10,620 (100.0%) | 10,090 (100.0%) |
Housing Occupancy in Newark
Occupancy by Ownership in Newark
Of the total 20,206 dwellings in Newark, owner-occupied units account for 11,048 (54.7%), while renter-occupied units make up 9,158 (45.3%).
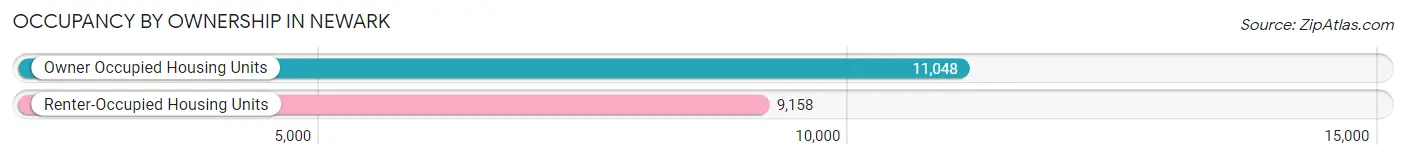
| Occupancy | # Housing Units | % Housing Units |
| Owner Occupied Housing Units | 11,048 | 54.7% |
| Renter-Occupied Housing Units | 9,158 | 45.3% |
| Total Occupied Housing Units | 20,206 | 100.0% |
Occupancy by Household Size in Newark
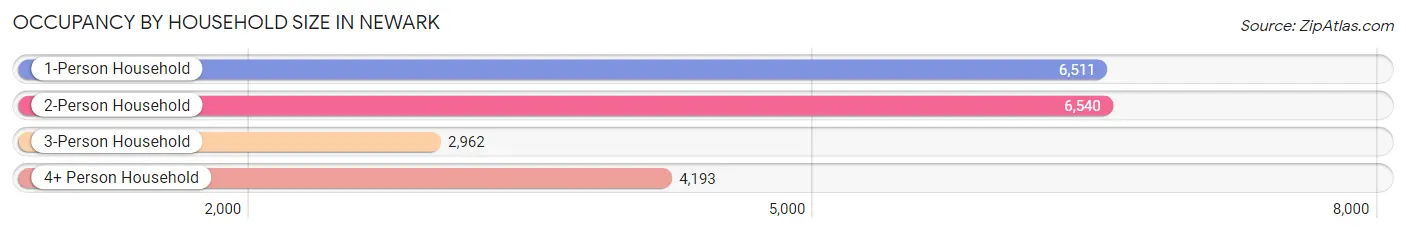
| Household Size | # Housing Units | % Housing Units |
| 1-Person Household | 6,511 | 32.2% |
| 2-Person Household | 6,540 | 32.4% |
| 3-Person Household | 2,962 | 14.7% |
| 4+ Person Household | 4,193 | 20.7% |
| Total Housing Units | 20,206 | 100.0% |
Occupancy by Ownership by Household Size in Newark
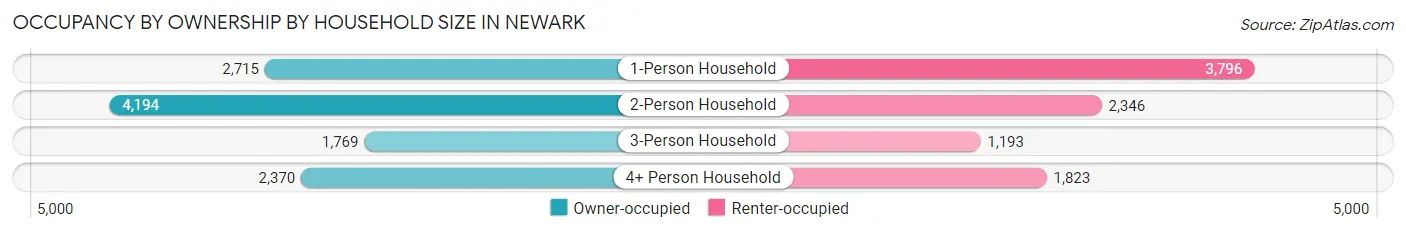
| Household Size | Owner-occupied | Renter-occupied |
| 1-Person Household | 2,715 (41.7%) | 3,796 (58.3%) |
| 2-Person Household | 4,194 (64.1%) | 2,346 (35.9%) |
| 3-Person Household | 1,769 (59.7%) | 1,193 (40.3%) |
| 4+ Person Household | 2,370 (56.5%) | 1,823 (43.5%) |
| Total Housing Units | 11,048 (54.7%) | 9,158 (45.3%) |
Occupancy by Educational Attainment in Newark
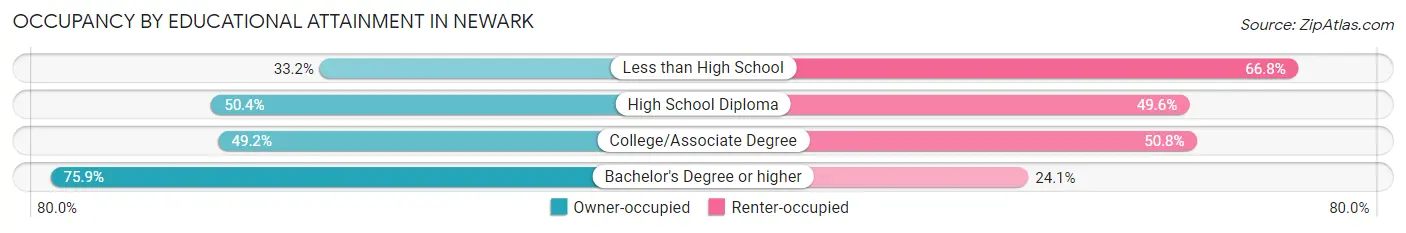
| Household Size | Owner-occupied | Renter-occupied |
| Less than High School | 517 (33.2%) | 1,041 (66.8%) |
| High School Diploma | 3,507 (50.4%) | 3,454 (49.6%) |
| College/Associate Degree | 3,403 (49.2%) | 3,511 (50.8%) |
| Bachelor's Degree or higher | 3,621 (75.9%) | 1,152 (24.1%) |
Occupancy by Age of Householder in Newark
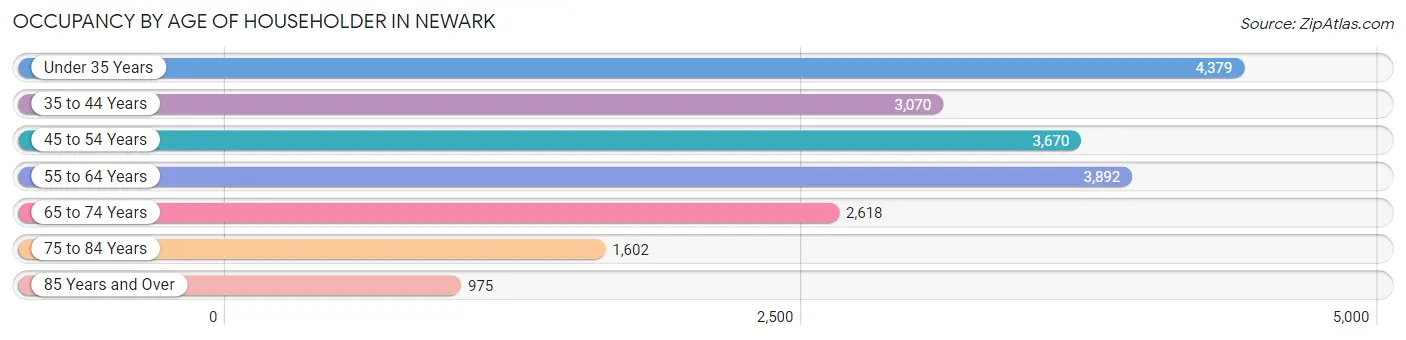
| Age Bracket | # Households | % Households |
| Under 35 Years | 4,379 | 21.7% |
| 35 to 44 Years | 3,070 | 15.2% |
| 45 to 54 Years | 3,670 | 18.2% |
| 55 to 64 Years | 3,892 | 19.3% |
| 65 to 74 Years | 2,618 | 13.0% |
| 75 to 84 Years | 1,602 | 7.9% |
| 85 Years and Over | 975 | 4.8% |
| Total | 20,206 | 100.0% |
Housing Finances in Newark
Median Income by Occupancy in Newark
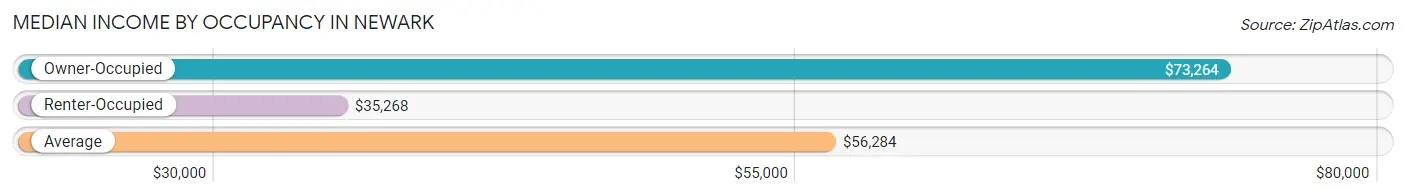
| Occupancy Type | # Households | Median Income |
| Owner-Occupied | 11,048 (54.7%) | $73,264 |
| Renter-Occupied | 9,158 (45.3%) | $35,268 |
| Average | 20,206 (100.0%) | $56,284 |
Occupancy by Householder Income Bracket in Newark
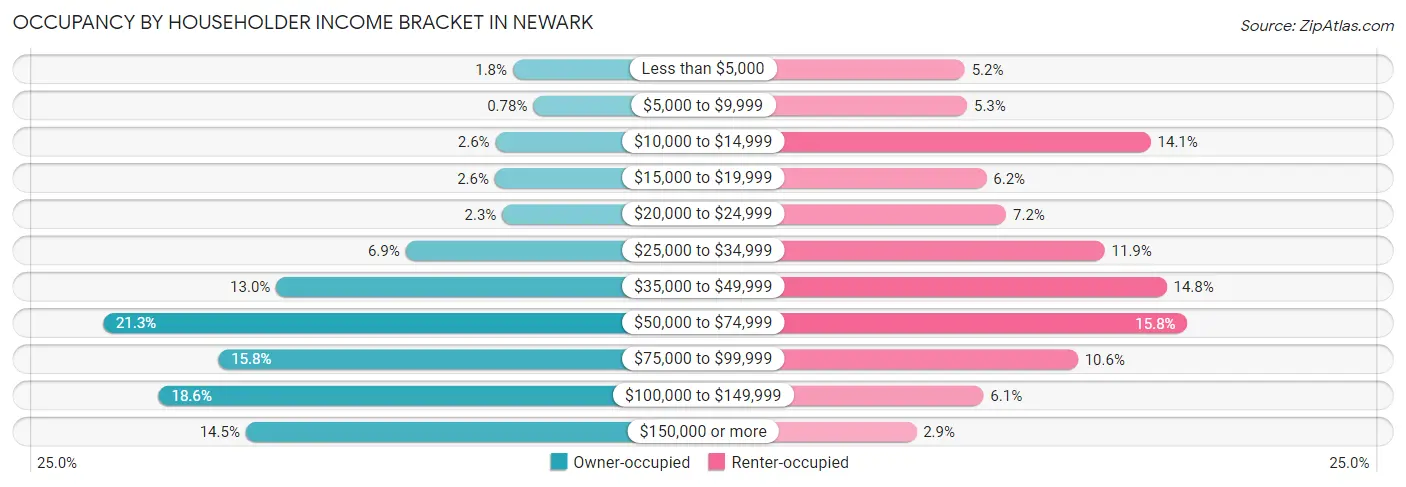
| Income Bracket | Owner-occupied | Renter-occupied |
| Less than $5,000 | 193 (1.8%) | 476 (5.2%) |
| $5,000 to $9,999 | 86 (0.8%) | 486 (5.3%) |
| $10,000 to $14,999 | 285 (2.6%) | 1,287 (14.1%) |
| $15,000 to $19,999 | 288 (2.6%) | 571 (6.2%) |
| $20,000 to $24,999 | 250 (2.3%) | 657 (7.2%) |
| $25,000 to $34,999 | 758 (6.9%) | 1,086 (11.9%) |
| $35,000 to $49,999 | 1,439 (13.0%) | 1,356 (14.8%) |
| $50,000 to $74,999 | 2,350 (21.3%) | 1,447 (15.8%) |
| $75,000 to $99,999 | 1,743 (15.8%) | 969 (10.6%) |
| $100,000 to $149,999 | 2,057 (18.6%) | 558 (6.1%) |
| $150,000 or more | 1,599 (14.5%) | 265 (2.9%) |
| Total | 11,048 (100.0%) | 9,158 (100.0%) |
Monthly Housing Cost Tiers in Newark
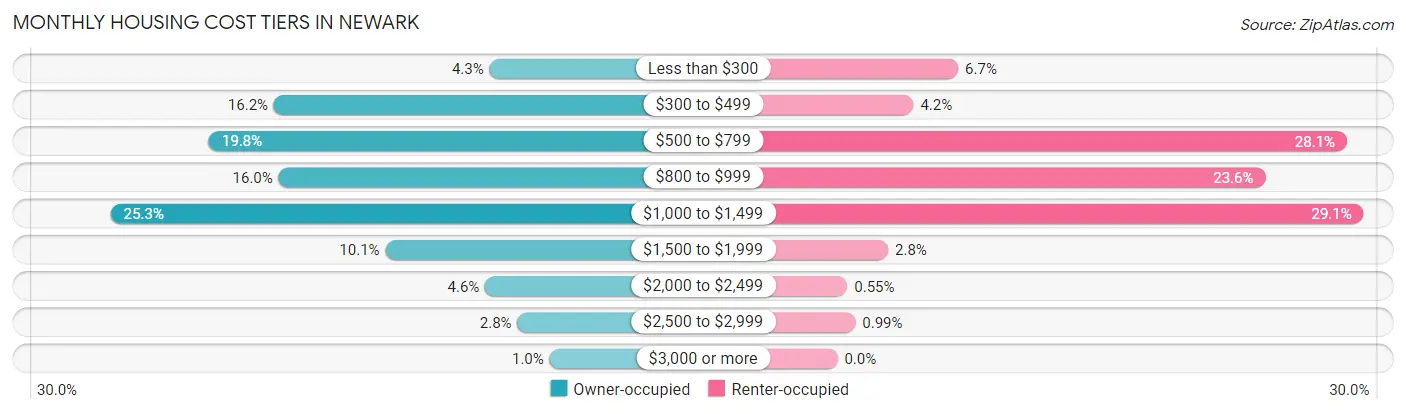
| Monthly Cost | Owner-occupied | Renter-occupied |
| Less than $300 | 477 (4.3%) | 611 (6.7%) |
| $300 to $499 | 1,793 (16.2%) | 385 (4.2%) |
| $500 to $799 | 2,190 (19.8%) | 2,577 (28.1%) |
| $800 to $999 | 1,764 (16.0%) | 2,164 (23.6%) |
| $1,000 to $1,499 | 2,790 (25.3%) | 2,661 (29.1%) |
| $1,500 to $1,999 | 1,112 (10.1%) | 256 (2.8%) |
| $2,000 to $2,499 | 504 (4.6%) | 50 (0.5%) |
| $2,500 to $2,999 | 307 (2.8%) | 91 (1.0%) |
| $3,000 or more | 111 (1.0%) | 0 (0.0%) |
| Total | 11,048 (100.0%) | 9,158 (100.0%) |
Physical Housing Characteristics in Newark
Housing Structures in Newark
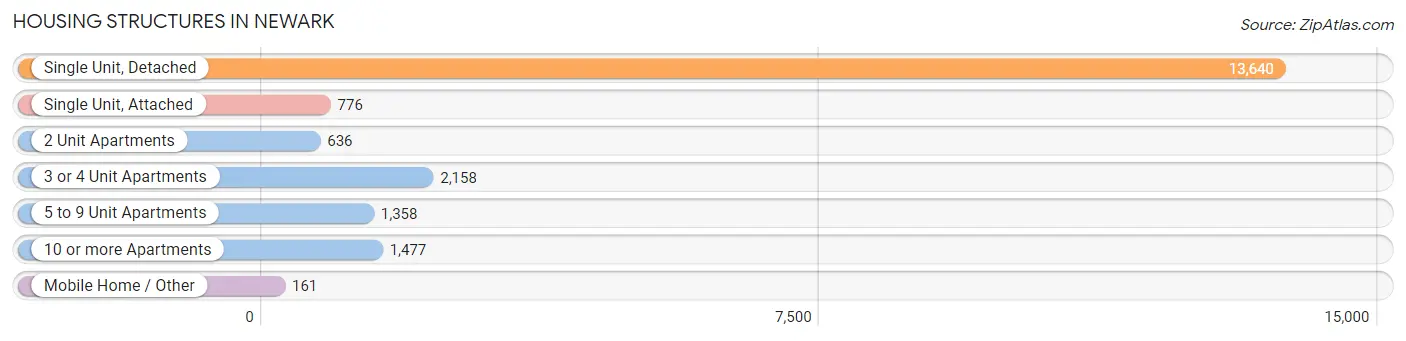
| Structure Type | # Housing Units | % Housing Units |
| Single Unit, Detached | 13,640 | 67.5% |
| Single Unit, Attached | 776 | 3.8% |
| 2 Unit Apartments | 636 | 3.2% |
| 3 or 4 Unit Apartments | 2,158 | 10.7% |
| 5 to 9 Unit Apartments | 1,358 | 6.7% |
| 10 or more Apartments | 1,477 | 7.3% |
| Mobile Home / Other | 161 | 0.8% |
| Total | 20,206 | 100.0% |
Housing Structures by Occupancy in Newark
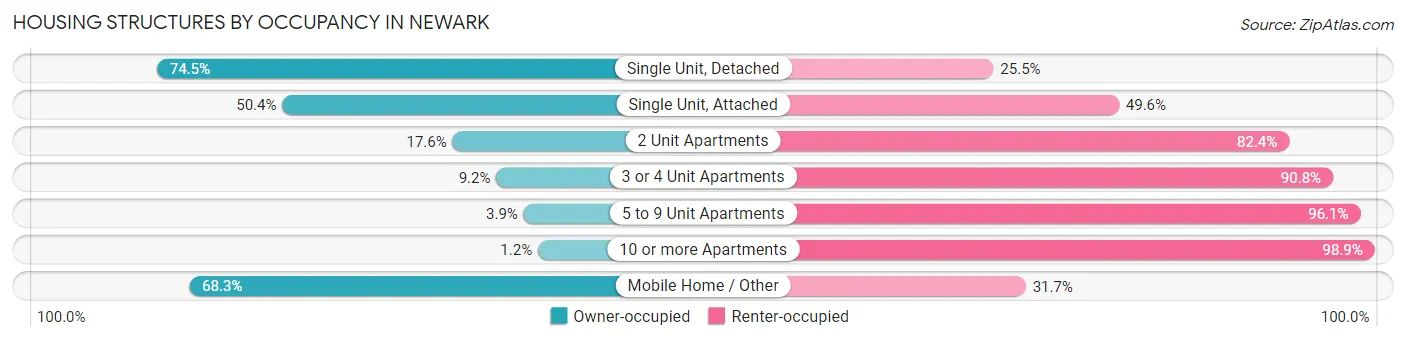
| Structure Type | Owner-occupied | Renter-occupied |
| Single Unit, Detached | 10,167 (74.5%) | 3,473 (25.5%) |
| Single Unit, Attached | 391 (50.4%) | 385 (49.6%) |
| 2 Unit Apartments | 112 (17.6%) | 524 (82.4%) |
| 3 or 4 Unit Apartments | 198 (9.2%) | 1,960 (90.8%) |
| 5 to 9 Unit Apartments | 53 (3.9%) | 1,305 (96.1%) |
| 10 or more Apartments | 17 (1.1%) | 1,460 (98.9%) |
| Mobile Home / Other | 110 (68.3%) | 51 (31.7%) |
| Total | 11,048 (54.7%) | 9,158 (45.3%) |
Housing Structures by Number of Rooms in Newark
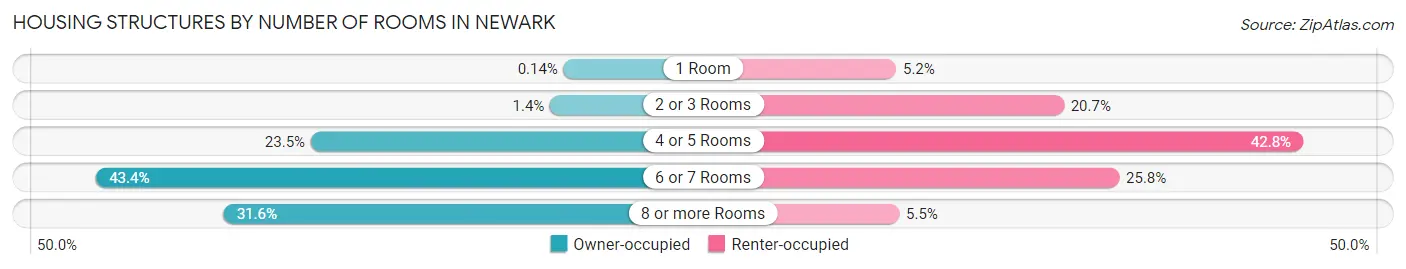
| Number of Rooms | Owner-occupied | Renter-occupied |
| 1 Room | 15 (0.1%) | 475 (5.2%) |
| 2 or 3 Rooms | 154 (1.4%) | 1,896 (20.7%) |
| 4 or 5 Rooms | 2,599 (23.5%) | 3,921 (42.8%) |
| 6 or 7 Rooms | 4,791 (43.4%) | 2,365 (25.8%) |
| 8 or more Rooms | 3,489 (31.6%) | 501 (5.5%) |
| Total | 11,048 (100.0%) | 9,158 (100.0%) |
Housing Structure by Heating Type in Newark
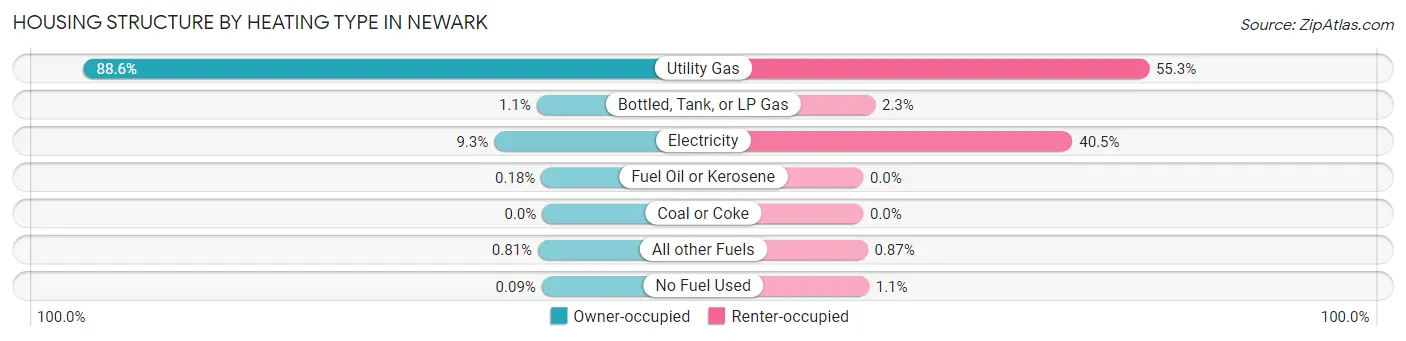
| Heating Type | Owner-occupied | Renter-occupied |
| Utility Gas | 9,786 (88.6%) | 5,060 (55.2%) |
| Bottled, Tank, or LP Gas | 117 (1.1%) | 212 (2.3%) |
| Electricity | 1,026 (9.3%) | 3,704 (40.5%) |
| Fuel Oil or Kerosene | 20 (0.2%) | 0 (0.0%) |
| Coal or Coke | 0 (0.0%) | 0 (0.0%) |
| All other Fuels | 89 (0.8%) | 80 (0.9%) |
| No Fuel Used | 10 (0.1%) | 102 (1.1%) |
| Total | 11,048 (100.0%) | 9,158 (100.0%) |
Household Vehicle Usage in Newark
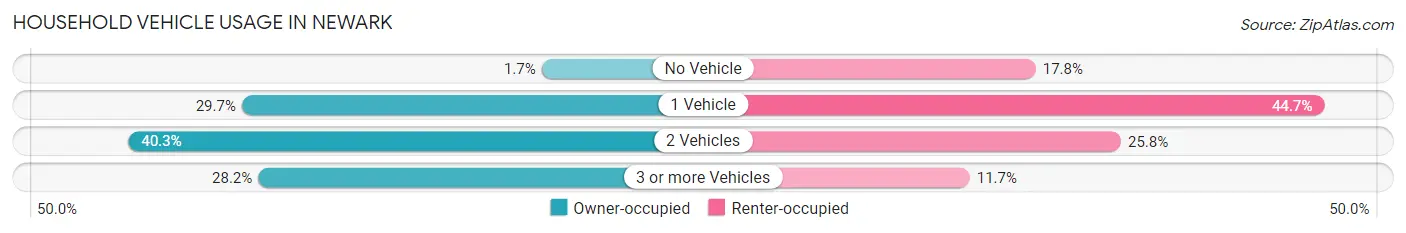
| Vehicles per Household | Owner-occupied | Renter-occupied |
| No Vehicle | 192 (1.7%) | 1,632 (17.8%) |
| 1 Vehicle | 3,285 (29.7%) | 4,097 (44.7%) |
| 2 Vehicles | 4,455 (40.3%) | 2,361 (25.8%) |
| 3 or more Vehicles | 3,116 (28.2%) | 1,068 (11.7%) |
| Total | 11,048 (100.0%) | 9,158 (100.0%) |
Real Estate & Mortgages in Newark
Real Estate and Mortgage Overview in Newark
| Characteristic | Without Mortgage | With Mortgage |
| Housing Units | 4,046 | 7,002 |
| Median Property Value | $156,000 | $165,100 |
| Median Household Income | $57,171 | $1,258 |
| Monthly Housing Costs | $482 | $103 |
| Real Estate Taxes | $1,728 | $148 |
Property Value by Mortgage Status in Newark
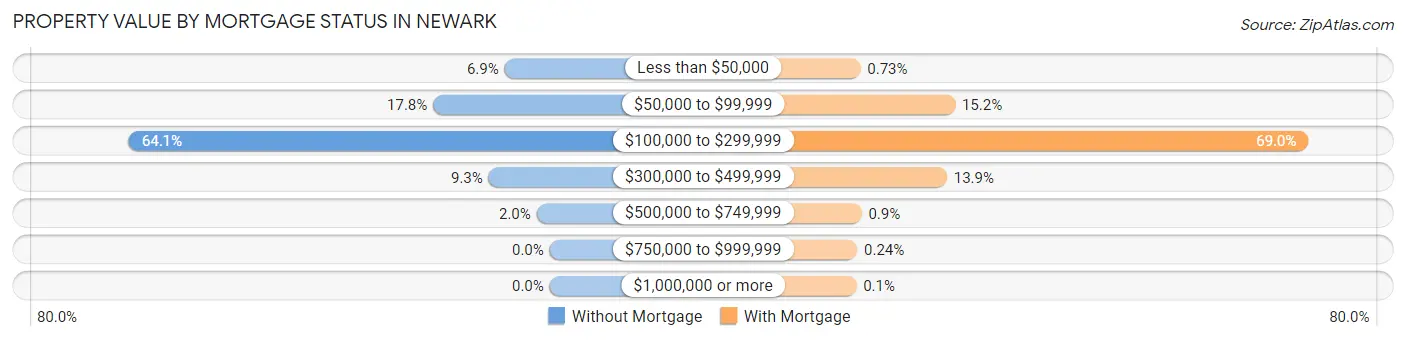
| Property Value | Without Mortgage | With Mortgage |
| Less than $50,000 | 278 (6.9%) | 51 (0.7%) |
| $50,000 to $99,999 | 718 (17.7%) | 1,061 (15.1%) |
| $100,000 to $299,999 | 2,594 (64.1%) | 4,830 (69.0%) |
| $300,000 to $499,999 | 376 (9.3%) | 973 (13.9%) |
| $500,000 to $749,999 | 80 (2.0%) | 63 (0.9%) |
| $750,000 to $999,999 | 0 (0.0%) | 17 (0.2%) |
| $1,000,000 or more | 0 (0.0%) | 7 (0.1%) |
| Total | 4,046 (100.0%) | 7,002 (100.0%) |
Household Income by Mortgage Status in Newark
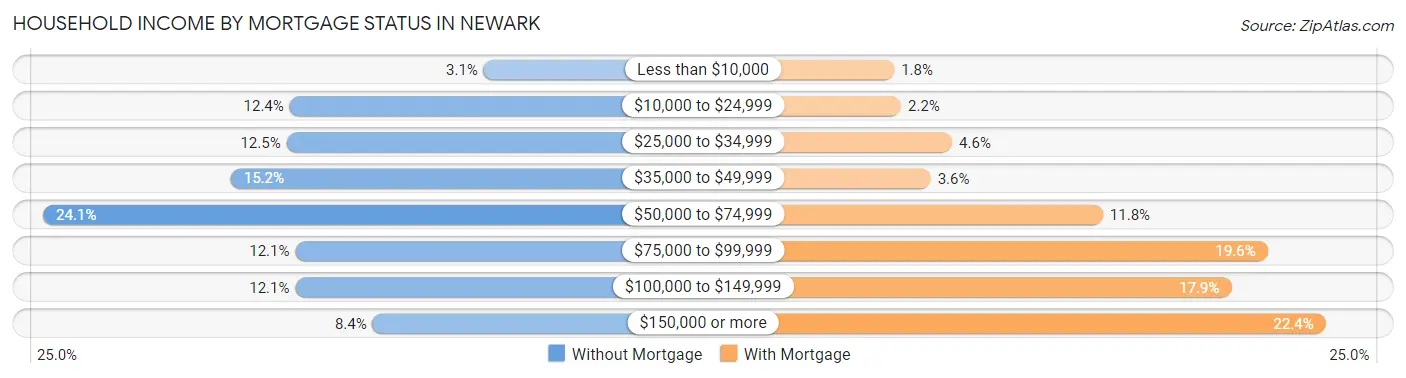
| Household Income | Without Mortgage | With Mortgage |
| Less than $10,000 | 127 (3.1%) | 129 (1.8%) |
| $10,000 to $24,999 | 501 (12.4%) | 152 (2.2%) |
| $25,000 to $34,999 | 507 (12.5%) | 322 (4.6%) |
| $35,000 to $49,999 | 614 (15.2%) | 251 (3.6%) |
| $50,000 to $74,999 | 976 (24.1%) | 825 (11.8%) |
| $75,000 to $99,999 | 490 (12.1%) | 1,374 (19.6%) |
| $100,000 to $149,999 | 490 (12.1%) | 1,253 (17.9%) |
| $150,000 or more | 341 (8.4%) | 1,567 (22.4%) |
| Total | 4,046 (100.0%) | 7,002 (100.0%) |
Property Value to Household Income Ratio in Newark
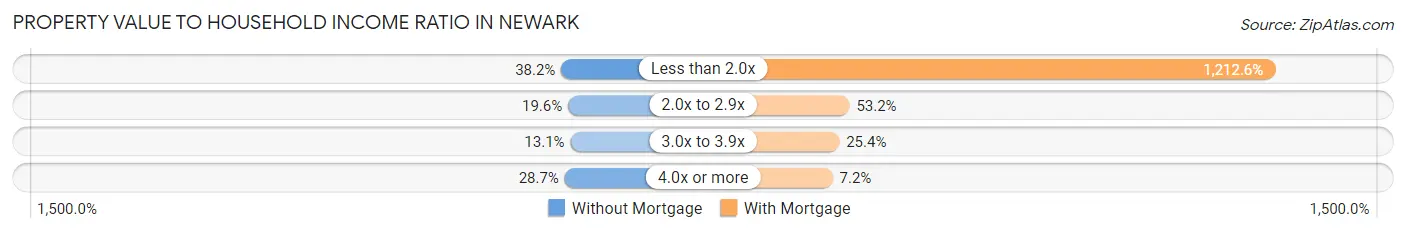
| Value-to-Income Ratio | Without Mortgage | With Mortgage |
| Less than 2.0x | 1,547 (38.2%) | 84,909 (1,212.6%) |
| 2.0x to 2.9x | 793 (19.6%) | 3,727 (53.2%) |
| 3.0x to 3.9x | 531 (13.1%) | 1,778 (25.4%) |
| 4.0x or more | 1,160 (28.7%) | 507 (7.2%) |
| Total | 4,046 (100.0%) | 7,002 (100.0%) |
Real Estate Taxes by Mortgage Status in Newark
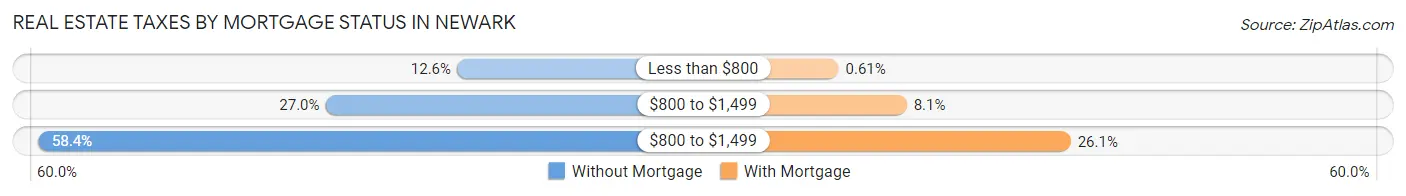
| Property Taxes | Without Mortgage | With Mortgage |
| Less than $800 | 511 (12.6%) | 43 (0.6%) |
| $800 to $1,499 | 1,094 (27.0%) | 565 (8.1%) |
| $800 to $1,499 | 2,364 (58.4%) | 1,824 (26.1%) |
| Total | 4,046 (100.0%) | 7,002 (100.0%) |
Health & Disability in Newark
Health Insurance Coverage by Age in Newark
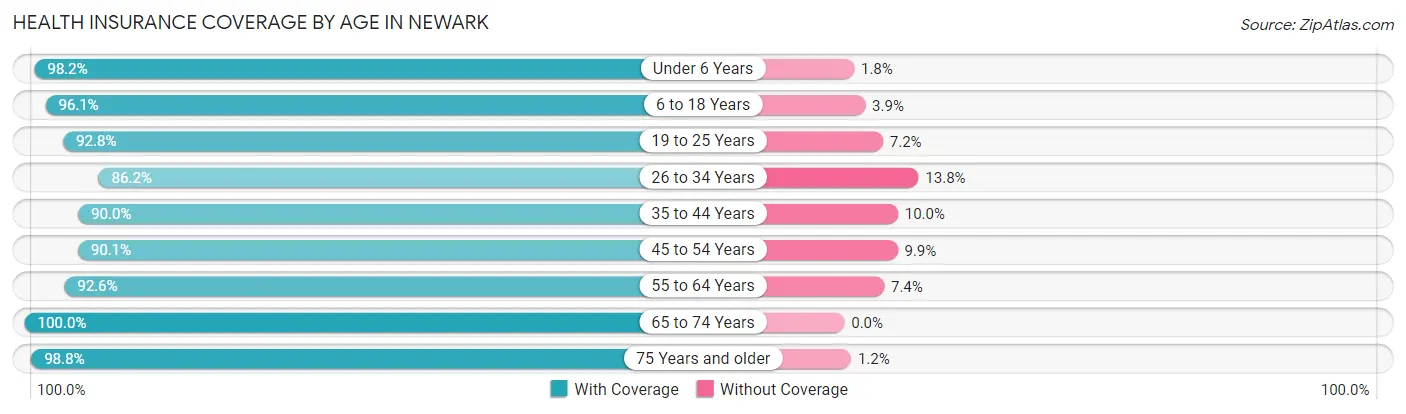
| Age Bracket | With Coverage | Without Coverage |
| Under 6 Years | 3,510 (98.2%) | 65 (1.8%) |
| 6 to 18 Years | 7,923 (96.1%) | 321 (3.9%) |
| 19 to 25 Years | 4,969 (92.8%) | 385 (7.2%) |
| 26 to 34 Years | 4,858 (86.2%) | 779 (13.8%) |
| 35 to 44 Years | 5,438 (90.0%) | 602 (10.0%) |
| 45 to 54 Years | 5,536 (90.1%) | 610 (9.9%) |
| 55 to 64 Years | 5,819 (92.6%) | 466 (7.4%) |
| 65 to 74 Years | 4,463 (100.0%) | 0 (0.0%) |
| 75 Years and older | 3,505 (98.8%) | 44 (1.2%) |
| Total | 46,021 (93.4%) | 3,272 (6.6%) |
Health Insurance Coverage by Citizenship Status in Newark
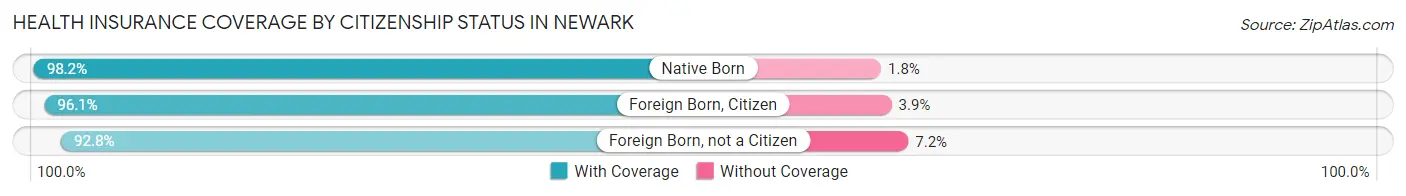
| Citizenship Status | With Coverage | Without Coverage |
| Native Born | 3,510 (98.2%) | 65 (1.8%) |
| Foreign Born, Citizen | 7,923 (96.1%) | 321 (3.9%) |
| Foreign Born, not a Citizen | 4,969 (92.8%) | 385 (7.2%) |
Health Insurance Coverage by Household Income in Newark
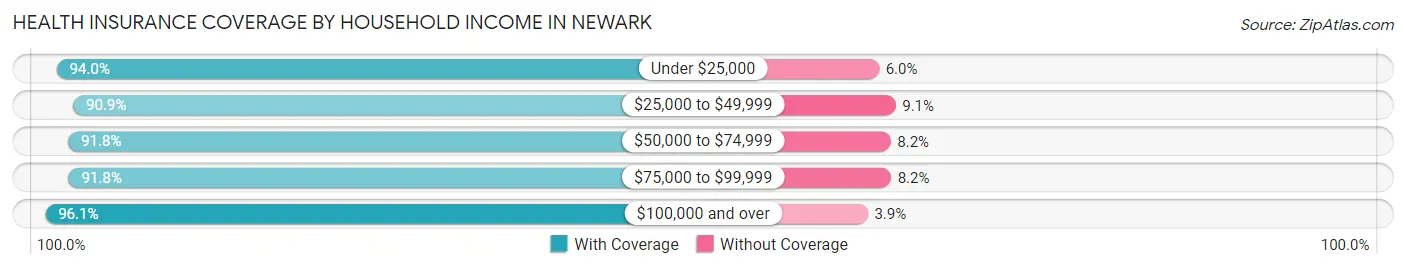
| Household Income | With Coverage | Without Coverage |
| Under $25,000 | 7,040 (94.0%) | 448 (6.0%) |
| $25,000 to $49,999 | 8,727 (90.9%) | 872 (9.1%) |
| $50,000 to $74,999 | 8,498 (91.8%) | 755 (8.2%) |
| $75,000 to $99,999 | 6,545 (91.8%) | 587 (8.2%) |
| $100,000 and over | 14,837 (96.1%) | 597 (3.9%) |
Public vs Private Health Insurance Coverage by Age in Newark
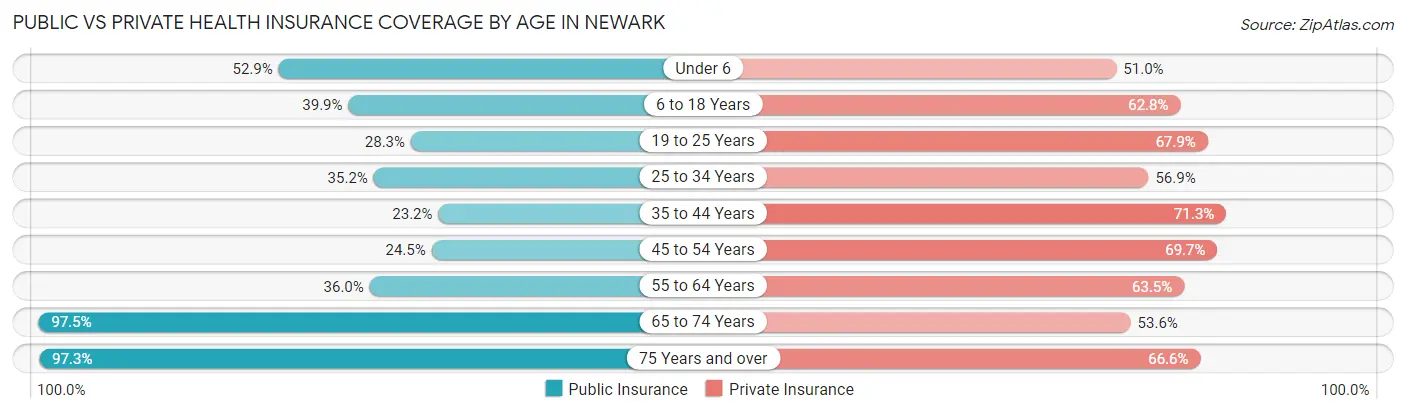
| Age Bracket | Public Insurance | Private Insurance |
| Under 6 | 1,890 (52.9%) | 1,822 (51.0%) |
| 6 to 18 Years | 3,289 (39.9%) | 5,179 (62.8%) |
| 19 to 25 Years | 1,515 (28.3%) | 3,636 (67.9%) |
| 25 to 34 Years | 1,985 (35.2%) | 3,209 (56.9%) |
| 35 to 44 Years | 1,401 (23.2%) | 4,309 (71.3%) |
| 45 to 54 Years | 1,504 (24.5%) | 4,283 (69.7%) |
| 55 to 64 Years | 2,260 (36.0%) | 3,993 (63.5%) |
| 65 to 74 Years | 4,349 (97.5%) | 2,393 (53.6%) |
| 75 Years and over | 3,454 (97.3%) | 2,362 (66.5%) |
| Total | 21,647 (43.9%) | 31,186 (63.3%) |
Disability Status by Sex by Age in Newark
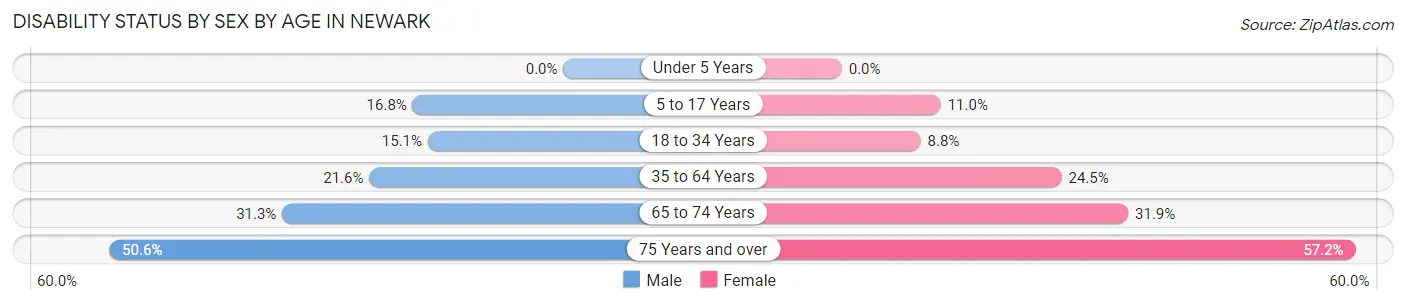
| Age Bracket | Male | Female |
| Under 5 Years | 0 (0.0%) | 0 (0.0%) |
| 5 to 17 Years | 685 (16.8%) | 459 (11.0%) |
| 18 to 34 Years | 897 (15.1%) | 513 (8.8%) |
| 35 to 64 Years | 1,984 (21.6%) | 2,274 (24.5%) |
| 65 to 74 Years | 615 (31.3%) | 797 (31.9%) |
| 75 Years and over | 702 (50.6%) | 1,236 (57.2%) |
Disability Class by Sex by Age in Newark
Disability Class: Hearing Difficulty
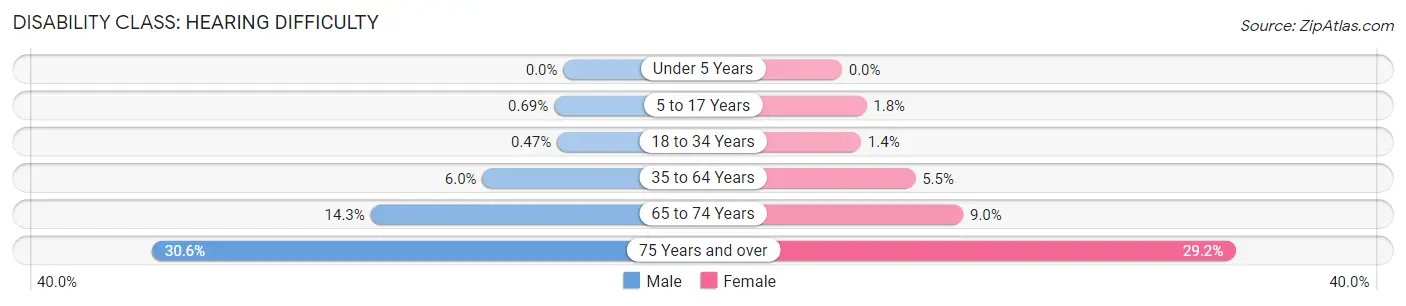
| Age Bracket | Male | Female |
| Under 5 Years | 0 (0.0%) | 0 (0.0%) |
| 5 to 17 Years | 28 (0.7%) | 76 (1.8%) |
| 18 to 34 Years | 28 (0.5%) | 83 (1.4%) |
| 35 to 64 Years | 552 (6.0%) | 506 (5.4%) |
| 65 to 74 Years | 281 (14.3%) | 225 (9.0%) |
| 75 Years and over | 424 (30.5%) | 631 (29.2%) |
Disability Class: Vision Difficulty
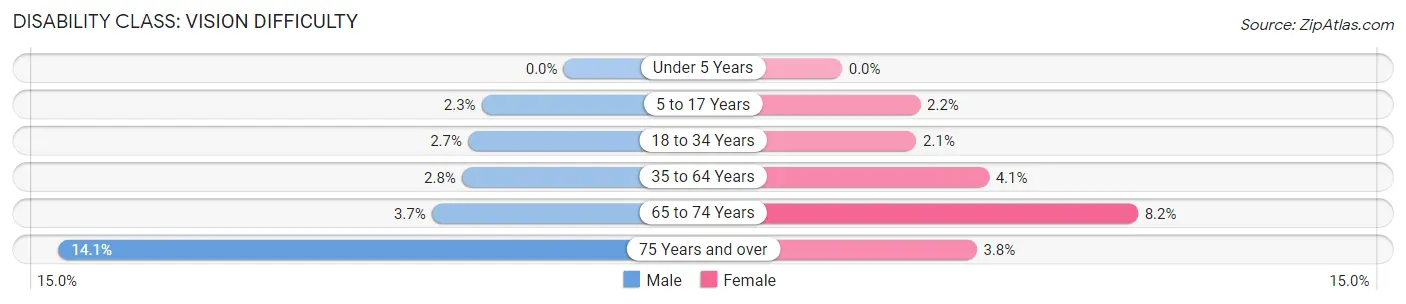
| Age Bracket | Male | Female |
| Under 5 Years | 0 (0.0%) | 0 (0.0%) |
| 5 to 17 Years | 93 (2.3%) | 91 (2.2%) |
| 18 to 34 Years | 158 (2.7%) | 121 (2.1%) |
| 35 to 64 Years | 260 (2.8%) | 380 (4.1%) |
| 65 to 74 Years | 72 (3.7%) | 206 (8.2%) |
| 75 Years and over | 195 (14.1%) | 81 (3.7%) |
Disability Class: Cognitive Difficulty
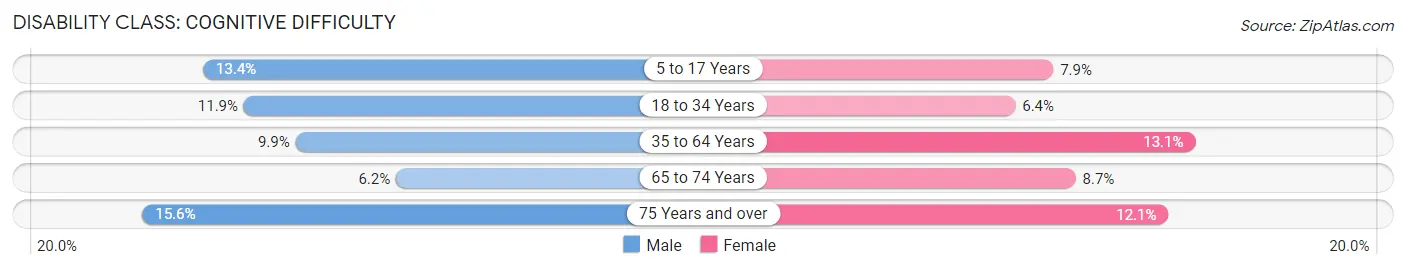
| Age Bracket | Male | Female |
| 5 to 17 Years | 546 (13.4%) | 327 (7.9%) |
| 18 to 34 Years | 705 (11.9%) | 376 (6.4%) |
| 35 to 64 Years | 912 (9.9%) | 1,219 (13.1%) |
| 65 to 74 Years | 122 (6.2%) | 217 (8.7%) |
| 75 Years and over | 217 (15.6%) | 262 (12.1%) |
Disability Class: Ambulatory Difficulty
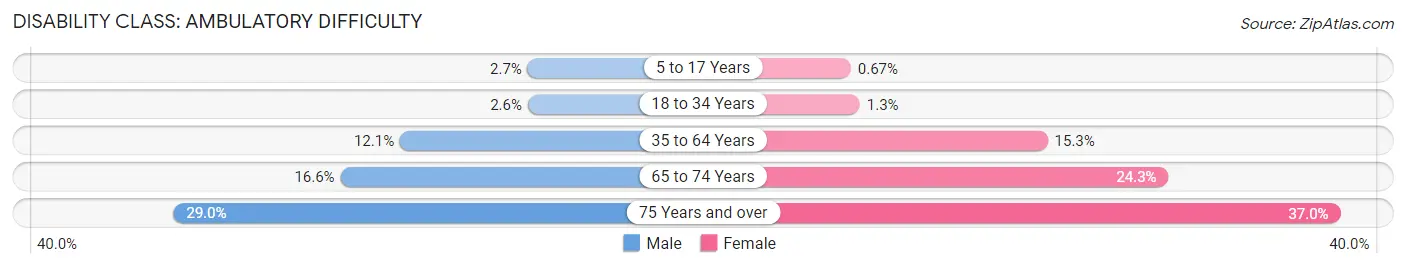
| Age Bracket | Male | Female |
| 5 to 17 Years | 108 (2.6%) | 28 (0.7%) |
| 18 to 34 Years | 157 (2.6%) | 78 (1.3%) |
| 35 to 64 Years | 1,113 (12.1%) | 1,420 (15.3%) |
| 65 to 74 Years | 325 (16.6%) | 606 (24.2%) |
| 75 Years and over | 402 (29.0%) | 800 (37.0%) |
Disability Class: Self-Care Difficulty
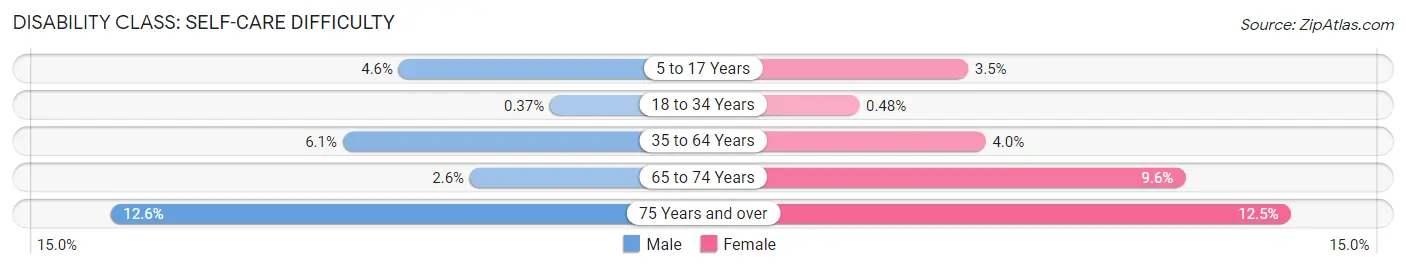
| Age Bracket | Male | Female |
| 5 to 17 Years | 187 (4.6%) | 146 (3.5%) |
| 18 to 34 Years | 22 (0.4%) | 28 (0.5%) |
| 35 to 64 Years | 564 (6.1%) | 372 (4.0%) |
| 65 to 74 Years | 51 (2.6%) | 239 (9.6%) |
| 75 Years and over | 175 (12.6%) | 270 (12.5%) |
Technology Access in Newark
Computing Device Access in Newark
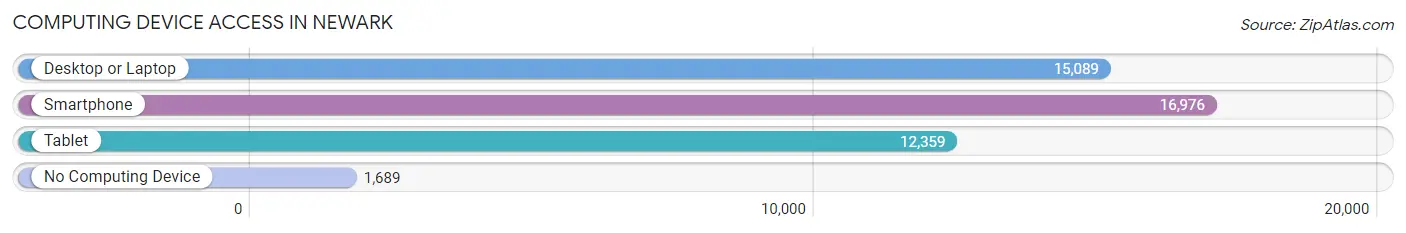
| Device Type | # Households | % Households |
| Desktop or Laptop | 15,089 | 74.7% |
| Smartphone | 16,976 | 84.0% |
| Tablet | 12,359 | 61.2% |
| No Computing Device | 1,689 | 8.4% |
| Total | 20,206 | 100.0% |
Internet Access in Newark
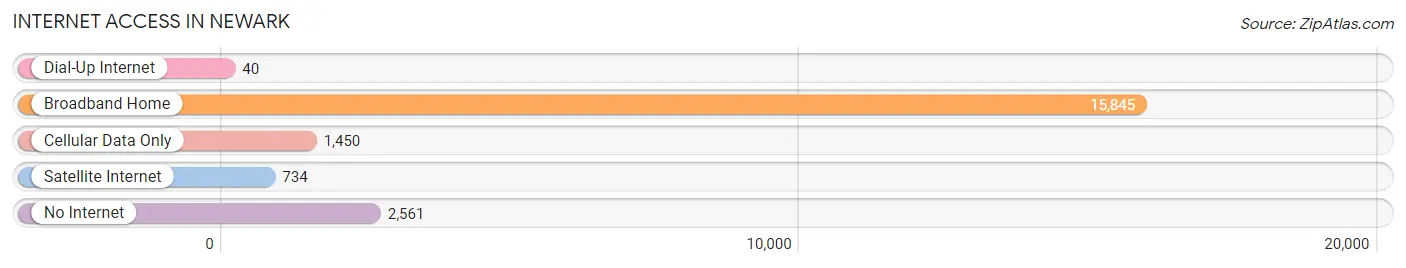
| Internet Type | # Households | % Households |
| Dial-Up Internet | 40 | 0.2% |
| Broadband Home | 15,845 | 78.4% |
| Cellular Data Only | 1,450 | 7.2% |
| Satellite Internet | 734 | 3.6% |
| No Internet | 2,561 | 12.7% |
| Total | 20,206 | 100.0% |
Newark Summary
Newark, Ohio is a city located in Licking County, Ohio, United States. It is located about 40 miles east of Columbus, the state capital. The city is the county seat of Licking County and is the largest city in the county. As of the 2010 census, the population of Newark was 47,573, making it the 20th largest city in Ohio.
History
The area that is now Newark was first settled in 1802 by John and Abigail Hosack. The Hosacks named the settlement after their hometown of Newark, New Jersey. The city was officially incorporated in 1833 and was named the county seat of Licking County in 1824.
In the mid-1800s, Newark was a major stop on the Underground Railroad, with many of the city's churches and homes providing shelter to runaway slaves. During the Civil War, Newark was a major center of Union activity, with many of the city's residents enlisting in the Union Army.
In the late 1800s, Newark became a major industrial center, with the city's economy being driven by the manufacturing of glass, pottery, and other products. The city also became a major transportation hub, with the Ohio and Erie Canal, the Baltimore and Ohio Railroad, and the Pennsylvania Railroad all running through the city.
Geography
Newark is located in central Ohio, about 40 miles east of Columbus. The city is situated in the Licking Valley, a region of rolling hills and valleys. The city is located on the Licking River, which flows through the city and is a major source of water for the city.
The city has a total area of 16.3 square miles, of which 16.2 square miles is land and 0.1 square miles is water. The city is located in the humid continental climate zone, with hot, humid summers and cold, snowy winters.
Economy
Newark's economy is largely driven by the manufacturing sector. The city is home to several major employers, including Owens Corning, AEP Ohio, and Denison University. The city is also home to several smaller businesses, including several restaurants, retail stores, and professional services.
The city is also home to several major healthcare providers, including Licking Memorial Hospital and the Ohio State University Wexner Medical Center.
Demographics
As of the 2010 census, the population of Newark was 47,573. The city has a population density of 2,919 people per square mile. The racial makeup of the city is 87.3% White, 8.2% African American, 0.5% Native American, 1.2% Asian, 0.1% Pacific Islander, 0.7% from other races, and 2.1% from two or more races. Hispanic or Latino of any race were 2.7% of the population.
The median income for a household in the city was $41,945, and the median income for a family was $51,945. The per capita income for the city was $21,845. About 11.3% of families and 14.2% of the population were below the poverty line, including 19.2% of those under age 18 and 8.2% of those age 65 or over.
Common Questions
What is Per Capita Income in Newark?
Per Capita income in Newark is $30,791.
What is the Median Family Income in Newark?
Median Family Income in Newark is $71,720.
What is the Median Household income in Newark?
Median Household Income in Newark is $56,284.
What is Income or Wage Gap in Newark?
Income or Wage Gap in Newark is 27.8%.
Women in Newark earn 72.2 cents for every dollar earned by a man.
What is Family Income Deficit in Newark?
Family Income Deficit in Newark is $12,304.
Families that are below poverty line in Newark earn $12,304 less on average than the poverty threshold level.
What is Inequality or Gini Index in Newark?
Inequality or Gini Index in Newark is 0.45.
What is the Total Population of Newark?
Total Population of Newark is 50,062.
What is the Total Male Population of Newark?
Total Male Population of Newark is 24,250.
What is the Total Female Population of Newark?
Total Female Population of Newark is 25,812.
What is the Ratio of Males per 100 Females in Newark?
There are 93.95 Males per 100 Females in Newark.
What is the Ratio of Females per 100 Males in Newark?
There are 106.44 Females per 100 Males in Newark.
What is the Median Population Age in Newark?
Median Population Age in Newark is 38.5 Years.
What is the Average Family Size in Newark
Average Family Size in Newark is 3.1 People.
What is the Average Household Size in Newark
Average Household Size in Newark is 2.4 People.
How Large is the Labor Force in Newark?
There are 24,157 People in the Labor Forcein in Newark.
What is the Percentage of People in the Labor Force in Newark?
60.0% of People are in the Labor Force in Newark.
What is the Unemployment Rate in Newark?
Unemployment Rate in Newark is 4.0%.