Austintown, OH Map & Demographics
Austintown Map
Austintown Overview
$30,207
PER CAPITA INCOME
$67,724
AVG FAMILY INCOME
$50,241
AVG HOUSEHOLD INCOME
37.5%
WAGE / INCOME GAP [ % ]
62.5¢/ $1
WAGE / INCOME GAP [ $ ]
$9,825
FAMILY INCOME DEFICIT
0.41
INEQUALITY / GINI INDEX
30,397
TOTAL POPULATION
14,334
MALE POPULATION
16,063
FEMALE POPULATION
89.24
MALES / 100 FEMALES
112.06
FEMALES / 100 MALES
43.3
MEDIAN AGE
2.8
AVG FAMILY SIZE
2.1
AVG HOUSEHOLD SIZE
16,313
LABOR FORCE [ PEOPLE ]
62.7%
PERCENT IN LABOR FORCE
4.8%
UNEMPLOYMENT RATE
Austintown Area Codes
Income in Austintown
Income Overview in Austintown
Per Capita Income in Austintown is $30,207, while median incomes of families and households are $67,724 and $50,241 respectively.
| Characteristic | Number | Measure |
| Per Capita Income | 30,397 | $30,207 |
| Median Family Income | 7,853 | $67,724 |
| Mean Family Income | 7,853 | $76,177 |
| Median Household Income | 14,111 | $50,241 |
| Mean Household Income | 14,111 | $63,164 |
| Income Deficit | 7,853 | $9,825 |
| Wage / Income Gap (%) | 30,397 | 37.47% |
| Wage / Income Gap ($) | 30,397 | 62.53¢ per $1 |
| Gini / Inequality Index | 30,397 | 0.41 |
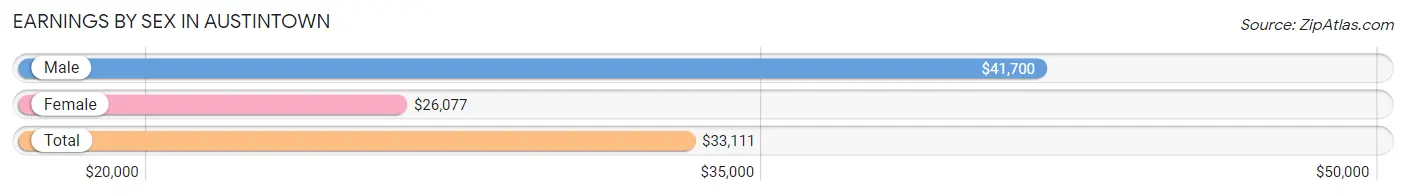
Earnings by Sex in Austintown
Average Earnings in Austintown are $33,111, $41,700 for men and $26,077 for women, a difference of 37.5%.
| Sex | Number | Average Earnings |
| Male | 8,160 (48.8%) | $41,700 |
| Female | 8,553 (51.2%) | $26,077 |
| Total | 16,713 (100.0%) | $33,111 |
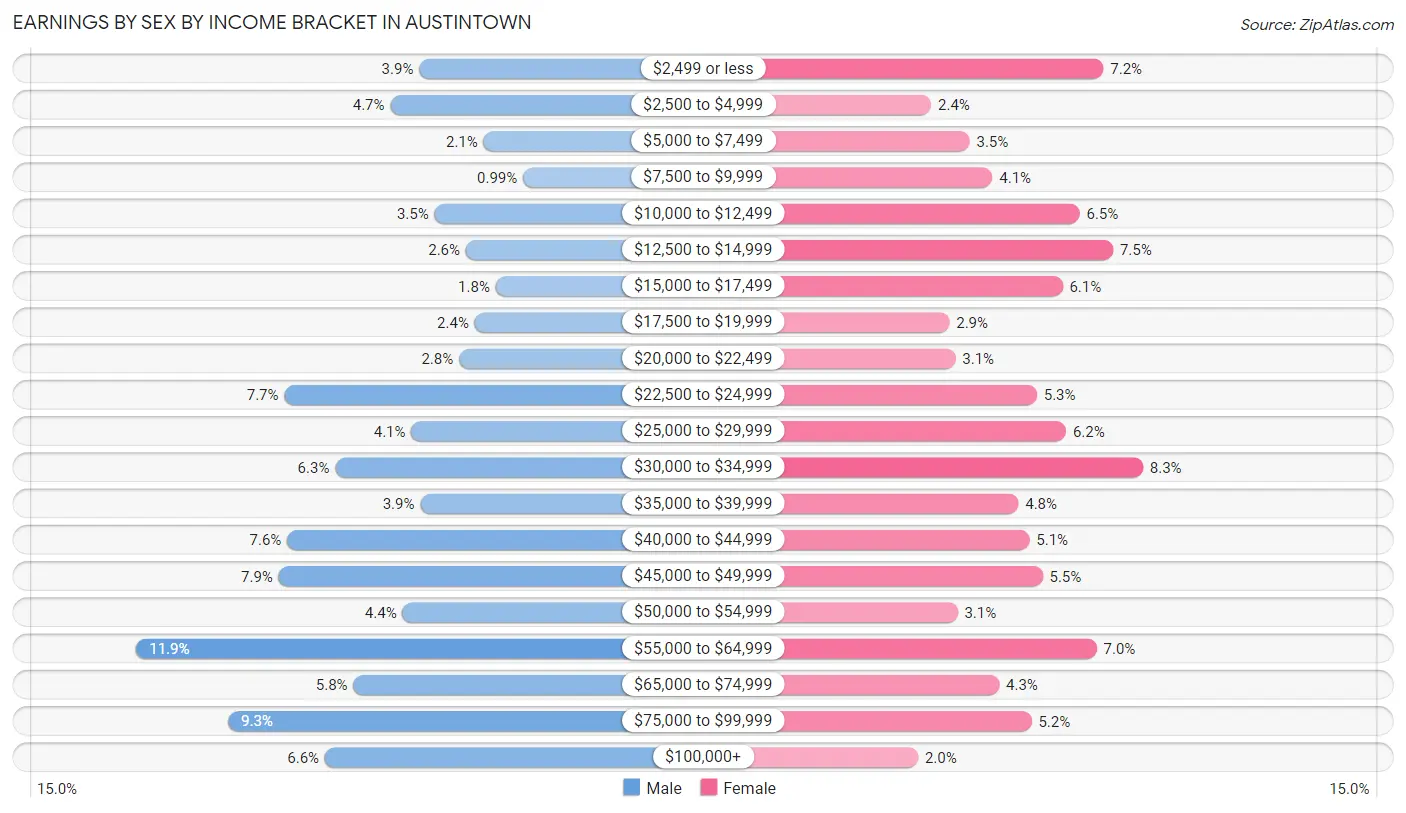
Earnings by Sex by Income Bracket in Austintown
The most common earnings brackets in Austintown are $55,000 to $64,999 for men (968 | 11.9%) and $30,000 to $34,999 for women (712 | 8.3%).
| Income | Male | Female |
| $2,499 or less | 319 (3.9%) | 617 (7.2%) |
| $2,500 to $4,999 | 385 (4.7%) | 203 (2.4%) |
| $5,000 to $7,499 | 171 (2.1%) | 295 (3.5%) |
| $7,500 to $9,999 | 81 (1.0%) | 350 (4.1%) |
| $10,000 to $12,499 | 284 (3.5%) | 559 (6.5%) |
| $12,500 to $14,999 | 212 (2.6%) | 640 (7.5%) |
| $15,000 to $17,499 | 144 (1.8%) | 518 (6.1%) |
| $17,500 to $19,999 | 192 (2.4%) | 246 (2.9%) |
| $20,000 to $22,499 | 228 (2.8%) | 261 (3.0%) |
| $22,500 to $24,999 | 628 (7.7%) | 457 (5.3%) |
| $25,000 to $29,999 | 337 (4.1%) | 527 (6.2%) |
| $30,000 to $34,999 | 512 (6.3%) | 712 (8.3%) |
| $35,000 to $39,999 | 317 (3.9%) | 412 (4.8%) |
| $40,000 to $44,999 | 622 (7.6%) | 439 (5.1%) |
| $45,000 to $49,999 | 641 (7.9%) | 470 (5.5%) |
| $50,000 to $54,999 | 357 (4.4%) | 266 (3.1%) |
| $55,000 to $64,999 | 968 (11.9%) | 600 (7.0%) |
| $65,000 to $74,999 | 470 (5.8%) | 366 (4.3%) |
| $75,000 to $99,999 | 757 (9.3%) | 444 (5.2%) |
| $100,000+ | 535 (6.6%) | 171 (2.0%) |
| Total | 8,160 (100.0%) | 8,553 (100.0%) |
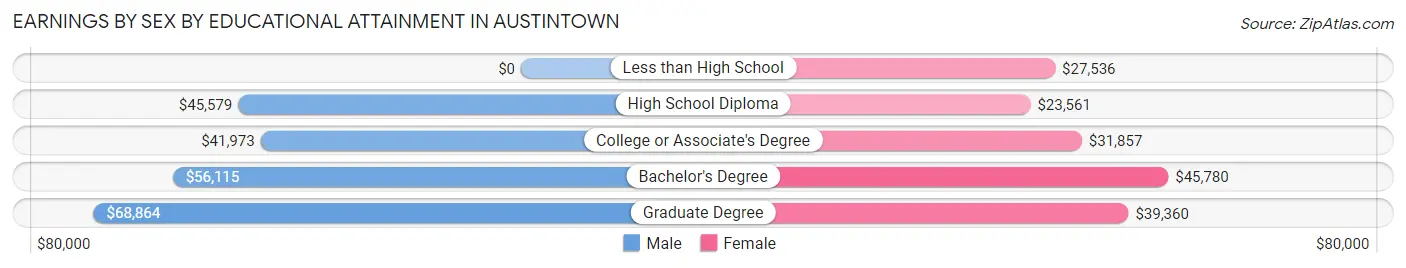
Earnings by Sex by Educational Attainment in Austintown
Average earnings in Austintown are $45,589 for men and $31,756 for women, a difference of 30.3%. Men with an educational attainment of graduate degree enjoy the highest average annual earnings of $68,864, while those with college or associate's degree education earn the least with $41,973. Women with an educational attainment of bachelor's degree earn the most with the average annual earnings of $45,780, while those with high school diploma education have the smallest earnings of $23,561.
| Educational Attainment | Male Income | Female Income |
| Less than High School | - | - |
| High School Diploma | $45,579 | $23,561 |
| College or Associate's Degree | $41,973 | $31,857 |
| Bachelor's Degree | $56,115 | $45,780 |
| Graduate Degree | $68,864 | $39,360 |
| Total | $45,589 | $31,756 |
Family Income in Austintown
Family Income Brackets in Austintown
According to the Austintown family income data, there are 1,845 families falling into the $50,000 to $74,999 income range, which is the most common income bracket and makes up 23.5% of all families. Conversely, the $200,000+ income bracket is the least frequent group with only 220 families (2.8%) belonging to this category.
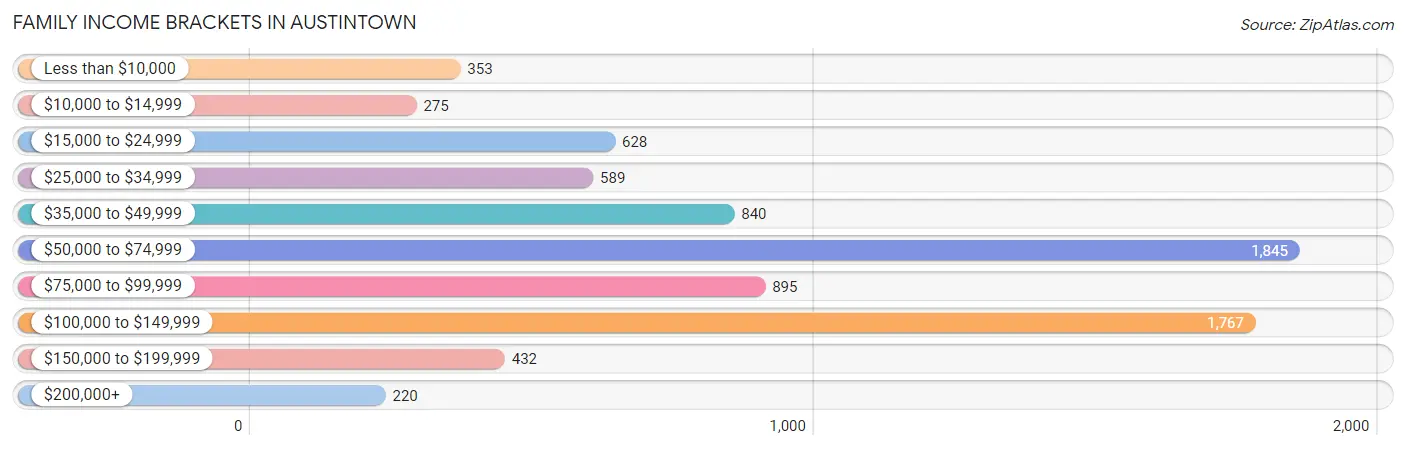
| Income Bracket | # Families | % Families |
| Less than $10,000 | 353 | 4.5% |
| $10,000 to $14,999 | 275 | 3.5% |
| $15,000 to $24,999 | 628 | 8.0% |
| $25,000 to $34,999 | 589 | 7.5% |
| $35,000 to $49,999 | 840 | 10.7% |
| $50,000 to $74,999 | 1,845 | 23.5% |
| $75,000 to $99,999 | 895 | 11.4% |
| $100,000 to $149,999 | 1,767 | 22.5% |
| $150,000 to $199,999 | 432 | 5.5% |
| $200,000+ | 220 | 2.8% |
Family Income by Famaliy Size in Austintown
5-person families (371 | 4.7%) account for the highest median family income in Austintown with $132,770 per family, while 2-person families (4,686 | 59.7%) have the highest median income of $27,466 per family member.
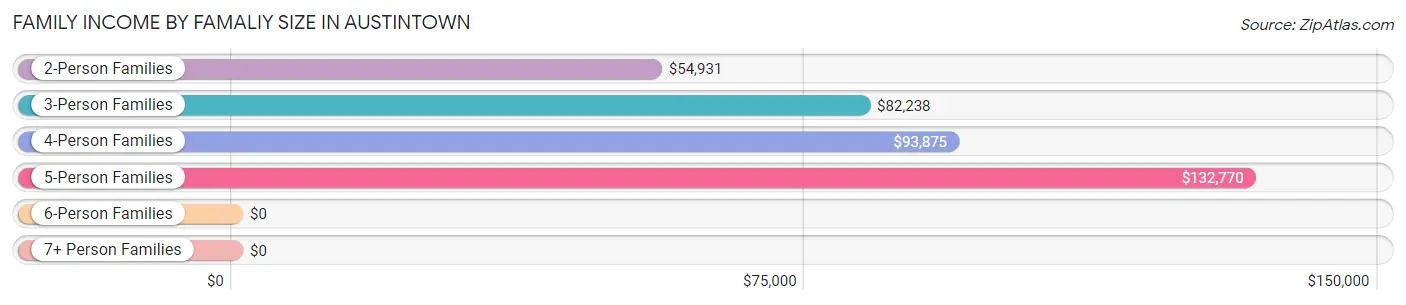
| Income Bracket | # Families | Median Income |
| 2-Person Families | 4,686 (59.7%) | $54,931 |
| 3-Person Families | 1,615 (20.6%) | $82,238 |
| 4-Person Families | 1,128 (14.4%) | $93,875 |
| 5-Person Families | 371 (4.7%) | $132,770 |
| 6-Person Families | 12 (0.2%) | $0 |
| 7+ Person Families | 41 (0.5%) | $0 |
| Total | 7,853 (100.0%) | $67,724 |
Family Income by Number of Earners in Austintown
The median family income in Austintown is $67,724, with families comprising 3+ earners (863) having the highest median family income of $122,527, while families with no earners (1,601) have the lowest median family income of $46,947, accounting for 11.0% and 20.4% of families, respectively.
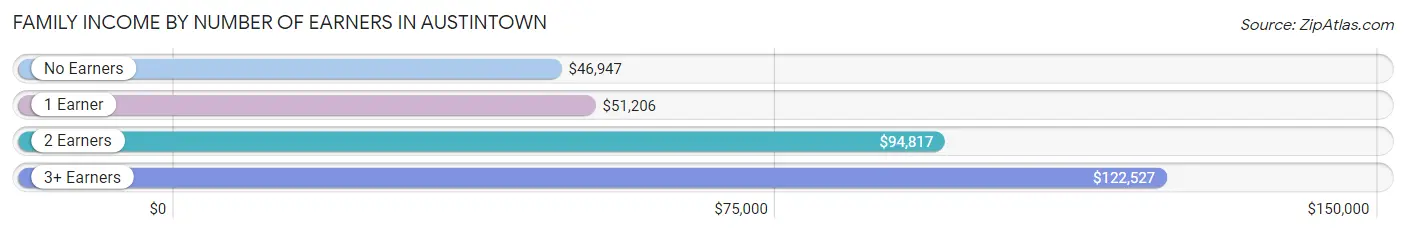
| Number of Earners | # Families | Median Income |
| No Earners | 1,601 (20.4%) | $46,947 |
| 1 Earner | 2,591 (33.0%) | $51,206 |
| 2 Earners | 2,798 (35.6%) | $94,817 |
| 3+ Earners | 863 (11.0%) | $122,527 |
| Total | 7,853 (100.0%) | $67,724 |
Household Income in Austintown
Household Income Brackets in Austintown
With 2,992 households falling in the category, the $50,000 to $74,999 income range is the most frequent in Austintown, accounting for 21.2% of all households. In contrast, only 268 households (1.9%) fall into the $200,000+ income bracket, making it the least populous group.
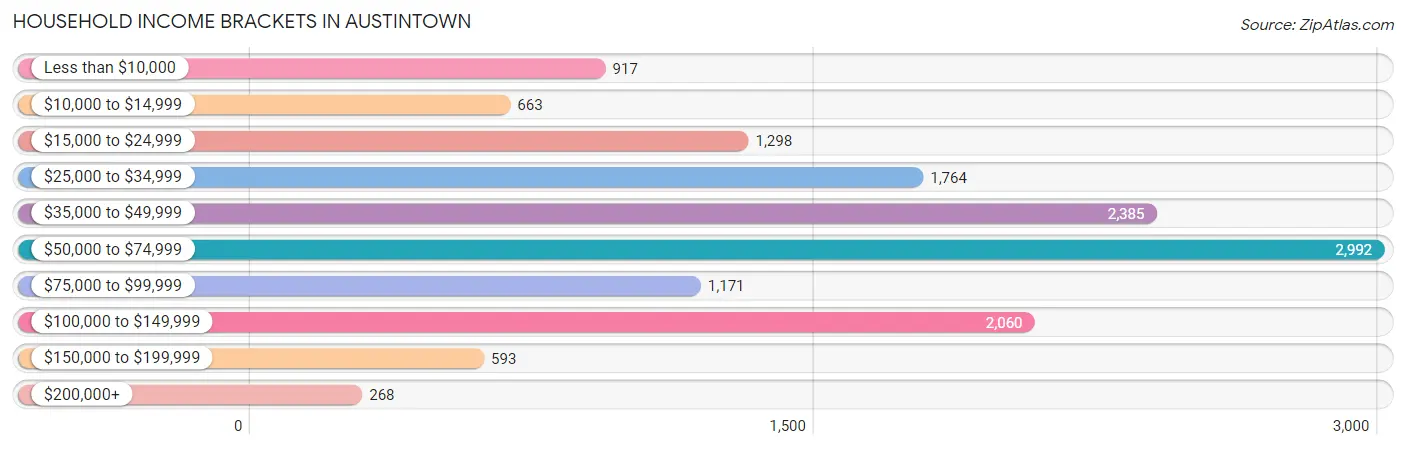
| Income Bracket | # Households | % Households |
| Less than $10,000 | 917 | 6.5% |
| $10,000 to $14,999 | 663 | 4.7% |
| $15,000 to $24,999 | 1,298 | 9.2% |
| $25,000 to $34,999 | 1,764 | 12.5% |
| $35,000 to $49,999 | 2,385 | 16.9% |
| $50,000 to $74,999 | 2,992 | 21.2% |
| $75,000 to $99,999 | 1,171 | 8.3% |
| $100,000 to $149,999 | 2,060 | 14.6% |
| $150,000 to $199,999 | 593 | 4.2% |
| $200,000+ | 268 | 1.9% |
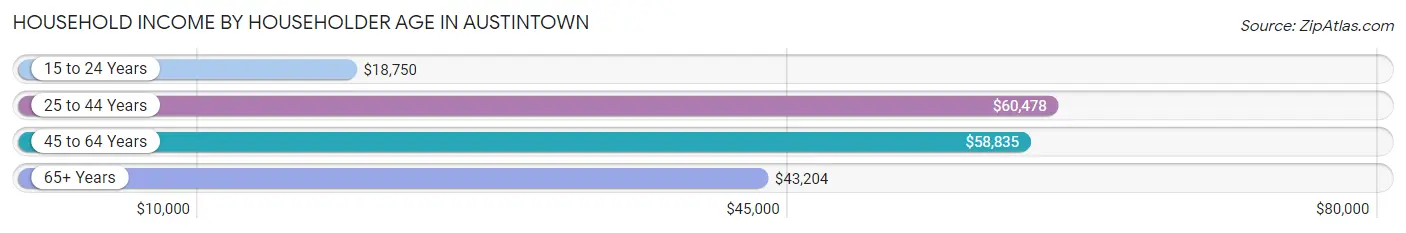
Household Income by Householder Age in Austintown
The median household income in Austintown is $50,241, with the highest median household income of $60,478 found in the 25 to 44 years age bracket for the primary householder. A total of 4,093 households (29.0%) fall into this category. Meanwhile, the 15 to 24 years age bracket for the primary householder has the lowest median household income of $18,750, with 752 households (5.3%) in this group.
| Income Bracket | # Households | Median Income |
| 15 to 24 Years | 752 (5.3%) | $18,750 |
| 25 to 44 Years | 4,093 (29.0%) | $60,478 |
| 45 to 64 Years | 4,817 (34.1%) | $58,835 |
| 65+ Years | 4,449 (31.5%) | $43,204 |
| Total | 14,111 (100.0%) | $50,241 |
Poverty in Austintown
Income Below Poverty by Sex and Age in Austintown
With 12.3% poverty level for males and 17.0% for females among the residents of Austintown, under 5 year old males and 16 and 17 year old females are the most vulnerable to poverty, with 219 males (33.5%) and 121 females (39.3%) in their respective age groups living below the poverty level.
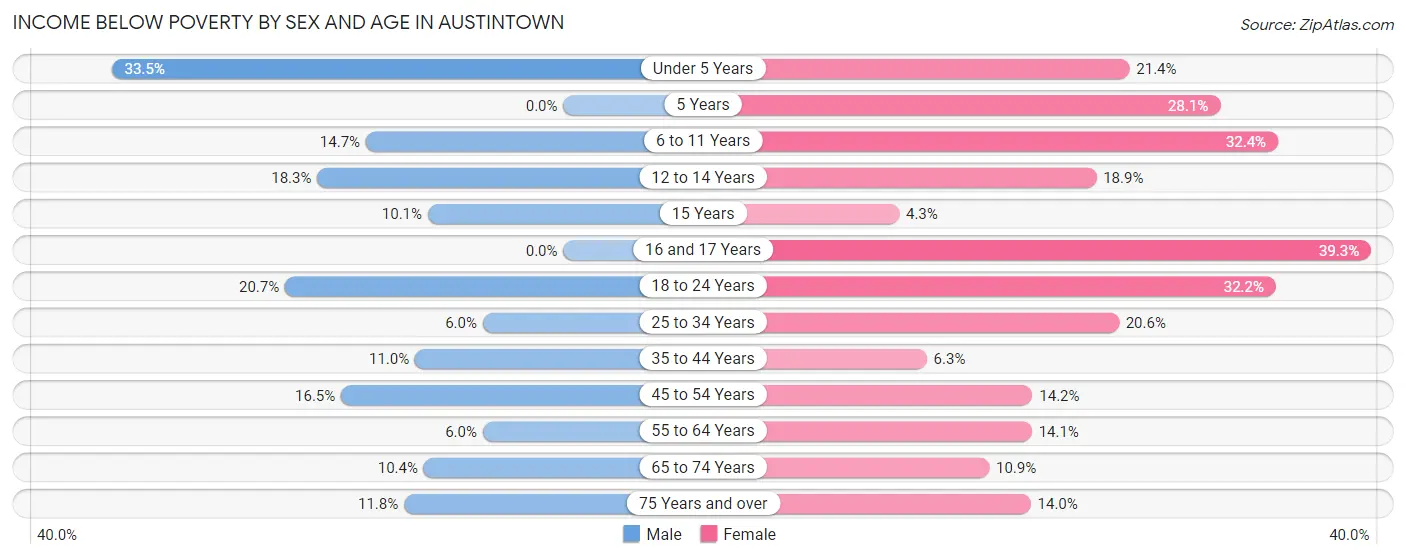
| Age Bracket | Male | Female |
| Under 5 Years | 219 (33.5%) | 136 (21.3%) |
| 5 Years | 0 (0.0%) | 50 (28.1%) |
| 6 to 11 Years | 123 (14.7%) | 204 (32.4%) |
| 12 to 14 Years | 55 (18.3%) | 102 (18.9%) |
| 15 Years | 18 (10.1%) | 9 (4.3%) |
| 16 and 17 Years | 0 (0.0%) | 121 (39.3%) |
| 18 to 24 Years | 288 (20.7%) | 443 (32.2%) |
| 25 to 34 Years | 126 (6.0%) | 475 (20.6%) |
| 35 to 44 Years | 202 (11.0%) | 104 (6.3%) |
| 45 to 54 Years | 307 (16.5%) | 261 (14.1%) |
| 55 to 64 Years | 106 (6.0%) | 310 (14.1%) |
| 65 to 74 Years | 163 (10.4%) | 253 (10.9%) |
| 75 Years and over | 141 (11.8%) | 225 (14.0%) |
| Total | 1,748 (12.3%) | 2,693 (17.0%) |
Income Above Poverty by Sex and Age in Austintown
According to the poverty statistics in Austintown, males aged 5 years and females aged 15 years are the age groups that are most secure financially, with 100.0% of males and 95.8% of females in these age groups living above the poverty line.
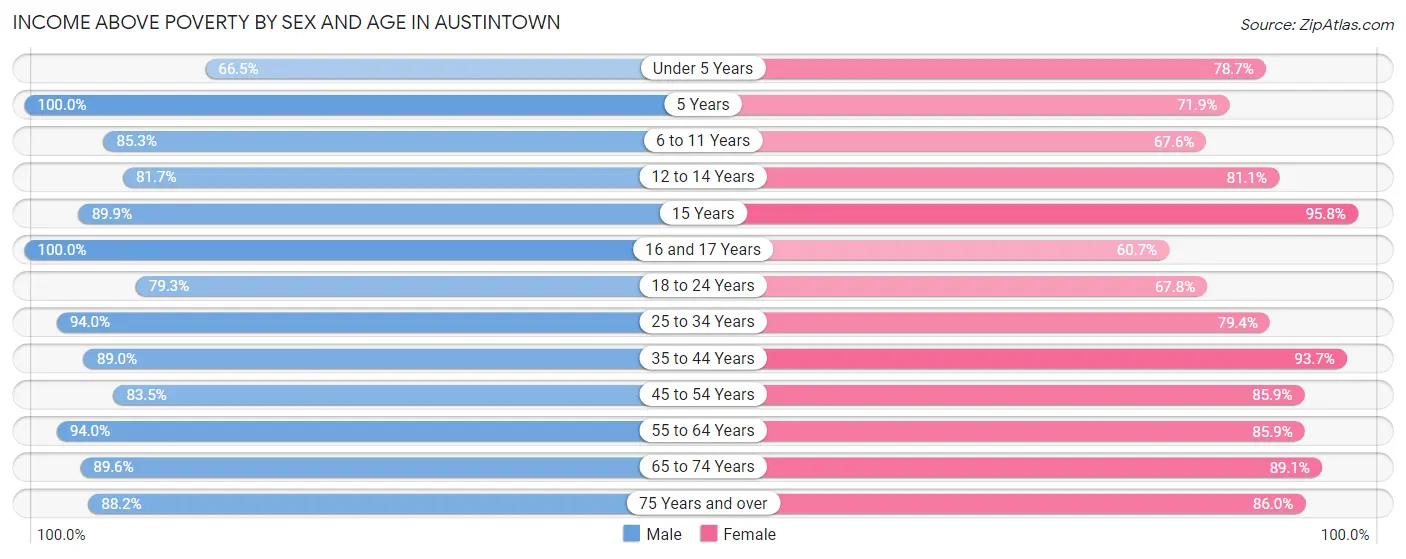
| Age Bracket | Male | Female |
| Under 5 Years | 434 (66.5%) | 501 (78.6%) |
| 5 Years | 135 (100.0%) | 128 (71.9%) |
| 6 to 11 Years | 716 (85.3%) | 426 (67.6%) |
| 12 to 14 Years | 246 (81.7%) | 438 (81.1%) |
| 15 Years | 161 (89.9%) | 203 (95.8%) |
| 16 and 17 Years | 373 (100.0%) | 187 (60.7%) |
| 18 to 24 Years | 1,106 (79.3%) | 932 (67.8%) |
| 25 to 34 Years | 1,980 (94.0%) | 1,835 (79.4%) |
| 35 to 44 Years | 1,633 (89.0%) | 1,546 (93.7%) |
| 45 to 54 Years | 1,554 (83.5%) | 1,584 (85.9%) |
| 55 to 64 Years | 1,667 (94.0%) | 1,889 (85.9%) |
| 65 to 74 Years | 1,411 (89.6%) | 2,061 (89.1%) |
| 75 Years and over | 1,051 (88.2%) | 1,380 (86.0%) |
| Total | 12,467 (87.7%) | 13,110 (83.0%) |
Income Below Poverty Among Married-Couple Families in Austintown
The poverty statistics for married-couple families in Austintown show that 5.3% or 290 of the total 5,429 families live below the poverty line. Families with no children have the highest poverty rate of 6.3%, comprising of 246 families. On the other hand, families with 3 or 4 children have the lowest poverty rate of 0.0%, which includes 0 families.
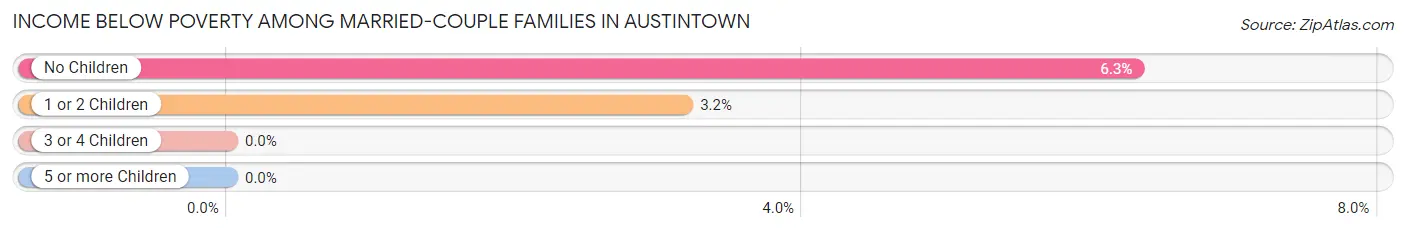
| Children | Above Poverty | Below Poverty |
| No Children | 3,652 (93.7%) | 246 (6.3%) |
| 1 or 2 Children | 1,345 (96.8%) | 44 (3.2%) |
| 3 or 4 Children | 142 (100.0%) | 0 (0.0%) |
| 5 or more Children | 0 (0.0%) | 0 (0.0%) |
| Total | 5,139 (94.7%) | 290 (5.3%) |
Income Below Poverty Among Single-Parent Households in Austintown
According to the poverty data in Austintown, 21.9% or 140 single-father households and 28.4% or 507 single-mother households are living below the poverty line. Among single-father households, those with 1 or 2 children have the highest poverty rate, with 133 households (31.3%) experiencing poverty. Likewise, among single-mother households, those with 3 or 4 children have the highest poverty rate, with 156 households (79.2%) falling below the poverty line.
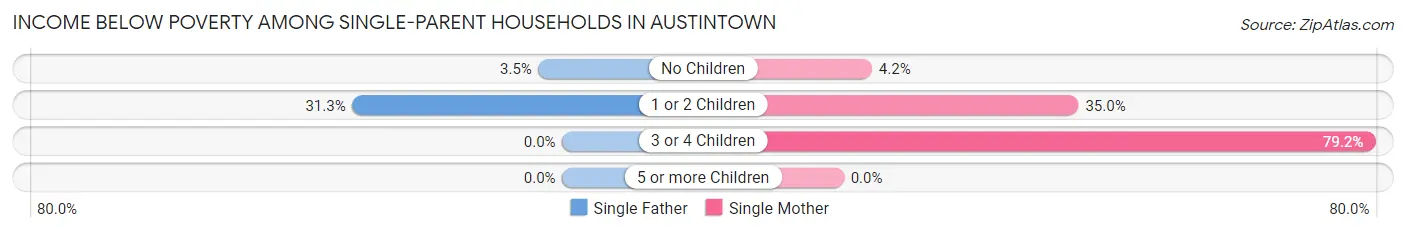
| Children | Single Father | Single Mother |
| No Children | 7 (3.5%) | 28 (4.2%) |
| 1 or 2 Children | 133 (31.3%) | 323 (35.0%) |
| 3 or 4 Children | 0 (0.0%) | 156 (79.2%) |
| 5 or more Children | 0 (0.0%) | 0 (0.0%) |
| Total | 140 (21.9%) | 507 (28.4%) |
Income Below Poverty Among Married-Couple vs Single-Parent Households in Austintown
The poverty data for Austintown shows that 290 of the married-couple family households (5.3%) and 647 of the single-parent households (26.7%) are living below the poverty level. Within the married-couple family households, those with no children have the highest poverty rate, with 246 households (6.3%) falling below the poverty line. Among the single-parent households, those with 3 or 4 children have the highest poverty rate, with 156 household (73.2%) living below poverty.
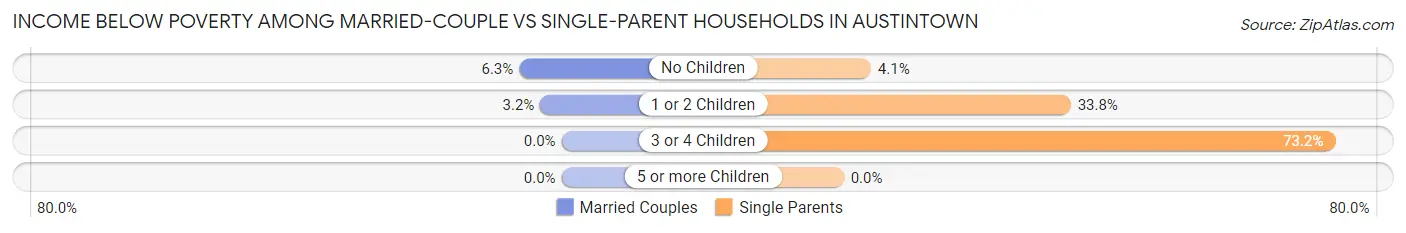
| Children | Married-Couple Families | Single-Parent Households |
| No Children | 246 (6.3%) | 35 (4.1%) |
| 1 or 2 Children | 44 (3.2%) | 456 (33.8%) |
| 3 or 4 Children | 0 (0.0%) | 156 (73.2%) |
| 5 or more Children | 0 (0.0%) | 0 (0.0%) |
| Total | 290 (5.3%) | 647 (26.7%) |
Race in Austintown
The most populous races in Austintown are White / Caucasian (25,888 | 85.2%), Black / African American (2,414 | 7.9%), and Hispanic or Latino (1,696 | 5.6%).
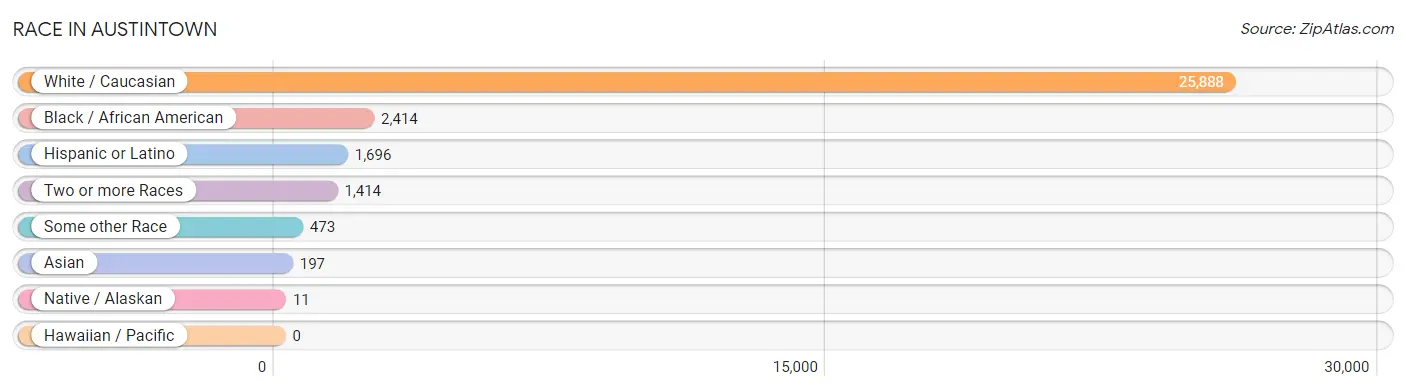
| Race | # Population | % Population |
| Asian | 197 | 0.6% |
| Black / African American | 2,414 | 7.9% |
| Hawaiian / Pacific | 0 | 0.0% |
| Hispanic or Latino | 1,696 | 5.6% |
| Native / Alaskan | 11 | 0.0% |
| White / Caucasian | 25,888 | 85.2% |
| Two or more Races | 1,414 | 4.6% |
| Some other Race | 473 | 1.6% |
| Total | 30,397 | 100.0% |
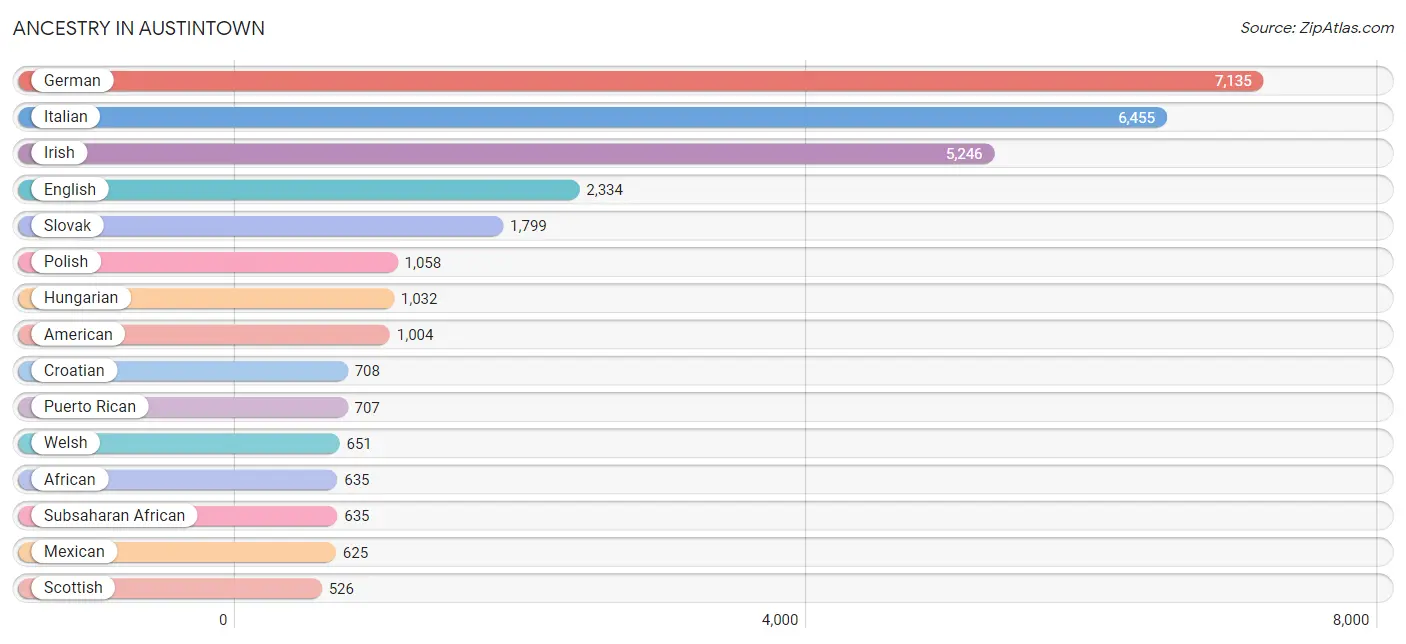
Ancestry in Austintown
The most populous ancestries reported in Austintown are German (7,135 | 23.5%), Italian (6,455 | 21.2%), Irish (5,246 | 17.3%), English (2,334 | 7.7%), and Slovak (1,799 | 5.9%), together accounting for 75.6% of all Austintown residents.
| Ancestry | # Population | % Population |
| African | 635 | 2.1% |
| American | 1,004 | 3.3% |
| Apache | 5 | 0.0% |
| Arab | 361 | 1.2% |
| Austrian | 136 | 0.4% |
| Belgian | 18 | 0.1% |
| Bhutanese | 95 | 0.3% |
| British | 86 | 0.3% |
| Bulgarian | 180 | 0.6% |
| Central American | 47 | 0.2% |
| Cherokee | 18 | 0.1% |
| Croatian | 708 | 2.3% |
| Cypriot | 8 | 0.0% |
| Czech | 23 | 0.1% |
| Czechoslovakian | 157 | 0.5% |
| Danish | 73 | 0.2% |
| Dominican | 30 | 0.1% |
| Dutch | 306 | 1.0% |
| Eastern European | 46 | 0.2% |
| English | 2,334 | 7.7% |
| European | 133 | 0.4% |
| Finnish | 77 | 0.3% |
| French | 432 | 1.4% |
| French Canadian | 38 | 0.1% |
| German | 7,135 | 23.5% |
| Greek | 154 | 0.5% |
| Guatemalan | 41 | 0.1% |
| Haitian | 51 | 0.2% |
| Hungarian | 1,032 | 3.4% |
| Indian (Asian) | 39 | 0.1% |
| Irish | 5,246 | 17.3% |
| Italian | 6,455 | 21.2% |
| Jamaican | 25 | 0.1% |
| Jordanian | 37 | 0.1% |
| Korean | 2 | 0.0% |
| Lebanese | 135 | 0.4% |
| Lithuanian | 196 | 0.6% |
| Mexican | 625 | 2.1% |
| Native Hawaiian | 79 | 0.3% |
| Nicaraguan | 6 | 0.0% |
| Northern European | 15 | 0.1% |
| Norwegian | 50 | 0.2% |
| Pakistani | 49 | 0.2% |
| Palestinian | 172 | 0.6% |
| Pennsylvania German | 23 | 0.1% |
| Polish | 1,058 | 3.5% |
| Portuguese | 17 | 0.1% |
| Puerto Rican | 707 | 2.3% |
| Romanian | 294 | 1.0% |
| Russian | 341 | 1.1% |
| Scandinavian | 8 | 0.0% |
| Scotch-Irish | 179 | 0.6% |
| Scottish | 526 | 1.7% |
| Serbian | 78 | 0.3% |
| Slavic | 25 | 0.1% |
| Slovak | 1,799 | 5.9% |
| Slovene | 32 | 0.1% |
| Spaniard | 12 | 0.0% |
| Spanish | 187 | 0.6% |
| Sri Lankan | 9 | 0.0% |
| Subsaharan African | 635 | 2.1% |
| Swedish | 115 | 0.4% |
| Swiss | 75 | 0.3% |
| Thai | 176 | 0.6% |
| Trinidadian and Tobagonian | 63 | 0.2% |
| Ukrainian | 356 | 1.2% |
| Welsh | 651 | 2.1% |
| West Indian | 28 | 0.1% |
| Yugoslavian | 27 | 0.1% | View All 69 Rows |
Immigrants in Austintown
The most numerous immigrant groups reported in Austintown came from Asia (279 | 0.9%), South Central Asia (156 | 0.5%), Europe (115 | 0.4%), India (111 | 0.4%), and Southern Europe (66 | 0.2%), together accounting for 2.4% of all Austintown residents.
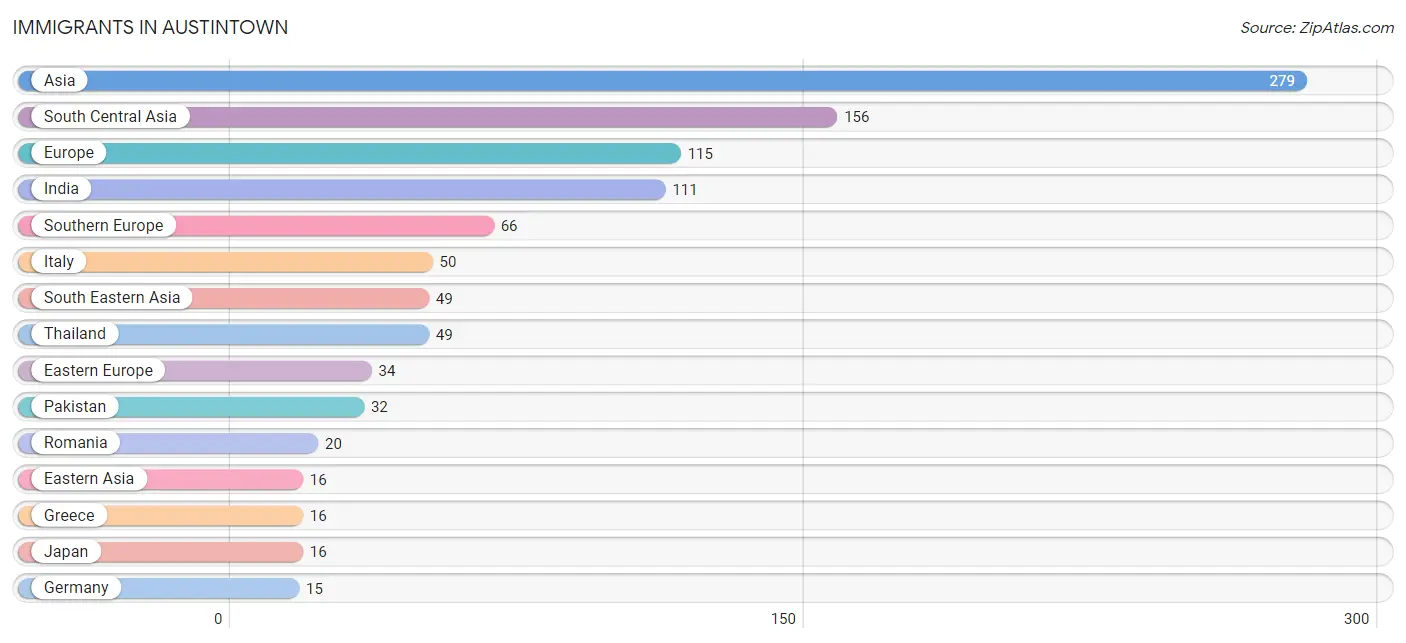
| Immigration Origin | # Population | % Population |
| Asia | 279 | 0.9% |
| Central America | 14 | 0.1% |
| Eastern Asia | 16 | 0.1% |
| Eastern Europe | 34 | 0.1% |
| Europe | 115 | 0.4% |
| Germany | 15 | 0.1% |
| Greece | 16 | 0.1% |
| India | 111 | 0.4% |
| Italy | 50 | 0.2% |
| Japan | 16 | 0.1% |
| Latin America | 14 | 0.1% |
| Mexico | 8 | 0.0% |
| Nepal | 13 | 0.0% |
| Nicaragua | 6 | 0.0% |
| Pakistan | 32 | 0.1% |
| Romania | 20 | 0.1% |
| South Central Asia | 156 | 0.5% |
| South Eastern Asia | 49 | 0.2% |
| Southern Europe | 66 | 0.2% |
| Thailand | 49 | 0.2% |
| Western Europe | 15 | 0.1% | View All 21 Rows |
Sex and Age in Austintown
Sex and Age in Austintown
The most populous age groups in Austintown are 30 to 34 Years (1,144 | 8.0%) for men and 65 to 69 Years (1,256 | 7.8%) for women.
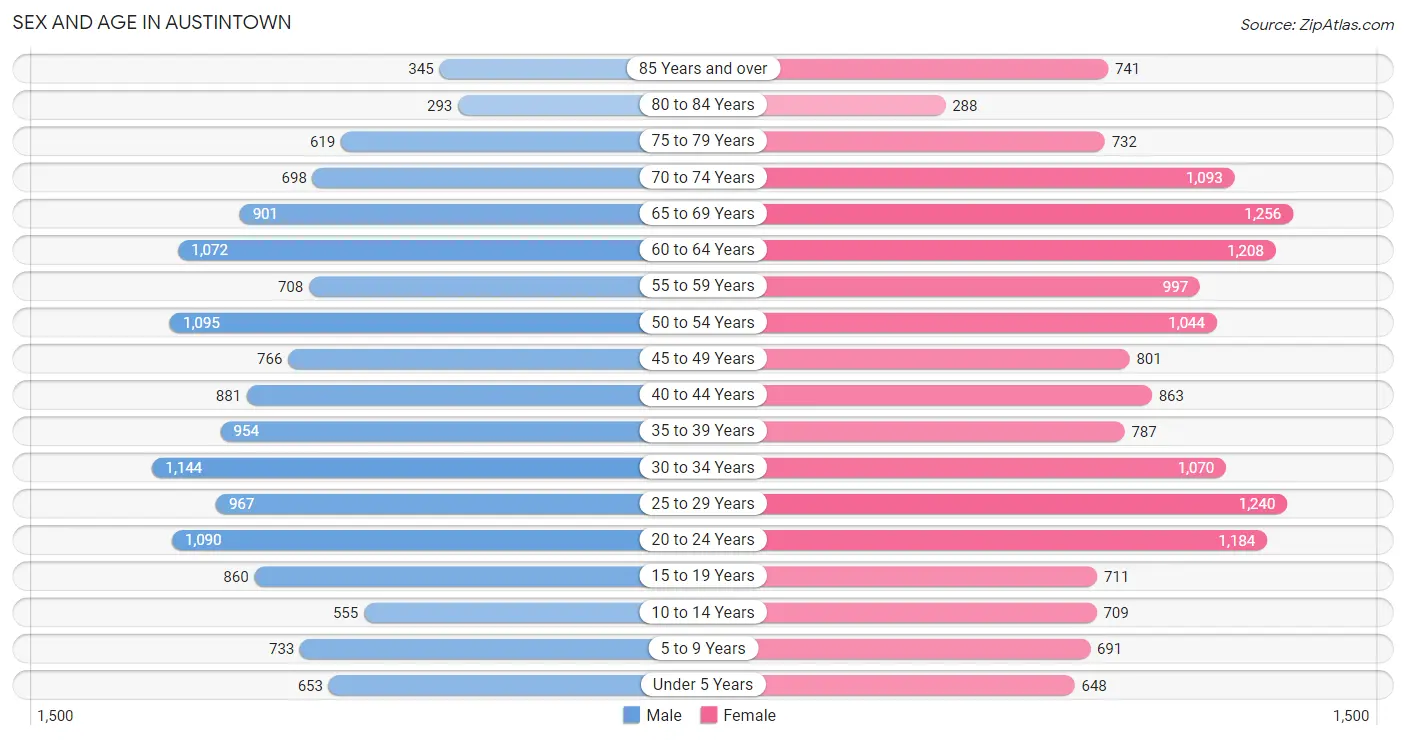
| Age Bracket | Male | Female |
| Under 5 Years | 653 (4.6%) | 648 (4.0%) |
| 5 to 9 Years | 733 (5.1%) | 691 (4.3%) |
| 10 to 14 Years | 555 (3.9%) | 709 (4.4%) |
| 15 to 19 Years | 860 (6.0%) | 711 (4.4%) |
| 20 to 24 Years | 1,090 (7.6%) | 1,184 (7.4%) |
| 25 to 29 Years | 967 (6.8%) | 1,240 (7.7%) |
| 30 to 34 Years | 1,144 (8.0%) | 1,070 (6.7%) |
| 35 to 39 Years | 954 (6.7%) | 787 (4.9%) |
| 40 to 44 Years | 881 (6.1%) | 863 (5.4%) |
| 45 to 49 Years | 766 (5.3%) | 801 (5.0%) |
| 50 to 54 Years | 1,095 (7.6%) | 1,044 (6.5%) |
| 55 to 59 Years | 708 (4.9%) | 997 (6.2%) |
| 60 to 64 Years | 1,072 (7.5%) | 1,208 (7.5%) |
| 65 to 69 Years | 901 (6.3%) | 1,256 (7.8%) |
| 70 to 74 Years | 698 (4.9%) | 1,093 (6.8%) |
| 75 to 79 Years | 619 (4.3%) | 732 (4.6%) |
| 80 to 84 Years | 293 (2.0%) | 288 (1.8%) |
| 85 Years and over | 345 (2.4%) | 741 (4.6%) |
| Total | 14,334 (100.0%) | 16,063 (100.0%) |
Families and Households in Austintown
Median Family Size in Austintown
The median family size in Austintown is 2.76 persons per family, with married-couple families (5,429 | 69.1%) accounting for the largest median family size of 2.85 persons per family. On the other hand, single male/father families (639 | 8.1%) represent the smallest median family size with 2.38 persons per family.
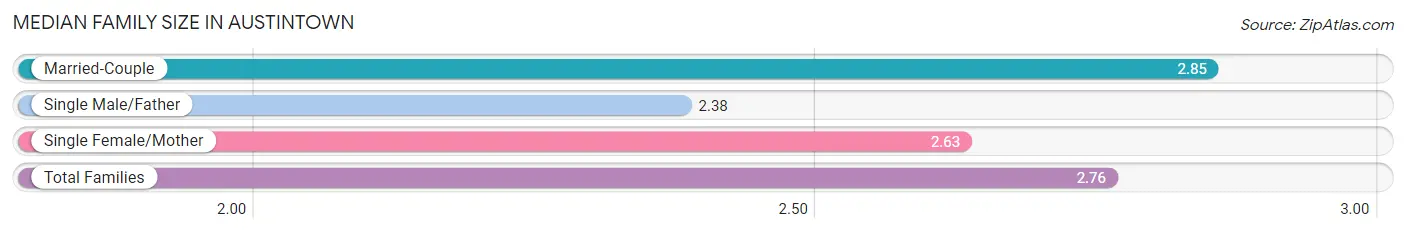
| Family Type | # Families | Family Size |
| Married-Couple | 5,429 (69.1%) | 2.85 |
| Single Male/Father | 639 (8.1%) | 2.38 |
| Single Female/Mother | 1,785 (22.7%) | 2.63 |
| Total Families | 7,853 (100.0%) | 2.76 |
Median Household Size in Austintown
The median household size in Austintown is 2.13 persons per household, with single male/father households (639 | 4.5%) accounting for the largest median household size of 3.11 persons per household. non-family households (6,258 | 44.4%) represent the smallest median household size with 1.16 persons per household.
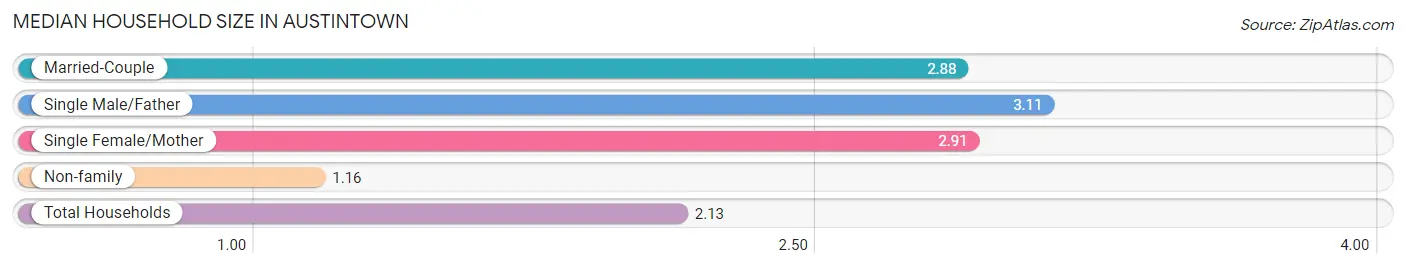
| Household Type | # Households | Household Size |
| Married-Couple | 5,429 (38.5%) | 2.88 |
| Single Male/Father | 639 (4.5%) | 3.11 |
| Single Female/Mother | 1,785 (12.7%) | 2.91 |
| Non-family | 6,258 (44.4%) | 1.16 |
| Total Households | 14,111 (100.0%) | 2.13 |
Household Size by Marriage Status in Austintown
Out of a total of 14,111 households in Austintown, 7,853 (55.6%) are family households, while 6,258 (44.4%) are nonfamily households. The most numerous type of family households are 2-person households, comprising 4,103, and the most common type of nonfamily households are 1-person households, comprising 5,397.
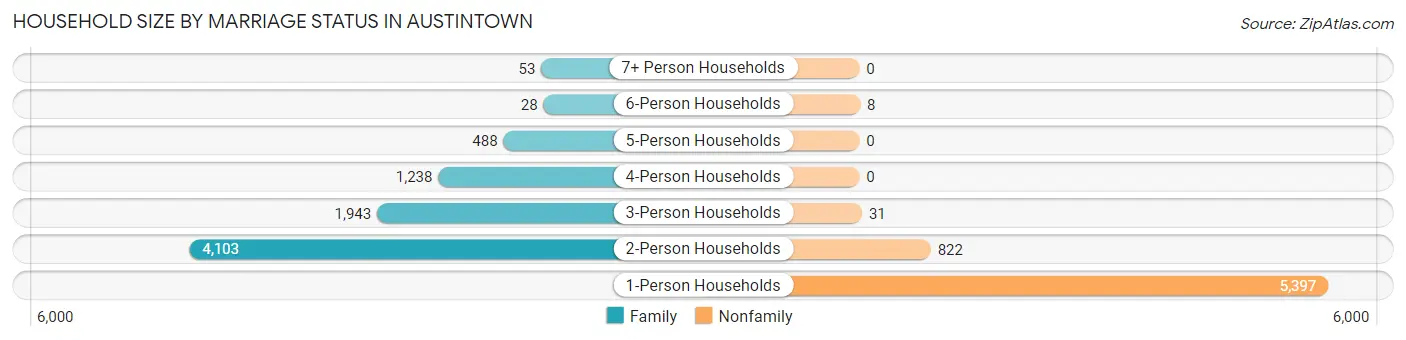
| Household Size | Family Households | Nonfamily Households |
| 1-Person Households | - | 5,397 (38.3%) |
| 2-Person Households | 4,103 (29.1%) | 822 (5.8%) |
| 3-Person Households | 1,943 (13.8%) | 31 (0.2%) |
| 4-Person Households | 1,238 (8.8%) | 0 (0.0%) |
| 5-Person Households | 488 (3.5%) | 0 (0.0%) |
| 6-Person Households | 28 (0.2%) | 8 (0.1%) |
| 7+ Person Households | 53 (0.4%) | 0 (0.0%) |
| Total | 7,853 (55.6%) | 6,258 (44.4%) |
Female Fertility in Austintown
Fertility by Age in Austintown
Average fertility rate in Austintown is 32.0 births per 1,000 women. Women in the age bracket of 20 to 34 years have the highest fertility rate with 47.0 births per 1,000 women. Women in the age bracket of 20 to 34 years acount for 74.1% of all women with births.
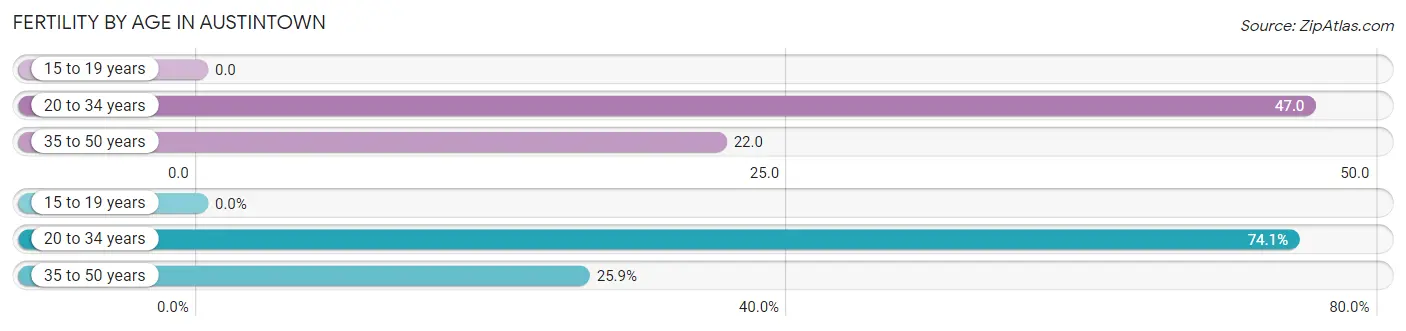
| Age Bracket | Women with Births | Births / 1,000 Women |
| 15 to 19 years | 0 (0.0%) | 0.0 |
| 20 to 34 years | 163 (74.1%) | 47.0 |
| 35 to 50 years | 57 (25.9%) | 22.0 |
| Total | 220 (100.0%) | 32.0 |
Fertility by Age by Marriage Status in Austintown
74.1% of women with births (220) in Austintown are married. The highest percentage of unmarried women with births falls into 35 to 50 years age bracket with 100.0% of them unmarried at the time of birth, while the lowest percentage of unmarried women with births belong to 20 to 34 years age bracket with 0.0% of them unmarried.
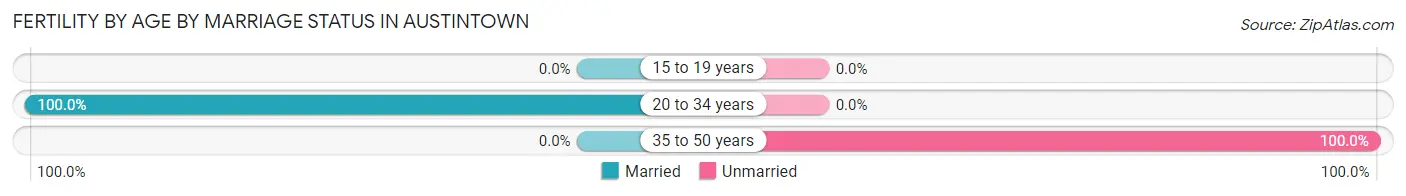
| Age Bracket | Married | Unmarried |
| 15 to 19 years | 0 (0.0%) | 0 (0.0%) |
| 20 to 34 years | 163 (100.0%) | 0 (0.0%) |
| 35 to 50 years | 0 (0.0%) | 57 (100.0%) |
| Total | 163 (74.1%) | 57 (25.9%) |
Fertility by Education in Austintown
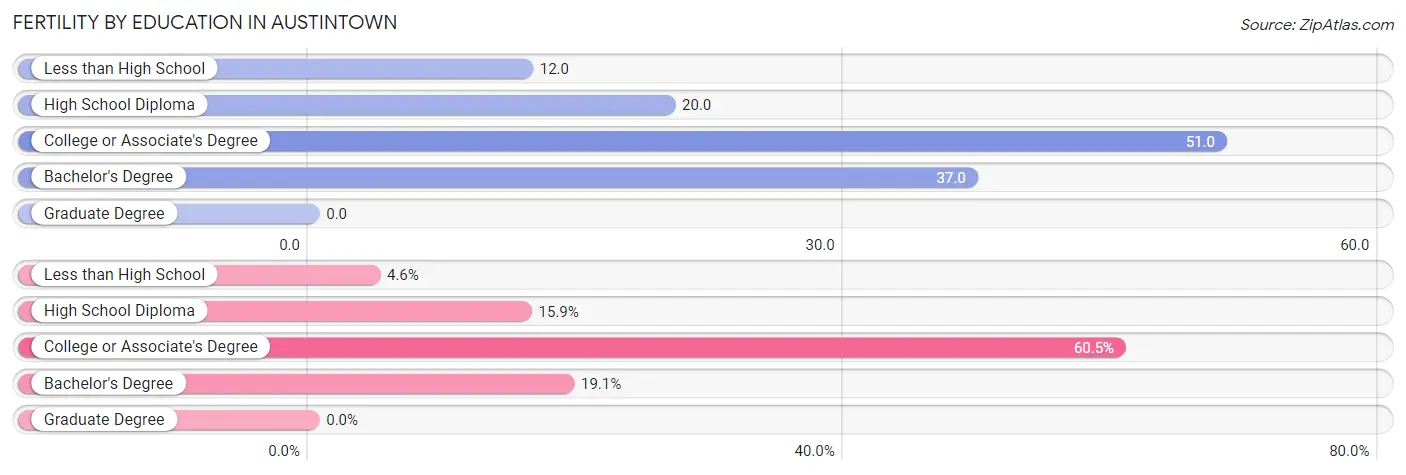
| Educational Attainment | Women with Births | Births / 1,000 Women |
| Less than High School | 10 (4.5%) | 12.0 |
| High School Diploma | 35 (15.9%) | 20.0 |
| College or Associate's Degree | 133 (60.5%) | 51.0 |
| Bachelor's Degree | 42 (19.1%) | 37.0 |
| Graduate Degree | 0 (0.0%) | 0.0 |
| Total | 220 (100.0%) | 32.0 |
Fertility by Education by Marriage Status in Austintown
25.9% of women with births in Austintown are unmarried. Women with the educational attainment of bachelor's degree are most likely to be married with 100.0% of them married at childbirth, while women with the educational attainment of less than high school are least likely to be married with 100.0% of them unmarried at childbirth.
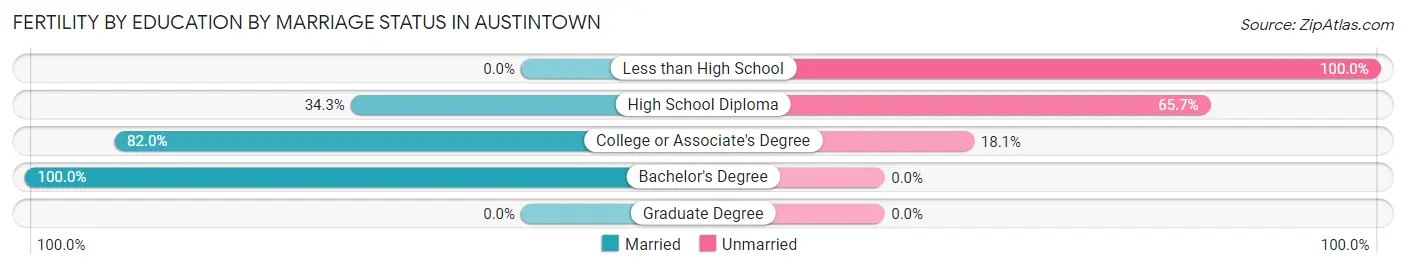
| Educational Attainment | Married | Unmarried |
| Less than High School | 0 (0.0%) | 10 (100.0%) |
| High School Diploma | 12 (34.3%) | 23 (65.7%) |
| College or Associate's Degree | 109 (82.0%) | 24 (18.0%) |
| Bachelor's Degree | 42 (100.0%) | 0 (0.0%) |
| Graduate Degree | 0 (0.0%) | 0 (0.0%) |
| Total | 163 (74.1%) | 57 (25.9%) |
Employment Characteristics in Austintown
Employment by Class of Employer in Austintown
Among the 15,252 employed individuals in Austintown, private company employees (10,664 | 69.9%), not-for-profit organizations (1,543 | 10.1%), and local government employees (938 | 6.1%) make up the most common classes of employment.
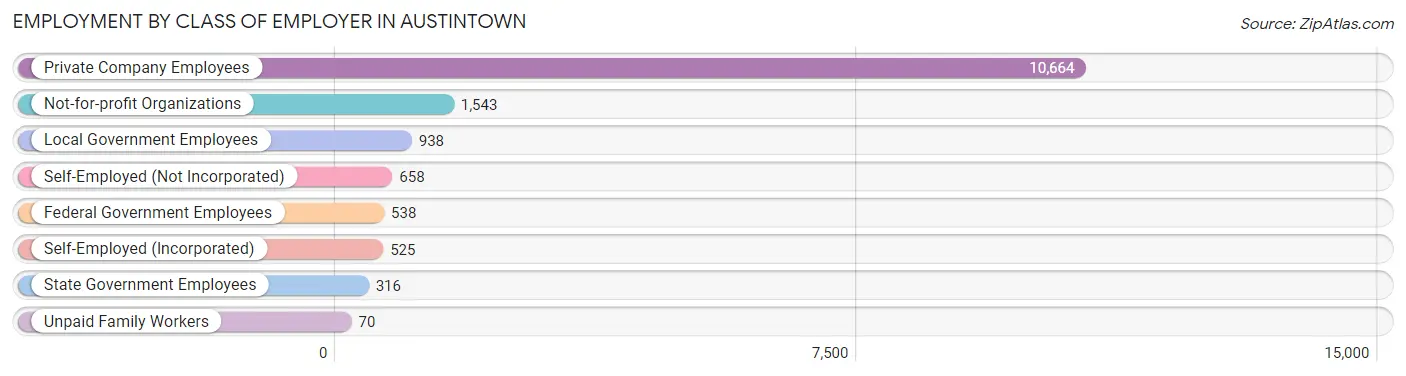
| Employer Class | # Employees | % Employees |
| Private Company Employees | 10,664 | 69.9% |
| Self-Employed (Incorporated) | 525 | 3.4% |
| Self-Employed (Not Incorporated) | 658 | 4.3% |
| Not-for-profit Organizations | 1,543 | 10.1% |
| Local Government Employees | 938 | 6.1% |
| State Government Employees | 316 | 2.1% |
| Federal Government Employees | 538 | 3.5% |
| Unpaid Family Workers | 70 | 0.5% |
| Total | 15,252 | 100.0% |
Employment Status by Age in Austintown
According to the labor force statistics for Austintown, out of the total population over 16 years of age (26,017), 62.7% or 16,313 individuals are in the labor force, with 4.8% or 783 of them unemployed. The age group with the highest labor force participation rate is 30 to 34 years, with 94.4% or 2,090 individuals in the labor force. Within the labor force, the 16 to 19 years age range has the highest percentage of unemployed individuals, with 10.9% or 57 of them being unemployed.
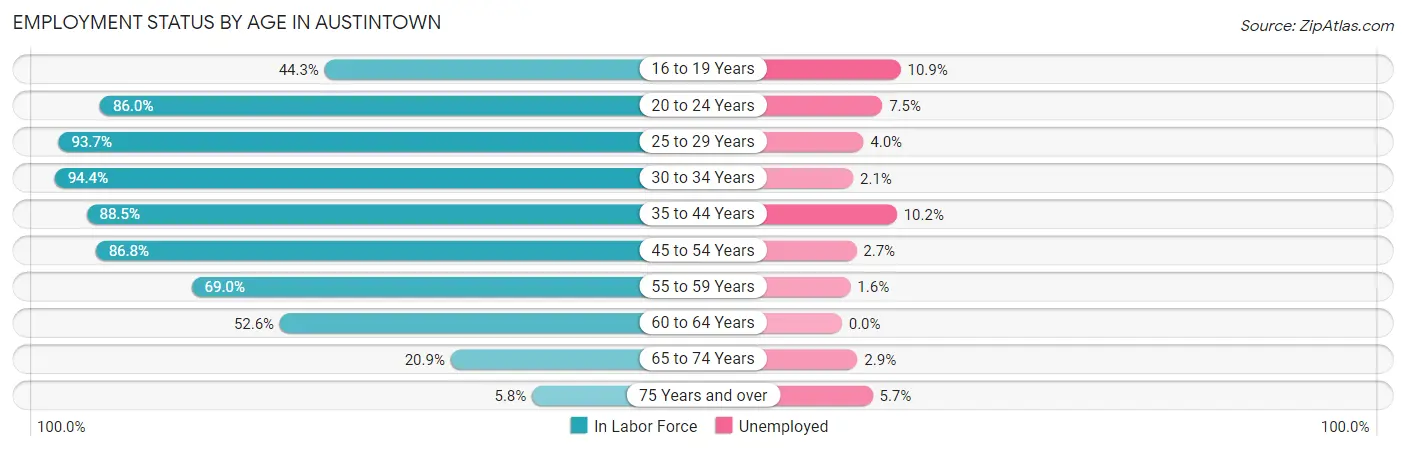
| Age Bracket | In Labor Force | Unemployed |
| 16 to 19 Years | 523 (44.3%) | 57 (10.9%) |
| 20 to 24 Years | 1,956 (86.0%) | 147 (7.5%) |
| 25 to 29 Years | 2,068 (93.7%) | 83 (4.0%) |
| 30 to 34 Years | 2,090 (94.4%) | 44 (2.1%) |
| 35 to 44 Years | 3,084 (88.5%) | 315 (10.2%) |
| 45 to 54 Years | 3,217 (86.8%) | 87 (2.7%) |
| 55 to 59 Years | 1,176 (69.0%) | 19 (1.6%) |
| 60 to 64 Years | 1,199 (52.6%) | 0 (0.0%) |
| 65 to 74 Years | 825 (20.9%) | 24 (2.9%) |
| 75 Years and over | 175 (5.8%) | 10 (5.7%) |
| Total | 16,313 (62.7%) | 783 (4.8%) |
Employment Status by Educational Attainment in Austintown
According to labor force statistics for Austintown, 82.3% of individuals (12,836) out of the total population between 25 and 64 years of age (15,597) are in the labor force, with 4.3% or 552 of them being unemployed. The group with the highest labor force participation rate are those with the educational attainment of bachelor's degree or higher, with 93.5% or 3,245 individuals in the labor force. Within the labor force, individuals with less than high school education have the highest percentage of unemployment, with 13.0% or 82 of them being unemployed.
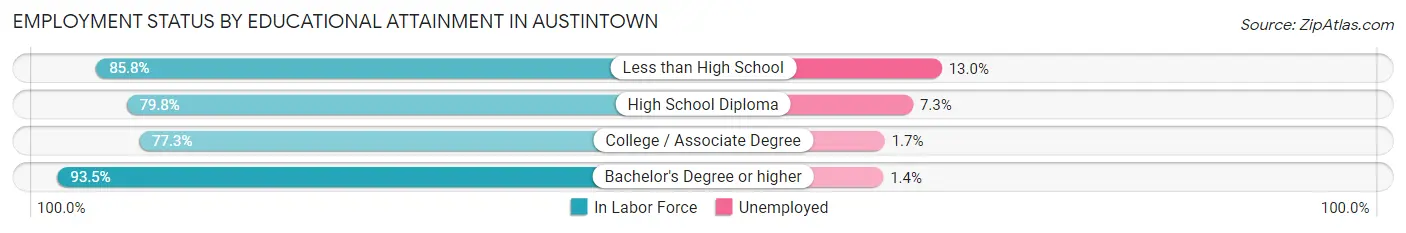
| Educational Attainment | In Labor Force | Unemployed |
| Less than High School | 632 (85.8%) | 96 (13.0%) |
| High School Diploma | 4,774 (79.8%) | 437 (7.3%) |
| College / Associate Degree | 4,180 (77.3%) | 92 (1.7%) |
| Bachelor's Degree or higher | 3,245 (93.5%) | 49 (1.4%) |
| Total | 12,836 (82.3%) | 671 (4.3%) |
Employment Occupations by Sex in Austintown
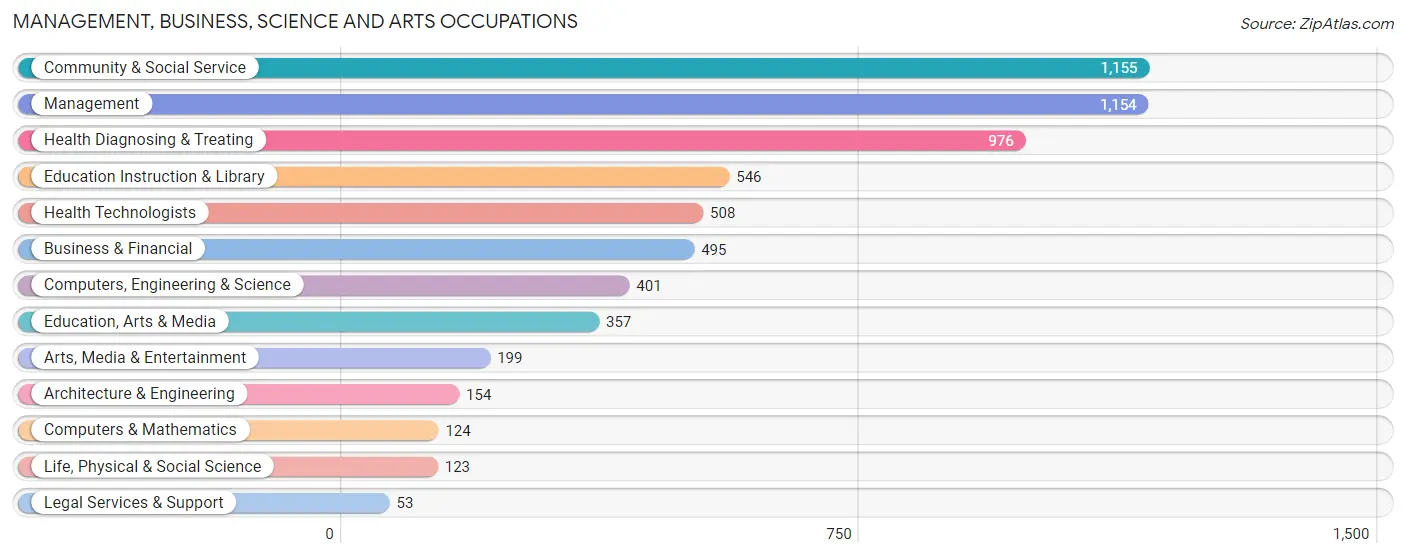
Management, Business, Science and Arts Occupations
The most common Management, Business, Science and Arts occupations in Austintown are Community & Social Service (1,155 | 7.4%), Management (1,154 | 7.4%), Health Diagnosing & Treating (976 | 6.3%), Education Instruction & Library (546 | 3.5%), and Health Technologists (508 | 3.3%).
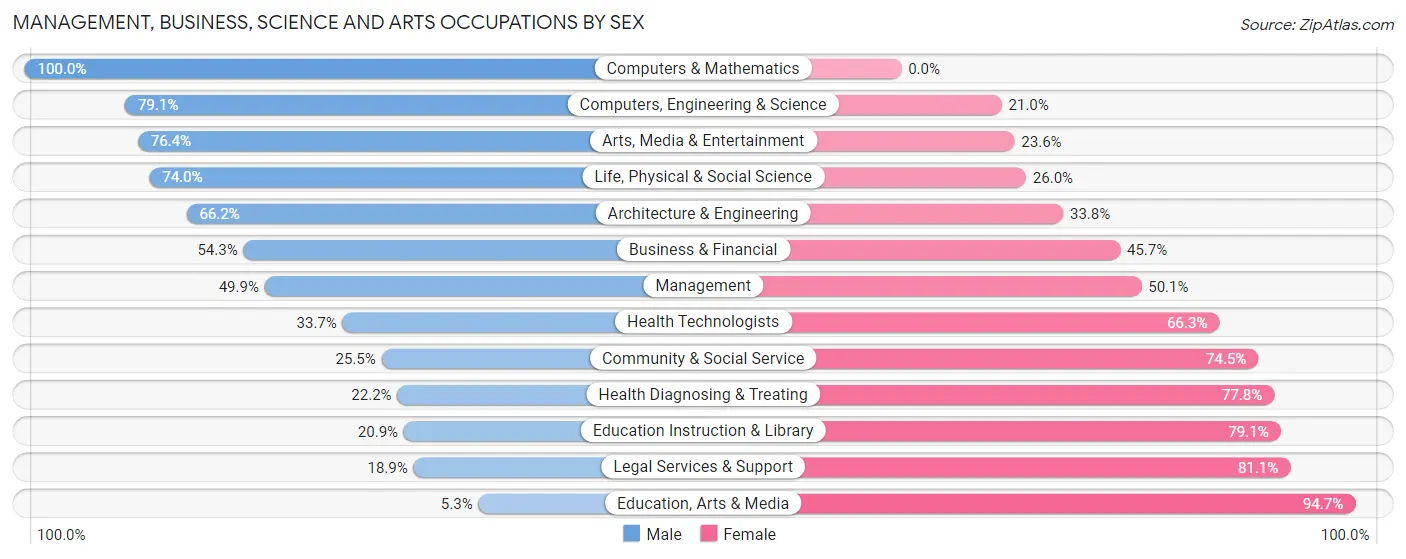
Management, Business, Science and Arts Occupations by Sex
Within the Management, Business, Science and Arts occupations in Austintown, the most male-oriented occupations are Computers & Mathematics (100.0%), Computers, Engineering & Science (79.0%), and Arts, Media & Entertainment (76.4%), while the most female-oriented occupations are Education, Arts & Media (94.7%), Legal Services & Support (81.1%), and Education Instruction & Library (79.1%).
| Occupation | Male | Female |
| Management | 576 (49.9%) | 578 (50.1%) |
| Business & Financial | 269 (54.3%) | 226 (45.7%) |
| Computers, Engineering & Science | 317 (79.0%) | 84 (20.9%) |
| Computers & Mathematics | 124 (100.0%) | 0 (0.0%) |
| Architecture & Engineering | 102 (66.2%) | 52 (33.8%) |
| Life, Physical & Social Science | 91 (74.0%) | 32 (26.0%) |
| Community & Social Service | 295 (25.5%) | 860 (74.5%) |
| Education, Arts & Media | 19 (5.3%) | 338 (94.7%) |
| Legal Services & Support | 10 (18.9%) | 43 (81.1%) |
| Education Instruction & Library | 114 (20.9%) | 432 (79.1%) |
| Arts, Media & Entertainment | 152 (76.4%) | 47 (23.6%) |
| Health Diagnosing & Treating | 217 (22.2%) | 759 (77.8%) |
| Health Technologists | 171 (33.7%) | 337 (66.3%) |
| Total (Category) | 1,674 (40.0%) | 2,507 (60.0%) |
| Total (Overall) | 7,691 (49.5%) | 7,836 (50.5%) |
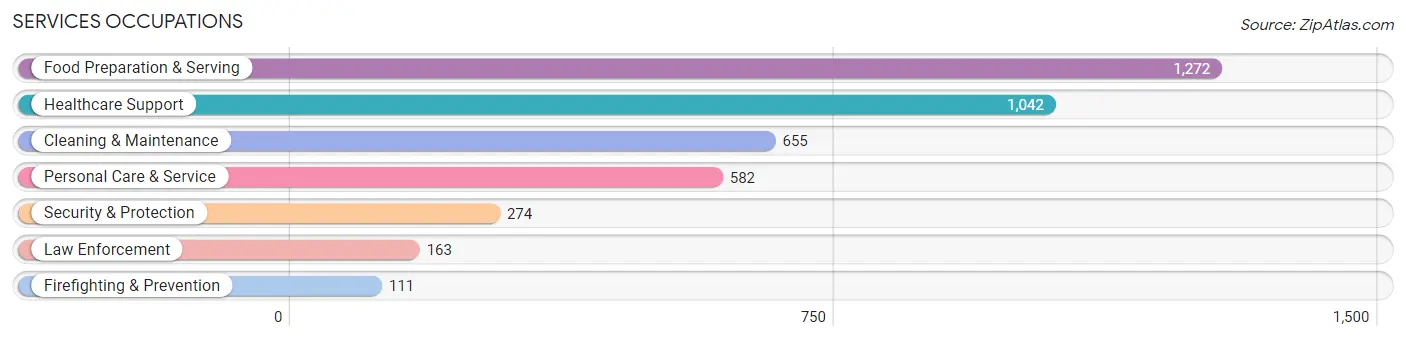
Services Occupations
The most common Services occupations in Austintown are Food Preparation & Serving (1,272 | 8.2%), Healthcare Support (1,042 | 6.7%), Cleaning & Maintenance (655 | 4.2%), Personal Care & Service (582 | 3.7%), and Security & Protection (274 | 1.8%).
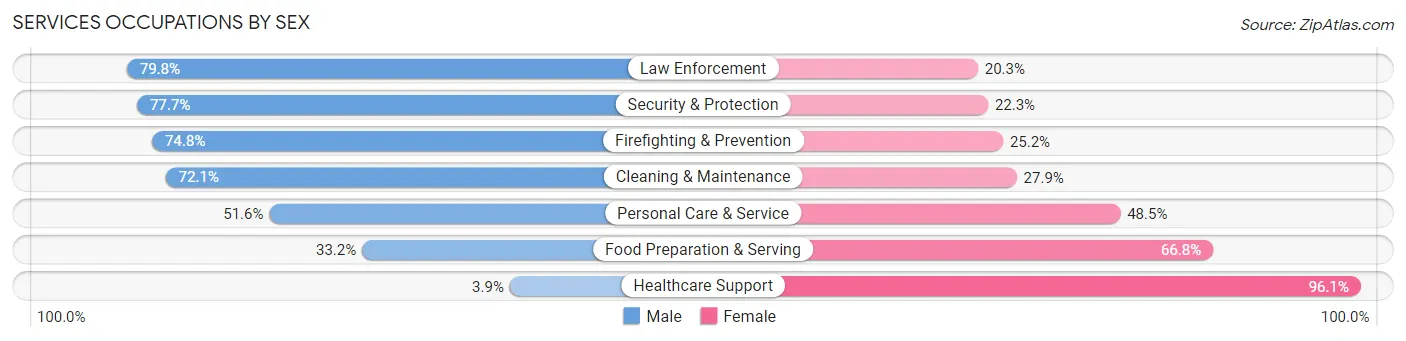
Services Occupations by Sex
Within the Services occupations in Austintown, the most male-oriented occupations are Law Enforcement (79.7%), Security & Protection (77.7%), and Firefighting & Prevention (74.8%), while the most female-oriented occupations are Healthcare Support (96.1%), Food Preparation & Serving (66.8%), and Personal Care & Service (48.4%).
| Occupation | Male | Female |
| Healthcare Support | 41 (3.9%) | 1,001 (96.1%) |
| Security & Protection | 213 (77.7%) | 61 (22.3%) |
| Firefighting & Prevention | 83 (74.8%) | 28 (25.2%) |
| Law Enforcement | 130 (79.7%) | 33 (20.3%) |
| Food Preparation & Serving | 422 (33.2%) | 850 (66.8%) |
| Cleaning & Maintenance | 472 (72.1%) | 183 (27.9%) |
| Personal Care & Service | 300 (51.5%) | 282 (48.4%) |
| Total (Category) | 1,448 (37.9%) | 2,377 (62.1%) |
| Total (Overall) | 7,691 (49.5%) | 7,836 (50.5%) |
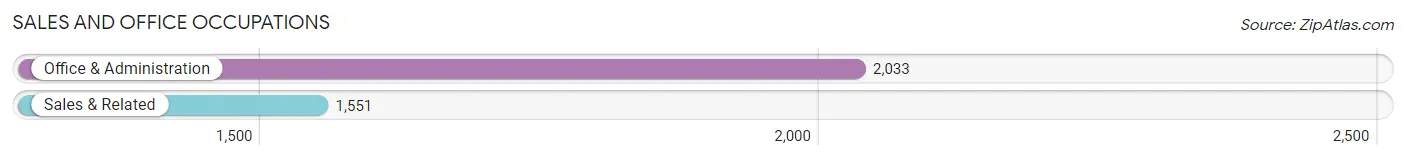
Sales and Office Occupations
The most common Sales and Office occupations in Austintown are Office & Administration (2,033 | 13.1%), and Sales & Related (1,551 | 10.0%).
Sales and Office Occupations by Sex
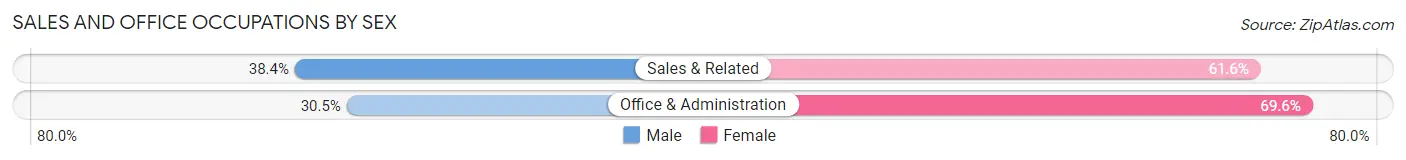
| Occupation | Male | Female |
| Sales & Related | 596 (38.4%) | 955 (61.6%) |
| Office & Administration | 619 (30.4%) | 1,414 (69.6%) |
| Total (Category) | 1,215 (33.9%) | 2,369 (66.1%) |
| Total (Overall) | 7,691 (49.5%) | 7,836 (50.5%) |
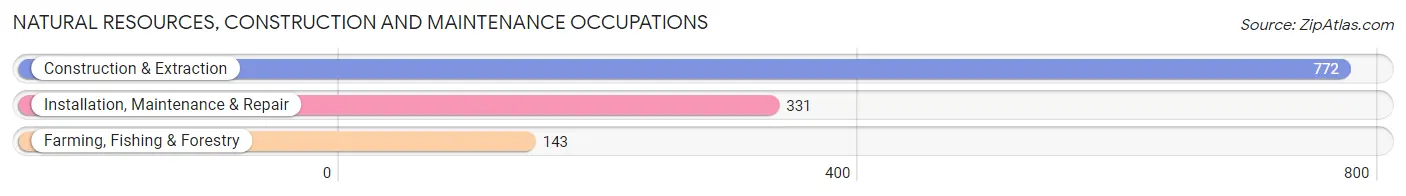
Natural Resources, Construction and Maintenance Occupations
The most common Natural Resources, Construction and Maintenance occupations in Austintown are Construction & Extraction (772 | 5.0%), Installation, Maintenance & Repair (331 | 2.1%), and Farming, Fishing & Forestry (143 | 0.9%).
Natural Resources, Construction and Maintenance Occupations by Sex
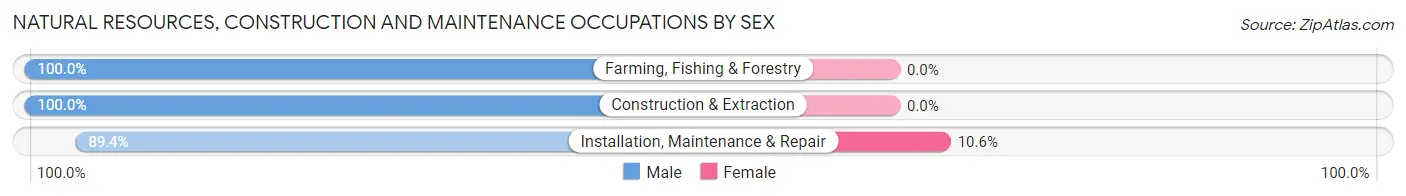
| Occupation | Male | Female |
| Farming, Fishing & Forestry | 143 (100.0%) | 0 (0.0%) |
| Construction & Extraction | 772 (100.0%) | 0 (0.0%) |
| Installation, Maintenance & Repair | 296 (89.4%) | 35 (10.6%) |
| Total (Category) | 1,211 (97.2%) | 35 (2.8%) |
| Total (Overall) | 7,691 (49.5%) | 7,836 (50.5%) |
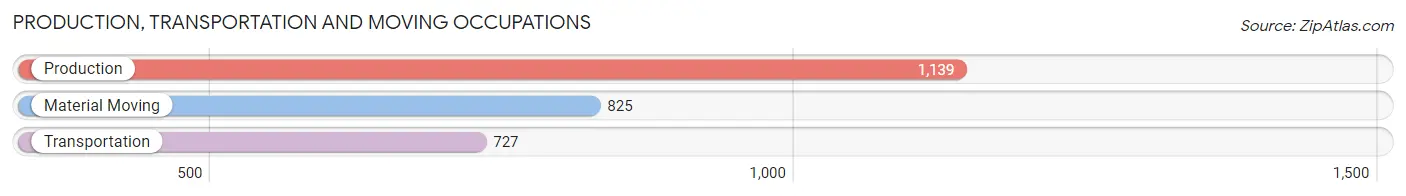
Production, Transportation and Moving Occupations
The most common Production, Transportation and Moving occupations in Austintown are Production (1,139 | 7.3%), Material Moving (825 | 5.3%), and Transportation (727 | 4.7%).
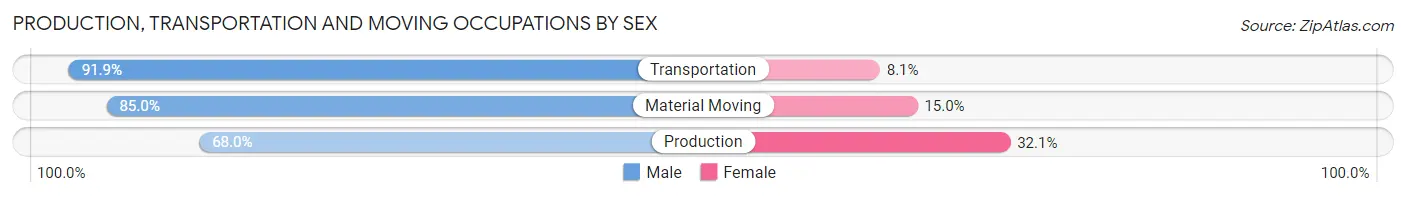
Production, Transportation and Moving Occupations by Sex
| Occupation | Male | Female |
| Production | 774 (67.9%) | 365 (32.1%) |
| Transportation | 668 (91.9%) | 59 (8.1%) |
| Material Moving | 701 (85.0%) | 124 (15.0%) |
| Total (Category) | 2,143 (79.6%) | 548 (20.4%) |
| Total (Overall) | 7,691 (49.5%) | 7,836 (50.5%) |
Employment Industries by Sex in Austintown
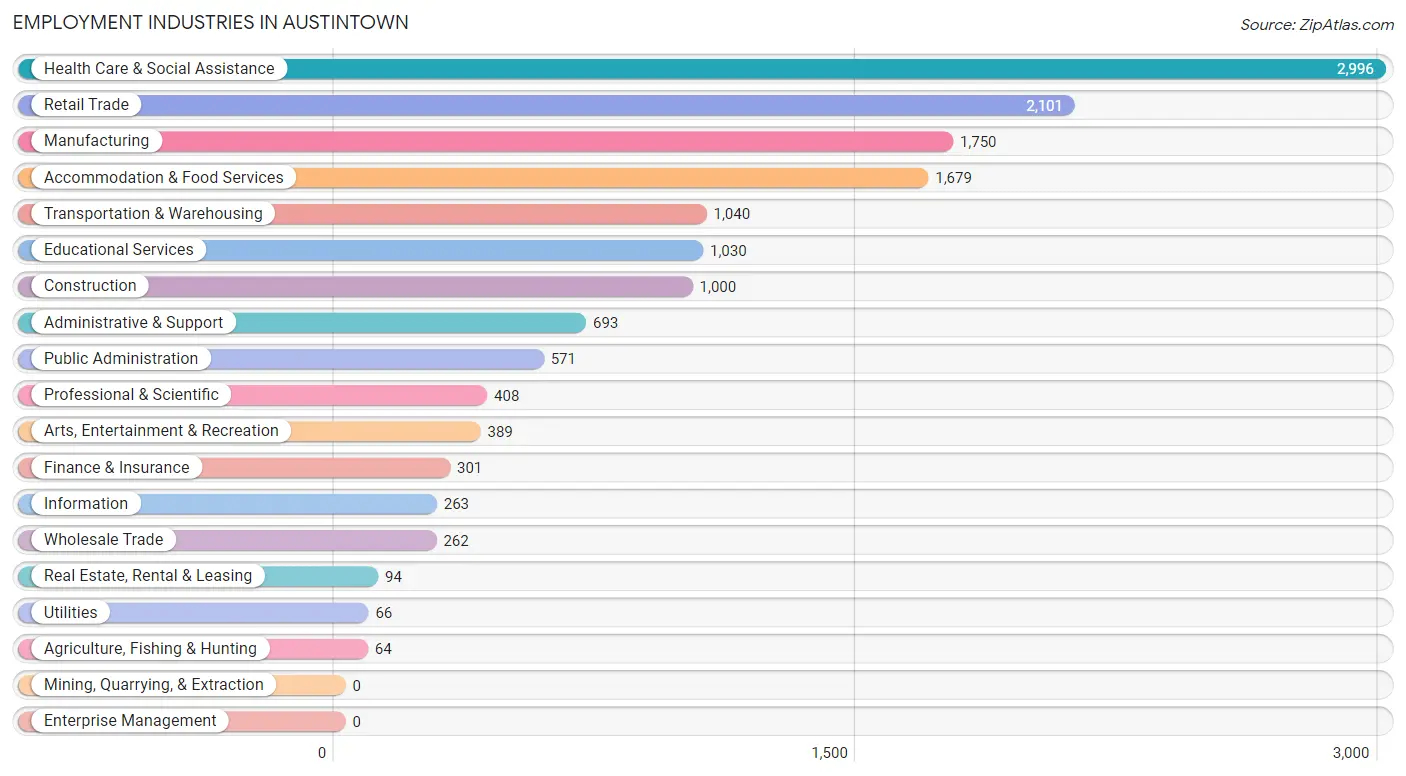
Employment Industries in Austintown
The major employment industries in Austintown include Health Care & Social Assistance (2,996 | 19.3%), Retail Trade (2,101 | 13.5%), Manufacturing (1,750 | 11.3%), Accommodation & Food Services (1,679 | 10.8%), and Transportation & Warehousing (1,040 | 6.7%).
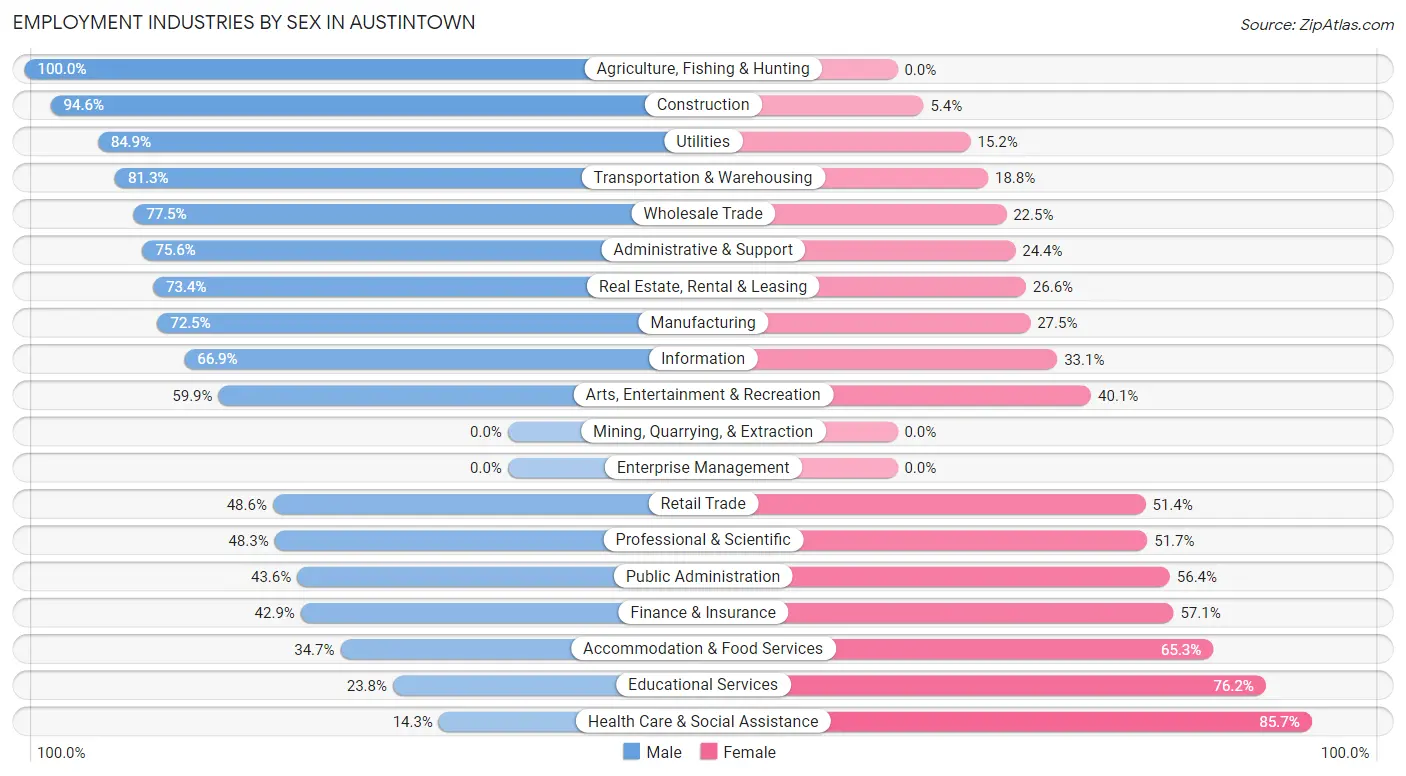
Employment Industries by Sex in Austintown
The Austintown industries that see more men than women are Agriculture, Fishing & Hunting (100.0%), Construction (94.6%), and Utilities (84.9%), whereas the industries that tend to have a higher number of women are Health Care & Social Assistance (85.7%), Educational Services (76.2%), and Accommodation & Food Services (65.3%).
| Industry | Male | Female |
| Agriculture, Fishing & Hunting | 64 (100.0%) | 0 (0.0%) |
| Mining, Quarrying, & Extraction | 0 (0.0%) | 0 (0.0%) |
| Construction | 946 (94.6%) | 54 (5.4%) |
| Manufacturing | 1,269 (72.5%) | 481 (27.5%) |
| Wholesale Trade | 203 (77.5%) | 59 (22.5%) |
| Retail Trade | 1,022 (48.6%) | 1,079 (51.4%) |
| Transportation & Warehousing | 845 (81.2%) | 195 (18.8%) |
| Utilities | 56 (84.9%) | 10 (15.1%) |
| Information | 176 (66.9%) | 87 (33.1%) |
| Finance & Insurance | 129 (42.9%) | 172 (57.1%) |
| Real Estate, Rental & Leasing | 69 (73.4%) | 25 (26.6%) |
| Professional & Scientific | 197 (48.3%) | 211 (51.7%) |
| Enterprise Management | 0 (0.0%) | 0 (0.0%) |
| Administrative & Support | 524 (75.6%) | 169 (24.4%) |
| Educational Services | 245 (23.8%) | 785 (76.2%) |
| Health Care & Social Assistance | 428 (14.3%) | 2,568 (85.7%) |
| Arts, Entertainment & Recreation | 233 (59.9%) | 156 (40.1%) |
| Accommodation & Food Services | 582 (34.7%) | 1,097 (65.3%) |
| Public Administration | 249 (43.6%) | 322 (56.4%) |
| Total | 7,691 (49.5%) | 7,836 (50.5%) |
Education in Austintown
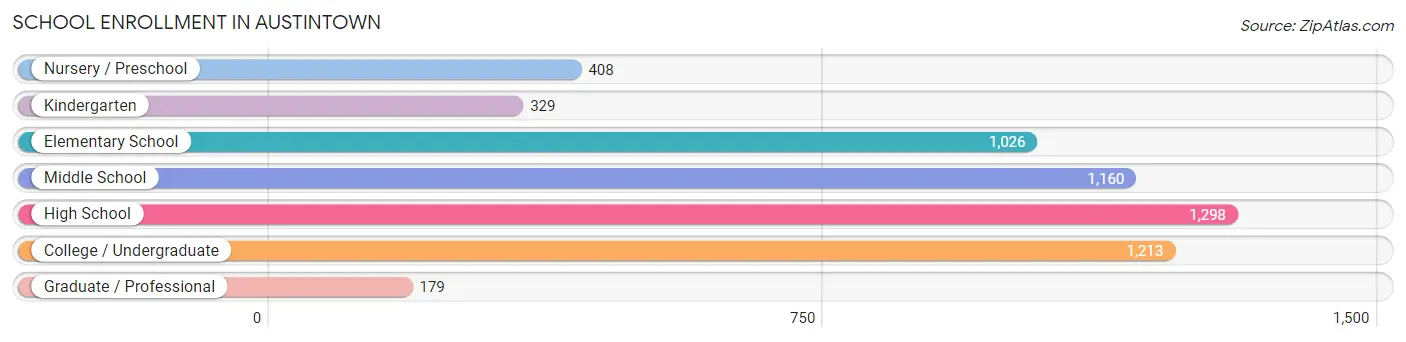
School Enrollment in Austintown
The most common levels of schooling among the 5,613 students in Austintown are high school (1,298 | 23.1%), college / undergraduate (1,213 | 21.6%), and middle school (1,160 | 20.7%).
| School Level | # Students | % Students |
| Nursery / Preschool | 408 | 7.3% |
| Kindergarten | 329 | 5.9% |
| Elementary School | 1,026 | 18.3% |
| Middle School | 1,160 | 20.7% |
| High School | 1,298 | 23.1% |
| College / Undergraduate | 1,213 | 21.6% |
| Graduate / Professional | 179 | 3.2% |
| Total | 5,613 | 100.0% |
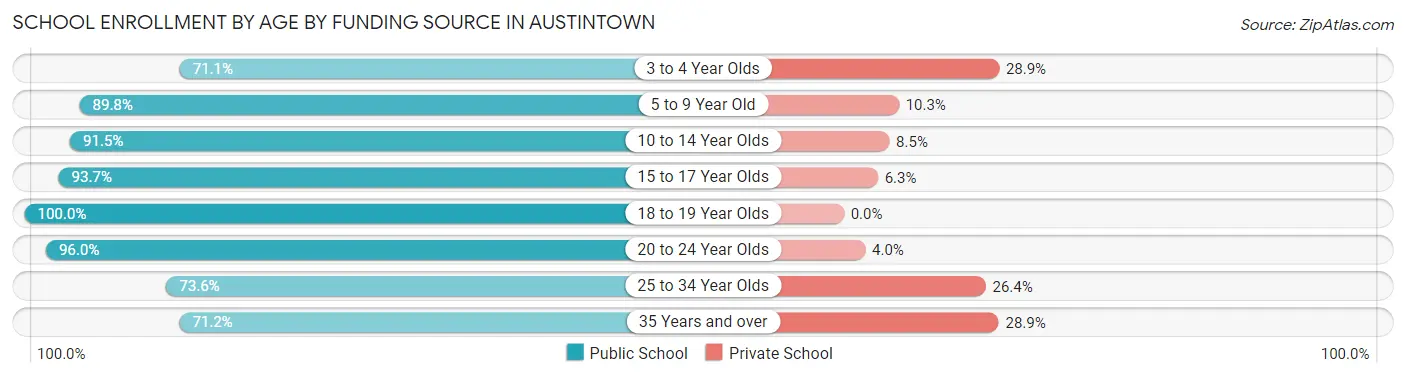
School Enrollment by Age by Funding Source in Austintown
Out of a total of 5,613 students who are enrolled in schools in Austintown, 601 (10.7%) attend a private institution, while the remaining 5,012 (89.3%) are enrolled in public schools. The age group of 3 to 4 year olds has the highest likelihood of being enrolled in private schools, with 107 (28.9% in the age bracket) enrolled. Conversely, the age group of 18 to 19 year olds has the lowest likelihood of being enrolled in a private school, with 314 (100.0% in the age bracket) attending a public institution.
| Age Bracket | Public School | Private School |
| 3 to 4 Year Olds | 263 (71.1%) | 107 (28.9%) |
| 5 to 9 Year Old | 1,173 (89.7%) | 134 (10.2%) |
| 10 to 14 Year Olds | 1,157 (91.5%) | 107 (8.5%) |
| 15 to 17 Year Olds | 1,004 (93.7%) | 68 (6.3%) |
| 18 to 19 Year Olds | 314 (100.0%) | 0 (0.0%) |
| 20 to 24 Year Olds | 697 (96.0%) | 29 (4.0%) |
| 25 to 34 Year Olds | 259 (73.6%) | 93 (26.4%) |
| 35 Years and over | 148 (71.2%) | 60 (28.8%) |
| Total | 5,012 (89.3%) | 601 (10.7%) |
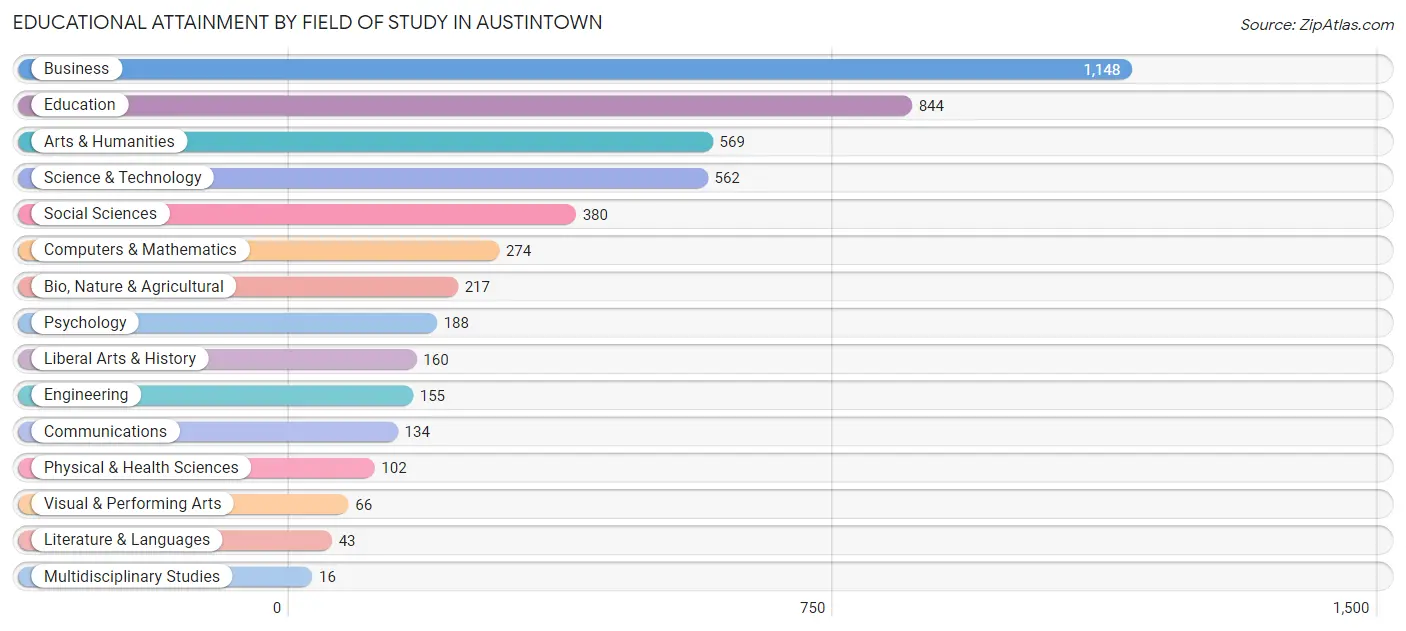
Educational Attainment by Field of Study in Austintown
Business (1,148 | 23.6%), education (844 | 17.4%), arts & humanities (569 | 11.7%), science & technology (562 | 11.6%), and social sciences (380 | 7.8%) are the most common fields of study among 4,858 individuals in Austintown who have obtained a bachelor's degree or higher.
| Field of Study | # Graduates | % Graduates |
| Computers & Mathematics | 274 | 5.6% |
| Bio, Nature & Agricultural | 217 | 4.5% |
| Physical & Health Sciences | 102 | 2.1% |
| Psychology | 188 | 3.9% |
| Social Sciences | 380 | 7.8% |
| Engineering | 155 | 3.2% |
| Multidisciplinary Studies | 16 | 0.3% |
| Science & Technology | 562 | 11.6% |
| Business | 1,148 | 23.6% |
| Education | 844 | 17.4% |
| Literature & Languages | 43 | 0.9% |
| Liberal Arts & History | 160 | 3.3% |
| Visual & Performing Arts | 66 | 1.4% |
| Communications | 134 | 2.8% |
| Arts & Humanities | 569 | 11.7% |
| Total | 4,858 | 100.0% |
Transportation & Commute in Austintown
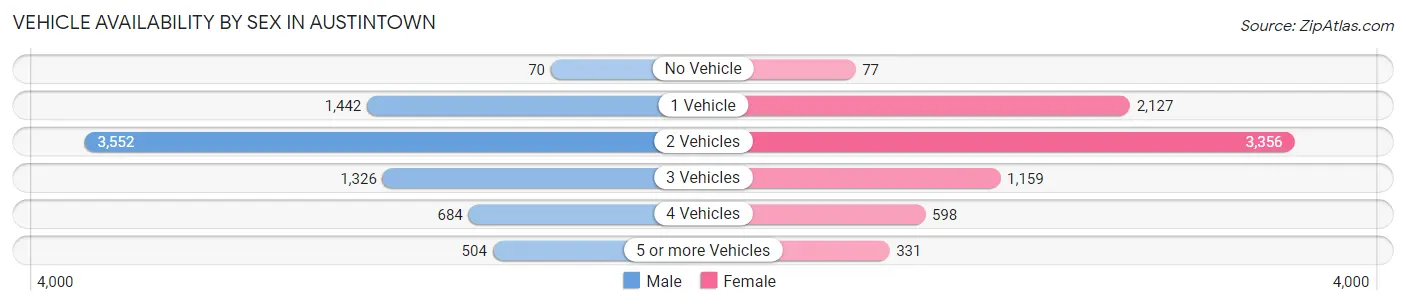
Vehicle Availability by Sex in Austintown
The most prevalent vehicle ownership categories in Austintown are males with 2 vehicles (3,552, accounting for 46.9%) and females with 2 vehicles (3,356, making up 46.4%).
| Vehicles Available | Male | Female |
| No Vehicle | 70 (0.9%) | 77 (1.0%) |
| 1 Vehicle | 1,442 (19.0%) | 2,127 (27.8%) |
| 2 Vehicles | 3,552 (46.9%) | 3,356 (43.9%) |
| 3 Vehicles | 1,326 (17.5%) | 1,159 (15.1%) |
| 4 Vehicles | 684 (9.0%) | 598 (7.8%) |
| 5 or more Vehicles | 504 (6.7%) | 331 (4.3%) |
| Total | 7,578 (100.0%) | 7,648 (100.0%) |
Commute Time in Austintown
The most frequently occuring commute durations in Austintown are 15 to 19 minutes (3,274 commuters, 22.3%), 10 to 14 minutes (2,606 commuters, 17.7%), and 20 to 24 minutes (2,529 commuters, 17.2%).
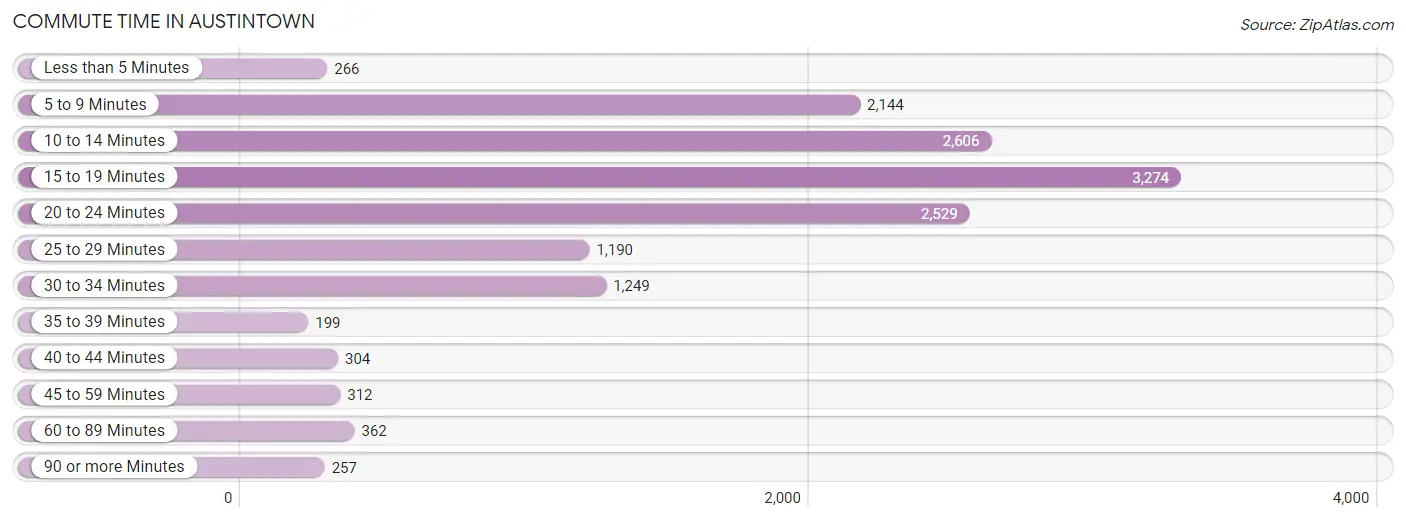
| Commute Time | # Commuters | % Commuters |
| Less than 5 Minutes | 266 | 1.8% |
| 5 to 9 Minutes | 2,144 | 14.6% |
| 10 to 14 Minutes | 2,606 | 17.7% |
| 15 to 19 Minutes | 3,274 | 22.3% |
| 20 to 24 Minutes | 2,529 | 17.2% |
| 25 to 29 Minutes | 1,190 | 8.1% |
| 30 to 34 Minutes | 1,249 | 8.5% |
| 35 to 39 Minutes | 199 | 1.3% |
| 40 to 44 Minutes | 304 | 2.1% |
| 45 to 59 Minutes | 312 | 2.1% |
| 60 to 89 Minutes | 362 | 2.5% |
| 90 or more Minutes | 257 | 1.8% |
Commute Time by Sex in Austintown
The most common commute times in Austintown are 15 to 19 minutes (1,824 commuters, 25.0%) for males and 15 to 19 minutes (1,450 commuters, 19.6%) for females.
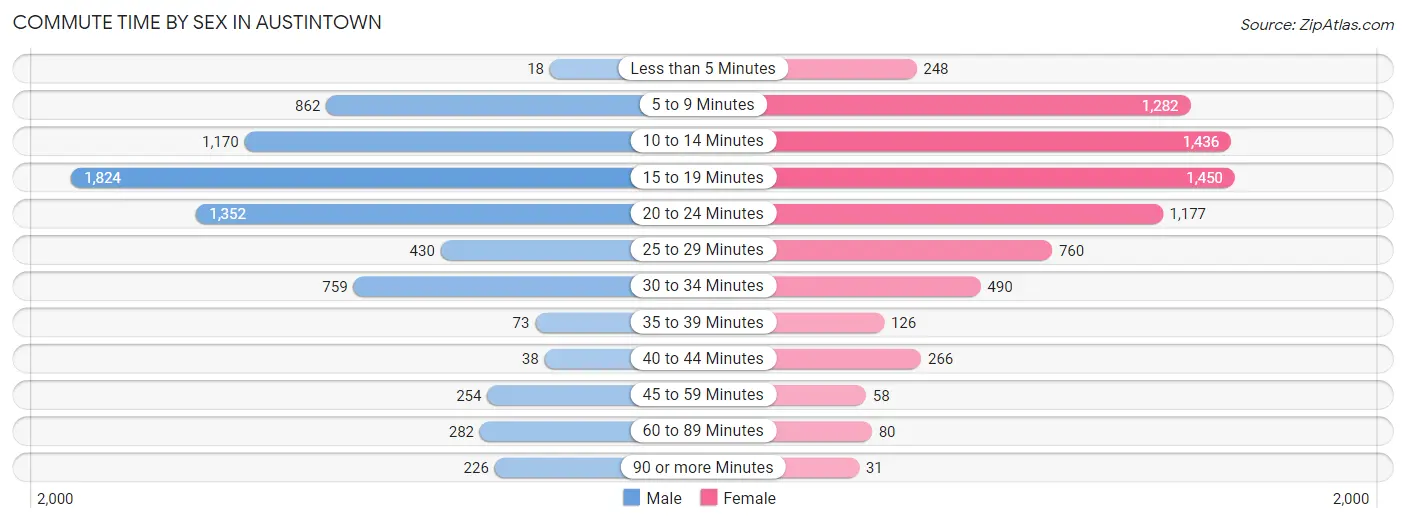
| Commute Time | Male | Female |
| Less than 5 Minutes | 18 (0.3%) | 248 (3.4%) |
| 5 to 9 Minutes | 862 (11.8%) | 1,282 (17.3%) |
| 10 to 14 Minutes | 1,170 (16.1%) | 1,436 (19.4%) |
| 15 to 19 Minutes | 1,824 (25.0%) | 1,450 (19.6%) |
| 20 to 24 Minutes | 1,352 (18.5%) | 1,177 (15.9%) |
| 25 to 29 Minutes | 430 (5.9%) | 760 (10.3%) |
| 30 to 34 Minutes | 759 (10.4%) | 490 (6.6%) |
| 35 to 39 Minutes | 73 (1.0%) | 126 (1.7%) |
| 40 to 44 Minutes | 38 (0.5%) | 266 (3.6%) |
| 45 to 59 Minutes | 254 (3.5%) | 58 (0.8%) |
| 60 to 89 Minutes | 282 (3.9%) | 80 (1.1%) |
| 90 or more Minutes | 226 (3.1%) | 31 (0.4%) |
Time of Departure to Work by Sex in Austintown
The most frequent times of departure to work in Austintown are 12:00 PM to 3:59 PM (1,033, 14.2%) for males and 7:30 AM to 7:59 AM (1,435, 19.4%) for females.
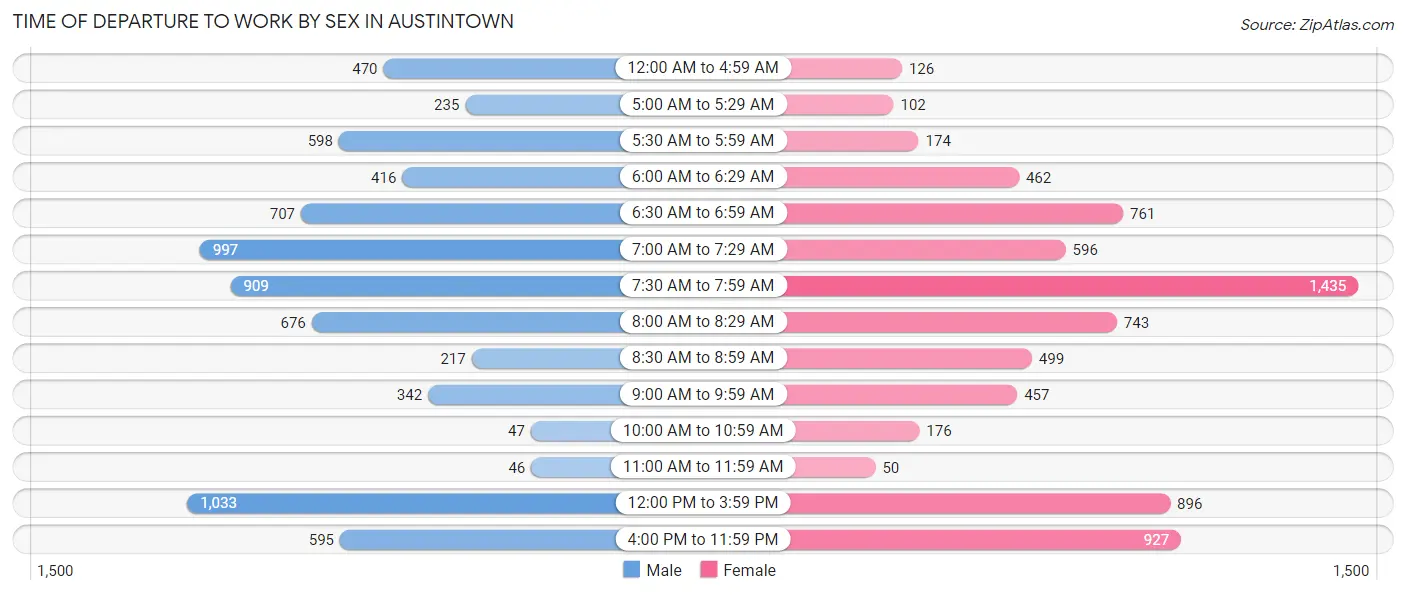
| Time of Departure | Male | Female |
| 12:00 AM to 4:59 AM | 470 (6.5%) | 126 (1.7%) |
| 5:00 AM to 5:29 AM | 235 (3.2%) | 102 (1.4%) |
| 5:30 AM to 5:59 AM | 598 (8.2%) | 174 (2.4%) |
| 6:00 AM to 6:29 AM | 416 (5.7%) | 462 (6.2%) |
| 6:30 AM to 6:59 AM | 707 (9.7%) | 761 (10.3%) |
| 7:00 AM to 7:29 AM | 997 (13.7%) | 596 (8.1%) |
| 7:30 AM to 7:59 AM | 909 (12.5%) | 1,435 (19.4%) |
| 8:00 AM to 8:29 AM | 676 (9.3%) | 743 (10.0%) |
| 8:30 AM to 8:59 AM | 217 (3.0%) | 499 (6.7%) |
| 9:00 AM to 9:59 AM | 342 (4.7%) | 457 (6.2%) |
| 10:00 AM to 10:59 AM | 47 (0.6%) | 176 (2.4%) |
| 11:00 AM to 11:59 AM | 46 (0.6%) | 50 (0.7%) |
| 12:00 PM to 3:59 PM | 1,033 (14.2%) | 896 (12.1%) |
| 4:00 PM to 11:59 PM | 595 (8.2%) | 927 (12.5%) |
| Total | 7,288 (100.0%) | 7,404 (100.0%) |
Housing Occupancy in Austintown
Occupancy by Ownership in Austintown
Of the total 14,111 dwellings in Austintown, owner-occupied units account for 9,080 (64.3%), while renter-occupied units make up 5,031 (35.6%).
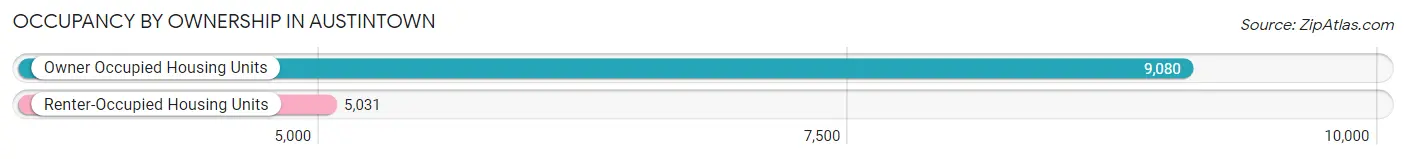
| Occupancy | # Housing Units | % Housing Units |
| Owner Occupied Housing Units | 9,080 | 64.3% |
| Renter-Occupied Housing Units | 5,031 | 35.6% |
| Total Occupied Housing Units | 14,111 | 100.0% |
Occupancy by Household Size in Austintown
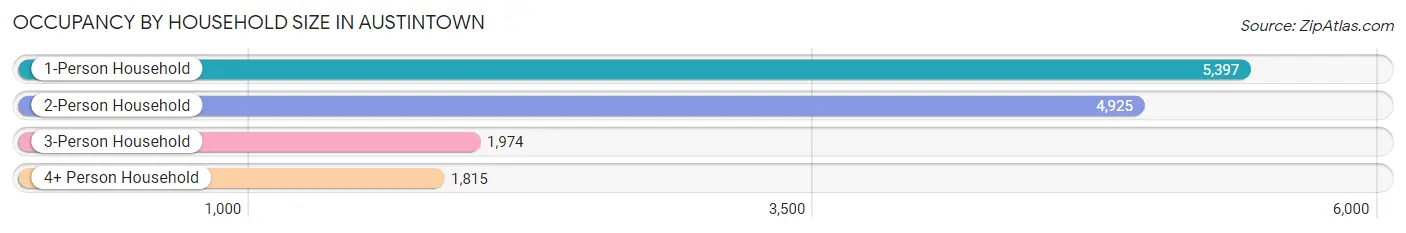
| Household Size | # Housing Units | % Housing Units |
| 1-Person Household | 5,397 | 38.3% |
| 2-Person Household | 4,925 | 34.9% |
| 3-Person Household | 1,974 | 14.0% |
| 4+ Person Household | 1,815 | 12.9% |
| Total Housing Units | 14,111 | 100.0% |
Occupancy by Ownership by Household Size in Austintown
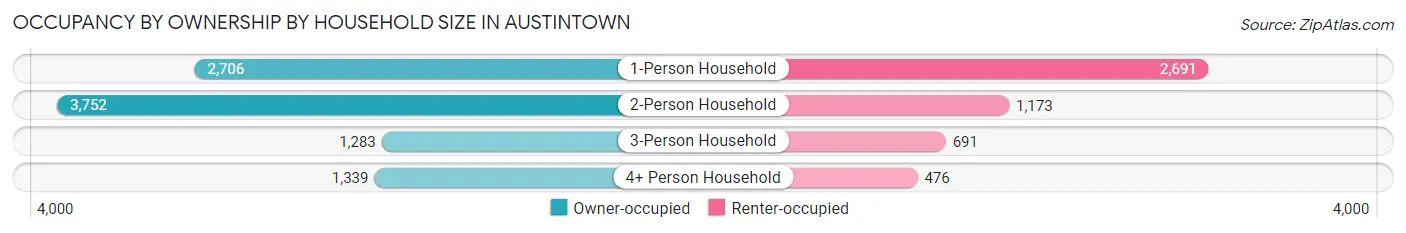
| Household Size | Owner-occupied | Renter-occupied |
| 1-Person Household | 2,706 (50.1%) | 2,691 (49.9%) |
| 2-Person Household | 3,752 (76.2%) | 1,173 (23.8%) |
| 3-Person Household | 1,283 (65.0%) | 691 (35.0%) |
| 4+ Person Household | 1,339 (73.8%) | 476 (26.2%) |
| Total Housing Units | 9,080 (64.3%) | 5,031 (35.6%) |
Occupancy by Educational Attainment in Austintown
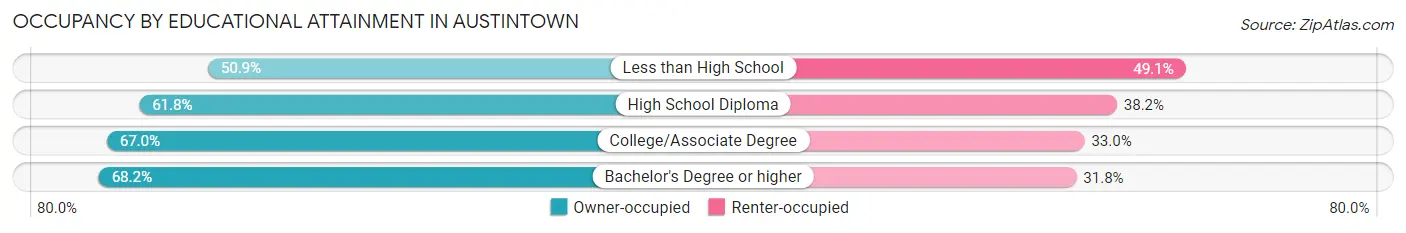
| Household Size | Owner-occupied | Renter-occupied |
| Less than High School | 409 (50.9%) | 394 (49.1%) |
| High School Diploma | 3,416 (61.8%) | 2,110 (38.2%) |
| College/Associate Degree | 2,892 (67.0%) | 1,427 (33.0%) |
| Bachelor's Degree or higher | 2,363 (68.2%) | 1,100 (31.8%) |
Occupancy by Age of Householder in Austintown
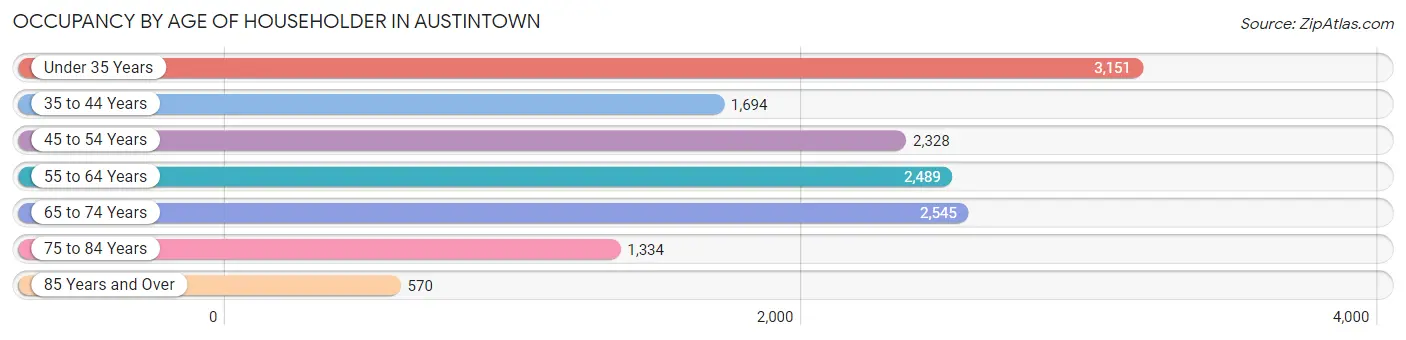
| Age Bracket | # Households | % Households |
| Under 35 Years | 3,151 | 22.3% |
| 35 to 44 Years | 1,694 | 12.0% |
| 45 to 54 Years | 2,328 | 16.5% |
| 55 to 64 Years | 2,489 | 17.6% |
| 65 to 74 Years | 2,545 | 18.0% |
| 75 to 84 Years | 1,334 | 9.5% |
| 85 Years and Over | 570 | 4.0% |
| Total | 14,111 | 100.0% |
Housing Finances in Austintown
Median Income by Occupancy in Austintown
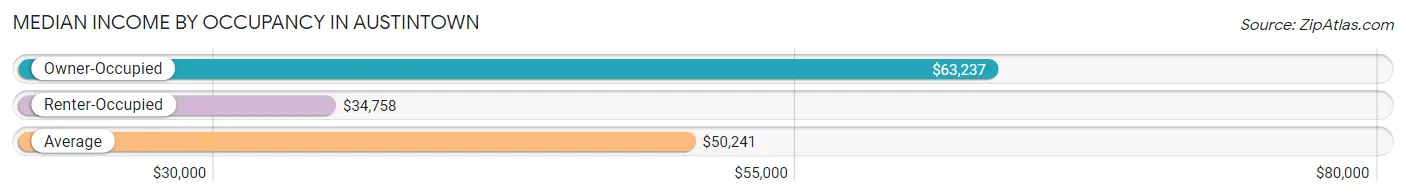
| Occupancy Type | # Households | Median Income |
| Owner-Occupied | 9,080 (64.3%) | $63,237 |
| Renter-Occupied | 5,031 (35.6%) | $34,758 |
| Average | 14,111 (100.0%) | $50,241 |
Occupancy by Householder Income Bracket in Austintown
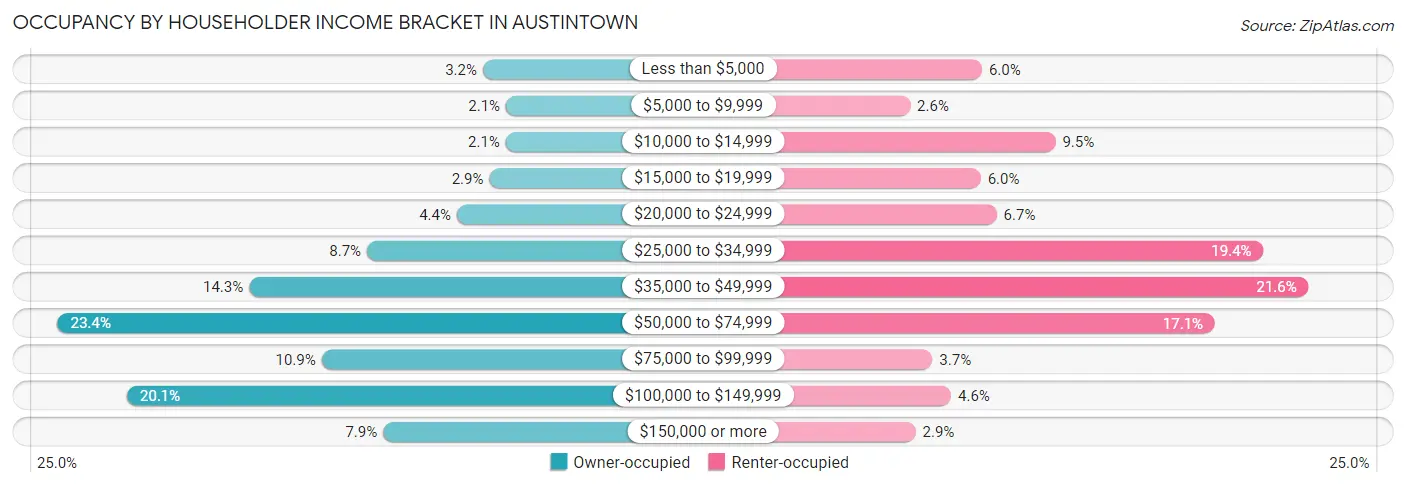
| Income Bracket | Owner-occupied | Renter-occupied |
| Less than $5,000 | 289 (3.2%) | 303 (6.0%) |
| $5,000 to $9,999 | 189 (2.1%) | 131 (2.6%) |
| $10,000 to $14,999 | 190 (2.1%) | 479 (9.5%) |
| $15,000 to $19,999 | 261 (2.9%) | 300 (6.0%) |
| $20,000 to $24,999 | 401 (4.4%) | 338 (6.7%) |
| $25,000 to $34,999 | 790 (8.7%) | 977 (19.4%) |
| $35,000 to $49,999 | 1,299 (14.3%) | 1,085 (21.6%) |
| $50,000 to $74,999 | 2,127 (23.4%) | 861 (17.1%) |
| $75,000 to $99,999 | 986 (10.9%) | 184 (3.7%) |
| $100,000 to $149,999 | 1,828 (20.1%) | 229 (4.5%) |
| $150,000 or more | 720 (7.9%) | 144 (2.9%) |
| Total | 9,080 (100.0%) | 5,031 (100.0%) |
Monthly Housing Cost Tiers in Austintown
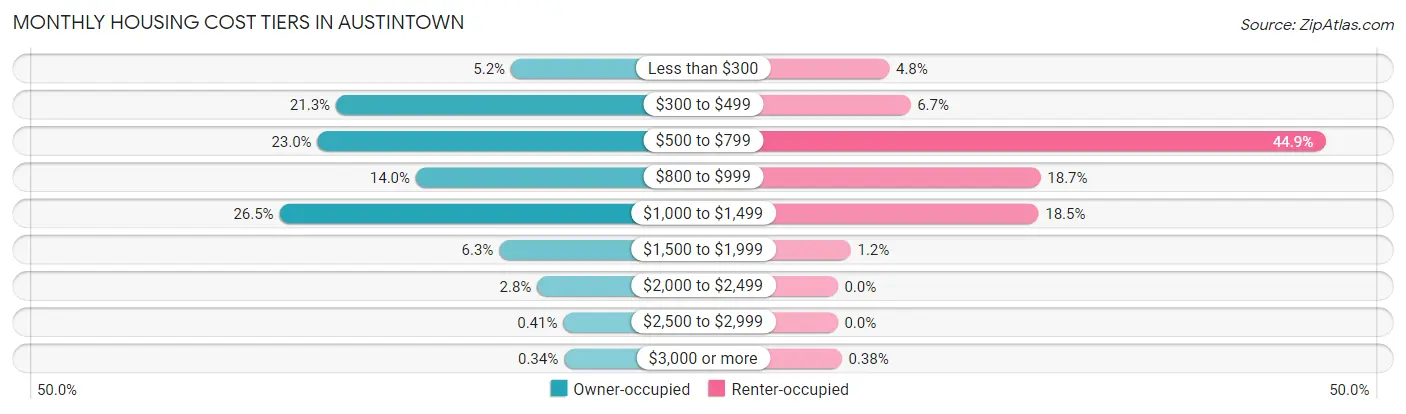
| Monthly Cost | Owner-occupied | Renter-occupied |
| Less than $300 | 475 (5.2%) | 239 (4.8%) |
| $300 to $499 | 1,938 (21.3%) | 337 (6.7%) |
| $500 to $799 | 2,092 (23.0%) | 2,258 (44.9%) |
| $800 to $999 | 1,269 (14.0%) | 940 (18.7%) |
| $1,000 to $1,499 | 2,410 (26.5%) | 930 (18.5%) |
| $1,500 to $1,999 | 573 (6.3%) | 61 (1.2%) |
| $2,000 to $2,499 | 255 (2.8%) | 0 (0.0%) |
| $2,500 to $2,999 | 37 (0.4%) | 0 (0.0%) |
| $3,000 or more | 31 (0.3%) | 19 (0.4%) |
| Total | 9,080 (100.0%) | 5,031 (100.0%) |
Physical Housing Characteristics in Austintown
Housing Structures in Austintown
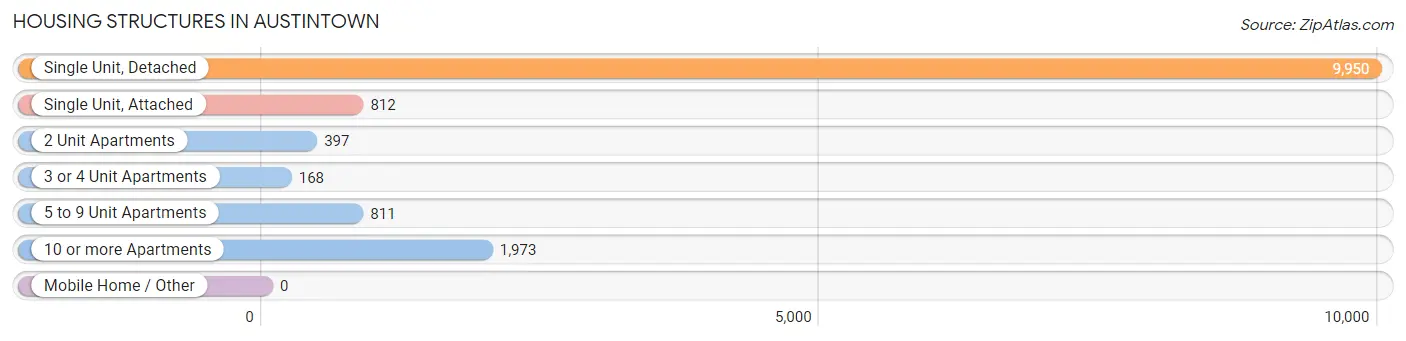
| Structure Type | # Housing Units | % Housing Units |
| Single Unit, Detached | 9,950 | 70.5% |
| Single Unit, Attached | 812 | 5.8% |
| 2 Unit Apartments | 397 | 2.8% |
| 3 or 4 Unit Apartments | 168 | 1.2% |
| 5 to 9 Unit Apartments | 811 | 5.8% |
| 10 or more Apartments | 1,973 | 14.0% |
| Mobile Home / Other | 0 | 0.0% |
| Total | 14,111 | 100.0% |
Housing Structures by Occupancy in Austintown
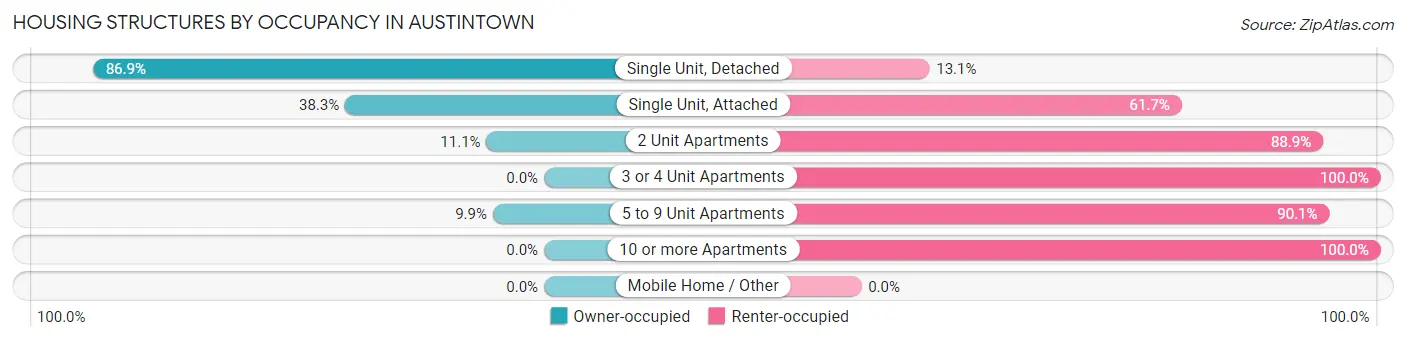
| Structure Type | Owner-occupied | Renter-occupied |
| Single Unit, Detached | 8,645 (86.9%) | 1,305 (13.1%) |
| Single Unit, Attached | 311 (38.3%) | 501 (61.7%) |
| 2 Unit Apartments | 44 (11.1%) | 353 (88.9%) |
| 3 or 4 Unit Apartments | 0 (0.0%) | 168 (100.0%) |
| 5 to 9 Unit Apartments | 80 (9.9%) | 731 (90.1%) |
| 10 or more Apartments | 0 (0.0%) | 1,973 (100.0%) |
| Mobile Home / Other | 0 (0.0%) | 0 (0.0%) |
| Total | 9,080 (64.3%) | 5,031 (35.6%) |
Housing Structures by Number of Rooms in Austintown
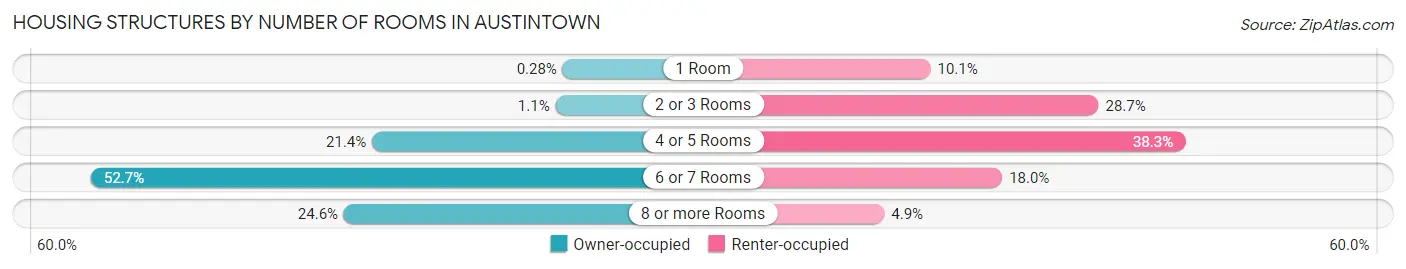
| Number of Rooms | Owner-occupied | Renter-occupied |
| 1 Room | 25 (0.3%) | 506 (10.1%) |
| 2 or 3 Rooms | 98 (1.1%) | 1,444 (28.7%) |
| 4 or 5 Rooms | 1,946 (21.4%) | 1,927 (38.3%) |
| 6 or 7 Rooms | 4,781 (52.6%) | 906 (18.0%) |
| 8 or more Rooms | 2,230 (24.6%) | 248 (4.9%) |
| Total | 9,080 (100.0%) | 5,031 (100.0%) |
Housing Structure by Heating Type in Austintown
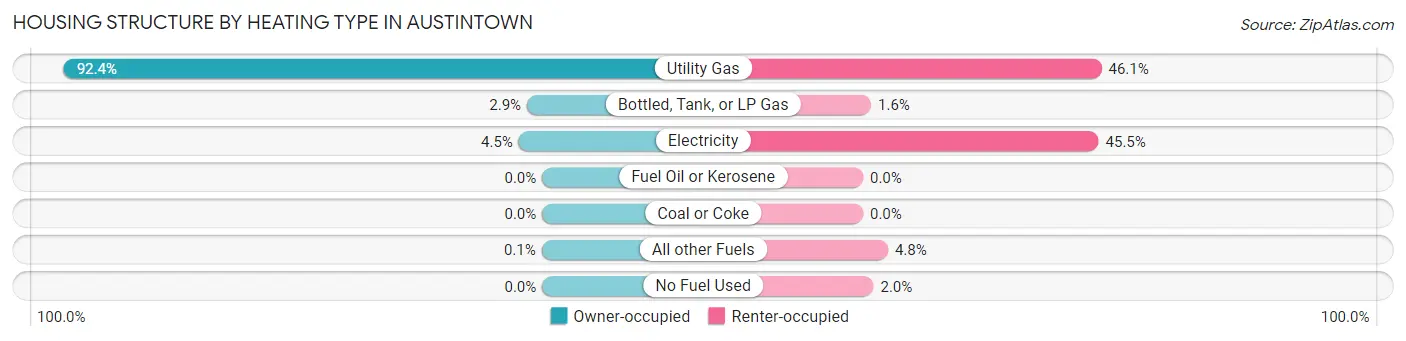
| Heating Type | Owner-occupied | Renter-occupied |
| Utility Gas | 8,394 (92.4%) | 2,319 (46.1%) |
| Bottled, Tank, or LP Gas | 267 (2.9%) | 78 (1.5%) |
| Electricity | 410 (4.5%) | 2,290 (45.5%) |
| Fuel Oil or Kerosene | 0 (0.0%) | 0 (0.0%) |
| Coal or Coke | 0 (0.0%) | 0 (0.0%) |
| All other Fuels | 9 (0.1%) | 242 (4.8%) |
| No Fuel Used | 0 (0.0%) | 102 (2.0%) |
| Total | 9,080 (100.0%) | 5,031 (100.0%) |
Household Vehicle Usage in Austintown
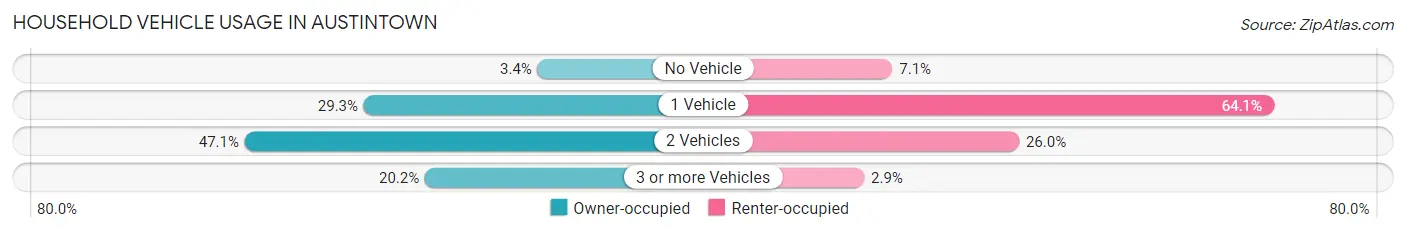
| Vehicles per Household | Owner-occupied | Renter-occupied |
| No Vehicle | 306 (3.4%) | 356 (7.1%) |
| 1 Vehicle | 2,663 (29.3%) | 3,223 (64.1%) |
| 2 Vehicles | 4,278 (47.1%) | 1,308 (26.0%) |
| 3 or more Vehicles | 1,833 (20.2%) | 144 (2.9%) |
| Total | 9,080 (100.0%) | 5,031 (100.0%) |
Real Estate & Mortgages in Austintown
Real Estate and Mortgage Overview in Austintown
| Characteristic | Without Mortgage | With Mortgage |
| Housing Units | 4,021 | 5,059 |
| Median Property Value | $115,800 | $126,300 |
| Median Household Income | $45,533 | $487 |
| Monthly Housing Costs | $458 | $23 |
| Real Estate Taxes | $1,597 | $173 |
Property Value by Mortgage Status in Austintown
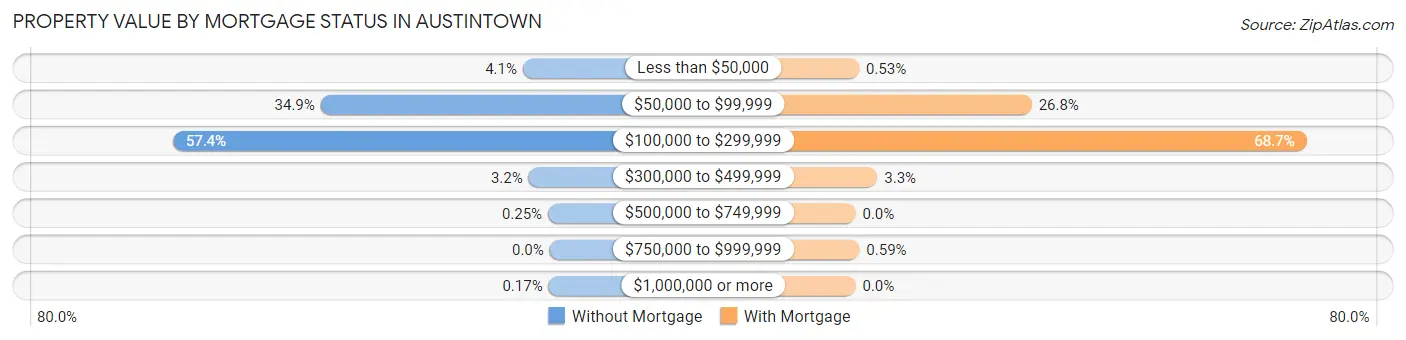
| Property Value | Without Mortgage | With Mortgage |
| Less than $50,000 | 164 (4.1%) | 27 (0.5%) |
| $50,000 to $99,999 | 1,403 (34.9%) | 1,358 (26.8%) |
| $100,000 to $299,999 | 2,308 (57.4%) | 3,476 (68.7%) |
| $300,000 to $499,999 | 129 (3.2%) | 168 (3.3%) |
| $500,000 to $749,999 | 10 (0.3%) | 0 (0.0%) |
| $750,000 to $999,999 | 0 (0.0%) | 30 (0.6%) |
| $1,000,000 or more | 7 (0.2%) | 0 (0.0%) |
| Total | 4,021 (100.0%) | 5,059 (100.0%) |
Household Income by Mortgage Status in Austintown
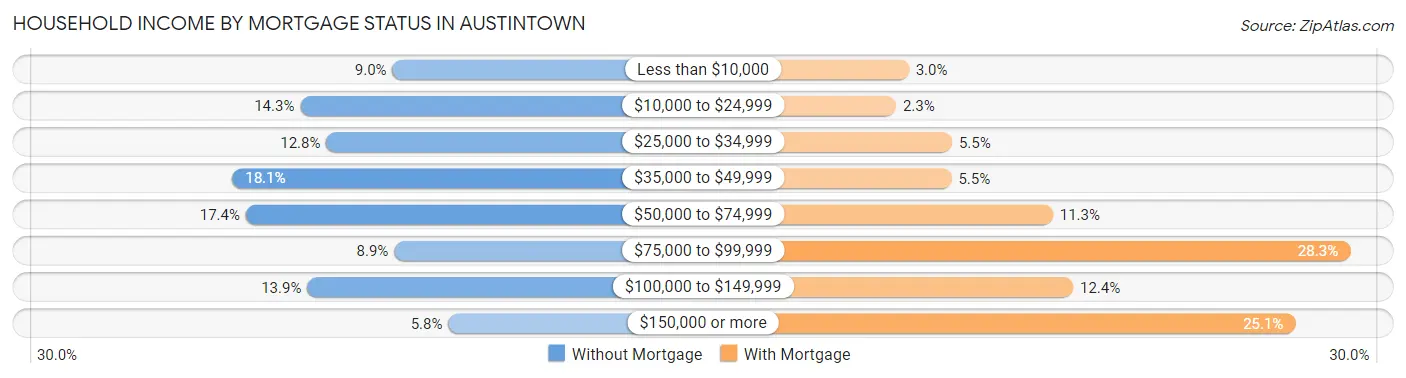
| Household Income | Without Mortgage | With Mortgage |
| Less than $10,000 | 361 (9.0%) | 154 (3.0%) |
| $10,000 to $24,999 | 573 (14.2%) | 117 (2.3%) |
| $25,000 to $34,999 | 513 (12.8%) | 279 (5.5%) |
| $35,000 to $49,999 | 729 (18.1%) | 277 (5.5%) |
| $50,000 to $74,999 | 698 (17.4%) | 570 (11.3%) |
| $75,000 to $99,999 | 357 (8.9%) | 1,429 (28.2%) |
| $100,000 to $149,999 | 557 (13.9%) | 629 (12.4%) |
| $150,000 or more | 233 (5.8%) | 1,271 (25.1%) |
| Total | 4,021 (100.0%) | 5,059 (100.0%) |
Property Value to Household Income Ratio in Austintown
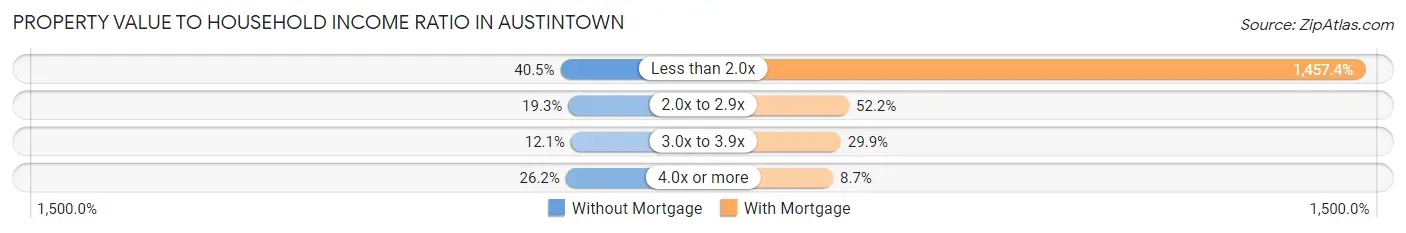
| Value-to-Income Ratio | Without Mortgage | With Mortgage |
| Less than 2.0x | 1,629 (40.5%) | 73,732 (1,457.4%) |
| 2.0x to 2.9x | 776 (19.3%) | 2,641 (52.2%) |
| 3.0x to 3.9x | 485 (12.1%) | 1,510 (29.8%) |
| 4.0x or more | 1,055 (26.2%) | 440 (8.7%) |
| Total | 4,021 (100.0%) | 5,059 (100.0%) |
Real Estate Taxes by Mortgage Status in Austintown
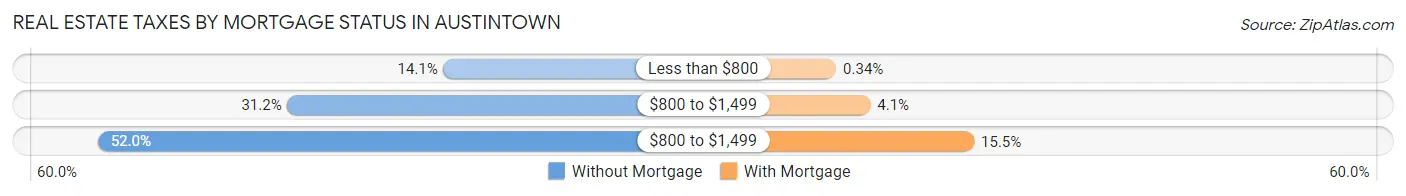
| Property Taxes | Without Mortgage | With Mortgage |
| Less than $800 | 566 (14.1%) | 17 (0.3%) |
| $800 to $1,499 | 1,254 (31.2%) | 207 (4.1%) |
| $800 to $1,499 | 2,090 (52.0%) | 782 (15.5%) |
| Total | 4,021 (100.0%) | 5,059 (100.0%) |
Health & Disability in Austintown
Health Insurance Coverage by Age in Austintown
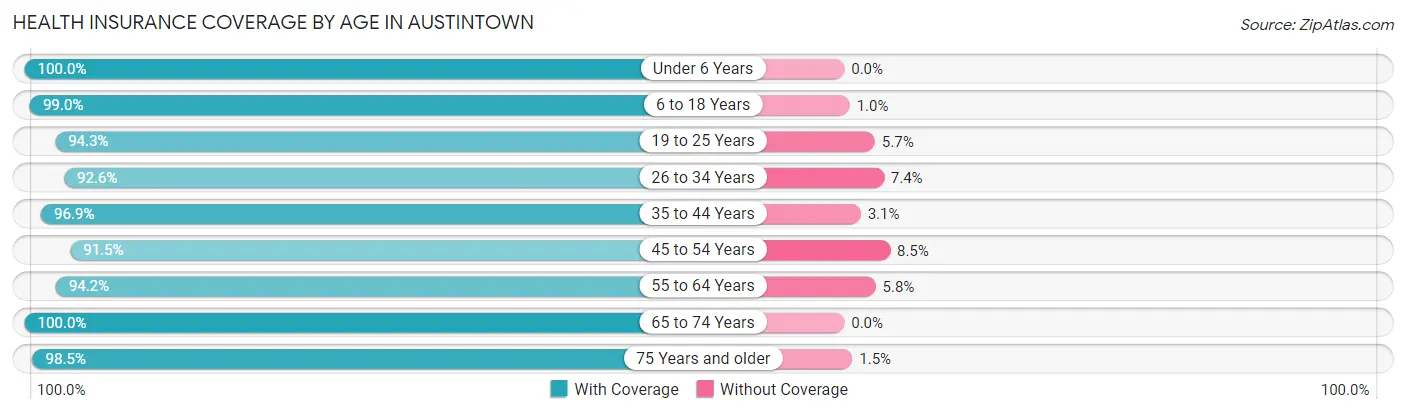
| Age Bracket | With Coverage | Without Coverage |
| Under 6 Years | 1,614 (100.0%) | 0 (0.0%) |
| 6 to 18 Years | 3,642 (99.0%) | 37 (1.0%) |
| 19 to 25 Years | 2,924 (94.3%) | 177 (5.7%) |
| 26 to 34 Years | 3,568 (92.6%) | 284 (7.4%) |
| 35 to 44 Years | 3,378 (96.9%) | 107 (3.1%) |
| 45 to 54 Years | 3,390 (91.5%) | 316 (8.5%) |
| 55 to 64 Years | 3,740 (94.2%) | 232 (5.8%) |
| 65 to 74 Years | 3,888 (100.0%) | 0 (0.0%) |
| 75 Years and older | 2,755 (98.5%) | 42 (1.5%) |
| Total | 28,899 (96.0%) | 1,195 (4.0%) |
Health Insurance Coverage by Citizenship Status in Austintown
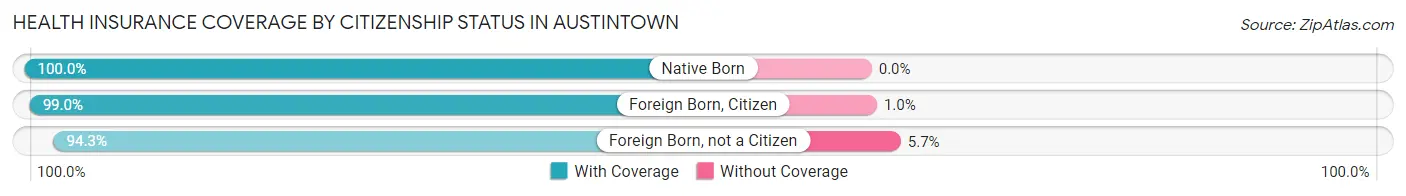
| Citizenship Status | With Coverage | Without Coverage |
| Native Born | 1,614 (100.0%) | 0 (0.0%) |
| Foreign Born, Citizen | 3,642 (99.0%) | 37 (1.0%) |
| Foreign Born, not a Citizen | 2,924 (94.3%) | 177 (5.7%) |
Health Insurance Coverage by Household Income in Austintown
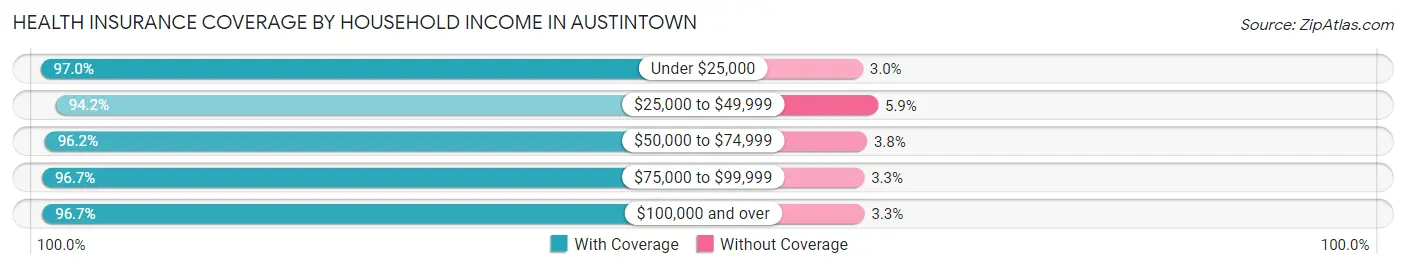
| Household Income | With Coverage | Without Coverage |
| Under $25,000 | 4,289 (97.0%) | 133 (3.0%) |
| $25,000 to $49,999 | 6,820 (94.2%) | 424 (5.9%) |
| $50,000 to $74,999 | 5,934 (96.2%) | 233 (3.8%) |
| $75,000 to $99,999 | 3,205 (96.7%) | 108 (3.3%) |
| $100,000 and over | 8,584 (96.7%) | 295 (3.3%) |
Public vs Private Health Insurance Coverage by Age in Austintown
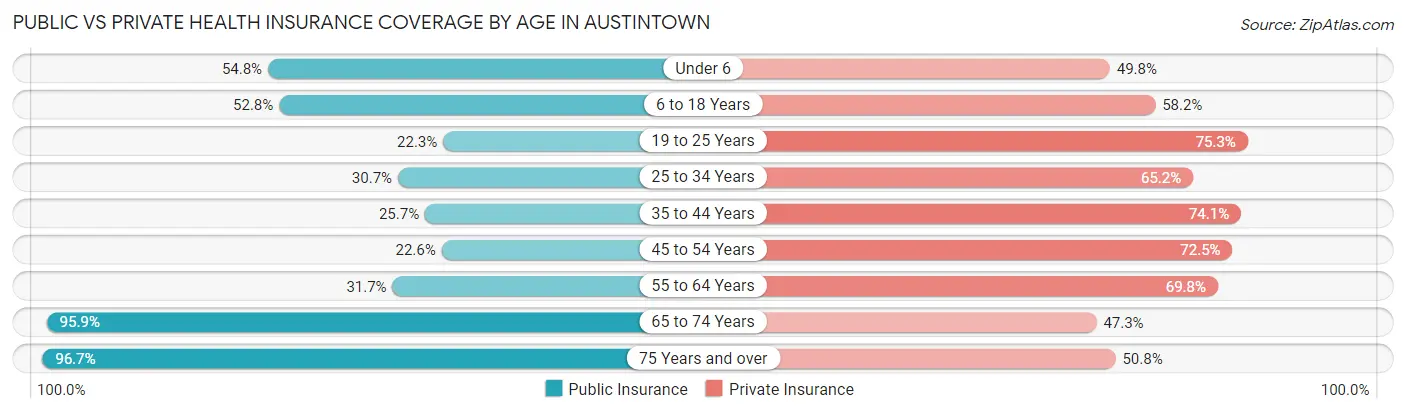
| Age Bracket | Public Insurance | Private Insurance |
| Under 6 | 885 (54.8%) | 803 (49.7%) |
| 6 to 18 Years | 1,941 (52.8%) | 2,140 (58.2%) |
| 19 to 25 Years | 692 (22.3%) | 2,336 (75.3%) |
| 25 to 34 Years | 1,183 (30.7%) | 2,511 (65.2%) |
| 35 to 44 Years | 895 (25.7%) | 2,582 (74.1%) |
| 45 to 54 Years | 838 (22.6%) | 2,687 (72.5%) |
| 55 to 64 Years | 1,260 (31.7%) | 2,772 (69.8%) |
| 65 to 74 Years | 3,729 (95.9%) | 1,838 (47.3%) |
| 75 Years and over | 2,705 (96.7%) | 1,421 (50.8%) |
| Total | 14,128 (46.9%) | 19,090 (63.4%) |
Disability Status by Sex by Age in Austintown
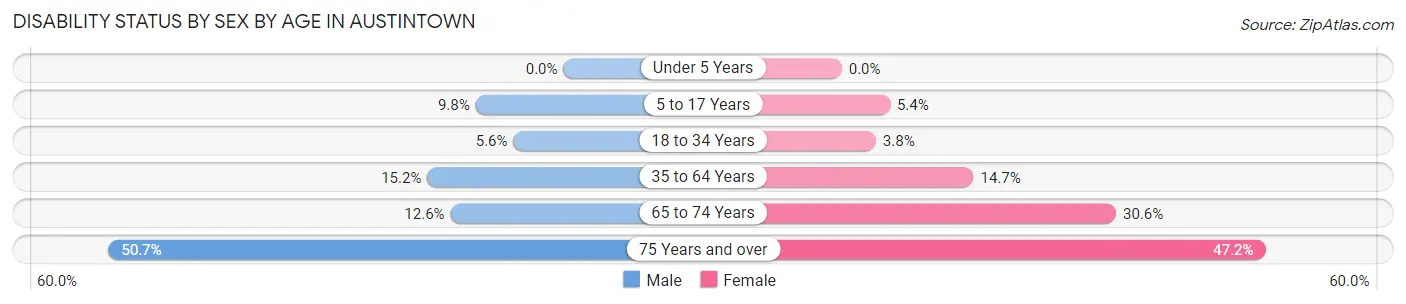
| Age Bracket | Male | Female |
| Under 5 Years | 0 (0.0%) | 0 (0.0%) |
| 5 to 17 Years | 180 (9.8%) | 103 (5.4%) |
| 18 to 34 Years | 195 (5.6%) | 140 (3.8%) |
| 35 to 64 Years | 829 (15.2%) | 836 (14.7%) |
| 65 to 74 Years | 198 (12.6%) | 707 (30.5%) |
| 75 Years and over | 604 (50.7%) | 757 (47.2%) |
Disability Class by Sex by Age in Austintown
Disability Class: Hearing Difficulty
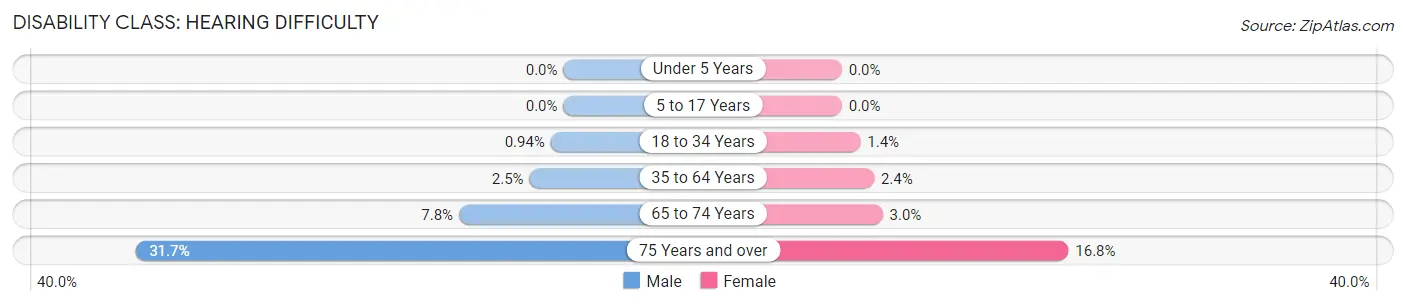
| Age Bracket | Male | Female |
| Under 5 Years | 0 (0.0%) | 0 (0.0%) |
| 5 to 17 Years | 0 (0.0%) | 0 (0.0%) |
| 18 to 34 Years | 33 (0.9%) | 51 (1.4%) |
| 35 to 64 Years | 138 (2.5%) | 136 (2.4%) |
| 65 to 74 Years | 122 (7.7%) | 70 (3.0%) |
| 75 Years and over | 378 (31.7%) | 270 (16.8%) |
Disability Class: Vision Difficulty
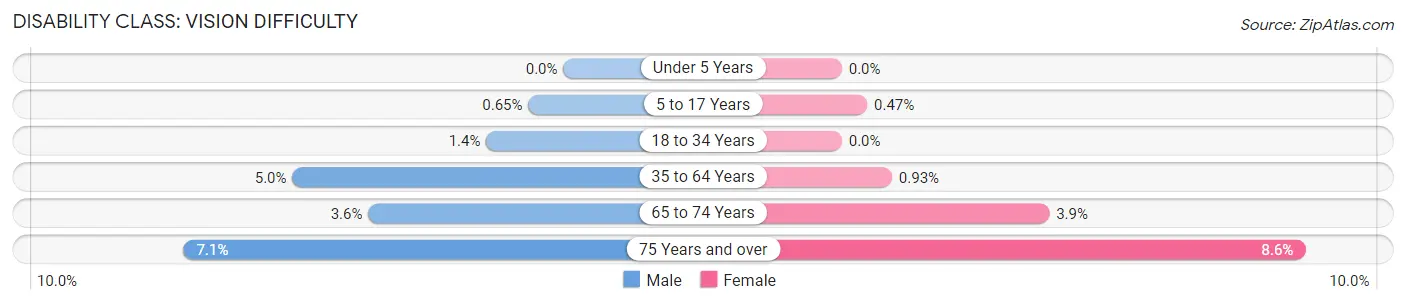
| Age Bracket | Male | Female |
| Under 5 Years | 0 (0.0%) | 0 (0.0%) |
| 5 to 17 Years | 12 (0.6%) | 9 (0.5%) |
| 18 to 34 Years | 50 (1.4%) | 0 (0.0%) |
| 35 to 64 Years | 275 (5.0%) | 53 (0.9%) |
| 65 to 74 Years | 57 (3.6%) | 89 (3.8%) |
| 75 Years and over | 84 (7.0%) | 138 (8.6%) |
Disability Class: Cognitive Difficulty
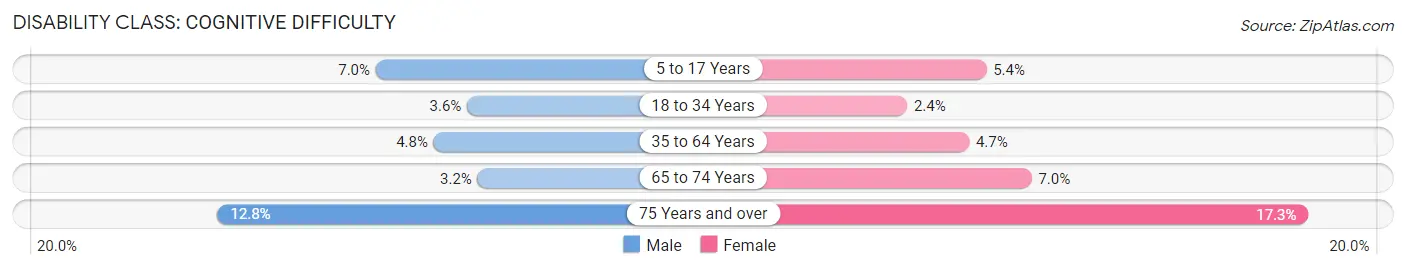
| Age Bracket | Male | Female |
| 5 to 17 Years | 128 (7.0%) | 103 (5.4%) |
| 18 to 34 Years | 125 (3.6%) | 89 (2.4%) |
| 35 to 64 Years | 263 (4.8%) | 269 (4.7%) |
| 65 to 74 Years | 50 (3.2%) | 163 (7.0%) |
| 75 Years and over | 153 (12.8%) | 278 (17.3%) |
Disability Class: Ambulatory Difficulty
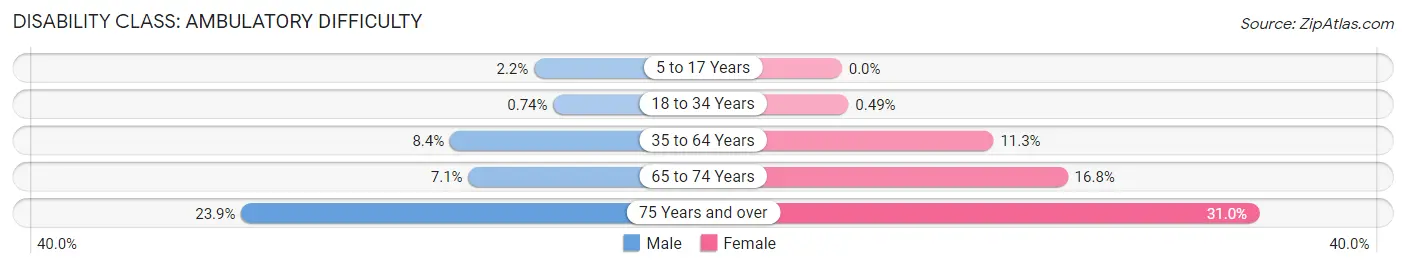
| Age Bracket | Male | Female |
| 5 to 17 Years | 40 (2.2%) | 0 (0.0%) |
| 18 to 34 Years | 26 (0.7%) | 18 (0.5%) |
| 35 to 64 Years | 460 (8.4%) | 641 (11.3%) |
| 65 to 74 Years | 111 (7.0%) | 388 (16.8%) |
| 75 Years and over | 285 (23.9%) | 497 (31.0%) |
Disability Class: Self-Care Difficulty
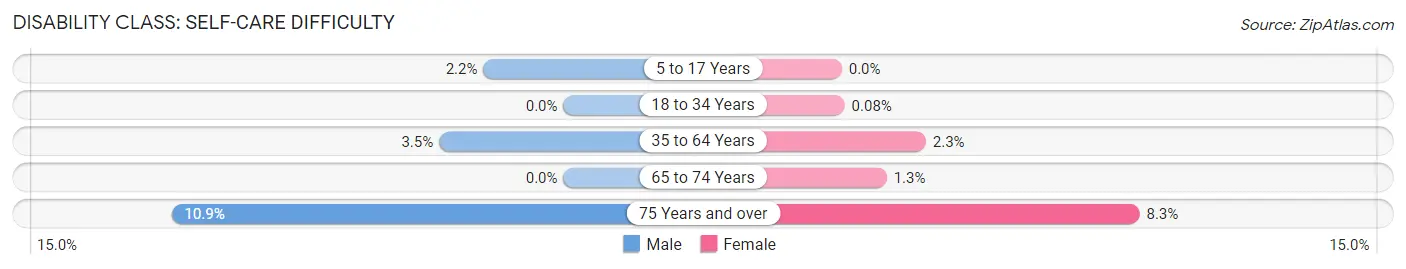
| Age Bracket | Male | Female |
| 5 to 17 Years | 41 (2.2%) | 0 (0.0%) |
| 18 to 34 Years | 0 (0.0%) | 3 (0.1%) |
| 35 to 64 Years | 189 (3.5%) | 133 (2.3%) |
| 65 to 74 Years | 0 (0.0%) | 29 (1.3%) |
| 75 Years and over | 130 (10.9%) | 133 (8.3%) |
Technology Access in Austintown
Computing Device Access in Austintown
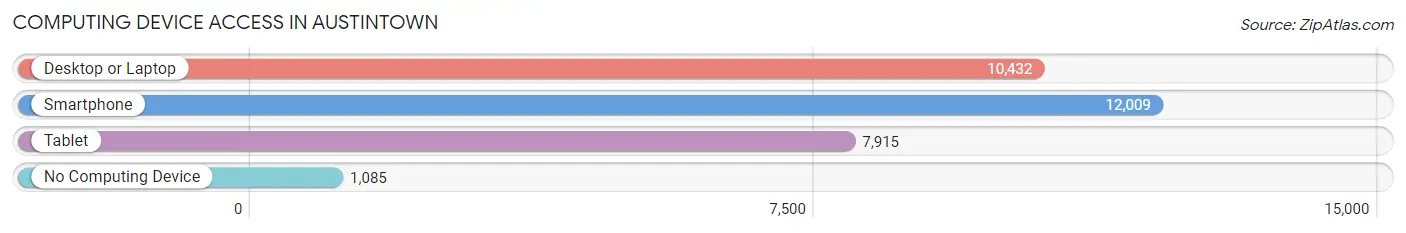
| Device Type | # Households | % Households |
| Desktop or Laptop | 10,432 | 73.9% |
| Smartphone | 12,009 | 85.1% |
| Tablet | 7,915 | 56.1% |
| No Computing Device | 1,085 | 7.7% |
| Total | 14,111 | 100.0% |
Internet Access in Austintown
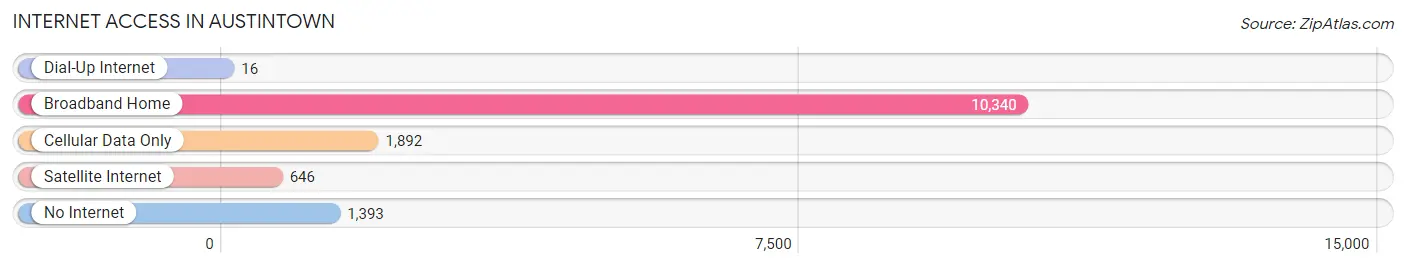
| Internet Type | # Households | % Households |
| Dial-Up Internet | 16 | 0.1% |
| Broadband Home | 10,340 | 73.3% |
| Cellular Data Only | 1,892 | 13.4% |
| Satellite Internet | 646 | 4.6% |
| No Internet | 1,393 | 9.9% |
| Total | 14,111 | 100.0% |
Austintown Summary
Austinown, Ohio is a small village located in Mahoning County, Ohio. It is part of the Youngstown-Warren-Boardman metropolitan area and is located just north of the city of Youngstown. The village was founded in 1806 and was named after Stephen F. Austin, the founder of the Republic of Texas. The village has a population of approximately 10,000 people and is home to a variety of businesses, including a large industrial park.
Geography
Austinown is located in the Mahoning Valley, which is part of the Appalachian Plateau. The village is situated on the Mahoning River, which is a tributary of the Ohio River. The village is located in the western part of the county and is bordered by the cities of Youngstown and Boardman. The village is located in a rural area and is surrounded by farmland. The village is located approximately 30 miles from Cleveland and Pittsburgh.
Economy
Austinown is a small village with a population of approximately 10,000 people. The village is home to a variety of businesses, including a large industrial park. The industrial park is home to a variety of manufacturing and industrial businesses, including a steel mill, a plastics plant, and a paper mill. The village is also home to a variety of retail businesses, including a grocery store, a hardware store, and a variety of restaurants.
Demographics
As of the 2010 census, Austinown had a population of 10,000 people. The racial makeup of the village was 95.3% White, 1.2% African American, 0.3% Native American, 0.7% Asian, 0.1% Pacific Islander, and 2.4% from two or more races. The median household income was $41,944 and the median family income was $50,944. The per capita income was $20,944.
History
Austinown was founded in 1806 and was named after Stephen F. Austin, the founder of the Republic of Texas. The village was originally a farming community and was home to a variety of small businesses. In the late 19th century, the village began to industrialize and a large industrial park was built. The industrial park is home to a variety of manufacturing and industrial businesses, including a steel mill, a plastics plant, and a paper mill. The village has remained a small, rural community and is home to a variety of businesses, including a grocery store, a hardware store, and a variety of restaurants.
Common Questions
What is Per Capita Income in Austintown?
Per Capita income in Austintown is $30,207.
What is the Median Family Income in Austintown?
Median Family Income in Austintown is $67,724.
What is the Median Household income in Austintown?
Median Household Income in Austintown is $50,241.
What is Income or Wage Gap in Austintown?
Income or Wage Gap in Austintown is 37.5%.
Women in Austintown earn 62.5 cents for every dollar earned by a man.
What is Family Income Deficit in Austintown?
Family Income Deficit in Austintown is $9,825.
Families that are below poverty line in Austintown earn $9,825 less on average than the poverty threshold level.
What is Inequality or Gini Index in Austintown?
Inequality or Gini Index in Austintown is 0.41.
What is the Total Population of Austintown?
Total Population of Austintown is 30,397.
What is the Total Male Population of Austintown?
Total Male Population of Austintown is 14,334.
What is the Total Female Population of Austintown?
Total Female Population of Austintown is 16,063.
What is the Ratio of Males per 100 Females in Austintown?
There are 89.24 Males per 100 Females in Austintown.
What is the Ratio of Females per 100 Males in Austintown?
There are 112.06 Females per 100 Males in Austintown.
What is the Median Population Age in Austintown?
Median Population Age in Austintown is 43.3 Years.
What is the Average Family Size in Austintown
Average Family Size in Austintown is 2.8 People.
What is the Average Household Size in Austintown
Average Household Size in Austintown is 2.1 People.
How Large is the Labor Force in Austintown?
There are 16,313 People in the Labor Forcein in Austintown.
What is the Percentage of People in the Labor Force in Austintown?
62.7% of People are in the Labor Force in Austintown.
What is the Unemployment Rate in Austintown?
Unemployment Rate in Austintown is 4.8%.