Parma, OH Map & Demographics
Parma Map
Parma Overview
$34,487
PER CAPITA INCOME
$79,377
AVG FAMILY INCOME
$65,848
AVG HOUSEHOLD INCOME
28.8%
WAGE / INCOME GAP [ % ]
71.2¢/ $1
WAGE / INCOME GAP [ $ ]
$9,544
FAMILY INCOME DEFICIT
0.39
INEQUALITY / GINI INDEX
80,587
TOTAL POPULATION
40,019
MALE POPULATION
40,568
FEMALE POPULATION
98.65
MALES / 100 FEMALES
101.37
FEMALES / 100 MALES
42.6
MEDIAN AGE
2.9
AVG FAMILY SIZE
2.3
AVG HOUSEHOLD SIZE
45,453
LABOR FORCE [ PEOPLE ]
66.6%
PERCENT IN LABOR FORCE
5.8%
UNEMPLOYMENT RATE
Income in Parma
Income Overview in Parma
Per Capita Income in Parma is $34,487, while median incomes of families and households are $79,377 and $65,848 respectively.
| Characteristic | Number | Measure |
| Per Capita Income | 80,587 | $34,487 |
| Median Family Income | 20,829 | $79,377 |
| Mean Family Income | 20,829 | $92,750 |
| Median Household Income | 34,546 | $65,848 |
| Mean Household Income | 34,546 | $78,518 |
| Income Deficit | 20,829 | $9,544 |
| Wage / Income Gap (%) | 80,587 | 28.83% |
| Wage / Income Gap ($) | 80,587 | 71.17¢ per $1 |
| Gini / Inequality Index | 80,587 | 0.39 |
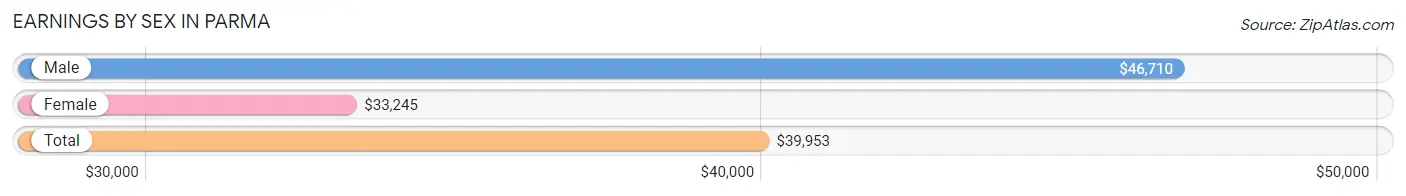
Earnings by Sex in Parma
Average Earnings in Parma are $39,953, $46,710 for men and $33,245 for women, a difference of 28.8%.
| Sex | Number | Average Earnings |
| Male | 24,234 (51.4%) | $46,710 |
| Female | 22,909 (48.6%) | $33,245 |
| Total | 47,143 (100.0%) | $39,953 |
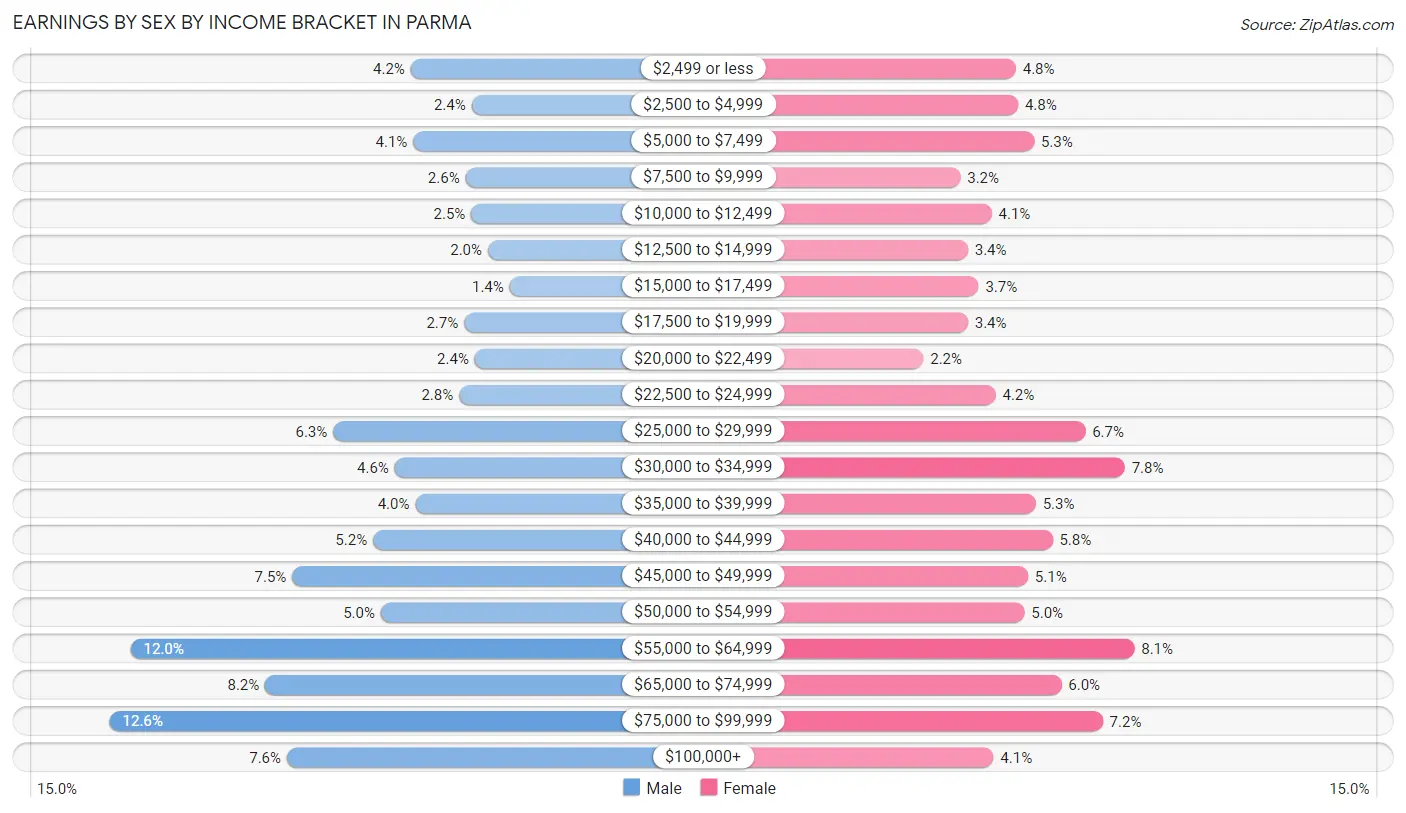
Earnings by Sex by Income Bracket in Parma
The most common earnings brackets in Parma are $75,000 to $99,999 for men (3,055 | 12.6%) and $55,000 to $64,999 for women (1,850 | 8.1%).
| Income | Male | Female |
| $2,499 or less | 1,005 (4.2%) | 1,088 (4.8%) |
| $2,500 to $4,999 | 592 (2.4%) | 1,103 (4.8%) |
| $5,000 to $7,499 | 988 (4.1%) | 1,204 (5.3%) |
| $7,500 to $9,999 | 633 (2.6%) | 731 (3.2%) |
| $10,000 to $12,499 | 593 (2.5%) | 932 (4.1%) |
| $12,500 to $14,999 | 481 (2.0%) | 778 (3.4%) |
| $15,000 to $17,499 | 332 (1.4%) | 847 (3.7%) |
| $17,500 to $19,999 | 642 (2.6%) | 779 (3.4%) |
| $20,000 to $22,499 | 569 (2.4%) | 492 (2.1%) |
| $22,500 to $24,999 | 677 (2.8%) | 957 (4.2%) |
| $25,000 to $29,999 | 1,535 (6.3%) | 1,535 (6.7%) |
| $30,000 to $34,999 | 1,115 (4.6%) | 1,790 (7.8%) |
| $35,000 to $39,999 | 975 (4.0%) | 1,217 (5.3%) |
| $40,000 to $44,999 | 1,262 (5.2%) | 1,324 (5.8%) |
| $45,000 to $49,999 | 1,813 (7.5%) | 1,167 (5.1%) |
| $50,000 to $54,999 | 1,209 (5.0%) | 1,143 (5.0%) |
| $55,000 to $64,999 | 2,912 (12.0%) | 1,850 (8.1%) |
| $65,000 to $74,999 | 1,997 (8.2%) | 1,381 (6.0%) |
| $75,000 to $99,999 | 3,055 (12.6%) | 1,647 (7.2%) |
| $100,000+ | 1,849 (7.6%) | 944 (4.1%) |
| Total | 24,234 (100.0%) | 22,909 (100.0%) |
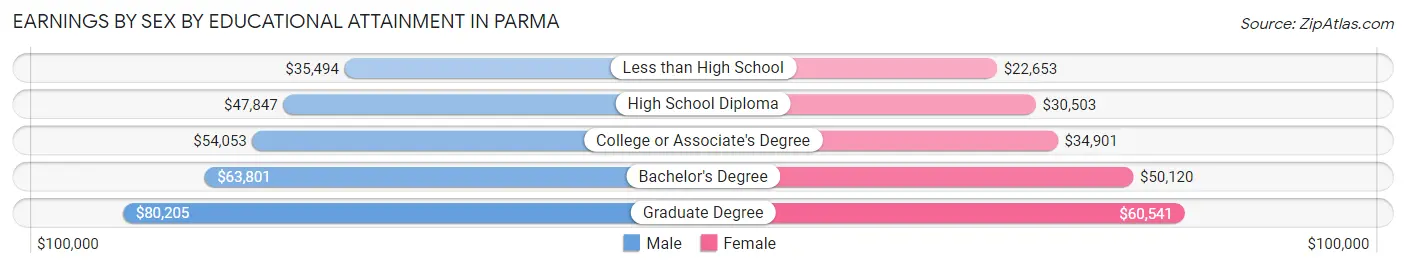
Earnings by Sex by Educational Attainment in Parma
Average earnings in Parma are $52,717 for men and $37,007 for women, a difference of 29.8%. Men with an educational attainment of graduate degree enjoy the highest average annual earnings of $80,205, while those with less than high school education earn the least with $35,494. Women with an educational attainment of graduate degree earn the most with the average annual earnings of $60,541, while those with less than high school education have the smallest earnings of $22,653.
| Educational Attainment | Male Income | Female Income |
| Less than High School | $35,494 | $22,653 |
| High School Diploma | $47,847 | $30,503 |
| College or Associate's Degree | $54,053 | $34,901 |
| Bachelor's Degree | $63,801 | $50,120 |
| Graduate Degree | $80,205 | $60,541 |
| Total | $52,717 | $37,007 |
Family Income in Parma
Family Income Brackets in Parma
According to the Parma family income data, there are 4,874 families falling into the $50,000 to $74,999 income range, which is the most common income bracket and makes up 23.4% of all families. Conversely, the $10,000 to $14,999 income bracket is the least frequent group with only 292 families (1.4%) belonging to this category.
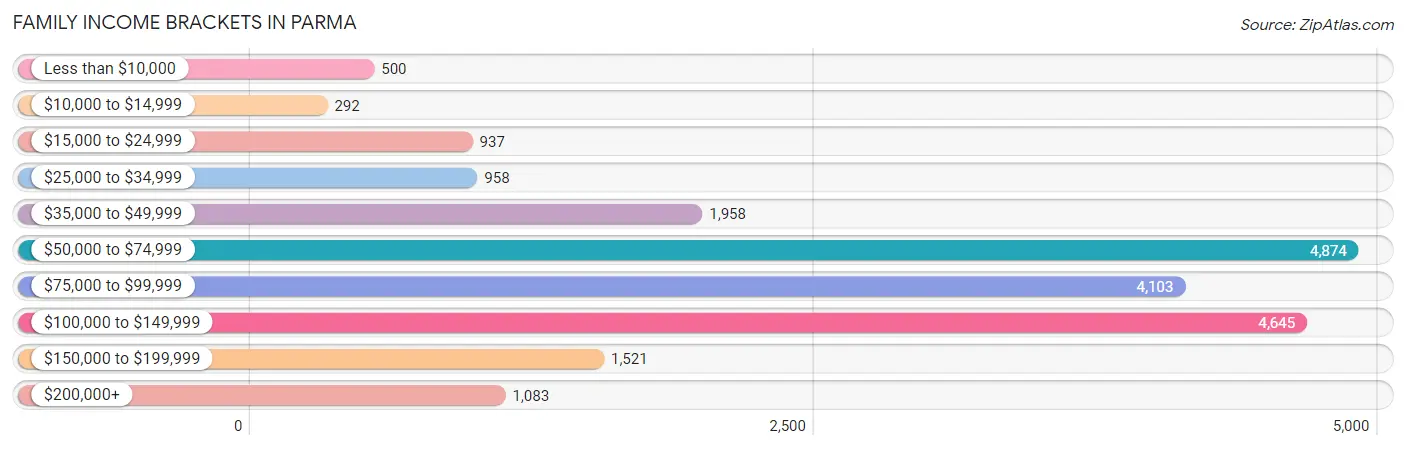
| Income Bracket | # Families | % Families |
| Less than $10,000 | 500 | 2.4% |
| $10,000 to $14,999 | 292 | 1.4% |
| $15,000 to $24,999 | 937 | 4.5% |
| $25,000 to $34,999 | 958 | 4.6% |
| $35,000 to $49,999 | 1,958 | 9.4% |
| $50,000 to $74,999 | 4,874 | 23.4% |
| $75,000 to $99,999 | 4,103 | 19.7% |
| $100,000 to $149,999 | 4,645 | 22.3% |
| $150,000 to $199,999 | 1,521 | 7.3% |
| $200,000+ | 1,083 | 5.2% |
Family Income by Famaliy Size in Parma
7+ person families (238 | 1.1%) account for the highest median family income in Parma with $116,463 per family, while 2-person families (10,746 | 51.6%) have the highest median income of $35,418 per family member.
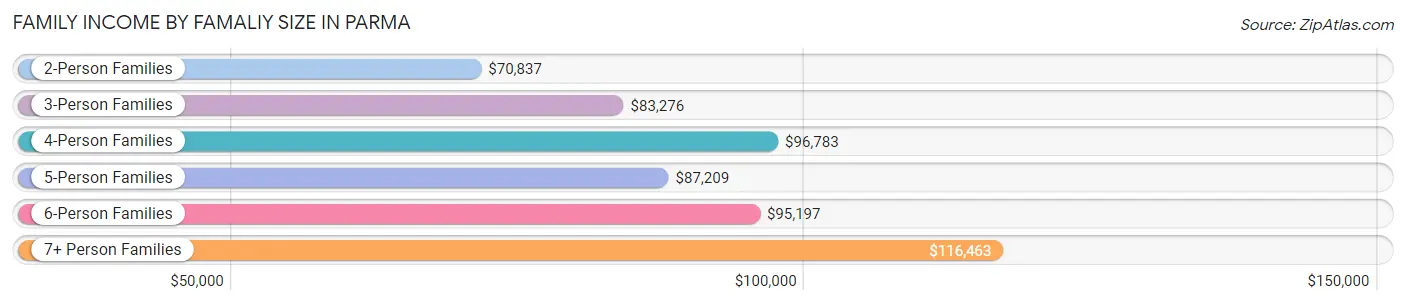
| Income Bracket | # Families | Median Income |
| 2-Person Families | 10,746 (51.6%) | $70,837 |
| 3-Person Families | 5,213 (25.0%) | $83,276 |
| 4-Person Families | 2,859 (13.7%) | $96,783 |
| 5-Person Families | 1,414 (6.8%) | $87,209 |
| 6-Person Families | 359 (1.7%) | $95,197 |
| 7+ Person Families | 238 (1.1%) | $116,463 |
| Total | 20,829 (100.0%) | $79,377 |
Family Income by Number of Earners in Parma
The median family income in Parma is $79,377, with families comprising 3+ earners (3,082) having the highest median family income of $124,025, while families with no earners (2,997) have the lowest median family income of $50,497, accounting for 14.8% and 14.4% of families, respectively.
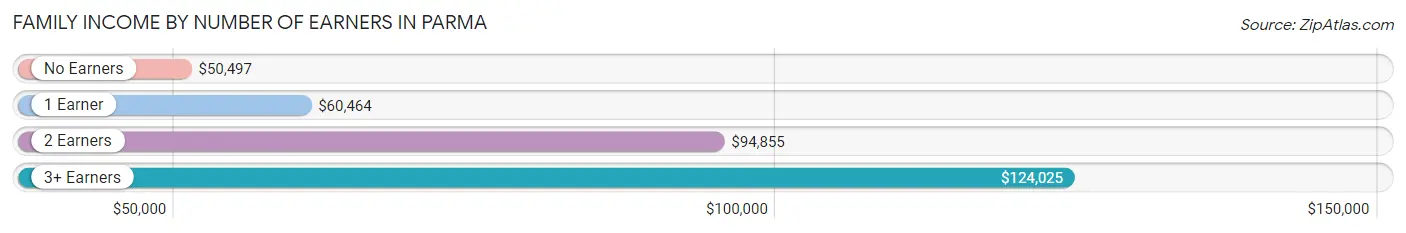
| Number of Earners | # Families | Median Income |
| No Earners | 2,997 (14.4%) | $50,497 |
| 1 Earner | 6,333 (30.4%) | $60,464 |
| 2 Earners | 8,417 (40.4%) | $94,855 |
| 3+ Earners | 3,082 (14.8%) | $124,025 |
| Total | 20,829 (100.0%) | $79,377 |
Household Income in Parma
Household Income Brackets in Parma
With 7,946 households falling in the category, the $50,000 to $74,999 income range is the most frequent in Parma, accounting for 23.0% of all households. In contrast, only 1,209 households (3.5%) fall into the $10,000 to $14,999 income bracket, making it the least populous group.
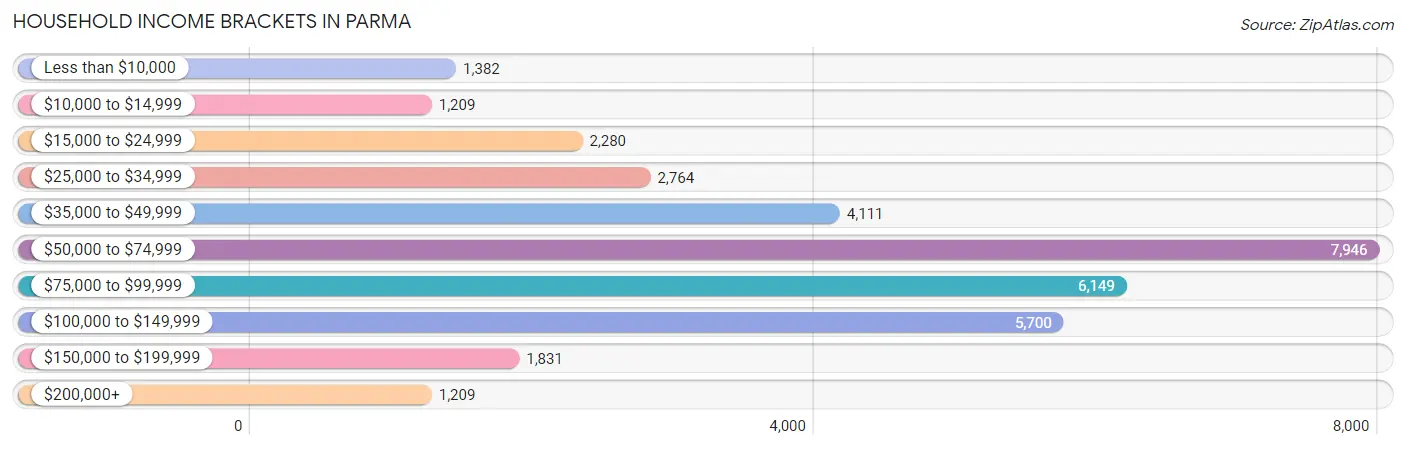
| Income Bracket | # Households | % Households |
| Less than $10,000 | 1,382 | 4.0% |
| $10,000 to $14,999 | 1,209 | 3.5% |
| $15,000 to $24,999 | 2,280 | 6.6% |
| $25,000 to $34,999 | 2,764 | 8.0% |
| $35,000 to $49,999 | 4,111 | 11.9% |
| $50,000 to $74,999 | 7,946 | 23.0% |
| $75,000 to $99,999 | 6,149 | 17.8% |
| $100,000 to $149,999 | 5,700 | 16.5% |
| $150,000 to $199,999 | 1,831 | 5.3% |
| $200,000+ | 1,209 | 3.5% |
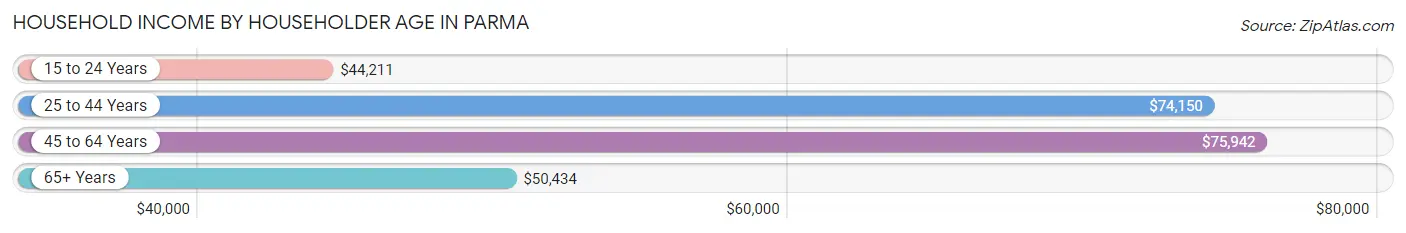
Household Income by Householder Age in Parma
The median household income in Parma is $65,848, with the highest median household income of $75,942 found in the 45 to 64 years age bracket for the primary householder. A total of 13,156 households (38.1%) fall into this category. Meanwhile, the 15 to 24 years age bracket for the primary householder has the lowest median household income of $44,211, with 1,192 households (3.5%) in this group.
| Income Bracket | # Households | Median Income |
| 15 to 24 Years | 1,192 (3.5%) | $44,211 |
| 25 to 44 Years | 10,548 (30.5%) | $74,150 |
| 45 to 64 Years | 13,156 (38.1%) | $75,942 |
| 65+ Years | 9,650 (27.9%) | $50,434 |
| Total | 34,546 (100.0%) | $65,848 |
Poverty in Parma
Income Below Poverty by Sex and Age in Parma
With 9.0% poverty level for males and 11.3% for females among the residents of Parma, 16 and 17 year old males and under 5 year old females are the most vulnerable to poverty, with 160 males (20.4%) and 478 females (25.7%) in their respective age groups living below the poverty level.
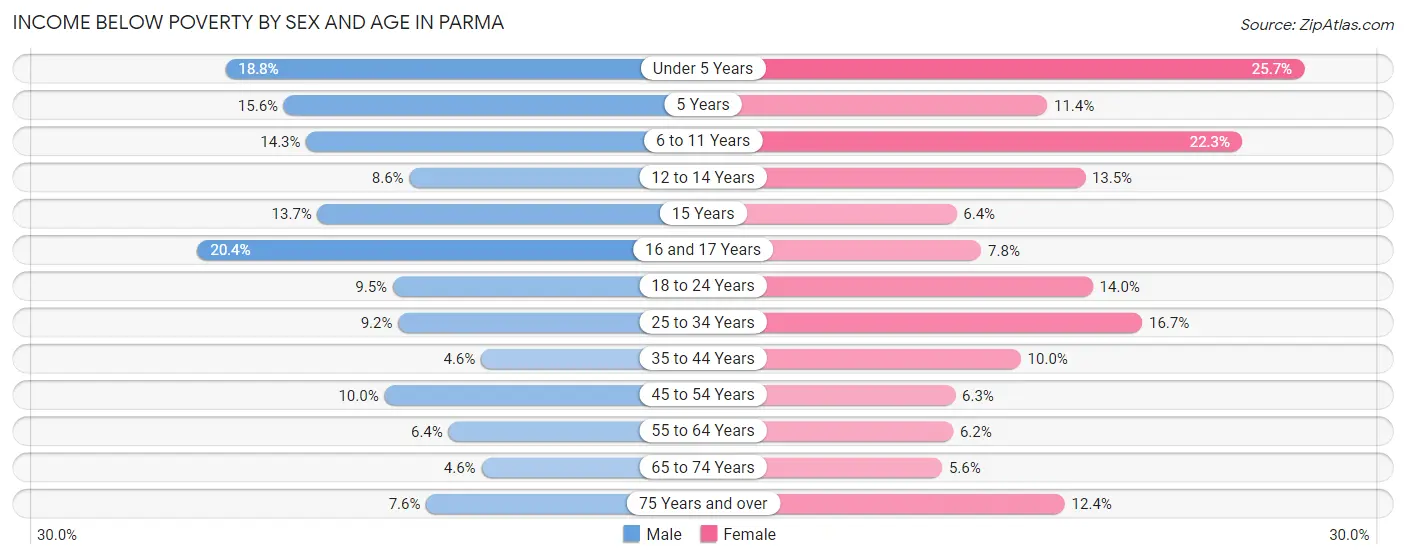
| Age Bracket | Male | Female |
| Under 5 Years | 413 (18.8%) | 478 (25.7%) |
| 5 Years | 47 (15.6%) | 36 (11.4%) |
| 6 to 11 Years | 335 (14.3%) | 436 (22.3%) |
| 12 to 14 Years | 110 (8.6%) | 146 (13.5%) |
| 15 Years | 39 (13.7%) | 36 (6.4%) |
| 16 and 17 Years | 160 (20.4%) | 69 (7.8%) |
| 18 to 24 Years | 410 (9.5%) | 438 (14.0%) |
| 25 to 34 Years | 607 (9.2%) | 981 (16.7%) |
| 35 to 44 Years | 198 (4.6%) | 445 (10.0%) |
| 45 to 54 Years | 523 (10.0%) | 307 (6.3%) |
| 55 to 64 Years | 341 (6.4%) | 392 (6.2%) |
| 65 to 74 Years | 191 (4.6%) | 271 (5.6%) |
| 75 Years and over | 180 (7.6%) | 470 (12.4%) |
| Total | 3,554 (9.0%) | 4,505 (11.3%) |
Income Above Poverty by Sex and Age in Parma
According to the poverty statistics in Parma, males aged 65 to 74 years and females aged 65 to 74 years are the age groups that are most secure financially, with 95.4% of males and 94.4% of females in these age groups living above the poverty line.
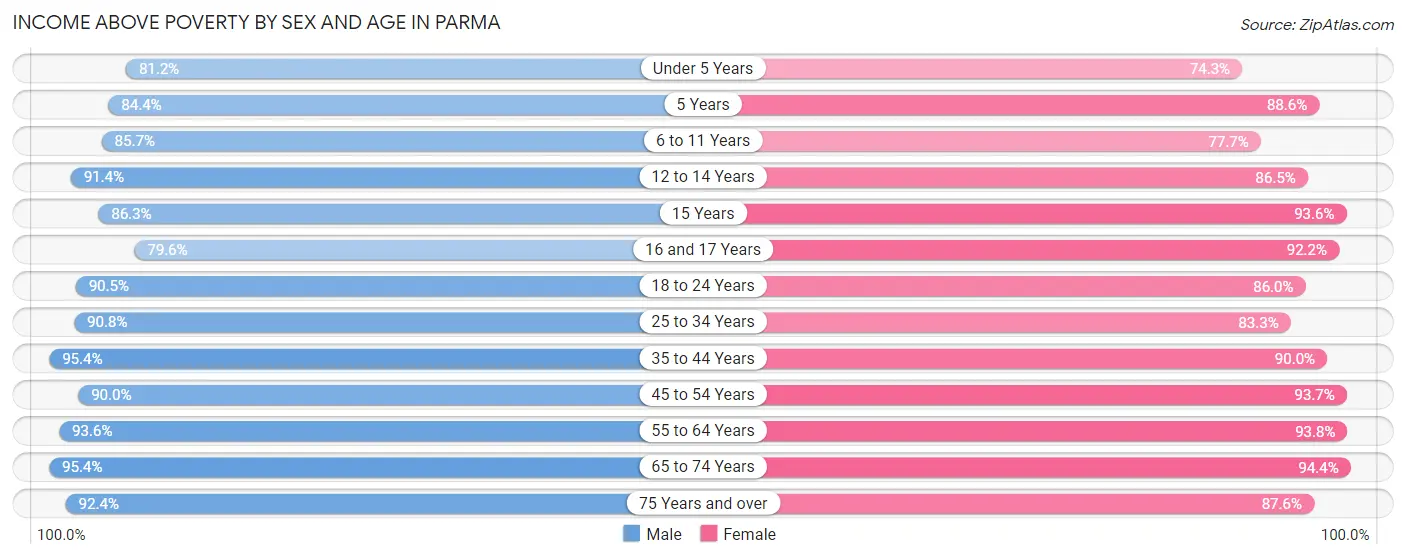
| Age Bracket | Male | Female |
| Under 5 Years | 1,781 (81.2%) | 1,380 (74.3%) |
| 5 Years | 255 (84.4%) | 279 (88.6%) |
| 6 to 11 Years | 2,006 (85.7%) | 1,522 (77.7%) |
| 12 to 14 Years | 1,174 (91.4%) | 932 (86.5%) |
| 15 Years | 246 (86.3%) | 528 (93.6%) |
| 16 and 17 Years | 625 (79.6%) | 820 (92.2%) |
| 18 to 24 Years | 3,911 (90.5%) | 2,697 (86.0%) |
| 25 to 34 Years | 6,001 (90.8%) | 4,885 (83.3%) |
| 35 to 44 Years | 4,128 (95.4%) | 4,022 (90.0%) |
| 45 to 54 Years | 4,729 (90.0%) | 4,562 (93.7%) |
| 55 to 64 Years | 4,996 (93.6%) | 5,940 (93.8%) |
| 65 to 74 Years | 3,994 (95.4%) | 4,589 (94.4%) |
| 75 Years and over | 2,179 (92.4%) | 3,316 (87.6%) |
| Total | 36,025 (91.0%) | 35,472 (88.7%) |
Income Below Poverty Among Married-Couple Families in Parma
The poverty statistics for married-couple families in Parma show that 2.0% or 279 of the total 14,083 families live below the poverty line. Families with 3 or 4 children have the highest poverty rate of 8.0%, comprising of 73 families. On the other hand, families with 5 or more children have the lowest poverty rate of 0.7%, which includes 1 families.
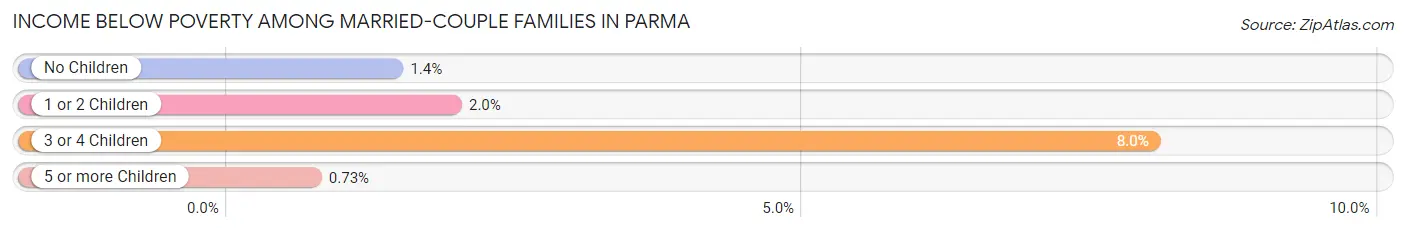
| Children | Above Poverty | Below Poverty |
| No Children | 9,467 (98.6%) | 138 (1.4%) |
| 1 or 2 Children | 3,365 (98.1%) | 67 (1.9%) |
| 3 or 4 Children | 836 (92.0%) | 73 (8.0%) |
| 5 or more Children | 136 (99.3%) | 1 (0.7%) |
| Total | 13,804 (98.0%) | 279 (2.0%) |
Income Below Poverty Among Single-Parent Households in Parma
According to the poverty data in Parma, 7.7% or 157 single-father households and 20.1% or 948 single-mother households are living below the poverty line. Among single-father households, those with 1 or 2 children have the highest poverty rate, with 89 households (10.2%) experiencing poverty. Likewise, among single-mother households, those with 3 or 4 children have the highest poverty rate, with 269 households (74.3%) falling below the poverty line.
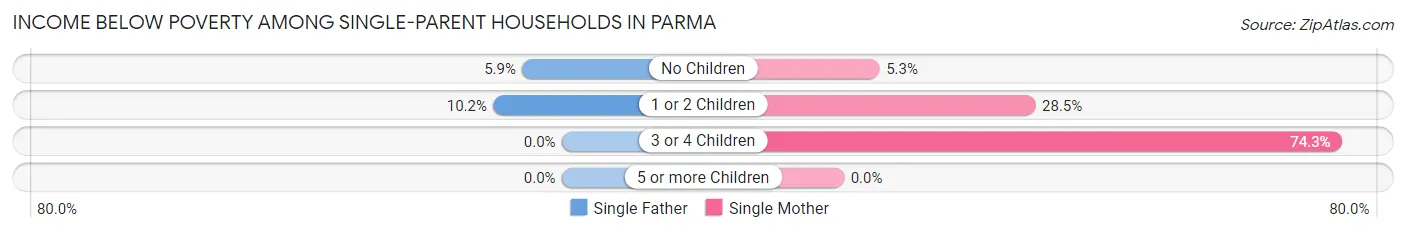
| Children | Single Father | Single Mother |
| No Children | 68 (5.9%) | 127 (5.3%) |
| 1 or 2 Children | 89 (10.2%) | 552 (28.5%) |
| 3 or 4 Children | 0 (0.0%) | 269 (74.3%) |
| 5 or more Children | 0 (0.0%) | 0 (0.0%) |
| Total | 157 (7.7%) | 948 (20.1%) |
Income Below Poverty Among Married-Couple vs Single-Parent Households in Parma
The poverty data for Parma shows that 279 of the married-couple family households (2.0%) and 1,105 of the single-parent households (16.4%) are living below the poverty level. Within the married-couple family households, those with 3 or 4 children have the highest poverty rate, with 73 households (8.0%) falling below the poverty line. Among the single-parent households, those with 3 or 4 children have the highest poverty rate, with 269 household (73.1%) living below poverty.
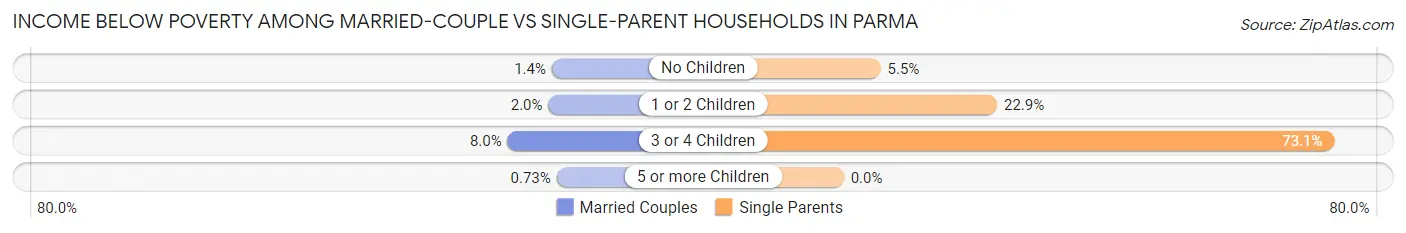
| Children | Married-Couple Families | Single-Parent Households |
| No Children | 138 (1.4%) | 195 (5.5%) |
| 1 or 2 Children | 67 (1.9%) | 641 (22.9%) |
| 3 or 4 Children | 73 (8.0%) | 269 (73.1%) |
| 5 or more Children | 1 (0.7%) | 0 (0.0%) |
| Total | 279 (2.0%) | 1,105 (16.4%) |
Race in Parma
The most populous races in Parma are White / Caucasian (68,092 | 84.5%), Hispanic or Latino (5,887 | 7.3%), and Two or more Races (5,231 | 6.5%).
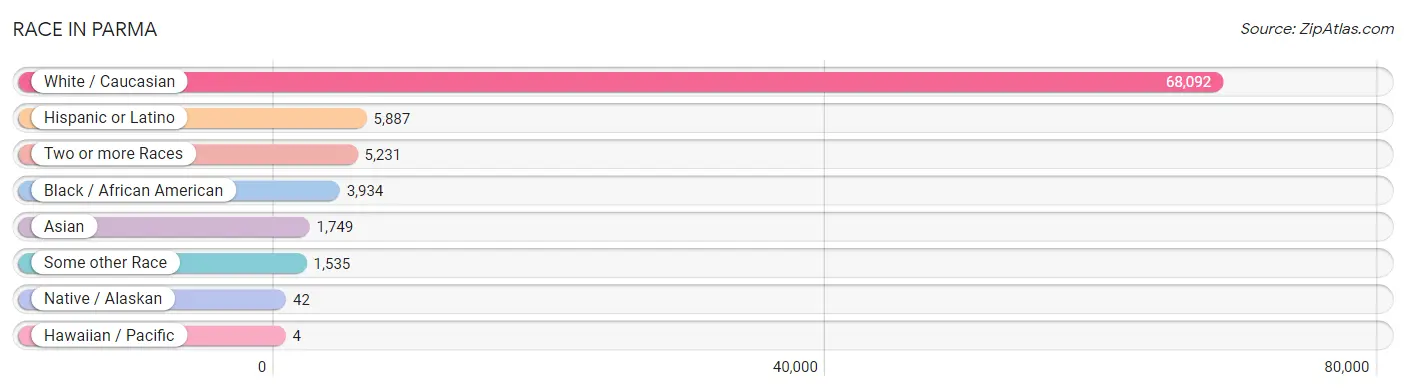
| Race | # Population | % Population |
| Asian | 1,749 | 2.2% |
| Black / African American | 3,934 | 4.9% |
| Hawaiian / Pacific | 4 | 0.0% |
| Hispanic or Latino | 5,887 | 7.3% |
| Native / Alaskan | 42 | 0.1% |
| White / Caucasian | 68,092 | 84.5% |
| Two or more Races | 5,231 | 6.5% |
| Some other Race | 1,535 | 1.9% |
| Total | 80,587 | 100.0% |
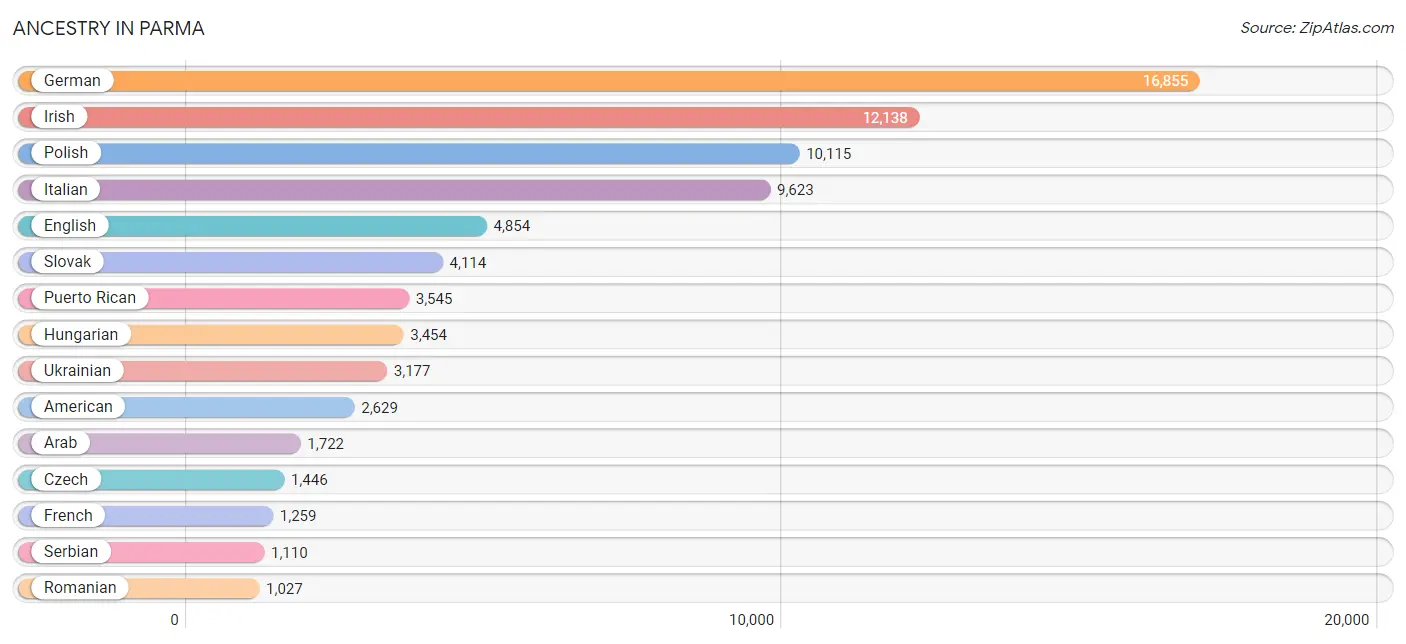
Ancestry in Parma
The most populous ancestries reported in Parma are German (16,855 | 20.9%), Irish (12,138 | 15.1%), Polish (10,115 | 12.6%), Italian (9,623 | 11.9%), and English (4,854 | 6.0%), together accounting for 66.5% of all Parma residents.
| Ancestry | # Population | % Population |
| Afghan | 60 | 0.1% |
| African | 117 | 0.2% |
| Albanian | 64 | 0.1% |
| American | 2,629 | 3.3% |
| Apache | 1 | 0.0% |
| Arab | 1,722 | 2.1% |
| Argentinean | 19 | 0.0% |
| Armenian | 71 | 0.1% |
| Australian | 7 | 0.0% |
| Austrian | 126 | 0.2% |
| Barbadian | 28 | 0.0% |
| Belgian | 5 | 0.0% |
| Belizean | 14 | 0.0% |
| Bhutanese | 68 | 0.1% |
| Blackfeet | 216 | 0.3% |
| British | 163 | 0.2% |
| Bulgarian | 21 | 0.0% |
| Burmese | 105 | 0.1% |
| Canadian | 72 | 0.1% |
| Carpatho Rusyn | 9 | 0.0% |
| Celtic | 9 | 0.0% |
| Central American | 317 | 0.4% |
| Central American Indian | 19 | 0.0% |
| Cherokee | 362 | 0.4% |
| Chippewa | 93 | 0.1% |
| Choctaw | 44 | 0.1% |
| Colombian | 71 | 0.1% |
| Croatian | 643 | 0.8% |
| Cuban | 91 | 0.1% |
| Czech | 1,446 | 1.8% |
| Czechoslovakian | 457 | 0.6% |
| Danish | 74 | 0.1% |
| Delaware | 18 | 0.0% |
| Dominican | 199 | 0.3% |
| Dutch | 418 | 0.5% |
| Eastern European | 239 | 0.3% |
| Ecuadorian | 132 | 0.2% |
| Egyptian | 421 | 0.5% |
| English | 4,854 | 6.0% |
| Estonian | 7 | 0.0% |
| European | 782 | 1.0% |
| Finnish | 114 | 0.1% |
| French | 1,259 | 1.6% |
| French American Indian | 2 | 0.0% |
| French Canadian | 96 | 0.1% |
| German | 16,855 | 20.9% |
| Ghanaian | 12 | 0.0% |
| Greek | 561 | 0.7% |
| Guamanian / Chamorro | 11 | 0.0% |
| Guatemalan | 163 | 0.2% |
| Guyanese | 99 | 0.1% |
| Honduran | 76 | 0.1% |
| Hungarian | 3,454 | 4.3% |
| Indian (Asian) | 283 | 0.4% |
| Iranian | 6 | 0.0% |
| Iraqi | 42 | 0.1% |
| Irish | 12,138 | 15.1% |
| Italian | 9,623 | 11.9% |
| Jamaican | 100 | 0.1% |
| Japanese | 119 | 0.2% |
| Jordanian | 75 | 0.1% |
| Korean | 505 | 0.6% |
| Laotian | 7 | 0.0% |
| Latvian | 53 | 0.1% |
| Lebanese | 634 | 0.8% |
| Lithuanian | 279 | 0.4% |
| Macedonian | 79 | 0.1% |
| Mexican | 809 | 1.0% |
| Mexican American Indian | 26 | 0.0% |
| Moroccan | 100 | 0.1% |
| Navajo | 10 | 0.0% |
| Nigerian | 106 | 0.1% |
| Northern European | 71 | 0.1% |
| Norwegian | 393 | 0.5% |
| Pakistani | 19 | 0.0% |
| Palestinian | 108 | 0.1% |
| Pennsylvania German | 123 | 0.2% |
| Peruvian | 219 | 0.3% |
| Polish | 10,115 | 12.6% |
| Portuguese | 14 | 0.0% |
| Pueblo | 35 | 0.0% |
| Puerto Rican | 3,545 | 4.4% |
| Romanian | 1,027 | 1.3% |
| Russian | 985 | 1.2% |
| Salvadoran | 78 | 0.1% |
| Scotch-Irish | 629 | 0.8% |
| Scottish | 919 | 1.1% |
| Serbian | 1,110 | 1.4% |
| Slavic | 45 | 0.1% |
| Slovak | 4,114 | 5.1% |
| Slovene | 948 | 1.2% |
| Somali | 122 | 0.2% |
| South American | 517 | 0.6% |
| South American Indian | 8 | 0.0% |
| Spaniard | 180 | 0.2% |
| Spanish | 25 | 0.0% |
| Sri Lankan | 271 | 0.3% |
| Subsaharan African | 383 | 0.5% |
| Swedish | 223 | 0.3% |
| Swiss | 200 | 0.3% |
| Syrian | 116 | 0.1% |
| Thai | 480 | 0.6% |
| Turkish | 10 | 0.0% |
| Ukrainian | 3,177 | 3.9% |
| Uruguayan | 21 | 0.0% |
| Venezuelan | 55 | 0.1% |
| Vietnamese | 10 | 0.0% |
| Welsh | 551 | 0.7% |
| Yugoslavian | 65 | 0.1% | View All 109 Rows |
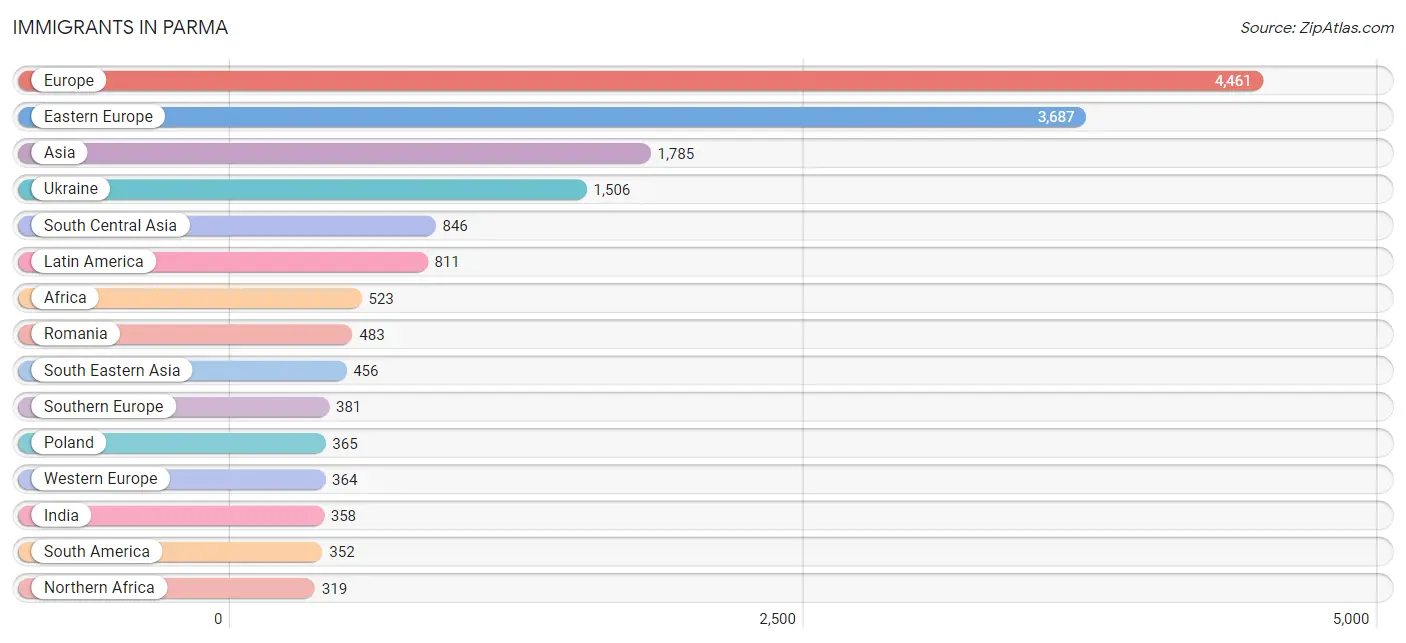
Immigrants in Parma
The most numerous immigrant groups reported in Parma came from Europe (4,461 | 5.5%), Eastern Europe (3,687 | 4.6%), Asia (1,785 | 2.2%), Ukraine (1,506 | 1.9%), and South Central Asia (846 | 1.1%), together accounting for 15.2% of all Parma residents.
| Immigration Origin | # Population | % Population |
| Afghanistan | 19 | 0.0% |
| Africa | 523 | 0.6% |
| Albania | 100 | 0.1% |
| Asia | 1,785 | 2.2% |
| Austria | 32 | 0.0% |
| Bangladesh | 10 | 0.0% |
| Barbados | 28 | 0.0% |
| Belarus | 22 | 0.0% |
| Belgium | 9 | 0.0% |
| Belize | 14 | 0.0% |
| Bosnia and Herzegovina | 281 | 0.4% |
| Bulgaria | 21 | 0.0% |
| Cambodia | 20 | 0.0% |
| Canada | 115 | 0.1% |
| Caribbean | 186 | 0.2% |
| Central America | 273 | 0.3% |
| China | 82 | 0.1% |
| Colombia | 21 | 0.0% |
| Croatia | 81 | 0.1% |
| Cuba | 35 | 0.0% |
| Czechoslovakia | 68 | 0.1% |
| Dominican Republic | 88 | 0.1% |
| Eastern Africa | 126 | 0.2% |
| Eastern Asia | 171 | 0.2% |
| Eastern Europe | 3,687 | 4.6% |
| Ecuador | 90 | 0.1% |
| Egypt | 275 | 0.3% |
| El Salvador | 8 | 0.0% |
| England | 8 | 0.0% |
| Europe | 4,461 | 5.5% |
| Germany | 312 | 0.4% |
| Ghana | 54 | 0.1% |
| Greece | 103 | 0.1% |
| Guatemala | 72 | 0.1% |
| Honduras | 76 | 0.1% |
| Hong Kong | 23 | 0.0% |
| Hungary | 126 | 0.2% |
| India | 358 | 0.4% |
| Iraq | 31 | 0.0% |
| Israel | 25 | 0.0% |
| Italy | 278 | 0.3% |
| Jamaica | 35 | 0.0% |
| Jordan | 35 | 0.0% |
| Kenya | 14 | 0.0% |
| Korea | 89 | 0.1% |
| Kuwait | 9 | 0.0% |
| Latin America | 811 | 1.0% |
| Latvia | 19 | 0.0% |
| Lebanon | 144 | 0.2% |
| Mexico | 98 | 0.1% |
| Moldova | 113 | 0.1% |
| Morocco | 44 | 0.1% |
| Nepal | 26 | 0.0% |
| Netherlands | 11 | 0.0% |
| Nigeria | 24 | 0.0% |
| Northern Africa | 319 | 0.4% |
| Northern Europe | 29 | 0.0% |
| Oceania | 4 | 0.0% |
| Pakistan | 66 | 0.1% |
| Peru | 177 | 0.2% |
| Philippines | 213 | 0.3% |
| Poland | 365 | 0.4% |
| Romania | 483 | 0.6% |
| Russia | 125 | 0.2% |
| Saudi Arabia | 42 | 0.1% |
| Scotland | 8 | 0.0% |
| Serbia | 235 | 0.3% |
| Somalia | 89 | 0.1% |
| South America | 352 | 0.4% |
| South Central Asia | 846 | 1.1% |
| South Eastern Asia | 456 | 0.6% |
| Southern Europe | 381 | 0.5% |
| Sweden | 13 | 0.0% |
| Thailand | 19 | 0.0% |
| Ukraine | 1,506 | 1.9% |
| Uruguay | 9 | 0.0% |
| Uzbekistan | 215 | 0.3% |
| Venezuela | 55 | 0.1% |
| Vietnam | 204 | 0.3% |
| Western Africa | 78 | 0.1% |
| Western Asia | 286 | 0.4% |
| Western Europe | 364 | 0.4% | View All 82 Rows |
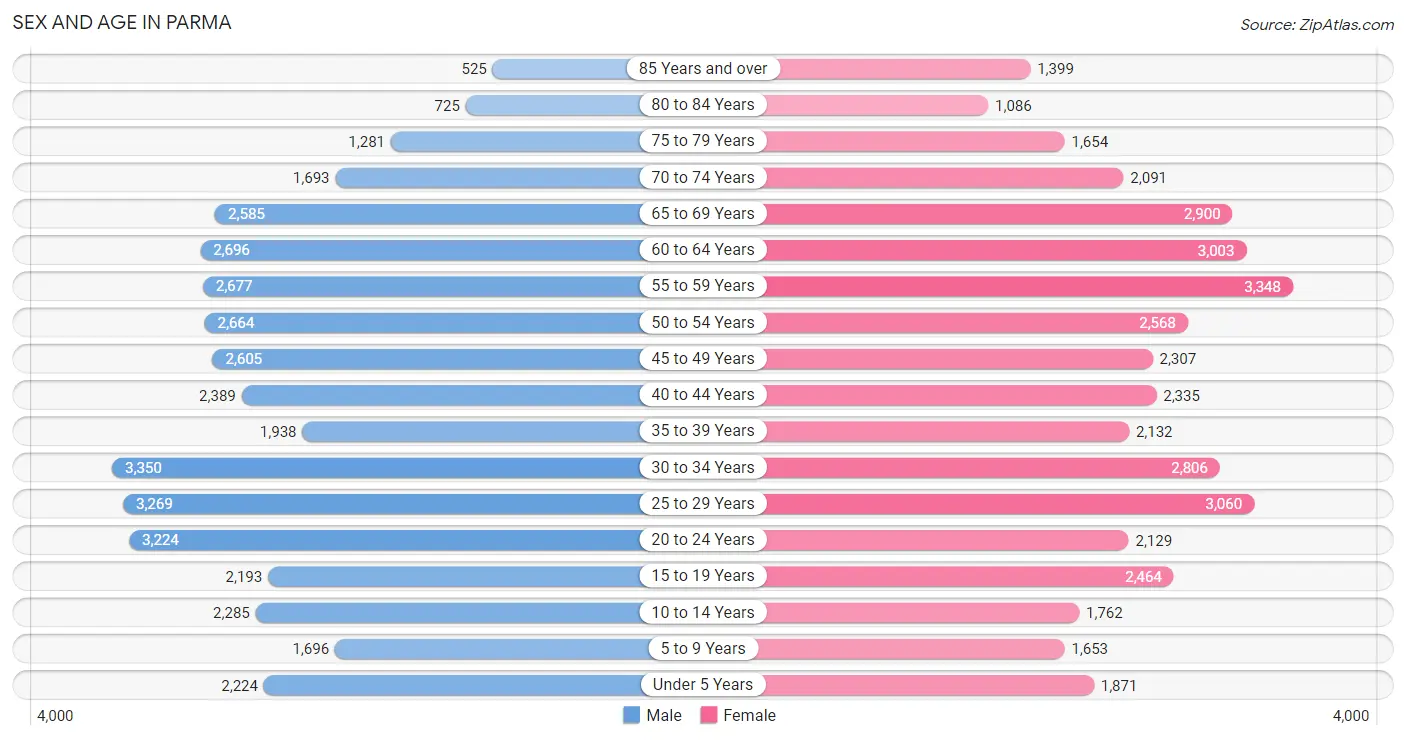
Sex and Age in Parma
Sex and Age in Parma
The most populous age groups in Parma are 30 to 34 Years (3,350 | 8.4%) for men and 55 to 59 Years (3,348 | 8.3%) for women.
| Age Bracket | Male | Female |
| Under 5 Years | 2,224 (5.6%) | 1,871 (4.6%) |
| 5 to 9 Years | 1,696 (4.2%) | 1,653 (4.1%) |
| 10 to 14 Years | 2,285 (5.7%) | 1,762 (4.3%) |
| 15 to 19 Years | 2,193 (5.5%) | 2,464 (6.1%) |
| 20 to 24 Years | 3,224 (8.1%) | 2,129 (5.2%) |
| 25 to 29 Years | 3,269 (8.2%) | 3,060 (7.5%) |
| 30 to 34 Years | 3,350 (8.4%) | 2,806 (6.9%) |
| 35 to 39 Years | 1,938 (4.8%) | 2,132 (5.3%) |
| 40 to 44 Years | 2,389 (6.0%) | 2,335 (5.8%) |
| 45 to 49 Years | 2,605 (6.5%) | 2,307 (5.7%) |
| 50 to 54 Years | 2,664 (6.7%) | 2,568 (6.3%) |
| 55 to 59 Years | 2,677 (6.7%) | 3,348 (8.3%) |
| 60 to 64 Years | 2,696 (6.7%) | 3,003 (7.4%) |
| 65 to 69 Years | 2,585 (6.5%) | 2,900 (7.1%) |
| 70 to 74 Years | 1,693 (4.2%) | 2,091 (5.1%) |
| 75 to 79 Years | 1,281 (3.2%) | 1,654 (4.1%) |
| 80 to 84 Years | 725 (1.8%) | 1,086 (2.7%) |
| 85 Years and over | 525 (1.3%) | 1,399 (3.5%) |
| Total | 40,019 (100.0%) | 40,568 (100.0%) |
Families and Households in Parma
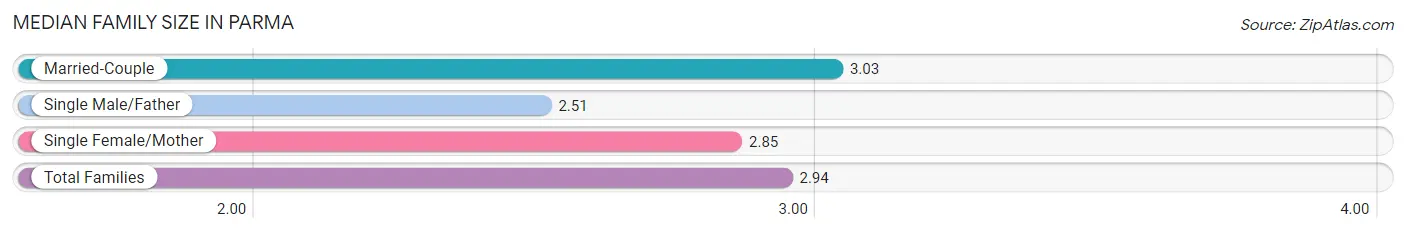
Median Family Size in Parma
The median family size in Parma is 2.94 persons per family, with married-couple families (14,083 | 67.6%) accounting for the largest median family size of 3.03 persons per family. On the other hand, single male/father families (2,027 | 9.7%) represent the smallest median family size with 2.51 persons per family.
| Family Type | # Families | Family Size |
| Married-Couple | 14,083 (67.6%) | 3.03 |
| Single Male/Father | 2,027 (9.7%) | 2.51 |
| Single Female/Mother | 4,719 (22.7%) | 2.85 |
| Total Families | 20,829 (100.0%) | 2.94 |
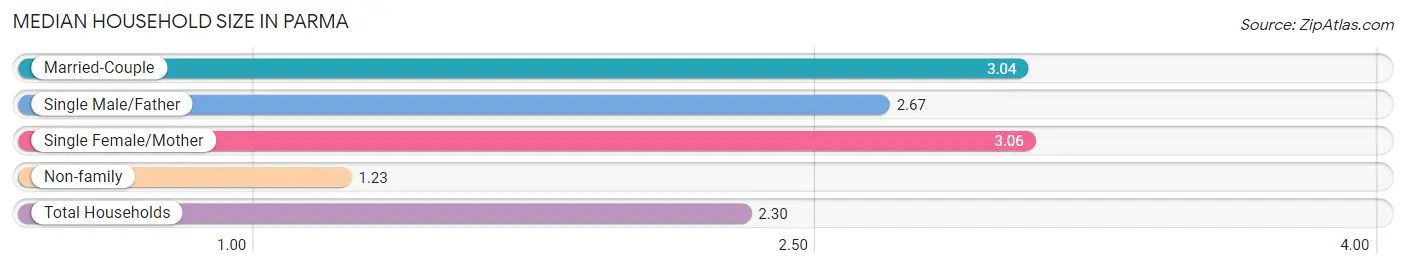
Median Household Size in Parma
The median household size in Parma is 2.30 persons per household, with single female/mother households (4,719 | 13.7%) accounting for the largest median household size of 3.06 persons per household. non-family households (13,717 | 39.7%) represent the smallest median household size with 1.23 persons per household.
| Household Type | # Households | Household Size |
| Married-Couple | 14,083 (40.8%) | 3.04 |
| Single Male/Father | 2,027 (5.9%) | 2.67 |
| Single Female/Mother | 4,719 (13.7%) | 3.06 |
| Non-family | 13,717 (39.7%) | 1.23 |
| Total Households | 34,546 (100.0%) | 2.30 |
Household Size by Marriage Status in Parma
Out of a total of 34,546 households in Parma, 20,829 (60.3%) are family households, while 13,717 (39.7%) are nonfamily households. The most numerous type of family households are 2-person households, comprising 9,972, and the most common type of nonfamily households are 1-person households, comprising 11,098.
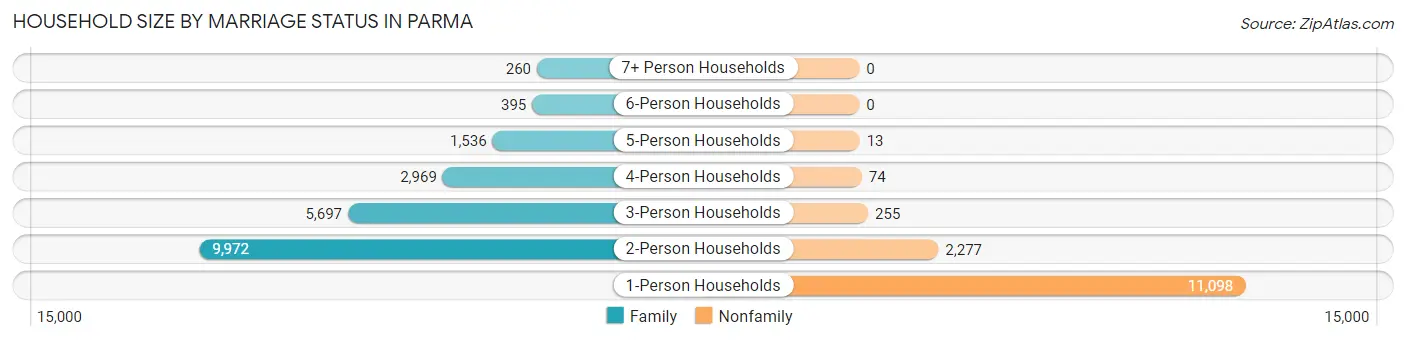
| Household Size | Family Households | Nonfamily Households |
| 1-Person Households | - | 11,098 (32.1%) |
| 2-Person Households | 9,972 (28.9%) | 2,277 (6.6%) |
| 3-Person Households | 5,697 (16.5%) | 255 (0.7%) |
| 4-Person Households | 2,969 (8.6%) | 74 (0.2%) |
| 5-Person Households | 1,536 (4.4%) | 13 (0.0%) |
| 6-Person Households | 395 (1.1%) | 0 (0.0%) |
| 7+ Person Households | 260 (0.7%) | 0 (0.0%) |
| Total | 20,829 (60.3%) | 13,717 (39.7%) |
Female Fertility in Parma
Fertility by Age in Parma
Average fertility rate in Parma is 30.0 births per 1,000 women. Women in the age bracket of 20 to 34 years have the highest fertility rate with 53.0 births per 1,000 women. Women in the age bracket of 20 to 34 years acount for 79.7% of all women with births.
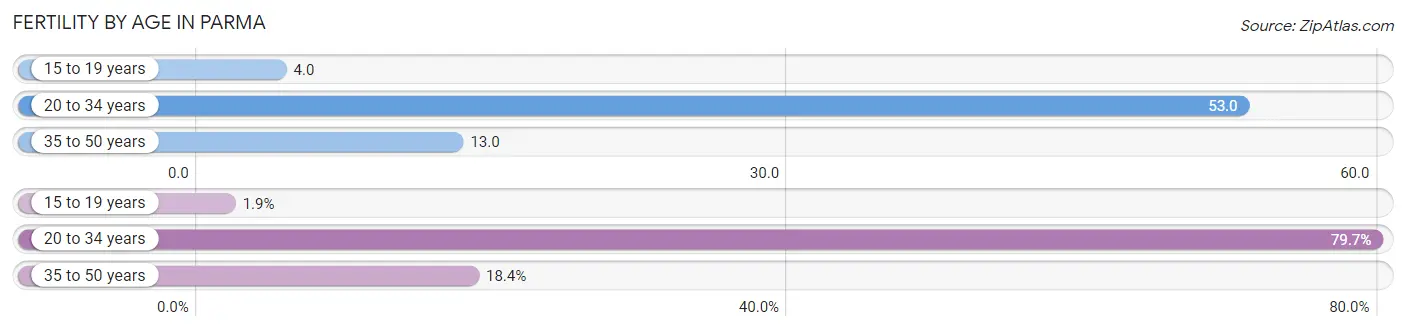
| Age Bracket | Women with Births | Births / 1,000 Women |
| 15 to 19 years | 10 (1.9%) | 4.0 |
| 20 to 34 years | 425 (79.7%) | 53.0 |
| 35 to 50 years | 98 (18.4%) | 13.0 |
| Total | 533 (100.0%) | 30.0 |
Fertility by Age by Marriage Status in Parma
65.9% of women with births (533) in Parma are married. The highest percentage of unmarried women with births falls into 15 to 19 years age bracket with 100.0% of them unmarried at the time of birth, while the lowest percentage of unmarried women with births belong to 35 to 50 years age bracket with 14.3% of them unmarried.
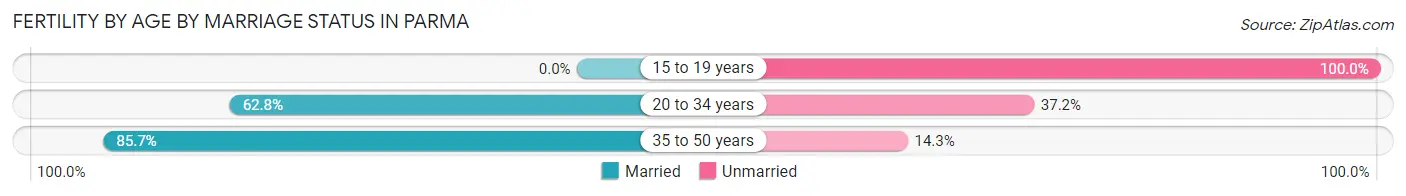
| Age Bracket | Married | Unmarried |
| 15 to 19 years | 0 (0.0%) | 10 (100.0%) |
| 20 to 34 years | 267 (62.8%) | 158 (37.2%) |
| 35 to 50 years | 84 (85.7%) | 14 (14.3%) |
| Total | 351 (65.8%) | 182 (34.2%) |
Fertility by Education in Parma
Average fertility rate in Parma is 30.0 births per 1,000 women. Women with the education attainment of graduate degree have the highest fertility rate of 87.0 births per 1,000 women, while women with the education attainment of high school diploma have the lowest fertility at 20.0 births per 1,000 women. Women with the education attainment of college or associate's degree represent 27.0% of all women with births.
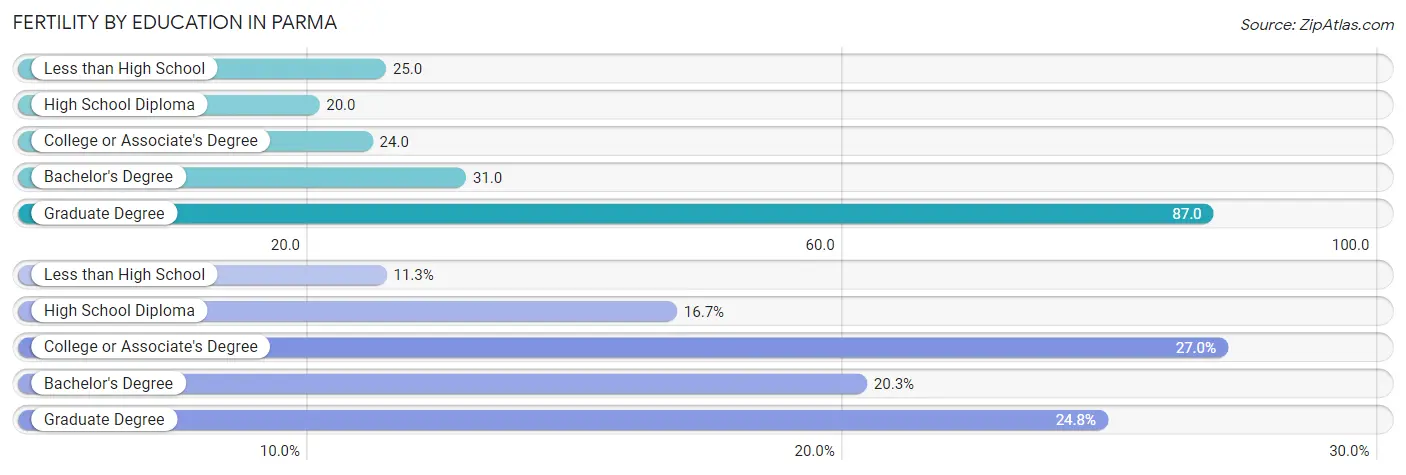
| Educational Attainment | Women with Births | Births / 1,000 Women |
| Less than High School | 60 (11.3%) | 25.0 |
| High School Diploma | 89 (16.7%) | 20.0 |
| College or Associate's Degree | 144 (27.0%) | 24.0 |
| Bachelor's Degree | 108 (20.3%) | 31.0 |
| Graduate Degree | 132 (24.8%) | 87.0 |
| Total | 533 (100.0%) | 30.0 |
Fertility by Education by Marriage Status in Parma
34.2% of women with births in Parma are unmarried. Women with the educational attainment of bachelor's degree are most likely to be married with 87.0% of them married at childbirth, while women with the educational attainment of less than high school are least likely to be married with 71.7% of them unmarried at childbirth.
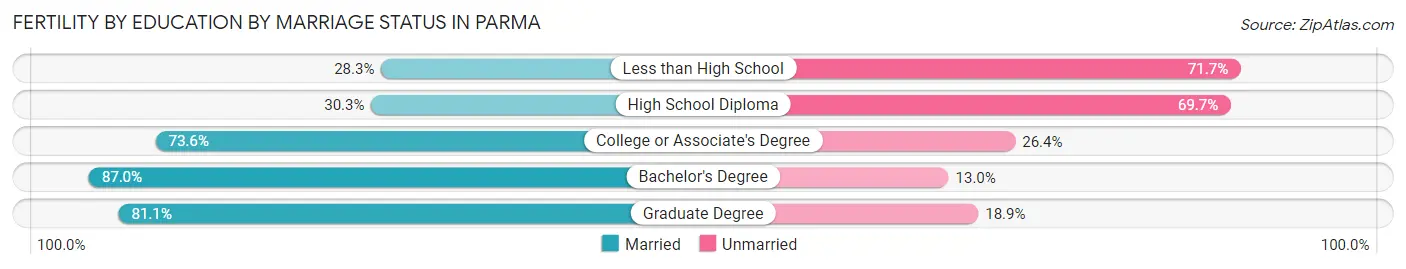
| Educational Attainment | Married | Unmarried |
| Less than High School | 17 (28.3%) | 43 (71.7%) |
| High School Diploma | 27 (30.3%) | 62 (69.7%) |
| College or Associate's Degree | 106 (73.6%) | 38 (26.4%) |
| Bachelor's Degree | 94 (87.0%) | 14 (13.0%) |
| Graduate Degree | 107 (81.1%) | 25 (18.9%) |
| Total | 351 (65.8%) | 182 (34.2%) |
Employment Characteristics in Parma
Employment by Class of Employer in Parma
Among the 41,839 employed individuals in Parma, private company employees (30,944 | 74.0%), not-for-profit organizations (4,056 | 9.7%), and local government employees (2,718 | 6.5%) make up the most common classes of employment.
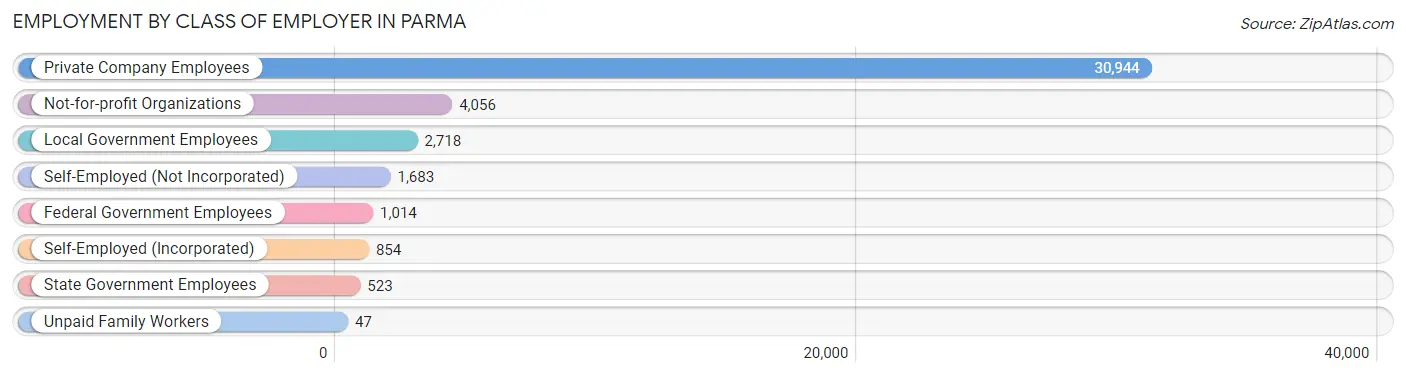
| Employer Class | # Employees | % Employees |
| Private Company Employees | 30,944 | 74.0% |
| Self-Employed (Incorporated) | 854 | 2.0% |
| Self-Employed (Not Incorporated) | 1,683 | 4.0% |
| Not-for-profit Organizations | 4,056 | 9.7% |
| Local Government Employees | 2,718 | 6.5% |
| State Government Employees | 523 | 1.3% |
| Federal Government Employees | 1,014 | 2.4% |
| Unpaid Family Workers | 47 | 0.1% |
| Total | 41,839 | 100.0% |
Employment Status by Age in Parma
According to the labor force statistics for Parma, out of the total population over 16 years of age (68,247), 66.6% or 45,453 individuals are in the labor force, with 5.8% or 2,636 of them unemployed. The age group with the highest labor force participation rate is 30 to 34 years, with 91.5% or 5,633 individuals in the labor force. Within the labor force, the 16 to 19 years age range has the highest percentage of unemployed individuals, with 28.5% or 607 of them being unemployed.
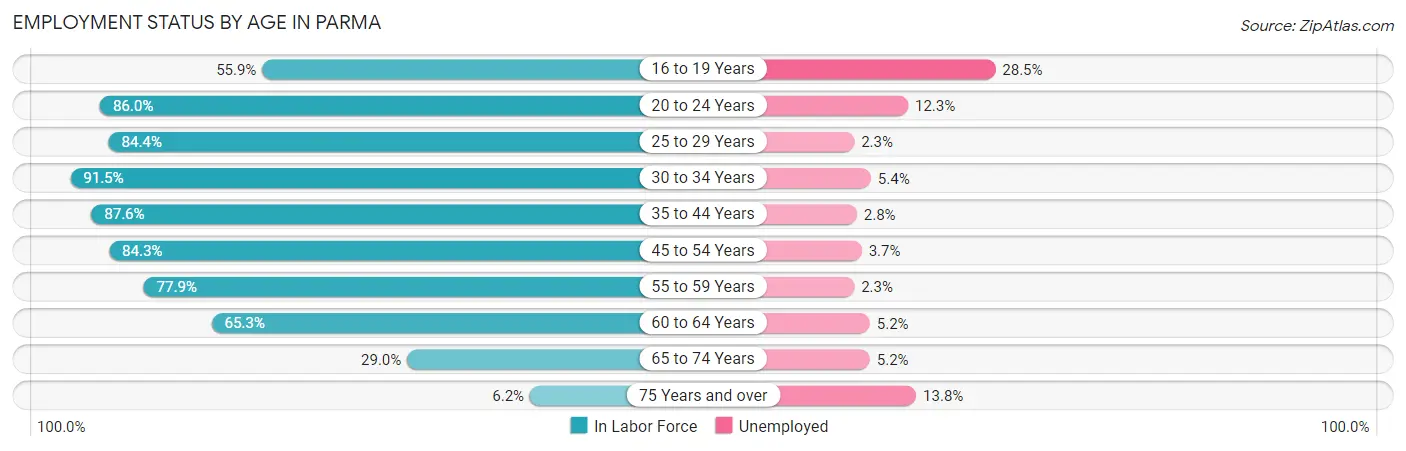
| Age Bracket | In Labor Force | Unemployed |
| 16 to 19 Years | 2,129 (55.9%) | 607 (28.5%) |
| 20 to 24 Years | 4,604 (86.0%) | 566 (12.3%) |
| 25 to 29 Years | 5,342 (84.4%) | 123 (2.3%) |
| 30 to 34 Years | 5,633 (91.5%) | 304 (5.4%) |
| 35 to 44 Years | 7,704 (87.6%) | 216 (2.8%) |
| 45 to 54 Years | 8,551 (84.3%) | 316 (3.7%) |
| 55 to 59 Years | 4,693 (77.9%) | 108 (2.3%) |
| 60 to 64 Years | 3,721 (65.3%) | 193 (5.2%) |
| 65 to 74 Years | 2,688 (29.0%) | 140 (5.2%) |
| 75 Years and over | 414 (6.2%) | 57 (13.8%) |
| Total | 45,453 (66.6%) | 2,636 (5.8%) |
Employment Status by Educational Attainment in Parma
According to labor force statistics for Parma, 82.6% of individuals (35,639) out of the total population between 25 and 64 years of age (43,147) are in the labor force, with 3.5% or 1,247 of them being unemployed. The group with the highest labor force participation rate are those with the educational attainment of bachelor's degree or higher, with 88.1% or 9,945 individuals in the labor force. Within the labor force, individuals with less than high school education have the highest percentage of unemployment, with 5.5% or 89 of them being unemployed.
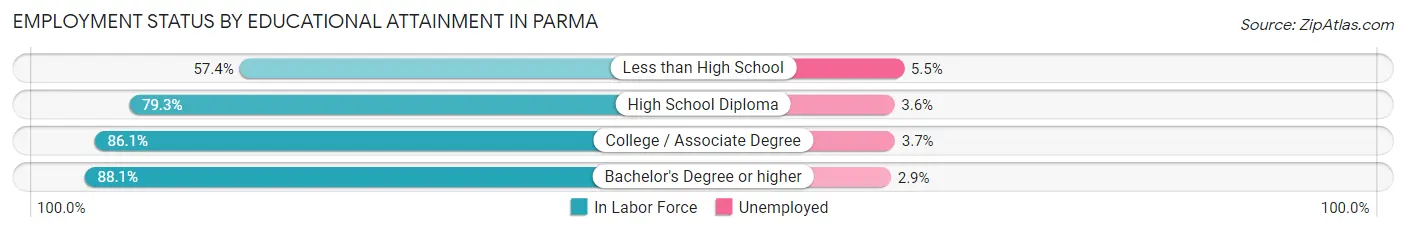
| Educational Attainment | In Labor Force | Unemployed |
| Less than High School | 1,623 (57.4%) | 156 (5.5%) |
| High School Diploma | 10,625 (79.3%) | 482 (3.6%) |
| College / Associate Degree | 13,460 (86.1%) | 578 (3.7%) |
| Bachelor's Degree or higher | 9,945 (88.1%) | 327 (2.9%) |
| Total | 35,639 (82.6%) | 1,510 (3.5%) |
Employment Occupations by Sex in Parma
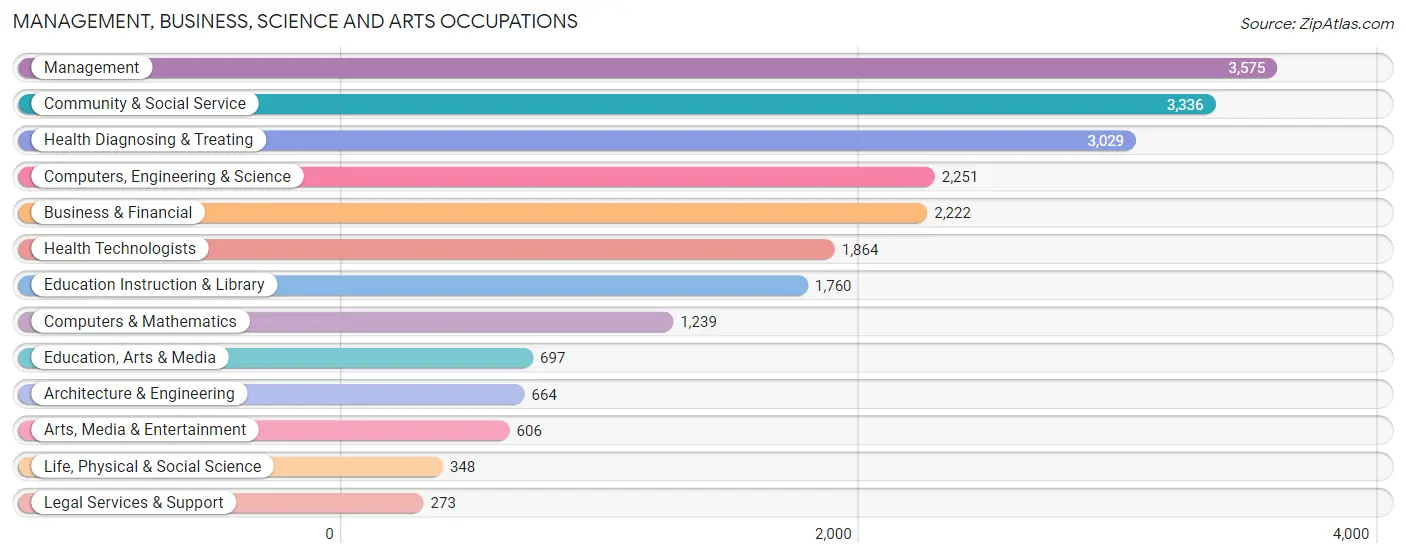
Management, Business, Science and Arts Occupations
The most common Management, Business, Science and Arts occupations in Parma are Management (3,575 | 8.4%), Community & Social Service (3,336 | 7.8%), Health Diagnosing & Treating (3,029 | 7.1%), Computers, Engineering & Science (2,251 | 5.3%), and Business & Financial (2,222 | 5.2%).
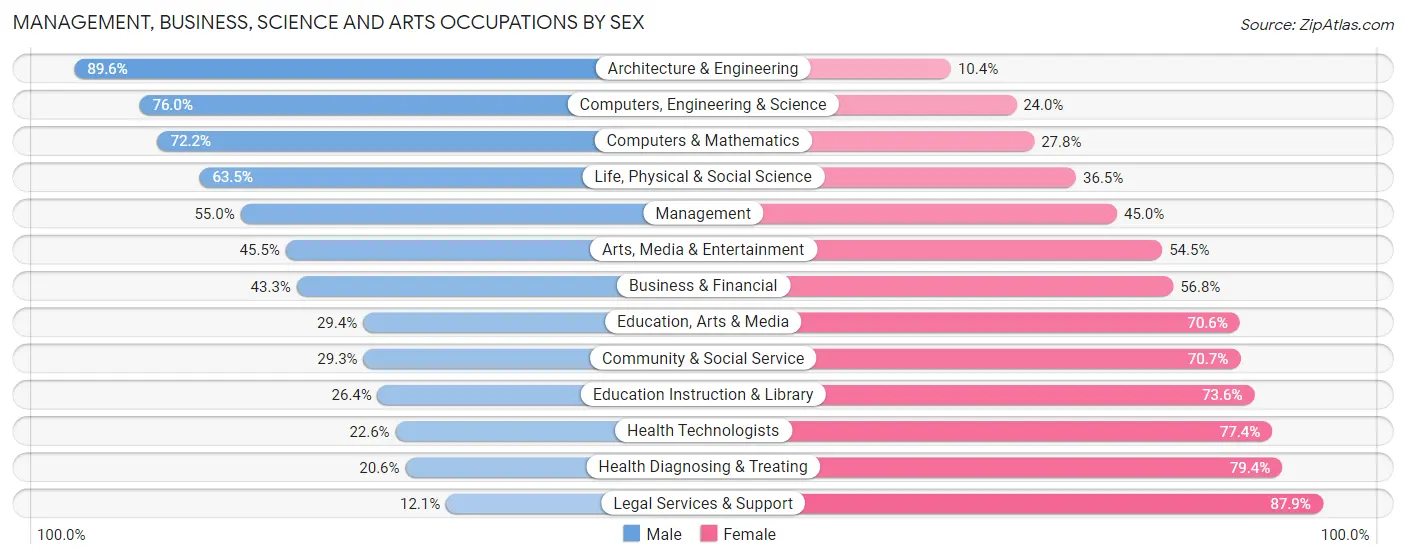
Management, Business, Science and Arts Occupations by Sex
Within the Management, Business, Science and Arts occupations in Parma, the most male-oriented occupations are Architecture & Engineering (89.6%), Computers, Engineering & Science (76.0%), and Computers & Mathematics (72.2%), while the most female-oriented occupations are Legal Services & Support (87.9%), Health Diagnosing & Treating (79.4%), and Health Technologists (77.4%).
| Occupation | Male | Female |
| Management | 1,965 (55.0%) | 1,610 (45.0%) |
| Business & Financial | 961 (43.2%) | 1,261 (56.8%) |
| Computers, Engineering & Science | 1,711 (76.0%) | 540 (24.0%) |
| Computers & Mathematics | 895 (72.2%) | 344 (27.8%) |
| Architecture & Engineering | 595 (89.6%) | 69 (10.4%) |
| Life, Physical & Social Science | 221 (63.5%) | 127 (36.5%) |
| Community & Social Service | 978 (29.3%) | 2,358 (70.7%) |
| Education, Arts & Media | 205 (29.4%) | 492 (70.6%) |
| Legal Services & Support | 33 (12.1%) | 240 (87.9%) |
| Education Instruction & Library | 464 (26.4%) | 1,296 (73.6%) |
| Arts, Media & Entertainment | 276 (45.5%) | 330 (54.5%) |
| Health Diagnosing & Treating | 623 (20.6%) | 2,406 (79.4%) |
| Health Technologists | 422 (22.6%) | 1,442 (77.4%) |
| Total (Category) | 6,238 (43.3%) | 8,175 (56.7%) |
| Total (Overall) | 22,107 (51.6%) | 20,702 (48.4%) |
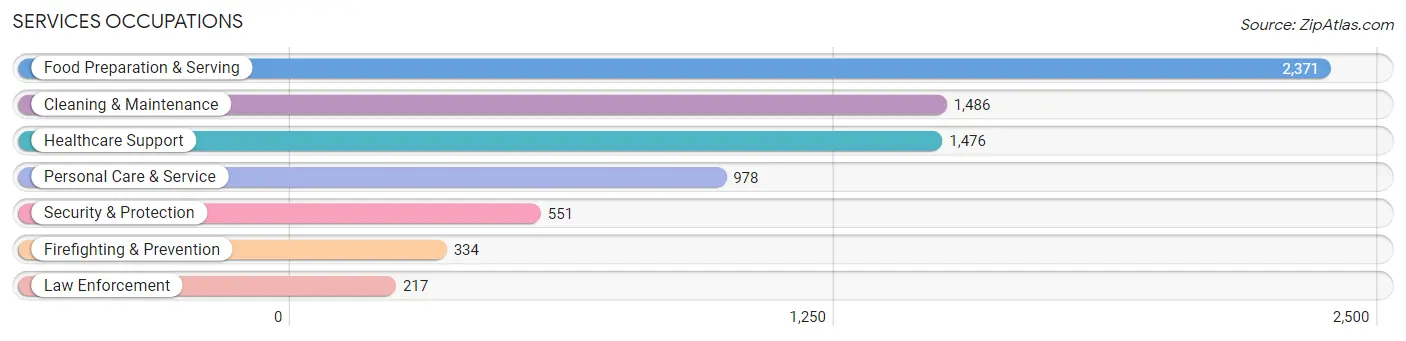
Services Occupations
The most common Services occupations in Parma are Food Preparation & Serving (2,371 | 5.5%), Cleaning & Maintenance (1,486 | 3.5%), Healthcare Support (1,476 | 3.5%), Personal Care & Service (978 | 2.3%), and Security & Protection (551 | 1.3%).
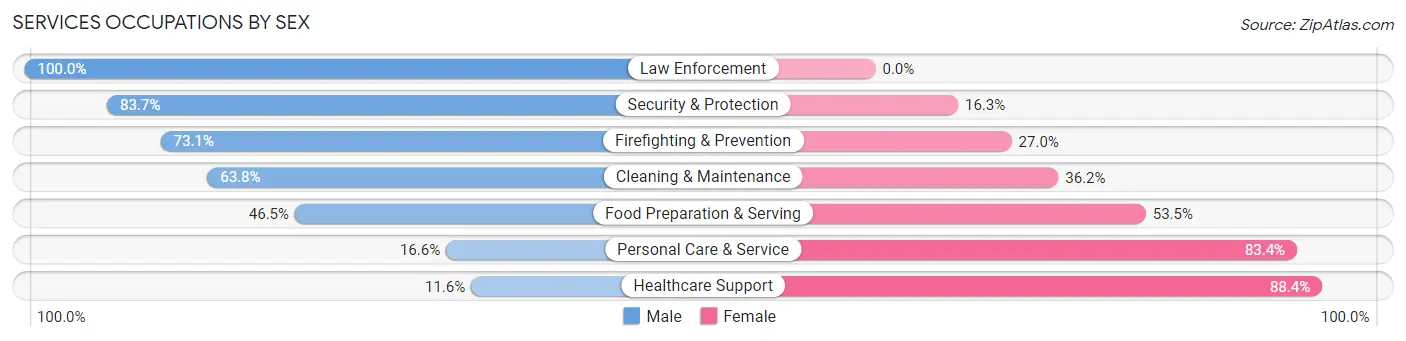
Services Occupations by Sex
Within the Services occupations in Parma, the most male-oriented occupations are Law Enforcement (100.0%), Security & Protection (83.7%), and Firefighting & Prevention (73.1%), while the most female-oriented occupations are Healthcare Support (88.4%), Personal Care & Service (83.4%), and Food Preparation & Serving (53.5%).
| Occupation | Male | Female |
| Healthcare Support | 171 (11.6%) | 1,305 (88.4%) |
| Security & Protection | 461 (83.7%) | 90 (16.3%) |
| Firefighting & Prevention | 244 (73.1%) | 90 (27.0%) |
| Law Enforcement | 217 (100.0%) | 0 (0.0%) |
| Food Preparation & Serving | 1,102 (46.5%) | 1,269 (53.5%) |
| Cleaning & Maintenance | 948 (63.8%) | 538 (36.2%) |
| Personal Care & Service | 162 (16.6%) | 816 (83.4%) |
| Total (Category) | 2,844 (41.4%) | 4,018 (58.6%) |
| Total (Overall) | 22,107 (51.6%) | 20,702 (48.4%) |
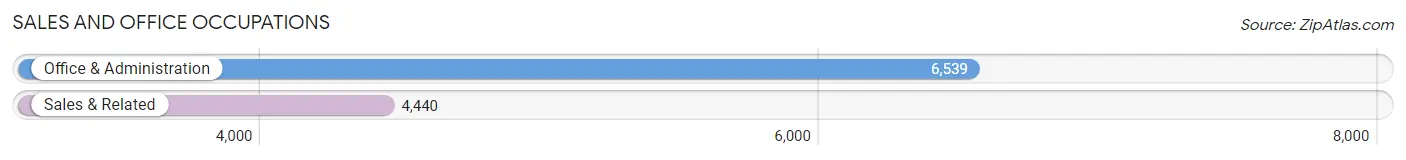
Sales and Office Occupations
The most common Sales and Office occupations in Parma are Office & Administration (6,539 | 15.3%), and Sales & Related (4,440 | 10.4%).
Sales and Office Occupations by Sex
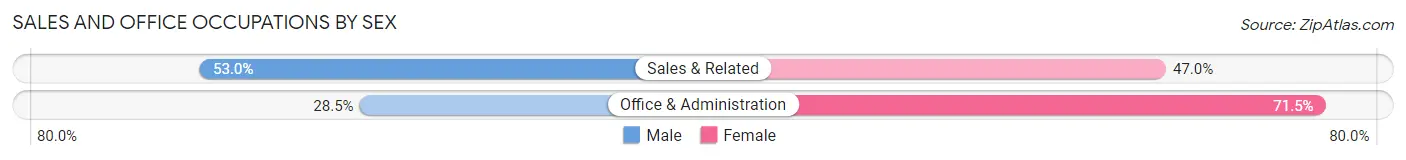
| Occupation | Male | Female |
| Sales & Related | 2,353 (53.0%) | 2,087 (47.0%) |
| Office & Administration | 1,863 (28.5%) | 4,676 (71.5%) |
| Total (Category) | 4,216 (38.4%) | 6,763 (61.6%) |
| Total (Overall) | 22,107 (51.6%) | 20,702 (48.4%) |
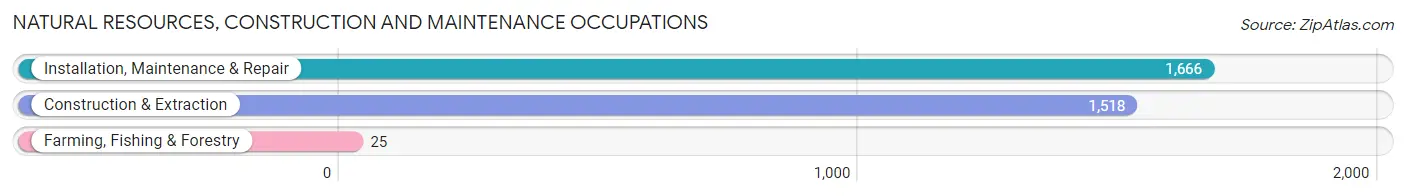
Natural Resources, Construction and Maintenance Occupations
The most common Natural Resources, Construction and Maintenance occupations in Parma are Installation, Maintenance & Repair (1,666 | 3.9%), Construction & Extraction (1,518 | 3.5%), and Farming, Fishing & Forestry (25 | 0.1%).
Natural Resources, Construction and Maintenance Occupations by Sex
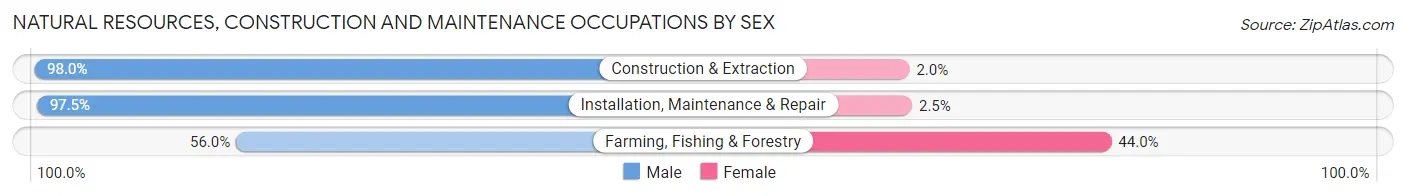
| Occupation | Male | Female |
| Farming, Fishing & Forestry | 14 (56.0%) | 11 (44.0%) |
| Construction & Extraction | 1,488 (98.0%) | 30 (2.0%) |
| Installation, Maintenance & Repair | 1,624 (97.5%) | 42 (2.5%) |
| Total (Category) | 3,126 (97.4%) | 83 (2.6%) |
| Total (Overall) | 22,107 (51.6%) | 20,702 (48.4%) |
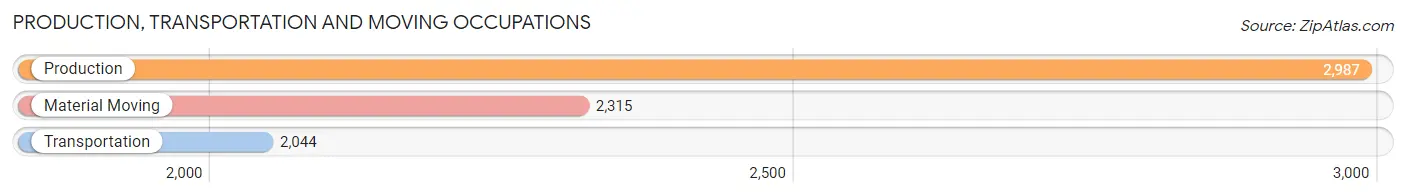
Production, Transportation and Moving Occupations
The most common Production, Transportation and Moving occupations in Parma are Production (2,987 | 7.0%), Material Moving (2,315 | 5.4%), and Transportation (2,044 | 4.8%).
Production, Transportation and Moving Occupations by Sex
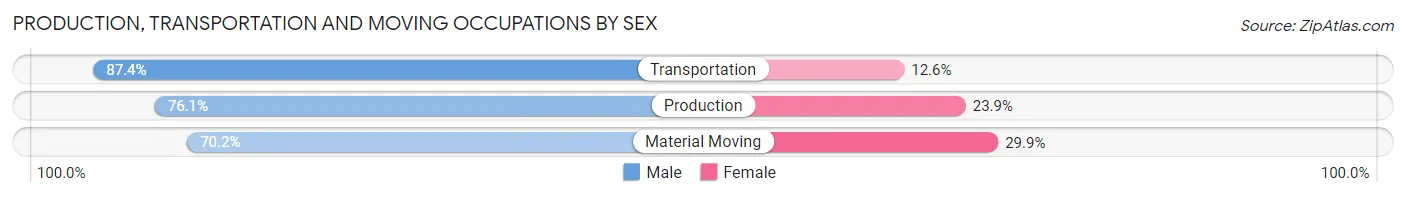
| Occupation | Male | Female |
| Production | 2,273 (76.1%) | 714 (23.9%) |
| Transportation | 1,786 (87.4%) | 258 (12.6%) |
| Material Moving | 1,624 (70.2%) | 691 (29.8%) |
| Total (Category) | 5,683 (77.4%) | 1,663 (22.6%) |
| Total (Overall) | 22,107 (51.6%) | 20,702 (48.4%) |
Employment Industries by Sex in Parma
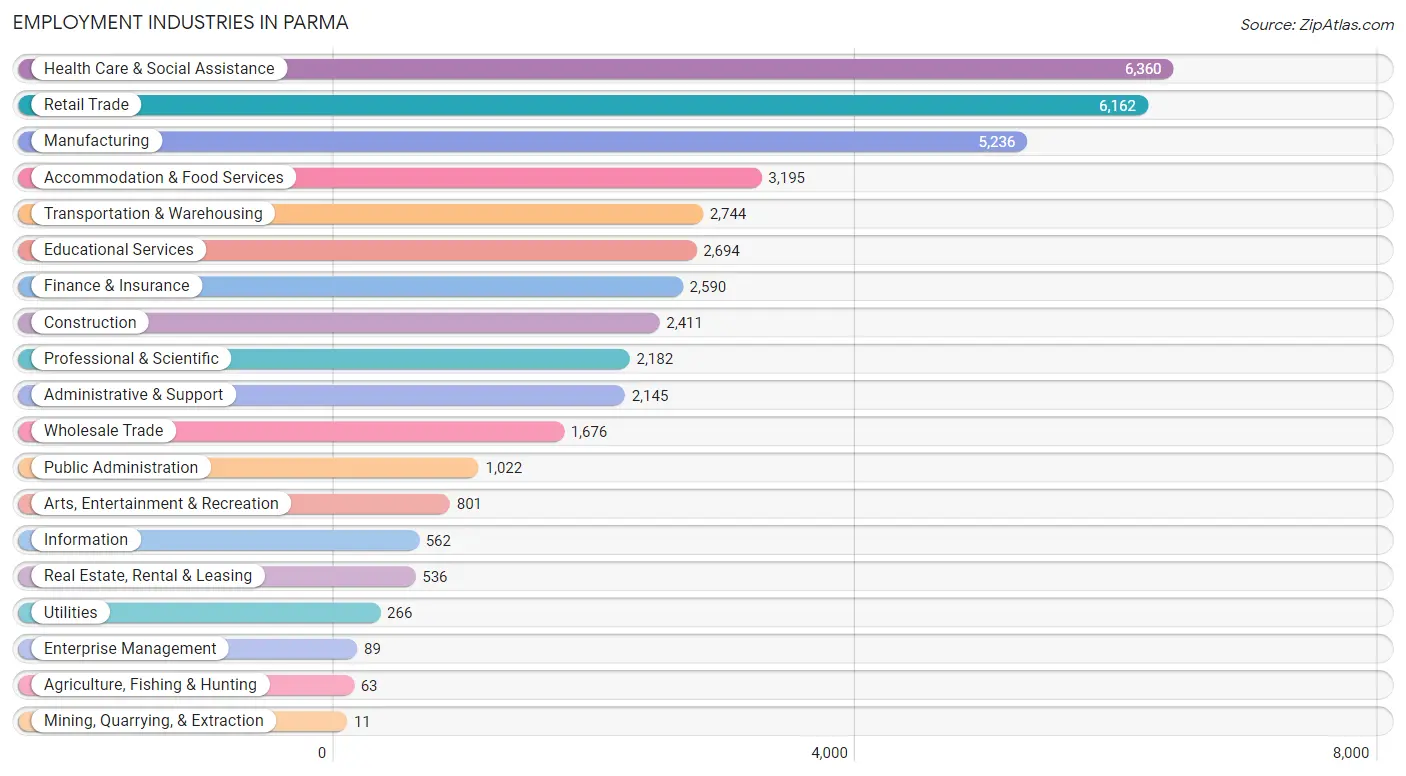
Employment Industries in Parma
The major employment industries in Parma include Health Care & Social Assistance (6,360 | 14.9%), Retail Trade (6,162 | 14.4%), Manufacturing (5,236 | 12.2%), Accommodation & Food Services (3,195 | 7.5%), and Transportation & Warehousing (2,744 | 6.4%).
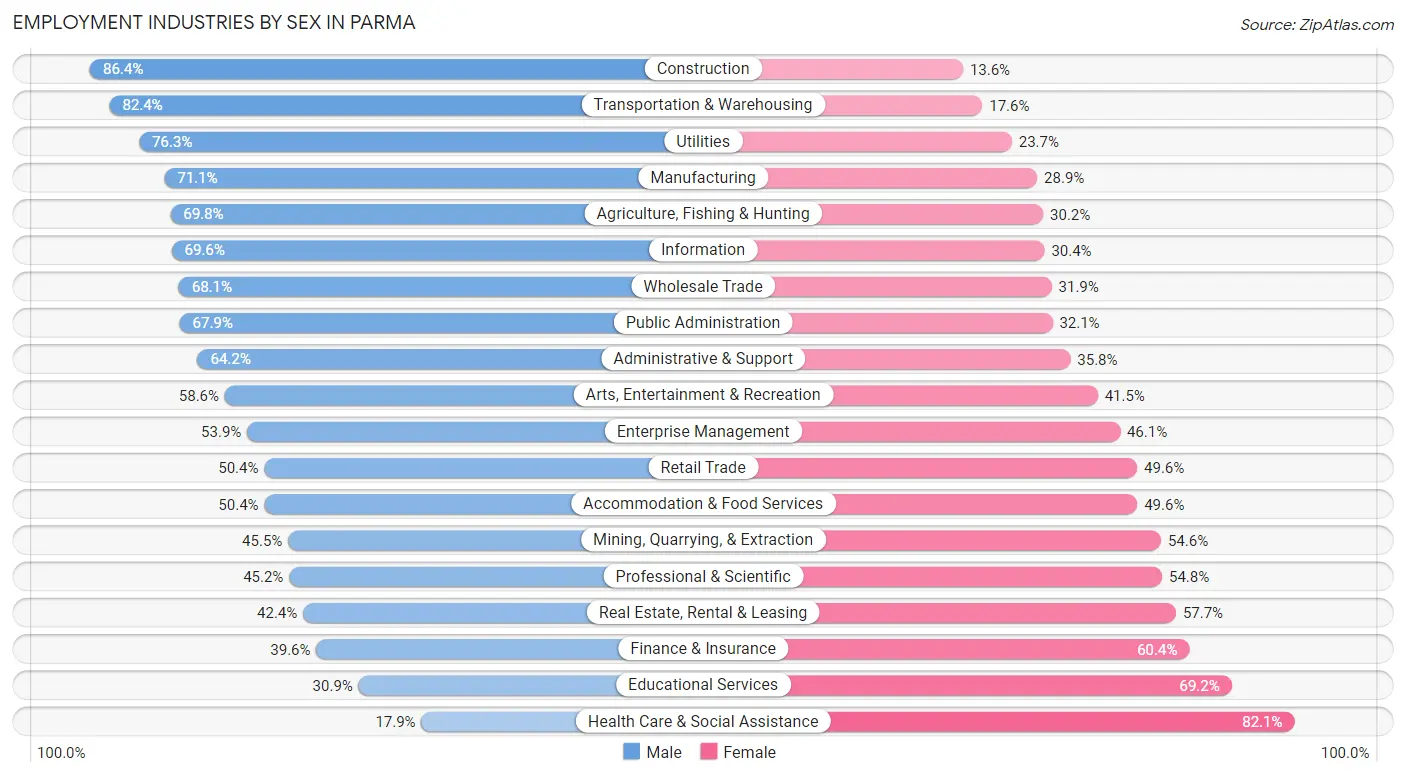
Employment Industries by Sex in Parma
The Parma industries that see more men than women are Construction (86.4%), Transportation & Warehousing (82.4%), and Utilities (76.3%), whereas the industries that tend to have a higher number of women are Health Care & Social Assistance (82.1%), Educational Services (69.2%), and Finance & Insurance (60.4%).
| Industry | Male | Female |
| Agriculture, Fishing & Hunting | 44 (69.8%) | 19 (30.2%) |
| Mining, Quarrying, & Extraction | 5 (45.5%) | 6 (54.5%) |
| Construction | 2,084 (86.4%) | 327 (13.6%) |
| Manufacturing | 3,722 (71.1%) | 1,514 (28.9%) |
| Wholesale Trade | 1,141 (68.1%) | 535 (31.9%) |
| Retail Trade | 3,105 (50.4%) | 3,057 (49.6%) |
| Transportation & Warehousing | 2,262 (82.4%) | 482 (17.6%) |
| Utilities | 203 (76.3%) | 63 (23.7%) |
| Information | 391 (69.6%) | 171 (30.4%) |
| Finance & Insurance | 1,026 (39.6%) | 1,564 (60.4%) |
| Real Estate, Rental & Leasing | 227 (42.3%) | 309 (57.7%) |
| Professional & Scientific | 987 (45.2%) | 1,195 (54.8%) |
| Enterprise Management | 48 (53.9%) | 41 (46.1%) |
| Administrative & Support | 1,377 (64.2%) | 768 (35.8%) |
| Educational Services | 831 (30.8%) | 1,863 (69.2%) |
| Health Care & Social Assistance | 1,136 (17.9%) | 5,224 (82.1%) |
| Arts, Entertainment & Recreation | 469 (58.6%) | 332 (41.4%) |
| Accommodation & Food Services | 1,609 (50.4%) | 1,586 (49.6%) |
| Public Administration | 694 (67.9%) | 328 (32.1%) |
| Total | 22,107 (51.6%) | 20,702 (48.4%) |
Education in Parma
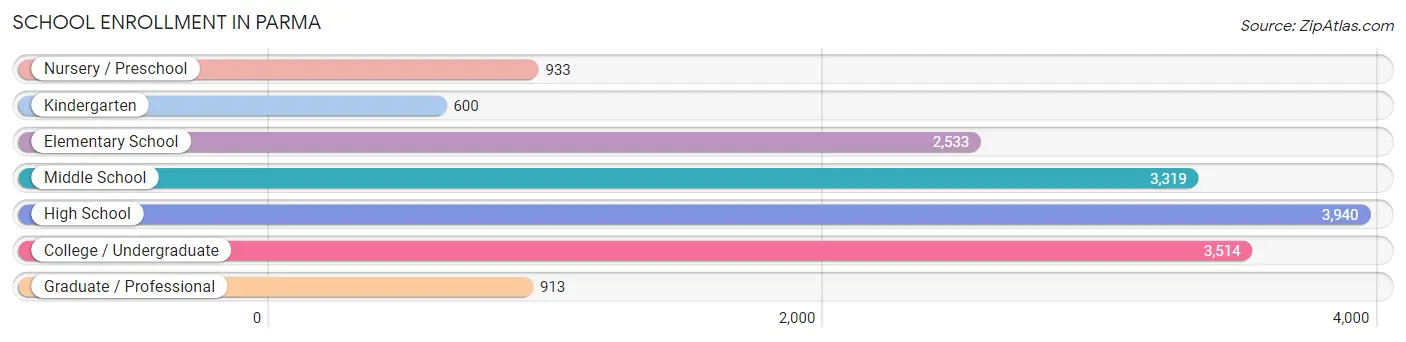
School Enrollment in Parma
The most common levels of schooling among the 15,752 students in Parma are high school (3,940 | 25.0%), college / undergraduate (3,514 | 22.3%), and middle school (3,319 | 21.1%).
| School Level | # Students | % Students |
| Nursery / Preschool | 933 | 5.9% |
| Kindergarten | 600 | 3.8% |
| Elementary School | 2,533 | 16.1% |
| Middle School | 3,319 | 21.1% |
| High School | 3,940 | 25.0% |
| College / Undergraduate | 3,514 | 22.3% |
| Graduate / Professional | 913 | 5.8% |
| Total | 15,752 | 100.0% |
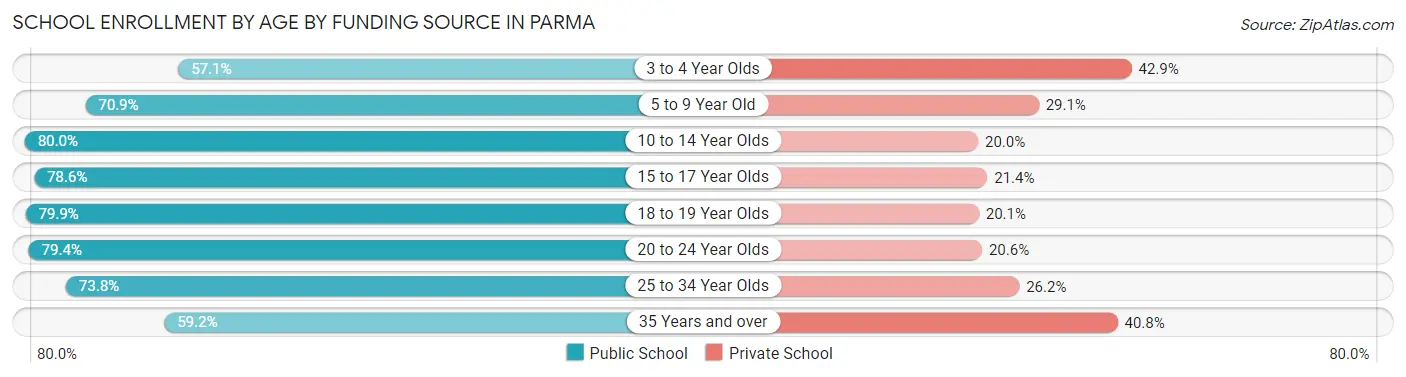
School Enrollment by Age by Funding Source in Parma
Out of a total of 15,752 students who are enrolled in schools in Parma, 3,891 (24.7%) attend a private institution, while the remaining 11,861 (75.3%) are enrolled in public schools. The age group of 3 to 4 year olds has the highest likelihood of being enrolled in private schools, with 296 (42.9% in the age bracket) enrolled. Conversely, the age group of 10 to 14 year olds has the lowest likelihood of being enrolled in a private school, with 3,216 (80.0% in the age bracket) attending a public institution.
| Age Bracket | Public School | Private School |
| 3 to 4 Year Olds | 394 (57.1%) | 296 (42.9%) |
| 5 to 9 Year Old | 2,217 (70.9%) | 908 (29.1%) |
| 10 to 14 Year Olds | 3,216 (80.0%) | 805 (20.0%) |
| 15 to 17 Year Olds | 1,862 (78.6%) | 507 (21.4%) |
| 18 to 19 Year Olds | 1,317 (79.9%) | 332 (20.1%) |
| 20 to 24 Year Olds | 1,406 (79.4%) | 365 (20.6%) |
| 25 to 34 Year Olds | 988 (73.8%) | 350 (26.2%) |
| 35 Years and over | 467 (59.2%) | 322 (40.8%) |
| Total | 11,861 (75.3%) | 3,891 (24.7%) |
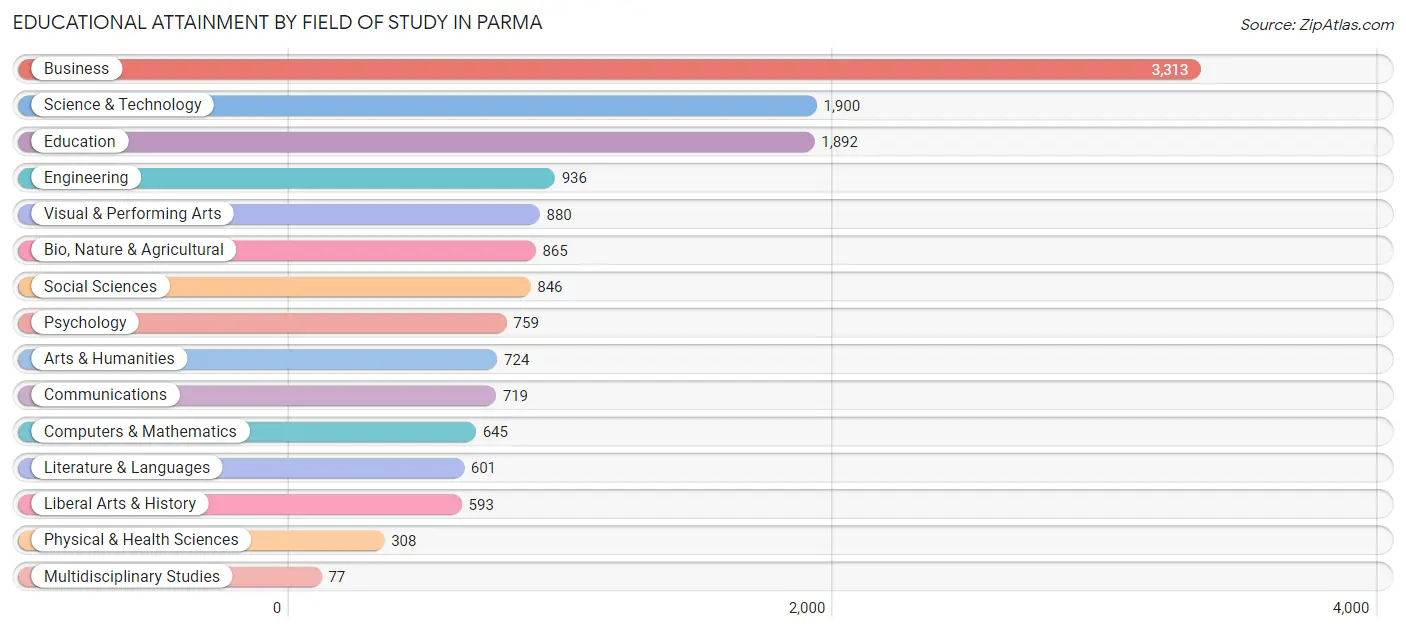
Educational Attainment by Field of Study in Parma
Business (3,313 | 22.0%), science & technology (1,900 | 12.6%), education (1,892 | 12.6%), engineering (936 | 6.2%), and visual & performing arts (880 | 5.8%) are the most common fields of study among 15,058 individuals in Parma who have obtained a bachelor's degree or higher.
| Field of Study | # Graduates | % Graduates |
| Computers & Mathematics | 645 | 4.3% |
| Bio, Nature & Agricultural | 865 | 5.7% |
| Physical & Health Sciences | 308 | 2.1% |
| Psychology | 759 | 5.0% |
| Social Sciences | 846 | 5.6% |
| Engineering | 936 | 6.2% |
| Multidisciplinary Studies | 77 | 0.5% |
| Science & Technology | 1,900 | 12.6% |
| Business | 3,313 | 22.0% |
| Education | 1,892 | 12.6% |
| Literature & Languages | 601 | 4.0% |
| Liberal Arts & History | 593 | 3.9% |
| Visual & Performing Arts | 880 | 5.8% |
| Communications | 719 | 4.8% |
| Arts & Humanities | 724 | 4.8% |
| Total | 15,058 | 100.0% |
Transportation & Commute in Parma
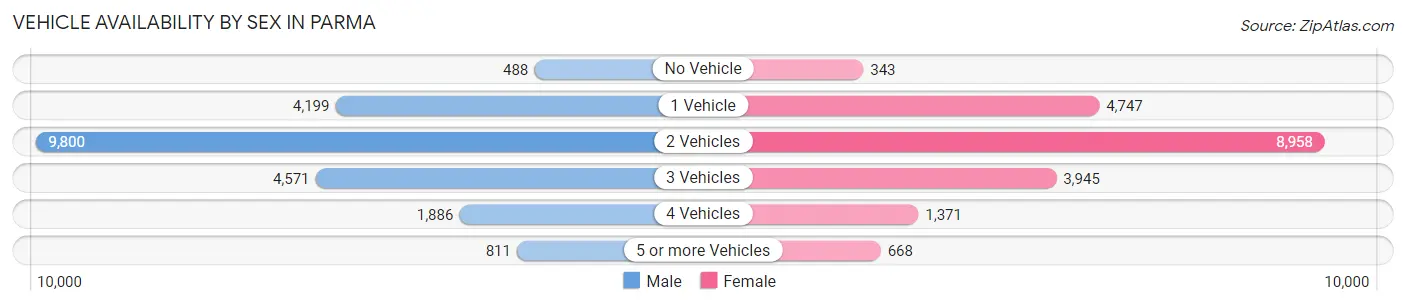
Vehicle Availability by Sex in Parma
The most prevalent vehicle ownership categories in Parma are males with 2 vehicles (9,800, accounting for 45.1%) and females with 2 vehicles (8,958, making up 48.9%).
| Vehicles Available | Male | Female |
| No Vehicle | 488 (2.2%) | 343 (1.7%) |
| 1 Vehicle | 4,199 (19.3%) | 4,747 (23.7%) |
| 2 Vehicles | 9,800 (45.1%) | 8,958 (44.7%) |
| 3 Vehicles | 4,571 (21.0%) | 3,945 (19.7%) |
| 4 Vehicles | 1,886 (8.7%) | 1,371 (6.8%) |
| 5 or more Vehicles | 811 (3.7%) | 668 (3.3%) |
| Total | 21,755 (100.0%) | 20,032 (100.0%) |
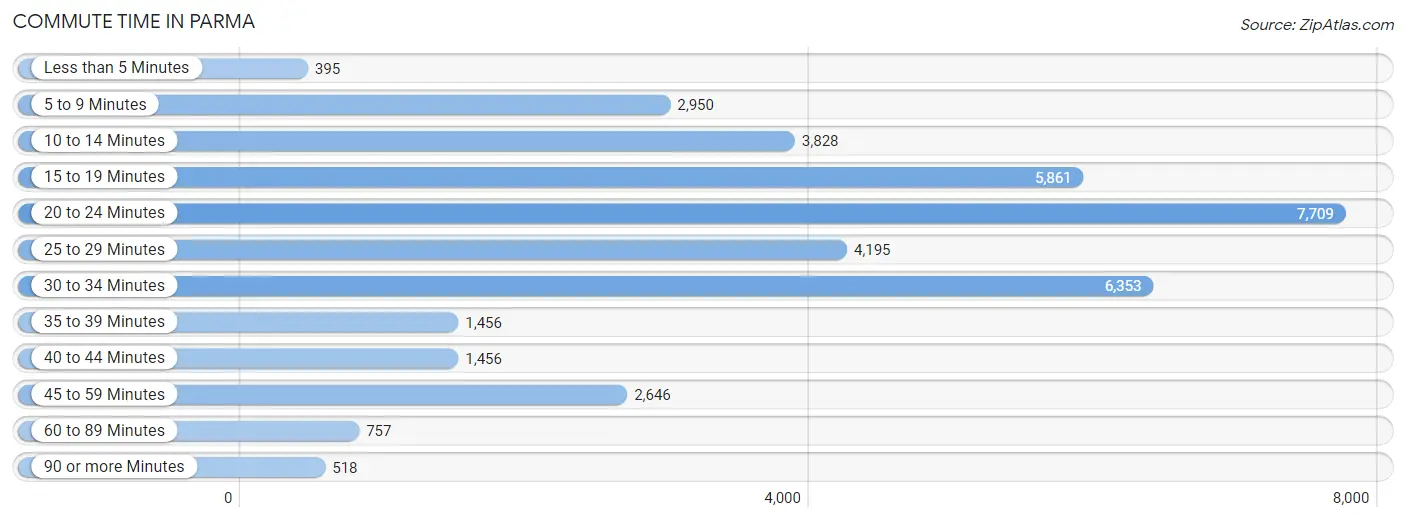
Commute Time in Parma
The most frequently occuring commute durations in Parma are 20 to 24 minutes (7,709 commuters, 20.2%), 30 to 34 minutes (6,353 commuters, 16.7%), and 15 to 19 minutes (5,861 commuters, 15.4%).
| Commute Time | # Commuters | % Commuters |
| Less than 5 Minutes | 395 | 1.0% |
| 5 to 9 Minutes | 2,950 | 7.7% |
| 10 to 14 Minutes | 3,828 | 10.0% |
| 15 to 19 Minutes | 5,861 | 15.4% |
| 20 to 24 Minutes | 7,709 | 20.2% |
| 25 to 29 Minutes | 4,195 | 11.0% |
| 30 to 34 Minutes | 6,353 | 16.7% |
| 35 to 39 Minutes | 1,456 | 3.8% |
| 40 to 44 Minutes | 1,456 | 3.8% |
| 45 to 59 Minutes | 2,646 | 6.9% |
| 60 to 89 Minutes | 757 | 2.0% |
| 90 or more Minutes | 518 | 1.4% |
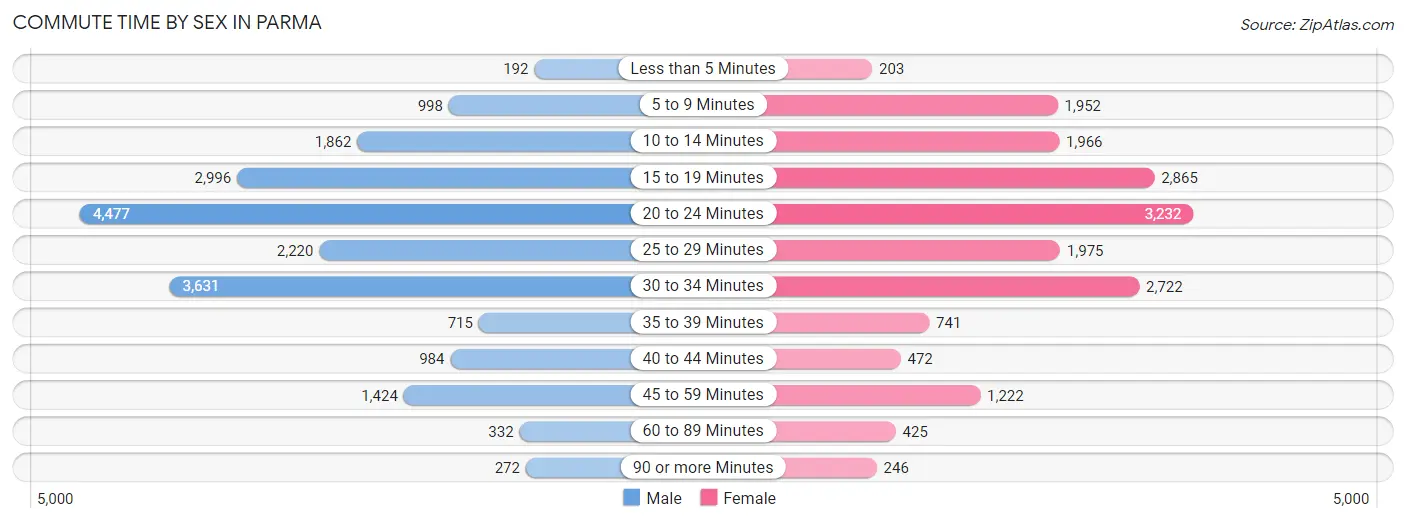
Commute Time by Sex in Parma
The most common commute times in Parma are 20 to 24 minutes (4,477 commuters, 22.3%) for males and 20 to 24 minutes (3,232 commuters, 17.9%) for females.
| Commute Time | Male | Female |
| Less than 5 Minutes | 192 (1.0%) | 203 (1.1%) |
| 5 to 9 Minutes | 998 (5.0%) | 1,952 (10.8%) |
| 10 to 14 Minutes | 1,862 (9.3%) | 1,966 (10.9%) |
| 15 to 19 Minutes | 2,996 (14.9%) | 2,865 (15.9%) |
| 20 to 24 Minutes | 4,477 (22.3%) | 3,232 (17.9%) |
| 25 to 29 Minutes | 2,220 (11.0%) | 1,975 (11.0%) |
| 30 to 34 Minutes | 3,631 (18.1%) | 2,722 (15.1%) |
| 35 to 39 Minutes | 715 (3.6%) | 741 (4.1%) |
| 40 to 44 Minutes | 984 (4.9%) | 472 (2.6%) |
| 45 to 59 Minutes | 1,424 (7.1%) | 1,222 (6.8%) |
| 60 to 89 Minutes | 332 (1.7%) | 425 (2.4%) |
| 90 or more Minutes | 272 (1.3%) | 246 (1.4%) |
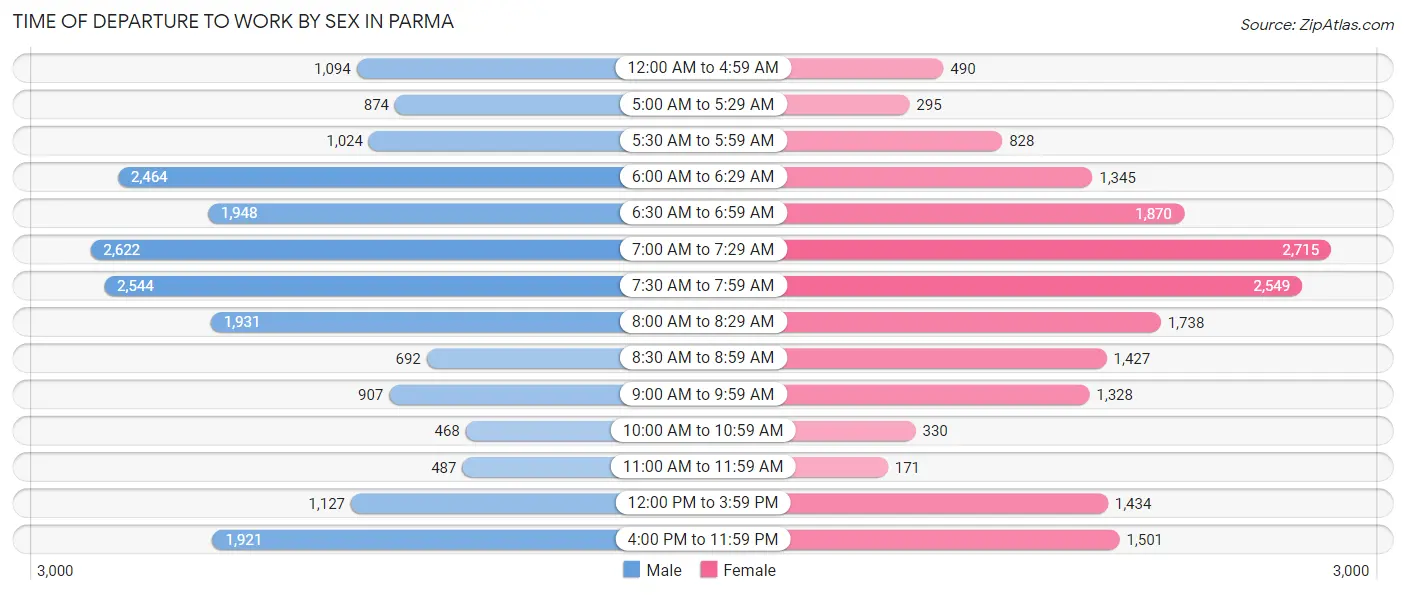
Time of Departure to Work by Sex in Parma
The most frequent times of departure to work in Parma are 7:00 AM to 7:29 AM (2,622, 13.0%) for males and 7:00 AM to 7:29 AM (2,715, 15.1%) for females.
| Time of Departure | Male | Female |
| 12:00 AM to 4:59 AM | 1,094 (5.4%) | 490 (2.7%) |
| 5:00 AM to 5:29 AM | 874 (4.3%) | 295 (1.6%) |
| 5:30 AM to 5:59 AM | 1,024 (5.1%) | 828 (4.6%) |
| 6:00 AM to 6:29 AM | 2,464 (12.3%) | 1,345 (7.5%) |
| 6:30 AM to 6:59 AM | 1,948 (9.7%) | 1,870 (10.4%) |
| 7:00 AM to 7:29 AM | 2,622 (13.0%) | 2,715 (15.1%) |
| 7:30 AM to 7:59 AM | 2,544 (12.7%) | 2,549 (14.1%) |
| 8:00 AM to 8:29 AM | 1,931 (9.6%) | 1,738 (9.6%) |
| 8:30 AM to 8:59 AM | 692 (3.4%) | 1,427 (7.9%) |
| 9:00 AM to 9:59 AM | 907 (4.5%) | 1,328 (7.4%) |
| 10:00 AM to 10:59 AM | 468 (2.3%) | 330 (1.8%) |
| 11:00 AM to 11:59 AM | 487 (2.4%) | 171 (0.9%) |
| 12:00 PM to 3:59 PM | 1,127 (5.6%) | 1,434 (8.0%) |
| 4:00 PM to 11:59 PM | 1,921 (9.6%) | 1,501 (8.3%) |
| Total | 20,103 (100.0%) | 18,021 (100.0%) |
Housing Occupancy in Parma
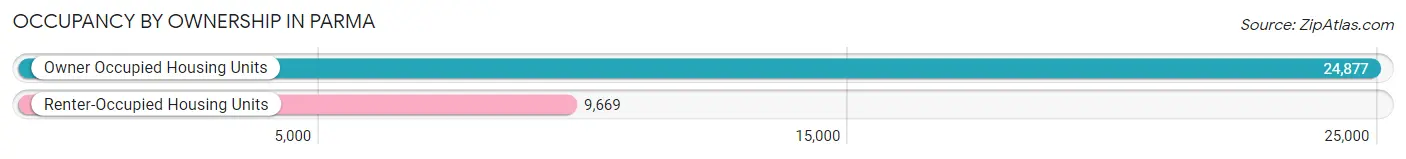
Occupancy by Ownership in Parma
Of the total 34,546 dwellings in Parma, owner-occupied units account for 24,877 (72.0%), while renter-occupied units make up 9,669 (28.0%).
| Occupancy | # Housing Units | % Housing Units |
| Owner Occupied Housing Units | 24,877 | 72.0% |
| Renter-Occupied Housing Units | 9,669 | 28.0% |
| Total Occupied Housing Units | 34,546 | 100.0% |
Occupancy by Household Size in Parma
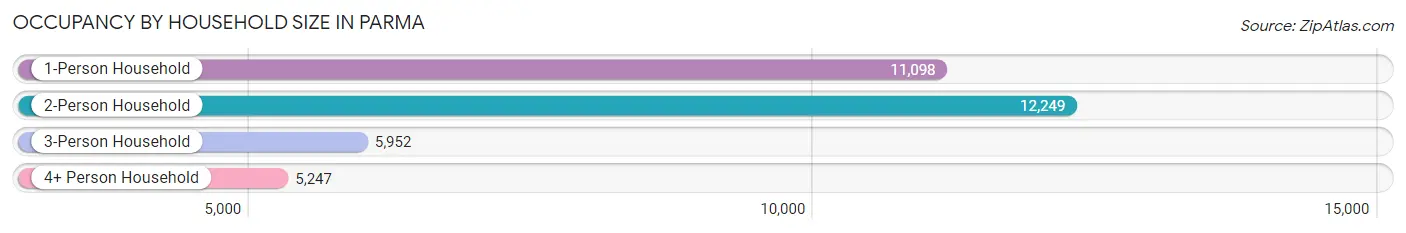
| Household Size | # Housing Units | % Housing Units |
| 1-Person Household | 11,098 | 32.1% |
| 2-Person Household | 12,249 | 35.5% |
| 3-Person Household | 5,952 | 17.2% |
| 4+ Person Household | 5,247 | 15.2% |
| Total Housing Units | 34,546 | 100.0% |
Occupancy by Ownership by Household Size in Parma
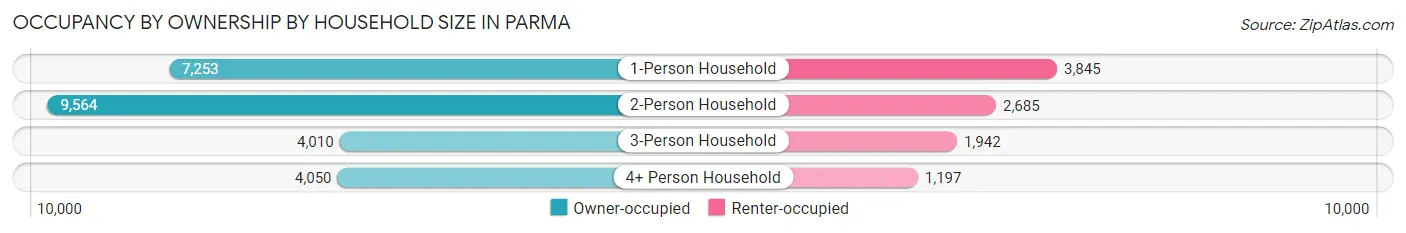
| Household Size | Owner-occupied | Renter-occupied |
| 1-Person Household | 7,253 (65.3%) | 3,845 (34.6%) |
| 2-Person Household | 9,564 (78.1%) | 2,685 (21.9%) |
| 3-Person Household | 4,010 (67.4%) | 1,942 (32.6%) |
| 4+ Person Household | 4,050 (77.2%) | 1,197 (22.8%) |
| Total Housing Units | 24,877 (72.0%) | 9,669 (28.0%) |
Occupancy by Educational Attainment in Parma
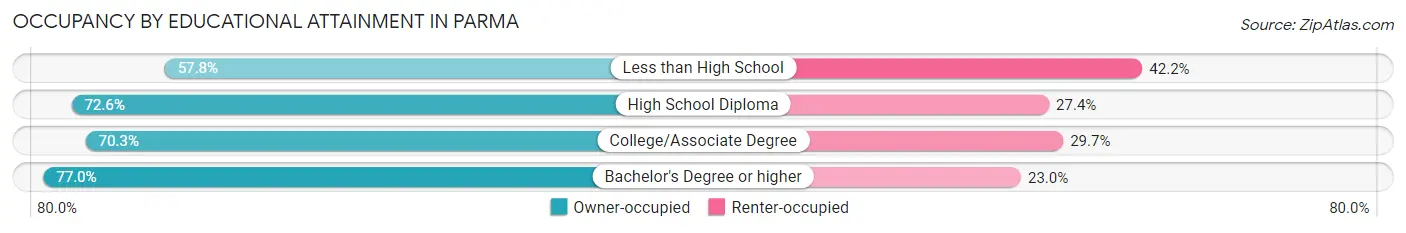
| Household Size | Owner-occupied | Renter-occupied |
| Less than High School | 1,208 (57.8%) | 883 (42.2%) |
| High School Diploma | 7,936 (72.6%) | 3,001 (27.4%) |
| College/Associate Degree | 8,828 (70.3%) | 3,725 (29.7%) |
| Bachelor's Degree or higher | 6,905 (77.0%) | 2,060 (23.0%) |
Occupancy by Age of Householder in Parma
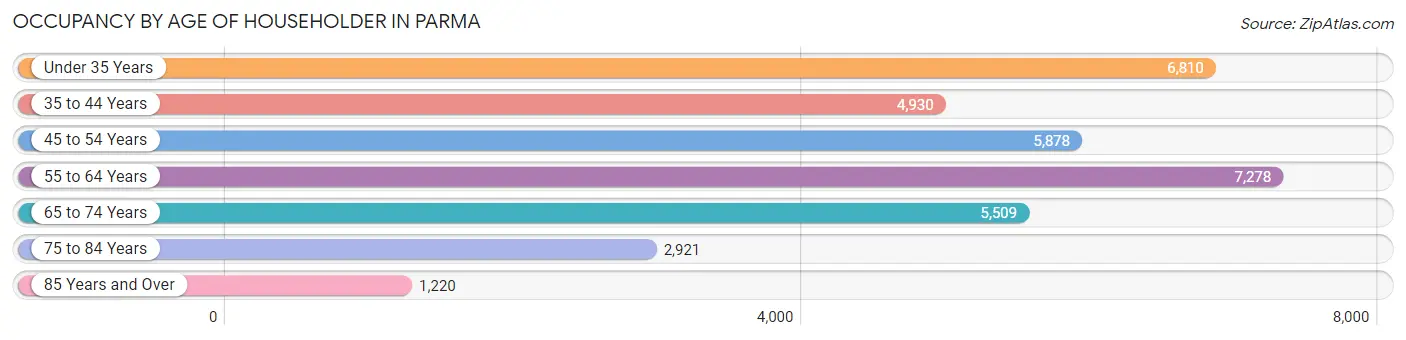
| Age Bracket | # Households | % Households |
| Under 35 Years | 6,810 | 19.7% |
| 35 to 44 Years | 4,930 | 14.3% |
| 45 to 54 Years | 5,878 | 17.0% |
| 55 to 64 Years | 7,278 | 21.1% |
| 65 to 74 Years | 5,509 | 16.0% |
| 75 to 84 Years | 2,921 | 8.5% |
| 85 Years and Over | 1,220 | 3.5% |
| Total | 34,546 | 100.0% |
Housing Finances in Parma
Median Income by Occupancy in Parma
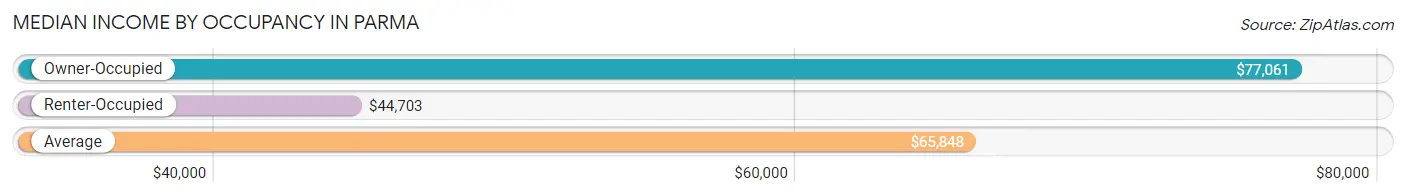
| Occupancy Type | # Households | Median Income |
| Owner-Occupied | 24,877 (72.0%) | $77,061 |
| Renter-Occupied | 9,669 (28.0%) | $44,703 |
| Average | 34,546 (100.0%) | $65,848 |
Occupancy by Householder Income Bracket in Parma
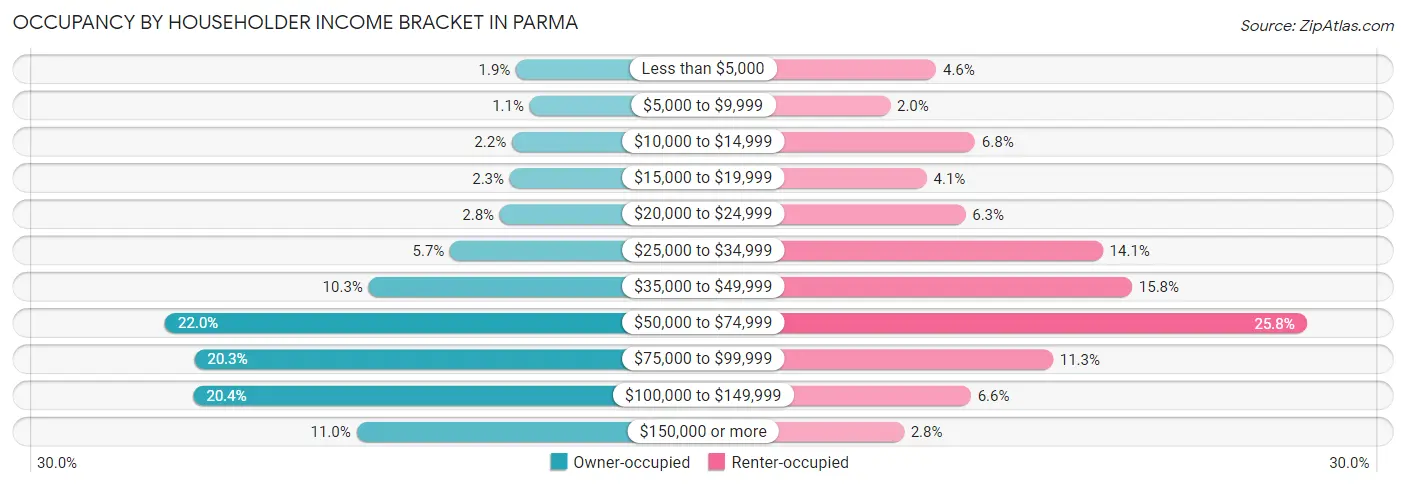
| Income Bracket | Owner-occupied | Renter-occupied |
| Less than $5,000 | 475 (1.9%) | 445 (4.6%) |
| $5,000 to $9,999 | 281 (1.1%) | 190 (2.0%) |
| $10,000 to $14,999 | 536 (2.1%) | 659 (6.8%) |
| $15,000 to $19,999 | 565 (2.3%) | 393 (4.1%) |
| $20,000 to $24,999 | 707 (2.8%) | 606 (6.3%) |
| $25,000 to $34,999 | 1,414 (5.7%) | 1,365 (14.1%) |
| $35,000 to $49,999 | 2,573 (10.3%) | 1,527 (15.8%) |
| $50,000 to $74,999 | 5,467 (22.0%) | 2,492 (25.8%) |
| $75,000 to $99,999 | 5,049 (20.3%) | 1,090 (11.3%) |
| $100,000 to $149,999 | 5,066 (20.4%) | 636 (6.6%) |
| $150,000 or more | 2,744 (11.0%) | 266 (2.8%) |
| Total | 24,877 (100.0%) | 9,669 (100.0%) |
Monthly Housing Cost Tiers in Parma
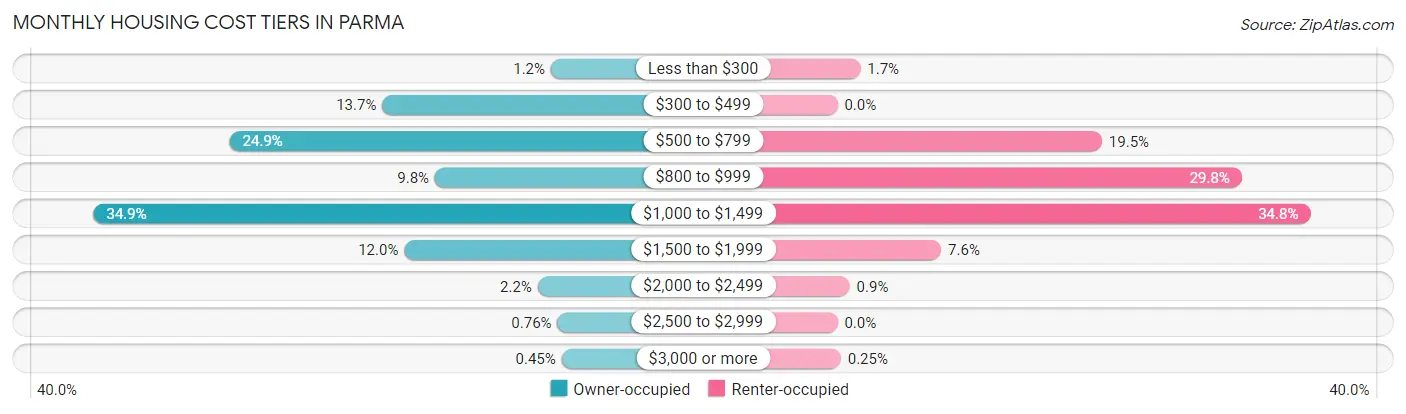
| Monthly Cost | Owner-occupied | Renter-occupied |
| Less than $300 | 309 (1.2%) | 163 (1.7%) |
| $300 to $499 | 3,398 (13.7%) | 0 (0.0%) |
| $500 to $799 | 6,197 (24.9%) | 1,884 (19.5%) |
| $800 to $999 | 2,434 (9.8%) | 2,878 (29.8%) |
| $1,000 to $1,499 | 8,692 (34.9%) | 3,367 (34.8%) |
| $1,500 to $1,999 | 2,995 (12.0%) | 739 (7.6%) |
| $2,000 to $2,499 | 550 (2.2%) | 87 (0.9%) |
| $2,500 to $2,999 | 190 (0.8%) | 0 (0.0%) |
| $3,000 or more | 112 (0.4%) | 24 (0.3%) |
| Total | 24,877 (100.0%) | 9,669 (100.0%) |
Physical Housing Characteristics in Parma
Housing Structures in Parma
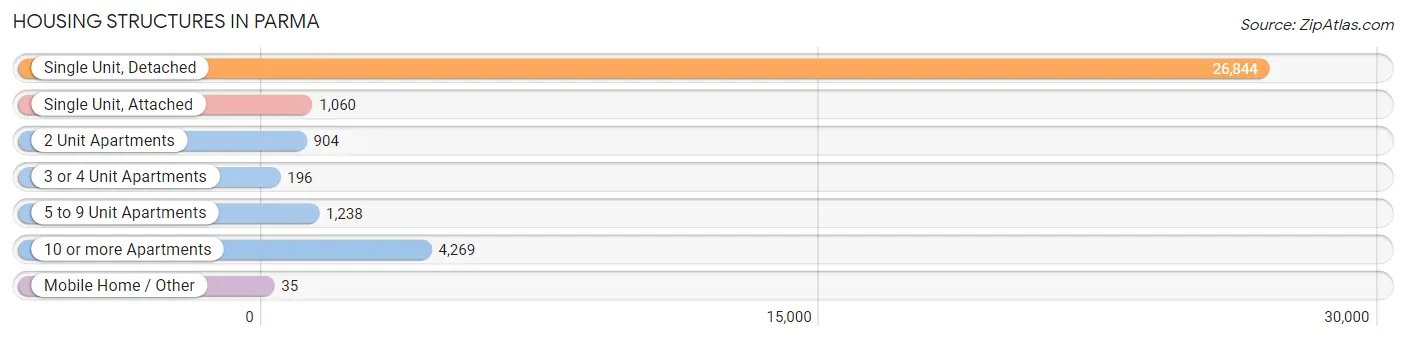
| Structure Type | # Housing Units | % Housing Units |
| Single Unit, Detached | 26,844 | 77.7% |
| Single Unit, Attached | 1,060 | 3.1% |
| 2 Unit Apartments | 904 | 2.6% |
| 3 or 4 Unit Apartments | 196 | 0.6% |
| 5 to 9 Unit Apartments | 1,238 | 3.6% |
| 10 or more Apartments | 4,269 | 12.4% |
| Mobile Home / Other | 35 | 0.1% |
| Total | 34,546 | 100.0% |
Housing Structures by Occupancy in Parma
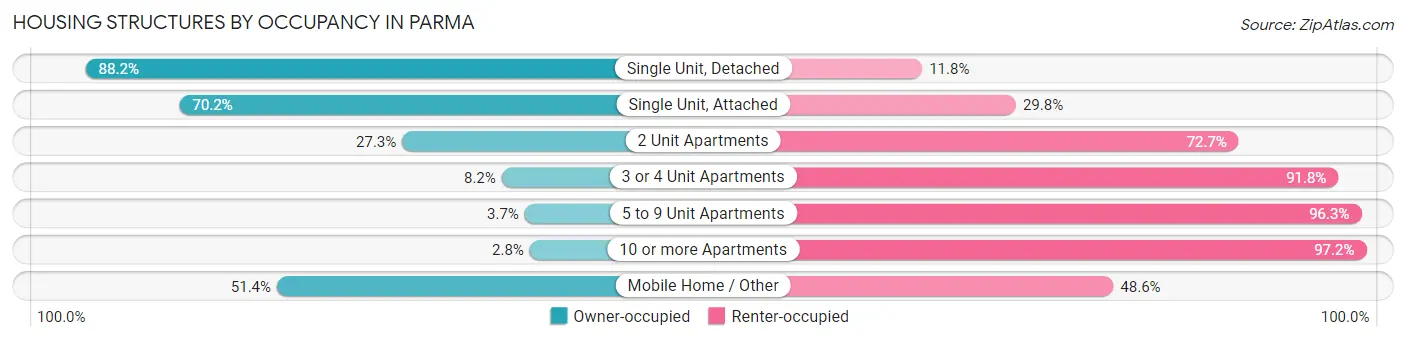
| Structure Type | Owner-occupied | Renter-occupied |
| Single Unit, Detached | 23,688 (88.2%) | 3,156 (11.8%) |
| Single Unit, Attached | 744 (70.2%) | 316 (29.8%) |
| 2 Unit Apartments | 247 (27.3%) | 657 (72.7%) |
| 3 or 4 Unit Apartments | 16 (8.2%) | 180 (91.8%) |
| 5 to 9 Unit Apartments | 46 (3.7%) | 1,192 (96.3%) |
| 10 or more Apartments | 118 (2.8%) | 4,151 (97.2%) |
| Mobile Home / Other | 18 (51.4%) | 17 (48.6%) |
| Total | 24,877 (72.0%) | 9,669 (28.0%) |
Housing Structures by Number of Rooms in Parma
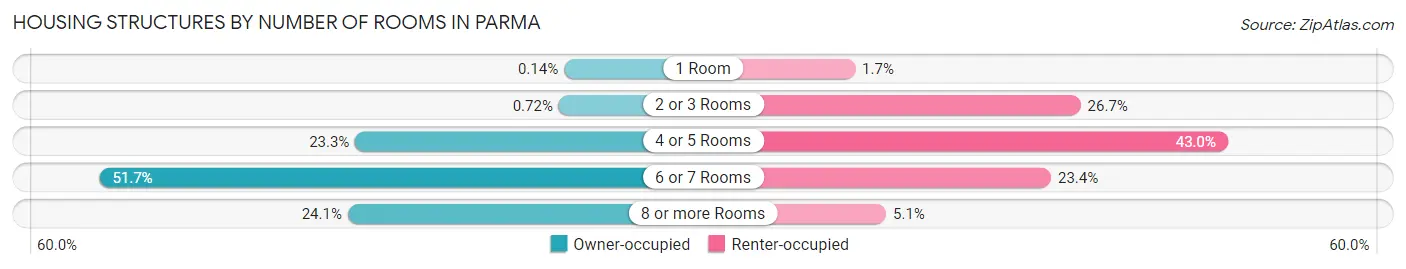
| Number of Rooms | Owner-occupied | Renter-occupied |
| 1 Room | 35 (0.1%) | 163 (1.7%) |
| 2 or 3 Rooms | 178 (0.7%) | 2,584 (26.7%) |
| 4 or 5 Rooms | 5,799 (23.3%) | 4,162 (43.0%) |
| 6 or 7 Rooms | 12,859 (51.7%) | 2,265 (23.4%) |
| 8 or more Rooms | 6,006 (24.1%) | 495 (5.1%) |
| Total | 24,877 (100.0%) | 9,669 (100.0%) |
Housing Structure by Heating Type in Parma
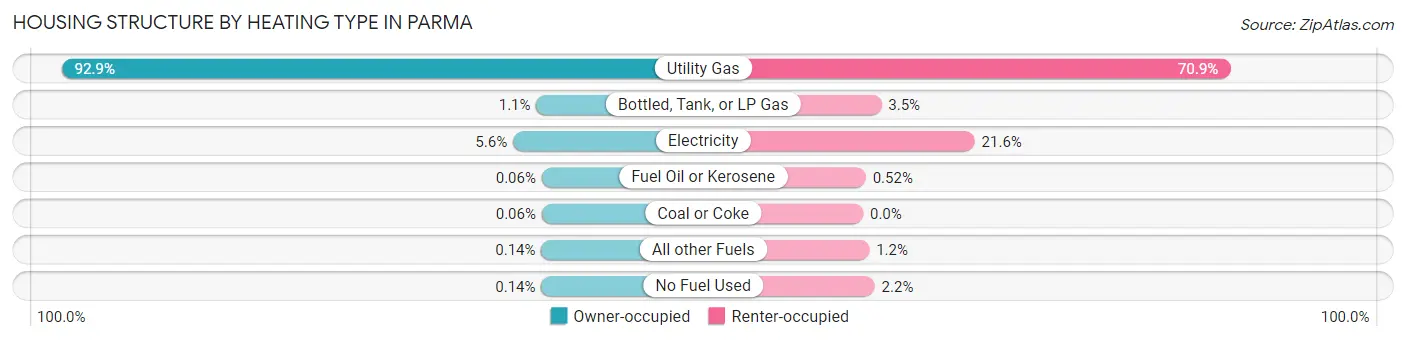
| Heating Type | Owner-occupied | Renter-occupied |
| Utility Gas | 23,101 (92.9%) | 6,858 (70.9%) |
| Bottled, Tank, or LP Gas | 277 (1.1%) | 342 (3.5%) |
| Electricity | 1,401 (5.6%) | 2,086 (21.6%) |
| Fuel Oil or Kerosene | 14 (0.1%) | 50 (0.5%) |
| Coal or Coke | 15 (0.1%) | 0 (0.0%) |
| All other Fuels | 34 (0.1%) | 116 (1.2%) |
| No Fuel Used | 35 (0.1%) | 217 (2.2%) |
| Total | 24,877 (100.0%) | 9,669 (100.0%) |
Household Vehicle Usage in Parma
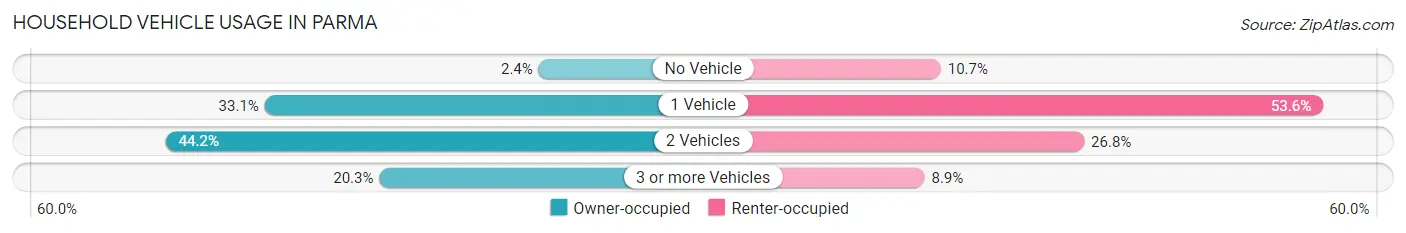
| Vehicles per Household | Owner-occupied | Renter-occupied |
| No Vehicle | 602 (2.4%) | 1,038 (10.7%) |
| 1 Vehicle | 8,238 (33.1%) | 5,178 (53.5%) |
| 2 Vehicles | 10,995 (44.2%) | 2,591 (26.8%) |
| 3 or more Vehicles | 5,042 (20.3%) | 862 (8.9%) |
| Total | 24,877 (100.0%) | 9,669 (100.0%) |
Real Estate & Mortgages in Parma
Real Estate and Mortgage Overview in Parma
| Characteristic | Without Mortgage | With Mortgage |
| Housing Units | 9,785 | 15,092 |
| Median Property Value | $140,600 | $147,900 |
| Median Household Income | $62,362 | $1,915 |
| Monthly Housing Costs | $560 | $89 |
| Real Estate Taxes | $3,047 | $356 |
Property Value by Mortgage Status in Parma
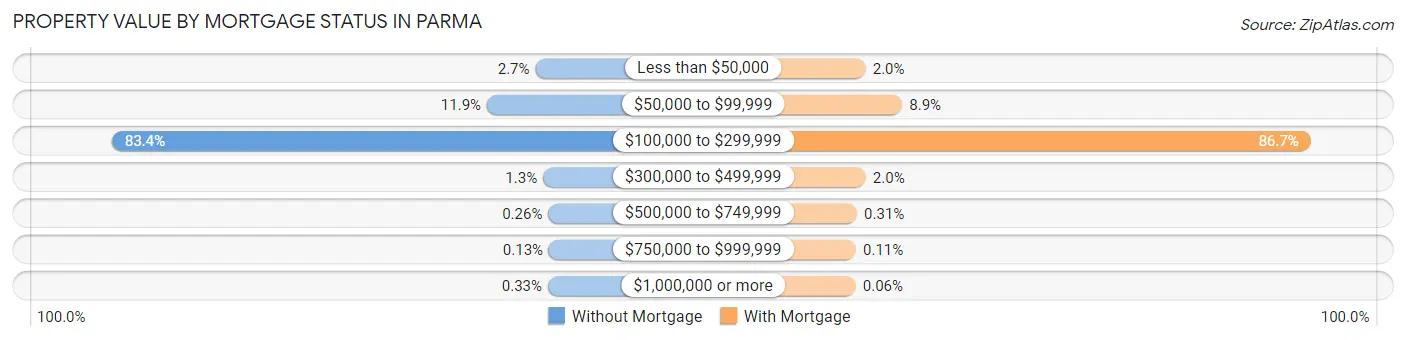
| Property Value | Without Mortgage | With Mortgage |
| Less than $50,000 | 265 (2.7%) | 294 (1.9%) |
| $50,000 to $99,999 | 1,168 (11.9%) | 1,345 (8.9%) |
| $100,000 to $299,999 | 8,159 (83.4%) | 13,083 (86.7%) |
| $300,000 to $499,999 | 123 (1.3%) | 298 (2.0%) |
| $500,000 to $749,999 | 25 (0.3%) | 47 (0.3%) |
| $750,000 to $999,999 | 13 (0.1%) | 16 (0.1%) |
| $1,000,000 or more | 32 (0.3%) | 9 (0.1%) |
| Total | 9,785 (100.0%) | 15,092 (100.0%) |
Household Income by Mortgage Status in Parma
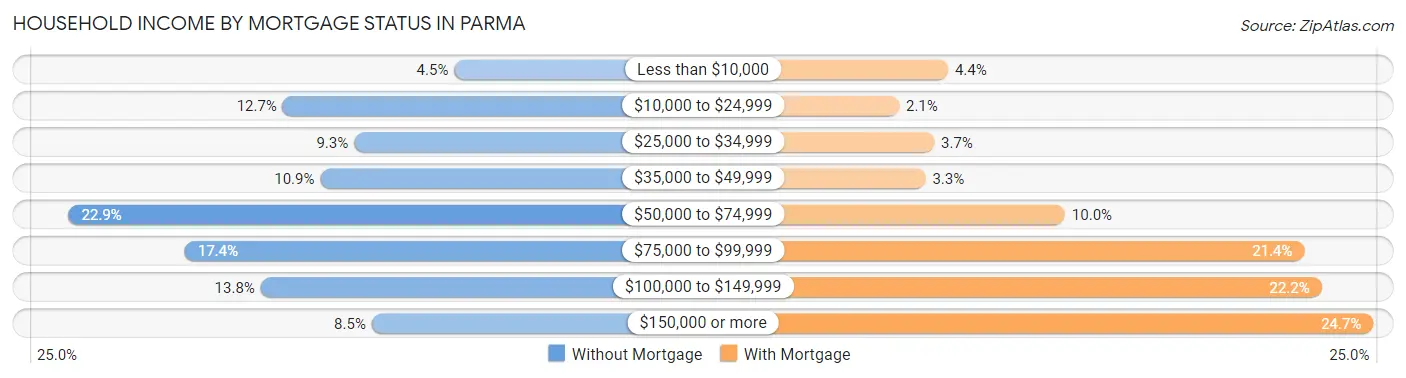
| Household Income | Without Mortgage | With Mortgage |
| Less than $10,000 | 444 (4.5%) | 664 (4.4%) |
| $10,000 to $24,999 | 1,244 (12.7%) | 312 (2.1%) |
| $25,000 to $34,999 | 911 (9.3%) | 564 (3.7%) |
| $35,000 to $49,999 | 1,069 (10.9%) | 503 (3.3%) |
| $50,000 to $74,999 | 2,242 (22.9%) | 1,504 (10.0%) |
| $75,000 to $99,999 | 1,700 (17.4%) | 3,225 (21.4%) |
| $100,000 to $149,999 | 1,346 (13.8%) | 3,349 (22.2%) |
| $150,000 or more | 829 (8.5%) | 3,720 (24.6%) |
| Total | 9,785 (100.0%) | 15,092 (100.0%) |
Property Value to Household Income Ratio in Parma
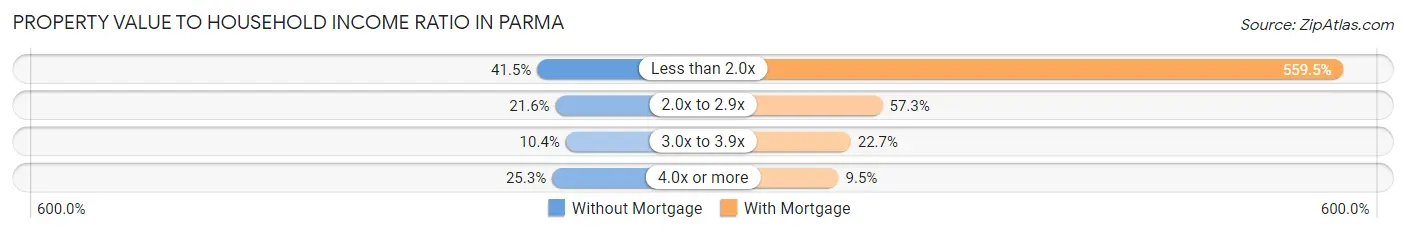
| Value-to-Income Ratio | Without Mortgage | With Mortgage |
| Less than 2.0x | 4,059 (41.5%) | 84,443 (559.5%) |
| 2.0x to 2.9x | 2,116 (21.6%) | 8,652 (57.3%) |
| 3.0x to 3.9x | 1,020 (10.4%) | 3,428 (22.7%) |
| 4.0x or more | 2,478 (25.3%) | 1,427 (9.5%) |
| Total | 9,785 (100.0%) | 15,092 (100.0%) |
Real Estate Taxes by Mortgage Status in Parma
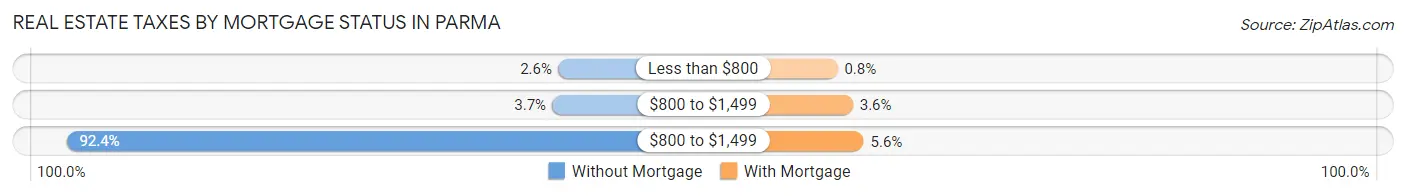
| Property Taxes | Without Mortgage | With Mortgage |
| Less than $800 | 255 (2.6%) | 120 (0.8%) |
| $800 to $1,499 | 360 (3.7%) | 543 (3.6%) |
| $800 to $1,499 | 9,036 (92.3%) | 842 (5.6%) |
| Total | 9,785 (100.0%) | 15,092 (100.0%) |
Health & Disability in Parma
Health Insurance Coverage by Age in Parma
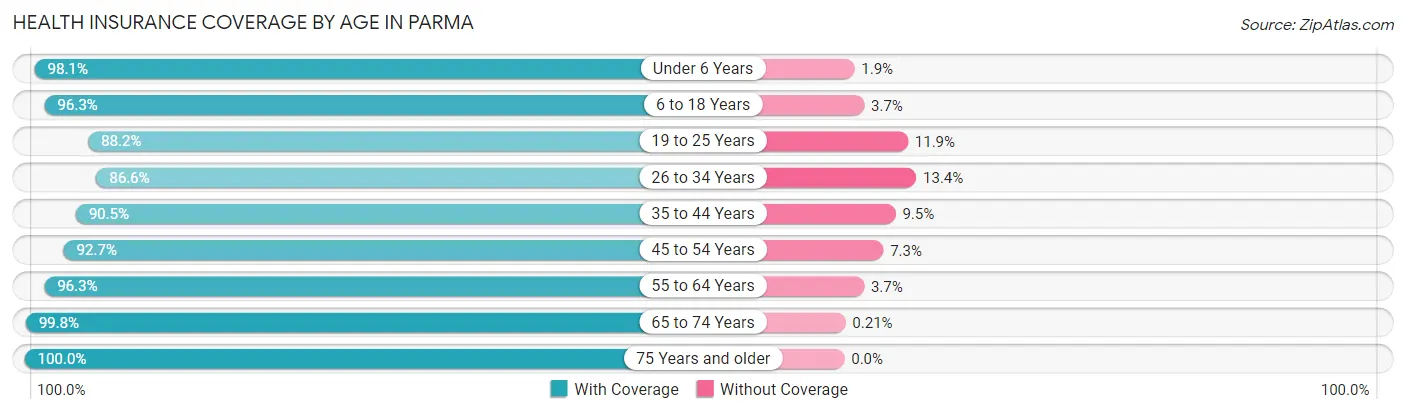
| Age Bracket | With Coverage | Without Coverage |
| Under 6 Years | 4,624 (98.1%) | 88 (1.9%) |
| 6 to 18 Years | 10,095 (96.3%) | 388 (3.7%) |
| 19 to 25 Years | 6,765 (88.1%) | 909 (11.8%) |
| 26 to 34 Years | 9,566 (86.6%) | 1,479 (13.4%) |
| 35 to 44 Years | 7,954 (90.5%) | 839 (9.5%) |
| 45 to 54 Years | 9,381 (92.7%) | 734 (7.3%) |
| 55 to 64 Years | 11,241 (96.3%) | 428 (3.7%) |
| 65 to 74 Years | 9,026 (99.8%) | 19 (0.2%) |
| 75 Years and older | 6,145 (100.0%) | 0 (0.0%) |
| Total | 74,797 (93.9%) | 4,884 (6.1%) |
Health Insurance Coverage by Citizenship Status in Parma
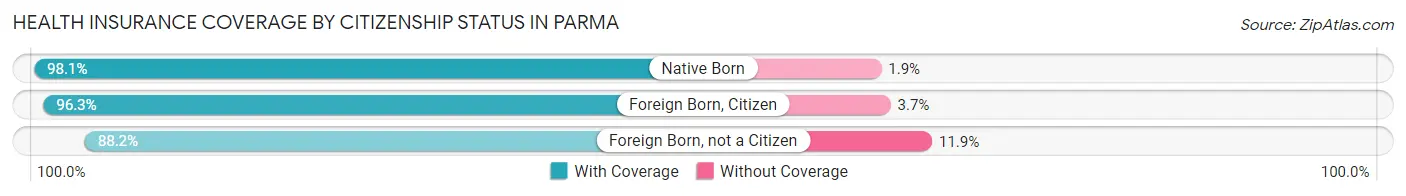
| Citizenship Status | With Coverage | Without Coverage |
| Native Born | 4,624 (98.1%) | 88 (1.9%) |
| Foreign Born, Citizen | 10,095 (96.3%) | 388 (3.7%) |
| Foreign Born, not a Citizen | 6,765 (88.1%) | 909 (11.8%) |
Health Insurance Coverage by Household Income in Parma
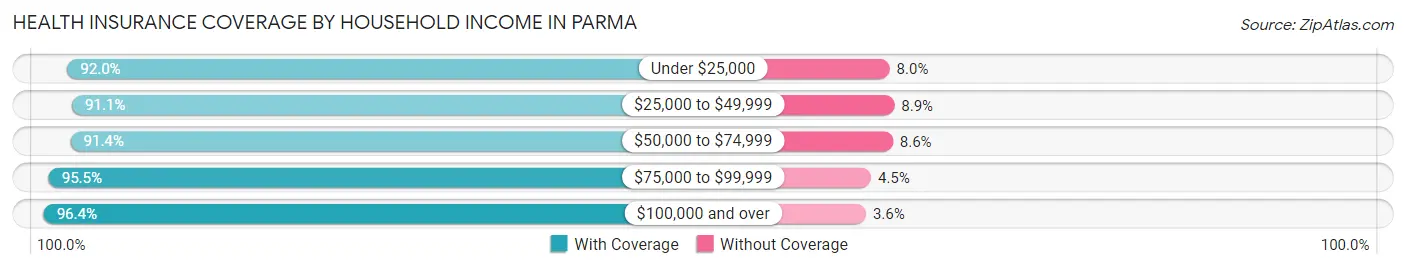
| Household Income | With Coverage | Without Coverage |
| Under $25,000 | 7,137 (92.0%) | 623 (8.0%) |
| $25,000 to $49,999 | 11,315 (91.1%) | 1,107 (8.9%) |
| $50,000 to $74,999 | 15,822 (91.4%) | 1,495 (8.6%) |
| $75,000 to $99,999 | 14,703 (95.5%) | 699 (4.5%) |
| $100,000 and over | 25,576 (96.4%) | 953 (3.6%) |
Public vs Private Health Insurance Coverage by Age in Parma
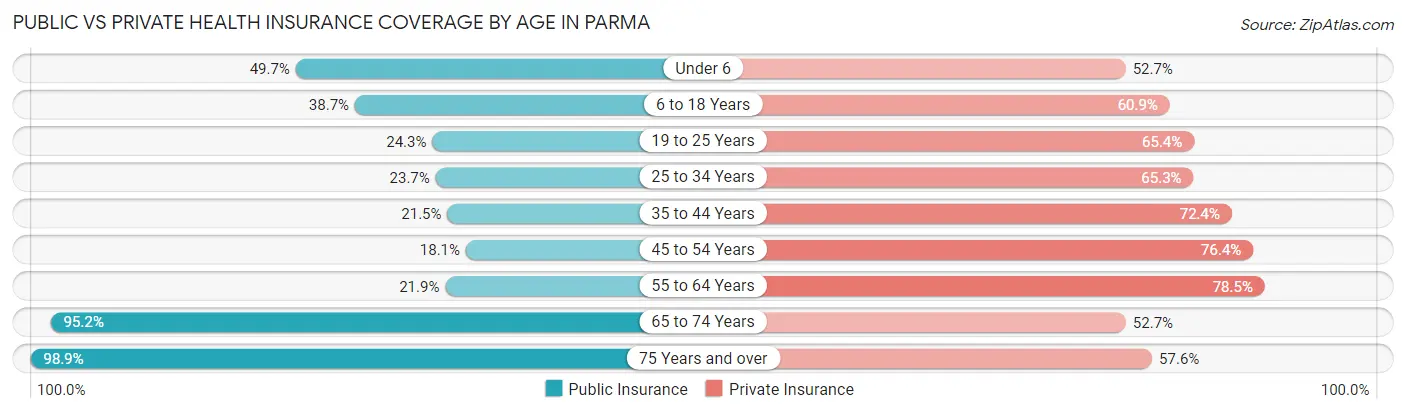
| Age Bracket | Public Insurance | Private Insurance |
| Under 6 | 2,341 (49.7%) | 2,483 (52.7%) |
| 6 to 18 Years | 4,056 (38.7%) | 6,380 (60.9%) |
| 19 to 25 Years | 1,866 (24.3%) | 5,018 (65.4%) |
| 25 to 34 Years | 2,619 (23.7%) | 7,208 (65.3%) |
| 35 to 44 Years | 1,893 (21.5%) | 6,364 (72.4%) |
| 45 to 54 Years | 1,831 (18.1%) | 7,723 (76.3%) |
| 55 to 64 Years | 2,558 (21.9%) | 9,160 (78.5%) |
| 65 to 74 Years | 8,610 (95.2%) | 4,770 (52.7%) |
| 75 Years and over | 6,079 (98.9%) | 3,540 (57.6%) |
| Total | 31,853 (40.0%) | 52,646 (66.1%) |
Disability Status by Sex by Age in Parma
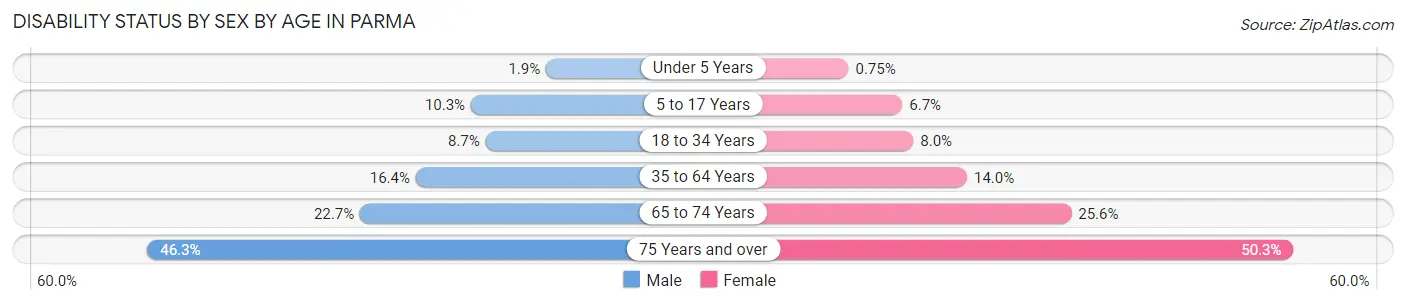
| Age Bracket | Male | Female |
| Under 5 Years | 43 (1.9%) | 14 (0.7%) |
| 5 to 17 Years | 520 (10.3%) | 328 (6.7%) |
| 18 to 34 Years | 944 (8.7%) | 717 (8.0%) |
| 35 to 64 Years | 2,450 (16.4%) | 2,186 (14.0%) |
| 65 to 74 Years | 948 (22.7%) | 1,242 (25.6%) |
| 75 Years and over | 1,093 (46.3%) | 1,904 (50.3%) |
Disability Class by Sex by Age in Parma
Disability Class: Hearing Difficulty
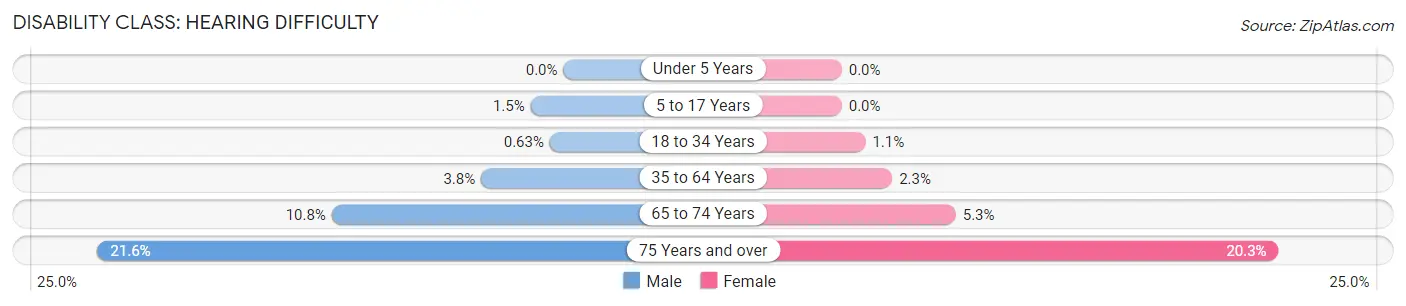
| Age Bracket | Male | Female |
| Under 5 Years | 0 (0.0%) | 0 (0.0%) |
| 5 to 17 Years | 77 (1.5%) | 0 (0.0%) |
| 18 to 34 Years | 69 (0.6%) | 99 (1.1%) |
| 35 to 64 Years | 570 (3.8%) | 366 (2.3%) |
| 65 to 74 Years | 450 (10.7%) | 257 (5.3%) |
| 75 Years and over | 510 (21.6%) | 767 (20.3%) |
Disability Class: Vision Difficulty
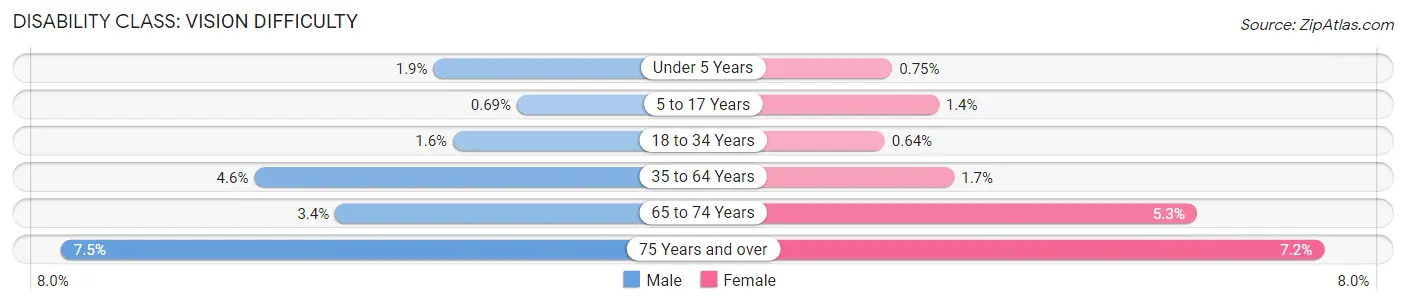
| Age Bracket | Male | Female |
| Under 5 Years | 43 (1.9%) | 14 (0.7%) |
| 5 to 17 Years | 35 (0.7%) | 70 (1.4%) |
| 18 to 34 Years | 179 (1.6%) | 58 (0.6%) |
| 35 to 64 Years | 685 (4.6%) | 262 (1.7%) |
| 65 to 74 Years | 142 (3.4%) | 256 (5.3%) |
| 75 Years and over | 176 (7.5%) | 271 (7.2%) |
Disability Class: Cognitive Difficulty

| Age Bracket | Male | Female |
| 5 to 17 Years | 510 (10.1%) | 232 (4.8%) |
| 18 to 34 Years | 620 (5.7%) | 625 (7.0%) |
| 35 to 64 Years | 1,021 (6.9%) | 758 (4.8%) |
| 65 to 74 Years | 162 (3.9%) | 343 (7.1%) |
| 75 Years and over | 293 (12.4%) | 420 (11.1%) |
Disability Class: Ambulatory Difficulty
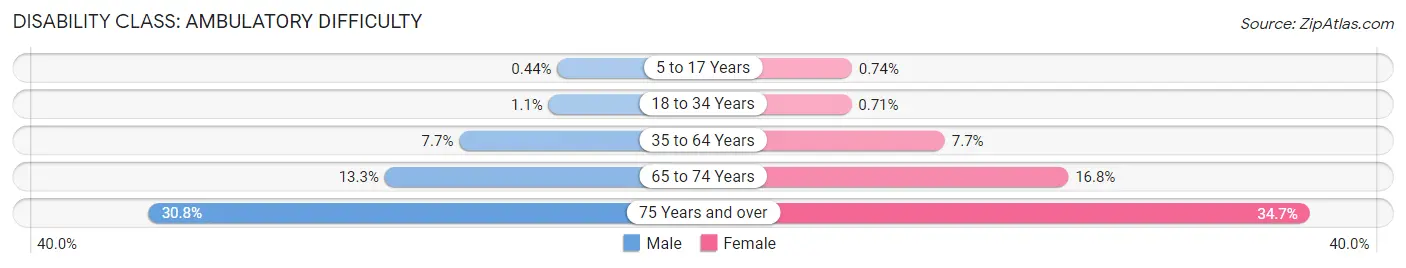
| Age Bracket | Male | Female |
| 5 to 17 Years | 22 (0.4%) | 36 (0.7%) |
| 18 to 34 Years | 119 (1.1%) | 64 (0.7%) |
| 35 to 64 Years | 1,153 (7.7%) | 1,198 (7.6%) |
| 65 to 74 Years | 555 (13.3%) | 817 (16.8%) |
| 75 Years and over | 726 (30.8%) | 1,315 (34.7%) |
Disability Class: Self-Care Difficulty
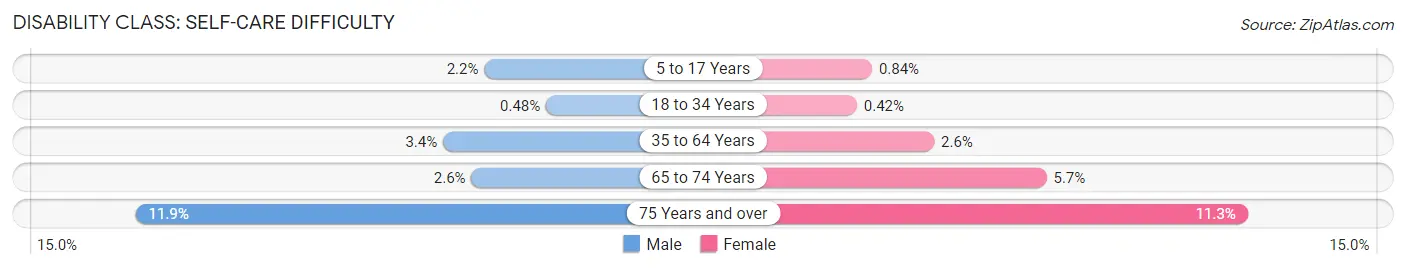
| Age Bracket | Male | Female |
| 5 to 17 Years | 111 (2.2%) | 41 (0.8%) |
| 18 to 34 Years | 52 (0.5%) | 38 (0.4%) |
| 35 to 64 Years | 500 (3.4%) | 403 (2.6%) |
| 65 to 74 Years | 107 (2.6%) | 277 (5.7%) |
| 75 Years and over | 281 (11.9%) | 428 (11.3%) |
Technology Access in Parma
Computing Device Access in Parma
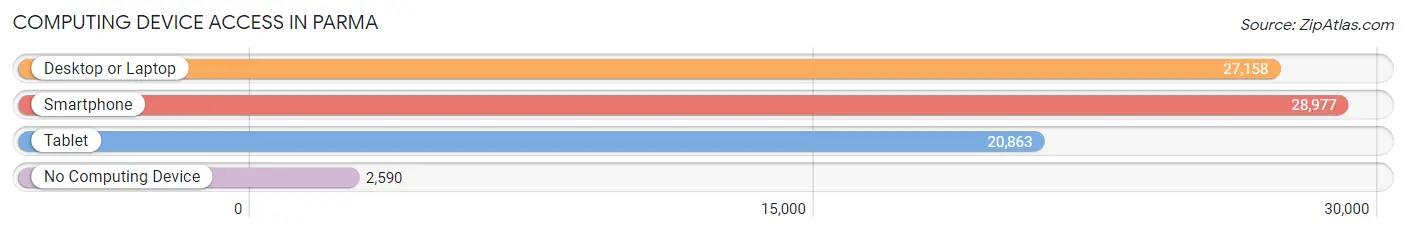
| Device Type | # Households | % Households |
| Desktop or Laptop | 27,158 | 78.6% |
| Smartphone | 28,977 | 83.9% |
| Tablet | 20,863 | 60.4% |
| No Computing Device | 2,590 | 7.5% |
| Total | 34,546 | 100.0% |
Internet Access in Parma
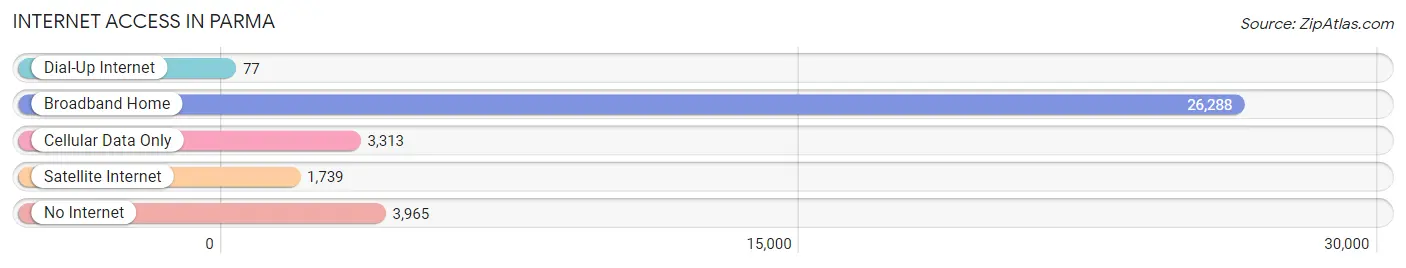
| Internet Type | # Households | % Households |
| Dial-Up Internet | 77 | 0.2% |
| Broadband Home | 26,288 | 76.1% |
| Cellular Data Only | 3,313 | 9.6% |
| Satellite Internet | 1,739 | 5.0% |
| No Internet | 3,965 | 11.5% |
| Total | 34,546 | 100.0% |
Parma Summary
Parma, Ohio is a city located in Cuyahoga County, Ohio, United States. It is the seventh largest city in the state and the second largest city in the county. The city is located on the southern edge of Cleveland and is part of the Greater Cleveland Metropolitan Area. As of the 2010 census, the city had a population of 81,601.
History
Parma was first settled in 1816 by Benajah Fay and his family. The area was originally known as Greenbriar, after the creek that ran through the area. In 1827, the area was renamed Parma, after the city of Parma in Italy. The name was chosen by the first postmaster, who was from Parma, Italy.
In 1845, Parma was incorporated as a village. The village was annexed by the city of Cleveland in 1854, but was re-established as a separate municipality in 1859.
In the late 19th century, Parma became a popular destination for German and Italian immigrants. The city was also home to a large number of Polish immigrants in the early 20th century.
Geography
Parma is located at 41°24′N 81°45′W (41.40, -81.75). According to the United States Census Bureau, the city has a total area of 16.2 square miles (41.8 km2), of which 16.1 square miles (41.6 km2) is land and 0.1 square miles (0.2 km2) is water.
The city is located on the southern edge of Cleveland and is part of the Greater Cleveland Metropolitan Area. It is bordered by the cities of Brooklyn, Seven Hills, and North Royalton to the north; Broadview Heights and Parma Heights to the east; Middleburg Heights to the south; and Brook Park and Brooklyn Heights to the west.
Economy
Parma is home to a number of large employers, including the Cleveland Clinic, University Hospitals, and the Cleveland Metroparks Zoo. The city is also home to a number of smaller businesses, including manufacturing, retail, and service industries.
Demographics
As of the 2010 census, there were 81,601 people, 33,945 households, and 22,845 families residing in the city. The population density was 5,068.2 people per square mile (1,958.2/km2). There were 36,890 housing units at an average density of 2,294.3 per square mile (888.3/km2). The racial makeup of the city was 87.2% White, 8.2% African American, 0.2% Native American, 1.7% Asian, 0.1% Pacific Islander, 0.7% from other races, and 2.0% from two or more races. Hispanic or Latino of any race were 2.7% of the population.
There were 33,945 households, out of which 25.3% had children under the age of 18 living with them, 48.2% were married couples living together, 12.3% had a female householder with no husband present, and 34.7% were non-families. 29.7% of all households were made up of individuals, and 12.3% had someone living alone who was 65 years of age or older. The average household size was 2.39 and the average family size was 2.96.
In the city, the population was spread out, with 20.9% under the age of 18, 8.2% from 18 to 24, 27.2% from 25 to 44, 25.3% from 45 to 64, and 18.4% who were 65 years of age or older. The median age was 40 years. For every 100 females, there were 91.2 males. For every 100 females age 18 and over, there were 87.7 males.
The median income for a household in the city was $45,902, and the median income for a family was $55,890. Males had a median income of $41,890 versus $30,890 for females. The per capita income for the city was $22,945. About 5.2% of families and 7.2% of the population were below the poverty line, including 9.2% of those under age 18 and 6.2% of those age 65 or over.
Common Questions
What is Per Capita Income in Parma?
Per Capita income in Parma is $34,487.
What is the Median Family Income in Parma?
Median Family Income in Parma is $79,377.
What is the Median Household income in Parma?
Median Household Income in Parma is $65,848.
What is Income or Wage Gap in Parma?
Income or Wage Gap in Parma is 28.8%.
Women in Parma earn 71.2 cents for every dollar earned by a man.
What is Family Income Deficit in Parma?
Family Income Deficit in Parma is $9,544.
Families that are below poverty line in Parma earn $9,544 less on average than the poverty threshold level.
What is Inequality or Gini Index in Parma?
Inequality or Gini Index in Parma is 0.39.
What is the Total Population of Parma?
Total Population of Parma is 80,587.
What is the Total Male Population of Parma?
Total Male Population of Parma is 40,019.
What is the Total Female Population of Parma?
Total Female Population of Parma is 40,568.
What is the Ratio of Males per 100 Females in Parma?
There are 98.65 Males per 100 Females in Parma.
What is the Ratio of Females per 100 Males in Parma?
There are 101.37 Females per 100 Males in Parma.
What is the Median Population Age in Parma?
Median Population Age in Parma is 42.6 Years.
What is the Average Family Size in Parma
Average Family Size in Parma is 2.9 People.
What is the Average Household Size in Parma
Average Household Size in Parma is 2.3 People.
How Large is the Labor Force in Parma?
There are 45,453 People in the Labor Forcein in Parma.
What is the Percentage of People in the Labor Force in Parma?
66.6% of People are in the Labor Force in Parma.
What is the Unemployment Rate in Parma?
Unemployment Rate in Parma is 5.8%.