Clarkson, NY Map & Demographics
Clarkson Map
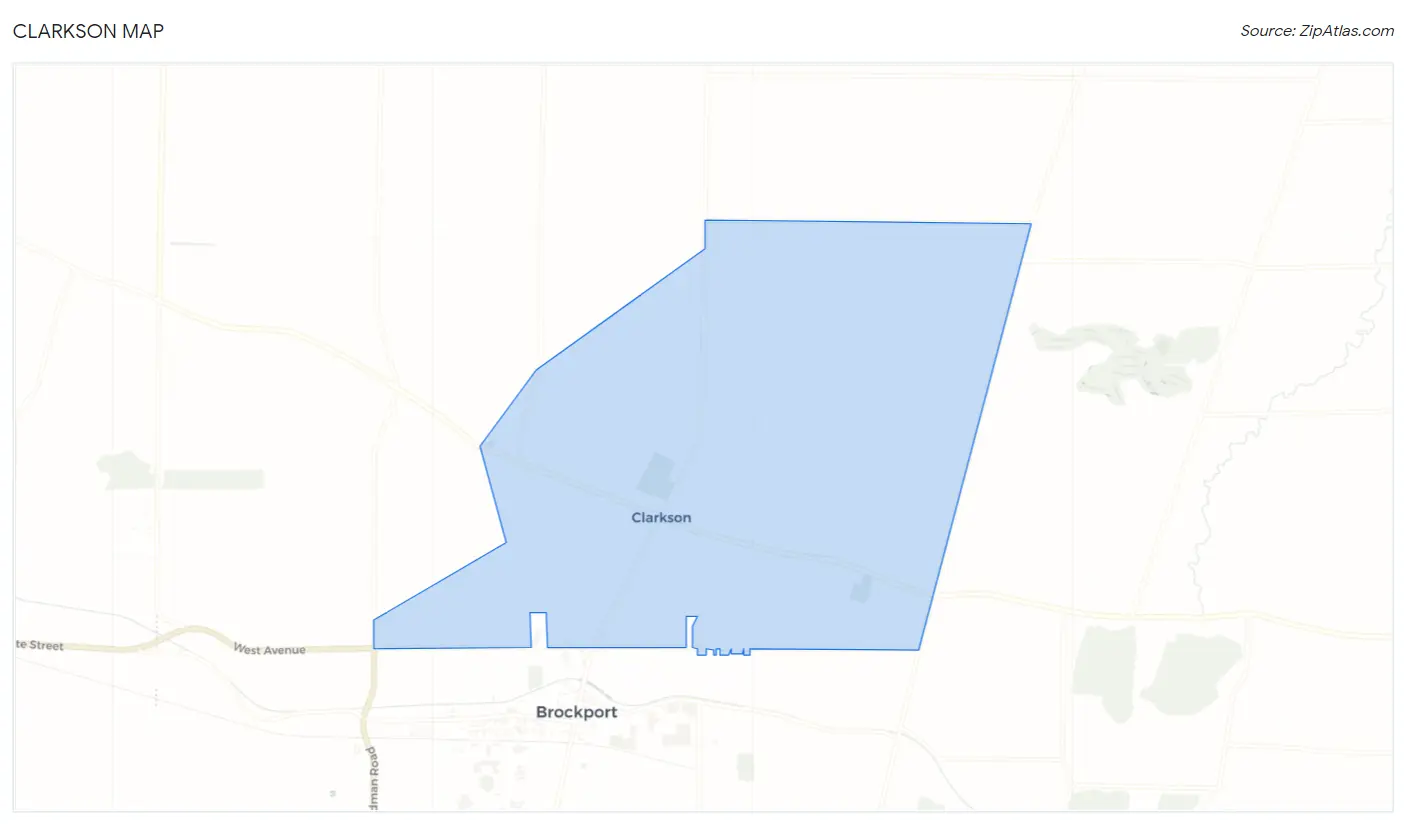
Clarkson Overview
$41,623
PER CAPITA INCOME
$117,679
AVG FAMILY INCOME
$81,429
AVG HOUSEHOLD INCOME
3.6%
WAGE / INCOME GAP [ % ]
96.4¢/ $1
WAGE / INCOME GAP [ $ ]
0.40
INEQUALITY / GINI INDEX
5,022
TOTAL POPULATION
2,426
MALE POPULATION
2,596
FEMALE POPULATION
93.45
MALES / 100 FEMALES
107.01
FEMALES / 100 MALES
40.6
MEDIAN AGE
2.9
AVG FAMILY SIZE
2.5
AVG HOUSEHOLD SIZE
2,533
LABOR FORCE [ PEOPLE ]
60.2%
PERCENT IN LABOR FORCE
1.6%
UNEMPLOYMENT RATE
Clarkson Area Codes
Income in Clarkson
Income Overview in Clarkson
Per Capita Income in Clarkson is $41,623, while median incomes of families and households are $117,679 and $81,429 respectively.
| Characteristic | Number | Measure |
| Per Capita Income | 5,022 | $41,623 |
| Median Family Income | 1,322 | $117,679 |
| Mean Family Income | 1,322 | $121,832 |
| Median Household Income | 2,004 | $81,429 |
| Mean Household Income | 2,004 | $103,251 |
| Income Deficit | 1,322 | $0 |
| Wage / Income Gap (%) | 5,022 | 3.56% |
| Wage / Income Gap ($) | 5,022 | 96.44¢ per $1 |
| Gini / Inequality Index | 5,022 | 0.40 |
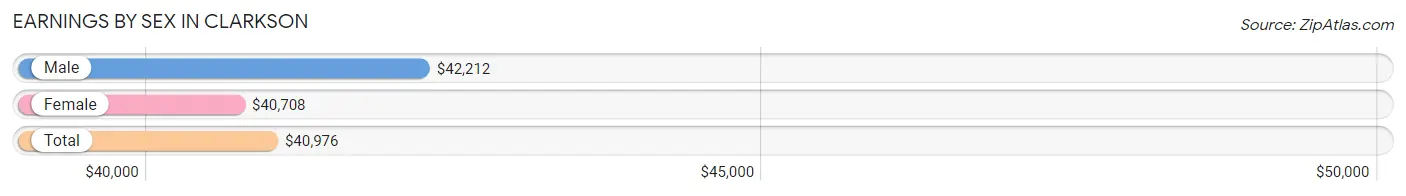
Earnings by Sex in Clarkson
Average Earnings in Clarkson are $40,976, $42,212 for men and $40,708 for women, a difference of 3.6%.
| Sex | Number | Average Earnings |
| Male | 1,357 (51.1%) | $42,212 |
| Female | 1,300 (48.9%) | $40,708 |
| Total | 2,657 (100.0%) | $40,976 |
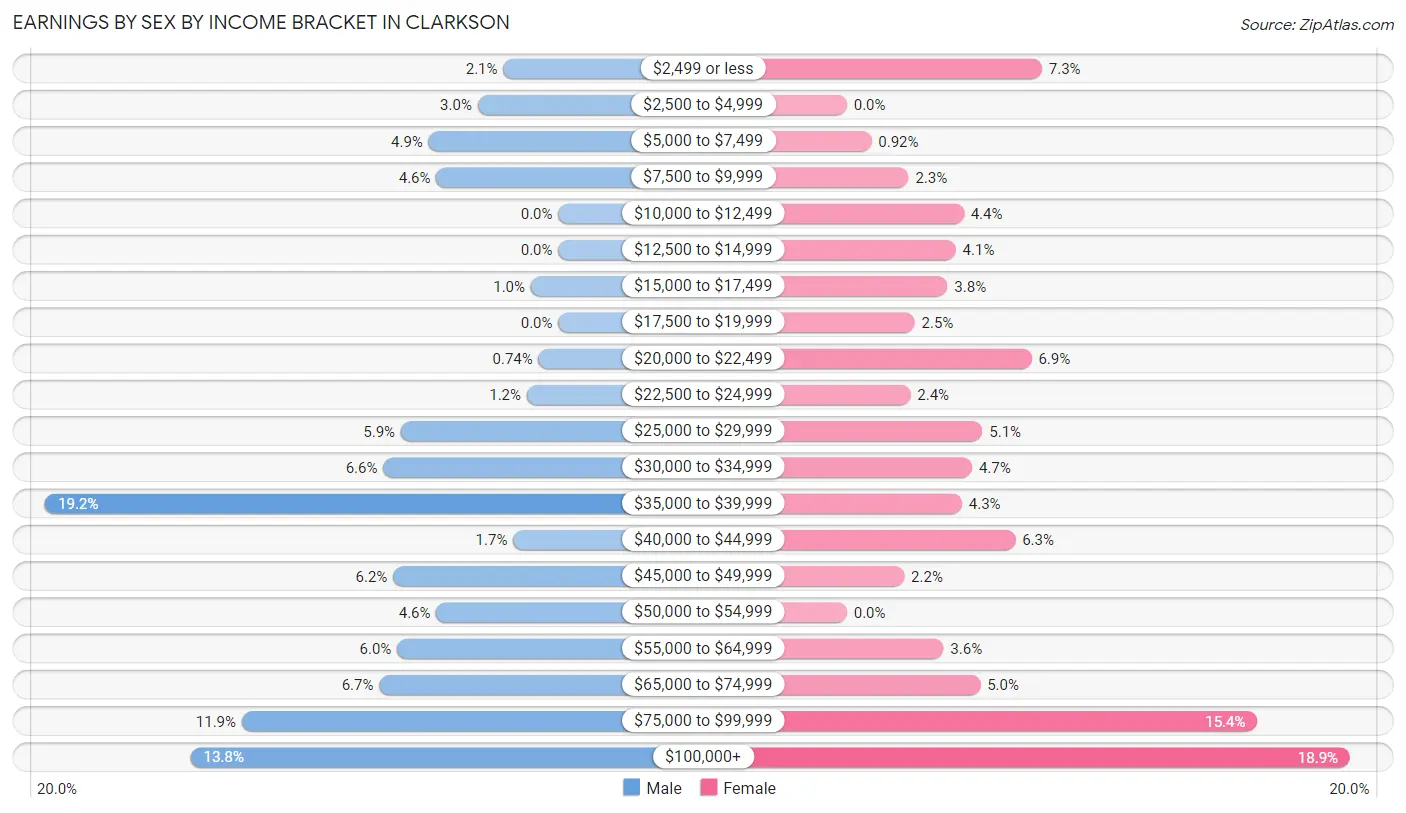
Earnings by Sex by Income Bracket in Clarkson
The most common earnings brackets in Clarkson are $35,000 to $39,999 for men (261 | 19.2%) and $100,000+ for women (245 | 18.9%).
| Income | Male | Female |
| $2,499 or less | 28 (2.1%) | 95 (7.3%) |
| $2,500 to $4,999 | 41 (3.0%) | 0 (0.0%) |
| $5,000 to $7,499 | 66 (4.9%) | 12 (0.9%) |
| $7,500 to $9,999 | 62 (4.6%) | 30 (2.3%) |
| $10,000 to $12,499 | 0 (0.0%) | 57 (4.4%) |
| $12,500 to $14,999 | 0 (0.0%) | 53 (4.1%) |
| $15,000 to $17,499 | 14 (1.0%) | 49 (3.8%) |
| $17,500 to $19,999 | 0 (0.0%) | 33 (2.5%) |
| $20,000 to $22,499 | 10 (0.7%) | 90 (6.9%) |
| $22,500 to $24,999 | 16 (1.2%) | 31 (2.4%) |
| $25,000 to $29,999 | 80 (5.9%) | 66 (5.1%) |
| $30,000 to $34,999 | 89 (6.6%) | 61 (4.7%) |
| $35,000 to $39,999 | 261 (19.2%) | 56 (4.3%) |
| $40,000 to $44,999 | 23 (1.7%) | 82 (6.3%) |
| $45,000 to $49,999 | 84 (6.2%) | 28 (2.1%) |
| $50,000 to $54,999 | 62 (4.6%) | 0 (0.0%) |
| $55,000 to $64,999 | 82 (6.0%) | 47 (3.6%) |
| $65,000 to $74,999 | 91 (6.7%) | 65 (5.0%) |
| $75,000 to $99,999 | 161 (11.9%) | 200 (15.4%) |
| $100,000+ | 187 (13.8%) | 245 (18.9%) |
| Total | 1,357 (100.0%) | 1,300 (100.0%) |
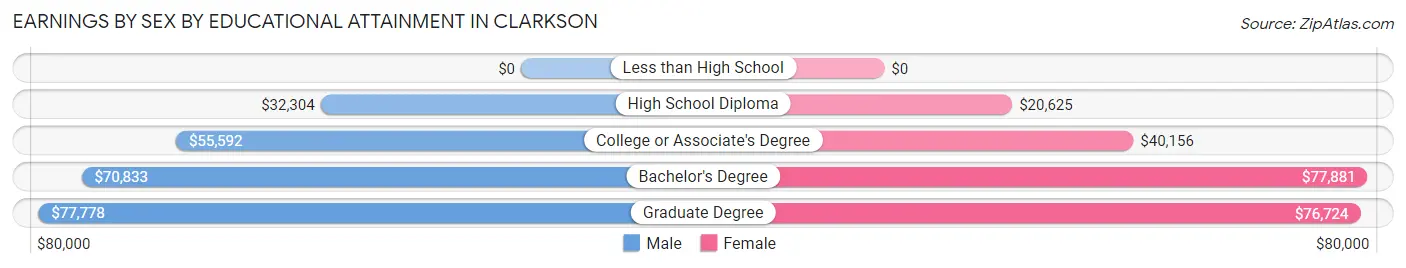
Earnings by Sex by Educational Attainment in Clarkson
Average earnings in Clarkson are $47,381 for men and $48,631 for women, a difference of 2.6%. Men with an educational attainment of graduate degree enjoy the highest average annual earnings of $77,778, while those with high school diploma education earn the least with $32,304. Women with an educational attainment of bachelor's degree earn the most with the average annual earnings of $77,881, while those with high school diploma education have the smallest earnings of $20,625.
| Educational Attainment | Male Income | Female Income |
| Less than High School | - | - |
| High School Diploma | $32,304 | $20,625 |
| College or Associate's Degree | $55,592 | $40,156 |
| Bachelor's Degree | $70,833 | $77,881 |
| Graduate Degree | $77,778 | $76,724 |
| Total | $47,381 | $48,631 |
Family Income in Clarkson
Family Income Brackets in Clarkson
According to the Clarkson family income data, there are 293 families falling into the $100,000 to $149,999 income range, which is the most common income bracket and makes up 22.2% of all families.
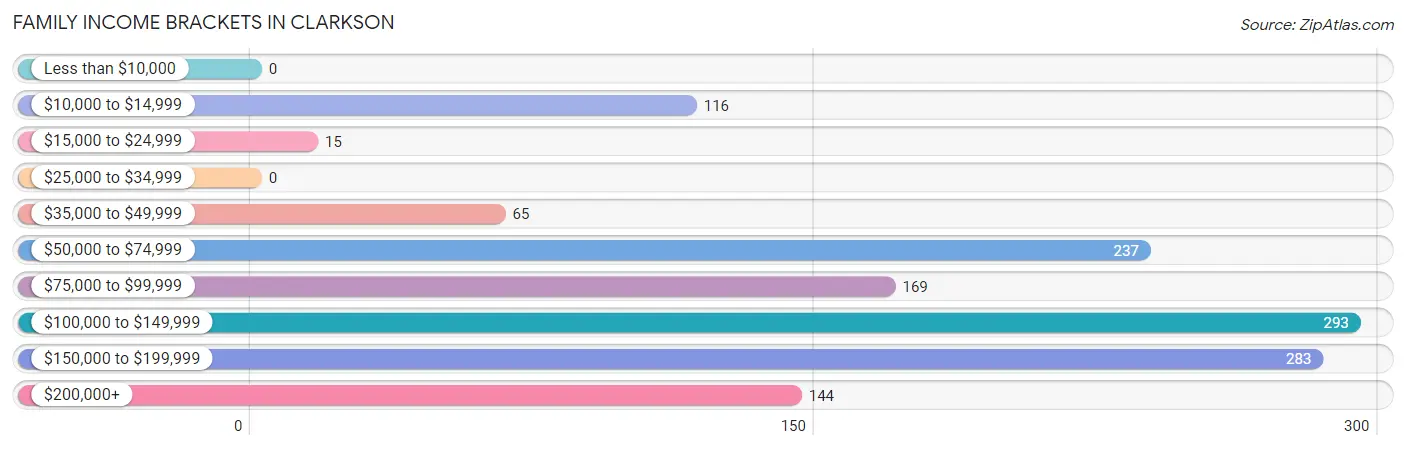
| Income Bracket | # Families | % Families |
| Less than $10,000 | 0 | 0.0% |
| $10,000 to $14,999 | 116 | 8.8% |
| $15,000 to $24,999 | 15 | 1.1% |
| $25,000 to $34,999 | 0 | 0.0% |
| $35,000 to $49,999 | 65 | 4.9% |
| $50,000 to $74,999 | 237 | 17.9% |
| $75,000 to $99,999 | 169 | 12.8% |
| $100,000 to $149,999 | 293 | 22.2% |
| $150,000 to $199,999 | 283 | 21.4% |
| $200,000+ | 144 | 10.9% |
Family Income by Famaliy Size in Clarkson
4-person families (225 | 17.0%) account for the highest median family income in Clarkson with $150,521 per family, while 2-person families (743 | 56.2%) have the highest median income of $44,963 per family member.
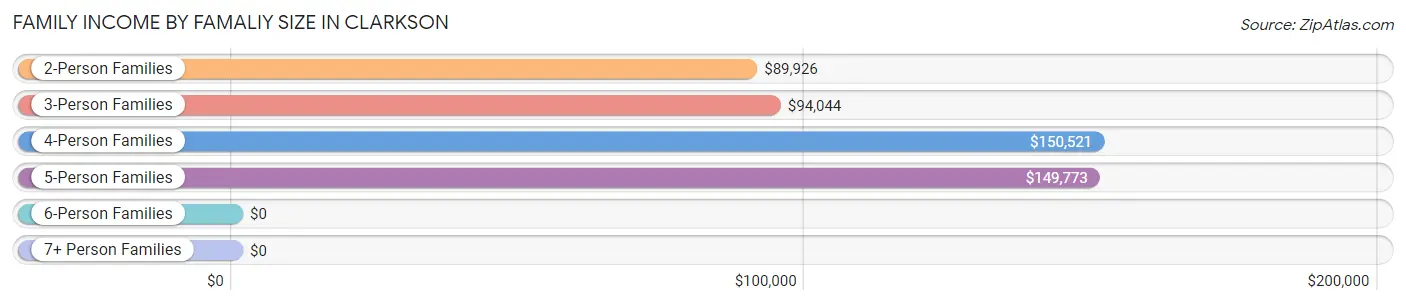
| Income Bracket | # Families | Median Income |
| 2-Person Families | 743 (56.2%) | $89,926 |
| 3-Person Families | 231 (17.5%) | $94,044 |
| 4-Person Families | 225 (17.0%) | $150,521 |
| 5-Person Families | 108 (8.2%) | $149,773 |
| 6-Person Families | 15 (1.1%) | $0 |
| 7+ Person Families | 0 (0.0%) | $0 |
| Total | 1,322 (100.0%) | $117,679 |
Family Income by Number of Earners in Clarkson
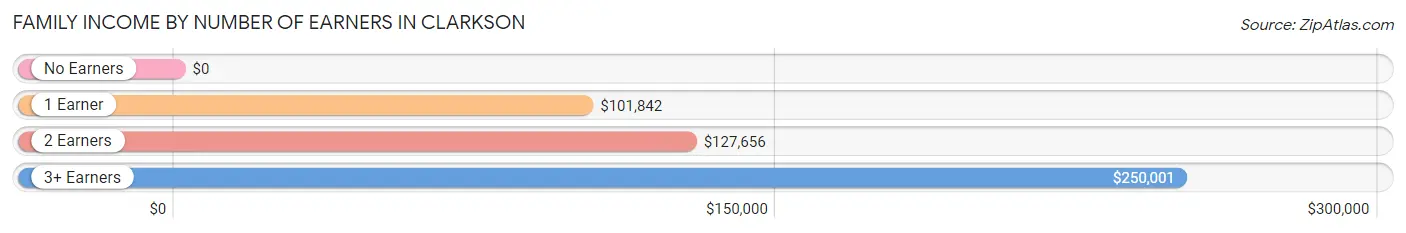
| Number of Earners | # Families | Median Income |
| No Earners | 272 (20.6%) | $0 |
| 1 Earner | 352 (26.6%) | $101,842 |
| 2 Earners | 575 (43.5%) | $127,656 |
| 3+ Earners | 123 (9.3%) | $250,001 |
| Total | 1,322 (100.0%) | $117,679 |
Household Income in Clarkson
Household Income Brackets in Clarkson
With 367 households falling in the category, the $50,000 to $74,999 income range is the most frequent in Clarkson, accounting for 18.3% of all households. In contrast, only 16 households (0.8%) fall into the less than $10,000 income bracket, making it the least populous group.
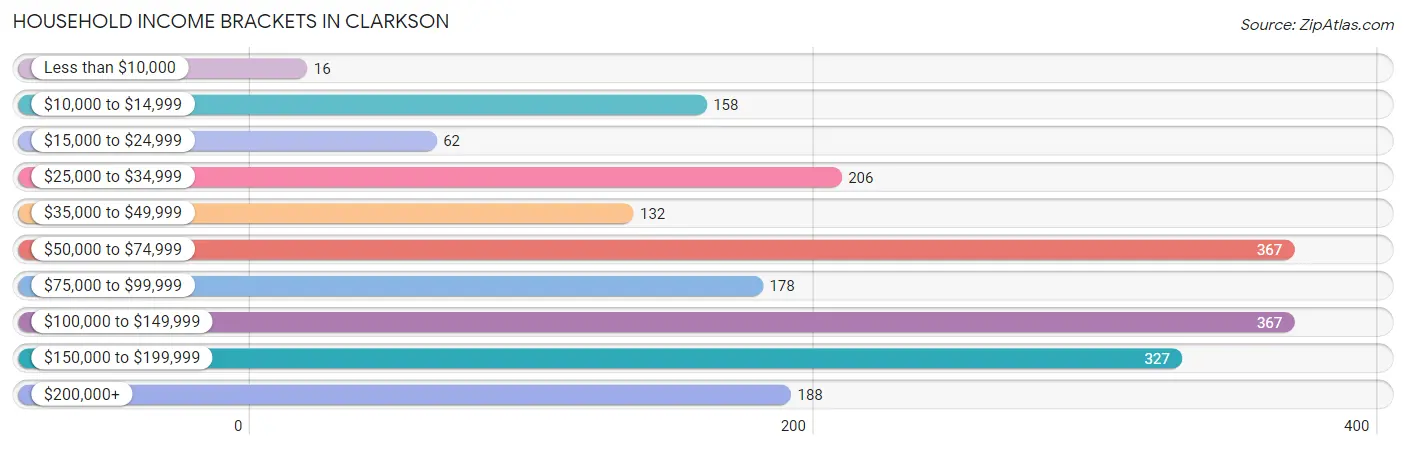
| Income Bracket | # Households | % Households |
| Less than $10,000 | 16 | 0.8% |
| $10,000 to $14,999 | 158 | 7.9% |
| $15,000 to $24,999 | 62 | 3.1% |
| $25,000 to $34,999 | 206 | 10.3% |
| $35,000 to $49,999 | 132 | 6.6% |
| $50,000 to $74,999 | 367 | 18.3% |
| $75,000 to $99,999 | 178 | 8.9% |
| $100,000 to $149,999 | 367 | 18.3% |
| $150,000 to $199,999 | 327 | 16.3% |
| $200,000+ | 188 | 9.4% |
Household Income by Householder Age in Clarkson
The median household income in Clarkson is $81,429, with the highest median household income of $137,260 found in the 45 to 64 years age bracket for the primary householder. A total of 691 households (34.5%) fall into this category. Meanwhile, the 15 to 24 years age bracket for the primary householder has the lowest median household income of $0, with 14 households (0.7%) in this group.
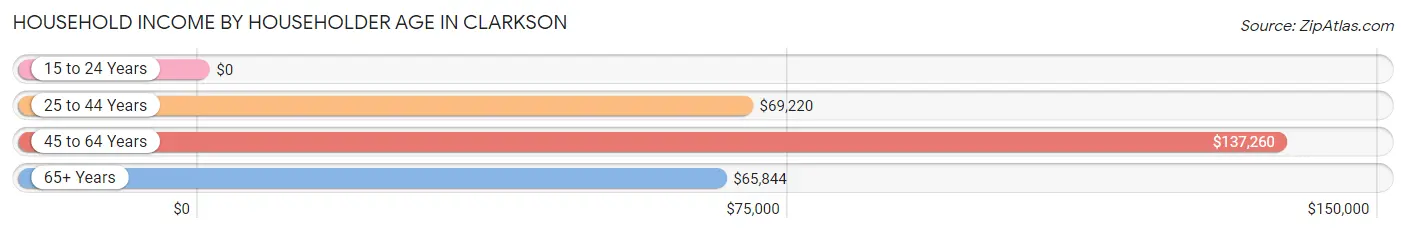
| Income Bracket | # Households | Median Income |
| 15 to 24 Years | 14 (0.7%) | $0 |
| 25 to 44 Years | 706 (35.2%) | $69,220 |
| 45 to 64 Years | 691 (34.5%) | $137,260 |
| 65+ Years | 593 (29.6%) | $65,844 |
| Total | 2,004 (100.0%) | $81,429 |
Poverty in Clarkson
Income Below Poverty by Sex and Age in Clarkson
With 9.8% poverty level for males and 11.7% for females among the residents of Clarkson, 35 to 44 year old males and 16 and 17 year old females are the most vulnerable to poverty, with 143 males (38.0%) and 22 females (61.1%) in their respective age groups living below the poverty level.
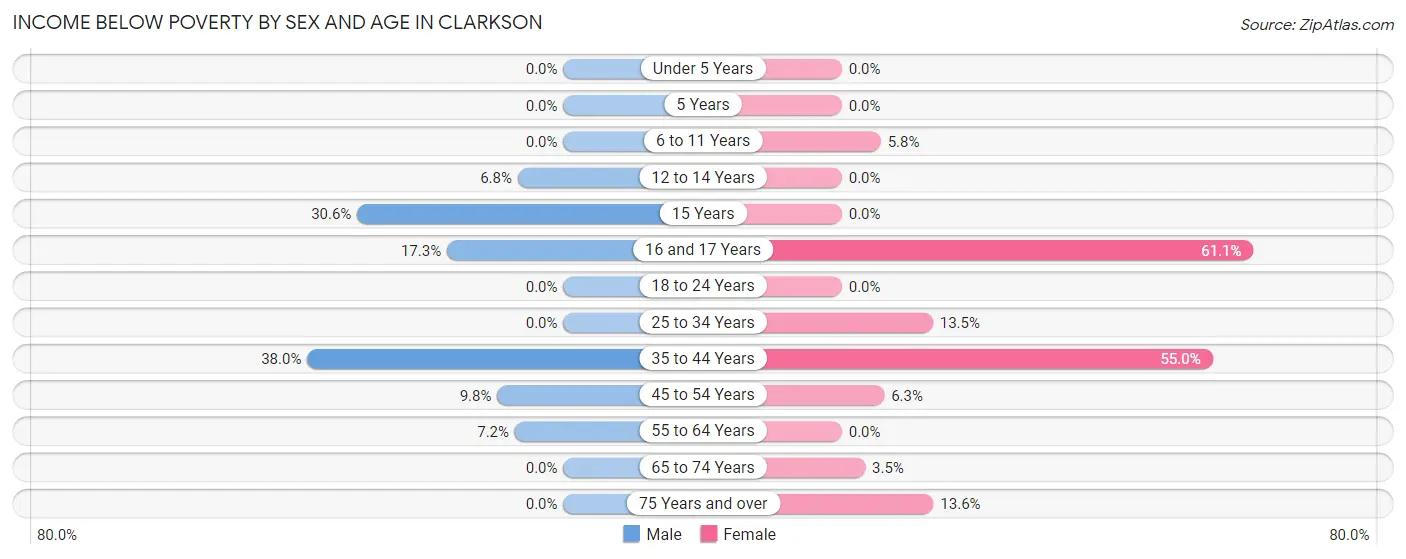
| Age Bracket | Male | Female |
| Under 5 Years | 0 (0.0%) | 0 (0.0%) |
| 5 Years | 0 (0.0%) | 0 (0.0%) |
| 6 to 11 Years | 0 (0.0%) | 13 (5.8%) |
| 12 to 14 Years | 14 (6.8%) | 0 (0.0%) |
| 15 Years | 15 (30.6%) | 0 (0.0%) |
| 16 and 17 Years | 14 (17.3%) | 22 (61.1%) |
| 18 to 24 Years | 0 (0.0%) | 0 (0.0%) |
| 25 to 34 Years | 0 (0.0%) | 50 (13.5%) |
| 35 to 44 Years | 143 (38.0%) | 153 (55.0%) |
| 45 to 54 Years | 31 (9.8%) | 24 (6.3%) |
| 55 to 64 Years | 17 (7.2%) | 0 (0.0%) |
| 65 to 74 Years | 0 (0.0%) | 15 (3.5%) |
| 75 Years and over | 0 (0.0%) | 17 (13.6%) |
| Total | 234 (9.8%) | 294 (11.7%) |
Income Above Poverty by Sex and Age in Clarkson
According to the poverty statistics in Clarkson, males aged under 5 years and females aged under 5 years are the age groups that are most secure financially, with 100.0% of males and 100.0% of females in these age groups living above the poverty line.
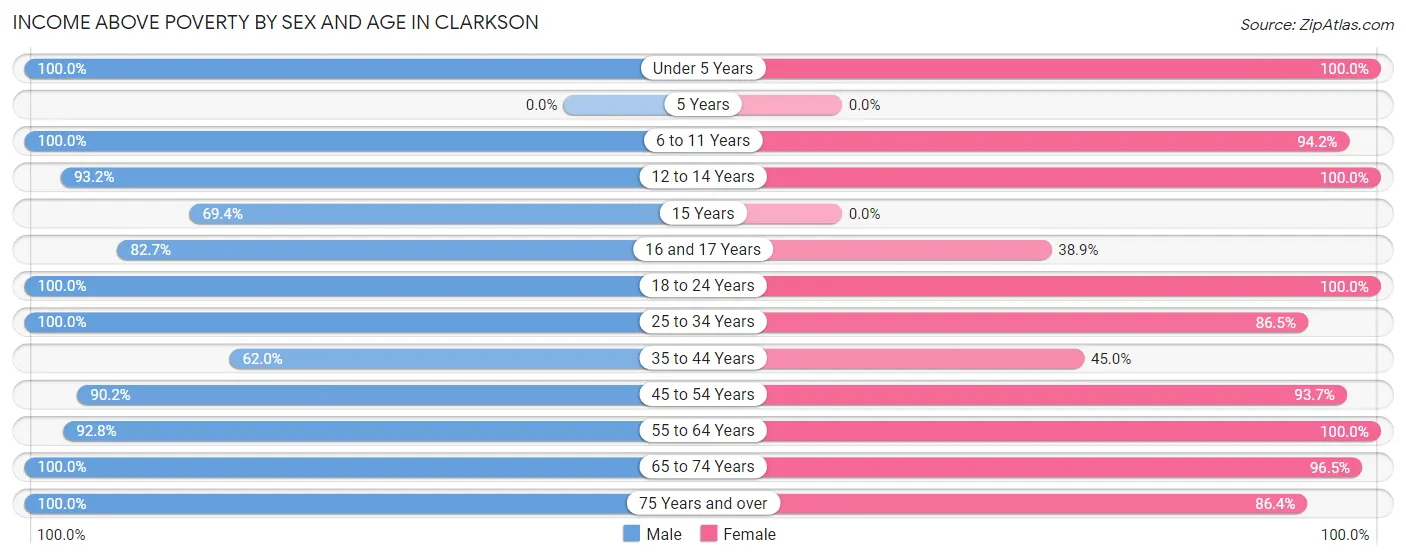
| Age Bracket | Male | Female |
| Under 5 Years | 64 (100.0%) | 31 (100.0%) |
| 5 Years | 0 (0.0%) | 0 (0.0%) |
| 6 to 11 Years | 152 (100.0%) | 212 (94.2%) |
| 12 to 14 Years | 193 (93.2%) | 29 (100.0%) |
| 15 Years | 34 (69.4%) | 0 (0.0%) |
| 16 and 17 Years | 67 (82.7%) | 14 (38.9%) |
| 18 to 24 Years | 108 (100.0%) | 339 (100.0%) |
| 25 to 34 Years | 432 (100.0%) | 320 (86.5%) |
| 35 to 44 Years | 233 (62.0%) | 125 (45.0%) |
| 45 to 54 Years | 285 (90.2%) | 357 (93.7%) |
| 55 to 64 Years | 219 (92.8%) | 273 (100.0%) |
| 65 to 74 Years | 200 (100.0%) | 419 (96.5%) |
| 75 Years and over | 162 (100.0%) | 108 (86.4%) |
| Total | 2,149 (90.2%) | 2,227 (88.3%) |
Income Below Poverty Among Married-Couple Families in Clarkson
The poverty statistics for married-couple families in Clarkson show that 12.5% or 131 of the total 1,047 families live below the poverty line. Families with 3 or 4 children have the highest poverty rate of 38.5%, comprising of 15 families. On the other hand, families with 1 or 2 children have the lowest poverty rate of 0.0%, which includes 0 families.
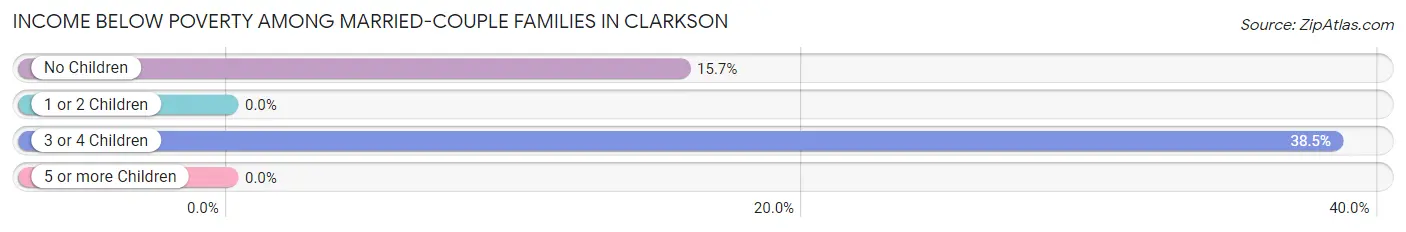
| Children | Above Poverty | Below Poverty |
| No Children | 621 (84.3%) | 116 (15.7%) |
| 1 or 2 Children | 271 (100.0%) | 0 (0.0%) |
| 3 or 4 Children | 24 (61.5%) | 15 (38.5%) |
| 5 or more Children | 0 (0.0%) | 0 (0.0%) |
| Total | 916 (87.5%) | 131 (12.5%) |
Income Below Poverty Among Single-Parent Households in Clarkson
| Children | Single Father | Single Mother |
| No Children | 0 (0.0%) | 0 (0.0%) |
| 1 or 2 Children | 0 (0.0%) | 0 (0.0%) |
| 3 or 4 Children | 0 (0.0%) | 0 (0.0%) |
| 5 or more Children | 0 (0.0%) | 0 (0.0%) |
| Total | 0 (0.0%) | 0 (0.0%) |
Income Below Poverty Among Married-Couple vs Single-Parent Households in Clarkson
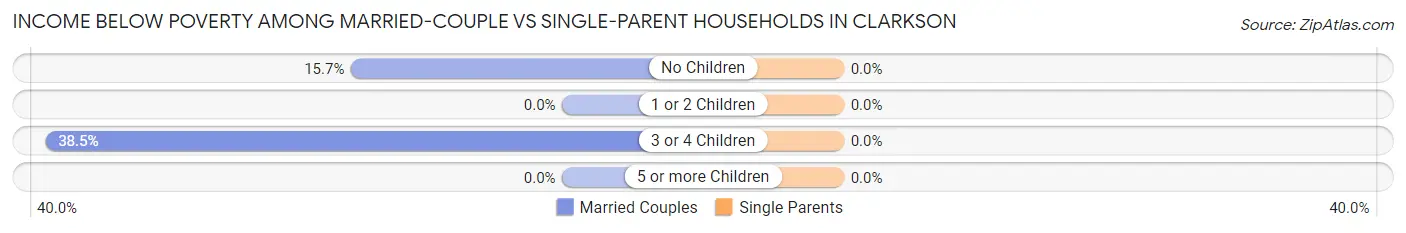
| Children | Married-Couple Families | Single-Parent Households |
| No Children | 116 (15.7%) | 0 (0.0%) |
| 1 or 2 Children | 0 (0.0%) | 0 (0.0%) |
| 3 or 4 Children | 15 (38.5%) | 0 (0.0%) |
| 5 or more Children | 0 (0.0%) | 0 (0.0%) |
| Total | 131 (12.5%) | 0 (0.0%) |
Race in Clarkson
The most populous races in Clarkson are White / Caucasian (4,110 | 81.8%), Hispanic or Latino (941 | 18.7%), and Some other Race (424 | 8.4%).
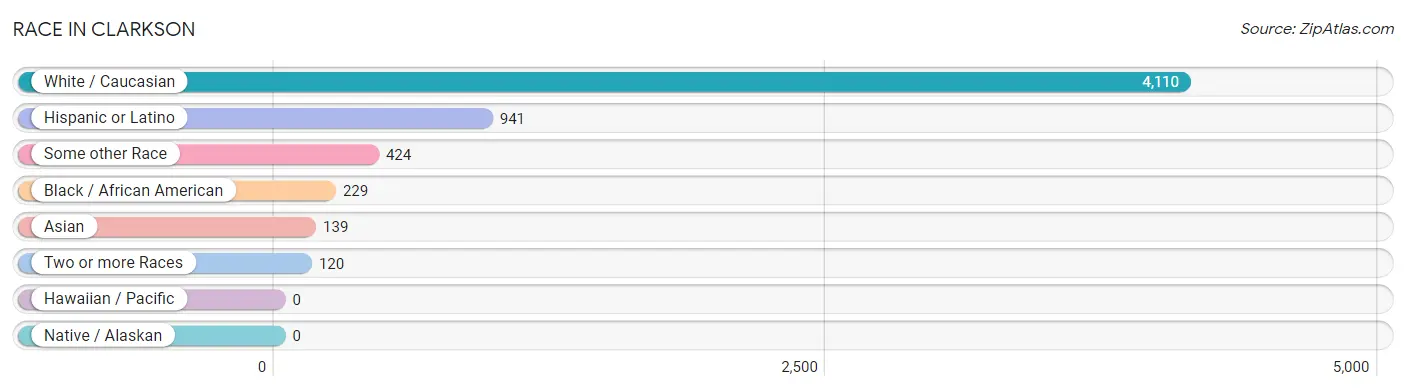
| Race | # Population | % Population |
| Asian | 139 | 2.8% |
| Black / African American | 229 | 4.6% |
| Hawaiian / Pacific | 0 | 0.0% |
| Hispanic or Latino | 941 | 18.7% |
| Native / Alaskan | 0 | 0.0% |
| White / Caucasian | 4,110 | 81.8% |
| Two or more Races | 120 | 2.4% |
| Some other Race | 424 | 8.4% |
| Total | 5,022 | 100.0% |
Ancestry in Clarkson
The most populous ancestries reported in Clarkson are German (1,133 | 22.6%), Italian (599 | 11.9%), Irish (598 | 11.9%), Puerto Rican (466 | 9.3%), and English (441 | 8.8%), together accounting for 64.5% of all Clarkson residents.
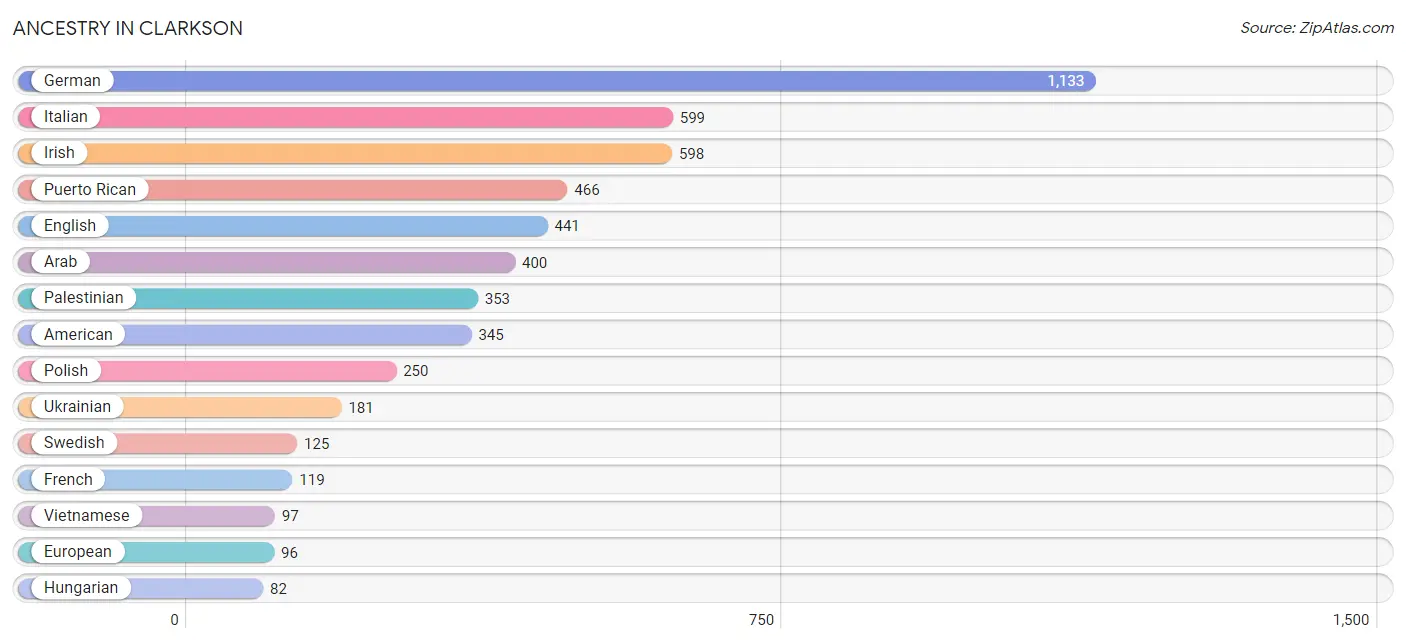
| Ancestry | # Population | % Population |
| American | 345 | 6.9% |
| Arab | 400 | 8.0% |
| Belgian | 17 | 0.3% |
| British | 15 | 0.3% |
| Danish | 14 | 0.3% |
| Dominican | 51 | 1.0% |
| Dutch | 20 | 0.4% |
| Eastern European | 13 | 0.3% |
| Egyptian | 10 | 0.2% |
| English | 441 | 8.8% |
| European | 96 | 1.9% |
| French | 119 | 2.4% |
| French Canadian | 44 | 0.9% |
| German | 1,133 | 22.6% |
| Hungarian | 82 | 1.6% |
| Irish | 598 | 11.9% |
| Italian | 599 | 11.9% |
| Lithuanian | 17 | 0.3% |
| Moroccan | 37 | 0.7% |
| Palestinian | 353 | 7.0% |
| Polish | 250 | 5.0% |
| Puerto Rican | 466 | 9.3% |
| Russian | 68 | 1.3% |
| Scotch-Irish | 54 | 1.1% |
| Scottish | 35 | 0.7% |
| Swedish | 125 | 2.5% |
| Thai | 42 | 0.8% |
| Turkish | 51 | 1.0% |
| Ukrainian | 181 | 3.6% |
| Vietnamese | 97 | 1.9% |
| Welsh | 30 | 0.6% |
| West Indian | 53 | 1.1% | View All 32 Rows |
Immigrants in Clarkson
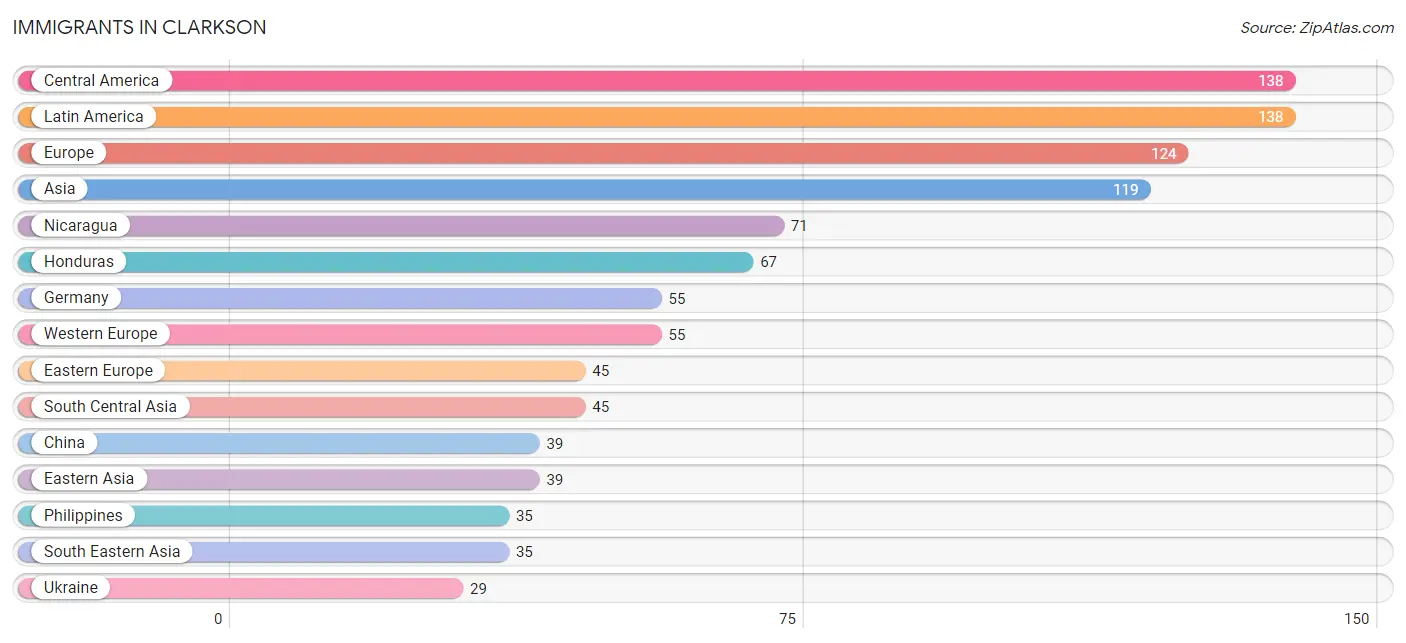
The most numerous immigrant groups reported in Clarkson came from Central America (138 | 2.8%), Latin America (138 | 2.8%), Europe (124 | 2.5%), Asia (119 | 2.4%), and Nicaragua (71 | 1.4%), together accounting for 11.7% of all Clarkson residents.
| Immigration Origin | # Population | % Population |
| Asia | 119 | 2.4% |
| Bangladesh | 23 | 0.5% |
| Belarus | 16 | 0.3% |
| Central America | 138 | 2.8% |
| China | 39 | 0.8% |
| Eastern Asia | 39 | 0.8% |
| Eastern Europe | 45 | 0.9% |
| Europe | 124 | 2.5% |
| Germany | 55 | 1.1% |
| Honduras | 67 | 1.3% |
| India | 22 | 0.4% |
| Italy | 24 | 0.5% |
| Latin America | 138 | 2.8% |
| Nicaragua | 71 | 1.4% |
| Philippines | 35 | 0.7% |
| South Central Asia | 45 | 0.9% |
| South Eastern Asia | 35 | 0.7% |
| Southern Europe | 24 | 0.5% |
| Ukraine | 29 | 0.6% |
| Western Europe | 55 | 1.1% | View All 20 Rows |
Sex and Age in Clarkson
Sex and Age in Clarkson
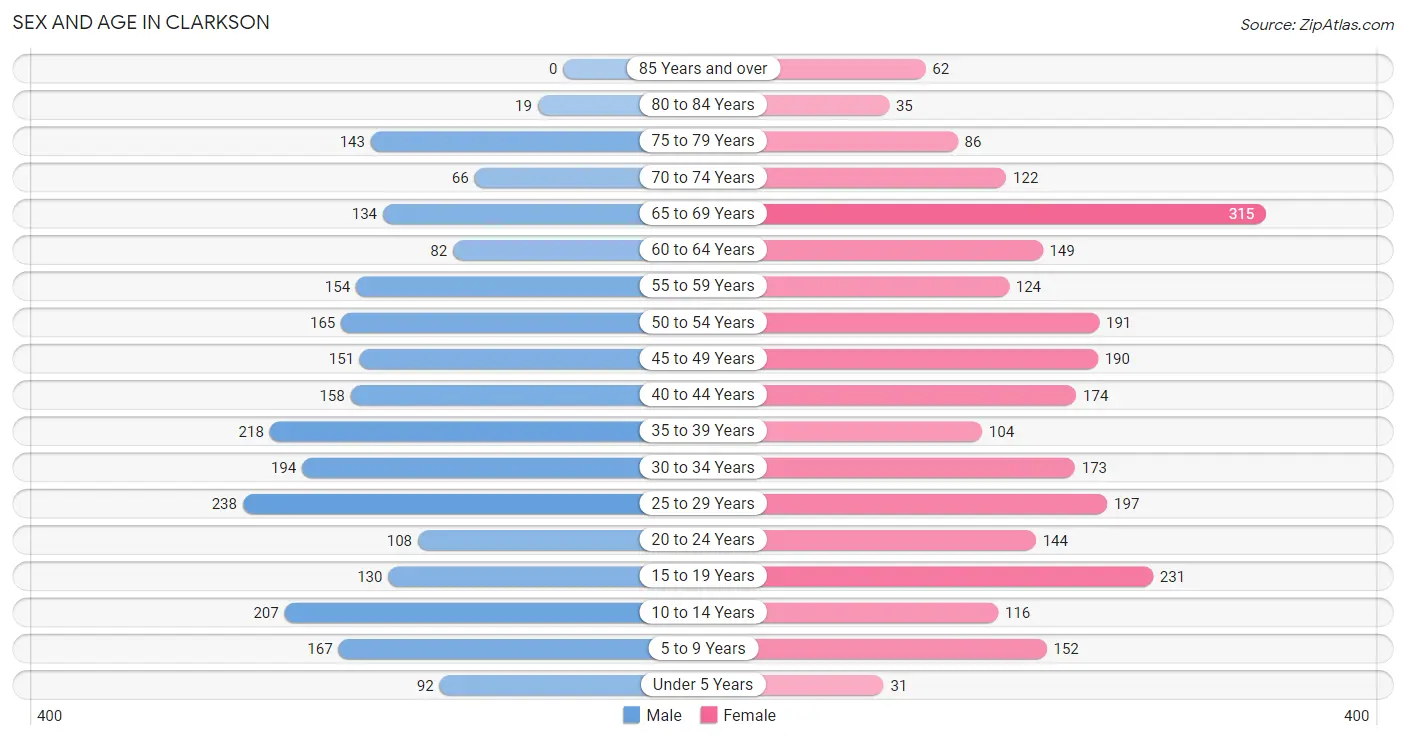
The most populous age groups in Clarkson are 25 to 29 Years (238 | 9.8%) for men and 65 to 69 Years (315 | 12.1%) for women.
| Age Bracket | Male | Female |
| Under 5 Years | 92 (3.8%) | 31 (1.2%) |
| 5 to 9 Years | 167 (6.9%) | 152 (5.9%) |
| 10 to 14 Years | 207 (8.5%) | 116 (4.5%) |
| 15 to 19 Years | 130 (5.4%) | 231 (8.9%) |
| 20 to 24 Years | 108 (4.4%) | 144 (5.6%) |
| 25 to 29 Years | 238 (9.8%) | 197 (7.6%) |
| 30 to 34 Years | 194 (8.0%) | 173 (6.7%) |
| 35 to 39 Years | 218 (9.0%) | 104 (4.0%) |
| 40 to 44 Years | 158 (6.5%) | 174 (6.7%) |
| 45 to 49 Years | 151 (6.2%) | 190 (7.3%) |
| 50 to 54 Years | 165 (6.8%) | 191 (7.4%) |
| 55 to 59 Years | 154 (6.4%) | 124 (4.8%) |
| 60 to 64 Years | 82 (3.4%) | 149 (5.7%) |
| 65 to 69 Years | 134 (5.5%) | 315 (12.1%) |
| 70 to 74 Years | 66 (2.7%) | 122 (4.7%) |
| 75 to 79 Years | 143 (5.9%) | 86 (3.3%) |
| 80 to 84 Years | 19 (0.8%) | 35 (1.3%) |
| 85 Years and over | 0 (0.0%) | 62 (2.4%) |
| Total | 2,426 (100.0%) | 2,596 (100.0%) |
Families and Households in Clarkson
Median Family Size in Clarkson
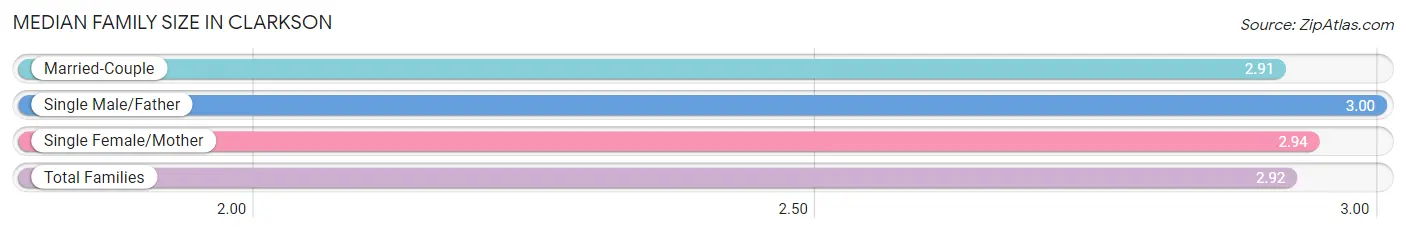
The median family size in Clarkson is 2.92 persons per family, with single male/father families (75 | 5.7%) accounting for the largest median family size of 3 persons per family. On the other hand, married-couple families (1,047 | 79.2%) represent the smallest median family size with 2.91 persons per family.
| Family Type | # Families | Family Size |
| Married-Couple | 1,047 (79.2%) | 2.91 |
| Single Male/Father | 75 (5.7%) | 3.00 |
| Single Female/Mother | 200 (15.1%) | 2.94 |
| Total Families | 1,322 (100.0%) | 2.92 |
Median Household Size in Clarkson
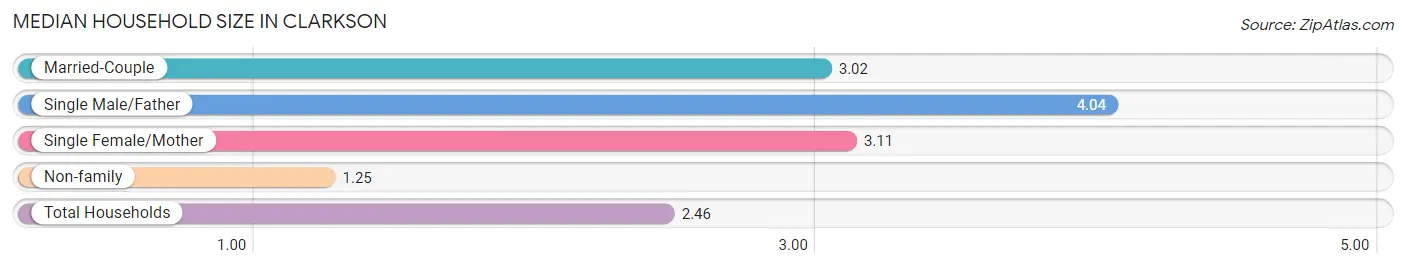
The median household size in Clarkson is 2.46 persons per household, with single male/father households (75 | 3.7%) accounting for the largest median household size of 4.04 persons per household. non-family households (682 | 34.0%) represent the smallest median household size with 1.25 persons per household.
| Household Type | # Households | Household Size |
| Married-Couple | 1,047 (52.2%) | 3.02 |
| Single Male/Father | 75 (3.7%) | 4.04 |
| Single Female/Mother | 200 (10.0%) | 3.11 |
| Non-family | 682 (34.0%) | 1.25 |
| Total Households | 2,004 (100.0%) | 2.46 |
Household Size by Marriage Status in Clarkson
Out of a total of 2,004 households in Clarkson, 1,322 (66.0%) are family households, while 682 (34.0%) are nonfamily households. The most numerous type of family households are 2-person households, comprising 663, and the most common type of nonfamily households are 1-person households, comprising 489.
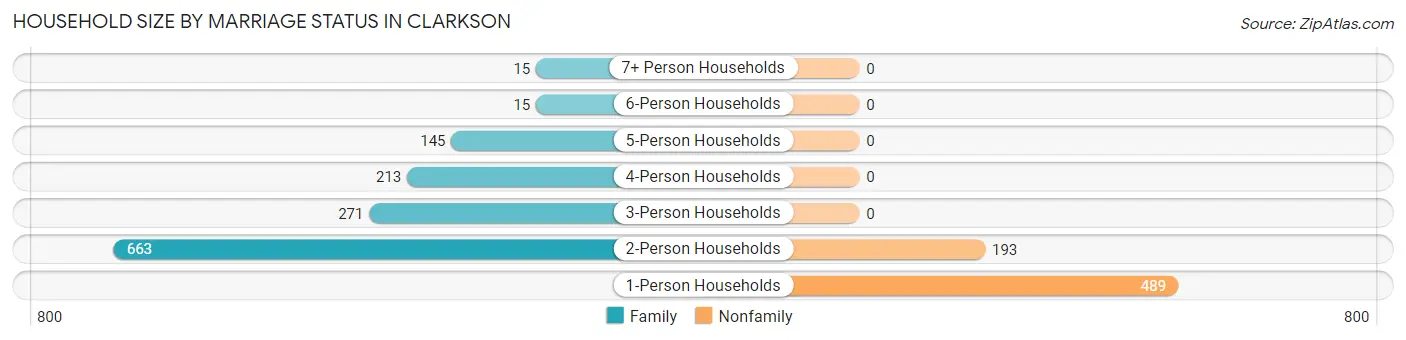
| Household Size | Family Households | Nonfamily Households |
| 1-Person Households | - | 489 (24.4%) |
| 2-Person Households | 663 (33.1%) | 193 (9.6%) |
| 3-Person Households | 271 (13.5%) | 0 (0.0%) |
| 4-Person Households | 213 (10.6%) | 0 (0.0%) |
| 5-Person Households | 145 (7.2%) | 0 (0.0%) |
| 6-Person Households | 15 (0.7%) | 0 (0.0%) |
| 7+ Person Households | 15 (0.7%) | 0 (0.0%) |
| Total | 1,322 (66.0%) | 682 (34.0%) |
Female Fertility in Clarkson
Fertility by Age in Clarkson
| Age Bracket | Women with Births | Births / 1,000 Women |
| 15 to 19 years | 0 (0.0%) | 0.0 |
| 20 to 34 years | 0 (0.0%) | 0.0 |
| 35 to 50 years | 0 (0.0%) | 0.0 |
| Total | 0 (0.0%) | 0.0 |
Fertility by Age by Marriage Status in Clarkson
| Age Bracket | Married | Unmarried |
| 15 to 19 years | 0 (0.0%) | 0 (0.0%) |
| 20 to 34 years | 0 (0.0%) | 0 (0.0%) |
| 35 to 50 years | 0 (0.0%) | 0 (0.0%) |
| Total | 0 (0.0%) | 0 (0.0%) |
Fertility by Education in Clarkson
| Educational Attainment | Women with Births | Births / 1,000 Women |
| Less than High School | 0 (0.0%) | 0.0 |
| High School Diploma | 0 (0.0%) | 0.0 |
| College or Associate's Degree | 0 (0.0%) | 0.0 |
| Bachelor's Degree | 0 (0.0%) | 0.0 |
| Graduate Degree | 0 (0.0%) | 0.0 |
| Total | 0 (0.0%) | 0.0 |
Fertility by Education by Marriage Status in Clarkson
| Educational Attainment | Married | Unmarried |
| Less than High School | 0 (0.0%) | 0 (0.0%) |
| High School Diploma | 0 (0.0%) | 0 (0.0%) |
| College or Associate's Degree | 0 (0.0%) | 0 (0.0%) |
| Bachelor's Degree | 0 (0.0%) | 0 (0.0%) |
| Graduate Degree | 0 (0.0%) | 0 (0.0%) |
| Total | 0 (0.0%) | 0 (0.0%) |
Employment Characteristics in Clarkson
Employment by Class of Employer in Clarkson
Among the 2,459 employed individuals in Clarkson, private company employees (1,481 | 60.2%), not-for-profit organizations (361 | 14.7%), and local government employees (337 | 13.7%) make up the most common classes of employment.
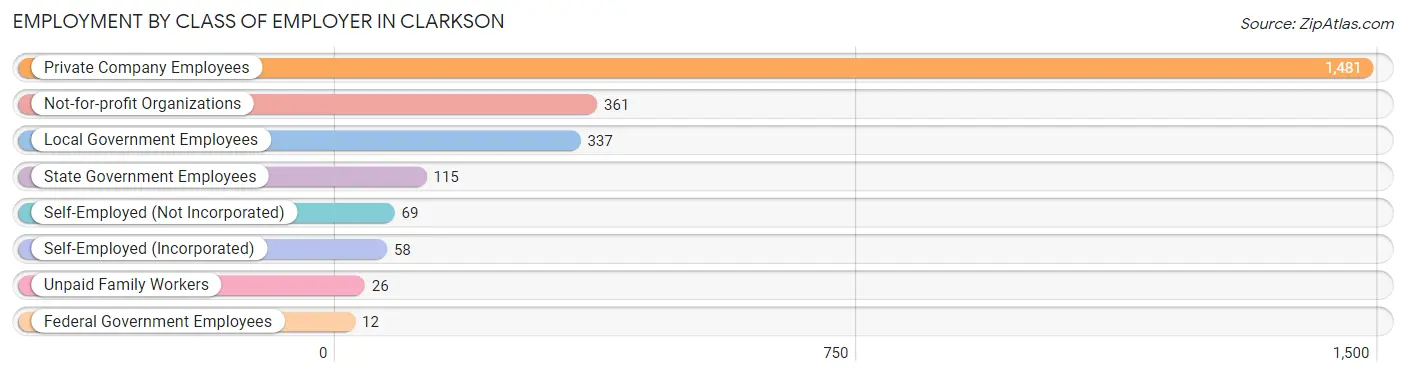
| Employer Class | # Employees | % Employees |
| Private Company Employees | 1,481 | 60.2% |
| Self-Employed (Incorporated) | 58 | 2.4% |
| Self-Employed (Not Incorporated) | 69 | 2.8% |
| Not-for-profit Organizations | 361 | 14.7% |
| Local Government Employees | 337 | 13.7% |
| State Government Employees | 115 | 4.7% |
| Federal Government Employees | 12 | 0.5% |
| Unpaid Family Workers | 26 | 1.1% |
| Total | 2,459 | 100.0% |
Employment Status by Age in Clarkson
According to the labor force statistics for Clarkson, out of the total population over 16 years of age (4,208), 60.2% or 2,533 individuals are in the labor force, with 1.6% or 41 of them unemployed. The age group with the highest labor force participation rate is 25 to 29 years, with 93.3% or 406 individuals in the labor force. Within the labor force, the 45 to 54 years age range has the highest percentage of unemployed individuals, with 4.7% or 30 of them being unemployed.
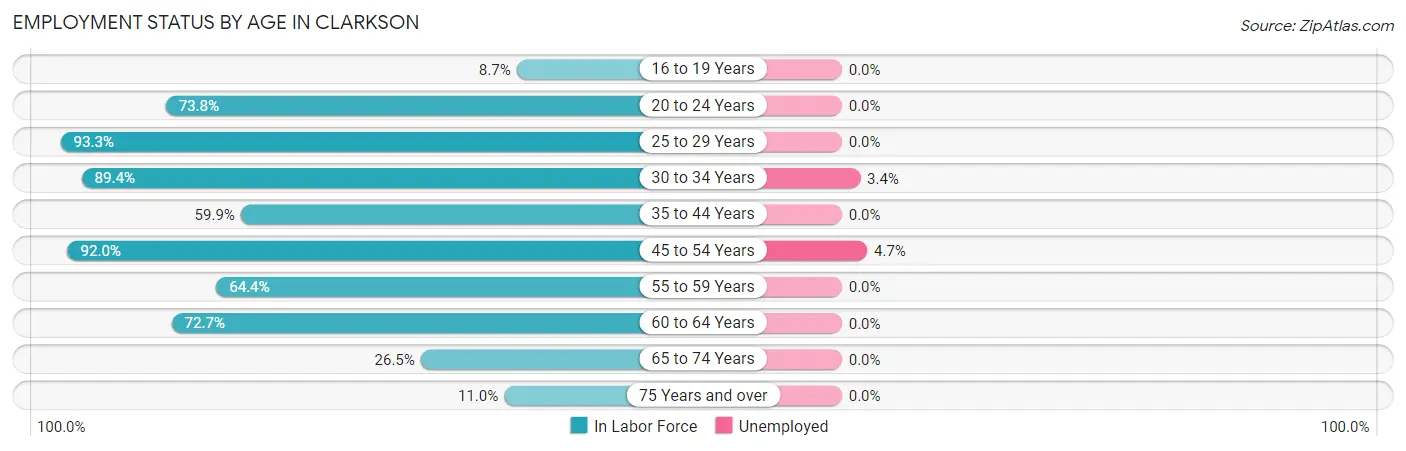
| Age Bracket | In Labor Force | Unemployed |
| 16 to 19 Years | 27 (8.7%) | 0 (0.0%) |
| 20 to 24 Years | 186 (73.8%) | 0 (0.0%) |
| 25 to 29 Years | 406 (93.3%) | 0 (0.0%) |
| 30 to 34 Years | 328 (89.4%) | 11 (3.4%) |
| 35 to 44 Years | 392 (59.9%) | 0 (0.0%) |
| 45 to 54 Years | 641 (92.0%) | 30 (4.7%) |
| 55 to 59 Years | 179 (64.4%) | 0 (0.0%) |
| 60 to 64 Years | 168 (72.7%) | 0 (0.0%) |
| 65 to 74 Years | 169 (26.5%) | 0 (0.0%) |
| 75 Years and over | 38 (11.0%) | 0 (0.0%) |
| Total | 2,533 (60.2%) | 41 (1.6%) |
Employment Status by Educational Attainment in Clarkson
According to labor force statistics for Clarkson, 79.4% of individuals (2,114) out of the total population between 25 and 64 years of age (2,662) are in the labor force, with 1.9% or 40 of them being unemployed. The group with the highest labor force participation rate are those with the educational attainment of college / associate degree, with 91.8% or 547 individuals in the labor force. Within the labor force, individuals with high school diploma education have the highest percentage of unemployment, with 6.6% or 30 of them being unemployed.
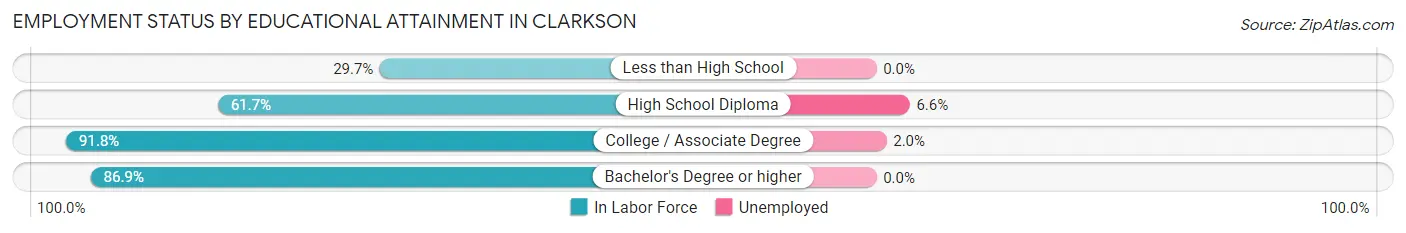
| Educational Attainment | In Labor Force | Unemployed |
| Less than High School | 22 (29.7%) | 0 (0.0%) |
| High School Diploma | 454 (61.7%) | 49 (6.6%) |
| College / Associate Degree | 547 (91.8%) | 12 (2.0%) |
| Bachelor's Degree or higher | 1,091 (86.9%) | 0 (0.0%) |
| Total | 2,114 (79.4%) | 51 (1.9%) |
Employment Occupations by Sex in Clarkson
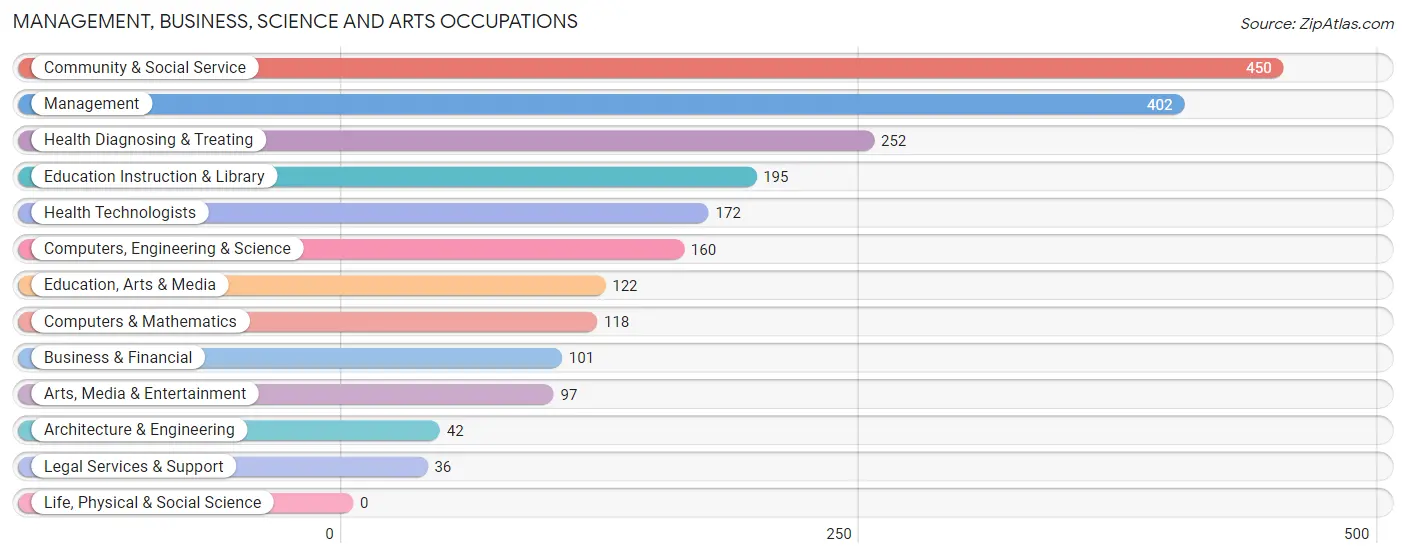
Management, Business, Science and Arts Occupations
The most common Management, Business, Science and Arts occupations in Clarkson are Community & Social Service (450 | 18.0%), Management (402 | 16.1%), Health Diagnosing & Treating (252 | 10.1%), Education Instruction & Library (195 | 7.8%), and Health Technologists (172 | 6.9%).
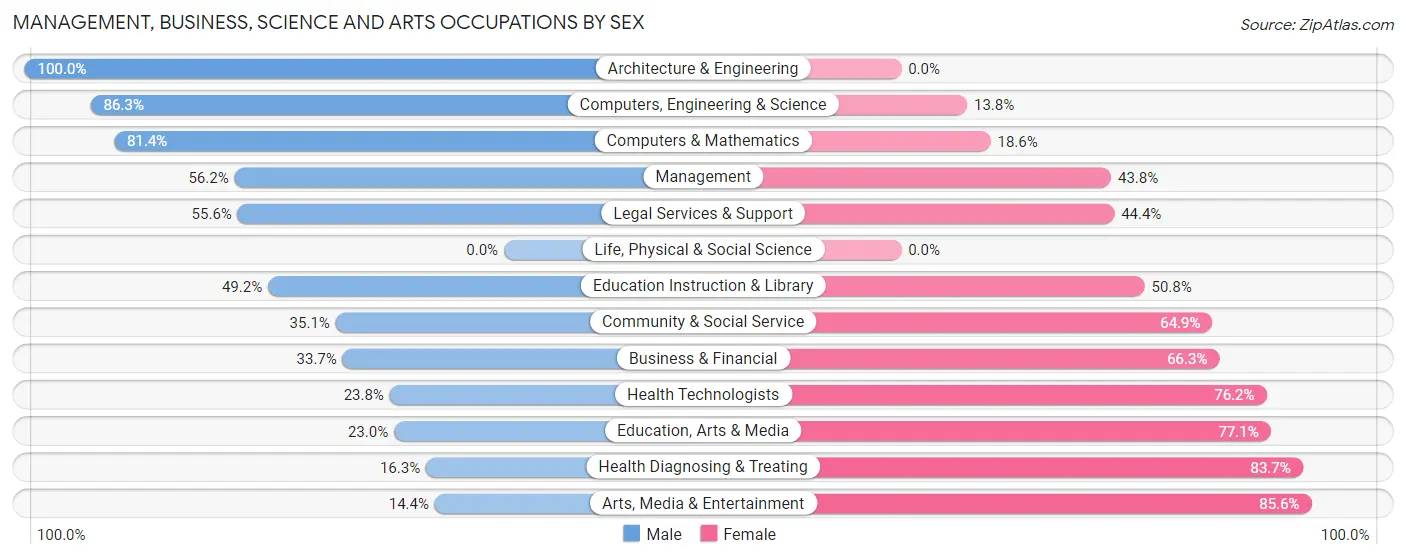
Management, Business, Science and Arts Occupations by Sex
Within the Management, Business, Science and Arts occupations in Clarkson, the most male-oriented occupations are Architecture & Engineering (100.0%), Computers, Engineering & Science (86.3%), and Computers & Mathematics (81.4%), while the most female-oriented occupations are Arts, Media & Entertainment (85.6%), Health Diagnosing & Treating (83.7%), and Education, Arts & Media (77.0%).
| Occupation | Male | Female |
| Management | 226 (56.2%) | 176 (43.8%) |
| Business & Financial | 34 (33.7%) | 67 (66.3%) |
| Computers, Engineering & Science | 138 (86.3%) | 22 (13.8%) |
| Computers & Mathematics | 96 (81.4%) | 22 (18.6%) |
| Architecture & Engineering | 42 (100.0%) | 0 (0.0%) |
| Life, Physical & Social Science | 0 (0.0%) | 0 (0.0%) |
| Community & Social Service | 158 (35.1%) | 292 (64.9%) |
| Education, Arts & Media | 28 (23.0%) | 94 (77.0%) |
| Legal Services & Support | 20 (55.6%) | 16 (44.4%) |
| Education Instruction & Library | 96 (49.2%) | 99 (50.8%) |
| Arts, Media & Entertainment | 14 (14.4%) | 83 (85.6%) |
| Health Diagnosing & Treating | 41 (16.3%) | 211 (83.7%) |
| Health Technologists | 41 (23.8%) | 131 (76.2%) |
| Total (Category) | 597 (43.7%) | 768 (56.3%) |
| Total (Overall) | 1,314 (52.7%) | 1,179 (47.3%) |
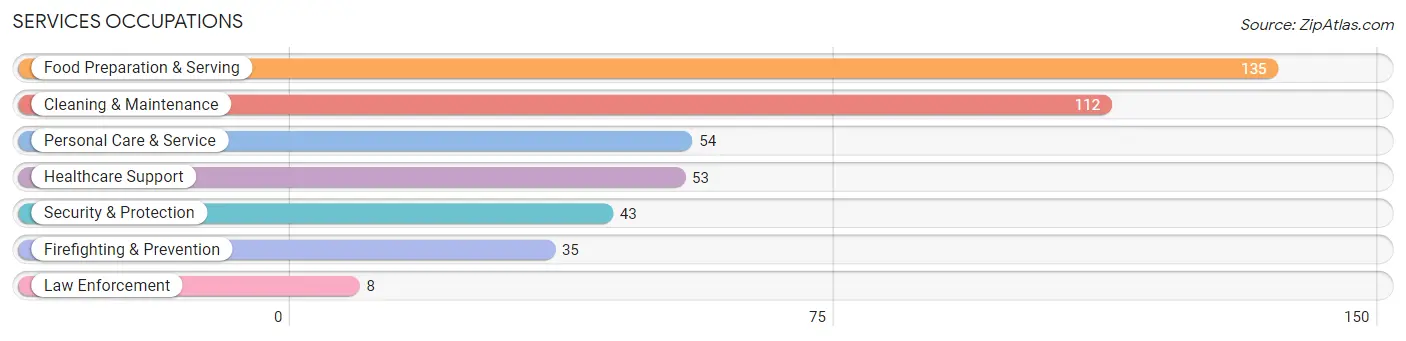
Services Occupations
The most common Services occupations in Clarkson are Food Preparation & Serving (135 | 5.4%), Cleaning & Maintenance (112 | 4.5%), Personal Care & Service (54 | 2.2%), Healthcare Support (53 | 2.1%), and Security & Protection (43 | 1.7%).
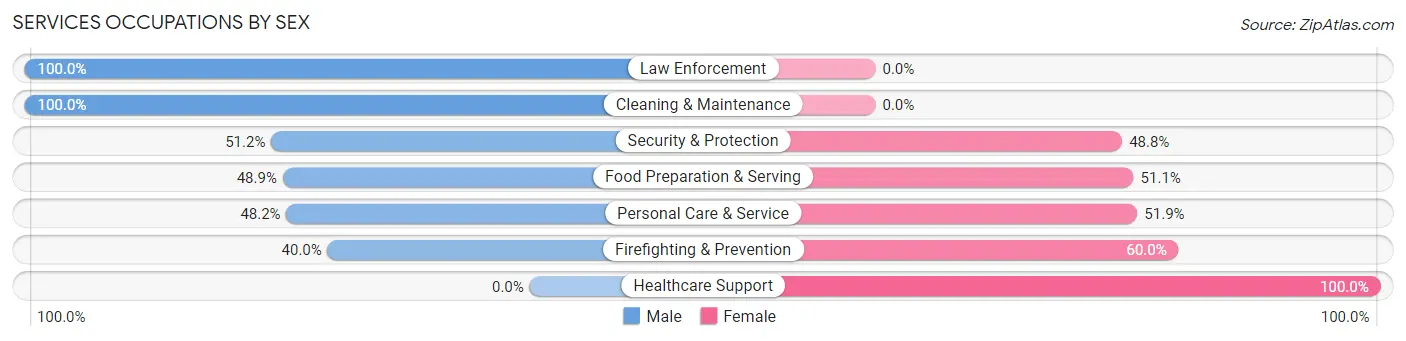
Services Occupations by Sex
Within the Services occupations in Clarkson, the most male-oriented occupations are Law Enforcement (100.0%), Cleaning & Maintenance (100.0%), and Security & Protection (51.2%), while the most female-oriented occupations are Healthcare Support (100.0%), Firefighting & Prevention (60.0%), and Personal Care & Service (51.8%).
| Occupation | Male | Female |
| Healthcare Support | 0 (0.0%) | 53 (100.0%) |
| Security & Protection | 22 (51.2%) | 21 (48.8%) |
| Firefighting & Prevention | 14 (40.0%) | 21 (60.0%) |
| Law Enforcement | 8 (100.0%) | 0 (0.0%) |
| Food Preparation & Serving | 66 (48.9%) | 69 (51.1%) |
| Cleaning & Maintenance | 112 (100.0%) | 0 (0.0%) |
| Personal Care & Service | 26 (48.1%) | 28 (51.8%) |
| Total (Category) | 226 (56.9%) | 171 (43.1%) |
| Total (Overall) | 1,314 (52.7%) | 1,179 (47.3%) |
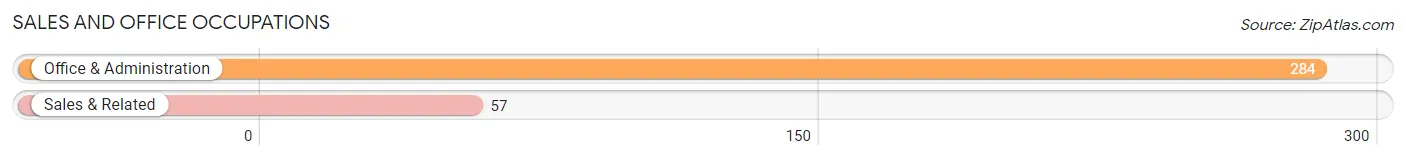
Sales and Office Occupations
The most common Sales and Office occupations in Clarkson are Office & Administration (284 | 11.4%), and Sales & Related (57 | 2.3%).
Sales and Office Occupations by Sex
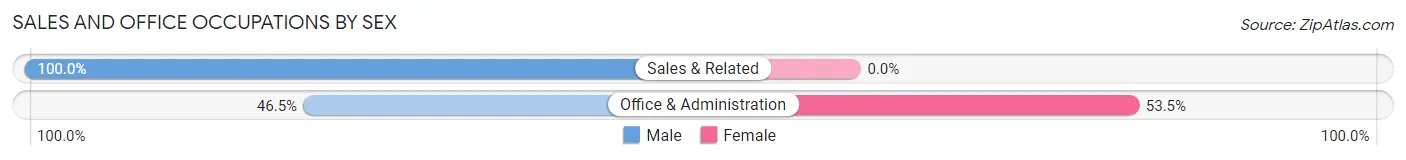
| Occupation | Male | Female |
| Sales & Related | 57 (100.0%) | 0 (0.0%) |
| Office & Administration | 132 (46.5%) | 152 (53.5%) |
| Total (Category) | 189 (55.4%) | 152 (44.6%) |
| Total (Overall) | 1,314 (52.7%) | 1,179 (47.3%) |
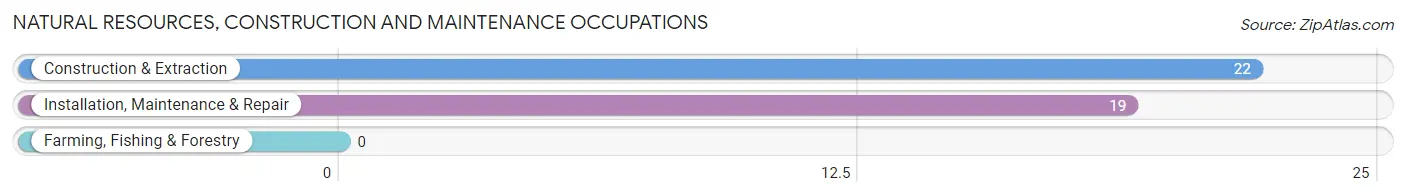
Natural Resources, Construction and Maintenance Occupations
The most common Natural Resources, Construction and Maintenance occupations in Clarkson are Construction & Extraction (22 | 0.9%), and Installation, Maintenance & Repair (19 | 0.8%).
Natural Resources, Construction and Maintenance Occupations by Sex
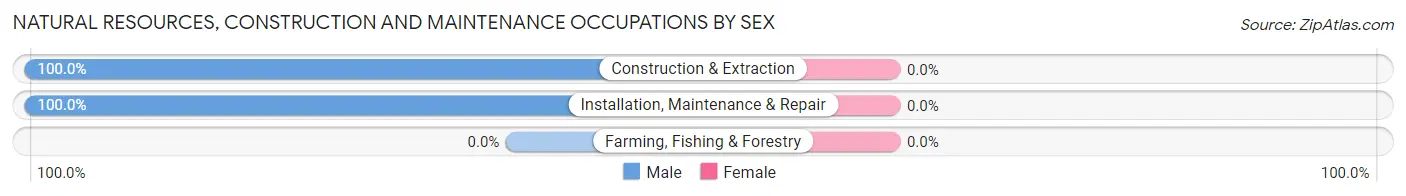
| Occupation | Male | Female |
| Farming, Fishing & Forestry | 0 (0.0%) | 0 (0.0%) |
| Construction & Extraction | 22 (100.0%) | 0 (0.0%) |
| Installation, Maintenance & Repair | 19 (100.0%) | 0 (0.0%) |
| Total (Category) | 41 (100.0%) | 0 (0.0%) |
| Total (Overall) | 1,314 (52.7%) | 1,179 (47.3%) |
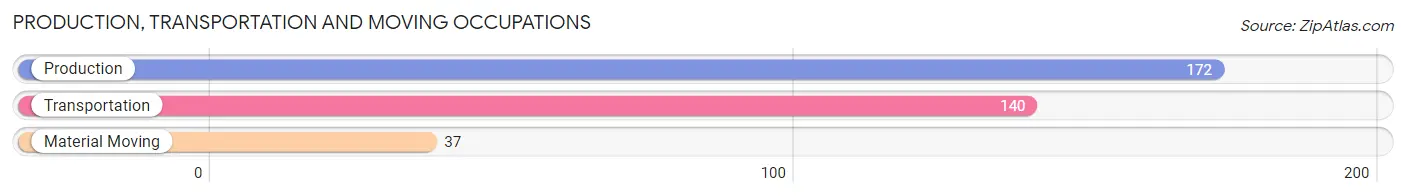
Production, Transportation and Moving Occupations
The most common Production, Transportation and Moving occupations in Clarkson are Production (172 | 6.9%), Transportation (140 | 5.6%), and Material Moving (37 | 1.5%).
Production, Transportation and Moving Occupations by Sex
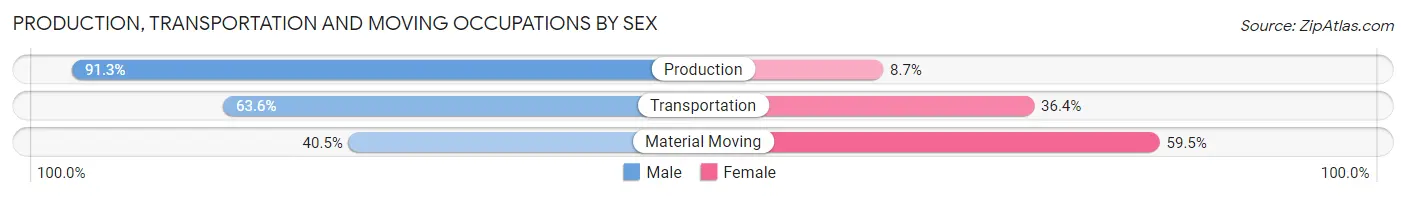
| Occupation | Male | Female |
| Production | 157 (91.3%) | 15 (8.7%) |
| Transportation | 89 (63.6%) | 51 (36.4%) |
| Material Moving | 15 (40.5%) | 22 (59.5%) |
| Total (Category) | 261 (74.8%) | 88 (25.2%) |
| Total (Overall) | 1,314 (52.7%) | 1,179 (47.3%) |
Employment Industries by Sex in Clarkson
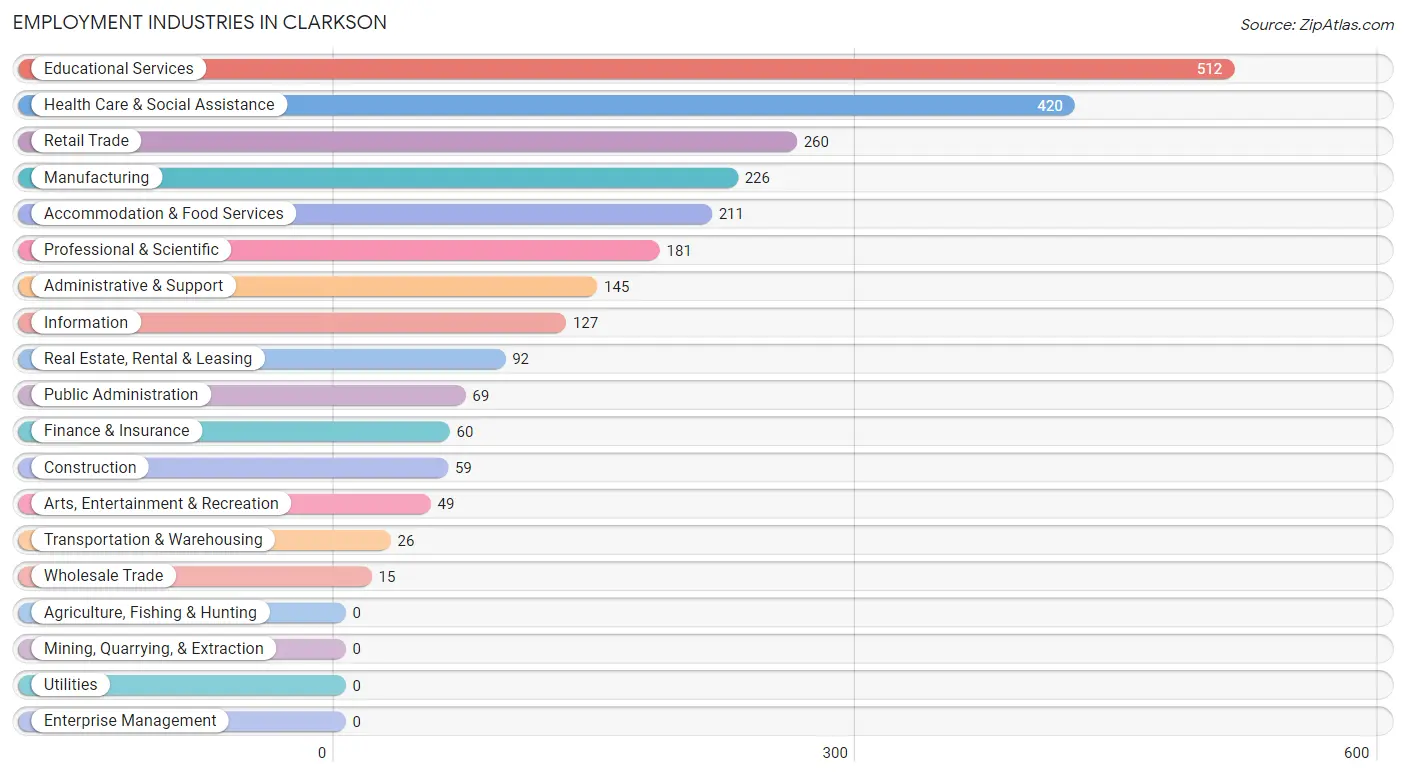
Employment Industries in Clarkson
The major employment industries in Clarkson include Educational Services (512 | 20.5%), Health Care & Social Assistance (420 | 16.9%), Retail Trade (260 | 10.4%), Manufacturing (226 | 9.1%), and Accommodation & Food Services (211 | 8.5%).
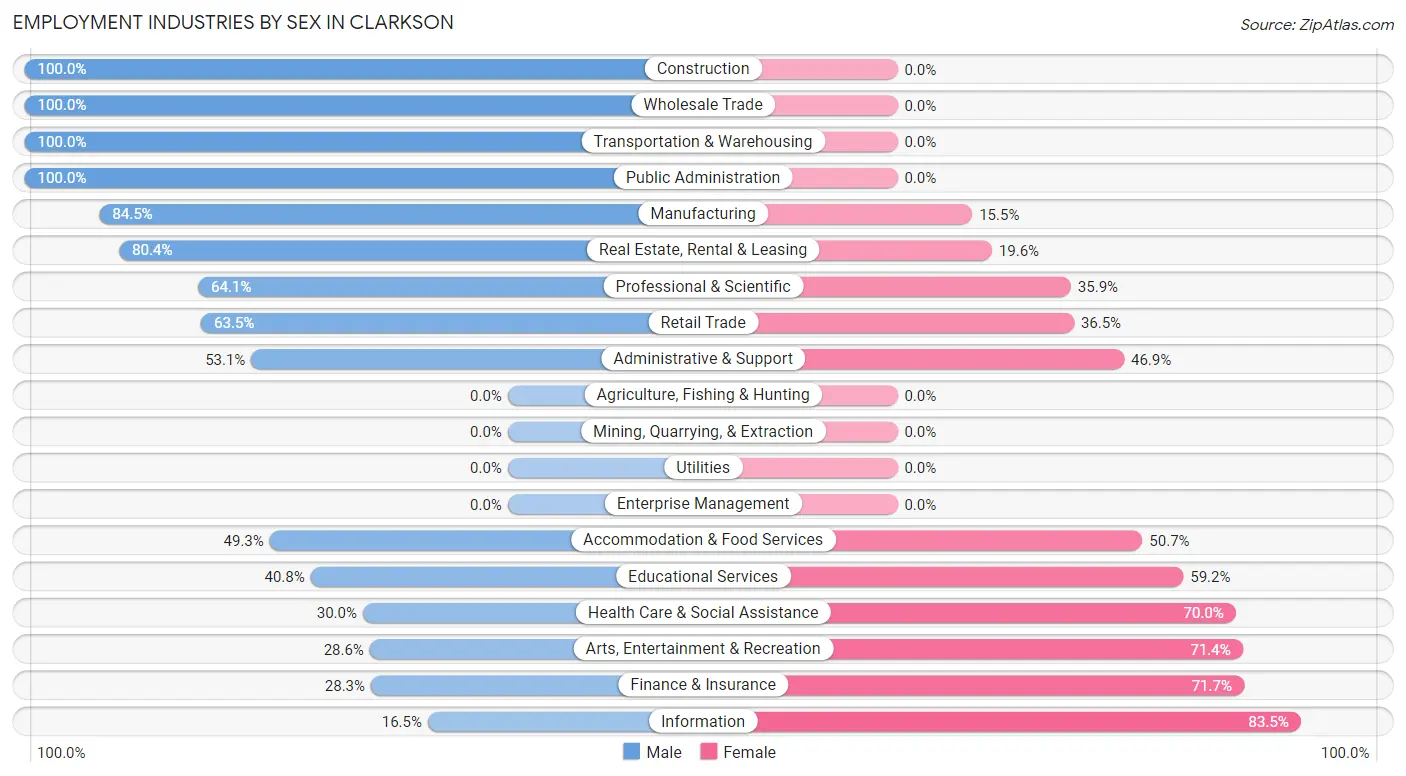
Employment Industries by Sex in Clarkson
The Clarkson industries that see more men than women are Construction (100.0%), Wholesale Trade (100.0%), and Transportation & Warehousing (100.0%), whereas the industries that tend to have a higher number of women are Information (83.5%), Finance & Insurance (71.7%), and Arts, Entertainment & Recreation (71.4%).
| Industry | Male | Female |
| Agriculture, Fishing & Hunting | 0 (0.0%) | 0 (0.0%) |
| Mining, Quarrying, & Extraction | 0 (0.0%) | 0 (0.0%) |
| Construction | 59 (100.0%) | 0 (0.0%) |
| Manufacturing | 191 (84.5%) | 35 (15.5%) |
| Wholesale Trade | 15 (100.0%) | 0 (0.0%) |
| Retail Trade | 165 (63.5%) | 95 (36.5%) |
| Transportation & Warehousing | 26 (100.0%) | 0 (0.0%) |
| Utilities | 0 (0.0%) | 0 (0.0%) |
| Information | 21 (16.5%) | 106 (83.5%) |
| Finance & Insurance | 17 (28.3%) | 43 (71.7%) |
| Real Estate, Rental & Leasing | 74 (80.4%) | 18 (19.6%) |
| Professional & Scientific | 116 (64.1%) | 65 (35.9%) |
| Enterprise Management | 0 (0.0%) | 0 (0.0%) |
| Administrative & Support | 77 (53.1%) | 68 (46.9%) |
| Educational Services | 209 (40.8%) | 303 (59.2%) |
| Health Care & Social Assistance | 126 (30.0%) | 294 (70.0%) |
| Arts, Entertainment & Recreation | 14 (28.6%) | 35 (71.4%) |
| Accommodation & Food Services | 104 (49.3%) | 107 (50.7%) |
| Public Administration | 69 (100.0%) | 0 (0.0%) |
| Total | 1,314 (52.7%) | 1,179 (47.3%) |
Education in Clarkson
School Enrollment in Clarkson
The most common levels of schooling among the 1,102 students in Clarkson are high school (336 | 30.5%), middle school (309 | 28.0%), and elementary school (224 | 20.3%).
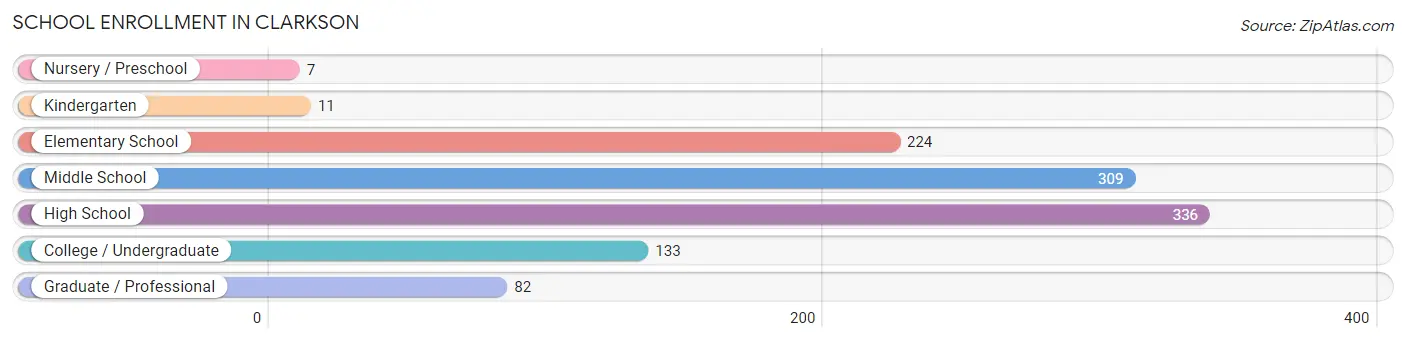
| School Level | # Students | % Students |
| Nursery / Preschool | 7 | 0.6% |
| Kindergarten | 11 | 1.0% |
| Elementary School | 224 | 20.3% |
| Middle School | 309 | 28.0% |
| High School | 336 | 30.5% |
| College / Undergraduate | 133 | 12.1% |
| Graduate / Professional | 82 | 7.4% |
| Total | 1,102 | 100.0% |
School Enrollment by Age by Funding Source in Clarkson
Out of a total of 1,102 students who are enrolled in schools in Clarkson, 370 (33.6%) attend a private institution, while the remaining 732 (66.4%) are enrolled in public schools. The age group of 18 to 19 year olds has the highest likelihood of being enrolled in private schools, with 156 (89.1% in the age bracket) enrolled. Conversely, the age group of 3 to 4 year olds has the lowest likelihood of being enrolled in a private school, with 7 (100.0% in the age bracket) attending a public institution.
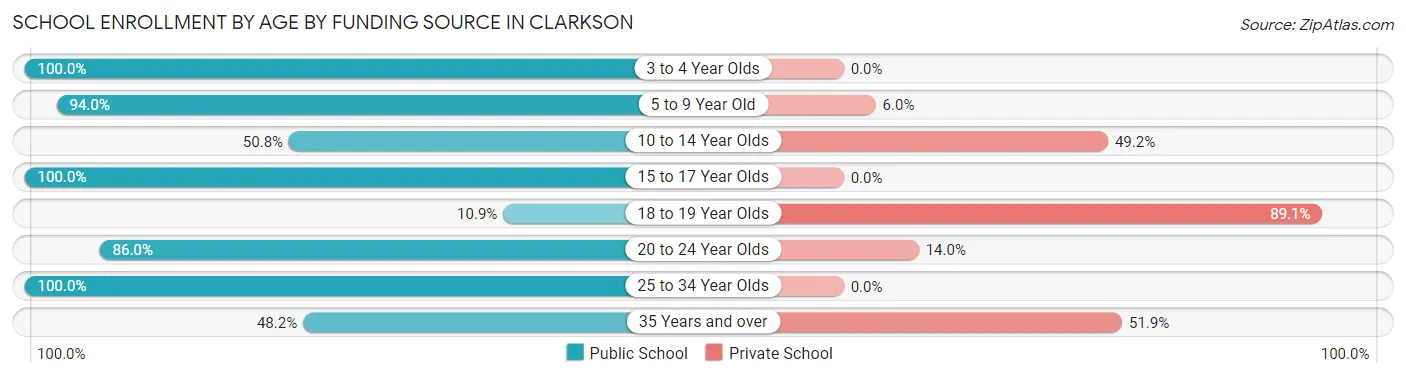
| Age Bracket | Public School | Private School |
| 3 to 4 Year Olds | 7 (100.0%) | 0 (0.0%) |
| 5 to 9 Year Old | 221 (94.0%) | 14 (6.0%) |
| 10 to 14 Year Olds | 164 (50.8%) | 159 (49.2%) |
| 15 to 17 Year Olds | 166 (100.0%) | 0 (0.0%) |
| 18 to 19 Year Olds | 19 (10.9%) | 156 (89.1%) |
| 20 to 24 Year Olds | 80 (86.0%) | 13 (14.0%) |
| 25 to 34 Year Olds | 49 (100.0%) | 0 (0.0%) |
| 35 Years and over | 26 (48.1%) | 28 (51.8%) |
| Total | 732 (66.4%) | 370 (33.6%) |
Educational Attainment by Field of Study in Clarkson
Education (286 | 17.8%), business (225 | 14.0%), arts & humanities (152 | 9.5%), communications (149 | 9.3%), and science & technology (121 | 7.5%) are the most common fields of study among 1,602 individuals in Clarkson who have obtained a bachelor's degree or higher.
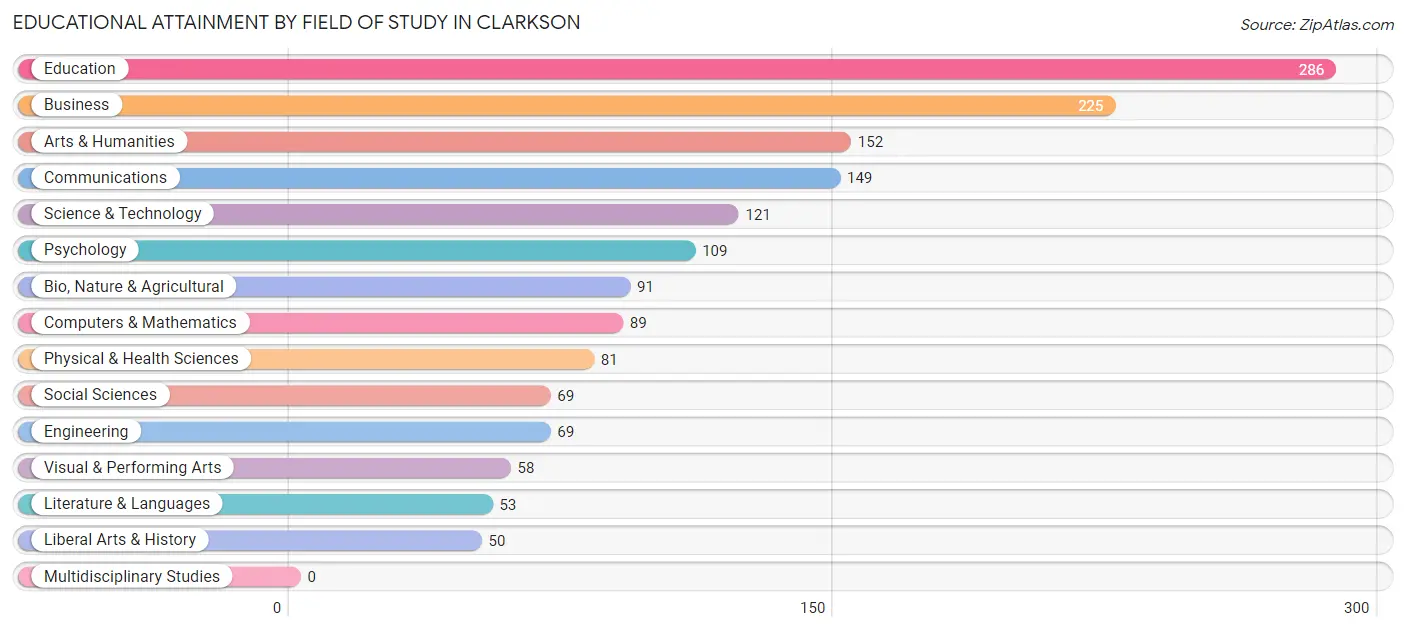
| Field of Study | # Graduates | % Graduates |
| Computers & Mathematics | 89 | 5.6% |
| Bio, Nature & Agricultural | 91 | 5.7% |
| Physical & Health Sciences | 81 | 5.1% |
| Psychology | 109 | 6.8% |
| Social Sciences | 69 | 4.3% |
| Engineering | 69 | 4.3% |
| Multidisciplinary Studies | 0 | 0.0% |
| Science & Technology | 121 | 7.5% |
| Business | 225 | 14.0% |
| Education | 286 | 17.8% |
| Literature & Languages | 53 | 3.3% |
| Liberal Arts & History | 50 | 3.1% |
| Visual & Performing Arts | 58 | 3.6% |
| Communications | 149 | 9.3% |
| Arts & Humanities | 152 | 9.5% |
| Total | 1,602 | 100.0% |
Transportation & Commute in Clarkson
Vehicle Availability by Sex in Clarkson
The most prevalent vehicle ownership categories in Clarkson are males with 2 vehicles (691, accounting for 54.0%) and females with 2 vehicles (689, making up 58.6%).
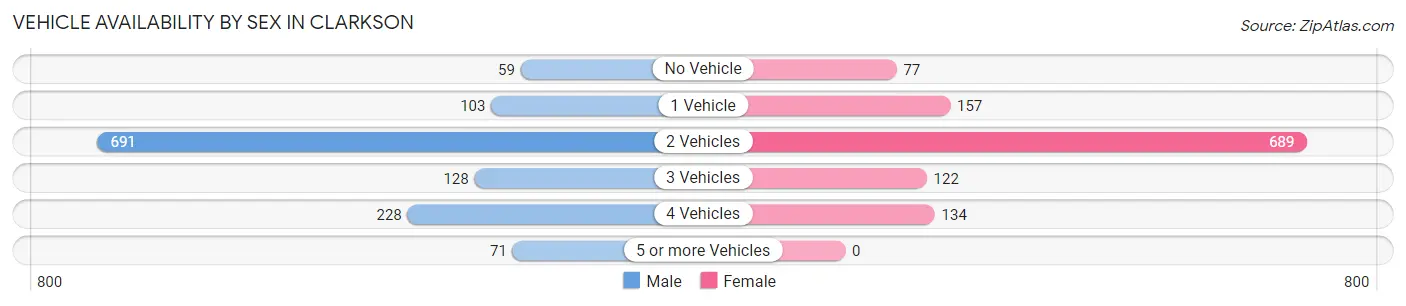
| Vehicles Available | Male | Female |
| No Vehicle | 59 (4.6%) | 77 (6.5%) |
| 1 Vehicle | 103 (8.1%) | 157 (13.3%) |
| 2 Vehicles | 691 (54.0%) | 689 (58.4%) |
| 3 Vehicles | 128 (10.0%) | 122 (10.3%) |
| 4 Vehicles | 228 (17.8%) | 134 (11.4%) |
| 5 or more Vehicles | 71 (5.6%) | 0 (0.0%) |
| Total | 1,280 (100.0%) | 1,179 (100.0%) |
Commute Time in Clarkson
The most frequently occuring commute durations in Clarkson are 30 to 34 minutes (382 commuters, 18.3%), 5 to 9 minutes (326 commuters, 15.6%), and 10 to 14 minutes (320 commuters, 15.3%).
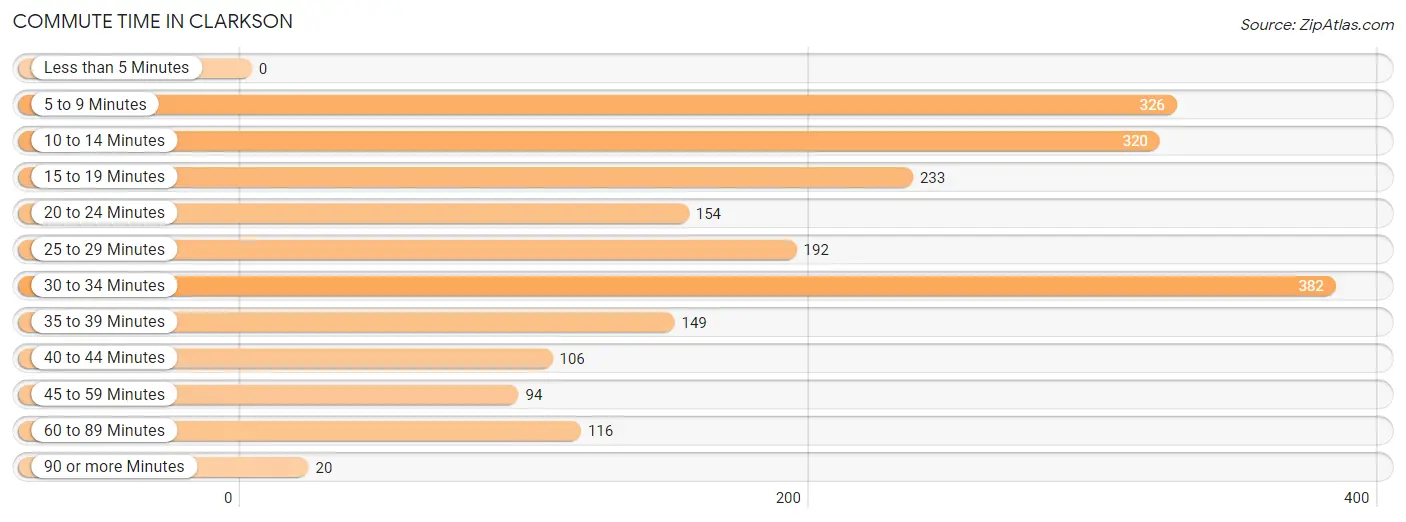
| Commute Time | # Commuters | % Commuters |
| Less than 5 Minutes | 0 | 0.0% |
| 5 to 9 Minutes | 326 | 15.6% |
| 10 to 14 Minutes | 320 | 15.3% |
| 15 to 19 Minutes | 233 | 11.1% |
| 20 to 24 Minutes | 154 | 7.4% |
| 25 to 29 Minutes | 192 | 9.2% |
| 30 to 34 Minutes | 382 | 18.3% |
| 35 to 39 Minutes | 149 | 7.1% |
| 40 to 44 Minutes | 106 | 5.1% |
| 45 to 59 Minutes | 94 | 4.5% |
| 60 to 89 Minutes | 116 | 5.5% |
| 90 or more Minutes | 20 | 1.0% |
Commute Time by Sex in Clarkson
The most common commute times in Clarkson are 30 to 34 minutes (246 commuters, 20.8%) for males and 5 to 9 minutes (184 commuters, 20.2%) for females.
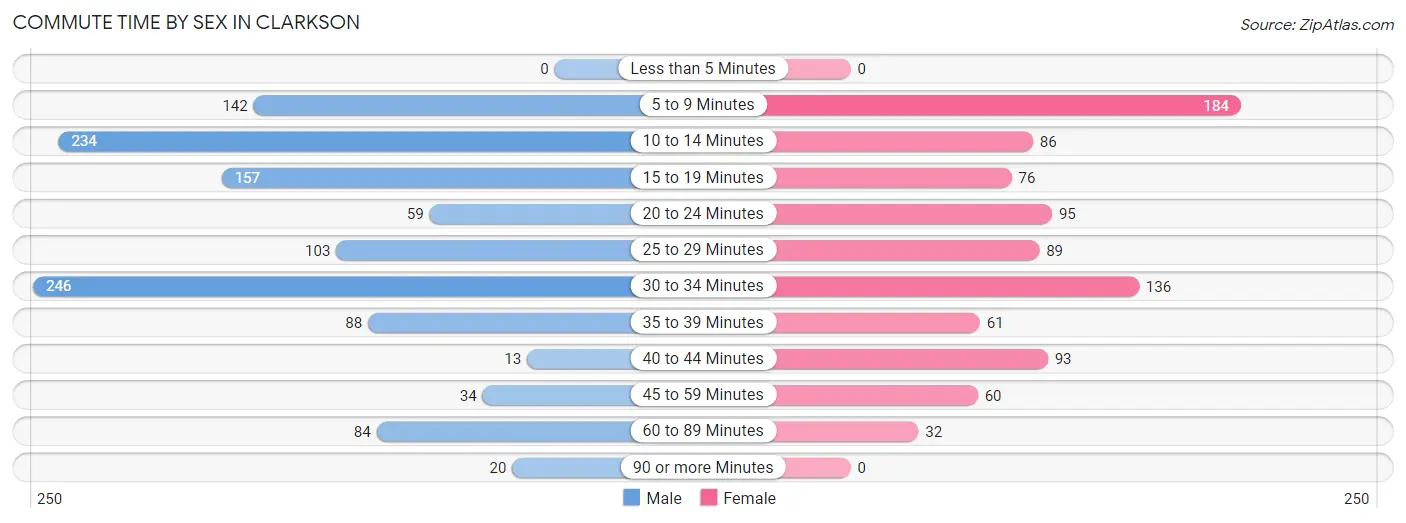
| Commute Time | Male | Female |
| Less than 5 Minutes | 0 (0.0%) | 0 (0.0%) |
| 5 to 9 Minutes | 142 (12.0%) | 184 (20.2%) |
| 10 to 14 Minutes | 234 (19.8%) | 86 (9.4%) |
| 15 to 19 Minutes | 157 (13.3%) | 76 (8.3%) |
| 20 to 24 Minutes | 59 (5.0%) | 95 (10.4%) |
| 25 to 29 Minutes | 103 (8.7%) | 89 (9.8%) |
| 30 to 34 Minutes | 246 (20.8%) | 136 (14.9%) |
| 35 to 39 Minutes | 88 (7.5%) | 61 (6.7%) |
| 40 to 44 Minutes | 13 (1.1%) | 93 (10.2%) |
| 45 to 59 Minutes | 34 (2.9%) | 60 (6.6%) |
| 60 to 89 Minutes | 84 (7.1%) | 32 (3.5%) |
| 90 or more Minutes | 20 (1.7%) | 0 (0.0%) |
Time of Departure to Work by Sex in Clarkson
The most frequent times of departure to work in Clarkson are 7:00 AM to 7:29 AM (223, 18.9%) for males and 6:30 AM to 6:59 AM (140, 15.3%) for females.
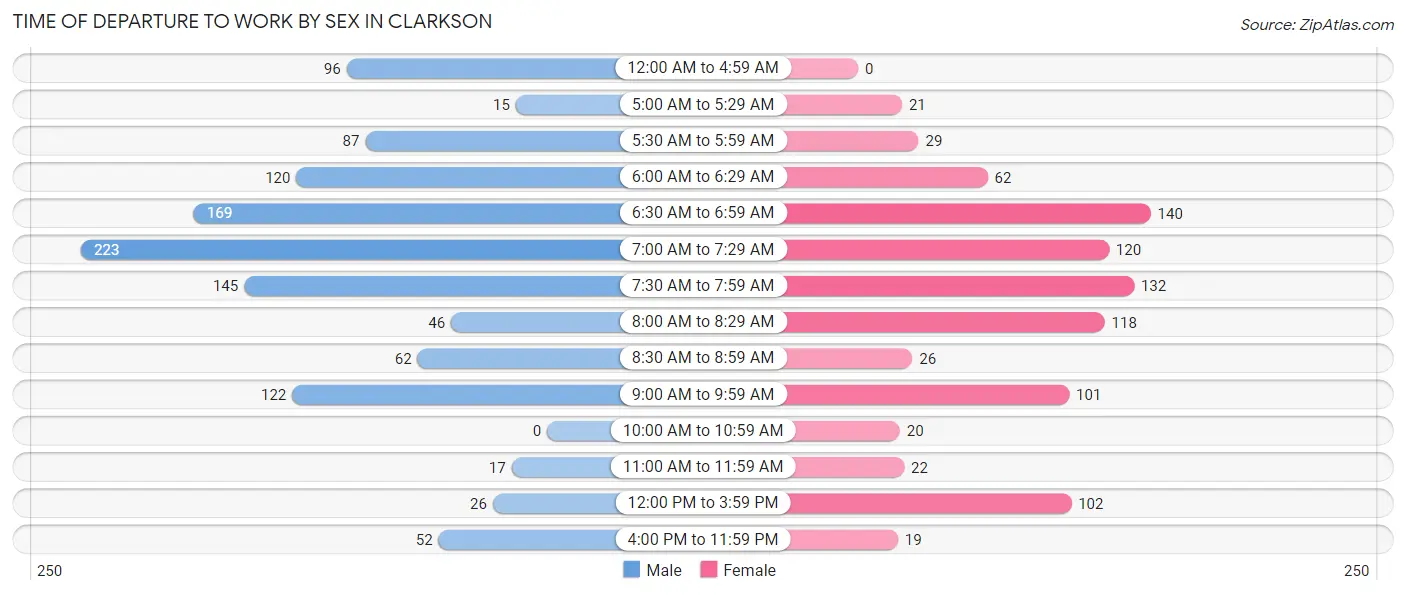
| Time of Departure | Male | Female |
| 12:00 AM to 4:59 AM | 96 (8.1%) | 0 (0.0%) |
| 5:00 AM to 5:29 AM | 15 (1.3%) | 21 (2.3%) |
| 5:30 AM to 5:59 AM | 87 (7.4%) | 29 (3.2%) |
| 6:00 AM to 6:29 AM | 120 (10.2%) | 62 (6.8%) |
| 6:30 AM to 6:59 AM | 169 (14.3%) | 140 (15.3%) |
| 7:00 AM to 7:29 AM | 223 (18.9%) | 120 (13.2%) |
| 7:30 AM to 7:59 AM | 145 (12.3%) | 132 (14.5%) |
| 8:00 AM to 8:29 AM | 46 (3.9%) | 118 (12.9%) |
| 8:30 AM to 8:59 AM | 62 (5.2%) | 26 (2.9%) |
| 9:00 AM to 9:59 AM | 122 (10.3%) | 101 (11.1%) |
| 10:00 AM to 10:59 AM | 0 (0.0%) | 20 (2.2%) |
| 11:00 AM to 11:59 AM | 17 (1.4%) | 22 (2.4%) |
| 12:00 PM to 3:59 PM | 26 (2.2%) | 102 (11.2%) |
| 4:00 PM to 11:59 PM | 52 (4.4%) | 19 (2.1%) |
| Total | 1,180 (100.0%) | 912 (100.0%) |
Housing Occupancy in Clarkson
Occupancy by Ownership in Clarkson
Of the total 2,004 dwellings in Clarkson, owner-occupied units account for 1,297 (64.7%), while renter-occupied units make up 707 (35.3%).
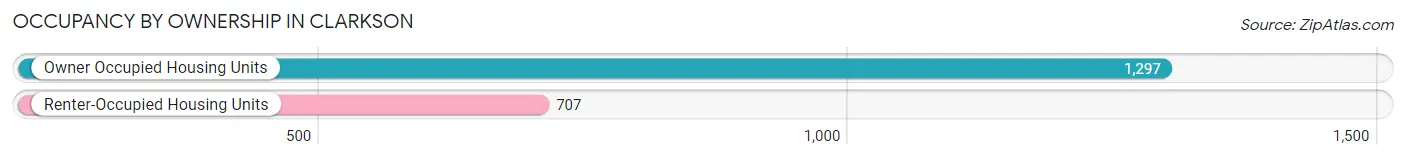
| Occupancy | # Housing Units | % Housing Units |
| Owner Occupied Housing Units | 1,297 | 64.7% |
| Renter-Occupied Housing Units | 707 | 35.3% |
| Total Occupied Housing Units | 2,004 | 100.0% |
Occupancy by Household Size in Clarkson
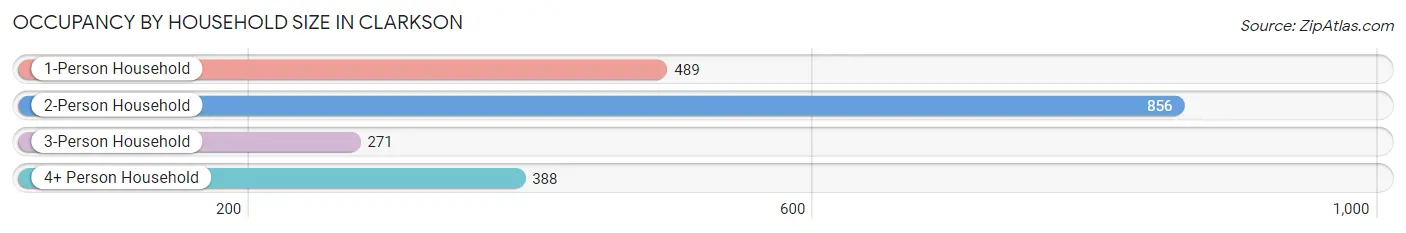
| Household Size | # Housing Units | % Housing Units |
| 1-Person Household | 489 | 24.4% |
| 2-Person Household | 856 | 42.7% |
| 3-Person Household | 271 | 13.5% |
| 4+ Person Household | 388 | 19.4% |
| Total Housing Units | 2,004 | 100.0% |
Occupancy by Ownership by Household Size in Clarkson
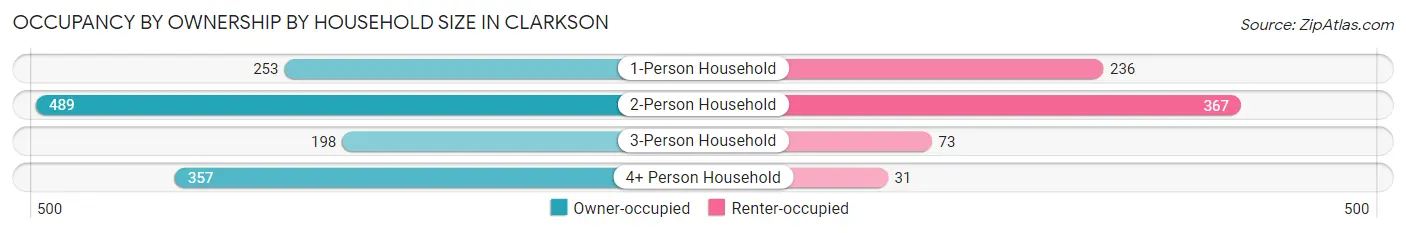
| Household Size | Owner-occupied | Renter-occupied |
| 1-Person Household | 253 (51.7%) | 236 (48.3%) |
| 2-Person Household | 489 (57.1%) | 367 (42.9%) |
| 3-Person Household | 198 (73.1%) | 73 (26.9%) |
| 4+ Person Household | 357 (92.0%) | 31 (8.0%) |
| Total Housing Units | 1,297 (64.7%) | 707 (35.3%) |
Occupancy by Educational Attainment in Clarkson
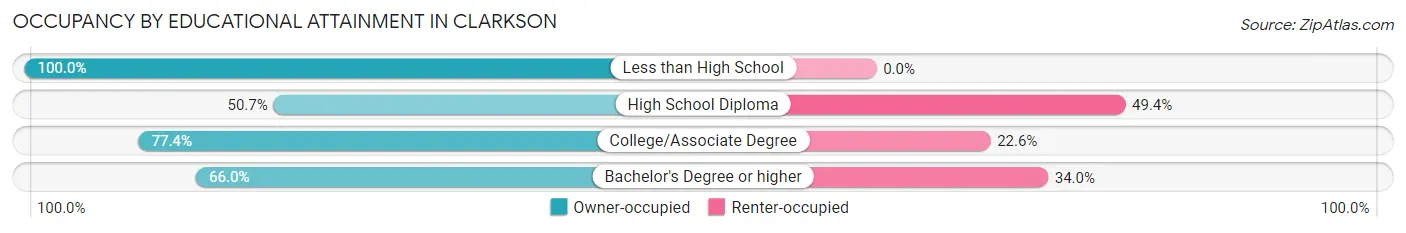
| Household Size | Owner-occupied | Renter-occupied |
| Less than High School | 22 (100.0%) | 0 (0.0%) |
| High School Diploma | 313 (50.6%) | 305 (49.3%) |
| College/Associate Degree | 421 (77.4%) | 123 (22.6%) |
| Bachelor's Degree or higher | 541 (66.0%) | 279 (34.0%) |
Occupancy by Age of Householder in Clarkson
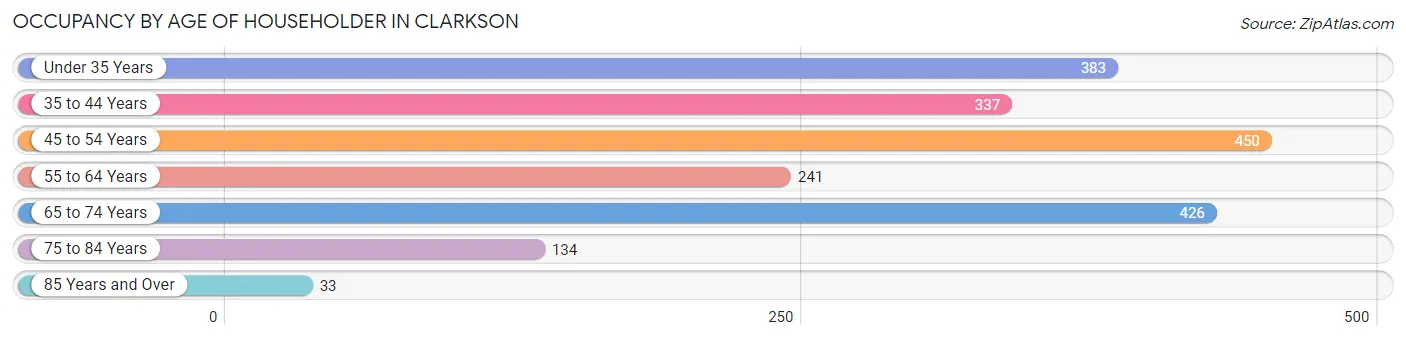
| Age Bracket | # Households | % Households |
| Under 35 Years | 383 | 19.1% |
| 35 to 44 Years | 337 | 16.8% |
| 45 to 54 Years | 450 | 22.5% |
| 55 to 64 Years | 241 | 12.0% |
| 65 to 74 Years | 426 | 21.3% |
| 75 to 84 Years | 134 | 6.7% |
| 85 Years and Over | 33 | 1.7% |
| Total | 2,004 | 100.0% |
Housing Finances in Clarkson
Median Income by Occupancy in Clarkson
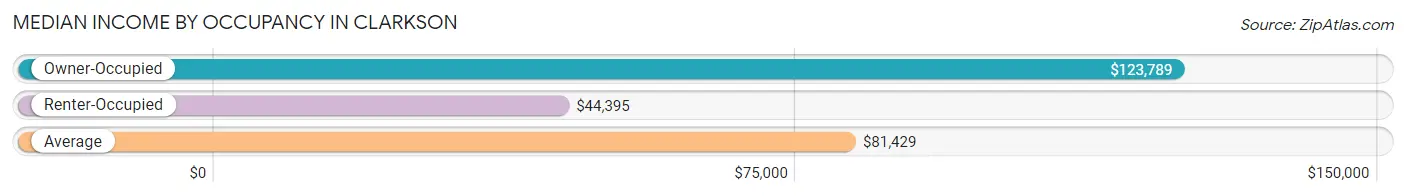
| Occupancy Type | # Households | Median Income |
| Owner-Occupied | 1,297 (64.7%) | $123,789 |
| Renter-Occupied | 707 (35.3%) | $44,395 |
| Average | 2,004 (100.0%) | $81,429 |
Occupancy by Householder Income Bracket in Clarkson
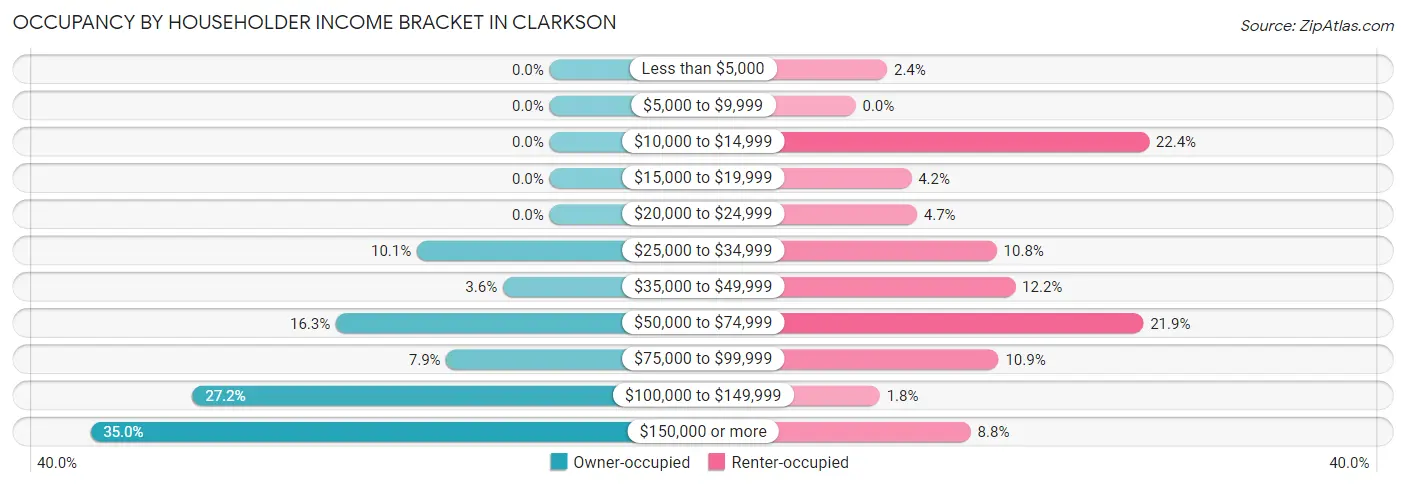
| Income Bracket | Owner-occupied | Renter-occupied |
| Less than $5,000 | 0 (0.0%) | 17 (2.4%) |
| $5,000 to $9,999 | 0 (0.0%) | 0 (0.0%) |
| $10,000 to $14,999 | 0 (0.0%) | 158 (22.4%) |
| $15,000 to $19,999 | 0 (0.0%) | 30 (4.2%) |
| $20,000 to $24,999 | 0 (0.0%) | 33 (4.7%) |
| $25,000 to $34,999 | 131 (10.1%) | 76 (10.7%) |
| $35,000 to $49,999 | 46 (3.5%) | 86 (12.2%) |
| $50,000 to $74,999 | 211 (16.3%) | 155 (21.9%) |
| $75,000 to $99,999 | 102 (7.9%) | 77 (10.9%) |
| $100,000 to $149,999 | 353 (27.2%) | 13 (1.8%) |
| $150,000 or more | 454 (35.0%) | 62 (8.8%) |
| Total | 1,297 (100.0%) | 707 (100.0%) |
Monthly Housing Cost Tiers in Clarkson
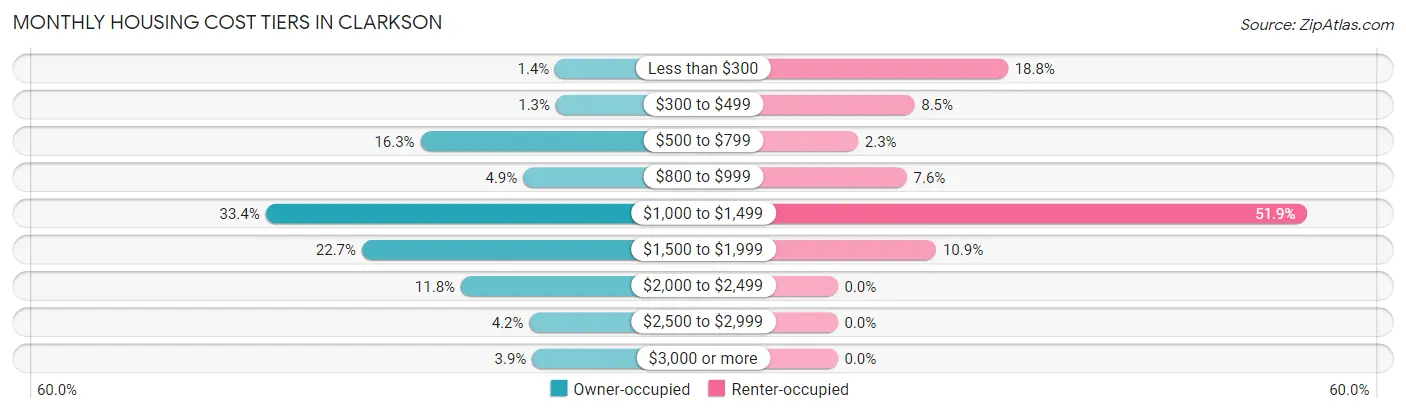
| Monthly Cost | Owner-occupied | Renter-occupied |
| Less than $300 | 18 (1.4%) | 133 (18.8%) |
| $300 to $499 | 17 (1.3%) | 60 (8.5%) |
| $500 to $799 | 211 (16.3%) | 16 (2.3%) |
| $800 to $999 | 64 (4.9%) | 54 (7.6%) |
| $1,000 to $1,499 | 433 (33.4%) | 367 (51.9%) |
| $1,500 to $1,999 | 295 (22.7%) | 77 (10.9%) |
| $2,000 to $2,499 | 153 (11.8%) | 0 (0.0%) |
| $2,500 to $2,999 | 55 (4.2%) | 0 (0.0%) |
| $3,000 or more | 51 (3.9%) | 0 (0.0%) |
| Total | 1,297 (100.0%) | 707 (100.0%) |
Physical Housing Characteristics in Clarkson
Housing Structures in Clarkson
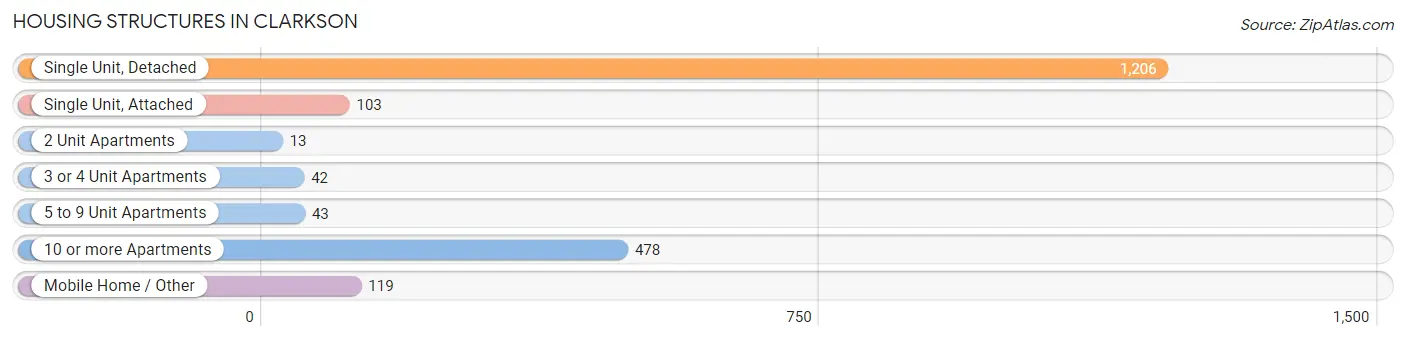
| Structure Type | # Housing Units | % Housing Units |
| Single Unit, Detached | 1,206 | 60.2% |
| Single Unit, Attached | 103 | 5.1% |
| 2 Unit Apartments | 13 | 0.6% |
| 3 or 4 Unit Apartments | 42 | 2.1% |
| 5 to 9 Unit Apartments | 43 | 2.1% |
| 10 or more Apartments | 478 | 23.8% |
| Mobile Home / Other | 119 | 5.9% |
| Total | 2,004 | 100.0% |
Housing Structures by Occupancy in Clarkson
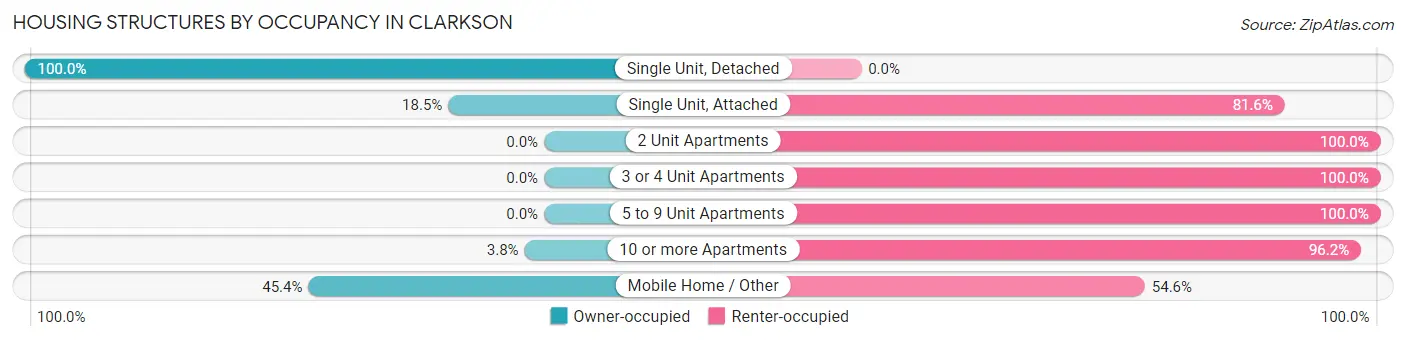
| Structure Type | Owner-occupied | Renter-occupied |
| Single Unit, Detached | 1,206 (100.0%) | 0 (0.0%) |
| Single Unit, Attached | 19 (18.4%) | 84 (81.6%) |
| 2 Unit Apartments | 0 (0.0%) | 13 (100.0%) |
| 3 or 4 Unit Apartments | 0 (0.0%) | 42 (100.0%) |
| 5 to 9 Unit Apartments | 0 (0.0%) | 43 (100.0%) |
| 10 or more Apartments | 18 (3.8%) | 460 (96.2%) |
| Mobile Home / Other | 54 (45.4%) | 65 (54.6%) |
| Total | 1,297 (64.7%) | 707 (35.3%) |
Housing Structures by Number of Rooms in Clarkson
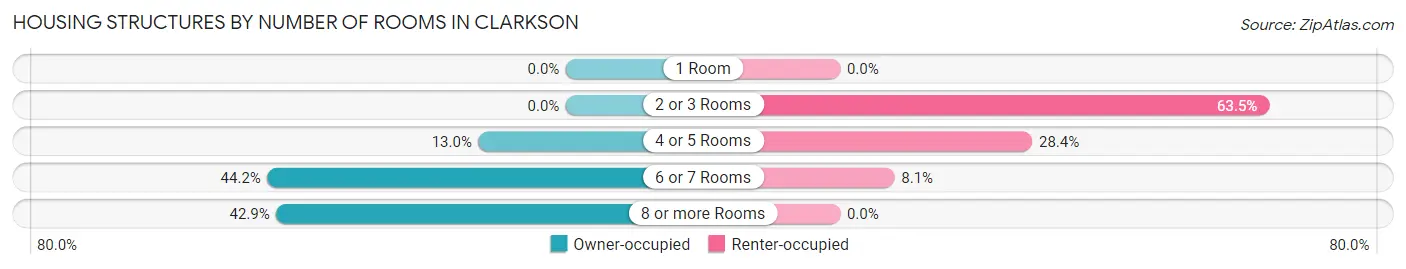
| Number of Rooms | Owner-occupied | Renter-occupied |
| 1 Room | 0 (0.0%) | 0 (0.0%) |
| 2 or 3 Rooms | 0 (0.0%) | 449 (63.5%) |
| 4 or 5 Rooms | 168 (13.0%) | 201 (28.4%) |
| 6 or 7 Rooms | 573 (44.2%) | 57 (8.1%) |
| 8 or more Rooms | 556 (42.9%) | 0 (0.0%) |
| Total | 1,297 (100.0%) | 707 (100.0%) |
Housing Structure by Heating Type in Clarkson
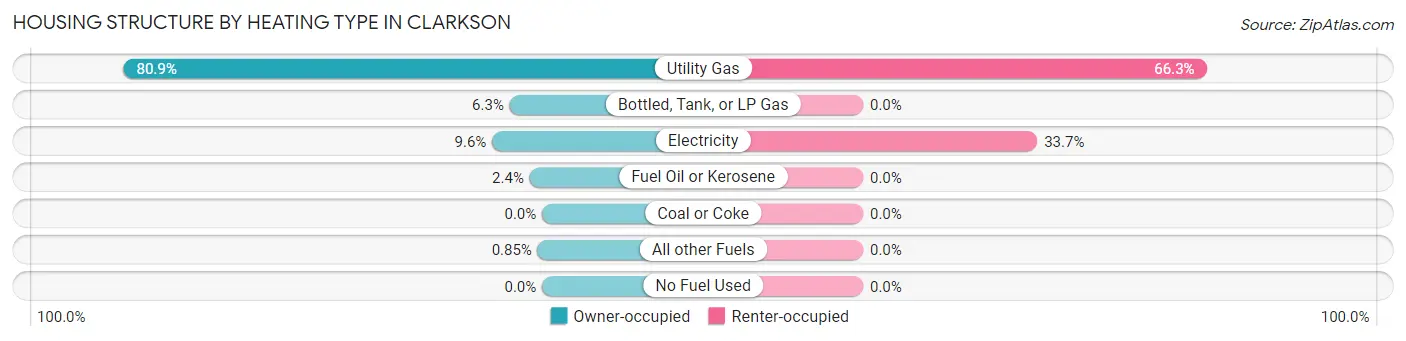
| Heating Type | Owner-occupied | Renter-occupied |
| Utility Gas | 1,049 (80.9%) | 469 (66.3%) |
| Bottled, Tank, or LP Gas | 81 (6.2%) | 0 (0.0%) |
| Electricity | 125 (9.6%) | 238 (33.7%) |
| Fuel Oil or Kerosene | 31 (2.4%) | 0 (0.0%) |
| Coal or Coke | 0 (0.0%) | 0 (0.0%) |
| All other Fuels | 11 (0.9%) | 0 (0.0%) |
| No Fuel Used | 0 (0.0%) | 0 (0.0%) |
| Total | 1,297 (100.0%) | 707 (100.0%) |
Household Vehicle Usage in Clarkson
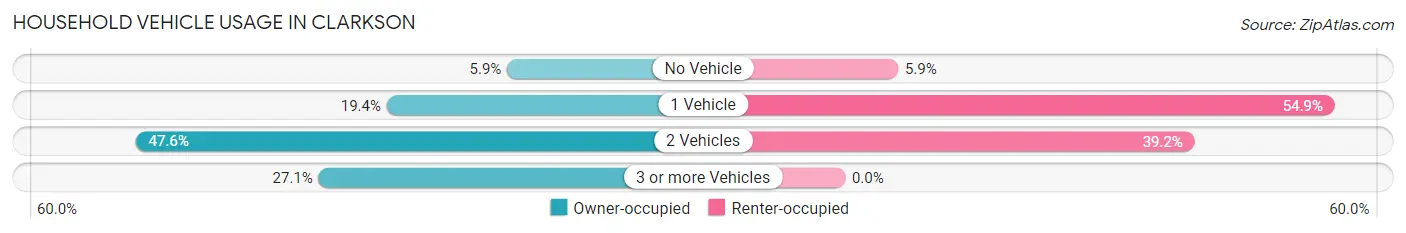
| Vehicles per Household | Owner-occupied | Renter-occupied |
| No Vehicle | 77 (5.9%) | 42 (5.9%) |
| 1 Vehicle | 252 (19.4%) | 388 (54.9%) |
| 2 Vehicles | 617 (47.6%) | 277 (39.2%) |
| 3 or more Vehicles | 351 (27.1%) | 0 (0.0%) |
| Total | 1,297 (100.0%) | 707 (100.0%) |
Real Estate & Mortgages in Clarkson
Real Estate and Mortgage Overview in Clarkson
| Characteristic | Without Mortgage | With Mortgage |
| Housing Units | 327 | 970 |
| Median Property Value | $164,400 | $191,600 |
| Median Household Income | $86,198 | $339 |
| Monthly Housing Costs | $660 | $51 |
| Real Estate Taxes | $4,912 | $0 |
Property Value by Mortgage Status in Clarkson
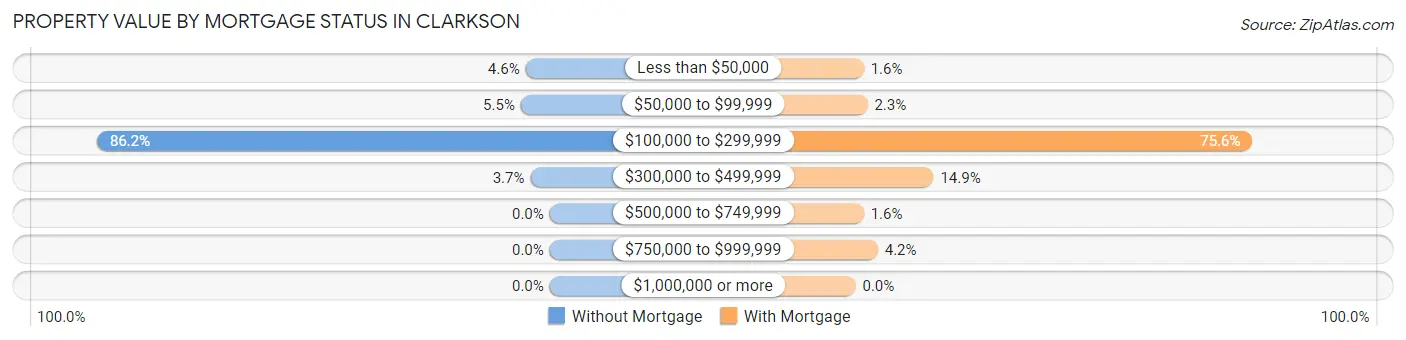
| Property Value | Without Mortgage | With Mortgage |
| Less than $50,000 | 15 (4.6%) | 15 (1.5%) |
| $50,000 to $99,999 | 18 (5.5%) | 22 (2.3%) |
| $100,000 to $299,999 | 282 (86.2%) | 733 (75.6%) |
| $300,000 to $499,999 | 12 (3.7%) | 144 (14.8%) |
| $500,000 to $749,999 | 0 (0.0%) | 15 (1.5%) |
| $750,000 to $999,999 | 0 (0.0%) | 41 (4.2%) |
| $1,000,000 or more | 0 (0.0%) | 0 (0.0%) |
| Total | 327 (100.0%) | 970 (100.0%) |
Household Income by Mortgage Status in Clarkson
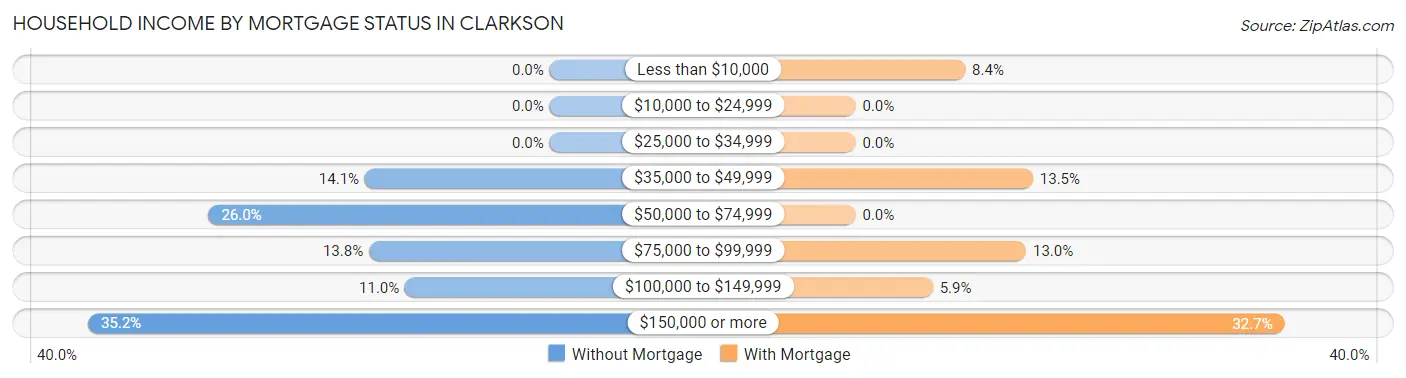
| Household Income | Without Mortgage | With Mortgage |
| Less than $10,000 | 0 (0.0%) | 81 (8.4%) |
| $10,000 to $24,999 | 0 (0.0%) | 0 (0.0%) |
| $25,000 to $34,999 | 0 (0.0%) | 0 (0.0%) |
| $35,000 to $49,999 | 46 (14.1%) | 131 (13.5%) |
| $50,000 to $74,999 | 85 (26.0%) | 0 (0.0%) |
| $75,000 to $99,999 | 45 (13.8%) | 126 (13.0%) |
| $100,000 to $149,999 | 36 (11.0%) | 57 (5.9%) |
| $150,000 or more | 115 (35.2%) | 317 (32.7%) |
| Total | 327 (100.0%) | 970 (100.0%) |
Property Value to Household Income Ratio in Clarkson
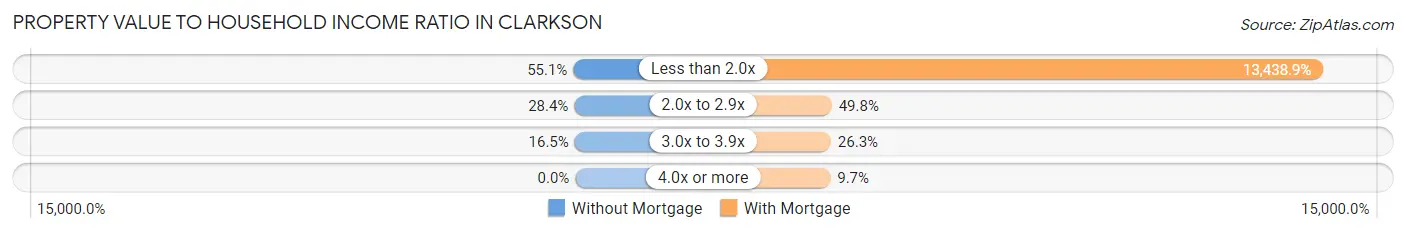
| Value-to-Income Ratio | Without Mortgage | With Mortgage |
| Less than 2.0x | 180 (55.0%) | 130,357 (13,438.9%) |
| 2.0x to 2.9x | 93 (28.4%) | 483 (49.8%) |
| 3.0x to 3.9x | 54 (16.5%) | 255 (26.3%) |
| 4.0x or more | 0 (0.0%) | 94 (9.7%) |
| Total | 327 (100.0%) | 970 (100.0%) |
Real Estate Taxes by Mortgage Status in Clarkson
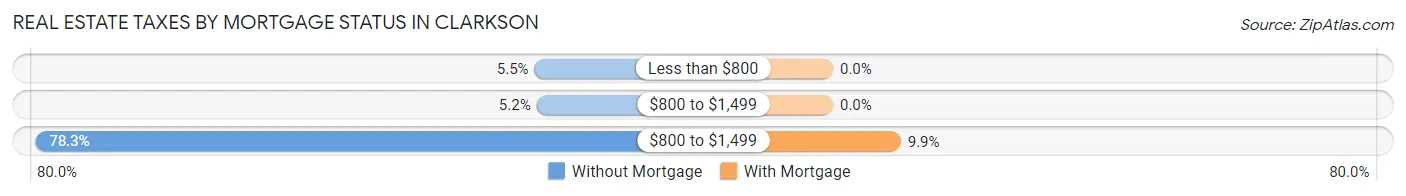
| Property Taxes | Without Mortgage | With Mortgage |
| Less than $800 | 18 (5.5%) | 0 (0.0%) |
| $800 to $1,499 | 17 (5.2%) | 0 (0.0%) |
| $800 to $1,499 | 256 (78.3%) | 96 (9.9%) |
| Total | 327 (100.0%) | 970 (100.0%) |
Health & Disability in Clarkson
Health Insurance Coverage by Age in Clarkson
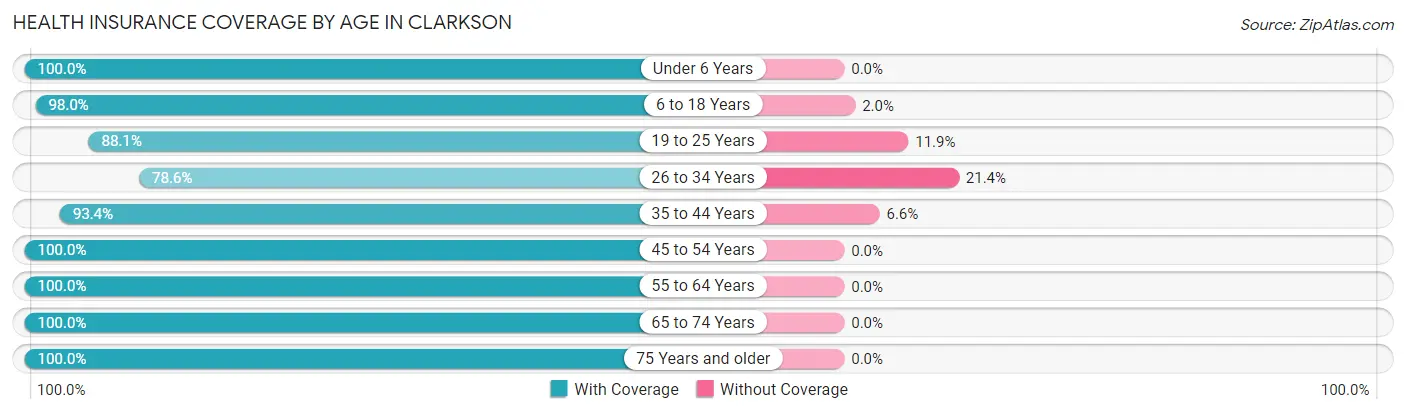
| Age Bracket | With Coverage | Without Coverage |
| Under 6 Years | 123 (100.0%) | 0 (0.0%) |
| 6 to 18 Years | 964 (98.0%) | 20 (2.0%) |
| 19 to 25 Years | 310 (88.1%) | 42 (11.9%) |
| 26 to 34 Years | 567 (78.6%) | 154 (21.4%) |
| 35 to 44 Years | 611 (93.4%) | 43 (6.6%) |
| 45 to 54 Years | 697 (100.0%) | 0 (0.0%) |
| 55 to 64 Years | 509 (100.0%) | 0 (0.0%) |
| 65 to 74 Years | 634 (100.0%) | 0 (0.0%) |
| 75 Years and older | 287 (100.0%) | 0 (0.0%) |
| Total | 4,702 (94.8%) | 259 (5.2%) |
Health Insurance Coverage by Citizenship Status in Clarkson
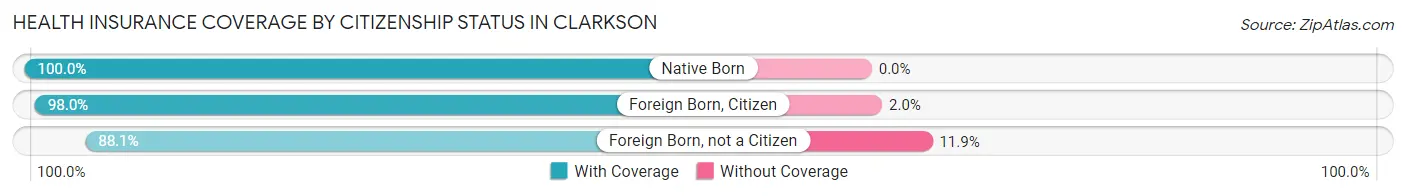
| Citizenship Status | With Coverage | Without Coverage |
| Native Born | 123 (100.0%) | 0 (0.0%) |
| Foreign Born, Citizen | 964 (98.0%) | 20 (2.0%) |
| Foreign Born, not a Citizen | 310 (88.1%) | 42 (11.9%) |
Health Insurance Coverage by Household Income in Clarkson
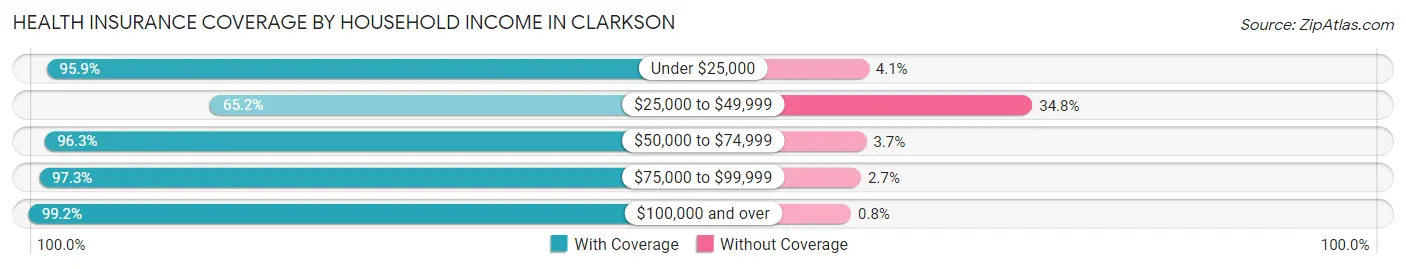
| Household Income | With Coverage | Without Coverage |
| Under $25,000 | 371 (95.9%) | 16 (4.1%) |
| $25,000 to $49,999 | 336 (65.2%) | 179 (34.8%) |
| $50,000 to $74,999 | 759 (96.3%) | 29 (3.7%) |
| $75,000 to $99,999 | 470 (97.3%) | 13 (2.7%) |
| $100,000 and over | 2,743 (99.2%) | 22 (0.8%) |
Public vs Private Health Insurance Coverage by Age in Clarkson
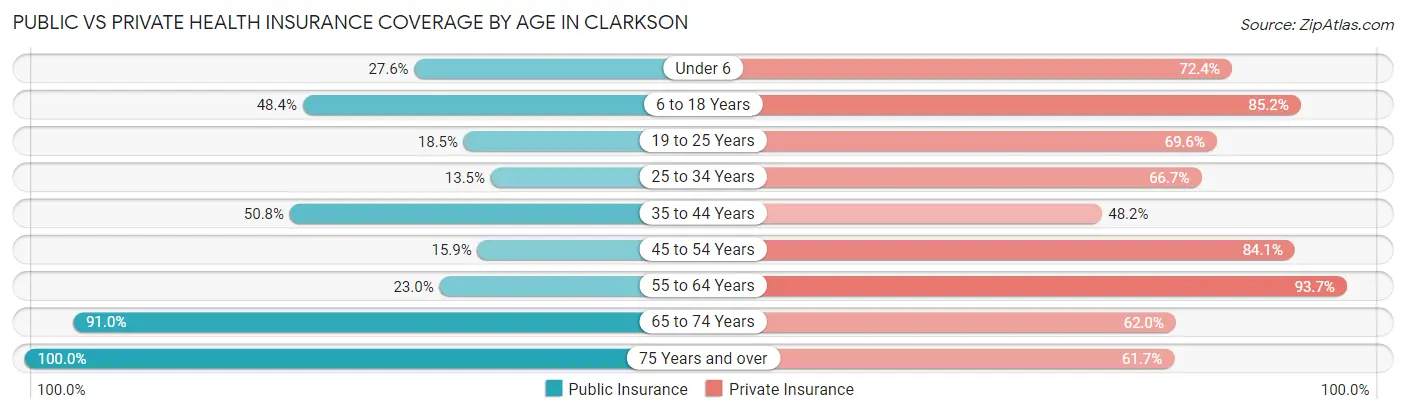
| Age Bracket | Public Insurance | Private Insurance |
| Under 6 | 34 (27.6%) | 89 (72.4%) |
| 6 to 18 Years | 476 (48.4%) | 838 (85.2%) |
| 19 to 25 Years | 65 (18.5%) | 245 (69.6%) |
| 25 to 34 Years | 97 (13.5%) | 481 (66.7%) |
| 35 to 44 Years | 332 (50.8%) | 315 (48.2%) |
| 45 to 54 Years | 111 (15.9%) | 586 (84.1%) |
| 55 to 64 Years | 117 (23.0%) | 477 (93.7%) |
| 65 to 74 Years | 577 (91.0%) | 393 (62.0%) |
| 75 Years and over | 287 (100.0%) | 177 (61.7%) |
| Total | 2,096 (42.2%) | 3,601 (72.6%) |
Disability Status by Sex by Age in Clarkson
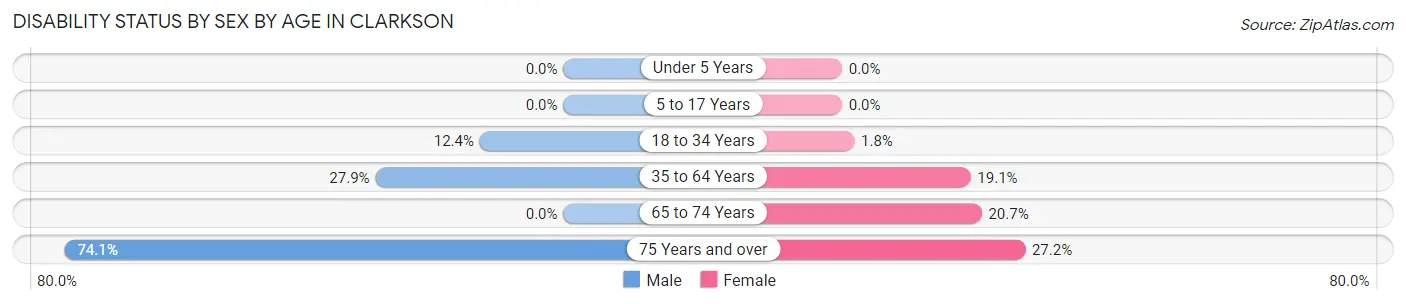
| Age Bracket | Male | Female |
| Under 5 Years | 0 (0.0%) | 0 (0.0%) |
| 5 to 17 Years | 0 (0.0%) | 0 (0.0%) |
| 18 to 34 Years | 67 (12.4%) | 13 (1.8%) |
| 35 to 64 Years | 259 (27.9%) | 178 (19.1%) |
| 65 to 74 Years | 0 (0.0%) | 90 (20.7%) |
| 75 Years and over | 120 (74.1%) | 34 (27.2%) |
Disability Class by Sex by Age in Clarkson
Disability Class: Hearing Difficulty
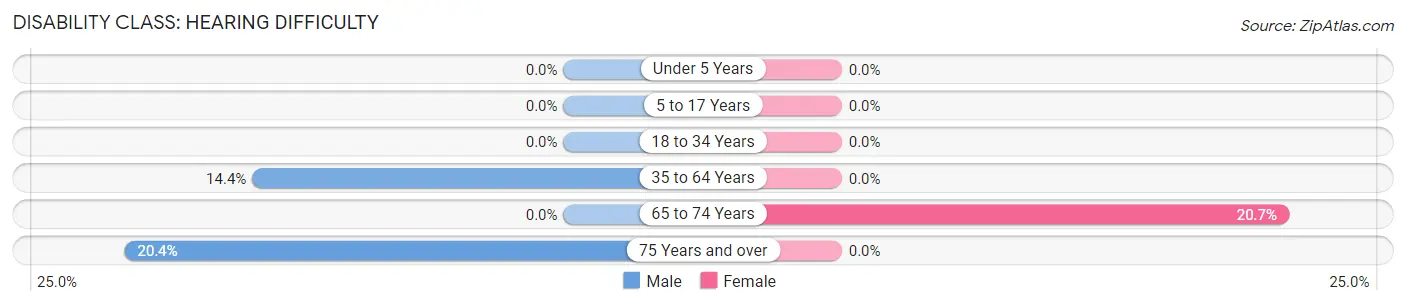
| Age Bracket | Male | Female |
| Under 5 Years | 0 (0.0%) | 0 (0.0%) |
| 5 to 17 Years | 0 (0.0%) | 0 (0.0%) |
| 18 to 34 Years | 0 (0.0%) | 0 (0.0%) |
| 35 to 64 Years | 134 (14.4%) | 0 (0.0%) |
| 65 to 74 Years | 0 (0.0%) | 90 (20.7%) |
| 75 Years and over | 33 (20.4%) | 0 (0.0%) |
Disability Class: Vision Difficulty
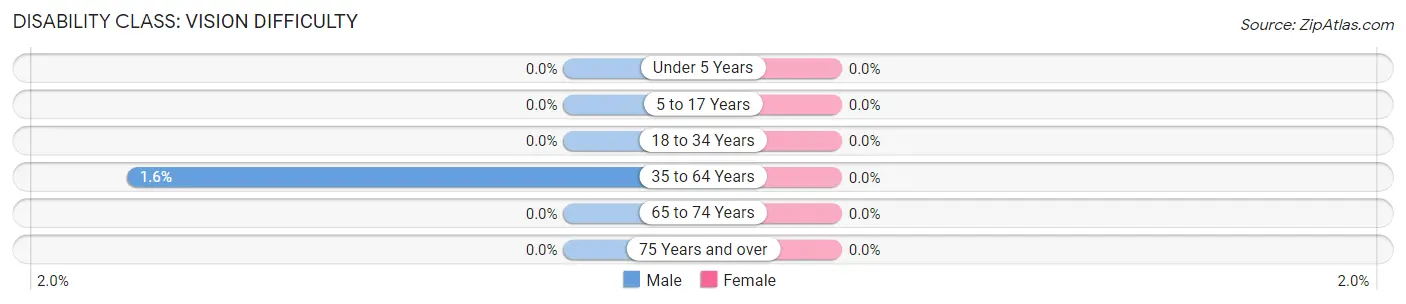
| Age Bracket | Male | Female |
| Under 5 Years | 0 (0.0%) | 0 (0.0%) |
| 5 to 17 Years | 0 (0.0%) | 0 (0.0%) |
| 18 to 34 Years | 0 (0.0%) | 0 (0.0%) |
| 35 to 64 Years | 15 (1.6%) | 0 (0.0%) |
| 65 to 74 Years | 0 (0.0%) | 0 (0.0%) |
| 75 Years and over | 0 (0.0%) | 0 (0.0%) |
Disability Class: Cognitive Difficulty
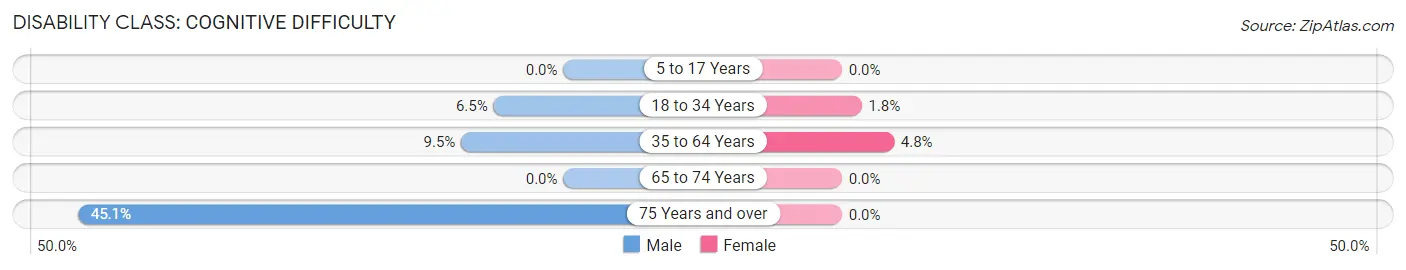
| Age Bracket | Male | Female |
| 5 to 17 Years | 0 (0.0%) | 0 (0.0%) |
| 18 to 34 Years | 35 (6.5%) | 13 (1.8%) |
| 35 to 64 Years | 88 (9.5%) | 45 (4.8%) |
| 65 to 74 Years | 0 (0.0%) | 0 (0.0%) |
| 75 Years and over | 73 (45.1%) | 0 (0.0%) |
Disability Class: Ambulatory Difficulty
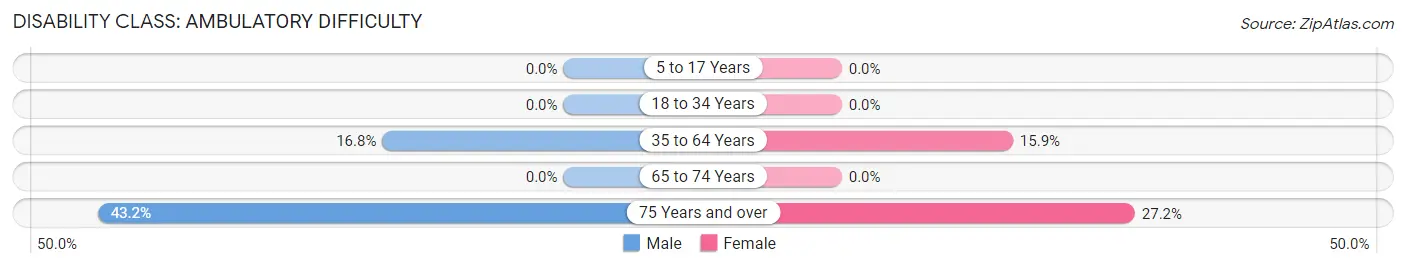
| Age Bracket | Male | Female |
| 5 to 17 Years | 0 (0.0%) | 0 (0.0%) |
| 18 to 34 Years | 0 (0.0%) | 0 (0.0%) |
| 35 to 64 Years | 156 (16.8%) | 148 (15.9%) |
| 65 to 74 Years | 0 (0.0%) | 0 (0.0%) |
| 75 Years and over | 70 (43.2%) | 34 (27.2%) |
Disability Class: Self-Care Difficulty
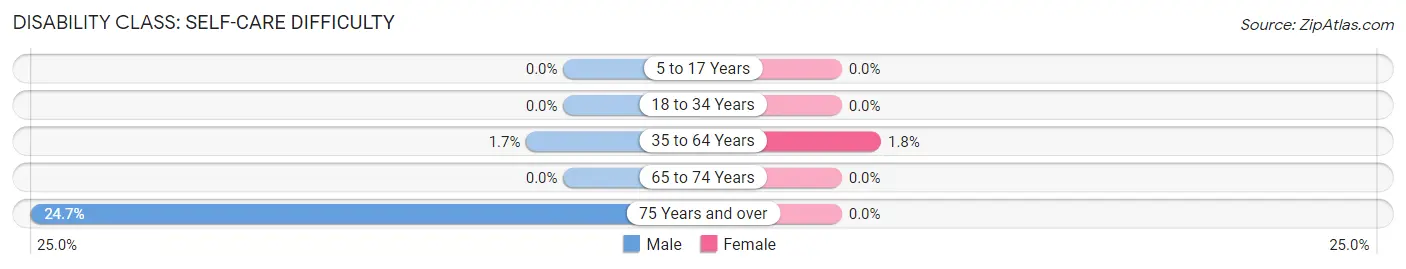
| Age Bracket | Male | Female |
| 5 to 17 Years | 0 (0.0%) | 0 (0.0%) |
| 18 to 34 Years | 0 (0.0%) | 0 (0.0%) |
| 35 to 64 Years | 16 (1.7%) | 17 (1.8%) |
| 65 to 74 Years | 0 (0.0%) | 0 (0.0%) |
| 75 Years and over | 40 (24.7%) | 0 (0.0%) |
Technology Access in Clarkson
Computing Device Access in Clarkson
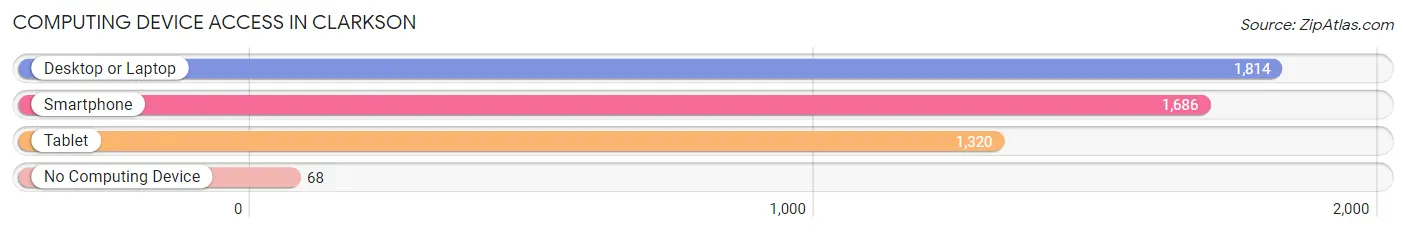
| Device Type | # Households | % Households |
| Desktop or Laptop | 1,814 | 90.5% |
| Smartphone | 1,686 | 84.1% |
| Tablet | 1,320 | 65.9% |
| No Computing Device | 68 | 3.4% |
| Total | 2,004 | 100.0% |
Internet Access in Clarkson
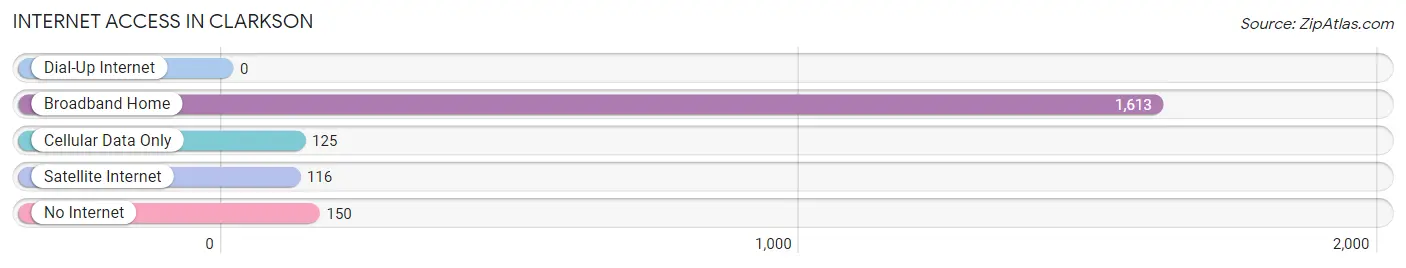
| Internet Type | # Households | % Households |
| Dial-Up Internet | 0 | 0.0% |
| Broadband Home | 1,613 | 80.5% |
| Cellular Data Only | 125 | 6.2% |
| Satellite Internet | 116 | 5.8% |
| No Internet | 150 | 7.5% |
| Total | 2,004 | 100.0% |
Clarkson Summary
Clarkson is a town located in Monroe County, New York, United States. The population was 8,741 at the 2010 census. The town is named after early settler, Jonas Clarkson.
History
The area that is now Clarkson was first settled in 1789 by Jonas Clarkson, a Revolutionary War veteran. The town was formed in 1819 from the Town of Murray. The first town meeting was held in 1820.
Geography
Clarkson is located in the northwest corner of Monroe County, bordered by the towns of Sweden to the north, Hamlin to the east, and Parma to the south. To the west, Clarkson is bordered by the Genesee River, which forms the border between Monroe and Orleans counties.
According to the United States Census Bureau, the town has a total area of 33.2 square miles, of which 32.9 square miles is land and 0.3 square miles, or 0.86%, is water.
Economy
Clarkson is home to several businesses, including a number of small manufacturing companies. The town is also home to a number of farms, including a large dairy farm.
Demographics
As of the census of 2000, there were 8,741 people, 3,093 households, and 2,346 families residing in the town. The population density was 265.3 people per square mile (102.5/km2). There were 3,213 housing units at an average density of 97.3 per square mile (37.5/km2). The racial makeup of the town was 97.45% White, 0.50% African American, 0.20% Native American, 0.50% Asian, 0.02% Pacific Islander, 0.37% from other races, and 1.45% from two or more races. Hispanic or Latino of any race were 1.17% of the population.
There were 3,093 households, out of which 37.2% had children under the age of 18 living with them, 62.2% were married couples living together, 8.2% had a female householder with no husband present, and 25.2% were non-families. 20.2% of all households were made up of individuals, and 7.2% had someone living alone who was 65 years of age or older. The average household size was 2.81 and the average family size was 3.27.
In the town, the population was spread out, with 28.2% under the age of 18, 6.3% from 18 to 24, 31.2% from 25 to 44, 24.2% from 45 to 64, and 10.1% who were 65 years of age or older. The median age was 37 years. For every 100 females, there were 98.2 males. For every 100 females age 18 and over, there were 95.2 males.
The median income for a household in the town was $50,945, and the median income for a family was $58,917. Males had a median income of $41,945 versus $27,917 for females. The per capita income for the town was $21,945. About 3.2% of families and 4.7% of the population were below the poverty line, including 5.2% of those under age 18 and 4.2% of those age 65 or over.
Common Questions
What is Per Capita Income in Clarkson?
Per Capita income in Clarkson is $41,623.
What is the Median Family Income in Clarkson?
Median Family Income in Clarkson is $117,679.
What is the Median Household income in Clarkson?
Median Household Income in Clarkson is $81,429.
What is Income or Wage Gap in Clarkson?
Income or Wage Gap in Clarkson is 3.6%.
Women in Clarkson earn 96.4 cents for every dollar earned by a man.
What is Inequality or Gini Index in Clarkson?
Inequality or Gini Index in Clarkson is 0.40.
What is the Total Population of Clarkson?
Total Population of Clarkson is 5,022.
What is the Total Male Population of Clarkson?
Total Male Population of Clarkson is 2,426.
What is the Total Female Population of Clarkson?
Total Female Population of Clarkson is 2,596.
What is the Ratio of Males per 100 Females in Clarkson?
There are 93.45 Males per 100 Females in Clarkson.
What is the Ratio of Females per 100 Males in Clarkson?
There are 107.01 Females per 100 Males in Clarkson.
What is the Median Population Age in Clarkson?
Median Population Age in Clarkson is 40.6 Years.
What is the Average Family Size in Clarkson
Average Family Size in Clarkson is 2.9 People.
What is the Average Household Size in Clarkson
Average Household Size in Clarkson is 2.5 People.
How Large is the Labor Force in Clarkson?
There are 2,533 People in the Labor Forcein in Clarkson.
What is the Percentage of People in the Labor Force in Clarkson?
60.2% of People are in the Labor Force in Clarkson.
What is the Unemployment Rate in Clarkson?
Unemployment Rate in Clarkson is 1.6%.