Zip Codes with the Highest Percentage of Population Employed in Cleaning & Maintenance in New York
RELATED REPORTS & OPTIONS
Cleaning & Maintenance
New York
Compare Zip Codes
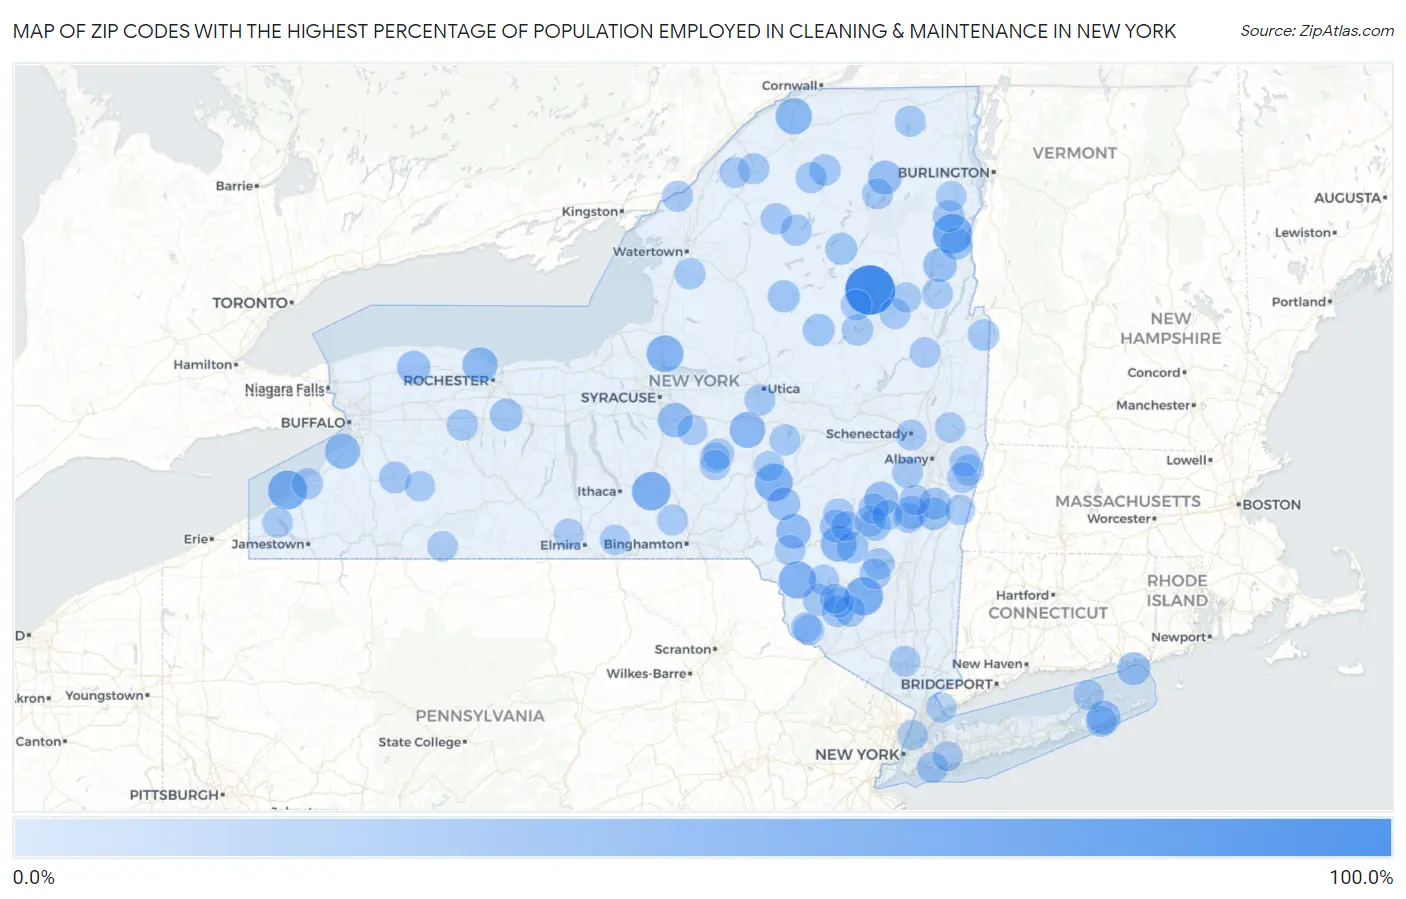
Map of Zip Codes with the Highest Percentage of Population Employed in Cleaning & Maintenance in New York
0.0%
100.0%
Zip Codes with the Highest Percentage of Population Employed in Cleaning & Maintenance in New York
| Zip Code | % Employed | vs State | vs National | |
| 1. | 12864 | 100.0% | 3.6%(+96.4)#1 | 3.5%(+96.5)#11 |
| 2. | 12998 | 51.9% | 3.6%(+48.3)#2 | 3.5%(+48.4)#42 |
| 3. | 14166 | 50.0% | 3.6%(+46.4)#3 | 3.5%(+46.5)#45 |
| 4. | 13784 | 47.9% | 3.6%(+44.3)#4 | 3.5%(+44.4)#57 |
| 5. | 12489 | 47.6% | 3.6%(+44.0)#5 | 3.5%(+44.1)#59 |
| 6. | 13861 | 44.6% | 3.6%(+41.0)#6 | 3.5%(+41.1)#67 |
| 7. | 12724 | 41.9% | 3.6%(+38.2)#7 | 3.5%(+38.4)#78 |
| 8. | 13103 | 39.8% | 3.6%(+36.2)#8 | 3.5%(+36.3)#92 |
| 9. | 13678 | 37.3% | 3.6%(+33.7)#9 | 3.5%(+33.9)#109 |
| 10. | 12406 | 35.9% | 3.6%(+32.3)#10 | 3.5%(+32.4)#120 |
| 11. | 13418 | 34.9% | 3.6%(+31.3)#11 | 3.5%(+31.5)#126 |
| 12. | 14515 | 32.1% | 3.6%(+28.5)#12 | 3.5%(+28.6)#151 |
| 13. | 14112 | 31.7% | 3.6%(+28.1)#13 | 3.5%(+28.2)#155 |
| 14. | 13782 | 29.5% | 3.6%(+25.9)#14 | 3.5%(+26.0)#177 |
| 15. | 13138 | 29.2% | 3.6%(+25.5)#15 | 3.5%(+25.7)#184 |
| 16. | 12422 | 27.5% | 3.6%(+23.9)#16 | 3.5%(+24.0)#202 |
| 17. | 12939 | 25.5% | 3.6%(+21.9)#17 | 3.5%(+22.0)#244 |
| 18. | 11975 | 25.4% | 3.6%(+21.8)#18 | 3.5%(+21.9)#246 |
| 19. | 12858 | 25.0% | 3.6%(+21.4)#19 | 3.5%(+21.5)#253 |
| 20. | 14479 | 23.9% | 3.6%(+20.3)#20 | 3.5%(+20.4)#274 |
| 21. | 06390 | 23.1% | 3.6%(+19.5)#21 | 3.5%(+19.6)#291 |
| 22. | 13846 | 22.1% | 3.6%(+18.5)#22 | 3.5%(+18.7)#322 |
| 23. | 12438 | 21.9% | 3.6%(+18.3)#23 | 3.5%(+18.4)#332 |
| 24. | 12451 | 21.1% | 3.6%(+17.5)#24 | 3.5%(+17.6)#363 |
| 25. | 14475 | 21.0% | 3.6%(+17.4)#25 | 3.5%(+17.5)#368 |
| 26. | 12172 | 20.0% | 3.6%(+16.4)#26 | 3.5%(+16.5)#403 |
| 27. | 13472 | 18.4% | 3.6%(+14.7)#27 | 3.5%(+14.9)#478 |
| 28. | 13353 | 18.2% | 3.6%(+14.6)#28 | 3.5%(+14.7)#492 |
| 29. | 12847 | 17.9% | 3.6%(+14.3)#29 | 3.5%(+14.5)#500 |
| 30. | 12960 | 17.9% | 3.6%(+14.3)#30 | 3.5%(+14.5)#502 |
| 31. | 12174 | 17.6% | 3.6%(+14.0)#31 | 3.5%(+14.1)#520 |
| 32. | 14173 | 17.1% | 3.6%(+13.5)#32 | 3.5%(+13.6)#563 |
| 33. | 12932 | 17.0% | 3.6%(+13.4)#33 | 3.5%(+13.5)#576 |
| 34. | 12410 | 16.9% | 3.6%(+13.3)#34 | 3.5%(+13.4)#584 |
| 35. | 12734 | 16.9% | 3.6%(+13.3)#35 | 3.5%(+13.4)#585 |
| 36. | 12738 | 16.6% | 3.6%(+12.9)#36 | 3.5%(+13.1)#615 |
| 37. | 12108 | 15.7% | 3.6%(+12.1)#37 | 3.5%(+12.2)#680 |
| 38. | 12442 | 15.6% | 3.6%(+11.9)#38 | 3.5%(+12.1)#692 |
| 39. | 14592 | 15.3% | 3.6%(+11.6)#39 | 3.5%(+11.8)#723 |
| 40. | 12849 | 15.2% | 3.6%(+11.6)#40 | 3.5%(+11.7)#727 |
| 41. | 11096 | 15.0% | 3.6%(+11.4)#41 | 3.5%(+11.5)#753 |
| 42. | 13670 | 14.9% | 3.6%(+11.3)#42 | 3.5%(+11.4)#761 |
| 43. | 13672 | 14.8% | 3.6%(+11.1)#43 | 3.5%(+11.3)#776 |
| 44. | 13687 | 14.7% | 3.6%(+11.1)#44 | 3.5%(+11.3)#778 |
| 45. | 13695 | 14.5% | 3.6%(+10.9)#45 | 3.5%(+11.0)#808 |
| 46. | 13630 | 14.2% | 3.6%(+10.6)#46 | 3.5%(+10.7)#837 |
| 47. | 11962 | 14.2% | 3.6%(+10.6)#47 | 3.5%(+10.7)#844 |
| 48. | 12041 | 14.0% | 3.6%(+10.4)#48 | 3.5%(+10.5)#867 |
| 49. | 12444 | 13.9% | 3.6%(+10.3)#49 | 3.5%(+10.4)#880 |
| 50. | 12769 | 13.7% | 3.6%(+10.1)#50 | 3.5%(+10.2)#916 |
| 51. | 13682 | 13.5% | 3.6%(+9.93)#51 | 3.5%(+10.1)#934 |
| 52. | 13319 | 13.3% | 3.6%(+9.73)#52 | 3.5%(+9.86)#960 |
| 53. | 12481 | 13.3% | 3.6%(+9.72)#53 | 3.5%(+9.85)#963 |
| 54. | 13457 | 13.3% | 3.6%(+9.72)#54 | 3.5%(+9.85)#967 |
| 55. | 12461 | 13.3% | 3.6%(+9.67)#55 | 3.5%(+9.81)#975 |
| 56. | 12955 | 13.2% | 3.6%(+9.60)#56 | 3.5%(+9.74)#984 |
| 57. | 14135 | 13.2% | 3.6%(+9.54)#57 | 3.5%(+9.68)#987 |
| 58. | 12169 | 13.0% | 3.6%(+9.34)#58 | 3.5%(+9.48)#1,019 |
| 59. | 12945 | 12.8% | 3.6%(+9.23)#59 | 3.5%(+9.36)#1,040 |
| 60. | 13640 | 12.8% | 3.6%(+9.20)#60 | 3.5%(+9.34)#1,047 |
| 61. | 12482 | 12.6% | 3.6%(+9.01)#61 | 3.5%(+9.15)#1,075 |
| 62. | 13802 | 12.4% | 3.6%(+8.76)#62 | 3.5%(+8.90)#1,122 |
| 63. | 12164 | 12.4% | 3.6%(+8.75)#63 | 3.5%(+8.88)#1,126 |
| 64. | 12042 | 12.3% | 3.6%(+8.69)#64 | 3.5%(+8.83)#1,141 |
| 65. | 10922 | 12.3% | 3.6%(+8.68)#65 | 3.5%(+8.81)#1,143 |
| 66. | 13464 | 12.3% | 3.6%(+8.66)#66 | 3.5%(+8.79)#1,145 |
| 67. | 12153 | 12.3% | 3.6%(+8.63)#67 | 3.5%(+8.77)#1,151 |
| 68. | 12307 | 12.2% | 3.6%(+8.57)#68 | 3.5%(+8.70)#1,168 |
| 69. | 12474 | 12.2% | 3.6%(+8.54)#69 | 3.5%(+8.68)#1,171 |
| 70. | 13633 | 12.1% | 3.6%(+8.50)#70 | 3.5%(+8.64)#1,179 |
| 71. | 12062 | 12.0% | 3.6%(+8.39)#71 | 3.5%(+8.52)#1,203 |
| 72. | 12768 | 12.0% | 3.6%(+8.35)#72 | 3.5%(+8.48)#1,214 |
| 73. | 12815 | 11.9% | 3.6%(+8.33)#73 | 3.5%(+8.47)#1,220 |
| 74. | 12496 | 11.6% | 3.6%(+8.01)#74 | 3.5%(+8.15)#1,297 |
| 75. | 12811 | 11.5% | 3.6%(+7.92)#75 | 3.5%(+8.06)#1,322 |
| 76. | 12743 | 11.5% | 3.6%(+7.88)#76 | 3.5%(+8.01)#1,335 |
| 77. | 12454 | 11.4% | 3.6%(+7.75)#77 | 3.5%(+7.88)#1,373 |
| 78. | 14757 | 11.3% | 3.6%(+7.71)#78 | 3.5%(+7.85)#1,388 |
| 79. | 12846 | 11.2% | 3.6%(+7.59)#79 | 3.5%(+7.72)#1,422 |
| 80. | 12789 | 11.2% | 3.6%(+7.58)#80 | 3.5%(+7.71)#1,426 |
| 81. | 12732 | 11.2% | 3.6%(+7.56)#81 | 3.5%(+7.69)#1,428 |
| 82. | 10452 | 11.1% | 3.6%(+7.50)#82 | 3.5%(+7.63)#1,445 |
| 83. | 13415 | 11.1% | 3.6%(+7.49)#83 | 3.5%(+7.63)#1,460 |
| 84. | 12950 | 11.0% | 3.6%(+7.38)#84 | 3.5%(+7.52)#1,487 |
| 85. | 13755 | 10.9% | 3.6%(+7.28)#85 | 3.5%(+7.41)#1,515 |
| 86. | 14707 | 10.7% | 3.6%(+7.10)#86 | 3.5%(+7.23)#1,564 |
| 87. | 13832 | 10.6% | 3.6%(+7.02)#87 | 3.5%(+7.16)#1,583 |
| 88. | 13122 | 10.5% | 3.6%(+6.92)#88 | 3.5%(+7.06)#1,608 |
| 89. | 14029 | 10.5% | 3.6%(+6.91)#89 | 3.5%(+7.04)#1,618 |
| 90. | 12121 | 10.5% | 3.6%(+6.86)#90 | 3.5%(+7.00)#1,632 |
| 91. | 13844 | 10.5% | 3.6%(+6.85)#91 | 3.5%(+6.98)#1,643 |
| 92. | 14859 | 10.4% | 3.6%(+6.76)#92 | 3.5%(+6.89)#1,672 |
| 93. | 12165 | 10.2% | 3.6%(+6.61)#93 | 3.5%(+6.74)#1,726 |
| 94. | 11550 | 10.1% | 3.6%(+6.46)#94 | 3.5%(+6.60)#1,775 |
| 95. | 12733 | 10.1% | 3.6%(+6.46)#95 | 3.5%(+6.60)#1,776 |
| 96. | 10573 | 10.1% | 3.6%(+6.46)#96 | 3.5%(+6.59)#1,779 |
| 97. | 14814 | 10.0% | 3.6%(+6.40)#97 | 3.5%(+6.53)#1,799 |
| 98. | 12853 | 10.0% | 3.6%(+6.36)#98 | 3.5%(+6.50)#1,818 |
| 99. | 12430 | 10.0% | 3.6%(+6.35)#99 | 3.5%(+6.49)#1,822 |
| 100. | 11944 | 9.9% | 3.6%(+6.33)#100 | 3.5%(+6.47)#1,833 |
Common Questions
What are the Top 10 Zip Codes with the Highest Percentage of Population Employed in Cleaning & Maintenance in New York?
Top 10 Zip Codes with the Highest Percentage of Population Employed in Cleaning & Maintenance in New York are:
What zip code has the Highest Percentage of Population Employed in Cleaning & Maintenance in New York?
12864 has the Highest Percentage of Population Employed in Cleaning & Maintenance in New York with 100.0%.
What is the Percentage of Population Employed in Cleaning & Maintenance in the State of New York?
Percentage of Population Employed in Cleaning & Maintenance in New York is 3.6%.
What is the Percentage of Population Employed in Cleaning & Maintenance in the United States?
Percentage of Population Employed in Cleaning & Maintenance in the United States is 3.5%.