Davenport Center, NY Map & Demographics
Davenport Center Map
Davenport Center Overview
$28,081
PER CAPITA INCOME
$56,389
AVG FAMILY INCOME
$51,071
AVG HOUSEHOLD INCOME
0.34
INEQUALITY / GINI INDEX
489
TOTAL POPULATION
167
MALE POPULATION
322
FEMALE POPULATION
51.86
MALES / 100 FEMALES
192.81
FEMALES / 100 MALES
29.9
MEDIAN AGE
3.0
AVG FAMILY SIZE
2.4
AVG HOUSEHOLD SIZE
172
LABOR FORCE [ PEOPLE ]
45.4%
PERCENT IN LABOR FORCE
Davenport Center Zip Codes
Davenport Center Area Codes
Income in Davenport Center
Income Overview in Davenport Center
Per Capita Income in Davenport Center is $28,081, while median incomes of families and households are $56,389 and $51,071 respectively.
| Characteristic | Number | Measure |
| Per Capita Income | 489 | $28,081 |
| Median Family Income | 116 | $56,389 |
| Mean Family Income | 116 | $69,142 |
| Median Household Income | 202 | $51,071 |
| Mean Household Income | 202 | $68,298 |
| Income Deficit | 116 | $0 |
| Wage / Income Gap (%) | 489 | 0.00% |
| Wage / Income Gap ($) | 489 | 100.00¢ per $1 |
| Gini / Inequality Index | 489 | 0.34 |
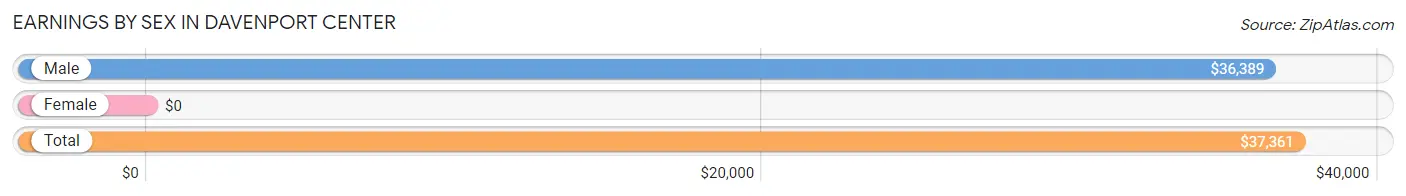
Earnings by Sex in Davenport Center
| Sex | Number | Average Earnings |
| Male | 122 (67.8%) | $36,389 |
| Female | 58 (32.2%) | $0 |
| Total | 180 (100.0%) | $37,361 |
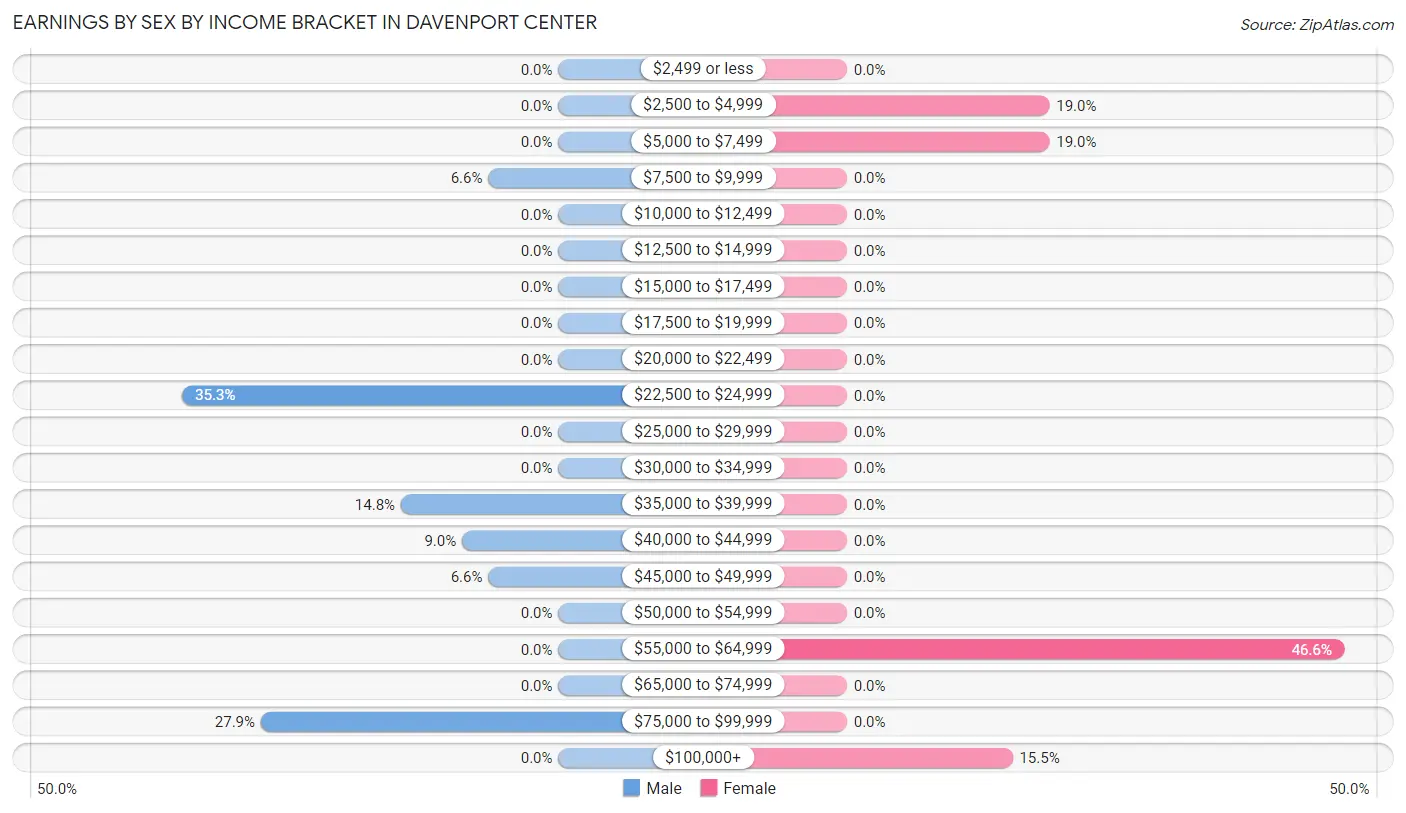
Earnings by Sex by Income Bracket in Davenport Center
The most common earnings brackets in Davenport Center are $22,500 to $24,999 for men (43 | 35.2%) and $55,000 to $64,999 for women (27 | 46.6%).
| Income | Male | Female |
| $2,499 or less | 0 (0.0%) | 0 (0.0%) |
| $2,500 to $4,999 | 0 (0.0%) | 11 (19.0%) |
| $5,000 to $7,499 | 0 (0.0%) | 11 (19.0%) |
| $7,500 to $9,999 | 8 (6.6%) | 0 (0.0%) |
| $10,000 to $12,499 | 0 (0.0%) | 0 (0.0%) |
| $12,500 to $14,999 | 0 (0.0%) | 0 (0.0%) |
| $15,000 to $17,499 | 0 (0.0%) | 0 (0.0%) |
| $17,500 to $19,999 | 0 (0.0%) | 0 (0.0%) |
| $20,000 to $22,499 | 0 (0.0%) | 0 (0.0%) |
| $22,500 to $24,999 | 43 (35.2%) | 0 (0.0%) |
| $25,000 to $29,999 | 0 (0.0%) | 0 (0.0%) |
| $30,000 to $34,999 | 0 (0.0%) | 0 (0.0%) |
| $35,000 to $39,999 | 18 (14.7%) | 0 (0.0%) |
| $40,000 to $44,999 | 11 (9.0%) | 0 (0.0%) |
| $45,000 to $49,999 | 8 (6.6%) | 0 (0.0%) |
| $50,000 to $54,999 | 0 (0.0%) | 0 (0.0%) |
| $55,000 to $64,999 | 0 (0.0%) | 27 (46.6%) |
| $65,000 to $74,999 | 0 (0.0%) | 0 (0.0%) |
| $75,000 to $99,999 | 34 (27.9%) | 0 (0.0%) |
| $100,000+ | 0 (0.0%) | 9 (15.5%) |
| Total | 122 (100.0%) | 58 (100.0%) |
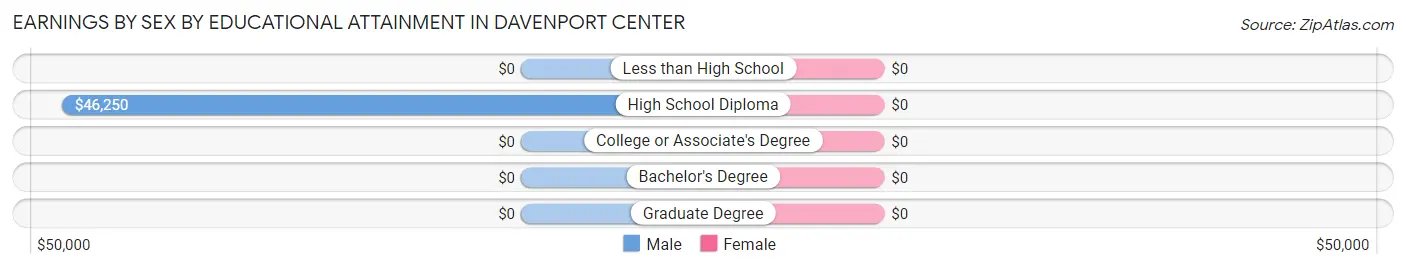
Earnings by Sex by Educational Attainment in Davenport Center
| Educational Attainment | Male Income | Female Income |
| Less than High School | - | - |
| High School Diploma | $46,250 | $0 |
| College or Associate's Degree | - | - |
| Bachelor's Degree | - | - |
| Graduate Degree | - | - |
| Total | $36,389 | $0 |
Family Income in Davenport Center
Family Income Brackets in Davenport Center
According to the Davenport Center family income data, there are 46 families falling into the $50,000 to $74,999 income range, which is the most common income bracket and makes up 39.7% of all families.
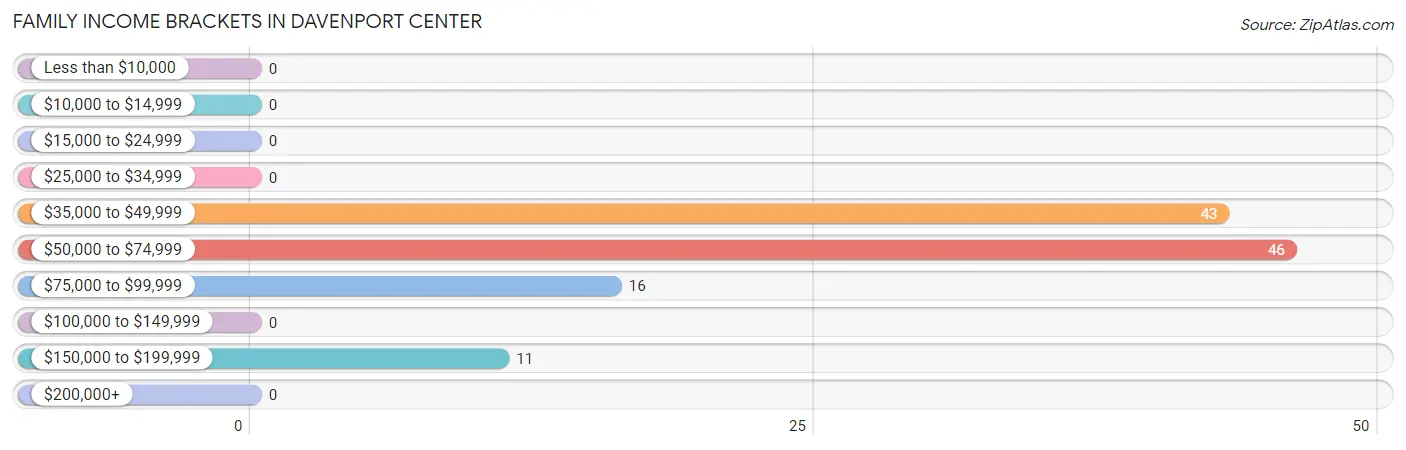
| Income Bracket | # Families | % Families |
| Less than $10,000 | 0 | 0.0% |
| $10,000 to $14,999 | 0 | 0.0% |
| $15,000 to $24,999 | 0 | 0.0% |
| $25,000 to $34,999 | 0 | 0.0% |
| $35,000 to $49,999 | 43 | 37.1% |
| $50,000 to $74,999 | 46 | 39.7% |
| $75,000 to $99,999 | 16 | 13.8% |
| $100,000 to $149,999 | 0 | 0.0% |
| $150,000 to $199,999 | 11 | 9.5% |
| $200,000+ | 0 | 0.0% |
Family Income by Famaliy Size in Davenport Center
2-person families (78 | 67.2%) account for the highest median family income in Davenport Center with $49,767 per family, while 2-person families (78 | 67.2%) have the highest median income of $24,884 per family member.
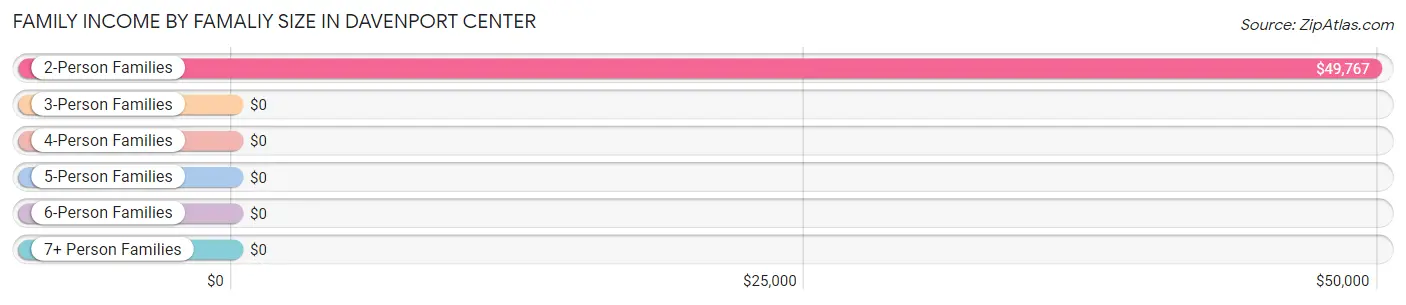
| Income Bracket | # Families | Median Income |
| 2-Person Families | 78 (67.2%) | $49,767 |
| 3-Person Families | 0 (0.0%) | $0 |
| 4-Person Families | 11 (9.5%) | $0 |
| 5-Person Families | 0 (0.0%) | $0 |
| 6-Person Families | 27 (23.3%) | $0 |
| 7+ Person Families | 0 (0.0%) | $0 |
| Total | 116 (100.0%) | $56,389 |
Family Income by Number of Earners in Davenport Center
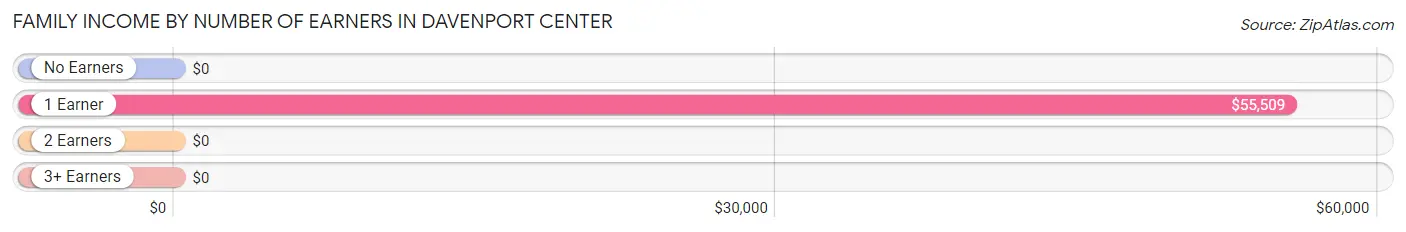
| Number of Earners | # Families | Median Income |
| No Earners | 0 (0.0%) | $0 |
| 1 Earner | 97 (83.6%) | $55,509 |
| 2 Earners | 8 (6.9%) | $0 |
| 3+ Earners | 11 (9.5%) | $0 |
| Total | 116 (100.0%) | $56,389 |
Household Income in Davenport Center
Household Income Brackets in Davenport Center
With 54 households falling in the category, the $50,000 to $74,999 income range is the most frequent in Davenport Center, accounting for 26.7% of all households.
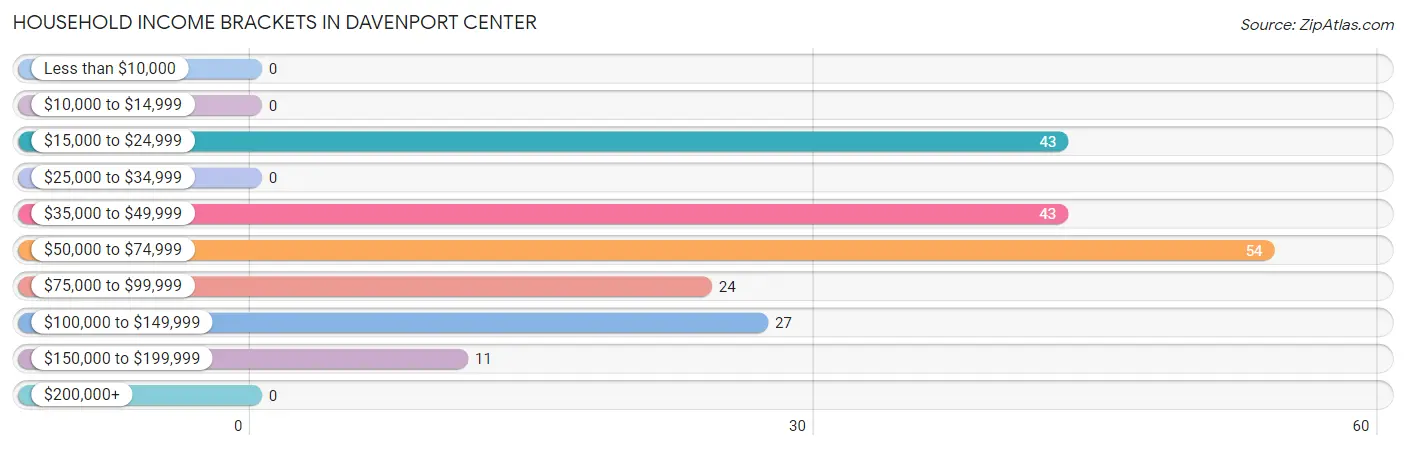
| Income Bracket | # Households | % Households |
| Less than $10,000 | 0 | 0.0% |
| $10,000 to $14,999 | 0 | 0.0% |
| $15,000 to $24,999 | 43 | 21.3% |
| $25,000 to $34,999 | 0 | 0.0% |
| $35,000 to $49,999 | 43 | 21.3% |
| $50,000 to $74,999 | 54 | 26.7% |
| $75,000 to $99,999 | 24 | 11.9% |
| $100,000 to $149,999 | 27 | 13.4% |
| $150,000 to $199,999 | 11 | 5.4% |
| $200,000+ | 0 | 0.0% |
Household Income by Householder Age in Davenport Center
The median household income in Davenport Center is $51,071, with the highest median household income of $48,983 found in the 65+ years age bracket for the primary householder. A total of 137 households (67.8%) fall into this category.
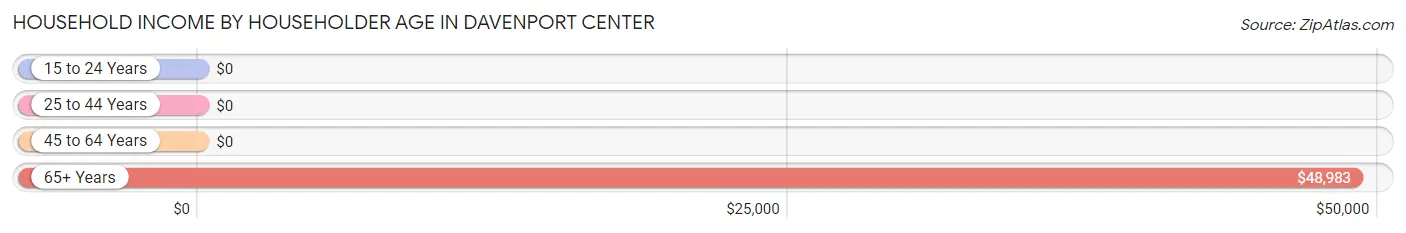
| Income Bracket | # Households | Median Income |
| 15 to 24 Years | 0 (0.0%) | $0 |
| 25 to 44 Years | 27 (13.4%) | $0 |
| 45 to 64 Years | 38 (18.8%) | $0 |
| 65+ Years | 137 (67.8%) | $48,983 |
| Total | 202 (100.0%) | $51,071 |
Poverty in Davenport Center
Income Below Poverty by Sex and Age in Davenport Center
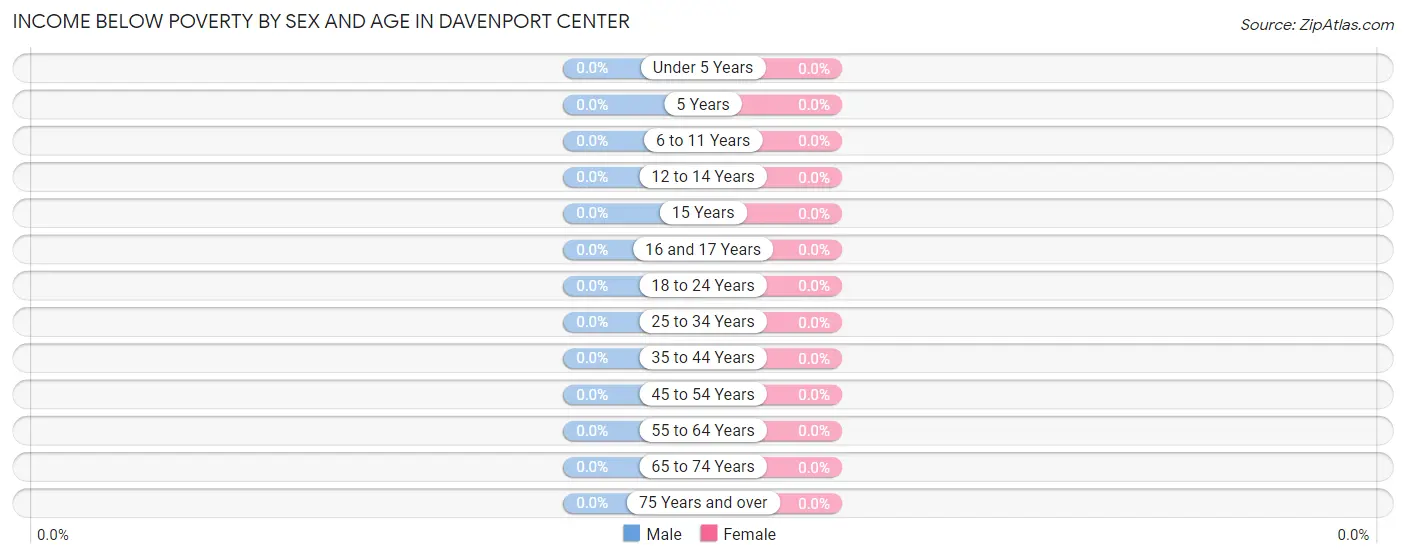
| Age Bracket | Male | Female |
| Under 5 Years | 0 (0.0%) | 0 (0.0%) |
| 5 Years | 0 (0.0%) | 0 (0.0%) |
| 6 to 11 Years | 0 (0.0%) | 0 (0.0%) |
| 12 to 14 Years | 0 (0.0%) | 0 (0.0%) |
| 15 Years | 0 (0.0%) | 0 (0.0%) |
| 16 and 17 Years | 0 (0.0%) | 0 (0.0%) |
| 18 to 24 Years | 0 (0.0%) | 0 (0.0%) |
| 25 to 34 Years | 0 (0.0%) | 0 (0.0%) |
| 35 to 44 Years | 0 (0.0%) | 0 (0.0%) |
| 45 to 54 Years | 0 (0.0%) | 0 (0.0%) |
| 55 to 64 Years | 0 (0.0%) | 0 (0.0%) |
| 65 to 74 Years | 0 (0.0%) | 0 (0.0%) |
| 75 Years and over | 0 (0.0%) | 0 (0.0%) |
| Total | 0 (0.0%) | 0 (0.0%) |
Income Above Poverty by Sex and Age in Davenport Center
According to the poverty statistics in Davenport Center, males aged 6 to 11 years and females aged under 5 years are the age groups that are most secure financially, with 100.0% of males and 100.0% of females in these age groups living above the poverty line.
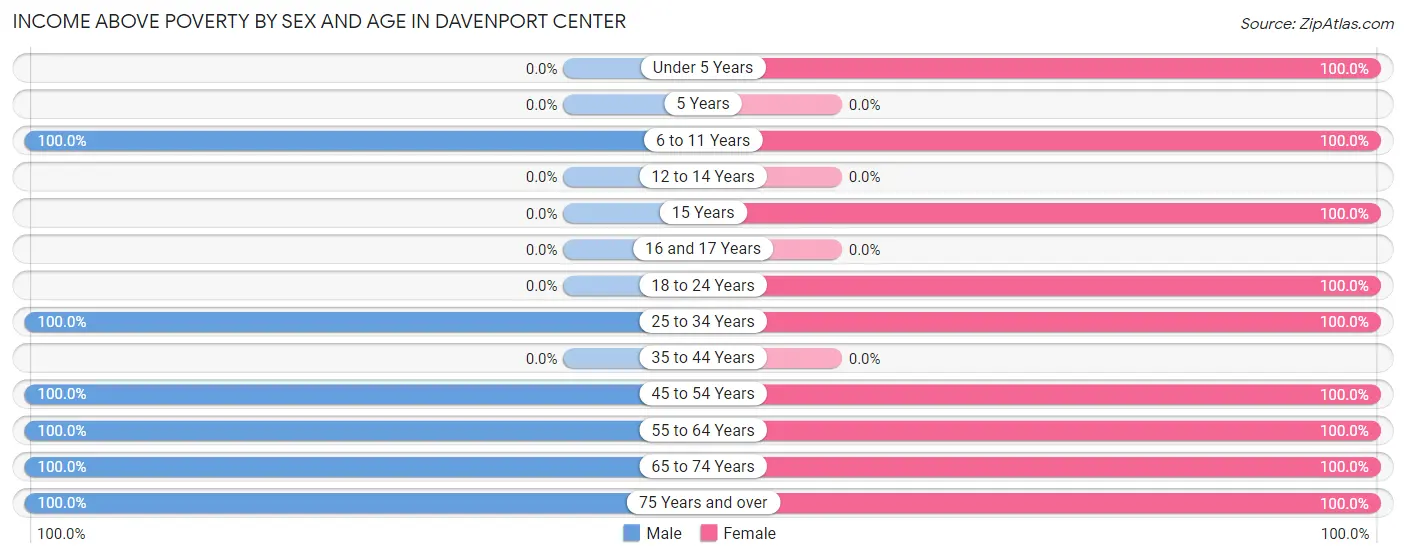
| Age Bracket | Male | Female |
| Under 5 Years | 0 (0.0%) | 58 (100.0%) |
| 5 Years | 0 (0.0%) | 0 (0.0%) |
| 6 to 11 Years | 17 (100.0%) | 23 (100.0%) |
| 12 to 14 Years | 0 (0.0%) | 0 (0.0%) |
| 15 Years | 0 (0.0%) | 12 (100.0%) |
| 16 and 17 Years | 0 (0.0%) | 0 (0.0%) |
| 18 to 24 Years | 0 (0.0%) | 22 (100.0%) |
| 25 to 34 Years | 26 (100.0%) | 92 (100.0%) |
| 35 to 44 Years | 0 (0.0%) | 0 (0.0%) |
| 45 to 54 Years | 19 (100.0%) | 9 (100.0%) |
| 55 to 64 Years | 18 (100.0%) | 28 (100.0%) |
| 65 to 74 Years | 59 (100.0%) | 28 (100.0%) |
| 75 Years and over | 28 (100.0%) | 50 (100.0%) |
| Total | 167 (100.0%) | 322 (100.0%) |
Income Below Poverty Among Married-Couple Families in Davenport Center
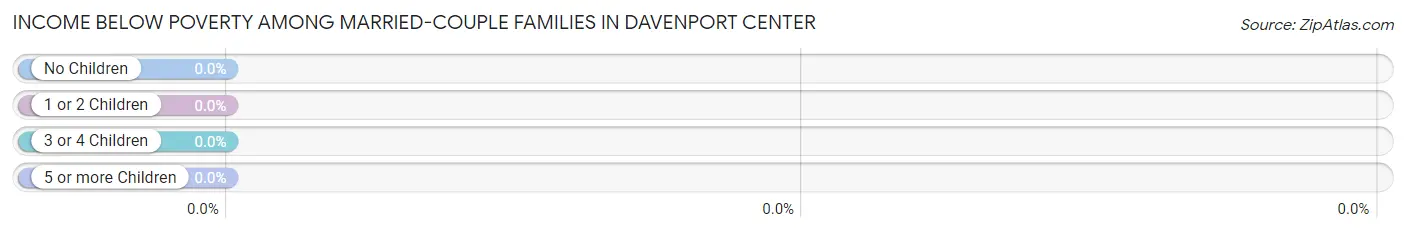
| Children | Above Poverty | Below Poverty |
| No Children | 27 (100.0%) | 0 (0.0%) |
| 1 or 2 Children | 11 (100.0%) | 0 (0.0%) |
| 3 or 4 Children | 0 (0.0%) | 0 (0.0%) |
| 5 or more Children | 0 (0.0%) | 0 (0.0%) |
| Total | 38 (100.0%) | 0 (0.0%) |
Income Below Poverty Among Single-Parent Households in Davenport Center
| Children | Single Father | Single Mother |
| No Children | 0 (0.0%) | 0 (0.0%) |
| 1 or 2 Children | 0 (0.0%) | 0 (0.0%) |
| 3 or 4 Children | 0 (0.0%) | 0 (0.0%) |
| 5 or more Children | 0 (0.0%) | 0 (0.0%) |
| Total | 0 (0.0%) | 0 (0.0%) |
Income Below Poverty Among Married-Couple vs Single-Parent Households in Davenport Center
| Children | Married-Couple Families | Single-Parent Households |
| No Children | 0 (0.0%) | 0 (0.0%) |
| 1 or 2 Children | 0 (0.0%) | 0 (0.0%) |
| 3 or 4 Children | 0 (0.0%) | 0 (0.0%) |
| 5 or more Children | 0 (0.0%) | 0 (0.0%) |
| Total | 0 (0.0%) | 0 (0.0%) |
Race in Davenport Center
The most populous races in Davenport Center are , and White / Caucasian (489 | 100.0%).
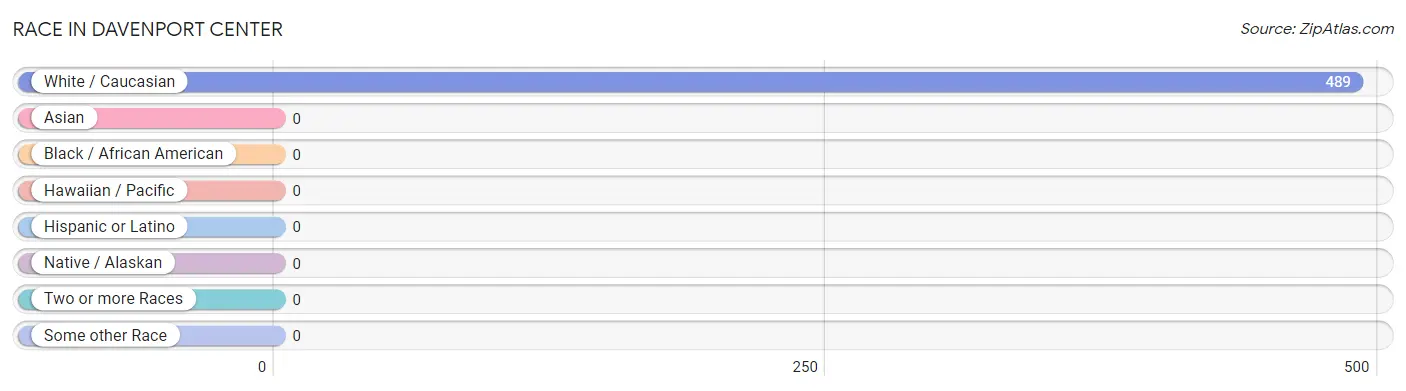
| Race | # Population | % Population |
| Asian | 0 | 0.0% |
| Black / African American | 0 | 0.0% |
| Hawaiian / Pacific | 0 | 0.0% |
| Hispanic or Latino | 0 | 0.0% |
| Native / Alaskan | 0 | 0.0% |
| White / Caucasian | 489 | 100.0% |
| Two or more Races | 0 | 0.0% |
| Some other Race | 0 | 0.0% |
| Total | 489 | 100.0% |
Ancestry in Davenport Center
The most populous ancestries reported in Davenport Center are English (163 | 33.3%), Irish (148 | 30.3%), German (125 | 25.6%), Welsh (108 | 22.1%), and Italian (62 | 12.7%), together accounting for 123.9% of all Davenport Center residents.
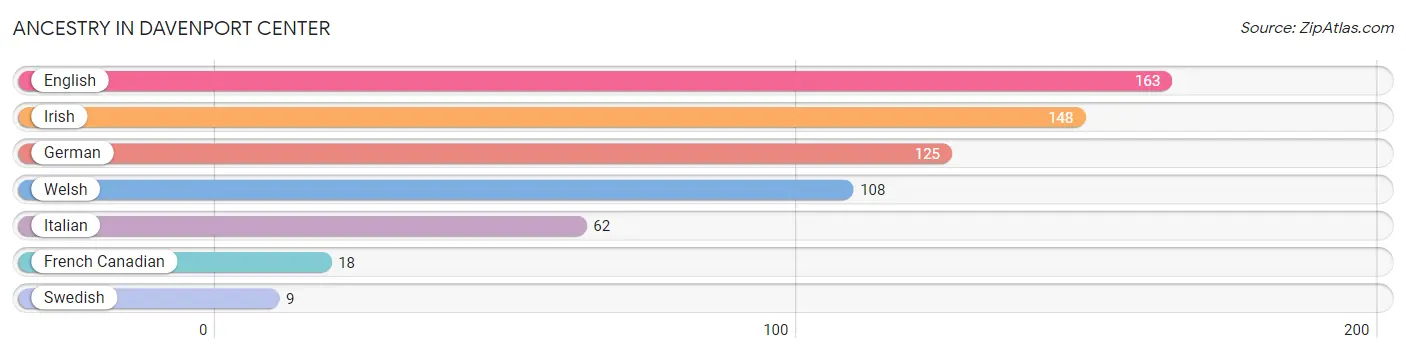
| Ancestry | # Population | % Population |
| English | 163 | 33.3% |
| French Canadian | 18 | 3.7% |
| German | 125 | 25.6% |
| Irish | 148 | 30.3% |
| Italian | 62 | 12.7% |
| Swedish | 9 | 1.8% |
| Welsh | 108 | 22.1% | View All 7 Rows |
Immigrants in Davenport Center

| Immigration Origin | # Population | % Population | View All 0 Rows |
Sex and Age in Davenport Center
Sex and Age in Davenport Center
The most populous age groups in Davenport Center are 65 to 69 Years (51 | 30.5%) for men and 25 to 29 Years (92 | 28.6%) for women.
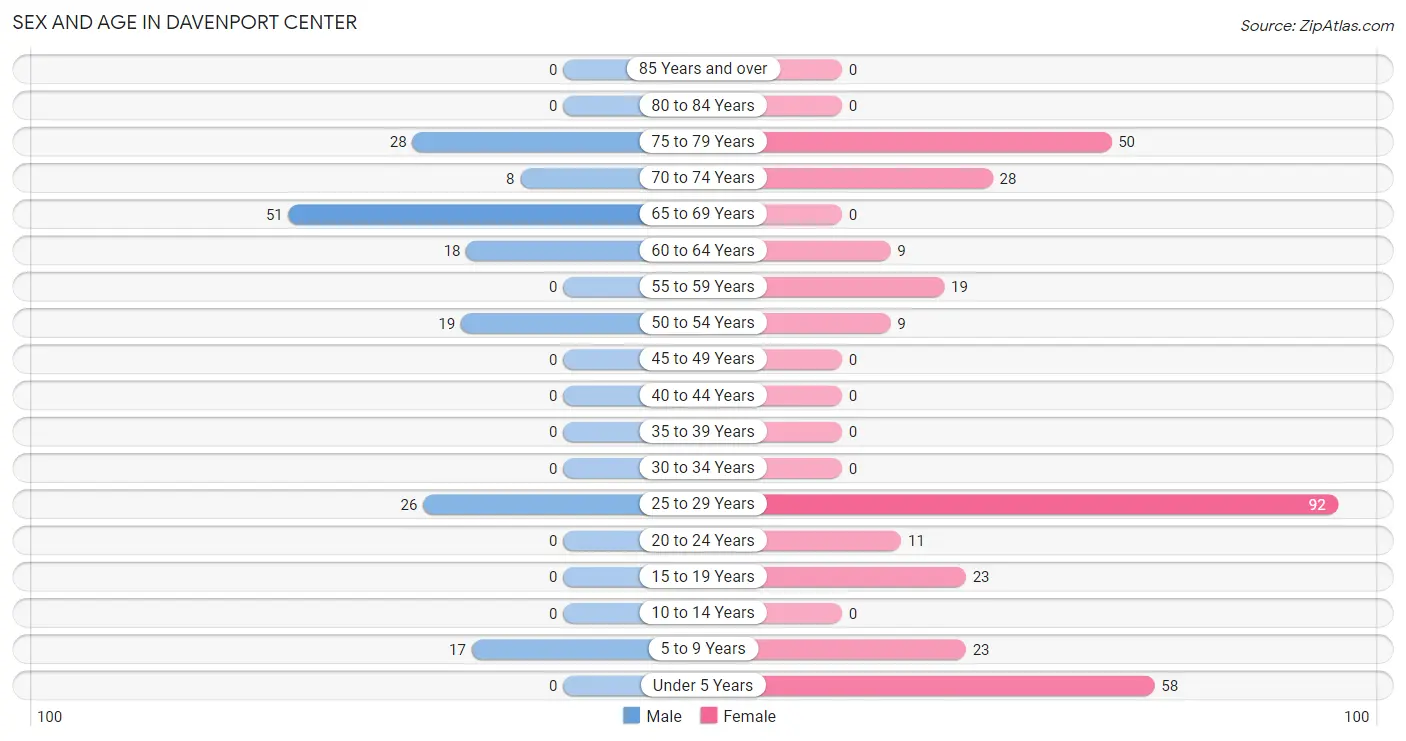
| Age Bracket | Male | Female |
| Under 5 Years | 0 (0.0%) | 58 (18.0%) |
| 5 to 9 Years | 17 (10.2%) | 23 (7.1%) |
| 10 to 14 Years | 0 (0.0%) | 0 (0.0%) |
| 15 to 19 Years | 0 (0.0%) | 23 (7.1%) |
| 20 to 24 Years | 0 (0.0%) | 11 (3.4%) |
| 25 to 29 Years | 26 (15.6%) | 92 (28.6%) |
| 30 to 34 Years | 0 (0.0%) | 0 (0.0%) |
| 35 to 39 Years | 0 (0.0%) | 0 (0.0%) |
| 40 to 44 Years | 0 (0.0%) | 0 (0.0%) |
| 45 to 49 Years | 0 (0.0%) | 0 (0.0%) |
| 50 to 54 Years | 19 (11.4%) | 9 (2.8%) |
| 55 to 59 Years | 0 (0.0%) | 19 (5.9%) |
| 60 to 64 Years | 18 (10.8%) | 9 (2.8%) |
| 65 to 69 Years | 51 (30.5%) | 0 (0.0%) |
| 70 to 74 Years | 8 (4.8%) | 28 (8.7%) |
| 75 to 79 Years | 28 (16.8%) | 50 (15.5%) |
| 80 to 84 Years | 0 (0.0%) | 0 (0.0%) |
| 85 Years and over | 0 (0.0%) | 0 (0.0%) |
| Total | 167 (100.0%) | 322 (100.0%) |
Families and Households in Davenport Center
Median Family Size in Davenport Center
The median family size in Davenport Center is 3.01 persons per family, with single female/mother families (27 | 23.3%) accounting for the largest median family size of 4.63 persons per family. On the other hand, single male/father families (51 | 44.0%) represent the smallest median family size with 2.49 persons per family.
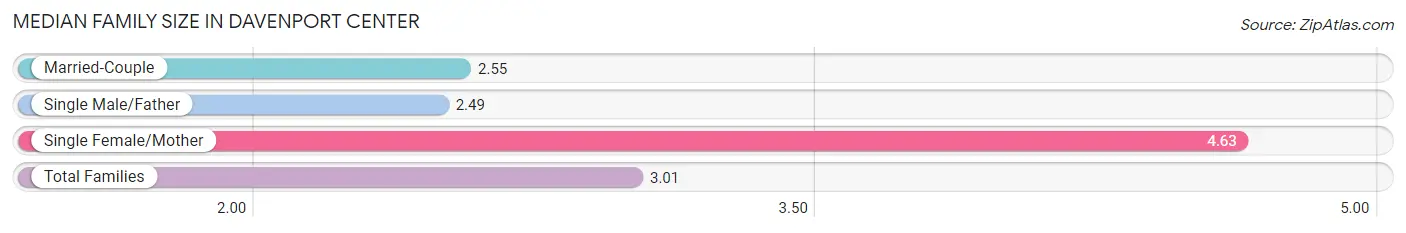
| Family Type | # Families | Family Size |
| Married-Couple | 38 (32.8%) | 2.55 |
| Single Male/Father | 51 (44.0%) | 2.49 |
| Single Female/Mother | 27 (23.3%) | 4.63 |
| Total Families | 116 (100.0%) | 3.01 |
Median Household Size in Davenport Center
The median household size in Davenport Center is 2.42 persons per household, with single female/mother households (27 | 13.4%) accounting for the largest median household size of 5.59 persons per household. non-family households (86 | 42.6%) represent the smallest median household size with 1.33 persons per household.
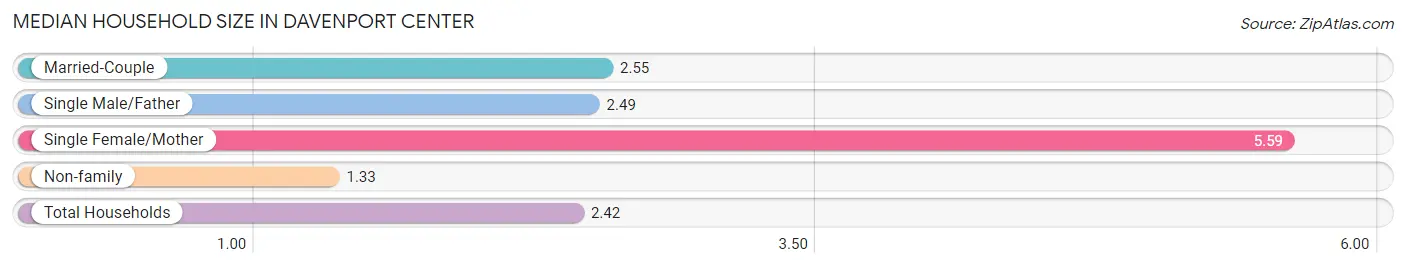
| Household Type | # Households | Household Size |
| Married-Couple | 38 (18.8%) | 2.55 |
| Single Male/Father | 51 (25.3%) | 2.49 |
| Single Female/Mother | 27 (13.4%) | 5.59 |
| Non-family | 86 (42.6%) | 1.33 |
| Total Households | 202 (100.0%) | 2.42 |
Household Size by Marriage Status in Davenport Center
Out of a total of 202 households in Davenport Center, 116 (57.4%) are family households, while 86 (42.6%) are nonfamily households. The most numerous type of family households are 2-person households, comprising 78, and the most common type of nonfamily households are 1-person households, comprising 58.
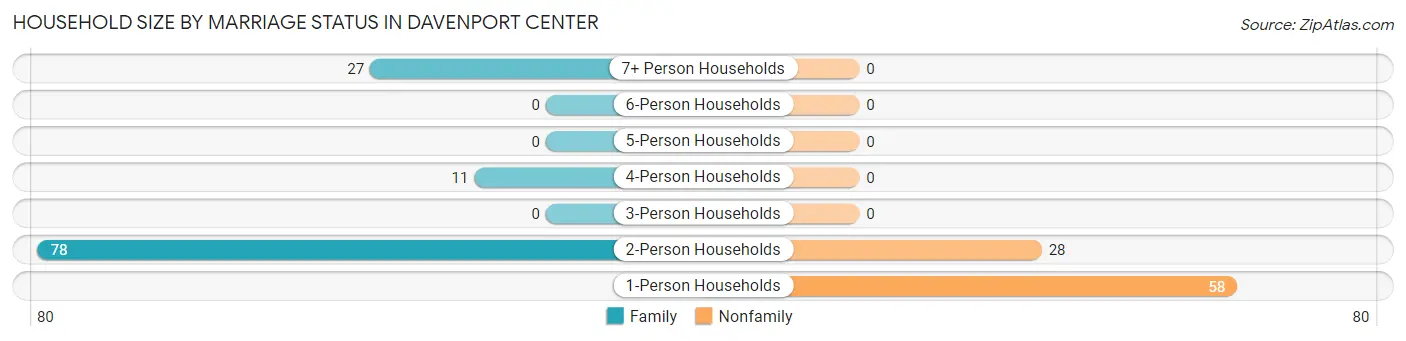
| Household Size | Family Households | Nonfamily Households |
| 1-Person Households | - | 58 (28.7%) |
| 2-Person Households | 78 (38.6%) | 28 (13.9%) |
| 3-Person Households | 0 (0.0%) | 0 (0.0%) |
| 4-Person Households | 11 (5.4%) | 0 (0.0%) |
| 5-Person Households | 0 (0.0%) | 0 (0.0%) |
| 6-Person Households | 0 (0.0%) | 0 (0.0%) |
| 7+ Person Households | 27 (13.4%) | 0 (0.0%) |
| Total | 116 (57.4%) | 86 (42.6%) |
Female Fertility in Davenport Center
Fertility by Age in Davenport Center
| Age Bracket | Women with Births | Births / 1,000 Women |
| 15 to 19 years | 0 (0.0%) | 0.0 |
| 20 to 34 years | 0 (0.0%) | 0.0 |
| 35 to 50 years | 0 (0.0%) | 0.0 |
| Total | 0 (0.0%) | 0.0 |
Fertility by Age by Marriage Status in Davenport Center
| Age Bracket | Married | Unmarried |
| 15 to 19 years | 0 (0.0%) | 0 (0.0%) |
| 20 to 34 years | 0 (0.0%) | 0 (0.0%) |
| 35 to 50 years | 0 (0.0%) | 0 (0.0%) |
| Total | 0 (0.0%) | 0 (0.0%) |
Fertility by Education in Davenport Center
| Educational Attainment | Women with Births | Births / 1,000 Women |
| Less than High School | 0 (0.0%) | 0.0 |
| High School Diploma | 0 (0.0%) | 0.0 |
| College or Associate's Degree | 0 (0.0%) | 0.0 |
| Bachelor's Degree | 0 (0.0%) | 0.0 |
| Graduate Degree | 0 (0.0%) | 0.0 |
| Total | 0 (0.0%) | 0.0 |
Fertility by Education by Marriage Status in Davenport Center
| Educational Attainment | Married | Unmarried |
| Less than High School | 0 (0.0%) | 0 (0.0%) |
| High School Diploma | 0 (0.0%) | 0 (0.0%) |
| College or Associate's Degree | 0 (0.0%) | 0 (0.0%) |
| Bachelor's Degree | 0 (0.0%) | 0 (0.0%) |
| Graduate Degree | 0 (0.0%) | 0 (0.0%) |
| Total | 0 (0.0%) | 0 (0.0%) |
Employment Characteristics in Davenport Center
Employment by Class of Employer in Davenport Center
Among the 172 employed individuals in Davenport Center, private company employees (72 | 41.9%), self-employed (not incorporated) (43 | 25.0%), and state government employees (29 | 16.9%) make up the most common classes of employment.
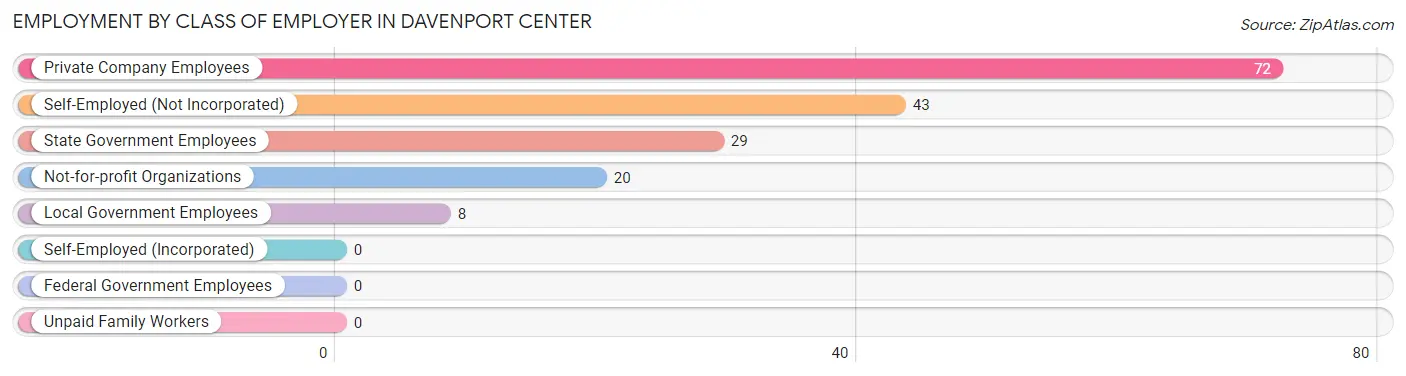
| Employer Class | # Employees | % Employees |
| Private Company Employees | 72 | 41.9% |
| Self-Employed (Incorporated) | 0 | 0.0% |
| Self-Employed (Not Incorporated) | 43 | 25.0% |
| Not-for-profit Organizations | 20 | 11.6% |
| Local Government Employees | 8 | 4.6% |
| State Government Employees | 29 | 16.9% |
| Federal Government Employees | 0 | 0.0% |
| Unpaid Family Workers | 0 | 0.0% |
| Total | 172 | 100.0% |
Employment Status by Age in Davenport Center
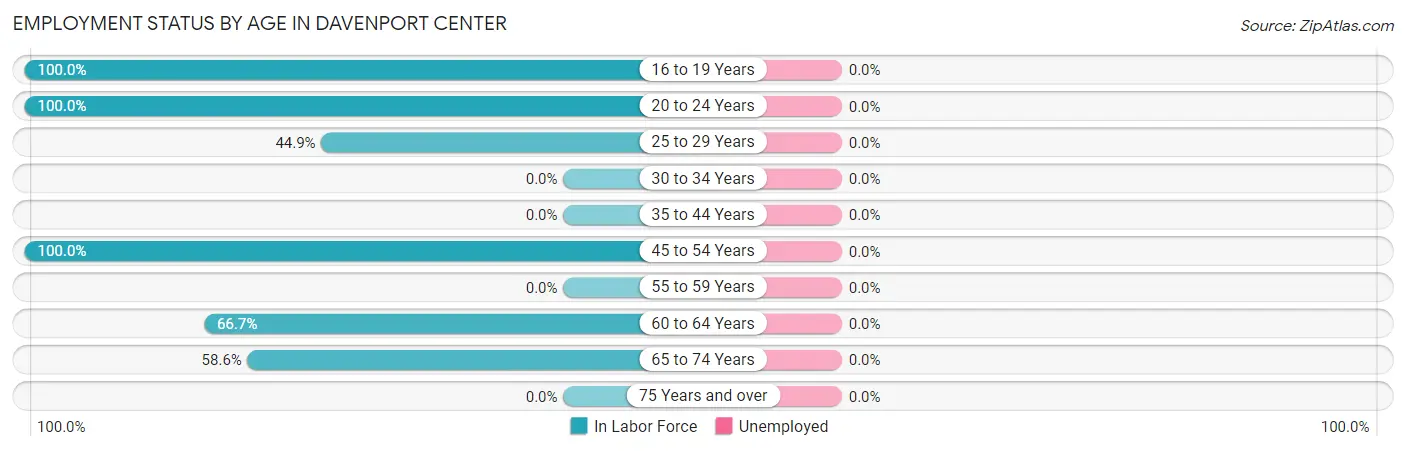
| Age Bracket | In Labor Force | Unemployed |
| 16 to 19 Years | 11 (100.0%) | 0 (0.0%) |
| 20 to 24 Years | 11 (100.0%) | 0 (0.0%) |
| 25 to 29 Years | 53 (44.9%) | 0 (0.0%) |
| 30 to 34 Years | 0 (0.0%) | 0 (0.0%) |
| 35 to 44 Years | 0 (0.0%) | 0 (0.0%) |
| 45 to 54 Years | 28 (100.0%) | 0 (0.0%) |
| 55 to 59 Years | 0 (0.0%) | 0 (0.0%) |
| 60 to 64 Years | 18 (66.7%) | 0 (0.0%) |
| 65 to 74 Years | 51 (58.6%) | 0 (0.0%) |
| 75 Years and over | 0 (0.0%) | 0 (0.0%) |
| Total | 172 (45.4%) | 0 (0.0%) |
Employment Status by Educational Attainment in Davenport Center
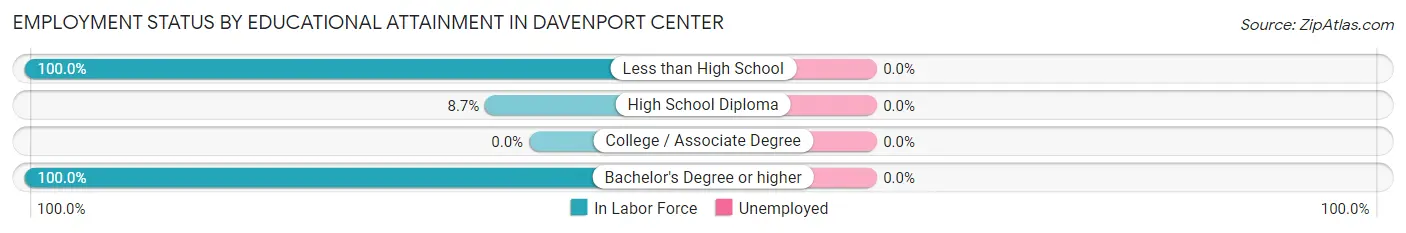
| Educational Attainment | In Labor Force | Unemployed |
| Less than High School | 18 (100.0%) | 0 (0.0%) |
| High School Diploma | 8 (8.7%) | 0 (0.0%) |
| College / Associate Degree | 0 (0.0%) | 0 (0.0%) |
| Bachelor's Degree or higher | 73 (100.0%) | 0 (0.0%) |
| Total | 99 (51.6%) | 0 (0.0%) |
Employment Occupations by Sex in Davenport Center
Management, Business, Science and Arts Occupations
The most common Management, Business, Science and Arts occupations in Davenport Center are Management (27 | 15.7%), Health Diagnosing & Treating (9 | 5.2%), and Health Technologists (9 | 5.2%).
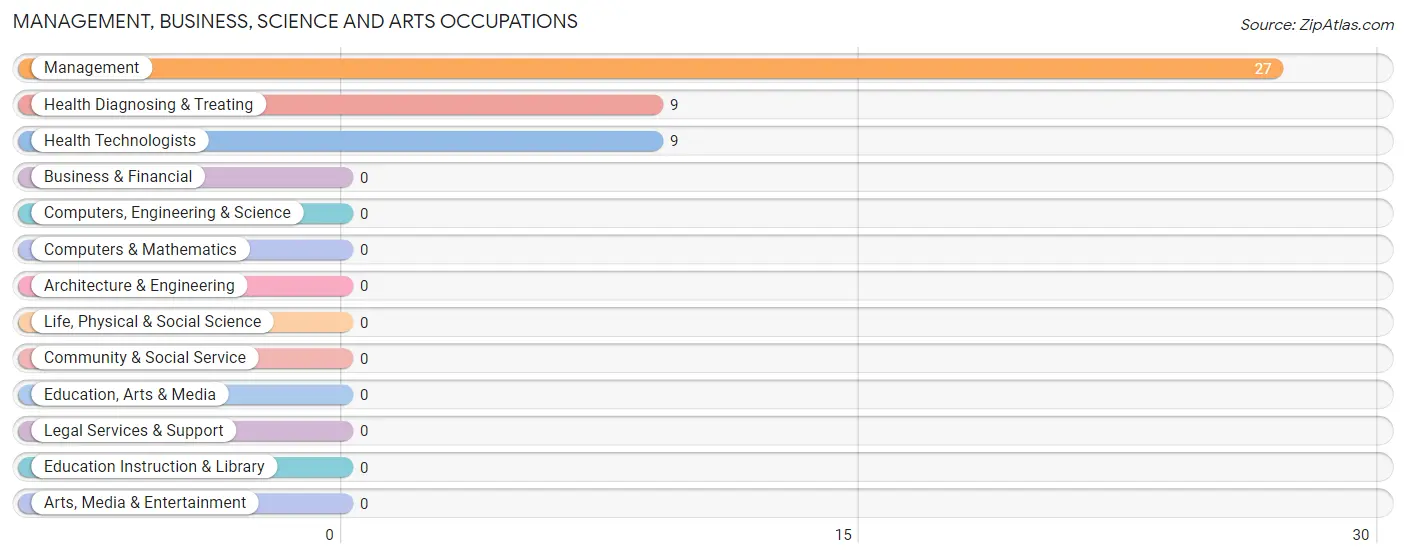
Management, Business, Science and Arts Occupations by Sex
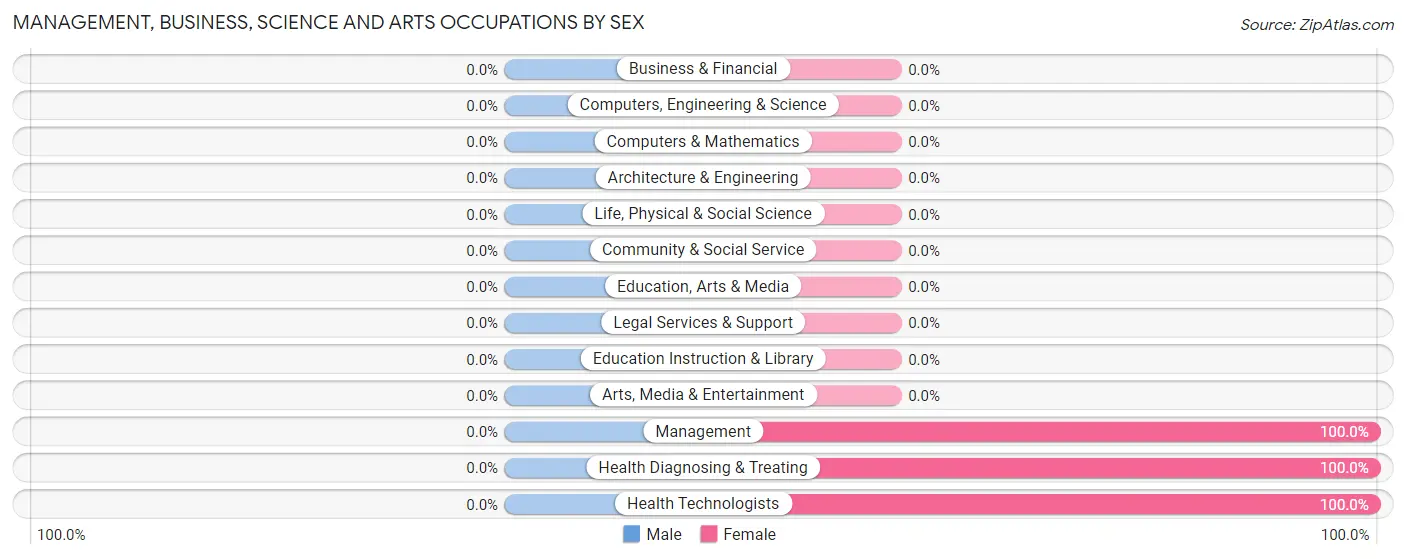
| Occupation | Male | Female |
| Management | 0 (0.0%) | 27 (100.0%) |
| Business & Financial | 0 (0.0%) | 0 (0.0%) |
| Computers, Engineering & Science | 0 (0.0%) | 0 (0.0%) |
| Computers & Mathematics | 0 (0.0%) | 0 (0.0%) |
| Architecture & Engineering | 0 (0.0%) | 0 (0.0%) |
| Life, Physical & Social Science | 0 (0.0%) | 0 (0.0%) |
| Community & Social Service | 0 (0.0%) | 0 (0.0%) |
| Education, Arts & Media | 0 (0.0%) | 0 (0.0%) |
| Legal Services & Support | 0 (0.0%) | 0 (0.0%) |
| Education Instruction & Library | 0 (0.0%) | 0 (0.0%) |
| Arts, Media & Entertainment | 0 (0.0%) | 0 (0.0%) |
| Health Diagnosing & Treating | 0 (0.0%) | 9 (100.0%) |
| Health Technologists | 0 (0.0%) | 9 (100.0%) |
| Total (Category) | 0 (0.0%) | 36 (100.0%) |
| Total (Overall) | 114 (66.3%) | 58 (33.7%) |
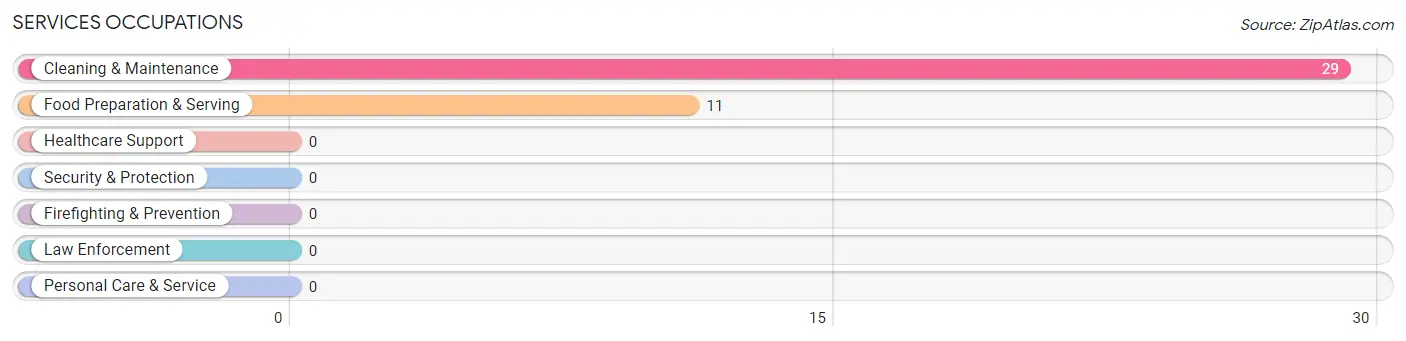
Services Occupations
The most common Services occupations in Davenport Center are Cleaning & Maintenance (29 | 16.9%), and Food Preparation & Serving (11 | 6.4%).
Services Occupations by Sex
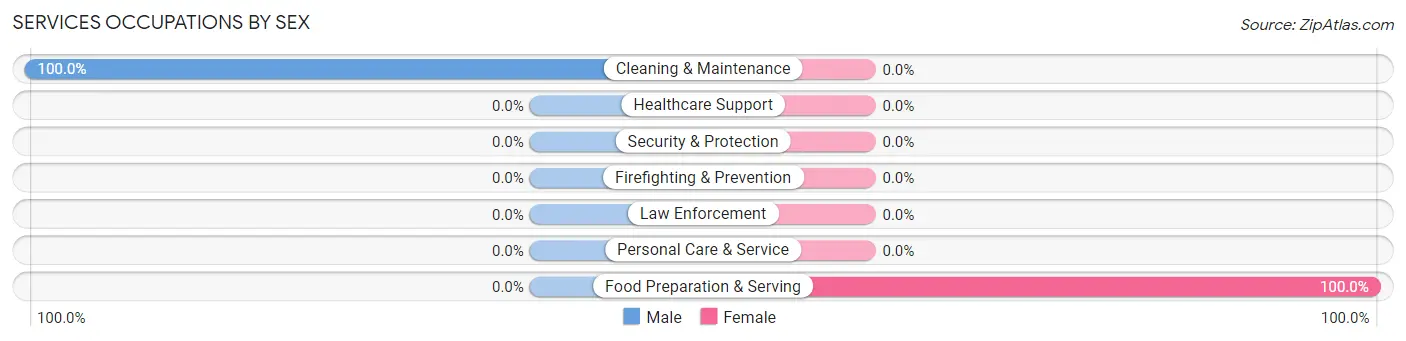
| Occupation | Male | Female |
| Healthcare Support | 0 (0.0%) | 0 (0.0%) |
| Security & Protection | 0 (0.0%) | 0 (0.0%) |
| Firefighting & Prevention | 0 (0.0%) | 0 (0.0%) |
| Law Enforcement | 0 (0.0%) | 0 (0.0%) |
| Food Preparation & Serving | 0 (0.0%) | 11 (100.0%) |
| Cleaning & Maintenance | 29 (100.0%) | 0 (0.0%) |
| Personal Care & Service | 0 (0.0%) | 0 (0.0%) |
| Total (Category) | 29 (72.5%) | 11 (27.5%) |
| Total (Overall) | 114 (66.3%) | 58 (33.7%) |
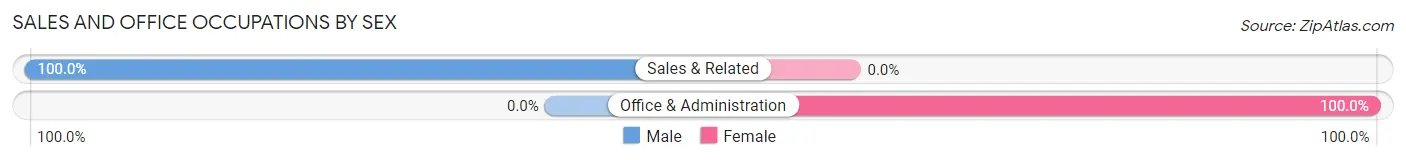
Sales and Office Occupations
The most common Sales and Office occupations in Davenport Center are Sales & Related (26 | 15.1%), and Office & Administration (11 | 6.4%).
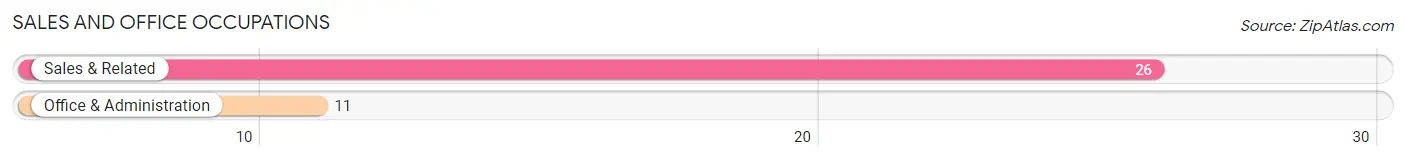
Sales and Office Occupations by Sex
| Occupation | Male | Female |
| Sales & Related | 26 (100.0%) | 0 (0.0%) |
| Office & Administration | 0 (0.0%) | 11 (100.0%) |
| Total (Category) | 26 (70.3%) | 11 (29.7%) |
| Total (Overall) | 114 (66.3%) | 58 (33.7%) |
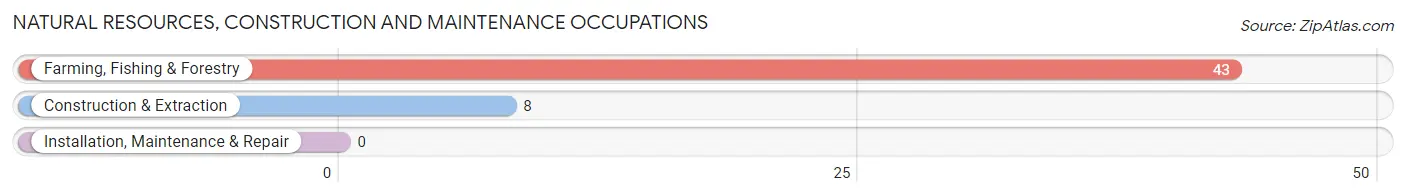
Natural Resources, Construction and Maintenance Occupations
The most common Natural Resources, Construction and Maintenance occupations in Davenport Center are Farming, Fishing & Forestry (43 | 25.0%), and Construction & Extraction (8 | 4.6%).
Natural Resources, Construction and Maintenance Occupations by Sex
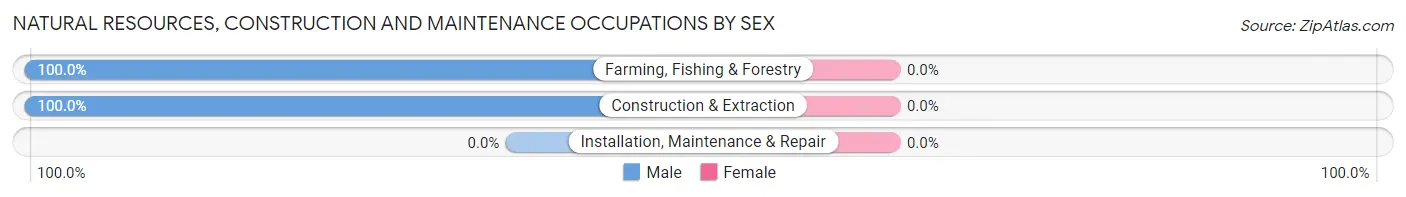
| Occupation | Male | Female |
| Farming, Fishing & Forestry | 43 (100.0%) | 0 (0.0%) |
| Construction & Extraction | 8 (100.0%) | 0 (0.0%) |
| Installation, Maintenance & Repair | 0 (0.0%) | 0 (0.0%) |
| Total (Category) | 51 (100.0%) | 0 (0.0%) |
| Total (Overall) | 114 (66.3%) | 58 (33.7%) |
Production, Transportation and Moving Occupations
The most common Production, Transportation and Moving occupations in Davenport Center are , and Material Moving (8 | 4.6%).
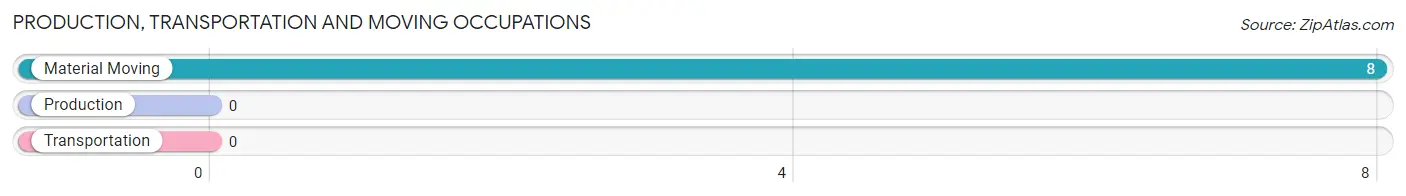
Production, Transportation and Moving Occupations by Sex
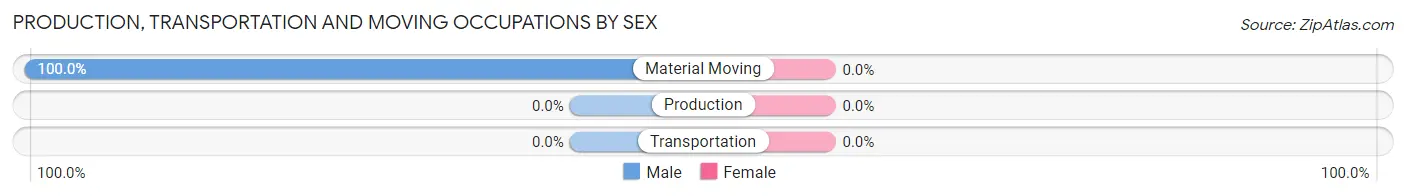
| Occupation | Male | Female |
| Production | 0 (0.0%) | 0 (0.0%) |
| Transportation | 0 (0.0%) | 0 (0.0%) |
| Material Moving | 8 (100.0%) | 0 (0.0%) |
| Total (Category) | 8 (100.0%) | 0 (0.0%) |
| Total (Overall) | 114 (66.3%) | 58 (33.7%) |
Employment Industries by Sex in Davenport Center
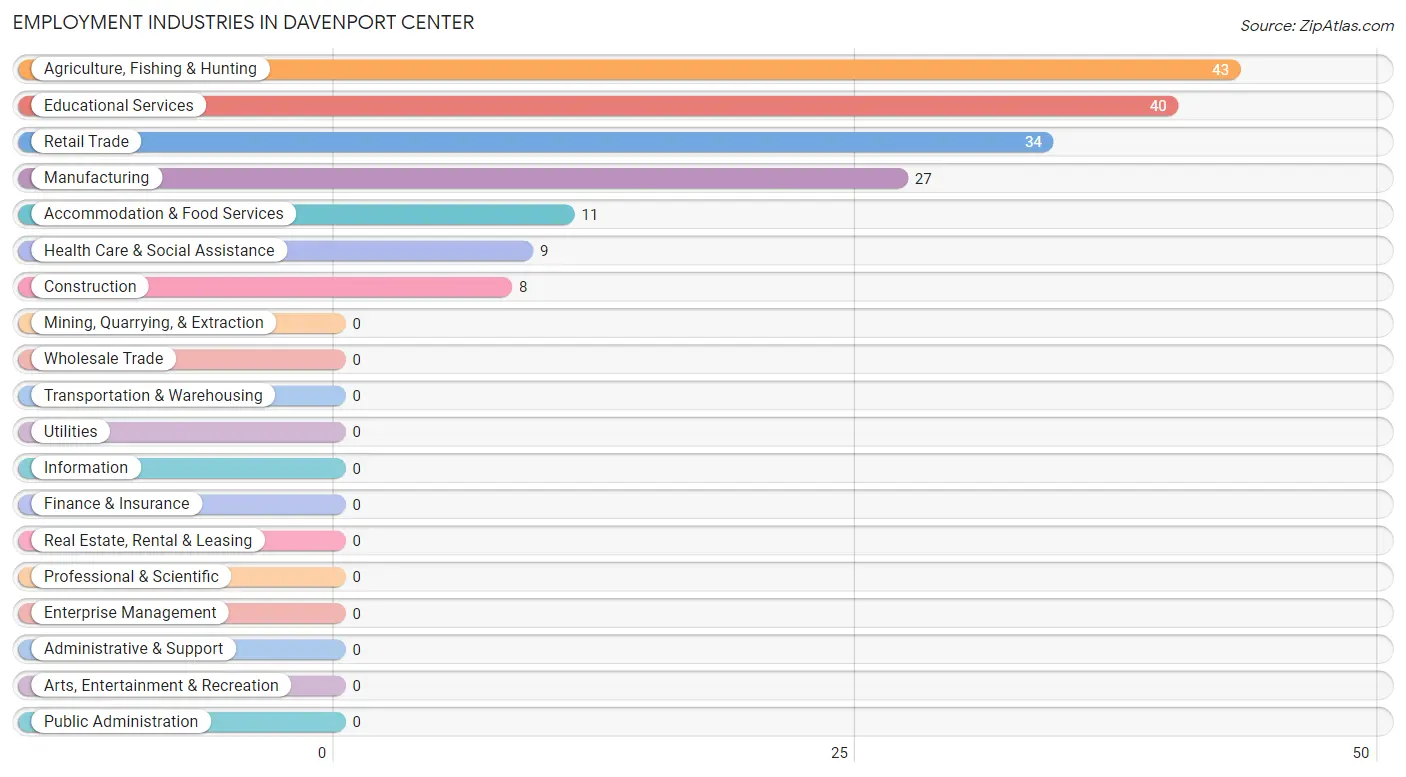
Employment Industries in Davenport Center
The major employment industries in Davenport Center include Agriculture, Fishing & Hunting (43 | 25.0%), Educational Services (40 | 23.3%), Retail Trade (34 | 19.8%), Manufacturing (27 | 15.7%), and Accommodation & Food Services (11 | 6.4%).
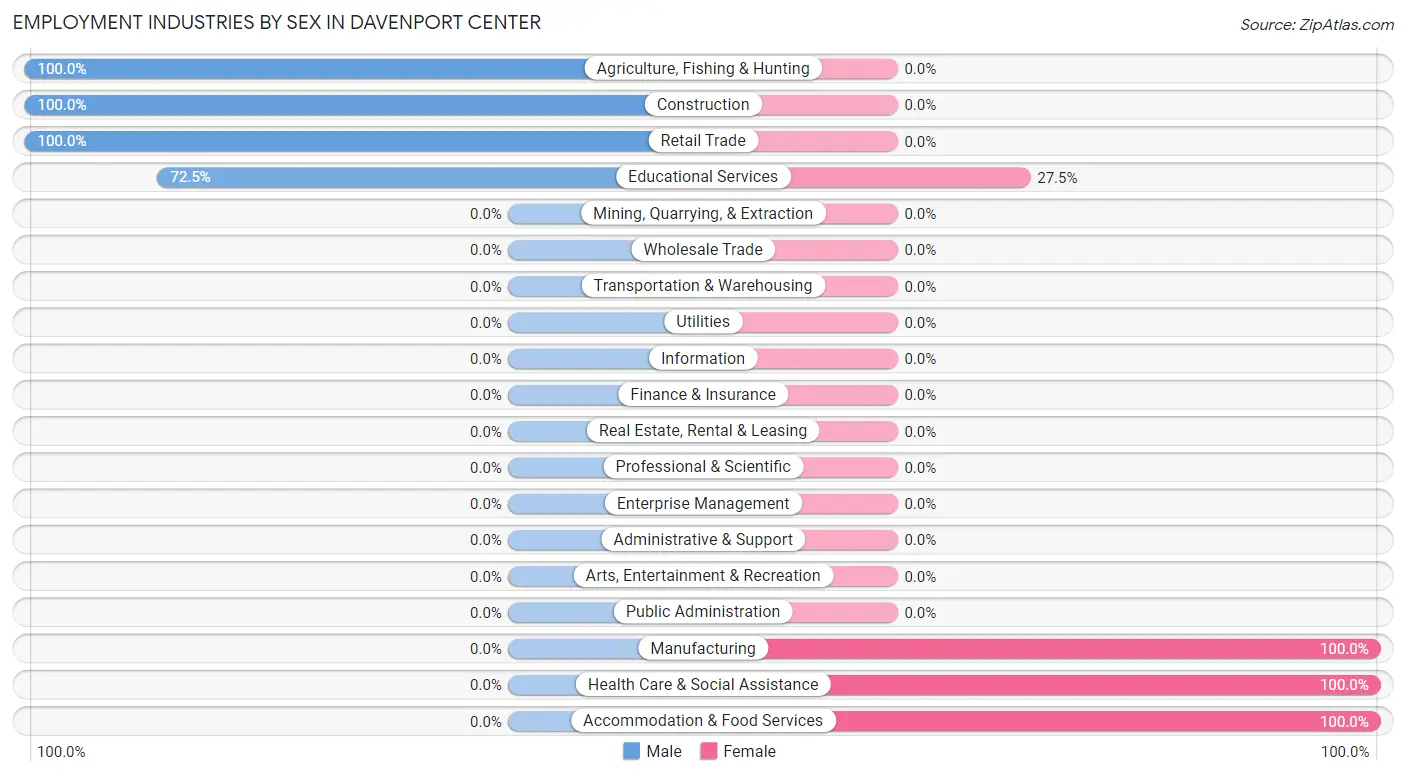
Employment Industries by Sex in Davenport Center
The Davenport Center industries that see more men than women are Agriculture, Fishing & Hunting (100.0%), Construction (100.0%), and Retail Trade (100.0%), whereas the industries that tend to have a higher number of women are Manufacturing (100.0%), Health Care & Social Assistance (100.0%), and Accommodation & Food Services (100.0%).
| Industry | Male | Female |
| Agriculture, Fishing & Hunting | 43 (100.0%) | 0 (0.0%) |
| Mining, Quarrying, & Extraction | 0 (0.0%) | 0 (0.0%) |
| Construction | 8 (100.0%) | 0 (0.0%) |
| Manufacturing | 0 (0.0%) | 27 (100.0%) |
| Wholesale Trade | 0 (0.0%) | 0 (0.0%) |
| Retail Trade | 34 (100.0%) | 0 (0.0%) |
| Transportation & Warehousing | 0 (0.0%) | 0 (0.0%) |
| Utilities | 0 (0.0%) | 0 (0.0%) |
| Information | 0 (0.0%) | 0 (0.0%) |
| Finance & Insurance | 0 (0.0%) | 0 (0.0%) |
| Real Estate, Rental & Leasing | 0 (0.0%) | 0 (0.0%) |
| Professional & Scientific | 0 (0.0%) | 0 (0.0%) |
| Enterprise Management | 0 (0.0%) | 0 (0.0%) |
| Administrative & Support | 0 (0.0%) | 0 (0.0%) |
| Educational Services | 29 (72.5%) | 11 (27.5%) |
| Health Care & Social Assistance | 0 (0.0%) | 9 (100.0%) |
| Arts, Entertainment & Recreation | 0 (0.0%) | 0 (0.0%) |
| Accommodation & Food Services | 0 (0.0%) | 11 (100.0%) |
| Public Administration | 0 (0.0%) | 0 (0.0%) |
| Total | 114 (66.3%) | 58 (33.7%) |
Education in Davenport Center
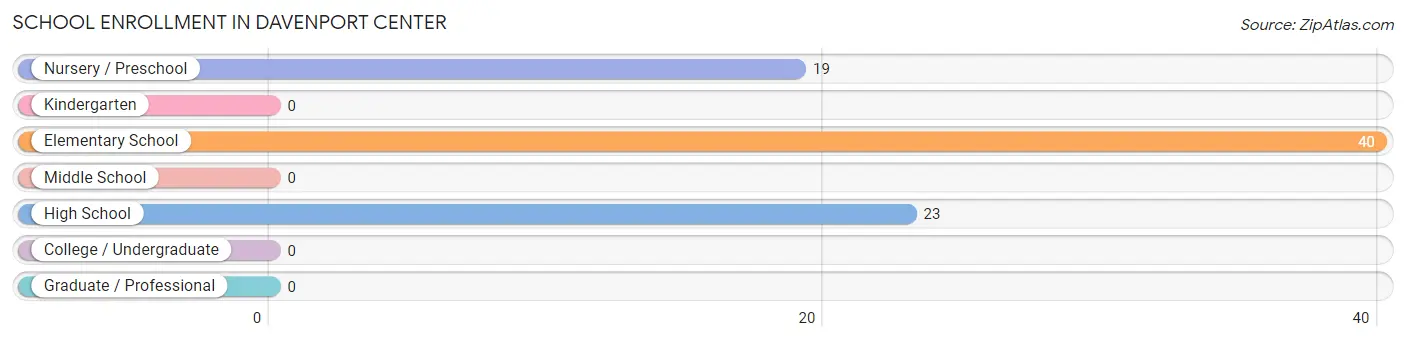
School Enrollment in Davenport Center
The most common levels of schooling among the 82 students in Davenport Center are elementary school (40 | 48.8%), high school (23 | 28.1%), and nursery / preschool (19 | 23.2%).
| School Level | # Students | % Students |
| Nursery / Preschool | 19 | 23.2% |
| Kindergarten | 0 | 0.0% |
| Elementary School | 40 | 48.8% |
| Middle School | 0 | 0.0% |
| High School | 23 | 28.1% |
| College / Undergraduate | 0 | 0.0% |
| Graduate / Professional | 0 | 0.0% |
| Total | 82 | 100.0% |
School Enrollment by Age by Funding Source in Davenport Center
Out of a total of 82 students who are enrolled in schools in Davenport Center, 17 (20.7%) attend a private institution, while the remaining 65 (79.3%) are enrolled in public schools. The age group of 5 to 9 year old has the highest likelihood of being enrolled in private schools, with 17 (42.5% in the age bracket) enrolled. Conversely, the age group of 3 to 4 year olds has the lowest likelihood of being enrolled in a private school, with 19 (100.0% in the age bracket) attending a public institution.
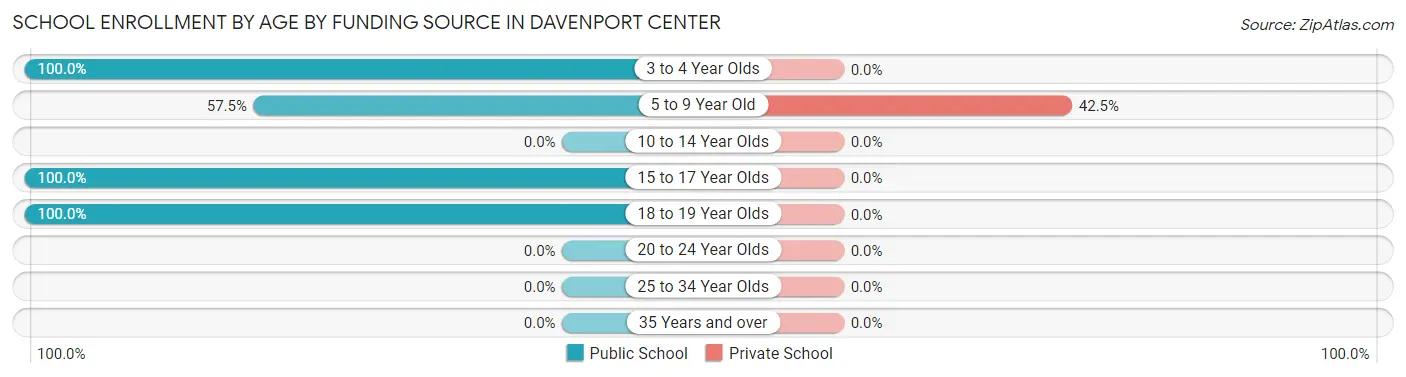
| Age Bracket | Public School | Private School |
| 3 to 4 Year Olds | 19 (100.0%) | 0 (0.0%) |
| 5 to 9 Year Old | 23 (57.5%) | 17 (42.5%) |
| 10 to 14 Year Olds | 0 (0.0%) | 0 (0.0%) |
| 15 to 17 Year Olds | 12 (100.0%) | 0 (0.0%) |
| 18 to 19 Year Olds | 11 (100.0%) | 0 (0.0%) |
| 20 to 24 Year Olds | 0 (0.0%) | 0 (0.0%) |
| 25 to 34 Year Olds | 0 (0.0%) | 0 (0.0%) |
| 35 Years and over | 0 (0.0%) | 0 (0.0%) |
| Total | 65 (79.3%) | 17 (20.7%) |
Educational Attainment by Field of Study in Davenport Center
Arts & humanities (27 | 33.8%), business (26 | 32.5%), social sciences (11 | 13.8%), bio, nature & agricultural (9 | 11.3%), and education (7 | 8.7%) are the most common fields of study among 80 individuals in Davenport Center who have obtained a bachelor's degree or higher.
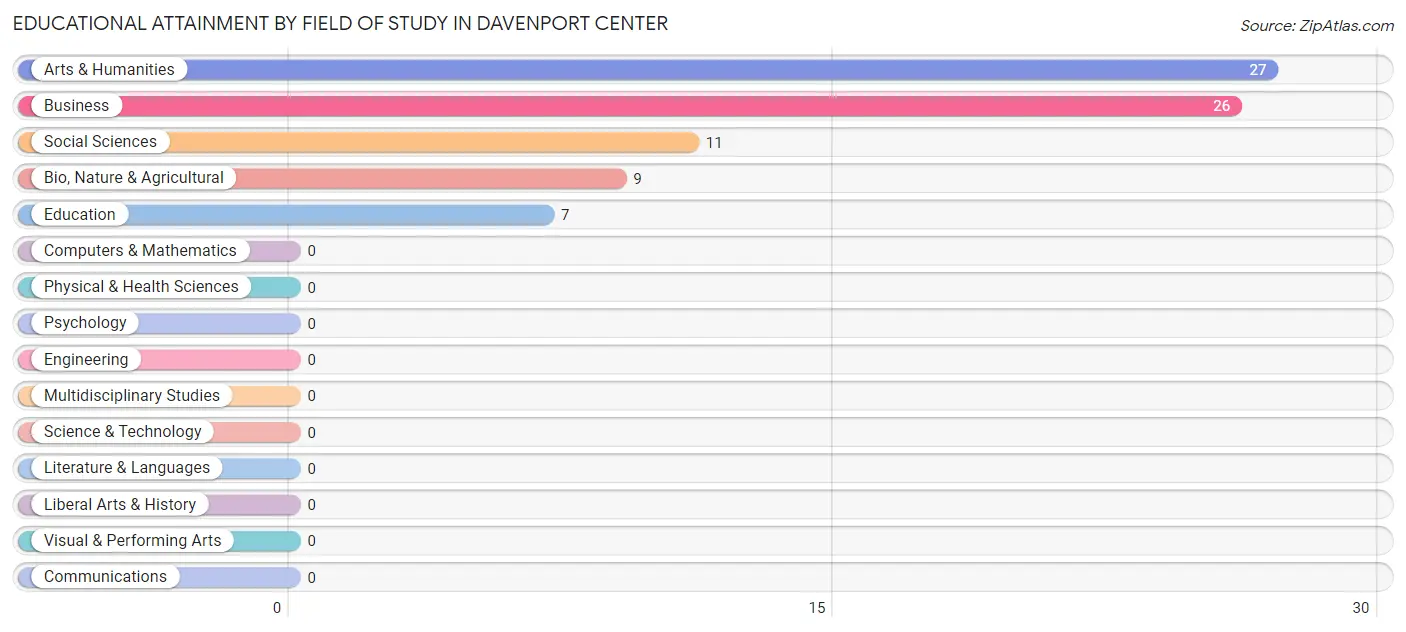
| Field of Study | # Graduates | % Graduates |
| Computers & Mathematics | 0 | 0.0% |
| Bio, Nature & Agricultural | 9 | 11.3% |
| Physical & Health Sciences | 0 | 0.0% |
| Psychology | 0 | 0.0% |
| Social Sciences | 11 | 13.8% |
| Engineering | 0 | 0.0% |
| Multidisciplinary Studies | 0 | 0.0% |
| Science & Technology | 0 | 0.0% |
| Business | 26 | 32.5% |
| Education | 7 | 8.7% |
| Literature & Languages | 0 | 0.0% |
| Liberal Arts & History | 0 | 0.0% |
| Visual & Performing Arts | 0 | 0.0% |
| Communications | 0 | 0.0% |
| Arts & Humanities | 27 | 33.8% |
| Total | 80 | 100.0% |
Transportation & Commute in Davenport Center
Vehicle Availability by Sex in Davenport Center
The most prevalent vehicle ownership categories in Davenport Center are males with 3 vehicles (69, accounting for 60.5%) and females with 3 vehicles (27, making up 119.0%).
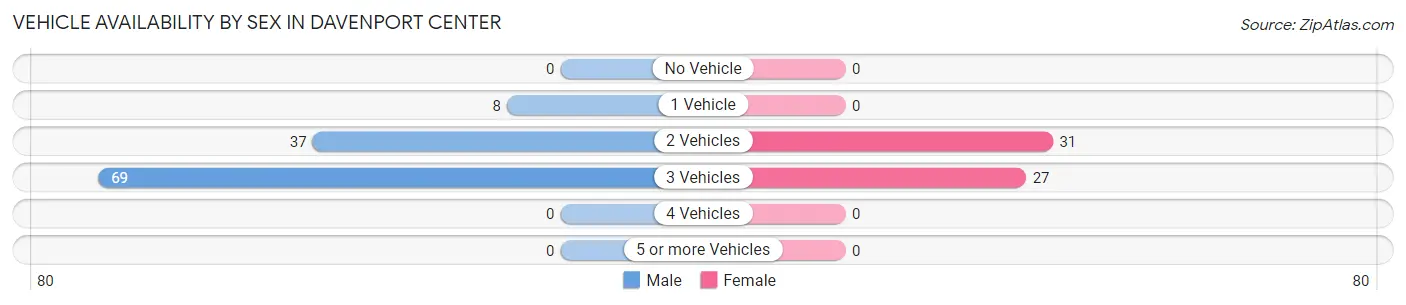
| Vehicles Available | Male | Female |
| No Vehicle | 0 (0.0%) | 0 (0.0%) |
| 1 Vehicle | 8 (7.0%) | 0 (0.0%) |
| 2 Vehicles | 37 (32.5%) | 31 (53.4%) |
| 3 Vehicles | 69 (60.5%) | 27 (46.6%) |
| 4 Vehicles | 0 (0.0%) | 0 (0.0%) |
| 5 or more Vehicles | 0 (0.0%) | 0 (0.0%) |
| Total | 114 (100.0%) | 58 (100.0%) |
Commute Time in Davenport Center
The most frequently occuring commute durations in Davenport Center are 30 to 34 minutes (44 commuters, 25.6%), 60 to 89 minutes (43 commuters, 25.0%), and 90 or more minutes (27 commuters, 15.7%).
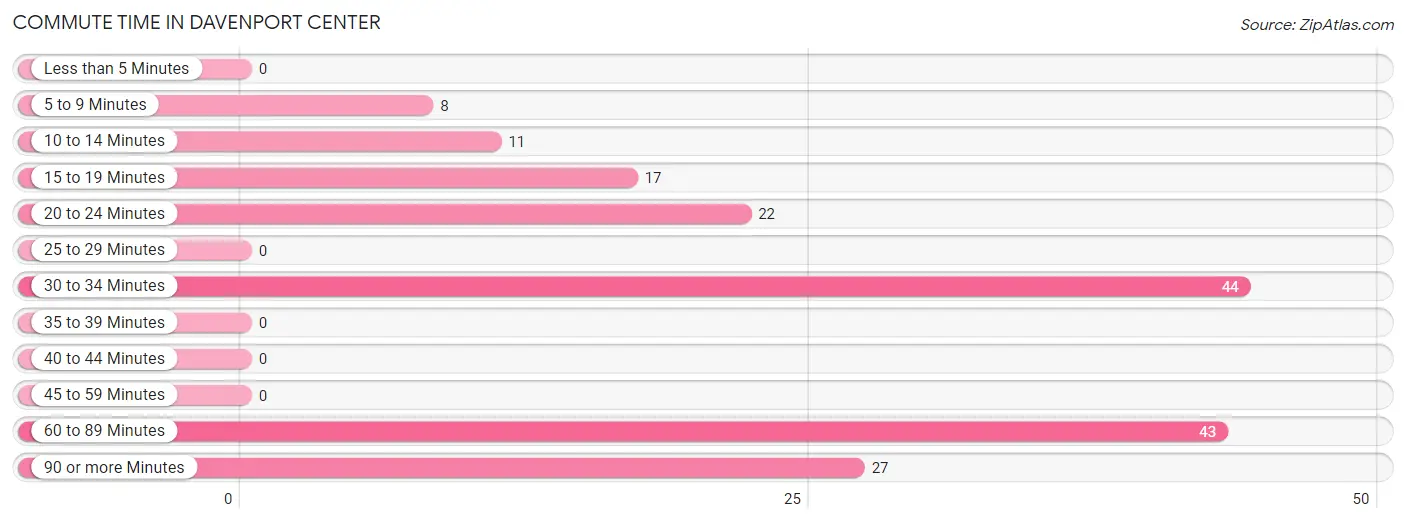
| Commute Time | # Commuters | % Commuters |
| Less than 5 Minutes | 0 | 0.0% |
| 5 to 9 Minutes | 8 | 4.6% |
| 10 to 14 Minutes | 11 | 6.4% |
| 15 to 19 Minutes | 17 | 9.9% |
| 20 to 24 Minutes | 22 | 12.8% |
| 25 to 29 Minutes | 0 | 0.0% |
| 30 to 34 Minutes | 44 | 25.6% |
| 35 to 39 Minutes | 0 | 0.0% |
| 40 to 44 Minutes | 0 | 0.0% |
| 45 to 59 Minutes | 0 | 0.0% |
| 60 to 89 Minutes | 43 | 25.0% |
| 90 or more Minutes | 27 | 15.7% |
Commute Time by Sex in Davenport Center
The most common commute times in Davenport Center are 30 to 34 minutes (44 commuters, 38.6%) for males and 90 or more minutes (27 commuters, 46.6%) for females.
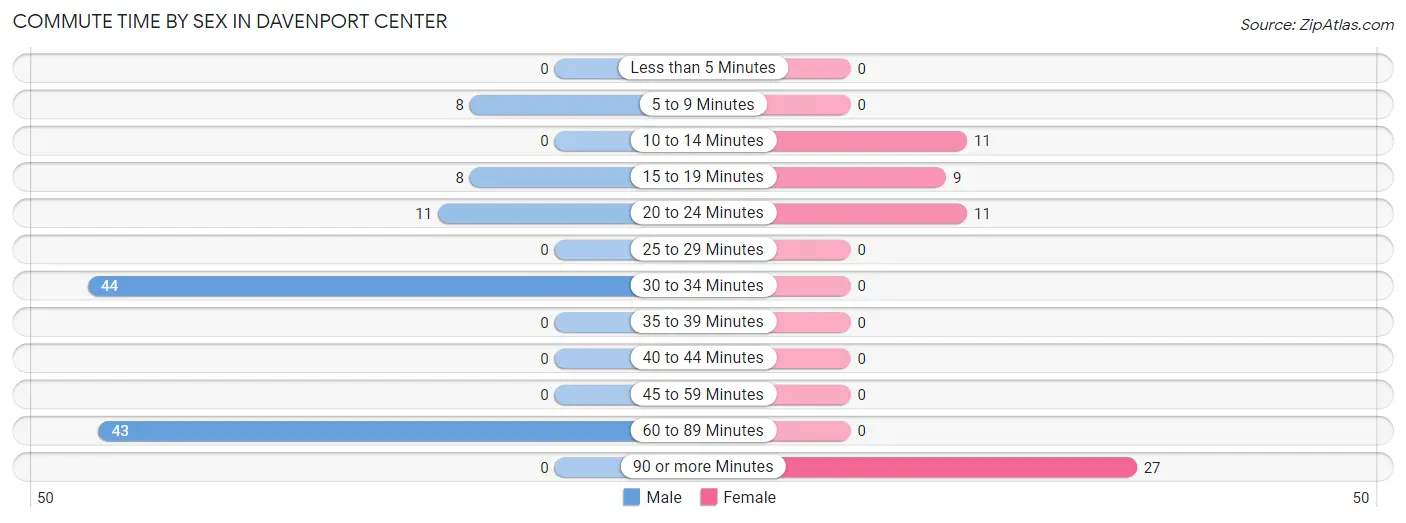
| Commute Time | Male | Female |
| Less than 5 Minutes | 0 (0.0%) | 0 (0.0%) |
| 5 to 9 Minutes | 8 (7.0%) | 0 (0.0%) |
| 10 to 14 Minutes | 0 (0.0%) | 11 (19.0%) |
| 15 to 19 Minutes | 8 (7.0%) | 9 (15.5%) |
| 20 to 24 Minutes | 11 (9.7%) | 11 (19.0%) |
| 25 to 29 Minutes | 0 (0.0%) | 0 (0.0%) |
| 30 to 34 Minutes | 44 (38.6%) | 0 (0.0%) |
| 35 to 39 Minutes | 0 (0.0%) | 0 (0.0%) |
| 40 to 44 Minutes | 0 (0.0%) | 0 (0.0%) |
| 45 to 59 Minutes | 0 (0.0%) | 0 (0.0%) |
| 60 to 89 Minutes | 43 (37.7%) | 0 (0.0%) |
| 90 or more Minutes | 0 (0.0%) | 27 (46.6%) |
Time of Departure to Work by Sex in Davenport Center
The most frequent times of departure to work in Davenport Center are 5:30 AM to 5:59 AM (44, 38.6%) for males and 7:30 AM to 7:59 AM (36, 62.1%) for females.
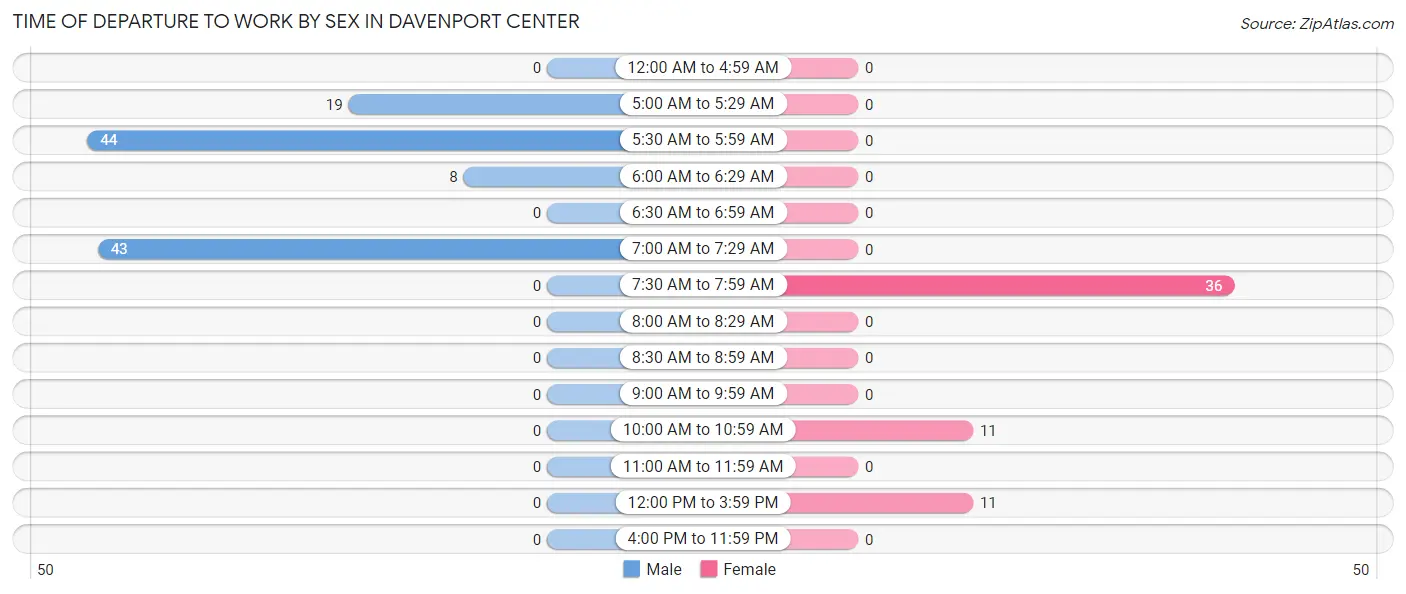
| Time of Departure | Male | Female |
| 12:00 AM to 4:59 AM | 0 (0.0%) | 0 (0.0%) |
| 5:00 AM to 5:29 AM | 19 (16.7%) | 0 (0.0%) |
| 5:30 AM to 5:59 AM | 44 (38.6%) | 0 (0.0%) |
| 6:00 AM to 6:29 AM | 8 (7.0%) | 0 (0.0%) |
| 6:30 AM to 6:59 AM | 0 (0.0%) | 0 (0.0%) |
| 7:00 AM to 7:29 AM | 43 (37.7%) | 0 (0.0%) |
| 7:30 AM to 7:59 AM | 0 (0.0%) | 36 (62.1%) |
| 8:00 AM to 8:29 AM | 0 (0.0%) | 0 (0.0%) |
| 8:30 AM to 8:59 AM | 0 (0.0%) | 0 (0.0%) |
| 9:00 AM to 9:59 AM | 0 (0.0%) | 0 (0.0%) |
| 10:00 AM to 10:59 AM | 0 (0.0%) | 11 (19.0%) |
| 11:00 AM to 11:59 AM | 0 (0.0%) | 0 (0.0%) |
| 12:00 PM to 3:59 PM | 0 (0.0%) | 11 (19.0%) |
| 4:00 PM to 11:59 PM | 0 (0.0%) | 0 (0.0%) |
| Total | 114 (100.0%) | 58 (100.0%) |
Housing Occupancy in Davenport Center
Occupancy by Ownership in Davenport Center
Of the total 202 dwellings in Davenport Center, owner-occupied units account for 202 (100.0%), while renter-occupied units make up 0 (0.0%).
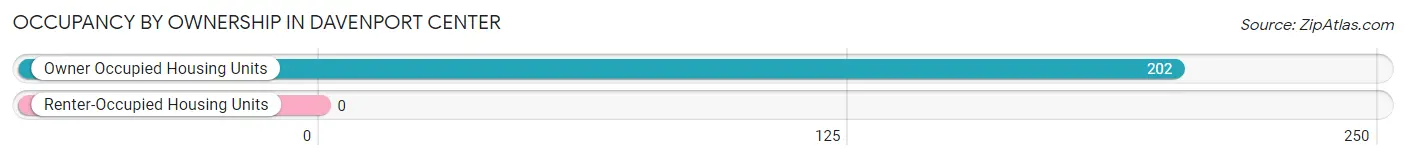
| Occupancy | # Housing Units | % Housing Units |
| Owner Occupied Housing Units | 202 | 100.0% |
| Renter-Occupied Housing Units | 0 | 0.0% |
| Total Occupied Housing Units | 202 | 100.0% |
Occupancy by Household Size in Davenport Center
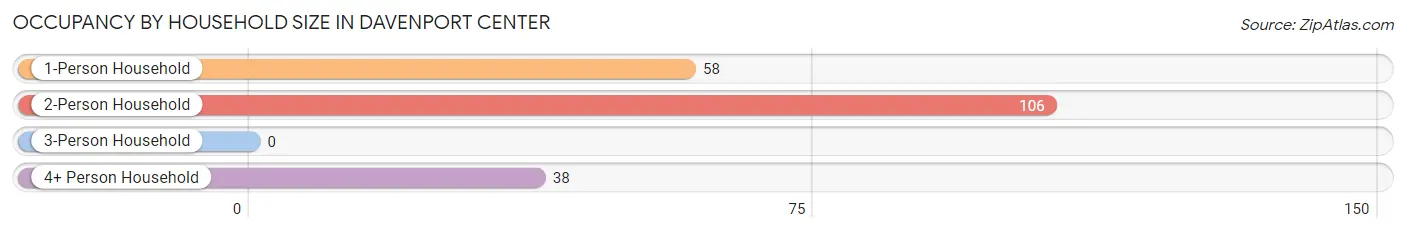
| Household Size | # Housing Units | % Housing Units |
| 1-Person Household | 58 | 28.7% |
| 2-Person Household | 106 | 52.5% |
| 3-Person Household | 0 | 0.0% |
| 4+ Person Household | 38 | 18.8% |
| Total Housing Units | 202 | 100.0% |
Occupancy by Ownership by Household Size in Davenport Center
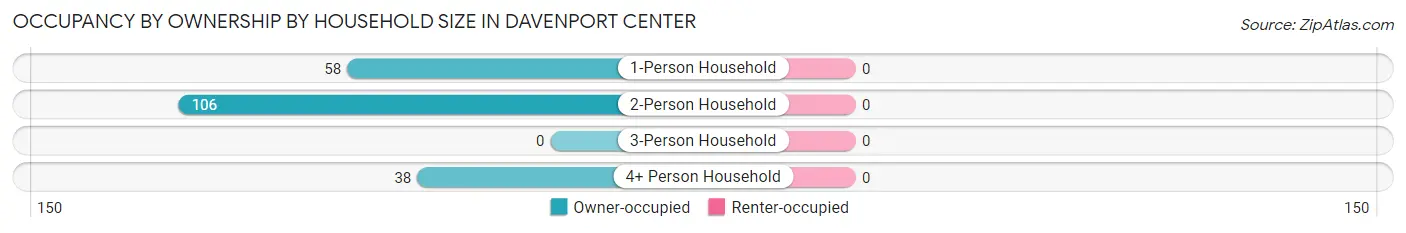
| Household Size | Owner-occupied | Renter-occupied |
| 1-Person Household | 58 (100.0%) | 0 (0.0%) |
| 2-Person Household | 106 (100.0%) | 0 (0.0%) |
| 3-Person Household | 0 (0.0%) | 0 (0.0%) |
| 4+ Person Household | 38 (100.0%) | 0 (0.0%) |
| Total Housing Units | 202 (100.0%) | 0 (0.0%) |
Occupancy by Educational Attainment in Davenport Center
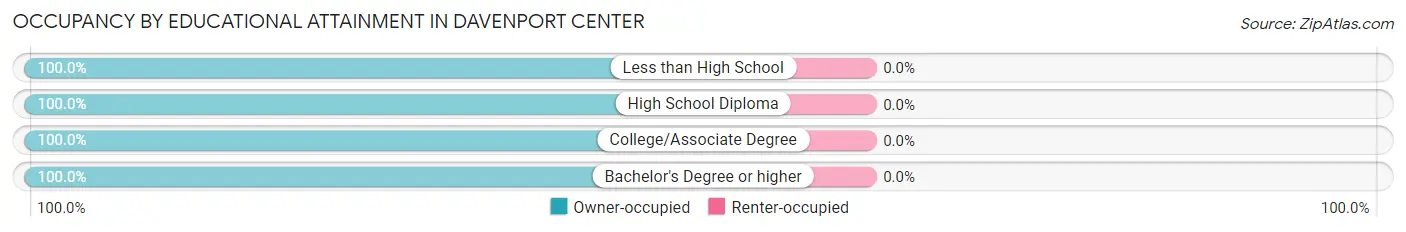
| Household Size | Owner-occupied | Renter-occupied |
| Less than High School | 43 (100.0%) | 0 (0.0%) |
| High School Diploma | 71 (100.0%) | 0 (0.0%) |
| College/Associate Degree | 43 (100.0%) | 0 (0.0%) |
| Bachelor's Degree or higher | 45 (100.0%) | 0 (0.0%) |
Occupancy by Age of Householder in Davenport Center
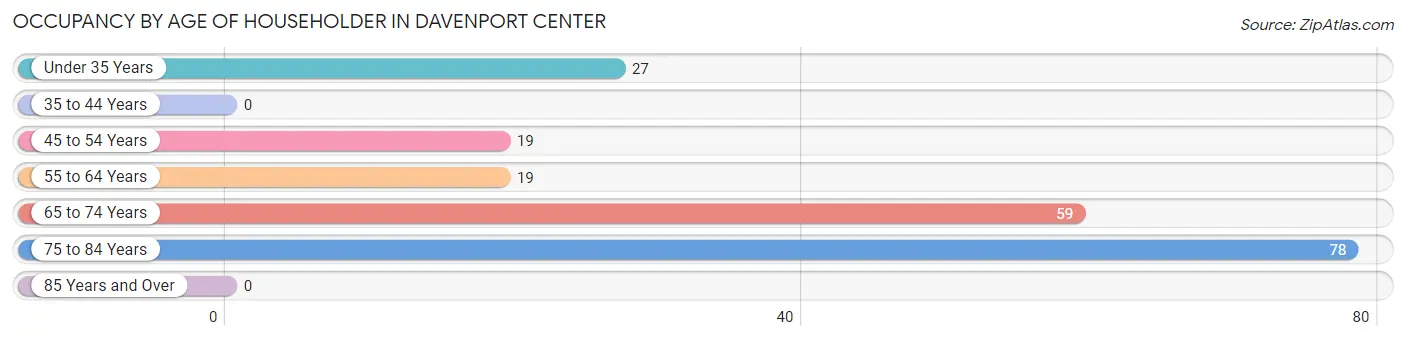
| Age Bracket | # Households | % Households |
| Under 35 Years | 27 | 13.4% |
| 35 to 44 Years | 0 | 0.0% |
| 45 to 54 Years | 19 | 9.4% |
| 55 to 64 Years | 19 | 9.4% |
| 65 to 74 Years | 59 | 29.2% |
| 75 to 84 Years | 78 | 38.6% |
| 85 Years and Over | 0 | 0.0% |
| Total | 202 | 100.0% |
Housing Finances in Davenport Center
Median Income by Occupancy in Davenport Center
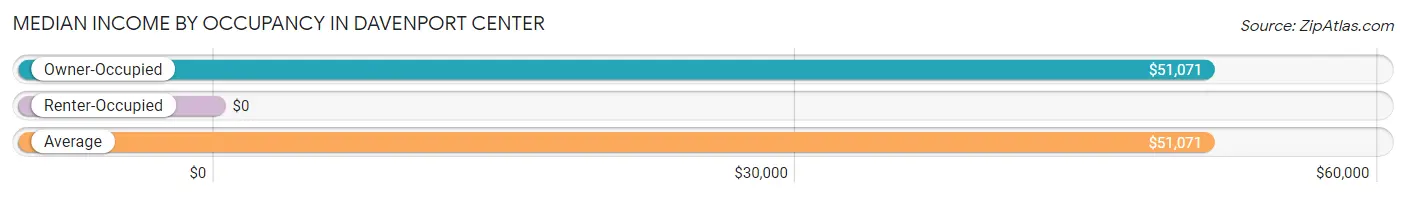
| Occupancy Type | # Households | Median Income |
| Owner-Occupied | 202 (100.0%) | $51,071 |
| Renter-Occupied | 0 (0.0%) | $0 |
| Average | 202 (100.0%) | $51,071 |
Occupancy by Householder Income Bracket in Davenport Center
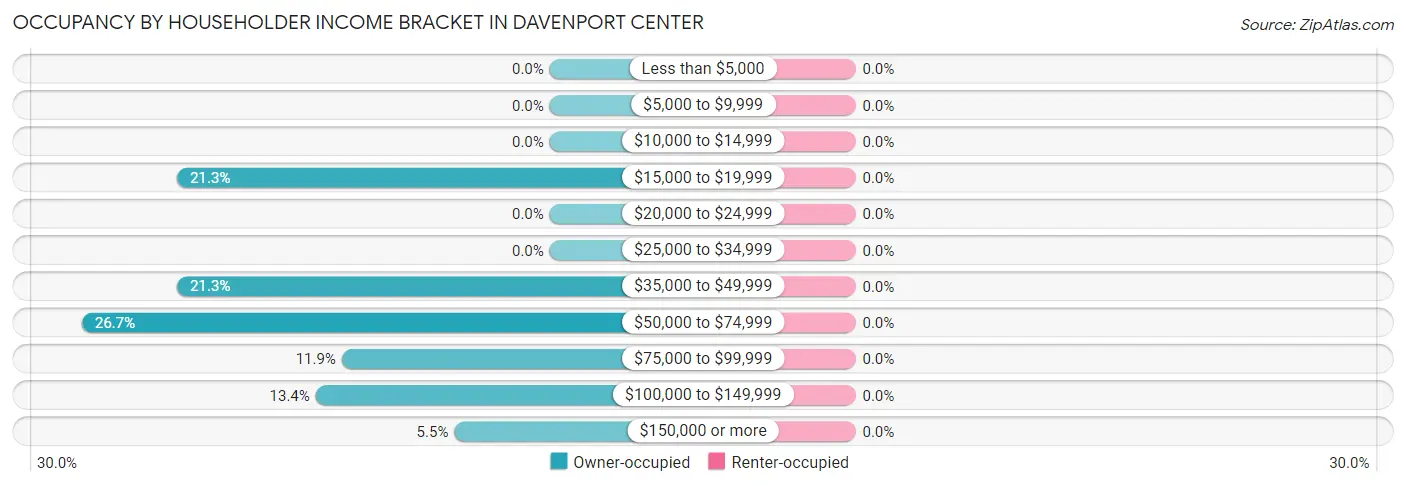
| Income Bracket | Owner-occupied | Renter-occupied |
| Less than $5,000 | 0 (0.0%) | 0 (0.0%) |
| $5,000 to $9,999 | 0 (0.0%) | 0 (0.0%) |
| $10,000 to $14,999 | 0 (0.0%) | 0 (0.0%) |
| $15,000 to $19,999 | 43 (21.3%) | 0 (0.0%) |
| $20,000 to $24,999 | 0 (0.0%) | 0 (0.0%) |
| $25,000 to $34,999 | 0 (0.0%) | 0 (0.0%) |
| $35,000 to $49,999 | 43 (21.3%) | 0 (0.0%) |
| $50,000 to $74,999 | 54 (26.7%) | 0 (0.0%) |
| $75,000 to $99,999 | 24 (11.9%) | 0 (0.0%) |
| $100,000 to $149,999 | 27 (13.4%) | 0 (0.0%) |
| $150,000 or more | 11 (5.4%) | 0 (0.0%) |
| Total | 202 (100.0%) | 0 (0.0%) |
Monthly Housing Cost Tiers in Davenport Center
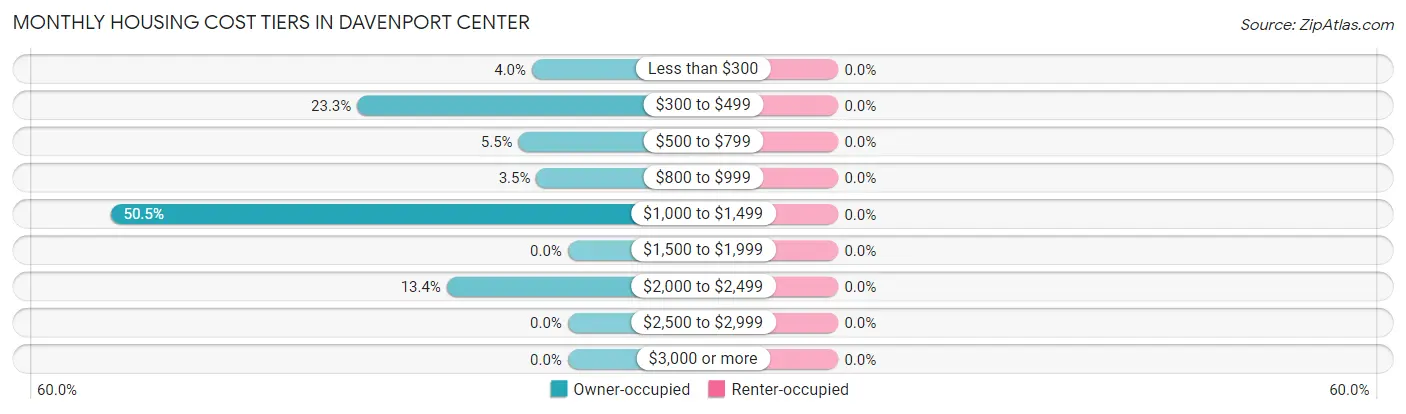
| Monthly Cost | Owner-occupied | Renter-occupied |
| Less than $300 | 8 (4.0%) | 0 (0.0%) |
| $300 to $499 | 47 (23.3%) | 0 (0.0%) |
| $500 to $799 | 11 (5.4%) | 0 (0.0%) |
| $800 to $999 | 7 (3.5%) | 0 (0.0%) |
| $1,000 to $1,499 | 102 (50.5%) | 0 (0.0%) |
| $1,500 to $1,999 | 0 (0.0%) | 0 (0.0%) |
| $2,000 to $2,499 | 27 (13.4%) | 0 (0.0%) |
| $2,500 to $2,999 | 0 (0.0%) | 0 (0.0%) |
| $3,000 or more | 0 (0.0%) | 0 (0.0%) |
| Total | 202 (100.0%) | 0 (0.0%) |
Physical Housing Characteristics in Davenport Center
Housing Structures in Davenport Center
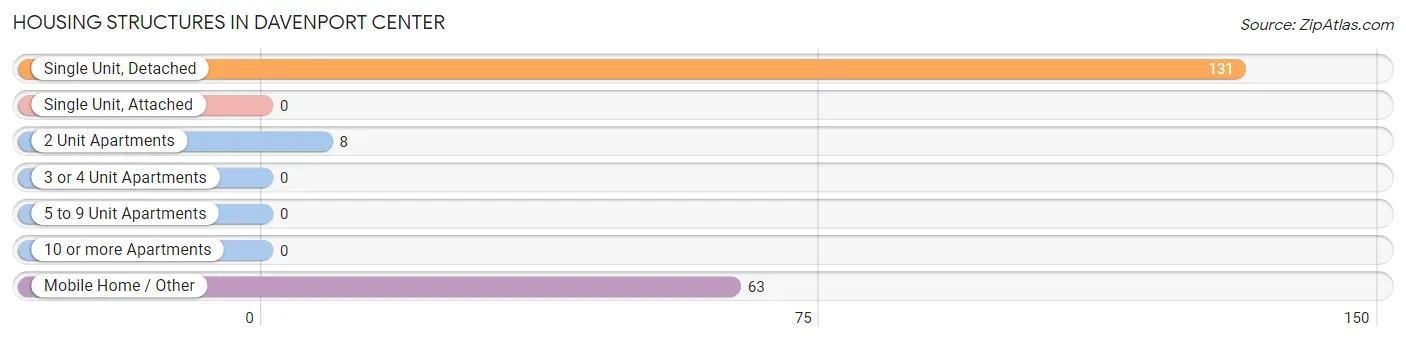
| Structure Type | # Housing Units | % Housing Units |
| Single Unit, Detached | 131 | 64.8% |
| Single Unit, Attached | 0 | 0.0% |
| 2 Unit Apartments | 8 | 4.0% |
| 3 or 4 Unit Apartments | 0 | 0.0% |
| 5 to 9 Unit Apartments | 0 | 0.0% |
| 10 or more Apartments | 0 | 0.0% |
| Mobile Home / Other | 63 | 31.2% |
| Total | 202 | 100.0% |
Housing Structures by Occupancy in Davenport Center
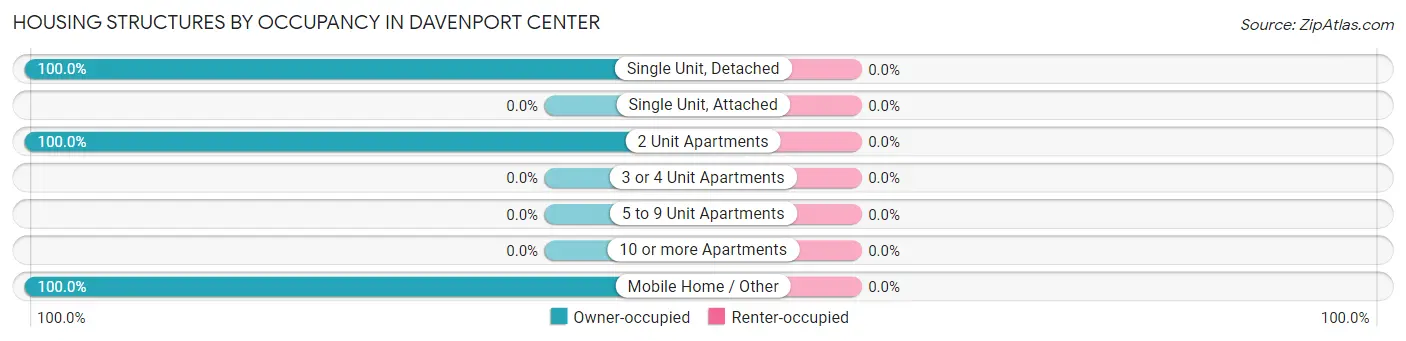
| Structure Type | Owner-occupied | Renter-occupied |
| Single Unit, Detached | 131 (100.0%) | 0 (0.0%) |
| Single Unit, Attached | 0 (0.0%) | 0 (0.0%) |
| 2 Unit Apartments | 8 (100.0%) | 0 (0.0%) |
| 3 or 4 Unit Apartments | 0 (0.0%) | 0 (0.0%) |
| 5 to 9 Unit Apartments | 0 (0.0%) | 0 (0.0%) |
| 10 or more Apartments | 0 (0.0%) | 0 (0.0%) |
| Mobile Home / Other | 63 (100.0%) | 0 (0.0%) |
| Total | 202 (100.0%) | 0 (0.0%) |
Housing Structures by Number of Rooms in Davenport Center
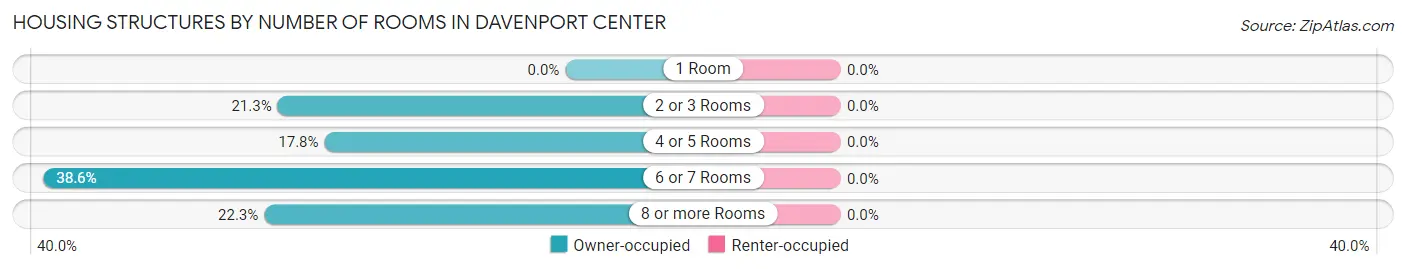
| Number of Rooms | Owner-occupied | Renter-occupied |
| 1 Room | 0 (0.0%) | 0 (0.0%) |
| 2 or 3 Rooms | 43 (21.3%) | 0 (0.0%) |
| 4 or 5 Rooms | 36 (17.8%) | 0 (0.0%) |
| 6 or 7 Rooms | 78 (38.6%) | 0 (0.0%) |
| 8 or more Rooms | 45 (22.3%) | 0 (0.0%) |
| Total | 202 (100.0%) | 0 (0.0%) |
Housing Structure by Heating Type in Davenport Center
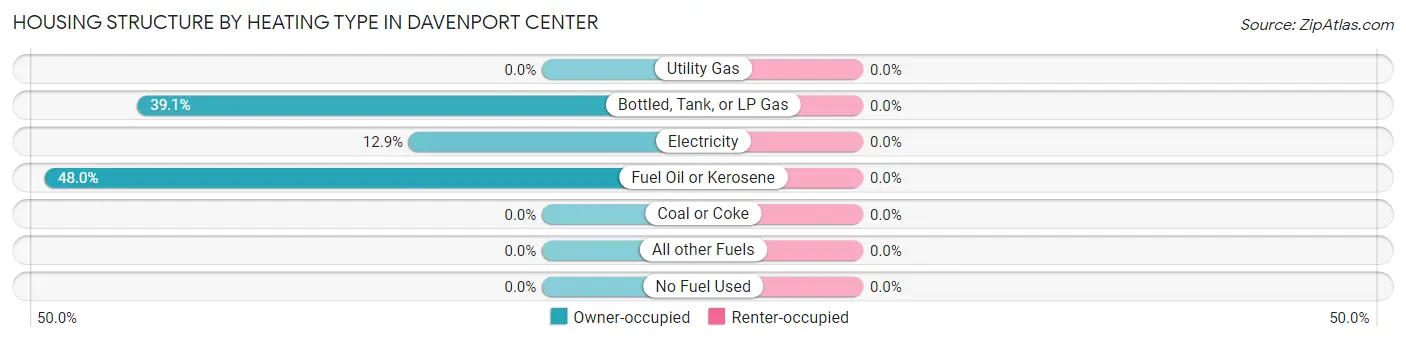
| Heating Type | Owner-occupied | Renter-occupied |
| Utility Gas | 0 (0.0%) | 0 (0.0%) |
| Bottled, Tank, or LP Gas | 79 (39.1%) | 0 (0.0%) |
| Electricity | 26 (12.9%) | 0 (0.0%) |
| Fuel Oil or Kerosene | 97 (48.0%) | 0 (0.0%) |
| Coal or Coke | 0 (0.0%) | 0 (0.0%) |
| All other Fuels | 0 (0.0%) | 0 (0.0%) |
| No Fuel Used | 0 (0.0%) | 0 (0.0%) |
| Total | 202 (100.0%) | 0 (0.0%) |
Household Vehicle Usage in Davenport Center
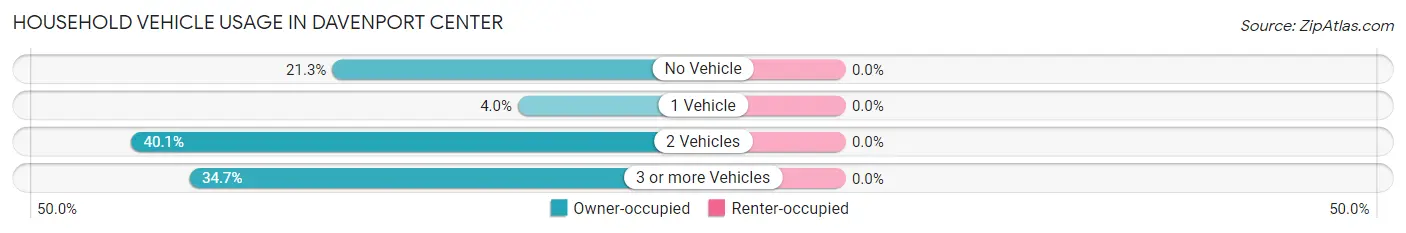
| Vehicles per Household | Owner-occupied | Renter-occupied |
| No Vehicle | 43 (21.3%) | 0 (0.0%) |
| 1 Vehicle | 8 (4.0%) | 0 (0.0%) |
| 2 Vehicles | 81 (40.1%) | 0 (0.0%) |
| 3 or more Vehicles | 70 (34.6%) | 0 (0.0%) |
| Total | 202 (100.0%) | 0 (0.0%) |
Real Estate & Mortgages in Davenport Center
Real Estate and Mortgage Overview in Davenport Center
| Characteristic | Without Mortgage | With Mortgage |
| Housing Units | 73 | 129 |
| Median Property Value | - | - |
| Median Household Income | $67,697 | $0 |
| Monthly Housing Costs | $380 | $0 |
| Real Estate Taxes | $1,742 | $0 |
Property Value by Mortgage Status in Davenport Center
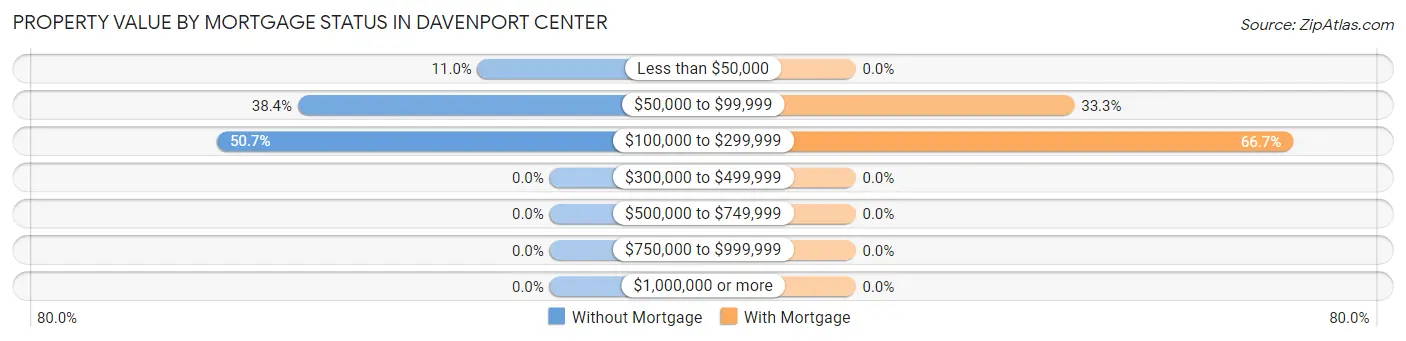
| Property Value | Without Mortgage | With Mortgage |
| Less than $50,000 | 8 (11.0%) | 0 (0.0%) |
| $50,000 to $99,999 | 28 (38.4%) | 43 (33.3%) |
| $100,000 to $299,999 | 37 (50.7%) | 86 (66.7%) |
| $300,000 to $499,999 | 0 (0.0%) | 0 (0.0%) |
| $500,000 to $749,999 | 0 (0.0%) | 0 (0.0%) |
| $750,000 to $999,999 | 0 (0.0%) | 0 (0.0%) |
| $1,000,000 or more | 0 (0.0%) | 0 (0.0%) |
| Total | 73 (100.0%) | 129 (100.0%) |
Household Income by Mortgage Status in Davenport Center
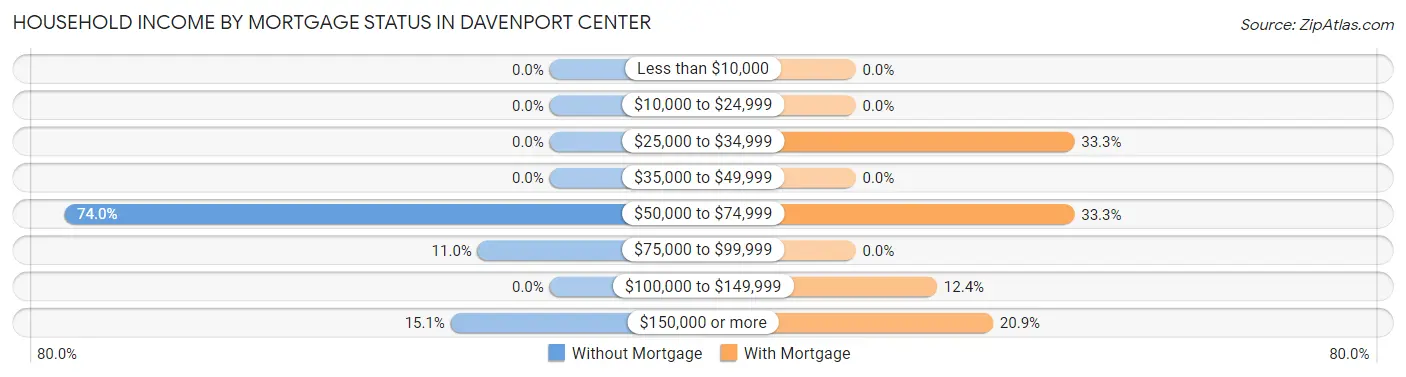
| Household Income | Without Mortgage | With Mortgage |
| Less than $10,000 | 0 (0.0%) | 0 (0.0%) |
| $10,000 to $24,999 | 0 (0.0%) | 0 (0.0%) |
| $25,000 to $34,999 | 0 (0.0%) | 43 (33.3%) |
| $35,000 to $49,999 | 0 (0.0%) | 0 (0.0%) |
| $50,000 to $74,999 | 54 (74.0%) | 43 (33.3%) |
| $75,000 to $99,999 | 8 (11.0%) | 0 (0.0%) |
| $100,000 to $149,999 | 0 (0.0%) | 16 (12.4%) |
| $150,000 or more | 11 (15.1%) | 27 (20.9%) |
| Total | 73 (100.0%) | 129 (100.0%) |
Property Value to Household Income Ratio in Davenport Center
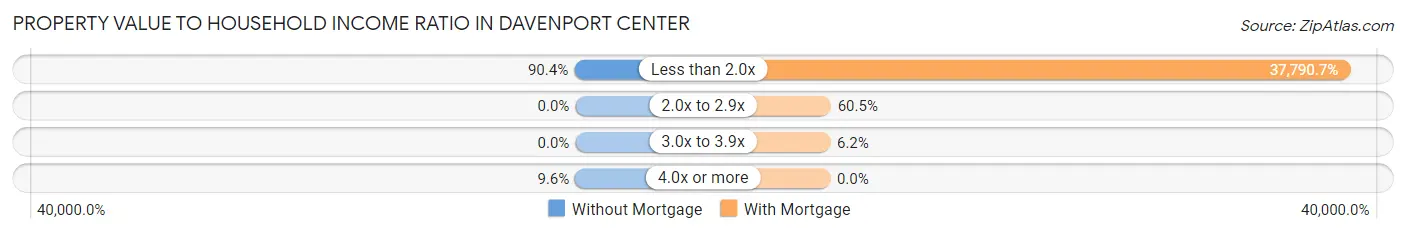
| Value-to-Income Ratio | Without Mortgage | With Mortgage |
| Less than 2.0x | 66 (90.4%) | 48,750 (37,790.7%) |
| 2.0x to 2.9x | 0 (0.0%) | 78 (60.5%) |
| 3.0x to 3.9x | 0 (0.0%) | 8 (6.2%) |
| 4.0x or more | 7 (9.6%) | 0 (0.0%) |
| Total | 73 (100.0%) | 129 (100.0%) |
Real Estate Taxes by Mortgage Status in Davenport Center
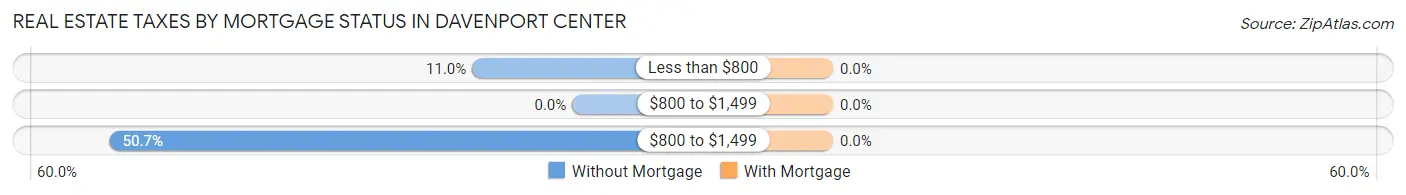
| Property Taxes | Without Mortgage | With Mortgage |
| Less than $800 | 8 (11.0%) | 0 (0.0%) |
| $800 to $1,499 | 0 (0.0%) | 0 (0.0%) |
| $800 to $1,499 | 37 (50.7%) | 0 (0.0%) |
| Total | 73 (100.0%) | 129 (100.0%) |
Health & Disability in Davenport Center
Health Insurance Coverage by Age in Davenport Center
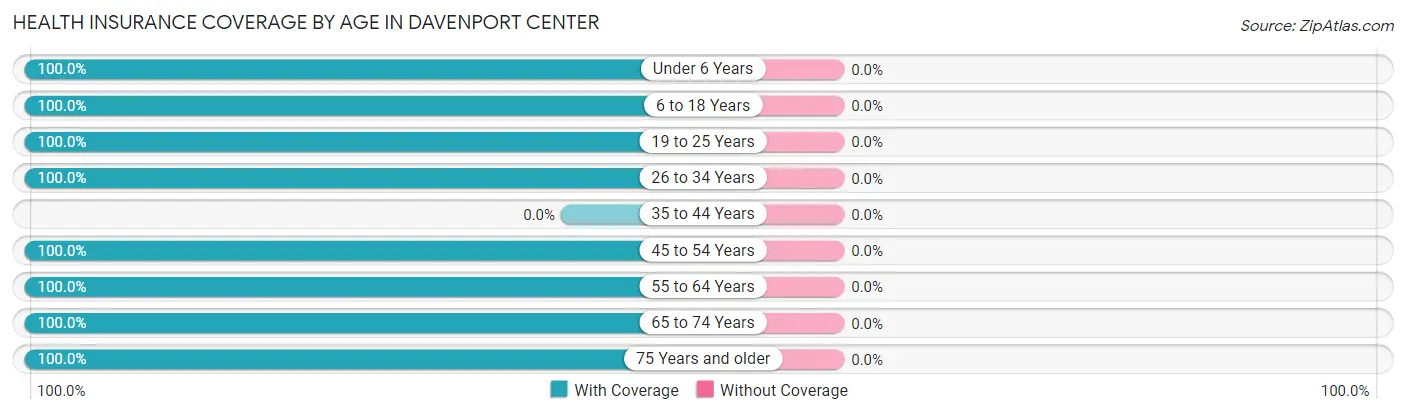
| Age Bracket | With Coverage | Without Coverage |
| Under 6 Years | 58 (100.0%) | 0 (0.0%) |
| 6 to 18 Years | 63 (100.0%) | 0 (0.0%) |
| 19 to 25 Years | 11 (100.0%) | 0 (0.0%) |
| 26 to 34 Years | 118 (100.0%) | 0 (0.0%) |
| 35 to 44 Years | 0 (0.0%) | 0 (0.0%) |
| 45 to 54 Years | 28 (100.0%) | 0 (0.0%) |
| 55 to 64 Years | 46 (100.0%) | 0 (0.0%) |
| 65 to 74 Years | 87 (100.0%) | 0 (0.0%) |
| 75 Years and older | 78 (100.0%) | 0 (0.0%) |
| Total | 489 (100.0%) | 0 (0.0%) |
Health Insurance Coverage by Citizenship Status in Davenport Center
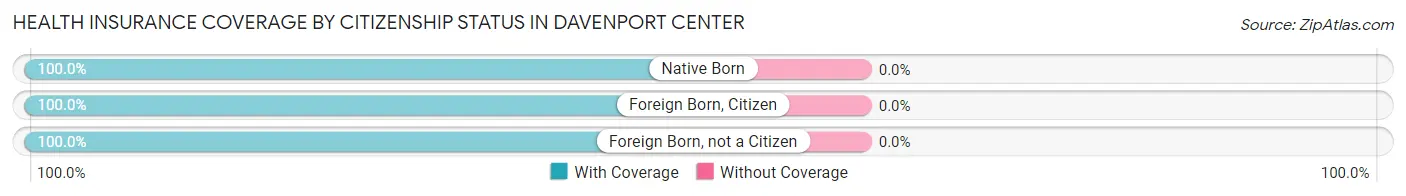
| Citizenship Status | With Coverage | Without Coverage |
| Native Born | 58 (100.0%) | 0 (0.0%) |
| Foreign Born, Citizen | 63 (100.0%) | 0 (0.0%) |
| Foreign Born, not a Citizen | 11 (100.0%) | 0 (0.0%) |
Health Insurance Coverage by Household Income in Davenport Center
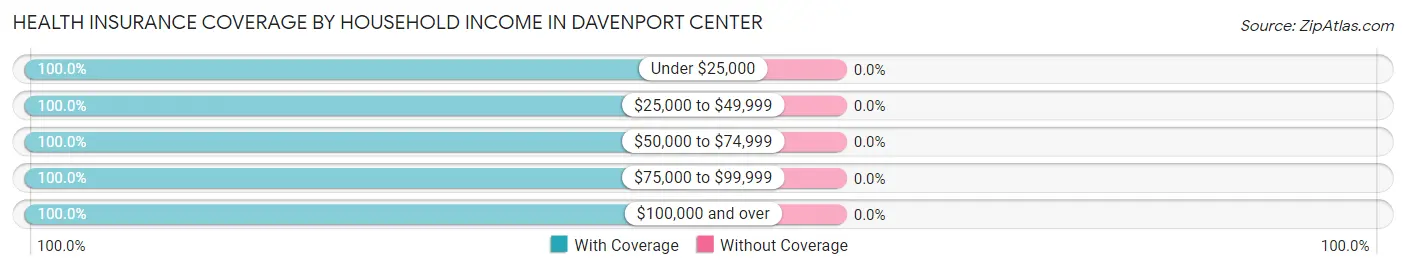
| Household Income | With Coverage | Without Coverage |
| Under $25,000 | 43 (100.0%) | 0 (0.0%) |
| $25,000 to $49,999 | 108 (100.0%) | 0 (0.0%) |
| $50,000 to $74,999 | 100 (100.0%) | 0 (0.0%) |
| $75,000 to $99,999 | 44 (100.0%) | 0 (0.0%) |
| $100,000 and over | 194 (100.0%) | 0 (0.0%) |
Public vs Private Health Insurance Coverage by Age in Davenport Center
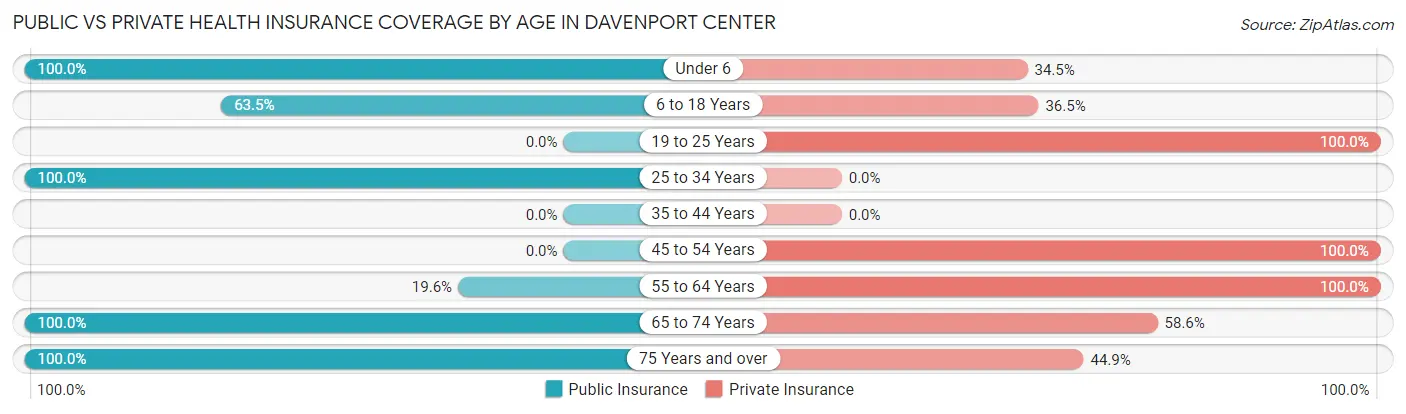
| Age Bracket | Public Insurance | Private Insurance |
| Under 6 | 58 (100.0%) | 20 (34.5%) |
| 6 to 18 Years | 40 (63.5%) | 23 (36.5%) |
| 19 to 25 Years | 0 (0.0%) | 11 (100.0%) |
| 25 to 34 Years | 118 (100.0%) | 0 (0.0%) |
| 35 to 44 Years | 0 (0.0%) | 0 (0.0%) |
| 45 to 54 Years | 0 (0.0%) | 28 (100.0%) |
| 55 to 64 Years | 9 (19.6%) | 46 (100.0%) |
| 65 to 74 Years | 87 (100.0%) | 51 (58.6%) |
| 75 Years and over | 78 (100.0%) | 35 (44.9%) |
| Total | 390 (79.7%) | 214 (43.8%) |
Disability Status by Sex by Age in Davenport Center
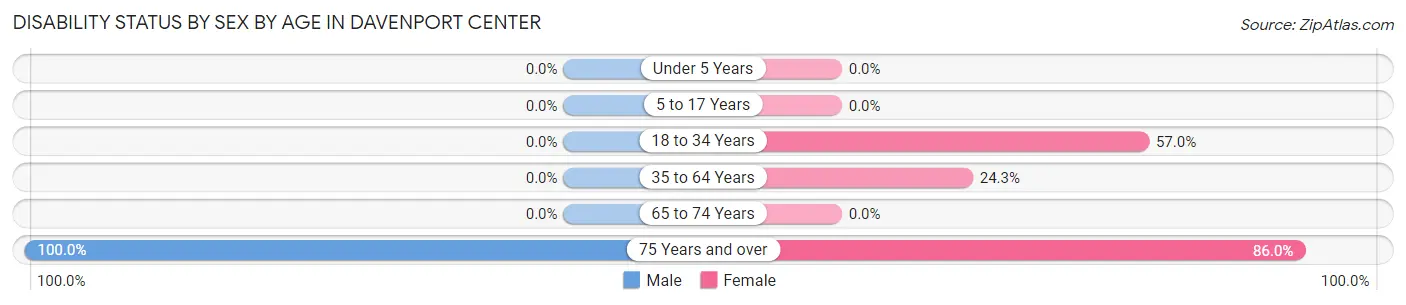
| Age Bracket | Male | Female |
| Under 5 Years | 0 (0.0%) | 0 (0.0%) |
| 5 to 17 Years | 0 (0.0%) | 0 (0.0%) |
| 18 to 34 Years | 0 (0.0%) | 65 (57.0%) |
| 35 to 64 Years | 0 (0.0%) | 9 (24.3%) |
| 65 to 74 Years | 0 (0.0%) | 0 (0.0%) |
| 75 Years and over | 28 (100.0%) | 43 (86.0%) |
Disability Class by Sex by Age in Davenport Center
Disability Class: Hearing Difficulty
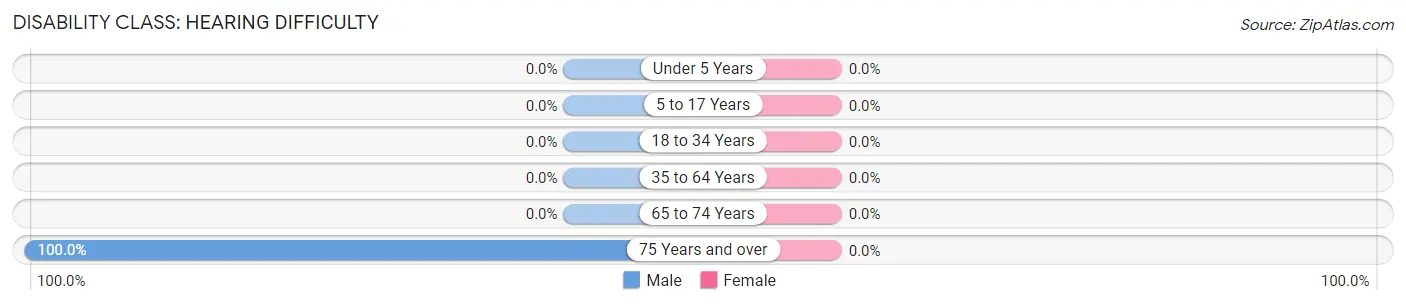
| Age Bracket | Male | Female |
| Under 5 Years | 0 (0.0%) | 0 (0.0%) |
| 5 to 17 Years | 0 (0.0%) | 0 (0.0%) |
| 18 to 34 Years | 0 (0.0%) | 0 (0.0%) |
| 35 to 64 Years | 0 (0.0%) | 0 (0.0%) |
| 65 to 74 Years | 0 (0.0%) | 0 (0.0%) |
| 75 Years and over | 28 (100.0%) | 0 (0.0%) |
Disability Class: Vision Difficulty
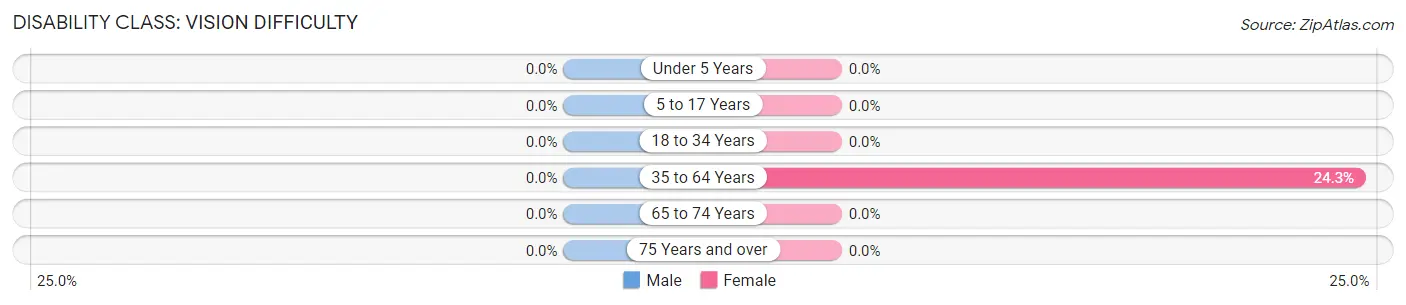
| Age Bracket | Male | Female |
| Under 5 Years | 0 (0.0%) | 0 (0.0%) |
| 5 to 17 Years | 0 (0.0%) | 0 (0.0%) |
| 18 to 34 Years | 0 (0.0%) | 0 (0.0%) |
| 35 to 64 Years | 0 (0.0%) | 9 (24.3%) |
| 65 to 74 Years | 0 (0.0%) | 0 (0.0%) |
| 75 Years and over | 0 (0.0%) | 0 (0.0%) |
Disability Class: Cognitive Difficulty
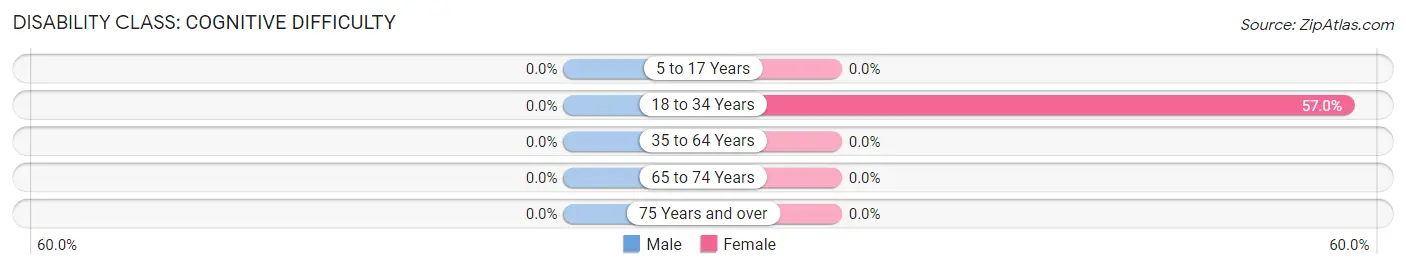
| Age Bracket | Male | Female |
| 5 to 17 Years | 0 (0.0%) | 0 (0.0%) |
| 18 to 34 Years | 0 (0.0%) | 65 (57.0%) |
| 35 to 64 Years | 0 (0.0%) | 0 (0.0%) |
| 65 to 74 Years | 0 (0.0%) | 0 (0.0%) |
| 75 Years and over | 0 (0.0%) | 0 (0.0%) |
Disability Class: Ambulatory Difficulty
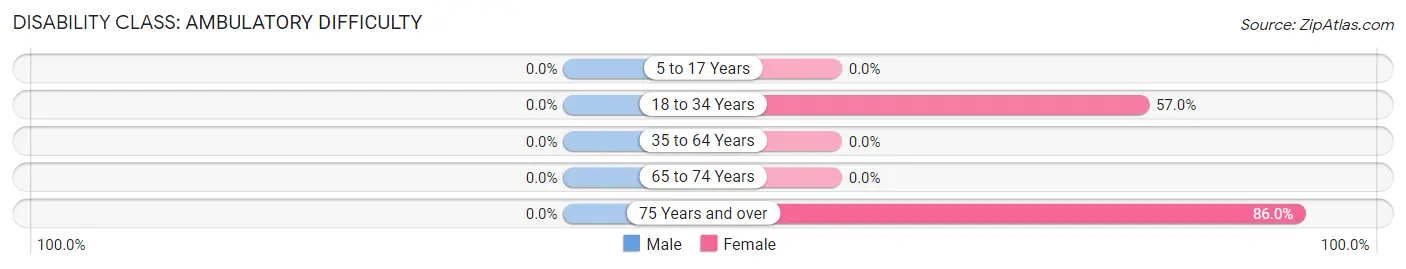
| Age Bracket | Male | Female |
| 5 to 17 Years | 0 (0.0%) | 0 (0.0%) |
| 18 to 34 Years | 0 (0.0%) | 65 (57.0%) |
| 35 to 64 Years | 0 (0.0%) | 0 (0.0%) |
| 65 to 74 Years | 0 (0.0%) | 0 (0.0%) |
| 75 Years and over | 0 (0.0%) | 43 (86.0%) |
Disability Class: Self-Care Difficulty
| Age Bracket | Male | Female |
| 5 to 17 Years | 0 (0.0%) | 0 (0.0%) |
| 18 to 34 Years | 0 (0.0%) | 0 (0.0%) |
| 35 to 64 Years | 0 (0.0%) | 0 (0.0%) |
| 65 to 74 Years | 0 (0.0%) | 0 (0.0%) |
| 75 Years and over | 0 (0.0%) | 0 (0.0%) |
Technology Access in Davenport Center
Computing Device Access in Davenport Center
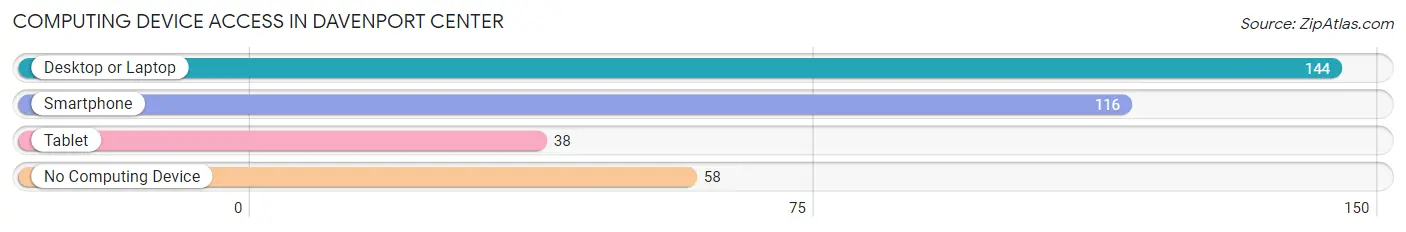
| Device Type | # Households | % Households |
| Desktop or Laptop | 144 | 71.3% |
| Smartphone | 116 | 57.4% |
| Tablet | 38 | 18.8% |
| No Computing Device | 58 | 28.7% |
| Total | 202 | 100.0% |
Internet Access in Davenport Center
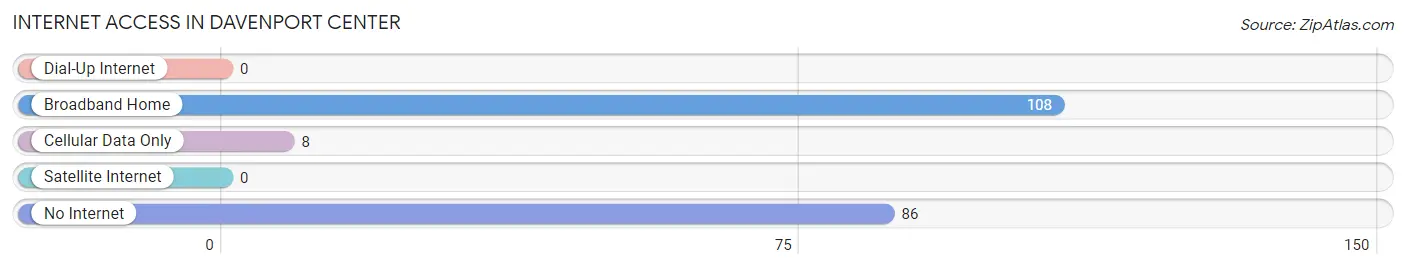
| Internet Type | # Households | % Households |
| Dial-Up Internet | 0 | 0.0% |
| Broadband Home | 108 | 53.5% |
| Cellular Data Only | 8 | 4.0% |
| Satellite Internet | 0 | 0.0% |
| No Internet | 86 | 42.6% |
| Total | 202 | 100.0% |
Davenport Center Summary
Davenport Center is a hamlet located in the town of Davenport, New York, in Delaware County. It is situated in the Catskill Mountains, about 20 miles west of Oneonta. The hamlet is home to about 500 people, and is a popular destination for outdoor recreation.
History
The hamlet of Davenport Center was first settled in the late 1700s by a group of settlers from Connecticut. The settlers were attracted to the area by its abundance of natural resources, including timber, water, and fertile soil. The hamlet was originally known as “Davenport’s Corners”, and was later renamed “Davenport Center”.
The hamlet was an important stop on the Delaware and Hudson Canal, which was built in the early 1800s to transport coal from Pennsylvania to New York City. The canal was a major source of economic activity in the area, and the hamlet grew rapidly. By the mid-1800s, Davenport Center had become a thriving community, with a variety of businesses, including a sawmill, a gristmill, a blacksmith shop, and a general store.
Geography
Davenport Center is located in the Catskill Mountains, about 20 miles west of Oneonta. The hamlet is situated in a valley, surrounded by hills and mountains. The terrain is mostly forested, with some open fields and meadows. The hamlet is located near several lakes and streams, including the East Branch of the Delaware River.
Economy
The economy of Davenport Center is largely based on tourism and outdoor recreation. The hamlet is a popular destination for fishing, hunting, camping, and hiking. There are several local businesses that cater to tourists, including restaurants, lodging, and outdoor equipment stores.
The hamlet is also home to several small farms, which produce a variety of crops, including corn, hay, and apples. There is also a small manufacturing sector in the area, which produces furniture and other wood products.
Demographics
As of the 2010 census, the population of Davenport Center was 498. The population is mostly white (96.2%), with a small minority population (3.8%). The median household income is $41,250, and the median age is 44.
Conclusion
Davenport Center is a small hamlet located in the Catskill Mountains of New York. It is a popular destination for outdoor recreation, and is home to about 500 people. The economy of the hamlet is largely based on tourism and outdoor recreation, as well as small-scale farming and manufacturing. The population is mostly white, with a small minority population.
Common Questions
What is Per Capita Income in Davenport Center?
Per Capita income in Davenport Center is $28,081.
What is the Median Family Income in Davenport Center?
Median Family Income in Davenport Center is $56,389.
What is the Median Household income in Davenport Center?
Median Household Income in Davenport Center is $51,071.
What is Inequality or Gini Index in Davenport Center?
Inequality or Gini Index in Davenport Center is 0.34.
What is the Total Population of Davenport Center?
Total Population of Davenport Center is 489.
What is the Total Male Population of Davenport Center?
Total Male Population of Davenport Center is 167.
What is the Total Female Population of Davenport Center?
Total Female Population of Davenport Center is 322.
What is the Ratio of Males per 100 Females in Davenport Center?
There are 51.86 Males per 100 Females in Davenport Center.
What is the Ratio of Females per 100 Males in Davenport Center?
There are 192.81 Females per 100 Males in Davenport Center.
What is the Median Population Age in Davenport Center?
Median Population Age in Davenport Center is 29.9 Years.
What is the Average Family Size in Davenport Center
Average Family Size in Davenport Center is 3.0 People.
What is the Average Household Size in Davenport Center
Average Household Size in Davenport Center is 2.4 People.
How Large is the Labor Force in Davenport Center?
There are 172 People in the Labor Forcein in Davenport Center.
What is the Percentage of People in the Labor Force in Davenport Center?
45.4% of People are in the Labor Force in Davenport Center.