Cities with the Largest Haitian Community in the United States
RELATED REPORTS & OPTIONS
Haitian
United States
Compare Cities
Map of Cities with the Largest Haitian Community in the United States
0
150,000
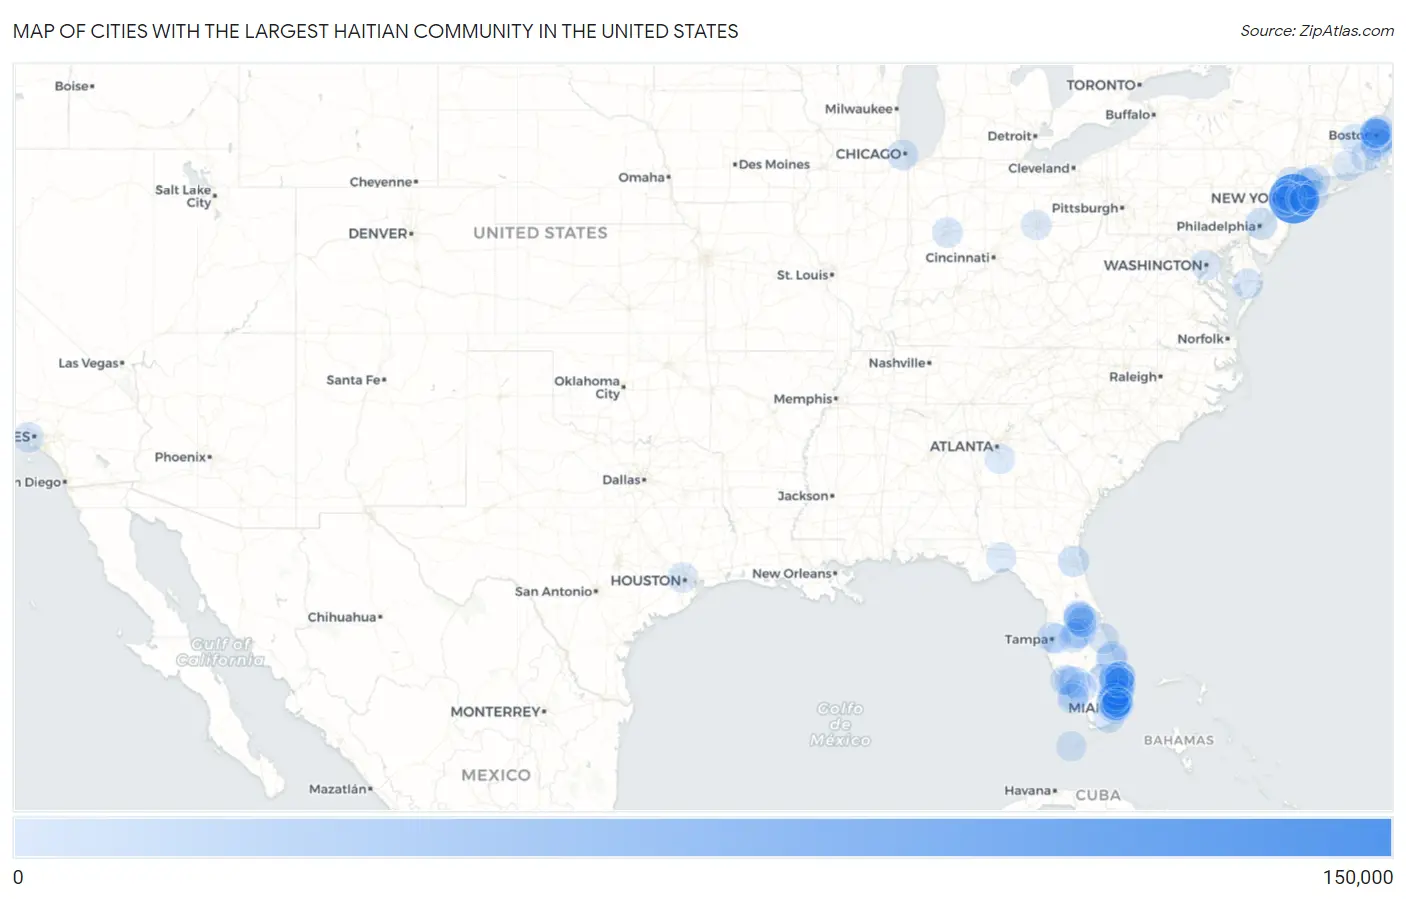
Cities with the Largest Haitian Community in the United States
| City | Haitian | vs State | vs National | |
| 1. | New York | 118,674 | 184,438 (64.34%)#1 | 1,060,713 (11.19%)#1 |
| 2. | North Miami | 22,671 | 496,400 (4.57%)#1 | 1,060,713 (2.14%)#2 |
| 3. | Boston | 21,059 | 80,378 (26.20%)#1 | 1,060,713 (1.99%)#3 |
| 4. | Pine Hills | 18,131 | 496,400 (3.65%)#2 | 1,060,713 (1.71%)#4 |
| 5. | Miami | 14,195 | 496,400 (2.86%)#3 | 1,060,713 (1.34%)#5 |
| 6. | Brockton | 14,051 | 80,378 (17.48%)#2 | 1,060,713 (1.32%)#6 |
| 7. | Golden Glades | 14,008 | 496,400 (2.82%)#4 | 1,060,713 (1.32%)#7 |
| 8. | Miramar | 13,869 | 496,400 (2.79%)#5 | 1,060,713 (1.31%)#8 |
| 9. | Boynton Beach | 13,642 | 496,400 (2.75%)#6 | 1,060,713 (1.29%)#9 |
| 10. | Fort Lauderdale | 11,475 | 496,400 (2.31%)#7 | 1,060,713 (1.08%)#10 |
| 11. | Pompano Beach | 11,373 | 496,400 (2.29%)#8 | 1,060,713 (1.07%)#11 |
| 12. | Lauderhill | 11,344 | 496,400 (2.29%)#9 | 1,060,713 (1.07%)#12 |
| 13. | Philadelphia | 11,327 | 24,452 (46.32%)#1 | 1,060,713 (1.07%)#13 |
| 14. | North Miami Beach | 9,753 | 496,400 (1.96%)#10 | 1,060,713 (0.92%)#14 |
| 15. | Lauderdale Lakes | 9,635 | 496,400 (1.94%)#11 | 1,060,713 (0.91%)#15 |
| 16. | Orlando | 9,420 | 496,400 (1.90%)#12 | 1,060,713 (0.89%)#16 |
| 17. | Lehigh Acres | 9,311 | 496,400 (1.88%)#13 | 1,060,713 (0.88%)#17 |
| 18. | Miami Gardens | 9,137 | 496,400 (1.84%)#14 | 1,060,713 (0.86%)#18 |
| 19. | Delray Beach | 9,020 | 496,400 (1.82%)#15 | 1,060,713 (0.85%)#19 |
| 20. | Coral Springs | 8,256 | 496,400 (1.66%)#16 | 1,060,713 (0.78%)#20 |
| 21. | Deerfield Beach | 8,088 | 496,400 (1.63%)#17 | 1,060,713 (0.76%)#21 |
| 22. | Sunrise | 8,016 | 496,400 (1.61%)#18 | 1,060,713 (0.76%)#22 |
| 23. | Port St Lucie | 7,621 | 496,400 (1.54%)#19 | 1,060,713 (0.72%)#23 |
| 24. | Jacksonville | 7,464 | 496,400 (1.50%)#20 | 1,060,713 (0.70%)#24 |
| 25. | Hollywood | 6,977 | 496,400 (1.41%)#21 | 1,060,713 (0.66%)#25 |
| 26. | North Lauderdale | 6,966 | 496,400 (1.40%)#22 | 1,060,713 (0.66%)#26 |
| 27. | Pembroke Pines | 6,345 | 496,400 (1.28%)#23 | 1,060,713 (0.60%)#27 |
| 28. | Pinewood | 6,140 | 496,400 (1.24%)#24 | 1,060,713 (0.58%)#28 |
| 29. | West Palm Beach | 5,963 | 496,400 (1.20%)#25 | 1,060,713 (0.56%)#29 |
| 30. | Spring Valley | 5,914 | 184,438 (3.21%)#2 | 1,060,713 (0.56%)#30 |
| 31. | Greenacres | 5,599 | 496,400 (1.13%)#26 | 1,060,713 (0.53%)#31 |
| 32. | Newark | 5,369 | 71,444 (7.51%)#1 | 1,060,713 (0.51%)#32 |
| 33. | Elmont | 4,902 | 184,438 (2.66%)#3 | 1,060,713 (0.46%)#33 |
| 34. | Chicago | 4,746 | 10,223 (46.42%)#1 | 1,060,713 (0.45%)#34 |
| 35. | Randolph Town | 4,396 | 80,378 (5.47%)#3 | 1,060,713 (0.41%)#35 |
| 36. | Stamford | 4,387 | 18,950 (23.15%)#1 | 1,060,713 (0.41%)#36 |
| 37. | Royal Palm Beach | 4,358 | 496,400 (0.88%)#27 | 1,060,713 (0.41%)#37 |
| 38. | Poinciana | 4,335 | 496,400 (0.87%)#28 | 1,060,713 (0.41%)#38 |
| 39. | Ives Estates | 4,309 | 496,400 (0.87%)#29 | 1,060,713 (0.41%)#39 |
| 40. | Tampa | 4,196 | 496,400 (0.85%)#30 | 1,060,713 (0.40%)#40 |
| 41. | Homestead | 4,173 | 496,400 (0.84%)#31 | 1,060,713 (0.39%)#41 |
| 42. | Margate | 3,989 | 496,400 (0.80%)#32 | 1,060,713 (0.38%)#42 |
| 43. | East Orange | 3,961 | 71,444 (5.54%)#2 | 1,060,713 (0.37%)#43 |
| 44. | Fort Pierce | 3,929 | 496,400 (0.79%)#33 | 1,060,713 (0.37%)#44 |
| 45. | Oakland Park | 3,859 | 496,400 (0.78%)#34 | 1,060,713 (0.36%)#45 |
| 46. | Tamarac | 3,829 | 496,400 (0.77%)#35 | 1,060,713 (0.36%)#46 |
| 47. | Lake Worth Beach | 3,677 | 496,400 (0.74%)#36 | 1,060,713 (0.35%)#47 |
| 48. | Elizabeth | 3,518 | 71,444 (4.92%)#3 | 1,060,713 (0.33%)#48 |
| 49. | Malden | 3,295 | 80,378 (4.10%)#4 | 1,060,713 (0.31%)#49 |
| 50. | West Little River | 3,222 | 496,400 (0.65%)#37 | 1,060,713 (0.30%)#50 |
| 51. | Riviera Beach | 2,940 | 496,400 (0.59%)#38 | 1,060,713 (0.28%)#51 |
| 52. | Everett | 2,879 | 80,378 (3.58%)#5 | 1,060,713 (0.27%)#52 |
| 53. | Indianapolis | 2,860 | 6,144 (46.55%)#1 | 1,060,713 (0.27%)#53 |
| 54. | Palm Bay | 2,811 | 496,400 (0.57%)#39 | 1,060,713 (0.27%)#54 |
| 55. | Boca Raton | 2,724 | 496,400 (0.55%)#40 | 1,060,713 (0.26%)#55 |
| 56. | Fort Myers | 2,714 | 496,400 (0.55%)#41 | 1,060,713 (0.26%)#56 |
| 57. | Immokalee | 2,691 | 496,400 (0.54%)#42 | 1,060,713 (0.25%)#57 |
| 58. | Bridgeport | 2,649 | 18,950 (13.98%)#2 | 1,060,713 (0.25%)#58 |
| 59. | Hempstead | 2,576 | 184,438 (1.40%)#4 | 1,060,713 (0.24%)#59 |
| 60. | Providence | 2,569 | 4,855 (52.91%)#1 | 1,060,713 (0.24%)#60 |
| 61. | Linden | 2,556 | 71,444 (3.58%)#4 | 1,060,713 (0.24%)#61 |
| 62. | Baldwin | 2,534 | 184,438 (1.37%)#5 | 1,060,713 (0.24%)#62 |
| 63. | Golden Gate | 2,414 | 496,400 (0.49%)#43 | 1,060,713 (0.23%)#63 |
| 64. | Los Angeles | 2,391 | 13,930 (17.16%)#1 | 1,060,713 (0.23%)#64 |
| 65. | Salisbury | 2,324 | 17,432 (13.33%)#1 | 1,060,713 (0.22%)#65 |
| 66. | North Valley Stream | 2,234 | 184,438 (1.21%)#6 | 1,060,713 (0.21%)#66 |
| 67. | Palm Springs | 2,206 | 496,400 (0.44%)#44 | 1,060,713 (0.21%)#67 |
| 68. | Medford | 2,120 | 80,378 (2.64%)#6 | 1,060,713 (0.20%)#68 |
| 69. | Belle Glade | 2,107 | 496,400 (0.42%)#45 | 1,060,713 (0.20%)#69 |
| 70. | Columbus | 2,087 | 5,717 (36.51%)#1 | 1,060,713 (0.20%)#70 |
| 71. | Worcester | 2,069 | 80,378 (2.57%)#7 | 1,060,713 (0.20%)#71 |
| 72. | Norwalk | 1,960 | 18,950 (10.34%)#3 | 1,060,713 (0.18%)#72 |
| 73. | Lynn | 1,926 | 80,378 (2.40%)#8 | 1,060,713 (0.18%)#73 |
| 74. | Ocoee | 1,840 | 496,400 (0.37%)#46 | 1,060,713 (0.17%)#74 |
| 75. | Hallandale Beach | 1,797 | 496,400 (0.36%)#47 | 1,060,713 (0.17%)#75 |
| 76. | Freeport | 1,777 | 184,438 (0.96%)#7 | 1,060,713 (0.17%)#76 |
| 77. | Winter Haven | 1,764 | 496,400 (0.36%)#48 | 1,060,713 (0.17%)#77 |
| 78. | Houston | 1,747 | 13,077 (13.36%)#1 | 1,060,713 (0.16%)#78 |
| 79. | Haines City | 1,739 | 496,400 (0.35%)#49 | 1,060,713 (0.16%)#79 |
| 80. | Wellington | 1,733 | 496,400 (0.35%)#50 | 1,060,713 (0.16%)#80 |
| 81. | Lake Park | 1,728 | 496,400 (0.35%)#51 | 1,060,713 (0.16%)#81 |
| 82. | Davie | 1,701 | 496,400 (0.34%)#52 | 1,060,713 (0.16%)#82 |
| 83. | Oak Ridge | 1,629 | 496,400 (0.33%)#53 | 1,060,713 (0.15%)#83 |
| 84. | Roselle Borough | 1,625 | 71,444 (2.27%)#5 | 1,060,713 (0.15%)#84 |
| 85. | Hampton | 1,610 | 39,066 (4.12%)#1 | 1,060,713 (0.15%)#85 |
| 86. | Tallahassee | 1,550 | 496,400 (0.31%)#54 | 1,060,713 (0.15%)#86 |
| 87. | Naples Manor | 1,544 | 496,400 (0.31%)#55 | 1,060,713 (0.15%)#87 |
| 88. | Jersey City | 1,532 | 71,444 (2.14%)#6 | 1,060,713 (0.14%)#88 |
| 89. | Brandon | 1,528 | 496,400 (0.31%)#56 | 1,060,713 (0.14%)#89 |
| 90. | Cambridge | 1,525 | 80,378 (1.90%)#9 | 1,060,713 (0.14%)#90 |
| 91. | The Acreage | 1,488 | 496,400 (0.30%)#57 | 1,060,713 (0.14%)#91 |
| 92. | Washington | 1,484 | 1,484 (100.00%)#1 | 1,060,713 (0.14%)#92 |
| 93. | Norwich | 1,479 | 18,950 (7.80%)#4 | 1,060,713 (0.14%)#93 |
| 94. | Lantana | 1,469 | 496,400 (0.30%)#58 | 1,060,713 (0.14%)#94 |
| 95. | Key West | 1,448 | 496,400 (0.29%)#59 | 1,060,713 (0.14%)#95 |
| 96. | Apopka | 1,437 | 496,400 (0.29%)#60 | 1,060,713 (0.14%)#96 |
| 97. | Westview | 1,403 | 496,400 (0.28%)#61 | 1,060,713 (0.13%)#97 |
| 98. | Cape Coral | 1,344 | 496,400 (0.27%)#62 | 1,060,713 (0.13%)#98 |
| 99. | Brentwood | 1,321 | 184,438 (0.72%)#8 | 1,060,713 (0.12%)#99 |
| 100. | Ojus | 1,283 | 496,400 (0.26%)#63 | 1,060,713 (0.12%)#100 |
Common Questions
What are the Top 10 Cities with the Largest Haitian Community in the United States?
Top 10 Cities with the Largest Haitian Community in the United States are:
#1
118,674
#2
22,671
#3
21,059
#4
18,131
#5
14,195
#6
14,051
#7
14,008
#8
13,869
#9
13,642
#10
11,475
What city has the Largest Haitian Community in the United States?
New York has the Largest Haitian Community in the United States with 118,674.
What is the Total Haitian Population in the United States?
Total Haitian Population in the United States is 1,060,713.