Cities with the Largest Haitian Community in Missouri
RELATED REPORTS & OPTIONS
Haitian
Missouri
Compare Cities
Map of Cities with the Largest Haitian Community in Missouri
0
1,000
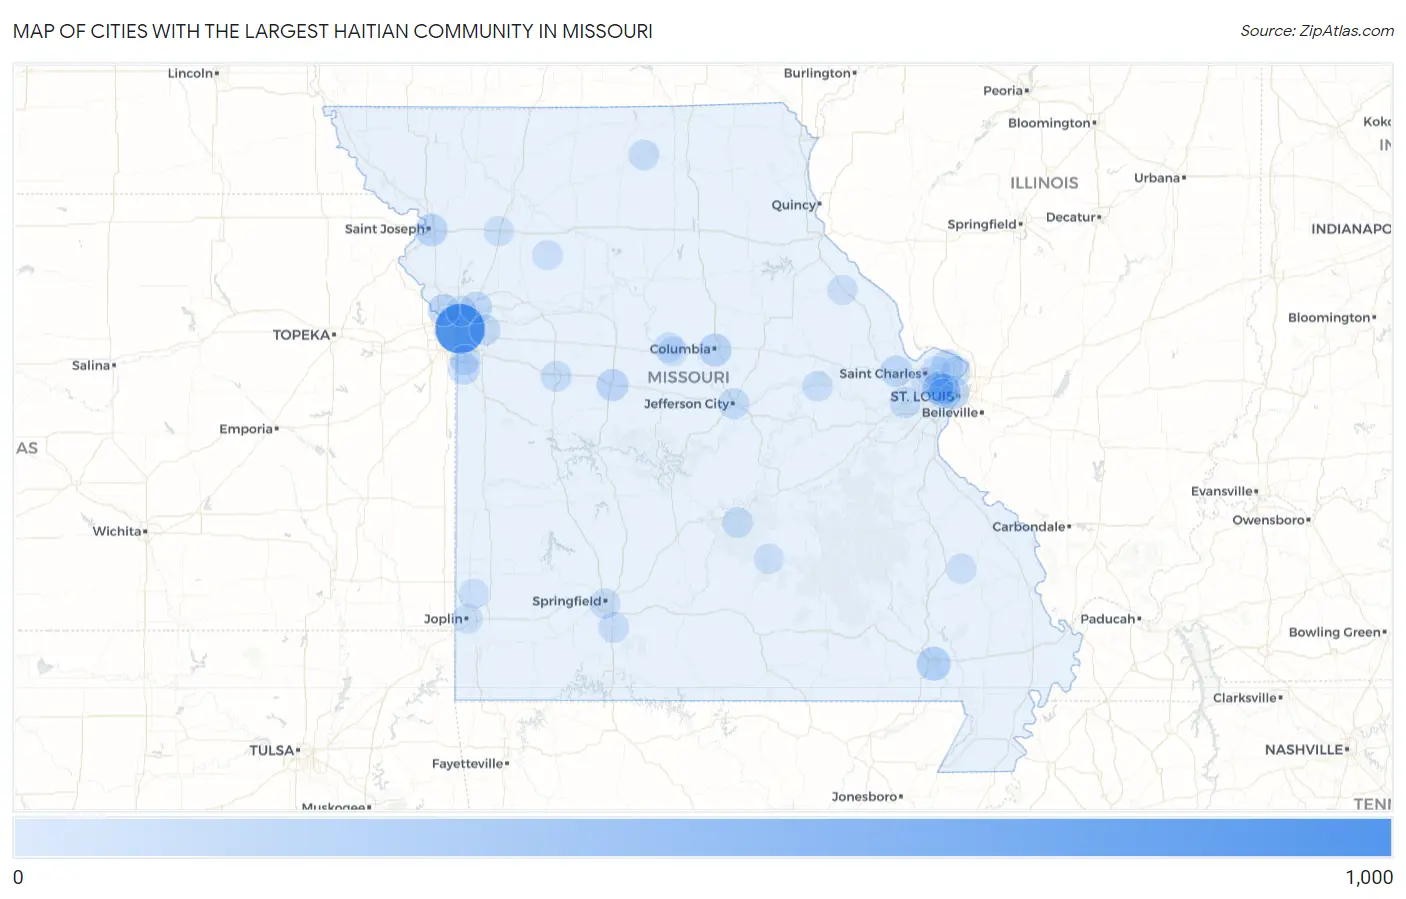
Cities with the Largest Haitian Community in Missouri
| City | Haitian | vs State | vs National | |
| 1. | Kansas City | 867 | 2,697(32.15%)#1 | 1,060,713(0.08%)#142 |
| 2. | Poplar Bluff | 163 | 2,697(6.04%)#2 | 1,060,713(0.02%)#577 |
| 3. | St Louis | 158 | 2,697(5.86%)#3 | 1,060,713(0.01%)#590 |
| 4. | Columbia | 121 | 2,697(4.49%)#4 | 1,060,713(0.01%)#702 |
| 5. | St Joseph | 108 | 2,697(4.00%)#5 | 1,060,713(0.01%)#764 |
| 6. | Sedalia | 89 | 2,697(3.30%)#6 | 1,060,713(0.01%)#868 |
| 7. | University City | 85 | 2,697(3.15%)#7 | 1,060,713(0.01%)#891 |
| 8. | Parkville | 81 | 2,697(3.00%)#8 | 1,060,713(0.01%)#922 |
| 9. | Belton | 79 | 2,697(2.93%)#9 | 1,060,713(0.01%)#931 |
| 10. | O Fallon | 68 | 2,697(2.52%)#10 | 1,060,713(0.01%)#1,005 |
| 11. | Liberty | 68 | 2,697(2.52%)#11 | 1,060,713(0.01%)#1,009 |
| 12. | Old Jamestown | 61 | 2,697(2.26%)#12 | 1,060,713(0.01%)#1,074 |
| 13. | Wildwood | 45 | 2,697(1.67%)#13 | 1,060,713(0.00%)#1,252 |
| 14. | Jefferson City | 41 | 2,697(1.52%)#14 | 1,060,713(0.00%)#1,300 |
| 15. | Independence | 39 | 2,697(1.45%)#15 | 1,060,713(0.00%)#1,329 |
| 16. | Warrensburg | 32 | 2,697(1.19%)#16 | 1,060,713(0.00%)#1,469 |
| 17. | Fort Leonard Wood | 27 | 2,697(1.00%)#17 | 1,060,713(0.00%)#1,562 |
| 18. | Olivette | 27 | 2,697(1.00%)#18 | 1,060,713(0.00%)#1,566 |
| 19. | Green City | 26 | 2,697(0.96%)#19 | 1,060,713(0.00%)#1,595 |
| 20. | Ozark | 23 | 2,697(0.85%)#20 | 1,060,713(0.00%)#1,680 |
| 21. | Springfield | 19 | 2,697(0.70%)#21 | 1,060,713(0.00%)#1,785 |
| 22. | Spanish Lake | 17 | 2,697(0.63%)#22 | 1,060,713(0.00%)#1,870 |
| 23. | Pagedale | 16 | 2,697(0.59%)#23 | 1,060,713(0.00%)#1,917 |
| 24. | Maryland Heights | 14 | 2,697(0.52%)#24 | 1,060,713(0.00%)#1,993 |
| 25. | Grandview | 11 | 2,697(0.41%)#25 | 1,060,713(0.00%)#2,124 |
| 26. | Hazelwood | 10 | 2,697(0.37%)#26 | 1,060,713(0.00%)#2,188 |
| 27. | Hermann | 10 | 2,697(0.37%)#27 | 1,060,713(0.00%)#2,220 |
| 28. | Licking | 8 | 2,697(0.30%)#28 | 1,060,713(0.00%)#2,329 |
| 29. | Gladstone | 7 | 2,697(0.26%)#29 | 1,060,713(0.00%)#2,358 |
| 30. | Overland | 6 | 2,697(0.22%)#30 | 1,060,713(0.00%)#2,432 |
| 31. | Boonville | 6 | 2,697(0.22%)#31 | 1,060,713(0.00%)#2,443 |
| 32. | Joplin | 5 | 2,697(0.19%)#32 | 1,060,713(0.00%)#2,480 |
| 33. | Braymer | 5 | 2,697(0.19%)#33 | 1,060,713(0.00%)#2,529 |
| 34. | Windsor Place | 5 | 2,697(0.19%)#34 | 1,060,713(0.00%)#2,534 |
| 35. | Cameron | 4 | 2,697(0.15%)#35 | 1,060,713(0.00%)#2,558 |
| 36. | Bowling Green | 2 | 2,697(0.07%)#36 | 1,060,713(0.00%)#2,668 |
| 37. | Neck City | 2 | 2,697(0.07%)#37 | 1,060,713(0.00%)#2,702 |
| 38. | Marquand | 2 | 2,697(0.07%)#38 | 1,060,713(0.00%)#2,703 |
| 39. | Clayton | 1 | 2,697(0.04%)#39 | 1,060,713(0.00%)#2,723 |
Common Questions
What are the Top 10 Cities with the Largest Haitian Community in Missouri?
Top 10 Cities with the Largest Haitian Community in Missouri are:
#1
867
#2
163
#3
158
#4
121
#5
108
#6
89
#7
85
#8
81
#9
79
#10
68
What city has the Largest Haitian Community in Missouri?
Kansas City has the Largest Haitian Community in Missouri with 867.
What is the Total Haitian Population in the State of Missouri?
Total Haitian Population in Missouri is 2,697.
What is the Total Haitian Population in the United States?
Total Haitian Population in the United States is 1,060,713.