Zip Codes with the Highest Percentage of Families with Income Below $10,000 in Arlington, MA
RELATED REPORTS & OPTIONS
Family Income | $0-10k
Arlington
Compare Zip Codes
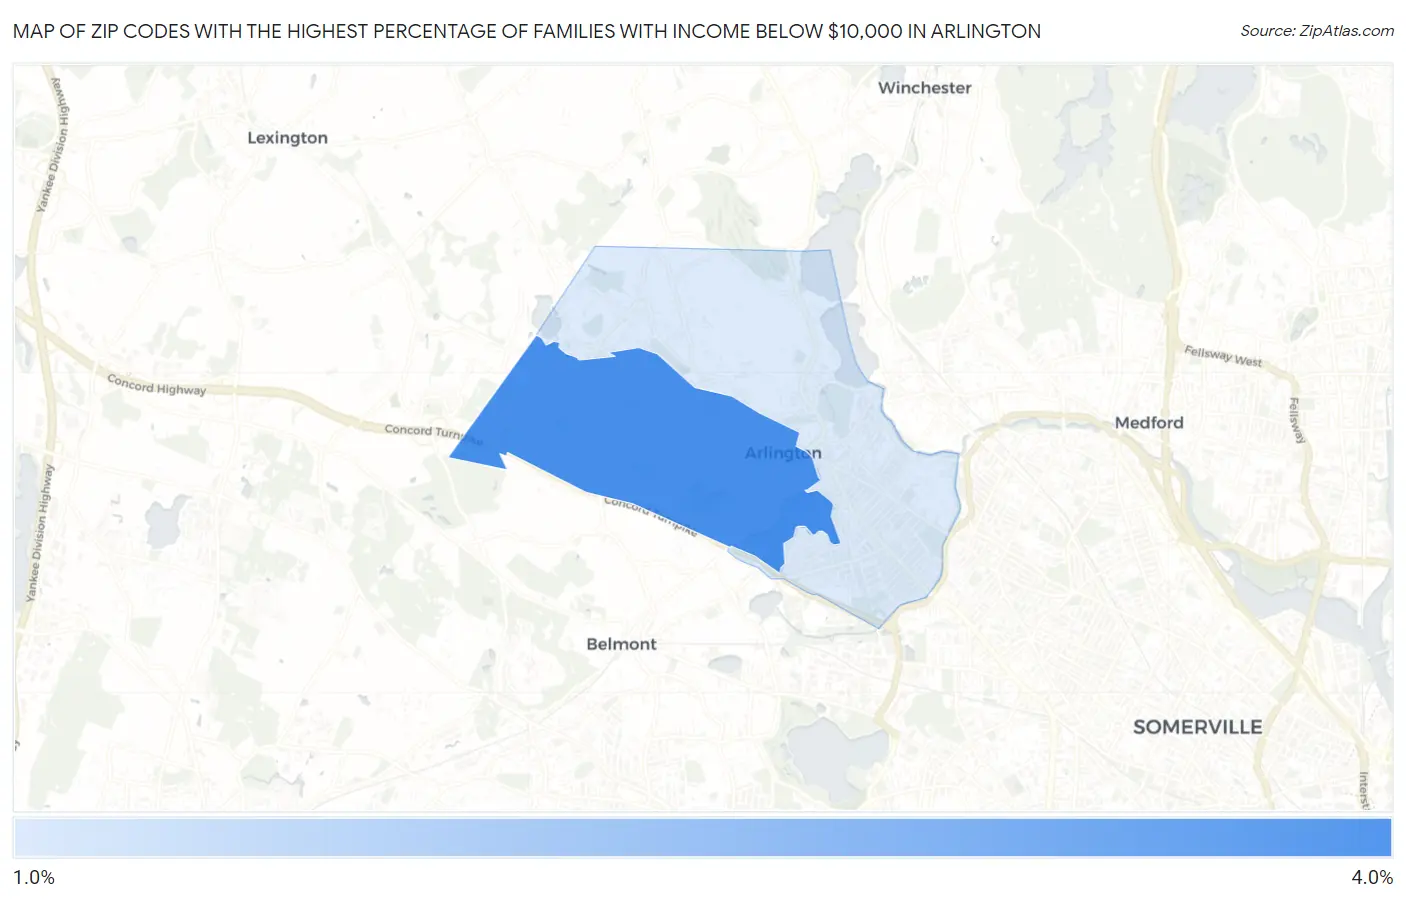
Map of Zip Codes with the Highest Percentage of Families with Income Below $10,000 in Arlington
1.7%
3.5%
Zip Codes with the Highest Percentage of Families with Income Below $10,000 in Arlington, MA
| Zip Code | Families with Income < $10k | vs State | vs National | |
| 1. | 02476 | 3.5% | 2.4%(+1.10)#97 | 3.1%(+0.400)#9,555 |
| 2. | 02474 | 1.7% | 2.4%(-0.700)#221 | 3.1%(-1.40)#16,773 |
1
Common Questions
What are the Top Zip Codes with the Highest Percentage of Families with Income Below $10,000 in Arlington, MA?
Top Zip Codes with the Highest Percentage of Families with Income Below $10,000 in Arlington, MA are:
What zip code has the Highest Percentage of Families with Income Below $10,000 in Arlington, MA?
02476 has the Highest Percentage of Families with Income Below $10,000 in Arlington, MA with 3.5%.
What is the Percentage of Families with Income Below $10,000 in Arlington, MA?
Percentage of Families with Income Below $10,000 in Arlington is 2.4%.
What is the Percentage of Families with Income Below $10,000 in Massachusetts?
Percentage of Families with Income Below $10,000 in Massachusetts is 2.4%.
What is the Percentage of Families with Income Below $10,000 in the United States?
Percentage of Families with Income Below $10,000 in the United States is 3.1%.