Zip Codes with the Lowest Poverty Level Among Children Under the Age of 5 in Massachusetts
RELATED REPORTS & OPTIONS
Lowest Poverty | Child 0-5
Massachusetts
Compare Zip Codes
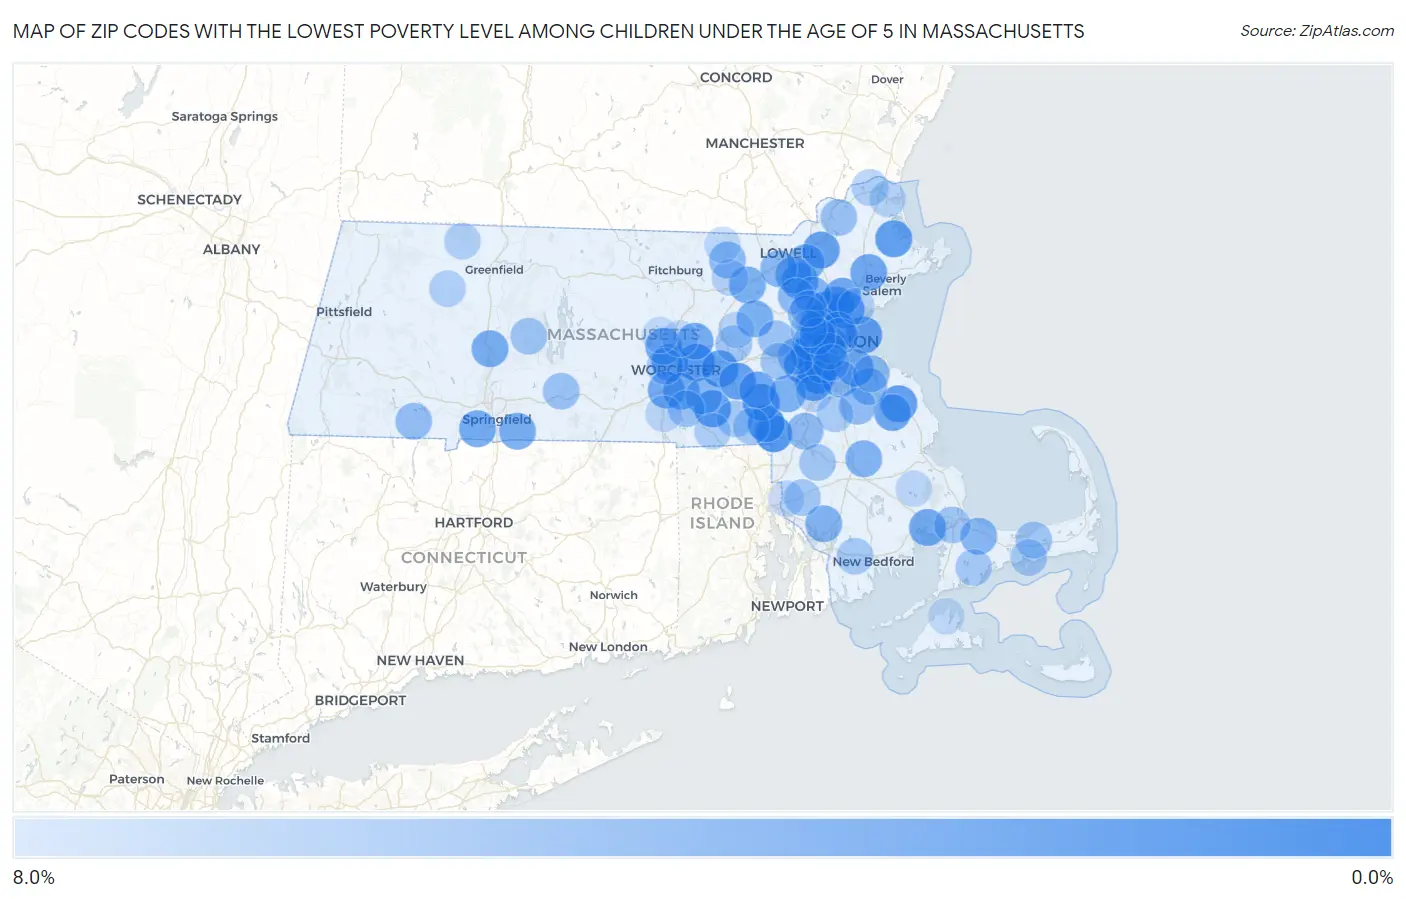
Map of Zip Codes with the Lowest Poverty Level Among Children Under the Age of 5 in Massachusetts
8.0%
0.0%
Zip Codes with the Lowest Poverty Level Among Children Under the Age of 5 in Massachusetts
| Zip Code | Child Poverty | vs State | vs National | |
| 1. | 02093 | 0.58% | 12.6%(-12.0)#1 | 18.1%(-17.5)#85 |
| 2. | 01545 | 0.62% | 12.6%(-12.0)#2 | 18.1%(-17.4)#100 |
| 3. | 02026 | 0.65% | 12.6%(-11.9)#3 | 18.1%(-17.4)#110 |
| 4. | 01890 | 0.68% | 12.6%(-11.9)#4 | 18.1%(-17.4)#125 |
| 5. | 02038 | 0.74% | 12.6%(-11.8)#5 | 18.1%(-17.3)#151 |
| 6. | 02053 | 1.0% | 12.6%(-11.6)#6 | 18.1%(-17.0)#289 |
| 7. | 02476 | 1.1% | 12.6%(-11.5)#7 | 18.1%(-17.0)#312 |
| 8. | 02492 | 1.1% | 12.6%(-11.5)#8 | 18.1%(-17.0)#327 |
| 9. | 02464 | 1.1% | 12.6%(-11.5)#9 | 18.1%(-16.9)#346 |
| 10. | 02152 | 1.1% | 12.6%(-11.4)#10 | 18.1%(-16.9)#353 |
| 11. | 02090 | 1.2% | 12.6%(-11.4)#11 | 18.1%(-16.9)#379 |
| 12. | 01534 | 1.2% | 12.6%(-11.4)#12 | 18.1%(-16.8)#385 |
| 13. | 01938 | 1.3% | 12.6%(-11.3)#13 | 18.1%(-16.8)#413 |
| 14. | 02061 | 1.3% | 12.6%(-11.2)#14 | 18.1%(-16.7)#445 |
| 15. | 02176 | 1.4% | 12.6%(-11.2)#15 | 18.1%(-16.7)#465 |
| 16. | 01581 | 1.4% | 12.6%(-11.2)#16 | 18.1%(-16.7)#477 |
| 17. | 01748 | 1.4% | 12.6%(-11.1)#17 | 18.1%(-16.6)#495 |
| 18. | 01810 | 1.5% | 12.6%(-11.1)#18 | 18.1%(-16.6)#510 |
| 19. | 01609 | 1.8% | 12.6%(-10.8)#19 | 18.1%(-16.3)#696 |
| 20. | 02132 | 1.8% | 12.6%(-10.8)#20 | 18.1%(-16.3)#703 |
| 21. | 01821 | 1.8% | 12.6%(-10.8)#21 | 18.1%(-16.2)#728 |
| 22. | 02180 | 1.9% | 12.6%(-10.7)#22 | 18.1%(-16.2)#763 |
| 23. | 01520 | 2.0% | 12.6%(-10.5)#23 | 18.1%(-16.0)#864 |
| 24. | 02339 | 2.1% | 12.6%(-10.5)#24 | 18.1%(-16.0)#868 |
| 25. | 01746 | 2.1% | 12.6%(-10.5)#25 | 18.1%(-15.9)#911 |
| 26. | 01880 | 2.2% | 12.6%(-10.4)#26 | 18.1%(-15.8)#979 |
| 27. | 01923 | 2.2% | 12.6%(-10.3)#27 | 18.1%(-15.8)#992 |
| 28. | 02145 | 2.3% | 12.6%(-10.3)#28 | 18.1%(-15.8)#1,023 |
| 29. | 02571 | 2.3% | 12.6%(-10.3)#29 | 18.1%(-15.8)#1,034 |
| 30. | 01501 | 2.3% | 12.6%(-10.3)#30 | 18.1%(-15.7)#1,042 |
| 31. | 01030 | 2.4% | 12.6%(-10.2)#31 | 18.1%(-15.7)#1,092 |
| 32. | 01527 | 2.4% | 12.6%(-10.1)#32 | 18.1%(-15.6)#1,134 |
| 33. | 01505 | 2.5% | 12.6%(-10.1)#33 | 18.1%(-15.6)#1,171 |
| 34. | 02170 | 2.5% | 12.6%(-10.1)#34 | 18.1%(-15.6)#1,177 |
| 35. | 01028 | 2.7% | 12.6%(-9.87)#35 | 18.1%(-15.3)#1,306 |
| 36. | 01060 | 2.8% | 12.6%(-9.82)#36 | 18.1%(-15.3)#1,343 |
| 37. | 01460 | 2.8% | 12.6%(-9.79)#37 | 18.1%(-15.3)#1,369 |
| 38. | 01876 | 2.8% | 12.6%(-9.75)#38 | 18.1%(-15.2)#1,389 |
| 39. | 01754 | 2.9% | 12.6%(-9.72)#39 | 18.1%(-15.2)#1,416 |
| 40. | 02052 | 3.0% | 12.6%(-9.60)#40 | 18.1%(-15.1)#1,489 |
| 41. | 01862 | 3.1% | 12.6%(-9.44)#41 | 18.1%(-14.9)#1,609 |
| 42. | 02186 | 3.2% | 12.6%(-9.40)#42 | 18.1%(-14.9)#1,635 |
| 43. | 02726 | 3.3% | 12.6%(-9.33)#43 | 18.1%(-14.8)#1,671 |
| 44. | 02460 | 3.3% | 12.6%(-9.25)#44 | 18.1%(-14.7)#1,718 |
| 45. | 02446 | 3.4% | 12.6%(-9.23)#45 | 18.1%(-14.7)#1,735 |
| 46. | 02324 | 3.4% | 12.6%(-9.17)#46 | 18.1%(-14.7)#1,768 |
| 47. | 01803 | 3.6% | 12.6%(-9.03)#47 | 18.1%(-14.5)#1,860 |
| 48. | 02563 | 3.6% | 12.6%(-8.96)#48 | 18.1%(-14.4)#1,896 |
| 49. | 01560 | 3.7% | 12.6%(-8.87)#49 | 18.1%(-14.3)#1,969 |
| 50. | 02188 | 3.8% | 12.6%(-8.79)#50 | 18.1%(-14.3)#2,021 |
| 51. | 01824 | 3.8% | 12.6%(-8.76)#51 | 18.1%(-14.2)#2,046 |
| 52. | 02481 | 4.0% | 12.6%(-8.62)#52 | 18.1%(-14.1)#2,144 |
| 53. | 01730 | 4.0% | 12.6%(-8.57)#53 | 18.1%(-14.0)#2,192 |
| 54. | 02478 | 4.0% | 12.6%(-8.56)#54 | 18.1%(-14.0)#2,194 |
| 55. | 01450 | 4.1% | 12.6%(-8.50)#55 | 18.1%(-14.0)#2,229 |
| 56. | 02035 | 4.1% | 12.6%(-8.49)#56 | 18.1%(-14.0)#2,243 |
| 57. | 02141 | 4.2% | 12.6%(-8.38)#57 | 18.1%(-13.9)#2,341 |
| 58. | 02445 | 4.3% | 12.6%(-8.29)#58 | 18.1%(-13.8)#2,404 |
| 59. | 02343 | 4.3% | 12.6%(-8.29)#59 | 18.1%(-13.8)#2,406 |
| 60. | 02421 | 4.4% | 12.6%(-8.18)#60 | 18.1%(-13.7)#2,486 |
| 61. | 01034 | 4.5% | 12.6%(-8.11)#61 | 18.1%(-13.6)#2,538 |
| 62. | 02191 | 4.6% | 12.6%(-8.01)#62 | 18.1%(-13.5)#2,615 |
| 63. | 02472 | 4.6% | 12.6%(-7.96)#63 | 18.1%(-13.4)#2,653 |
| 64. | 01069 | 4.8% | 12.6%(-7.76)#64 | 18.1%(-13.2)#2,780 |
| 65. | 01835 | 4.8% | 12.6%(-7.76)#65 | 18.1%(-13.2)#2,782 |
| 66. | 01590 | 4.8% | 12.6%(-7.75)#66 | 18.1%(-13.2)#2,783 |
| 67. | 01778 | 5.0% | 12.6%(-7.55)#67 | 18.1%(-13.0)#2,929 |
| 68. | 01002 | 5.1% | 12.6%(-7.45)#68 | 18.1%(-12.9)#2,997 |
| 69. | 01760 | 5.2% | 12.6%(-7.37)#69 | 18.1%(-12.8)#3,048 |
| 70. | 02675 | 5.2% | 12.6%(-7.35)#70 | 18.1%(-12.8)#3,053 |
| 71. | 02532 | 5.3% | 12.6%(-7.33)#71 | 18.1%(-12.8)#3,061 |
| 72. | 02766 | 5.4% | 12.6%(-7.19)#72 | 18.1%(-12.7)#3,157 |
| 73. | 01752 | 5.4% | 12.6%(-7.18)#73 | 18.1%(-12.7)#3,170 |
| 74. | 02769 | 5.4% | 12.6%(-7.17)#74 | 18.1%(-12.6)#3,180 |
| 75. | 01756 | 5.5% | 12.6%(-7.08)#75 | 18.1%(-12.6)#3,244 |
| 76. | 02649 | 5.6% | 12.6%(-7.02)#76 | 18.1%(-12.5)#3,298 |
| 77. | 02019 | 5.6% | 12.6%(-6.97)#77 | 18.1%(-12.4)#3,333 |
| 78. | 02747 | 5.6% | 12.6%(-6.95)#78 | 18.1%(-12.4)#3,345 |
| 79. | 02673 | 5.7% | 12.6%(-6.93)#79 | 18.1%(-12.4)#3,362 |
| 80. | 01602 | 5.8% | 12.6%(-6.81)#80 | 18.1%(-12.3)#3,437 |
| 81. | 02072 | 5.9% | 12.6%(-6.70)#81 | 18.1%(-12.2)#3,532 |
| 82. | 02452 | 5.9% | 12.6%(-6.64)#82 | 18.1%(-12.1)#3,563 |
| 83. | 01913 | 6.0% | 12.6%(-6.55)#83 | 18.1%(-12.0)#3,622 |
| 84. | 01569 | 6.1% | 12.6%(-6.45)#84 | 18.1%(-11.9)#3,690 |
| 85. | 01340 | 6.2% | 12.6%(-6.41)#85 | 18.1%(-11.9)#3,715 |
| 86. | 01330 | 6.2% | 12.6%(-6.34)#86 | 18.1%(-11.8)#3,774 |
| 87. | 01906 | 6.3% | 12.6%(-6.29)#87 | 18.1%(-11.8)#3,807 |
| 88. | 01432 | 6.4% | 12.6%(-6.21)#88 | 18.1%(-11.7)#3,855 |
| 89. | 01950 | 6.6% | 12.6%(-5.98)#89 | 18.1%(-11.5)#4,004 |
| 90. | 02062 | 6.7% | 12.6%(-5.91)#90 | 18.1%(-11.4)#4,061 |
| 91. | 01749 | 6.7% | 12.6%(-5.91)#91 | 18.1%(-11.4)#4,062 |
| 92. | 01540 | 6.7% | 12.6%(-5.89)#92 | 18.1%(-11.4)#4,071 |
| 93. | 02131 | 6.7% | 12.6%(-5.87)#93 | 18.1%(-11.3)#4,086 |
| 94. | 02420 | 6.8% | 12.6%(-5.79)#94 | 18.1%(-11.3)#4,141 |
| 95. | 02771 | 6.9% | 12.6%(-5.72)#95 | 18.1%(-11.2)#4,193 |
| 96. | 01463 | 7.0% | 12.6%(-5.59)#96 | 18.1%(-11.1)#4,284 |
| 97. | 02330 | 7.0% | 12.6%(-5.57)#97 | 18.1%(-11.0)#4,299 |
| 98. | 01583 | 7.2% | 12.6%(-5.36)#98 | 18.1%(-10.8)#4,434 |
| 99. | 02568 | 7.2% | 12.6%(-5.35)#99 | 18.1%(-10.8)#4,443 |
| 100. | 01522 | 7.3% | 12.6%(-5.33)#100 | 18.1%(-10.8)#4,452 |
Common Questions
What are the Top 10 Zip Codes with the Lowest Poverty Level Among Children Under the Age of 5 in Massachusetts?
Top 10 Zip Codes with the Lowest Poverty Level Among Children Under the Age of 5 in Massachusetts are:
What zip code has the Lowest Poverty Level Among Children Under the Age of 5 in Massachusetts?
02093 has the Lowest Poverty Level Among Children Under the Age of 5 in Massachusetts with 0.58%.
What is the Poverty Level Among Children Under the Age of 5 in the State of Massachusetts?
Poverty Level Among Children Under the Age of 5 in Massachusetts is 12.6%.
What is the Poverty Level Among Children Under the Age of 5 in the United States?
Poverty Level Among Children Under the Age of 5 in the United States is 18.1%.