Carlyle, IL Map & Demographics
Carlyle Map
Carlyle Overview
$29,777
PER CAPITA INCOME
$74,292
AVG FAMILY INCOME
$65,286
AVG HOUSEHOLD INCOME
22.3%
WAGE / INCOME GAP [ % ]
77.7¢/ $1
WAGE / INCOME GAP [ $ ]
0.35
INEQUALITY / GINI INDEX
3,252
TOTAL POPULATION
1,588
MALE POPULATION
1,664
FEMALE POPULATION
95.43
MALES / 100 FEMALES
104.79
FEMALES / 100 MALES
35.6
MEDIAN AGE
2.8
AVG FAMILY SIZE
2.5
AVG HOUSEHOLD SIZE
1,904
LABOR FORCE [ PEOPLE ]
71.6%
PERCENT IN LABOR FORCE
4.8%
UNEMPLOYMENT RATE
Carlyle Zip Codes
Carlyle Area Codes
Income in Carlyle
Income Overview in Carlyle
Per Capita Income in Carlyle is $29,777, while median incomes of families and households are $74,292 and $65,286 respectively.
| Characteristic | Number | Measure |
| Per Capita Income | 3,252 | $29,777 |
| Median Family Income | 912 | $74,292 |
| Mean Family Income | 912 | $88,597 |
| Median Household Income | 1,234 | $65,286 |
| Mean Household Income | 1,234 | $78,661 |
| Income Deficit | 912 | $0 |
| Wage / Income Gap (%) | 3,252 | 22.28% |
| Wage / Income Gap ($) | 3,252 | 77.72¢ per $1 |
| Gini / Inequality Index | 3,252 | 0.35 |
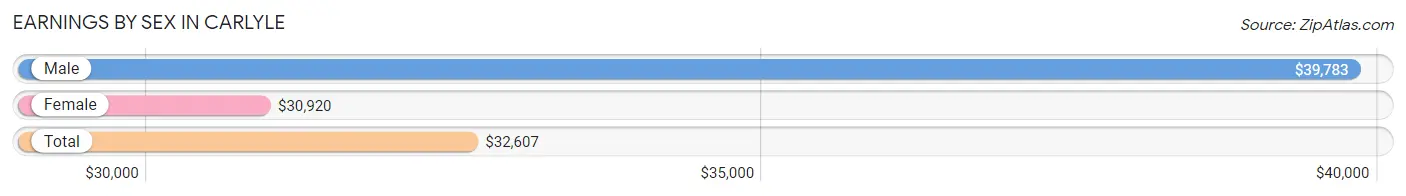
Earnings by Sex in Carlyle
Average Earnings in Carlyle are $32,607, $39,783 for men and $30,920 for women, a difference of 22.3%.
| Sex | Number | Average Earnings |
| Male | 954 (50.0%) | $39,783 |
| Female | 953 (50.0%) | $30,920 |
| Total | 1,907 (100.0%) | $32,607 |
Earnings by Sex by Income Bracket in Carlyle
The most common earnings brackets in Carlyle are $75,000 to $99,999 for men (126 | 13.2%) and $15,000 to $17,499 for women (99 | 10.4%).

| Income | Male | Female |
| $2,499 or less | 15 (1.6%) | 34 (3.6%) |
| $2,500 to $4,999 | 14 (1.5%) | 0 (0.0%) |
| $5,000 to $7,499 | 32 (3.4%) | 12 (1.3%) |
| $7,500 to $9,999 | 13 (1.4%) | 14 (1.5%) |
| $10,000 to $12,499 | 81 (8.5%) | 83 (8.7%) |
| $12,500 to $14,999 | 13 (1.4%) | 34 (3.6%) |
| $15,000 to $17,499 | 4 (0.4%) | 99 (10.4%) |
| $17,500 to $19,999 | 35 (3.7%) | 12 (1.3%) |
| $20,000 to $22,499 | 63 (6.6%) | 25 (2.6%) |
| $22,500 to $24,999 | 0 (0.0%) | 88 (9.2%) |
| $25,000 to $29,999 | 121 (12.7%) | 56 (5.9%) |
| $30,000 to $34,999 | 65 (6.8%) | 74 (7.8%) |
| $35,000 to $39,999 | 23 (2.4%) | 96 (10.1%) |
| $40,000 to $44,999 | 43 (4.5%) | 47 (4.9%) |
| $45,000 to $49,999 | 27 (2.8%) | 38 (4.0%) |
| $50,000 to $54,999 | 80 (8.4%) | 42 (4.4%) |
| $55,000 to $64,999 | 64 (6.7%) | 69 (7.2%) |
| $65,000 to $74,999 | 80 (8.4%) | 13 (1.4%) |
| $75,000 to $99,999 | 126 (13.2%) | 49 (5.1%) |
| $100,000+ | 55 (5.8%) | 68 (7.1%) |
| Total | 954 (100.0%) | 953 (100.0%) |
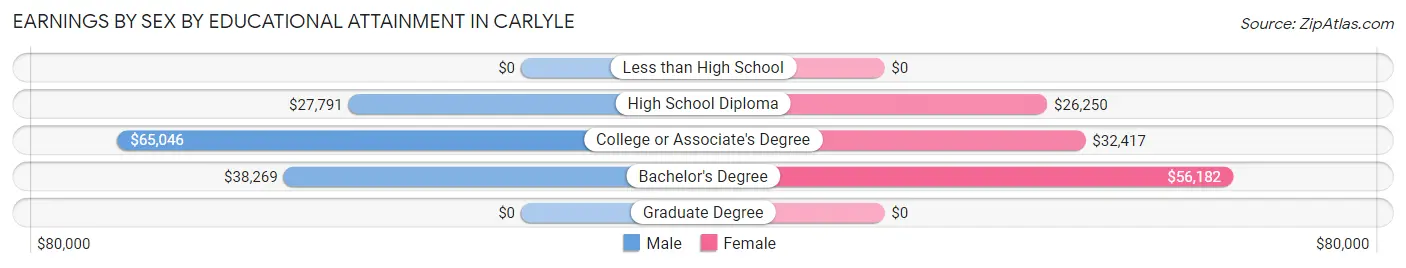
Earnings by Sex by Educational Attainment in Carlyle
Average earnings in Carlyle are $51,677 for men and $36,304 for women, a difference of 29.7%. Men with an educational attainment of college or associate's degree enjoy the highest average annual earnings of $65,046, while those with high school diploma education earn the least with $27,791. Women with an educational attainment of bachelor's degree earn the most with the average annual earnings of $56,182, while those with high school diploma education have the smallest earnings of $26,250.
| Educational Attainment | Male Income | Female Income |
| Less than High School | - | - |
| High School Diploma | $27,791 | $26,250 |
| College or Associate's Degree | $65,046 | $32,417 |
| Bachelor's Degree | $38,269 | $56,182 |
| Graduate Degree | - | - |
| Total | $51,677 | $36,304 |
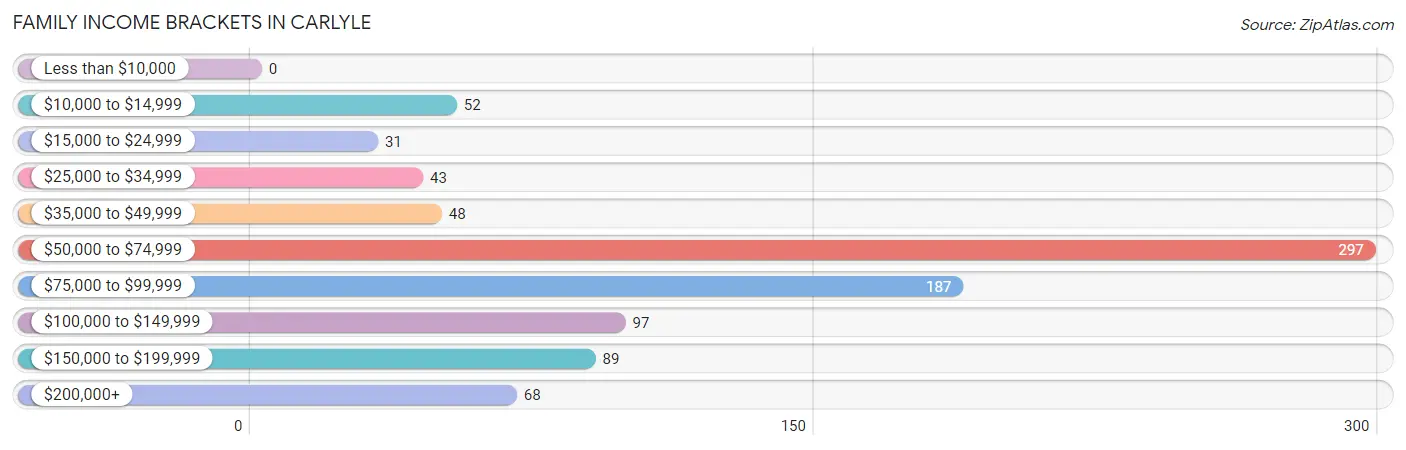
Family Income in Carlyle
Family Income Brackets in Carlyle
According to the Carlyle family income data, there are 297 families falling into the $50,000 to $74,999 income range, which is the most common income bracket and makes up 32.6% of all families.
| Income Bracket | # Families | % Families |
| Less than $10,000 | 0 | 0.0% |
| $10,000 to $14,999 | 52 | 5.7% |
| $15,000 to $24,999 | 31 | 3.4% |
| $25,000 to $34,999 | 43 | 4.7% |
| $35,000 to $49,999 | 48 | 5.3% |
| $50,000 to $74,999 | 297 | 32.6% |
| $75,000 to $99,999 | 187 | 20.5% |
| $100,000 to $149,999 | 97 | 10.6% |
| $150,000 to $199,999 | 89 | 9.8% |
| $200,000+ | 68 | 7.5% |
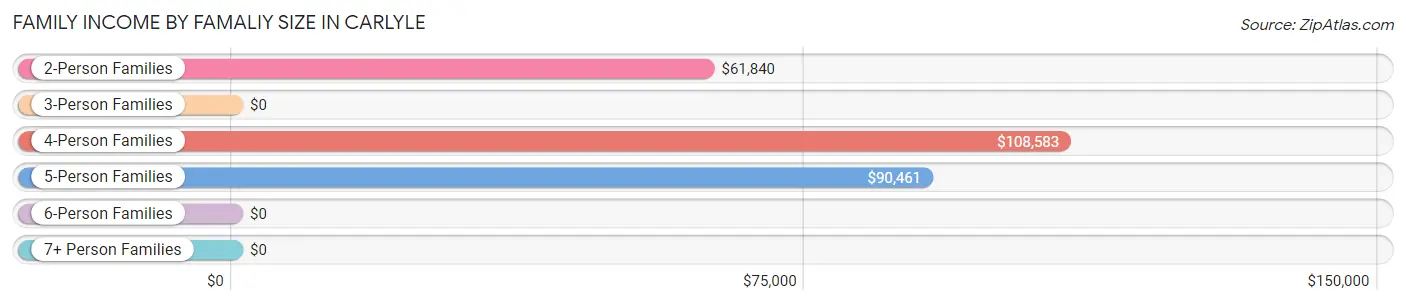
Family Income by Famaliy Size in Carlyle
4-person families (125 | 13.7%) account for the highest median family income in Carlyle with $108,583 per family, while 2-person families (467 | 51.2%) have the highest median income of $30,920 per family member.
| Income Bracket | # Families | Median Income |
| 2-Person Families | 467 (51.2%) | $61,840 |
| 3-Person Families | 164 (18.0%) | $0 |
| 4-Person Families | 125 (13.7%) | $108,583 |
| 5-Person Families | 147 (16.1%) | $90,461 |
| 6-Person Families | 0 (0.0%) | $0 |
| 7+ Person Families | 9 (1.0%) | $0 |
| Total | 912 (100.0%) | $74,292 |
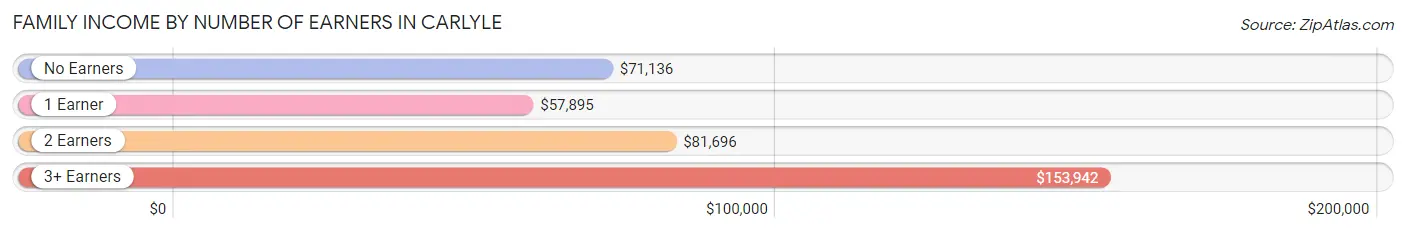
Family Income by Number of Earners in Carlyle
The median family income in Carlyle is $74,292, with families comprising 3+ earners (91) having the highest median family income of $153,942, while families with 1 earner (360) have the lowest median family income of $57,895, accounting for 10.0% and 39.5% of families, respectively.
| Number of Earners | # Families | Median Income |
| No Earners | 58 (6.4%) | $71,136 |
| 1 Earner | 360 (39.5%) | $57,895 |
| 2 Earners | 403 (44.2%) | $81,696 |
| 3+ Earners | 91 (10.0%) | $153,942 |
| Total | 912 (100.0%) | $74,292 |
Household Income in Carlyle
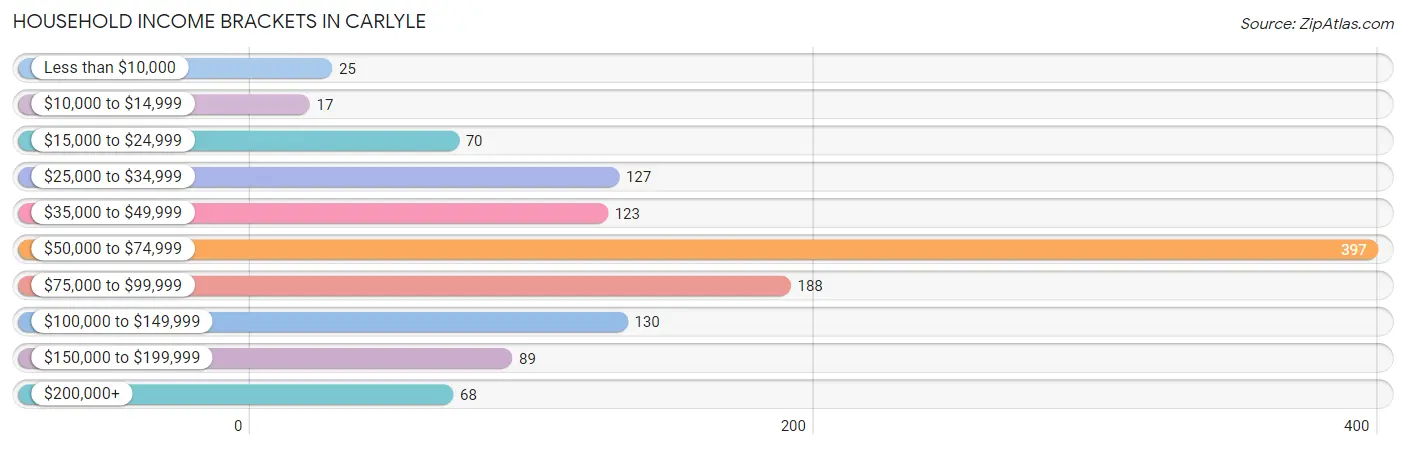
Household Income Brackets in Carlyle
With 397 households falling in the category, the $50,000 to $74,999 income range is the most frequent in Carlyle, accounting for 32.2% of all households. In contrast, only 17 households (1.4%) fall into the $10,000 to $14,999 income bracket, making it the least populous group.
| Income Bracket | # Households | % Households |
| Less than $10,000 | 25 | 2.0% |
| $10,000 to $14,999 | 17 | 1.4% |
| $15,000 to $24,999 | 70 | 5.7% |
| $25,000 to $34,999 | 127 | 10.3% |
| $35,000 to $49,999 | 123 | 10.0% |
| $50,000 to $74,999 | 397 | 32.2% |
| $75,000 to $99,999 | 188 | 15.2% |
| $100,000 to $149,999 | 130 | 10.5% |
| $150,000 to $199,999 | 89 | 7.2% |
| $200,000+ | 68 | 5.5% |
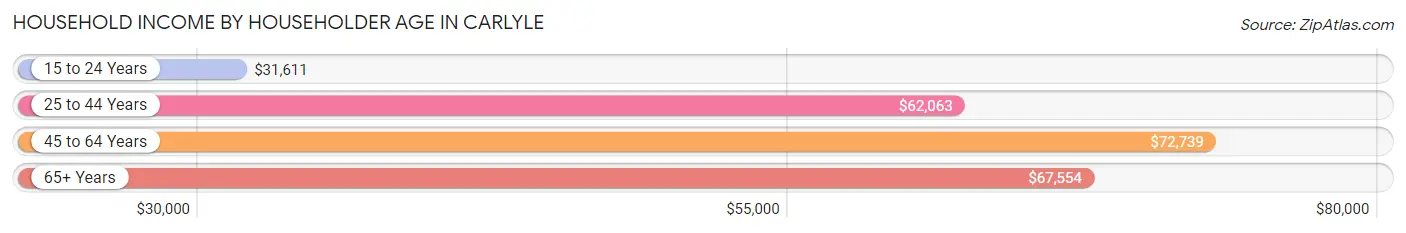
Household Income by Householder Age in Carlyle
The median household income in Carlyle is $65,286, with the highest median household income of $72,739 found in the 45 to 64 years age bracket for the primary householder. A total of 355 households (28.8%) fall into this category. Meanwhile, the 15 to 24 years age bracket for the primary householder has the lowest median household income of $31,611, with 67 households (5.4%) in this group.
| Income Bracket | # Households | Median Income |
| 15 to 24 Years | 67 (5.4%) | $31,611 |
| 25 to 44 Years | 569 (46.1%) | $62,063 |
| 45 to 64 Years | 355 (28.8%) | $72,739 |
| 65+ Years | 243 (19.7%) | $67,554 |
| Total | 1,234 (100.0%) | $65,286 |
Poverty in Carlyle
Income Below Poverty by Sex and Age in Carlyle
With 6.5% poverty level for males and 9.2% for females among the residents of Carlyle, 16 and 17 year old males and 16 and 17 year old females are the most vulnerable to poverty, with 18 males (37.5%) and 15 females (55.6%) in their respective age groups living below the poverty level.

| Age Bracket | Male | Female |
| Under 5 Years | 31 (22.0%) | 8 (42.1%) |
| 5 Years | 0 (0.0%) | 0 (0.0%) |
| 6 to 11 Years | 0 (0.0%) | 0 (0.0%) |
| 12 to 14 Years | 0 (0.0%) | 0 (0.0%) |
| 15 Years | 0 (0.0%) | 0 (0.0%) |
| 16 and 17 Years | 18 (37.5%) | 15 (55.6%) |
| 18 to 24 Years | 10 (3.7%) | 52 (33.8%) |
| 25 to 34 Years | 11 (4.0%) | 28 (12.4%) |
| 35 to 44 Years | 7 (3.7%) | 0 (0.0%) |
| 45 to 54 Years | 0 (0.0%) | 11 (5.7%) |
| 55 to 64 Years | 3 (2.1%) | 16 (8.9%) |
| 65 to 74 Years | 19 (15.6%) | 0 (0.0%) |
| 75 Years and over | 0 (0.0%) | 17 (15.7%) |
| Total | 99 (6.5%) | 147 (9.2%) |
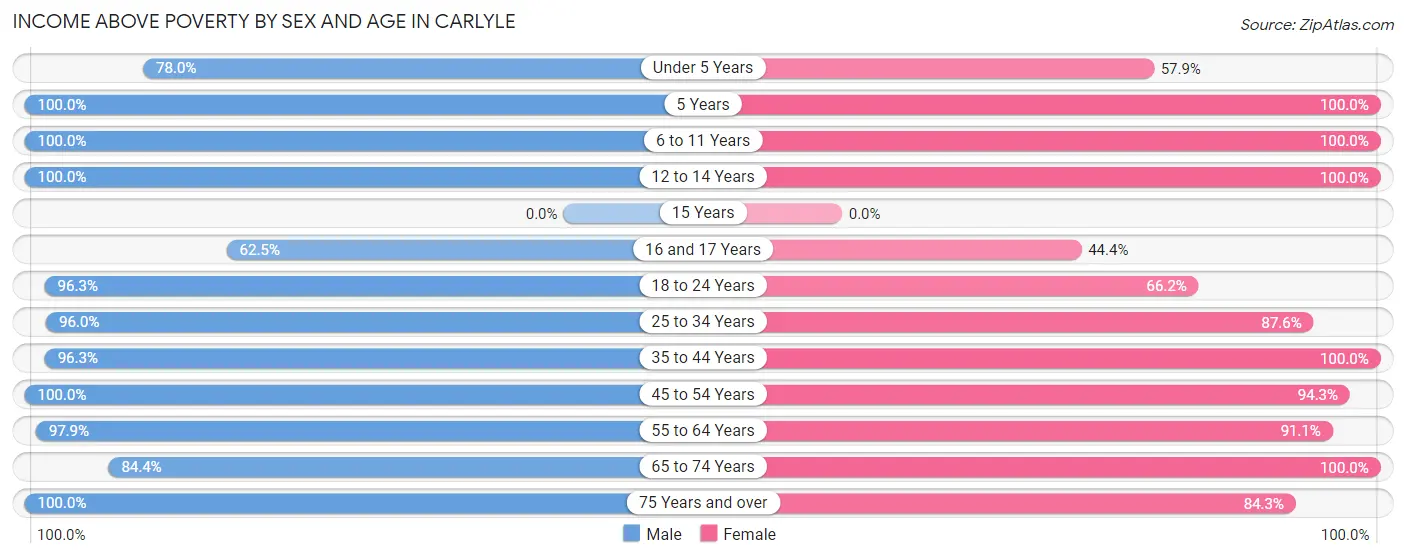
Income Above Poverty by Sex and Age in Carlyle
According to the poverty statistics in Carlyle, males aged 5 years and females aged 5 years are the age groups that are most secure financially, with 100.0% of males and 100.0% of females in these age groups living above the poverty line.
| Age Bracket | Male | Female |
| Under 5 Years | 110 (78.0%) | 11 (57.9%) |
| 5 Years | 25 (100.0%) | 61 (100.0%) |
| 6 to 11 Years | 135 (100.0%) | 158 (100.0%) |
| 12 to 14 Years | 12 (100.0%) | 42 (100.0%) |
| 15 Years | 0 (0.0%) | 0 (0.0%) |
| 16 and 17 Years | 30 (62.5%) | 12 (44.4%) |
| 18 to 24 Years | 259 (96.3%) | 102 (66.2%) |
| 25 to 34 Years | 265 (96.0%) | 197 (87.6%) |
| 35 to 44 Years | 180 (96.3%) | 289 (100.0%) |
| 45 to 54 Years | 108 (100.0%) | 182 (94.3%) |
| 55 to 64 Years | 141 (97.9%) | 164 (91.1%) |
| 65 to 74 Years | 103 (84.4%) | 143 (100.0%) |
| 75 Years and over | 50 (100.0%) | 91 (84.3%) |
| Total | 1,418 (93.5%) | 1,452 (90.8%) |
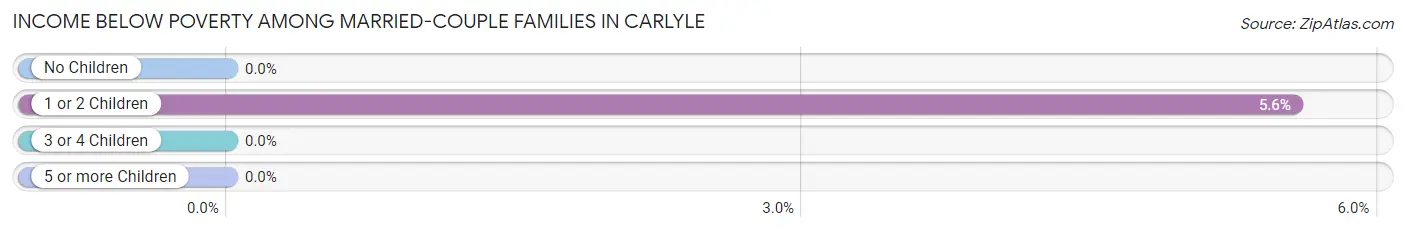
Income Below Poverty Among Married-Couple Families in Carlyle
The poverty statistics for married-couple families in Carlyle show that 1.4% or 9 of the total 659 families live below the poverty line. Families with 1 or 2 children have the highest poverty rate of 5.6%, comprising of 9 families. On the other hand, families with no children have the lowest poverty rate of 0.0%, which includes 0 families.
| Children | Above Poverty | Below Poverty |
| No Children | 350 (100.0%) | 0 (0.0%) |
| 1 or 2 Children | 153 (94.4%) | 9 (5.6%) |
| 3 or 4 Children | 147 (100.0%) | 0 (0.0%) |
| 5 or more Children | 0 (0.0%) | 0 (0.0%) |
| Total | 650 (98.6%) | 9 (1.4%) |
Income Below Poverty Among Single-Parent Households in Carlyle
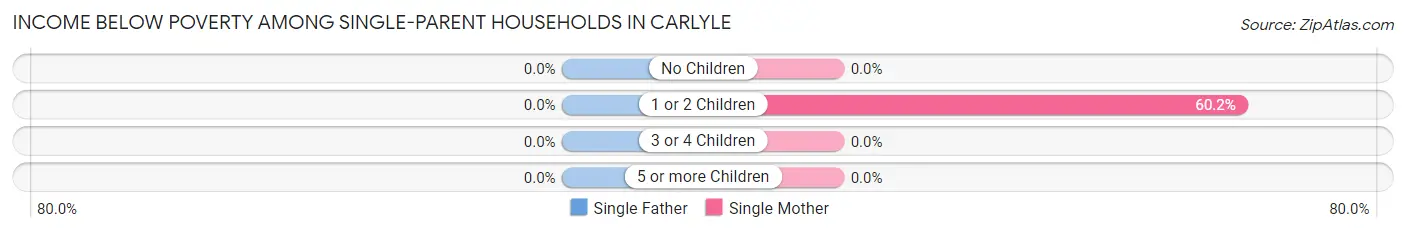
| Children | Single Father | Single Mother |
| No Children | 0 (0.0%) | 0 (0.0%) |
| 1 or 2 Children | 0 (0.0%) | 68 (60.2%) |
| 3 or 4 Children | 0 (0.0%) | 0 (0.0%) |
| 5 or more Children | 0 (0.0%) | 0 (0.0%) |
| Total | 0 (0.0%) | 68 (39.8%) |
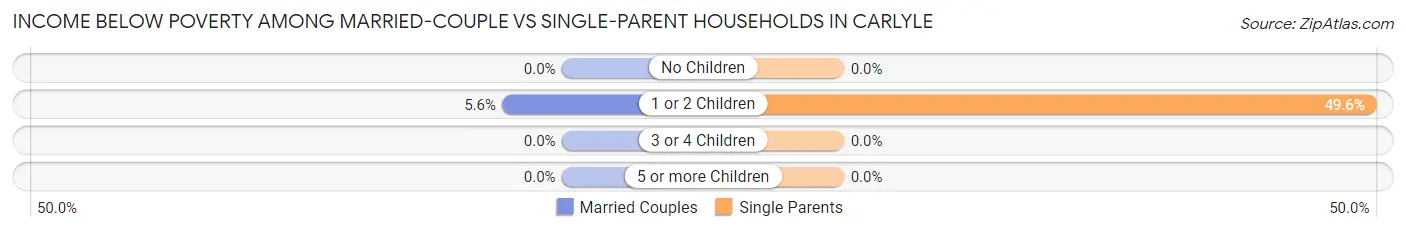
Income Below Poverty Among Married-Couple vs Single-Parent Households in Carlyle
The poverty data for Carlyle shows that 9 of the married-couple family households (1.4%) and 68 of the single-parent households (26.9%) are living below the poverty level. Within the married-couple family households, those with 1 or 2 children have the highest poverty rate, with 9 households (5.6%) falling below the poverty line. Among the single-parent households, those with 1 or 2 children have the highest poverty rate, with 68 household (49.6%) living below poverty.
| Children | Married-Couple Families | Single-Parent Households |
| No Children | 0 (0.0%) | 0 (0.0%) |
| 1 or 2 Children | 9 (5.6%) | 68 (49.6%) |
| 3 or 4 Children | 0 (0.0%) | 0 (0.0%) |
| 5 or more Children | 0 (0.0%) | 0 (0.0%) |
| Total | 9 (1.4%) | 68 (26.9%) |
Race in Carlyle
The most populous races in Carlyle are White / Caucasian (2,921 | 89.8%), Two or more Races (241 | 7.4%), and Black / African American (86 | 2.6%).

| Race | # Population | % Population |
| Asian | 0 | 0.0% |
| Black / African American | 86 | 2.6% |
| Hawaiian / Pacific | 0 | 0.0% |
| Hispanic or Latino | 46 | 1.4% |
| Native / Alaskan | 4 | 0.1% |
| White / Caucasian | 2,921 | 89.8% |
| Two or more Races | 241 | 7.4% |
| Some other Race | 0 | 0.0% |
| Total | 3,252 | 100.0% |
Ancestry in Carlyle
The most populous ancestries reported in Carlyle are German (869 | 26.7%), French (335 | 10.3%), Irish (291 | 8.9%), American (242 | 7.4%), and English (147 | 4.5%), together accounting for 57.9% of all Carlyle residents.
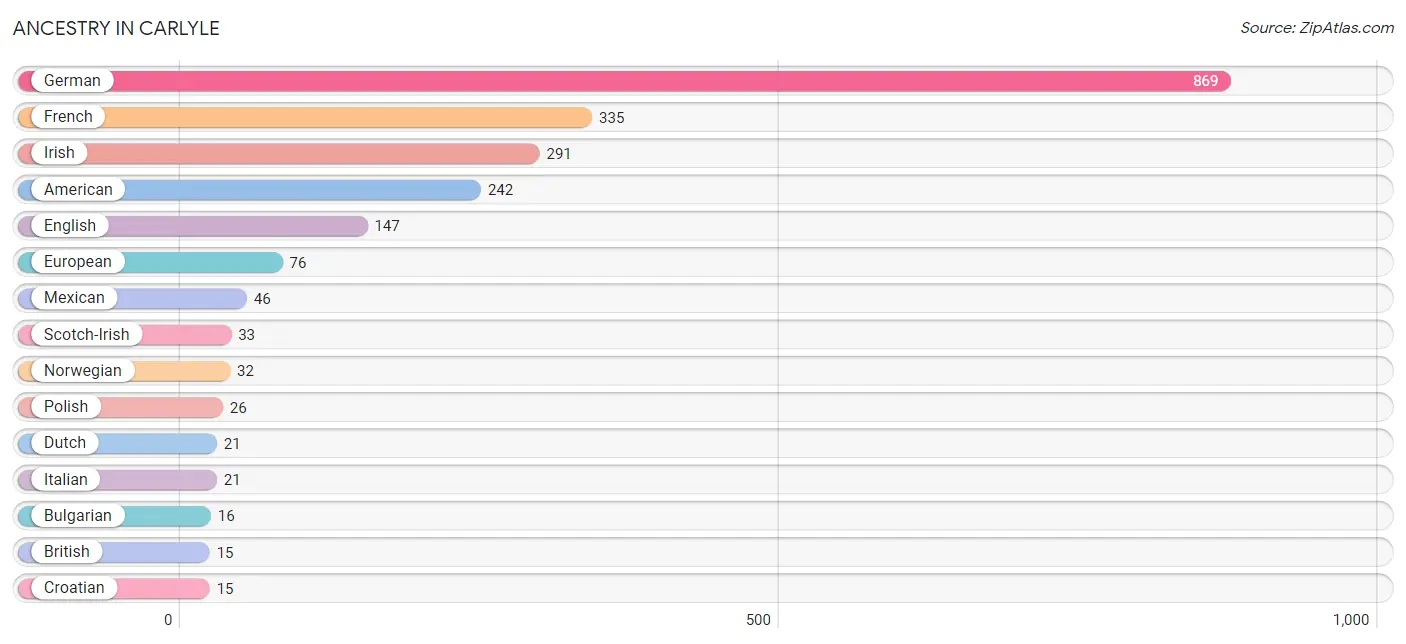
| Ancestry | # Population | % Population |
| Alaska Native | 4 | 0.1% |
| American | 242 | 7.4% |
| British | 15 | 0.5% |
| Bulgarian | 16 | 0.5% |
| Cherokee | 9 | 0.3% |
| Croatian | 15 | 0.5% |
| Czech | 14 | 0.4% |
| Dutch | 21 | 0.6% |
| Eastern European | 1 | 0.0% |
| English | 147 | 4.5% |
| European | 76 | 2.3% |
| French | 335 | 10.3% |
| French Canadian | 14 | 0.4% |
| German | 869 | 26.7% |
| Hungarian | 10 | 0.3% |
| Irish | 291 | 8.9% |
| Italian | 21 | 0.6% |
| Mexican | 46 | 1.4% |
| Norwegian | 32 | 1.0% |
| Polish | 26 | 0.8% |
| Scotch-Irish | 33 | 1.0% |
| Scottish | 11 | 0.3% |
| Swedish | 13 | 0.4% | View All 23 Rows |
Immigrants in Carlyle
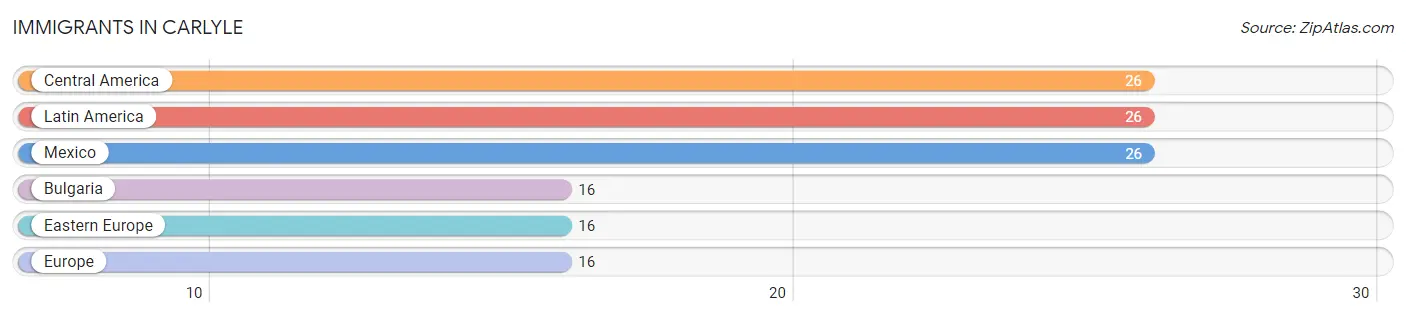
The most numerous immigrant groups reported in Carlyle came from Central America (26 | 0.8%), Latin America (26 | 0.8%), Mexico (26 | 0.8%), Bulgaria (16 | 0.5%), and Eastern Europe (16 | 0.5%), together accounting for 3.4% of all Carlyle residents.
| Immigration Origin | # Population | % Population |
| Bulgaria | 16 | 0.5% |
| Central America | 26 | 0.8% |
| Eastern Europe | 16 | 0.5% |
| Europe | 16 | 0.5% |
| Latin America | 26 | 0.8% |
| Mexico | 26 | 0.8% | View All 6 Rows |
Sex and Age in Carlyle
Sex and Age in Carlyle
The most populous age groups in Carlyle are 30 to 34 Years (218 | 13.7%) for men and 35 to 39 Years (190 | 11.4%) for women.

| Age Bracket | Male | Female |
| Under 5 Years | 141 (8.9%) | 19 (1.1%) |
| 5 to 9 Years | 144 (9.1%) | 113 (6.8%) |
| 10 to 14 Years | 28 (1.8%) | 148 (8.9%) |
| 15 to 19 Years | 191 (12.0%) | 37 (2.2%) |
| 20 to 24 Years | 126 (7.9%) | 144 (8.6%) |
| 25 to 29 Years | 59 (3.7%) | 118 (7.1%) |
| 30 to 34 Years | 218 (13.7%) | 109 (6.6%) |
| 35 to 39 Years | 91 (5.7%) | 190 (11.4%) |
| 40 to 44 Years | 105 (6.6%) | 101 (6.1%) |
| 45 to 49 Years | 95 (6.0%) | 100 (6.0%) |
| 50 to 54 Years | 37 (2.3%) | 116 (7.0%) |
| 55 to 59 Years | 45 (2.8%) | 103 (6.2%) |
| 60 to 64 Years | 103 (6.5%) | 77 (4.6%) |
| 65 to 69 Years | 91 (5.7%) | 81 (4.9%) |
| 70 to 74 Years | 35 (2.2%) | 71 (4.3%) |
| 75 to 79 Years | 39 (2.5%) | 56 (3.4%) |
| 80 to 84 Years | 12 (0.8%) | 36 (2.2%) |
| 85 Years and over | 28 (1.8%) | 45 (2.7%) |
| Total | 1,588 (100.0%) | 1,664 (100.0%) |
Families and Households in Carlyle
Median Family Size in Carlyle
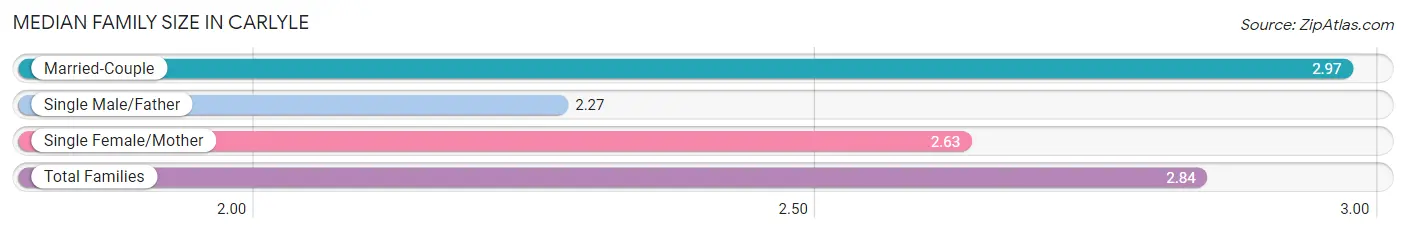
The median family size in Carlyle is 2.84 persons per family, with married-couple families (659 | 72.3%) accounting for the largest median family size of 2.97 persons per family. On the other hand, single male/father families (82 | 9.0%) represent the smallest median family size with 2.27 persons per family.
| Family Type | # Families | Family Size |
| Married-Couple | 659 (72.3%) | 2.97 |
| Single Male/Father | 82 (9.0%) | 2.27 |
| Single Female/Mother | 171 (18.8%) | 2.63 |
| Total Families | 912 (100.0%) | 2.84 |
Median Household Size in Carlyle
The median household size in Carlyle is 2.48 persons per household, with single female/mother households (171 | 13.9%) accounting for the largest median household size of 3.02 persons per household. non-family households (322 | 26.1%) represent the smallest median household size with 1.18 persons per household.

| Household Type | # Households | Household Size |
| Married-Couple | 659 (53.4%) | 2.97 |
| Single Male/Father | 82 (6.7%) | 2.54 |
| Single Female/Mother | 171 (13.9%) | 3.02 |
| Non-family | 322 (26.1%) | 1.18 |
| Total Households | 1,234 (100.0%) | 2.48 |
Household Size by Marriage Status in Carlyle
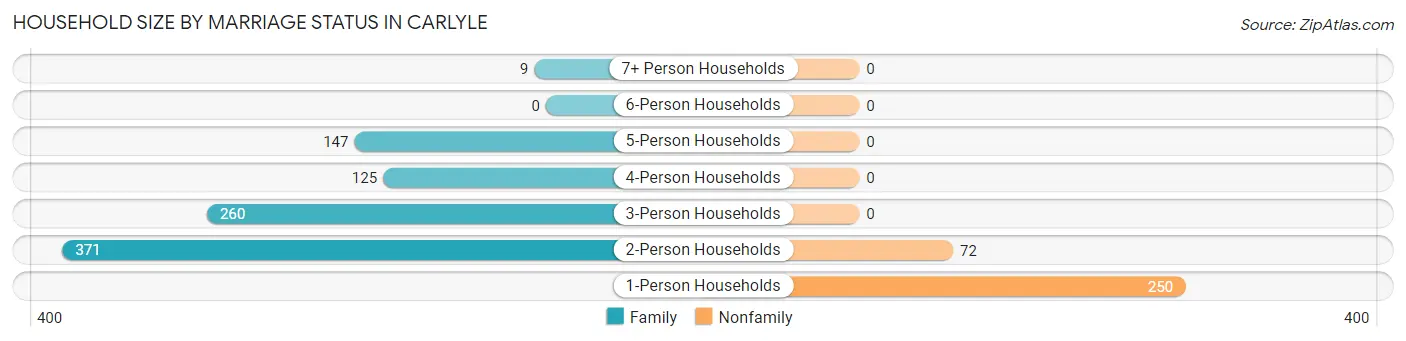
Out of a total of 1,234 households in Carlyle, 912 (73.9%) are family households, while 322 (26.1%) are nonfamily households. The most numerous type of family households are 2-person households, comprising 371, and the most common type of nonfamily households are 1-person households, comprising 250.
| Household Size | Family Households | Nonfamily Households |
| 1-Person Households | - | 250 (20.3%) |
| 2-Person Households | 371 (30.1%) | 72 (5.8%) |
| 3-Person Households | 260 (21.1%) | 0 (0.0%) |
| 4-Person Households | 125 (10.1%) | 0 (0.0%) |
| 5-Person Households | 147 (11.9%) | 0 (0.0%) |
| 6-Person Households | 0 (0.0%) | 0 (0.0%) |
| 7+ Person Households | 9 (0.7%) | 0 (0.0%) |
| Total | 912 (73.9%) | 322 (26.1%) |
Female Fertility in Carlyle
Fertility by Age in Carlyle
Average fertility rate in Carlyle is 89.0 births per 1,000 women. Women in the age bracket of 20 to 34 years have the highest fertility rate with 194.0 births per 1,000 women. Women in the age bracket of 20 to 34 years acount for 100.0% of all women with births.
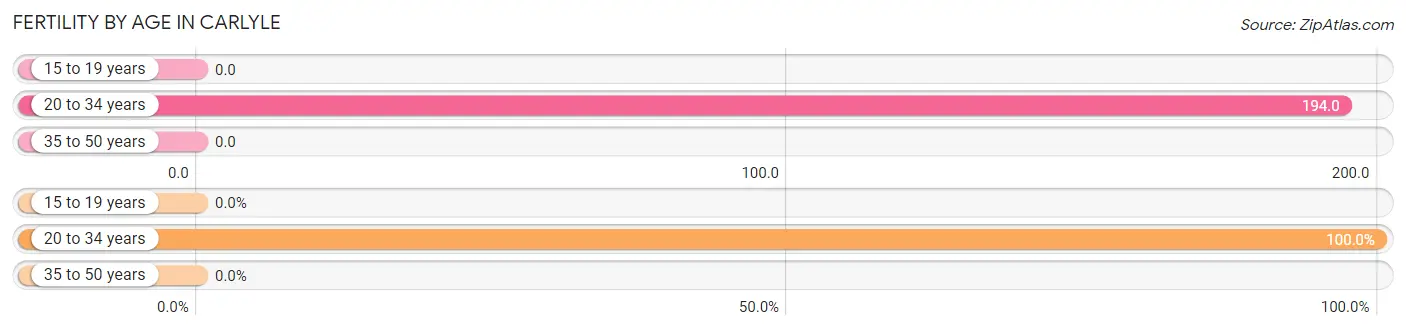
| Age Bracket | Women with Births | Births / 1,000 Women |
| 15 to 19 years | 0 (0.0%) | 0.0 |
| 20 to 34 years | 72 (100.0%) | 194.0 |
| 35 to 50 years | 0 (0.0%) | 0.0 |
| Total | 72 (100.0%) | 89.0 |
Fertility by Age by Marriage Status in Carlyle
27.8% of women with births (72) in Carlyle are married. The highest percentage of unmarried women with births falls into 20 to 34 years age bracket with 72.2% of them unmarried at the time of birth, while the lowest percentage of unmarried women with births belong to 20 to 34 years age bracket with 72.2% of them unmarried.

| Age Bracket | Married | Unmarried |
| 15 to 19 years | 0 (0.0%) | 0 (0.0%) |
| 20 to 34 years | 20 (27.8%) | 52 (72.2%) |
| 35 to 50 years | 0 (0.0%) | 0 (0.0%) |
| Total | 20 (27.8%) | 52 (72.2%) |
Fertility by Education in Carlyle
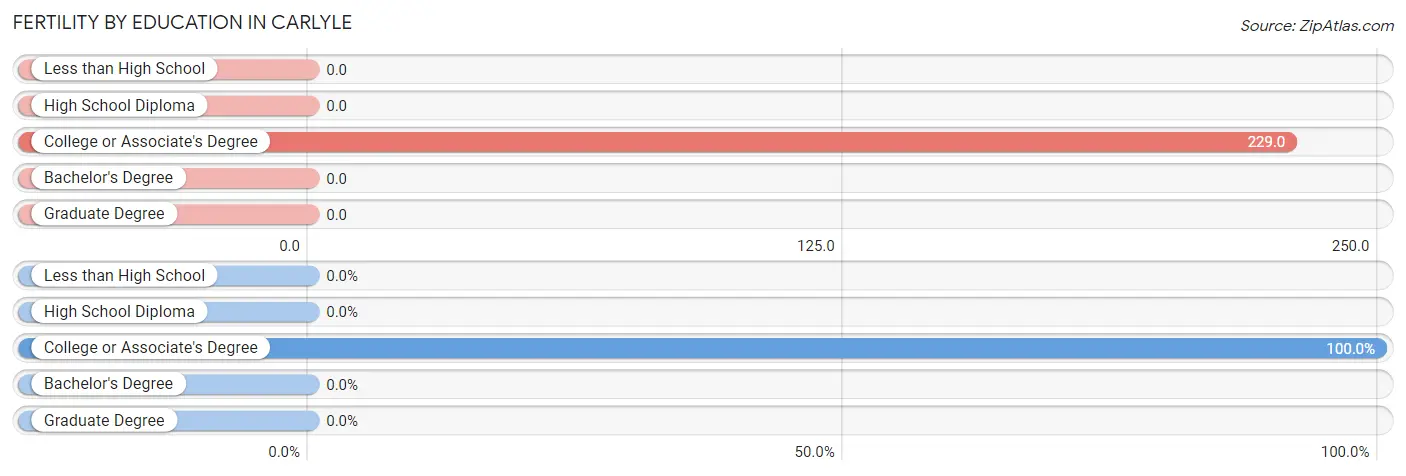
| Educational Attainment | Women with Births | Births / 1,000 Women |
| Less than High School | 0 (0.0%) | 0.0 |
| High School Diploma | 0 (0.0%) | 0.0 |
| College or Associate's Degree | 72 (100.0%) | 229.0 |
| Bachelor's Degree | 0 (0.0%) | 0.0 |
| Graduate Degree | 0 (0.0%) | 0.0 |
| Total | 72 (100.0%) | 89.0 |
Fertility by Education by Marriage Status in Carlyle
72.2% of women with births in Carlyle are unmarried. Women with the educational attainment of college or associate's degree are most likely to be married with 27.8% of them married at childbirth, while women with the educational attainment of college or associate's degree are least likely to be married with 72.2% of them unmarried at childbirth.

| Educational Attainment | Married | Unmarried |
| Less than High School | 0 (0.0%) | 0 (0.0%) |
| High School Diploma | 0 (0.0%) | 0 (0.0%) |
| College or Associate's Degree | 20 (27.8%) | 52 (72.2%) |
| Bachelor's Degree | 0 (0.0%) | 0 (0.0%) |
| Graduate Degree | 0 (0.0%) | 0 (0.0%) |
| Total | 20 (27.8%) | 52 (72.2%) |
Employment Characteristics in Carlyle
Employment by Class of Employer in Carlyle
Among the 1,813 employed individuals in Carlyle, private company employees (1,299 | 71.7%), not-for-profit organizations (154 | 8.5%), and local government employees (138 | 7.6%) make up the most common classes of employment.

| Employer Class | # Employees | % Employees |
| Private Company Employees | 1,299 | 71.7% |
| Self-Employed (Incorporated) | 56 | 3.1% |
| Self-Employed (Not Incorporated) | 78 | 4.3% |
| Not-for-profit Organizations | 154 | 8.5% |
| Local Government Employees | 138 | 7.6% |
| State Government Employees | 88 | 4.9% |
| Federal Government Employees | 0 | 0.0% |
| Unpaid Family Workers | 0 | 0.0% |
| Total | 1,813 | 100.0% |
Employment Status by Age in Carlyle
According to the labor force statistics for Carlyle, out of the total population over 16 years of age (2,659), 71.6% or 1,904 individuals are in the labor force, with 4.8% or 91 of them unemployed. The age group with the highest labor force participation rate is 25 to 29 years, with 92.7% or 164 individuals in the labor force. Within the labor force, the 16 to 19 years age range has the highest percentage of unemployed individuals, with 32.8% or 60 of them being unemployed.

| Age Bracket | In Labor Force | Unemployed |
| 16 to 19 Years | 183 (80.3%) | 60 (32.8%) |
| 20 to 24 Years | 234 (86.7%) | 0 (0.0%) |
| 25 to 29 Years | 164 (92.7%) | 0 (0.0%) |
| 30 to 34 Years | 286 (87.5%) | 0 (0.0%) |
| 35 to 44 Years | 361 (74.1%) | 15 (4.2%) |
| 45 to 54 Years | 281 (80.7%) | 17 (6.0%) |
| 55 to 59 Years | 128 (86.5%) | 0 (0.0%) |
| 60 to 64 Years | 116 (64.4%) | 0 (0.0%) |
| 65 to 74 Years | 112 (40.3%) | 0 (0.0%) |
| 75 Years and over | 40 (18.5%) | 0 (0.0%) |
| Total | 1,904 (71.6%) | 91 (4.8%) |
Employment Status by Educational Attainment in Carlyle
According to labor force statistics for Carlyle, 80.1% of individuals (1,335) out of the total population between 25 and 64 years of age (1,667) are in the labor force, with 2.4% or 32 of them being unemployed. The group with the highest labor force participation rate are those with the educational attainment of college / associate degree, with 91.4% or 679 individuals in the labor force. Within the labor force, individuals with high school diploma education have the highest percentage of unemployment, with 8.2% or 32 of them being unemployed.

| Educational Attainment | In Labor Force | Unemployed |
| Less than High School | 0 (0.0%) | 0 (0.0%) |
| High School Diploma | 389 (76.6%) | 42 (8.2%) |
| College / Associate Degree | 679 (91.4%) | 0 (0.0%) |
| Bachelor's Degree or higher | 268 (72.2%) | 0 (0.0%) |
| Total | 1,335 (80.1%) | 40 (2.4%) |
Employment Occupations by Sex in Carlyle
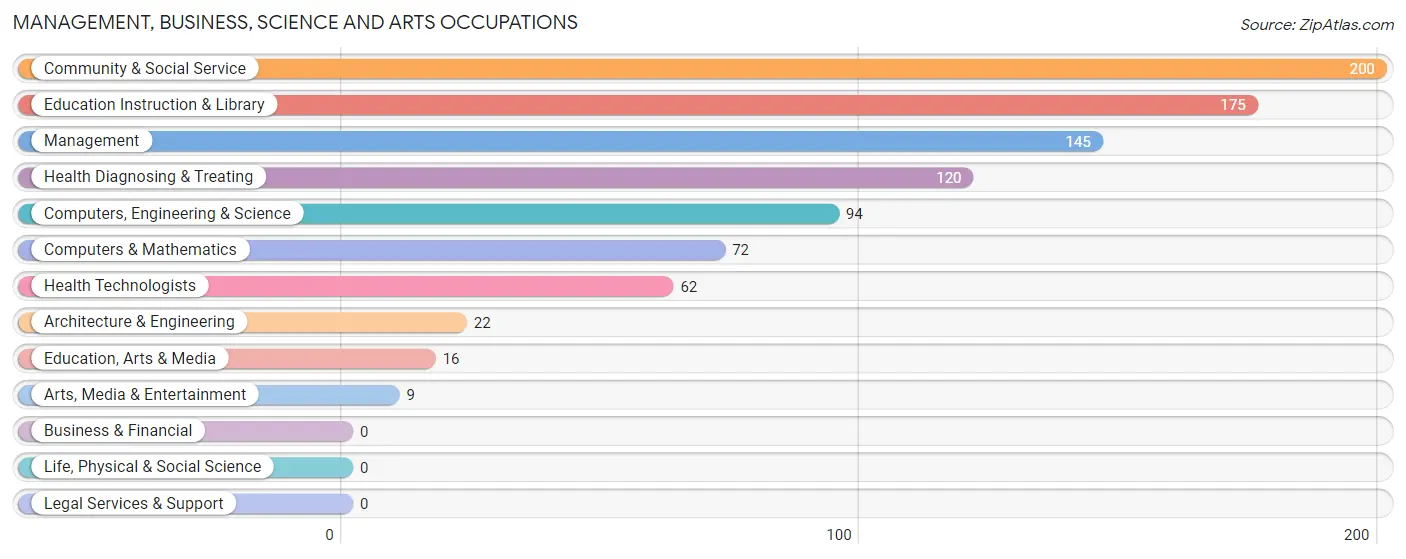
Management, Business, Science and Arts Occupations
The most common Management, Business, Science and Arts occupations in Carlyle are Community & Social Service (200 | 11.0%), Education Instruction & Library (175 | 9.7%), Management (145 | 8.0%), Health Diagnosing & Treating (120 | 6.6%), and Computers, Engineering & Science (94 | 5.2%).
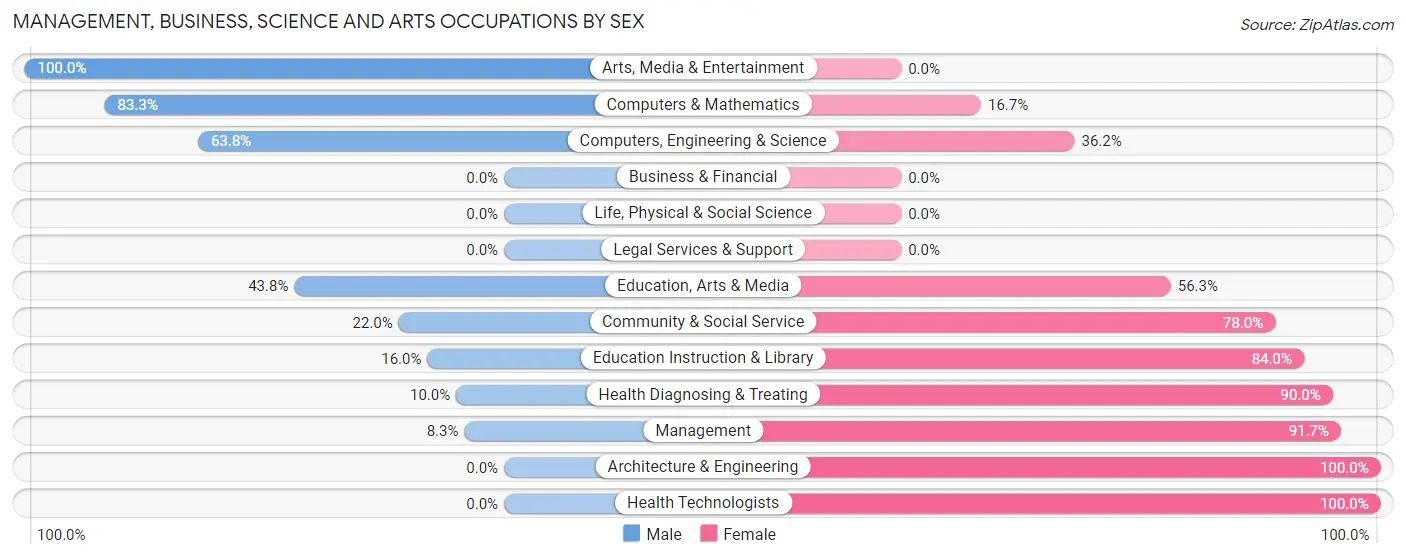
Management, Business, Science and Arts Occupations by Sex
Within the Management, Business, Science and Arts occupations in Carlyle, the most male-oriented occupations are Arts, Media & Entertainment (100.0%), Computers & Mathematics (83.3%), and Computers, Engineering & Science (63.8%), while the most female-oriented occupations are Architecture & Engineering (100.0%), Health Technologists (100.0%), and Management (91.7%).
| Occupation | Male | Female |
| Management | 12 (8.3%) | 133 (91.7%) |
| Business & Financial | 0 (0.0%) | 0 (0.0%) |
| Computers, Engineering & Science | 60 (63.8%) | 34 (36.2%) |
| Computers & Mathematics | 60 (83.3%) | 12 (16.7%) |
| Architecture & Engineering | 0 (0.0%) | 22 (100.0%) |
| Life, Physical & Social Science | 0 (0.0%) | 0 (0.0%) |
| Community & Social Service | 44 (22.0%) | 156 (78.0%) |
| Education, Arts & Media | 7 (43.8%) | 9 (56.2%) |
| Legal Services & Support | 0 (0.0%) | 0 (0.0%) |
| Education Instruction & Library | 28 (16.0%) | 147 (84.0%) |
| Arts, Media & Entertainment | 9 (100.0%) | 0 (0.0%) |
| Health Diagnosing & Treating | 12 (10.0%) | 108 (90.0%) |
| Health Technologists | 0 (0.0%) | 62 (100.0%) |
| Total (Category) | 128 (22.9%) | 431 (77.1%) |
| Total (Overall) | 920 (50.7%) | 893 (49.3%) |
Services Occupations
The most common Services occupations in Carlyle are Cleaning & Maintenance (122 | 6.7%), Food Preparation & Serving (89 | 4.9%), Security & Protection (77 | 4.3%), Law Enforcement (77 | 4.3%), and Healthcare Support (75 | 4.1%).

Services Occupations by Sex
Within the Services occupations in Carlyle, the most male-oriented occupations are Security & Protection (100.0%), Law Enforcement (100.0%), and Cleaning & Maintenance (59.8%), while the most female-oriented occupations are Healthcare Support (100.0%), Personal Care & Service (62.9%), and Food Preparation & Serving (51.7%).
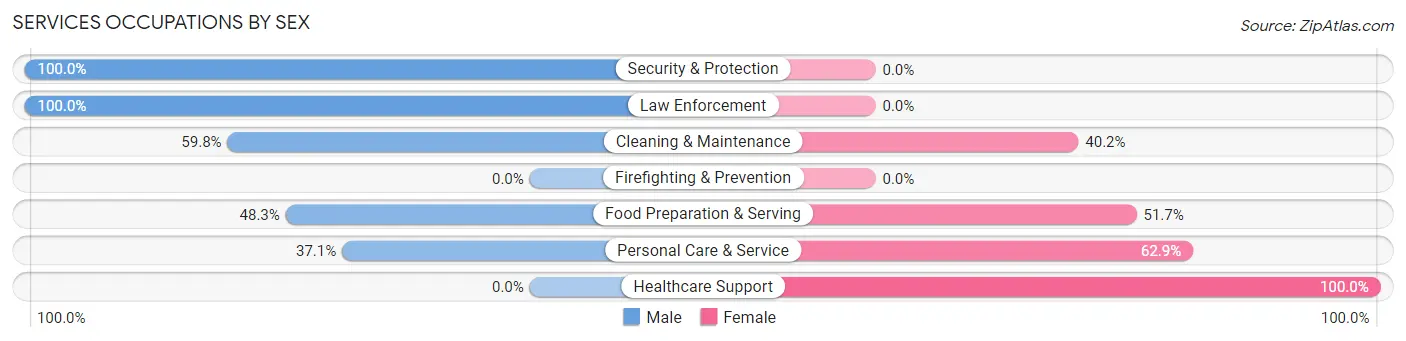
| Occupation | Male | Female |
| Healthcare Support | 0 (0.0%) | 75 (100.0%) |
| Security & Protection | 77 (100.0%) | 0 (0.0%) |
| Firefighting & Prevention | 0 (0.0%) | 0 (0.0%) |
| Law Enforcement | 77 (100.0%) | 0 (0.0%) |
| Food Preparation & Serving | 43 (48.3%) | 46 (51.7%) |
| Cleaning & Maintenance | 73 (59.8%) | 49 (40.2%) |
| Personal Care & Service | 13 (37.1%) | 22 (62.9%) |
| Total (Category) | 206 (51.8%) | 192 (48.2%) |
| Total (Overall) | 920 (50.7%) | 893 (49.3%) |
Sales and Office Occupations
The most common Sales and Office occupations in Carlyle are Sales & Related (172 | 9.5%), and Office & Administration (104 | 5.7%).

Sales and Office Occupations by Sex
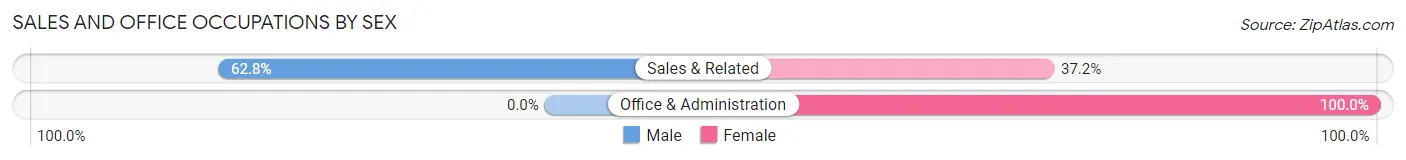
| Occupation | Male | Female |
| Sales & Related | 108 (62.8%) | 64 (37.2%) |
| Office & Administration | 0 (0.0%) | 104 (100.0%) |
| Total (Category) | 108 (39.1%) | 168 (60.9%) |
| Total (Overall) | 920 (50.7%) | 893 (49.3%) |
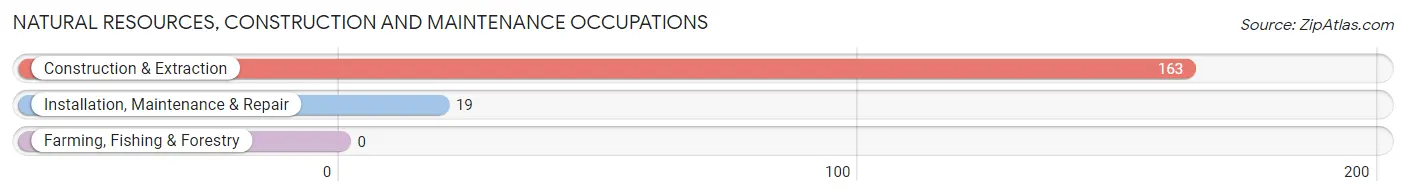
Natural Resources, Construction and Maintenance Occupations
The most common Natural Resources, Construction and Maintenance occupations in Carlyle are Construction & Extraction (163 | 9.0%), and Installation, Maintenance & Repair (19 | 1.1%).
Natural Resources, Construction and Maintenance Occupations by Sex
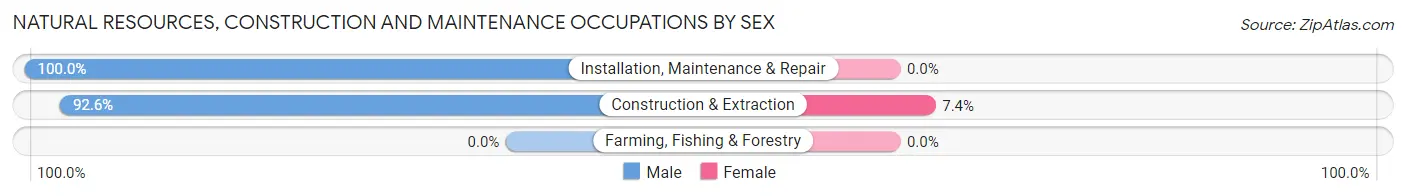
| Occupation | Male | Female |
| Farming, Fishing & Forestry | 0 (0.0%) | 0 (0.0%) |
| Construction & Extraction | 151 (92.6%) | 12 (7.4%) |
| Installation, Maintenance & Repair | 19 (100.0%) | 0 (0.0%) |
| Total (Category) | 170 (93.4%) | 12 (6.6%) |
| Total (Overall) | 920 (50.7%) | 893 (49.3%) |
Production, Transportation and Moving Occupations
The most common Production, Transportation and Moving occupations in Carlyle are Transportation (150 | 8.3%), Material Moving (145 | 8.0%), and Production (103 | 5.7%).

Production, Transportation and Moving Occupations by Sex

| Occupation | Male | Female |
| Production | 48 (46.6%) | 55 (53.4%) |
| Transportation | 150 (100.0%) | 0 (0.0%) |
| Material Moving | 110 (75.9%) | 35 (24.1%) |
| Total (Category) | 308 (77.4%) | 90 (22.6%) |
| Total (Overall) | 920 (50.7%) | 893 (49.3%) |
Employment Industries by Sex in Carlyle
Employment Industries in Carlyle
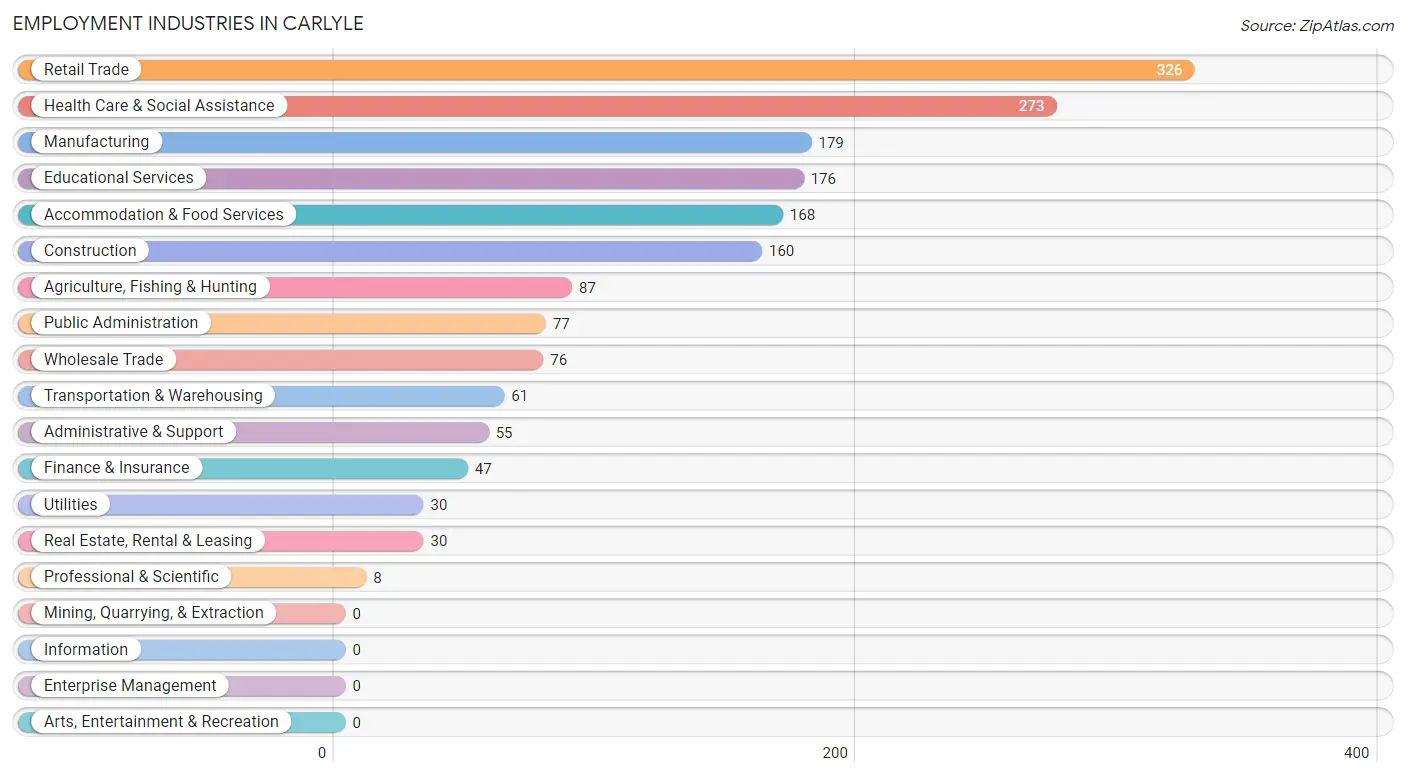
The major employment industries in Carlyle include Retail Trade (326 | 18.0%), Health Care & Social Assistance (273 | 15.1%), Manufacturing (179 | 9.9%), Educational Services (176 | 9.7%), and Accommodation & Food Services (168 | 9.3%).
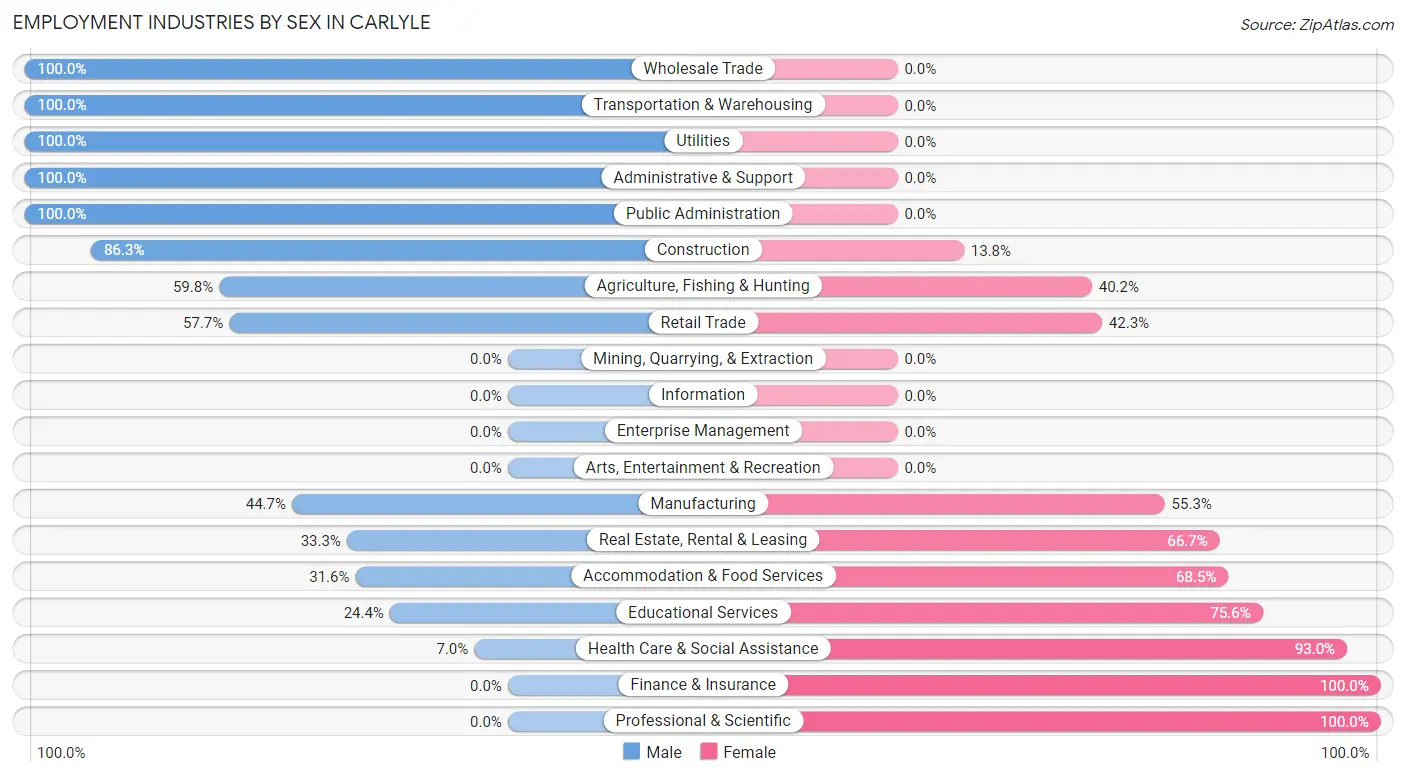
Employment Industries by Sex in Carlyle
The Carlyle industries that see more men than women are Wholesale Trade (100.0%), Transportation & Warehousing (100.0%), and Utilities (100.0%), whereas the industries that tend to have a higher number of women are Finance & Insurance (100.0%), Professional & Scientific (100.0%), and Health Care & Social Assistance (93.0%).
| Industry | Male | Female |
| Agriculture, Fishing & Hunting | 52 (59.8%) | 35 (40.2%) |
| Mining, Quarrying, & Extraction | 0 (0.0%) | 0 (0.0%) |
| Construction | 138 (86.3%) | 22 (13.8%) |
| Manufacturing | 80 (44.7%) | 99 (55.3%) |
| Wholesale Trade | 76 (100.0%) | 0 (0.0%) |
| Retail Trade | 188 (57.7%) | 138 (42.3%) |
| Transportation & Warehousing | 61 (100.0%) | 0 (0.0%) |
| Utilities | 30 (100.0%) | 0 (0.0%) |
| Information | 0 (0.0%) | 0 (0.0%) |
| Finance & Insurance | 0 (0.0%) | 47 (100.0%) |
| Real Estate, Rental & Leasing | 10 (33.3%) | 20 (66.7%) |
| Professional & Scientific | 0 (0.0%) | 8 (100.0%) |
| Enterprise Management | 0 (0.0%) | 0 (0.0%) |
| Administrative & Support | 55 (100.0%) | 0 (0.0%) |
| Educational Services | 43 (24.4%) | 133 (75.6%) |
| Health Care & Social Assistance | 19 (7.0%) | 254 (93.0%) |
| Arts, Entertainment & Recreation | 0 (0.0%) | 0 (0.0%) |
| Accommodation & Food Services | 53 (31.6%) | 115 (68.4%) |
| Public Administration | 77 (100.0%) | 0 (0.0%) |
| Total | 920 (50.7%) | 893 (49.3%) |
Education in Carlyle
School Enrollment in Carlyle
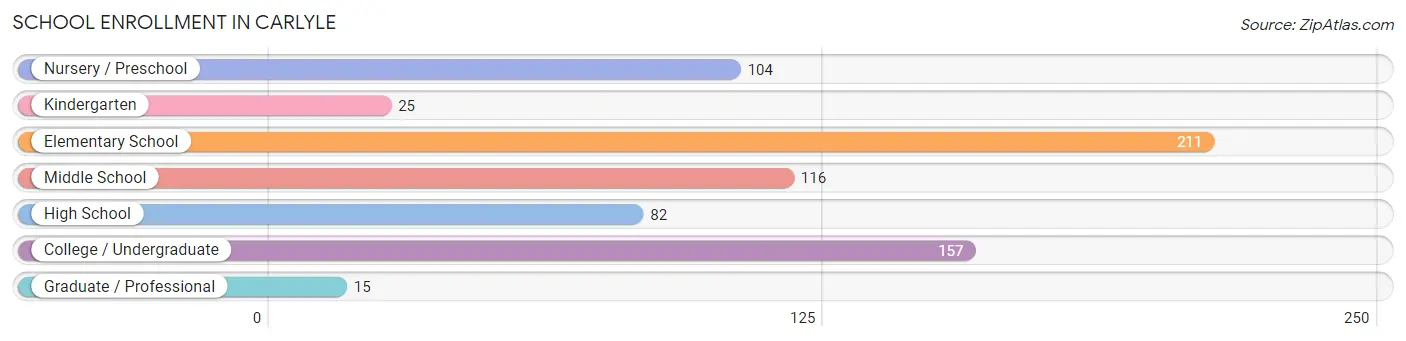
The most common levels of schooling among the 710 students in Carlyle are elementary school (211 | 29.7%), college / undergraduate (157 | 22.1%), and middle school (116 | 16.3%).
| School Level | # Students | % Students |
| Nursery / Preschool | 104 | 14.6% |
| Kindergarten | 25 | 3.5% |
| Elementary School | 211 | 29.7% |
| Middle School | 116 | 16.3% |
| High School | 82 | 11.6% |
| College / Undergraduate | 157 | 22.1% |
| Graduate / Professional | 15 | 2.1% |
| Total | 710 | 100.0% |
School Enrollment by Age by Funding Source in Carlyle
Out of a total of 710 students who are enrolled in schools in Carlyle, 96 (13.5%) attend a private institution, while the remaining 614 (86.5%) are enrolled in public schools. The age group of 20 to 24 year olds has the highest likelihood of being enrolled in private schools, with 52 (59.1% in the age bracket) enrolled. Conversely, the age group of 10 to 14 year olds has the lowest likelihood of being enrolled in a private school, with 176 (100.0% in the age bracket) attending a public institution.

| Age Bracket | Public School | Private School |
| 3 to 4 Year Olds | 33 (76.7%) | 10 (23.3%) |
| 5 to 9 Year Old | 210 (86.1%) | 34 (13.9%) |
| 10 to 14 Year Olds | 176 (100.0%) | 0 (0.0%) |
| 15 to 17 Year Olds | 75 (100.0%) | 0 (0.0%) |
| 18 to 19 Year Olds | 21 (100.0%) | 0 (0.0%) |
| 20 to 24 Year Olds | 36 (40.9%) | 52 (59.1%) |
| 25 to 34 Year Olds | 24 (100.0%) | 0 (0.0%) |
| 35 Years and over | 39 (100.0%) | 0 (0.0%) |
| Total | 614 (86.5%) | 96 (13.5%) |
Educational Attainment by Field of Study in Carlyle
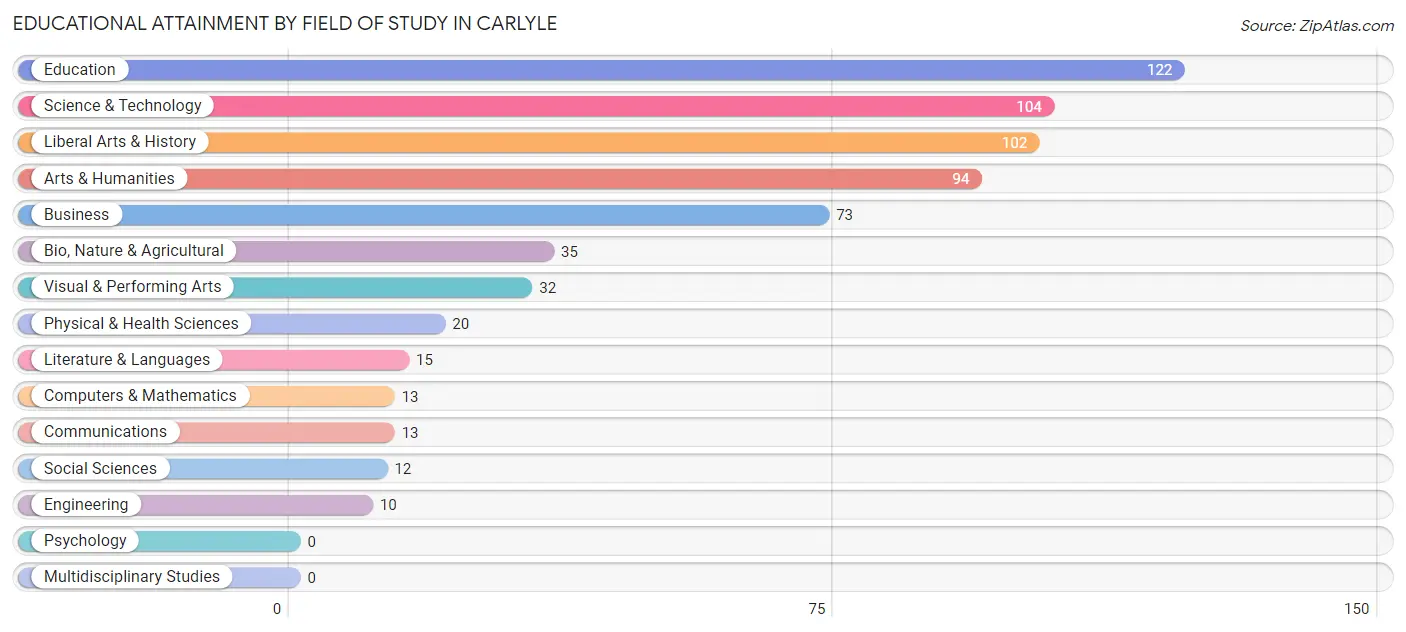
Education (122 | 18.9%), science & technology (104 | 16.1%), liberal arts & history (102 | 15.8%), arts & humanities (94 | 14.6%), and business (73 | 11.3%) are the most common fields of study among 645 individuals in Carlyle who have obtained a bachelor's degree or higher.
| Field of Study | # Graduates | % Graduates |
| Computers & Mathematics | 13 | 2.0% |
| Bio, Nature & Agricultural | 35 | 5.4% |
| Physical & Health Sciences | 20 | 3.1% |
| Psychology | 0 | 0.0% |
| Social Sciences | 12 | 1.9% |
| Engineering | 10 | 1.5% |
| Multidisciplinary Studies | 0 | 0.0% |
| Science & Technology | 104 | 16.1% |
| Business | 73 | 11.3% |
| Education | 122 | 18.9% |
| Literature & Languages | 15 | 2.3% |
| Liberal Arts & History | 102 | 15.8% |
| Visual & Performing Arts | 32 | 5.0% |
| Communications | 13 | 2.0% |
| Arts & Humanities | 94 | 14.6% |
| Total | 645 | 100.0% |
Transportation & Commute in Carlyle
Vehicle Availability by Sex in Carlyle
The most prevalent vehicle ownership categories in Carlyle are males with 2 vehicles (348, accounting for 38.1%) and females with 2 vehicles (322, making up 39.8%).

| Vehicles Available | Male | Female |
| No Vehicle | 0 (0.0%) | 14 (1.6%) |
| 1 Vehicle | 227 (24.9%) | 192 (22.0%) |
| 2 Vehicles | 348 (38.1%) | 322 (36.8%) |
| 3 Vehicles | 221 (24.2%) | 189 (21.6%) |
| 4 Vehicles | 96 (10.5%) | 116 (13.3%) |
| 5 or more Vehicles | 21 (2.3%) | 41 (4.7%) |
| Total | 913 (100.0%) | 874 (100.0%) |
Commute Time in Carlyle
The most frequently occuring commute durations in Carlyle are 5 to 9 minutes (314 commuters, 18.2%), 10 to 14 minutes (230 commuters, 13.3%), and 20 to 24 minutes (182 commuters, 10.5%).

| Commute Time | # Commuters | % Commuters |
| Less than 5 Minutes | 172 | 10.0% |
| 5 to 9 Minutes | 314 | 18.2% |
| 10 to 14 Minutes | 230 | 13.3% |
| 15 to 19 Minutes | 171 | 9.9% |
| 20 to 24 Minutes | 182 | 10.5% |
| 25 to 29 Minutes | 103 | 6.0% |
| 30 to 34 Minutes | 180 | 10.4% |
| 35 to 39 Minutes | 0 | 0.0% |
| 40 to 44 Minutes | 52 | 3.0% |
| 45 to 59 Minutes | 144 | 8.4% |
| 60 to 89 Minutes | 153 | 8.9% |
| 90 or more Minutes | 24 | 1.4% |
Commute Time by Sex in Carlyle
The most common commute times in Carlyle are 10 to 14 minutes (184 commuters, 21.8%) for males and 5 to 9 minutes (223 commuters, 25.3%) for females.
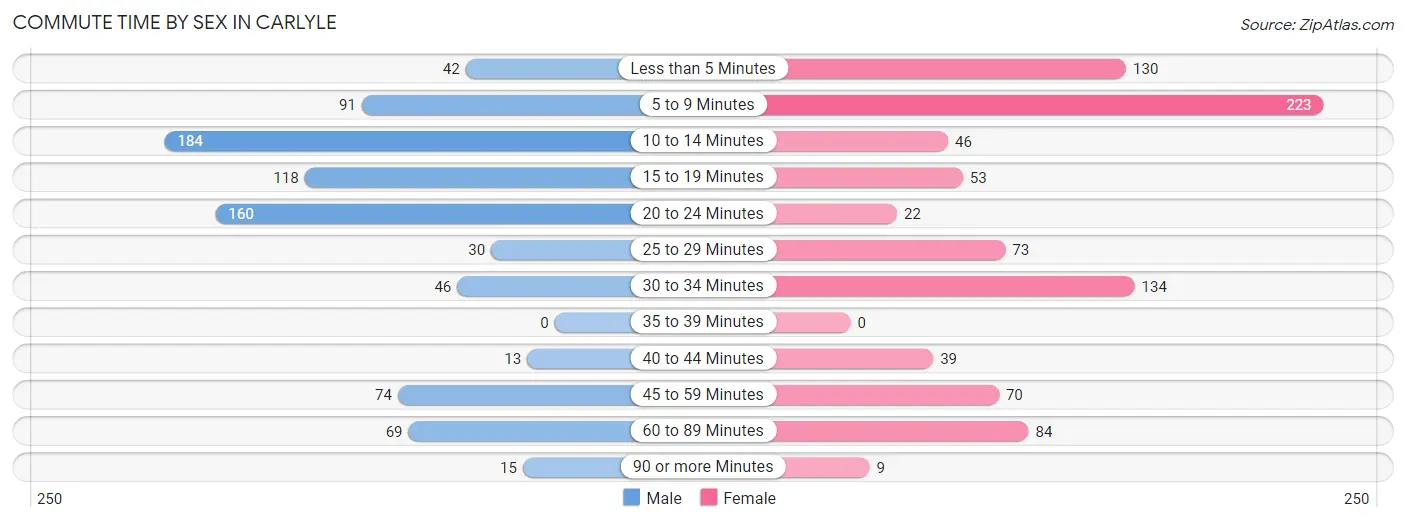
| Commute Time | Male | Female |
| Less than 5 Minutes | 42 (5.0%) | 130 (14.7%) |
| 5 to 9 Minutes | 91 (10.8%) | 223 (25.3%) |
| 10 to 14 Minutes | 184 (21.8%) | 46 (5.2%) |
| 15 to 19 Minutes | 118 (14.0%) | 53 (6.0%) |
| 20 to 24 Minutes | 160 (19.0%) | 22 (2.5%) |
| 25 to 29 Minutes | 30 (3.6%) | 73 (8.3%) |
| 30 to 34 Minutes | 46 (5.5%) | 134 (15.2%) |
| 35 to 39 Minutes | 0 (0.0%) | 0 (0.0%) |
| 40 to 44 Minutes | 13 (1.5%) | 39 (4.4%) |
| 45 to 59 Minutes | 74 (8.8%) | 70 (7.9%) |
| 60 to 89 Minutes | 69 (8.2%) | 84 (9.5%) |
| 90 or more Minutes | 15 (1.8%) | 9 (1.0%) |
Time of Departure to Work by Sex in Carlyle
The most frequent times of departure to work in Carlyle are 12:00 PM to 3:59 PM (217, 25.8%) for males and 7:00 AM to 7:29 AM (230, 26.1%) for females.
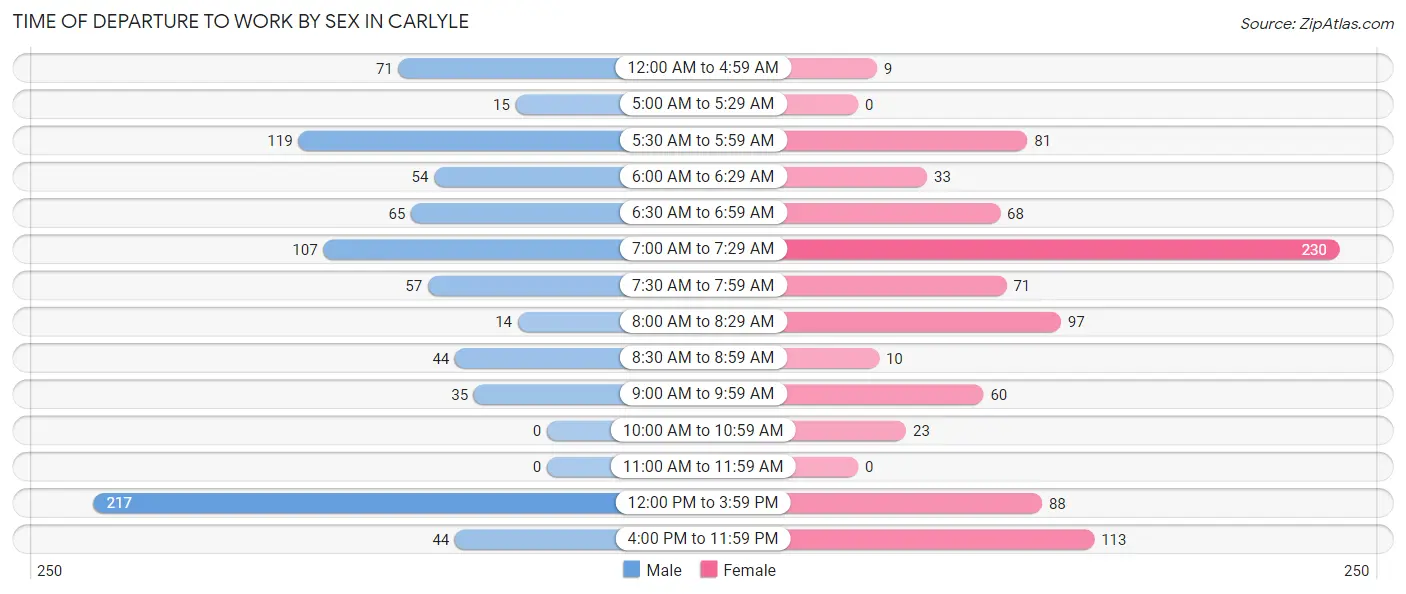
| Time of Departure | Male | Female |
| 12:00 AM to 4:59 AM | 71 (8.4%) | 9 (1.0%) |
| 5:00 AM to 5:29 AM | 15 (1.8%) | 0 (0.0%) |
| 5:30 AM to 5:59 AM | 119 (14.1%) | 81 (9.2%) |
| 6:00 AM to 6:29 AM | 54 (6.4%) | 33 (3.7%) |
| 6:30 AM to 6:59 AM | 65 (7.7%) | 68 (7.7%) |
| 7:00 AM to 7:29 AM | 107 (12.7%) | 230 (26.1%) |
| 7:30 AM to 7:59 AM | 57 (6.8%) | 71 (8.0%) |
| 8:00 AM to 8:29 AM | 14 (1.7%) | 97 (11.0%) |
| 8:30 AM to 8:59 AM | 44 (5.2%) | 10 (1.1%) |
| 9:00 AM to 9:59 AM | 35 (4.2%) | 60 (6.8%) |
| 10:00 AM to 10:59 AM | 0 (0.0%) | 23 (2.6%) |
| 11:00 AM to 11:59 AM | 0 (0.0%) | 0 (0.0%) |
| 12:00 PM to 3:59 PM | 217 (25.8%) | 88 (10.0%) |
| 4:00 PM to 11:59 PM | 44 (5.2%) | 113 (12.8%) |
| Total | 842 (100.0%) | 883 (100.0%) |
Housing Occupancy in Carlyle
Occupancy by Ownership in Carlyle
Of the total 1,234 dwellings in Carlyle, owner-occupied units account for 793 (64.3%), while renter-occupied units make up 441 (35.7%).
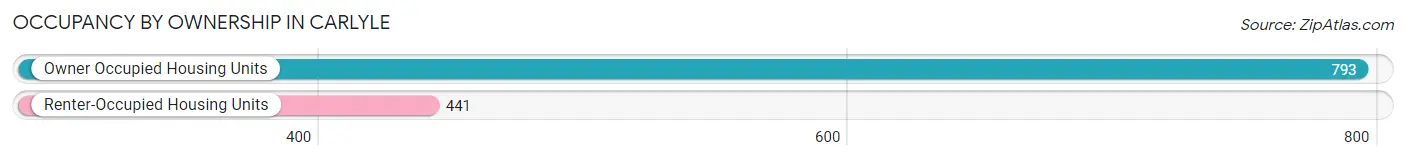
| Occupancy | # Housing Units | % Housing Units |
| Owner Occupied Housing Units | 793 | 64.3% |
| Renter-Occupied Housing Units | 441 | 35.7% |
| Total Occupied Housing Units | 1,234 | 100.0% |
Occupancy by Household Size in Carlyle
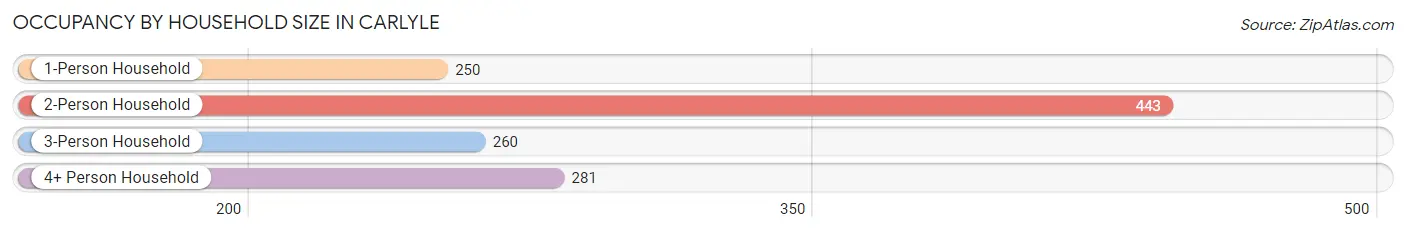
| Household Size | # Housing Units | % Housing Units |
| 1-Person Household | 250 | 20.3% |
| 2-Person Household | 443 | 35.9% |
| 3-Person Household | 260 | 21.1% |
| 4+ Person Household | 281 | 22.8% |
| Total Housing Units | 1,234 | 100.0% |
Occupancy by Ownership by Household Size in Carlyle
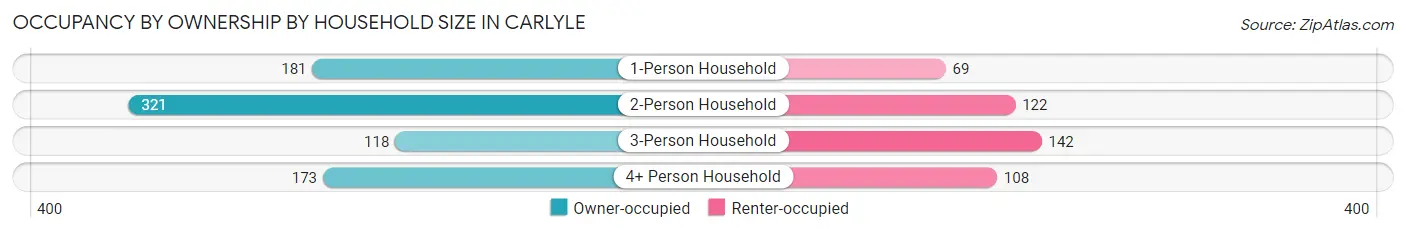
| Household Size | Owner-occupied | Renter-occupied |
| 1-Person Household | 181 (72.4%) | 69 (27.6%) |
| 2-Person Household | 321 (72.5%) | 122 (27.5%) |
| 3-Person Household | 118 (45.4%) | 142 (54.6%) |
| 4+ Person Household | 173 (61.6%) | 108 (38.4%) |
| Total Housing Units | 793 (64.3%) | 441 (35.7%) |
Occupancy by Educational Attainment in Carlyle
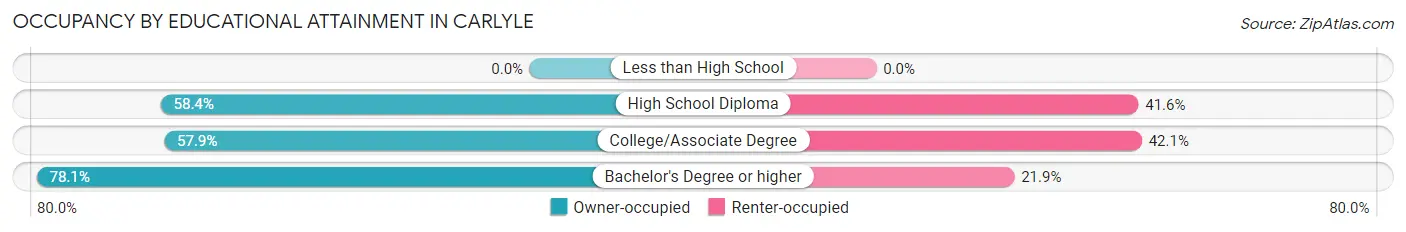
| Household Size | Owner-occupied | Renter-occupied |
| Less than High School | 0 (0.0%) | 0 (0.0%) |
| High School Diploma | 229 (58.4%) | 163 (41.6%) |
| College/Associate Degree | 268 (57.9%) | 195 (42.1%) |
| Bachelor's Degree or higher | 296 (78.1%) | 83 (21.9%) |
Occupancy by Age of Householder in Carlyle
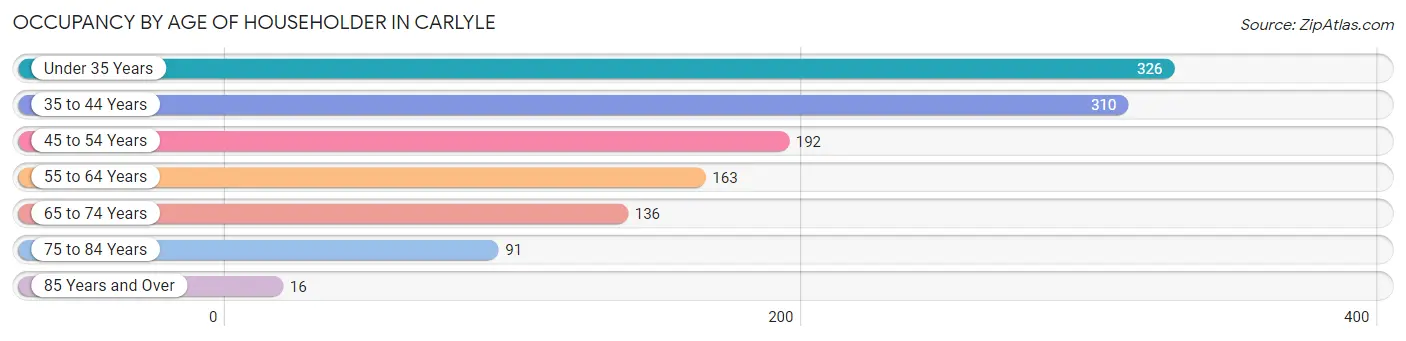
| Age Bracket | # Households | % Households |
| Under 35 Years | 326 | 26.4% |
| 35 to 44 Years | 310 | 25.1% |
| 45 to 54 Years | 192 | 15.6% |
| 55 to 64 Years | 163 | 13.2% |
| 65 to 74 Years | 136 | 11.0% |
| 75 to 84 Years | 91 | 7.4% |
| 85 Years and Over | 16 | 1.3% |
| Total | 1,234 | 100.0% |
Housing Finances in Carlyle
Median Income by Occupancy in Carlyle
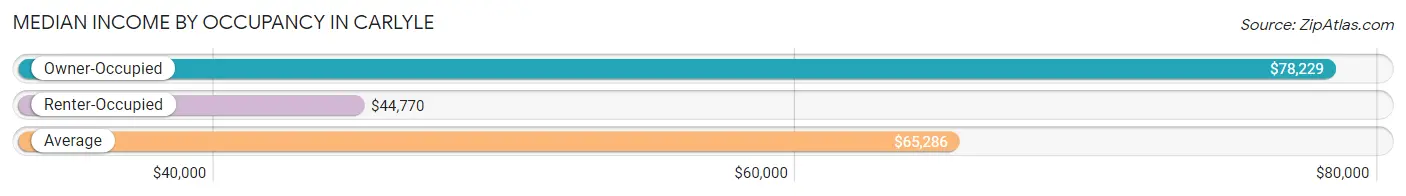
| Occupancy Type | # Households | Median Income |
| Owner-Occupied | 793 (64.3%) | $78,229 |
| Renter-Occupied | 441 (35.7%) | $44,770 |
| Average | 1,234 (100.0%) | $65,286 |
Occupancy by Householder Income Bracket in Carlyle
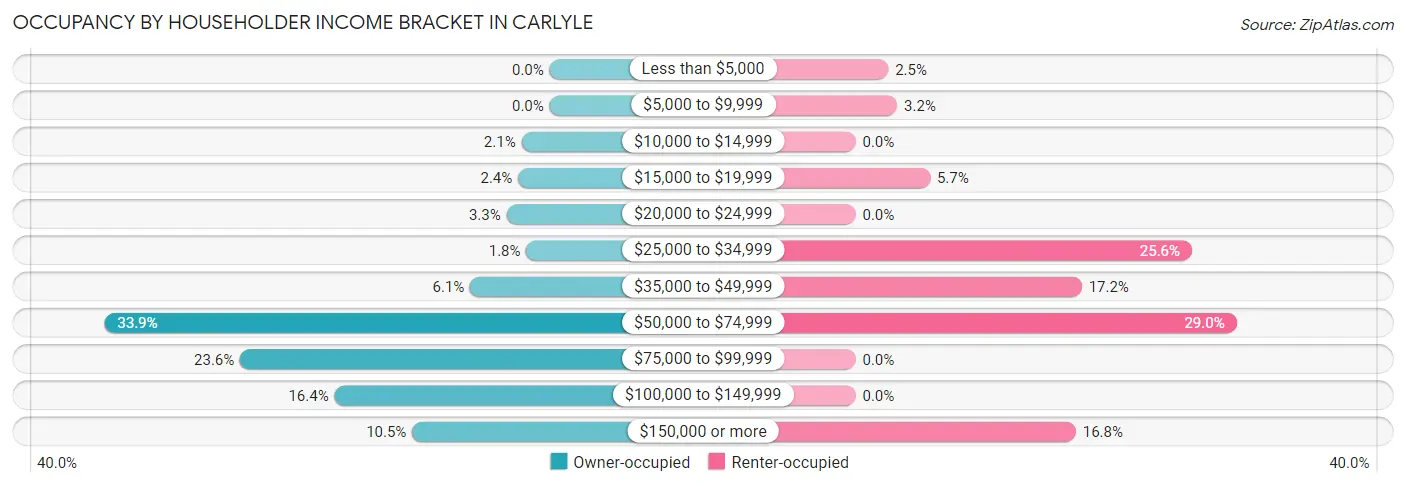
| Income Bracket | Owner-occupied | Renter-occupied |
| Less than $5,000 | 0 (0.0%) | 11 (2.5%) |
| $5,000 to $9,999 | 0 (0.0%) | 14 (3.2%) |
| $10,000 to $14,999 | 17 (2.1%) | 0 (0.0%) |
| $15,000 to $19,999 | 19 (2.4%) | 25 (5.7%) |
| $20,000 to $24,999 | 26 (3.3%) | 0 (0.0%) |
| $25,000 to $34,999 | 14 (1.8%) | 113 (25.6%) |
| $35,000 to $49,999 | 48 (6.0%) | 76 (17.2%) |
| $50,000 to $74,999 | 269 (33.9%) | 128 (29.0%) |
| $75,000 to $99,999 | 187 (23.6%) | 0 (0.0%) |
| $100,000 to $149,999 | 130 (16.4%) | 0 (0.0%) |
| $150,000 or more | 83 (10.5%) | 74 (16.8%) |
| Total | 793 (100.0%) | 441 (100.0%) |
Monthly Housing Cost Tiers in Carlyle
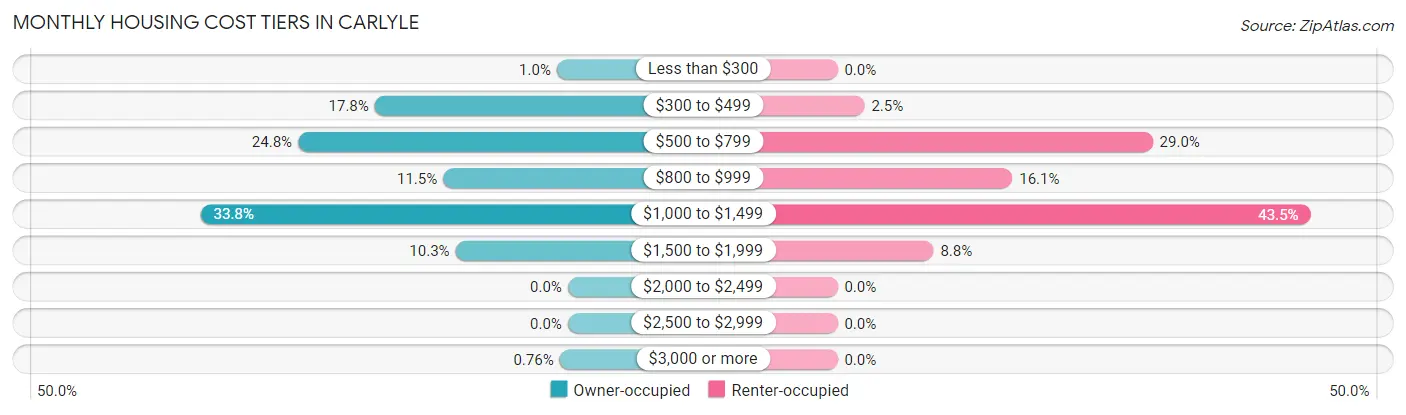
| Monthly Cost | Owner-occupied | Renter-occupied |
| Less than $300 | 8 (1.0%) | 0 (0.0%) |
| $300 to $499 | 141 (17.8%) | 11 (2.5%) |
| $500 to $799 | 197 (24.8%) | 128 (29.0%) |
| $800 to $999 | 91 (11.5%) | 71 (16.1%) |
| $1,000 to $1,499 | 268 (33.8%) | 192 (43.5%) |
| $1,500 to $1,999 | 82 (10.3%) | 39 (8.8%) |
| $2,000 to $2,499 | 0 (0.0%) | 0 (0.0%) |
| $2,500 to $2,999 | 0 (0.0%) | 0 (0.0%) |
| $3,000 or more | 6 (0.8%) | 0 (0.0%) |
| Total | 793 (100.0%) | 441 (100.0%) |
Physical Housing Characteristics in Carlyle
Housing Structures in Carlyle
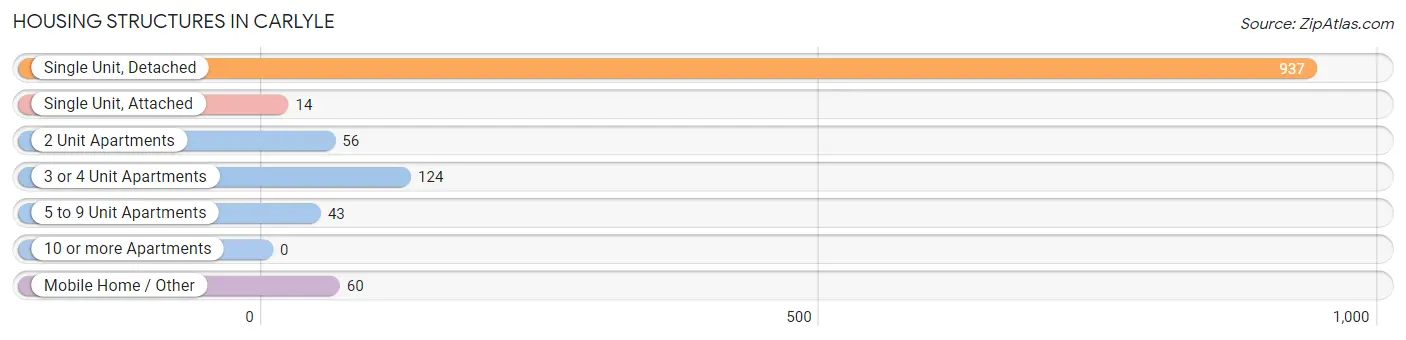
| Structure Type | # Housing Units | % Housing Units |
| Single Unit, Detached | 937 | 75.9% |
| Single Unit, Attached | 14 | 1.1% |
| 2 Unit Apartments | 56 | 4.5% |
| 3 or 4 Unit Apartments | 124 | 10.1% |
| 5 to 9 Unit Apartments | 43 | 3.5% |
| 10 or more Apartments | 0 | 0.0% |
| Mobile Home / Other | 60 | 4.9% |
| Total | 1,234 | 100.0% |
Housing Structures by Occupancy in Carlyle
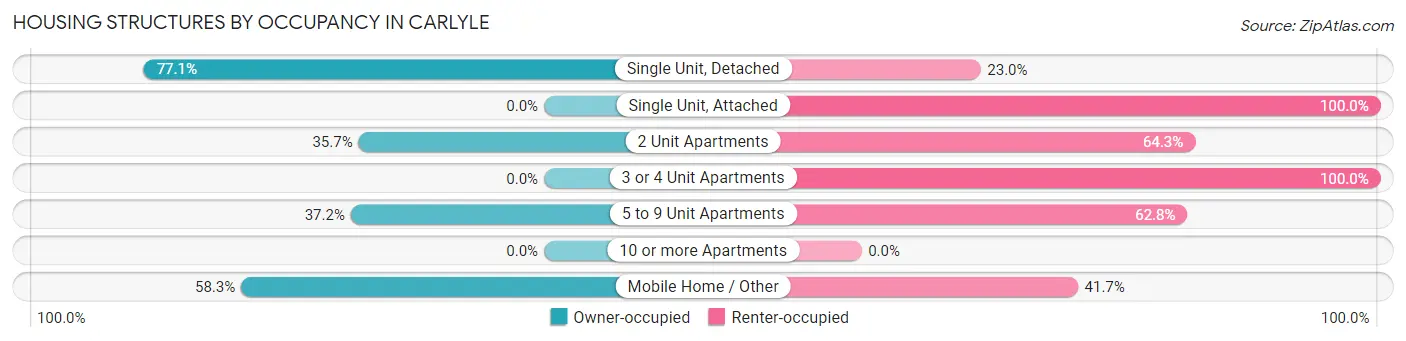
| Structure Type | Owner-occupied | Renter-occupied |
| Single Unit, Detached | 722 (77.0%) | 215 (23.0%) |
| Single Unit, Attached | 0 (0.0%) | 14 (100.0%) |
| 2 Unit Apartments | 20 (35.7%) | 36 (64.3%) |
| 3 or 4 Unit Apartments | 0 (0.0%) | 124 (100.0%) |
| 5 to 9 Unit Apartments | 16 (37.2%) | 27 (62.8%) |
| 10 or more Apartments | 0 (0.0%) | 0 (0.0%) |
| Mobile Home / Other | 35 (58.3%) | 25 (41.7%) |
| Total | 793 (64.3%) | 441 (35.7%) |
Housing Structures by Number of Rooms in Carlyle

| Number of Rooms | Owner-occupied | Renter-occupied |
| 1 Room | 0 (0.0%) | 35 (7.9%) |
| 2 or 3 Rooms | 16 (2.0%) | 0 (0.0%) |
| 4 or 5 Rooms | 240 (30.3%) | 272 (61.7%) |
| 6 or 7 Rooms | 325 (41.0%) | 115 (26.1%) |
| 8 or more Rooms | 212 (26.7%) | 19 (4.3%) |
| Total | 793 (100.0%) | 441 (100.0%) |
Housing Structure by Heating Type in Carlyle
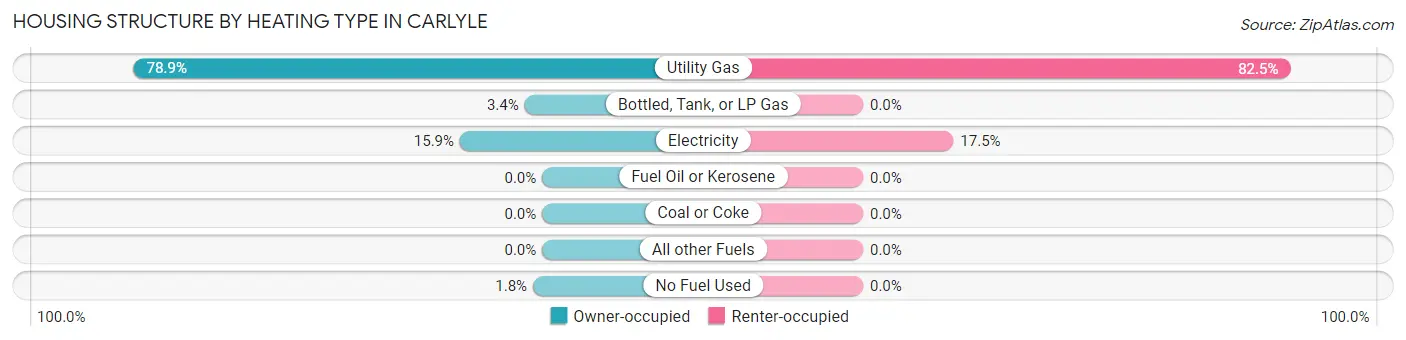
| Heating Type | Owner-occupied | Renter-occupied |
| Utility Gas | 626 (78.9%) | 364 (82.5%) |
| Bottled, Tank, or LP Gas | 27 (3.4%) | 0 (0.0%) |
| Electricity | 126 (15.9%) | 77 (17.5%) |
| Fuel Oil or Kerosene | 0 (0.0%) | 0 (0.0%) |
| Coal or Coke | 0 (0.0%) | 0 (0.0%) |
| All other Fuels | 0 (0.0%) | 0 (0.0%) |
| No Fuel Used | 14 (1.8%) | 0 (0.0%) |
| Total | 793 (100.0%) | 441 (100.0%) |
Household Vehicle Usage in Carlyle
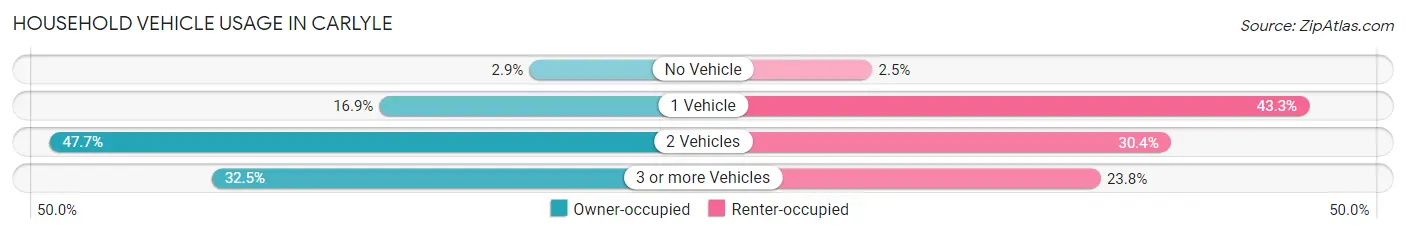
| Vehicles per Household | Owner-occupied | Renter-occupied |
| No Vehicle | 23 (2.9%) | 11 (2.5%) |
| 1 Vehicle | 134 (16.9%) | 191 (43.3%) |
| 2 Vehicles | 378 (47.7%) | 134 (30.4%) |
| 3 or more Vehicles | 258 (32.5%) | 105 (23.8%) |
| Total | 793 (100.0%) | 441 (100.0%) |
Real Estate & Mortgages in Carlyle
Real Estate and Mortgage Overview in Carlyle
| Characteristic | Without Mortgage | With Mortgage |
| Housing Units | 320 | 473 |
| Median Property Value | $144,700 | $156,300 |
| Median Household Income | $73,000 | $55 |
| Monthly Housing Costs | $569 | $6 |
| Real Estate Taxes | $2,528 | $0 |
Property Value by Mortgage Status in Carlyle

| Property Value | Without Mortgage | With Mortgage |
| Less than $50,000 | 54 (16.9%) | 20 (4.2%) |
| $50,000 to $99,999 | 35 (10.9%) | 81 (17.1%) |
| $100,000 to $299,999 | 196 (61.3%) | 345 (72.9%) |
| $300,000 to $499,999 | 35 (10.9%) | 27 (5.7%) |
| $500,000 to $749,999 | 0 (0.0%) | 0 (0.0%) |
| $750,000 to $999,999 | 0 (0.0%) | 0 (0.0%) |
| $1,000,000 or more | 0 (0.0%) | 0 (0.0%) |
| Total | 320 (100.0%) | 473 (100.0%) |
Household Income by Mortgage Status in Carlyle
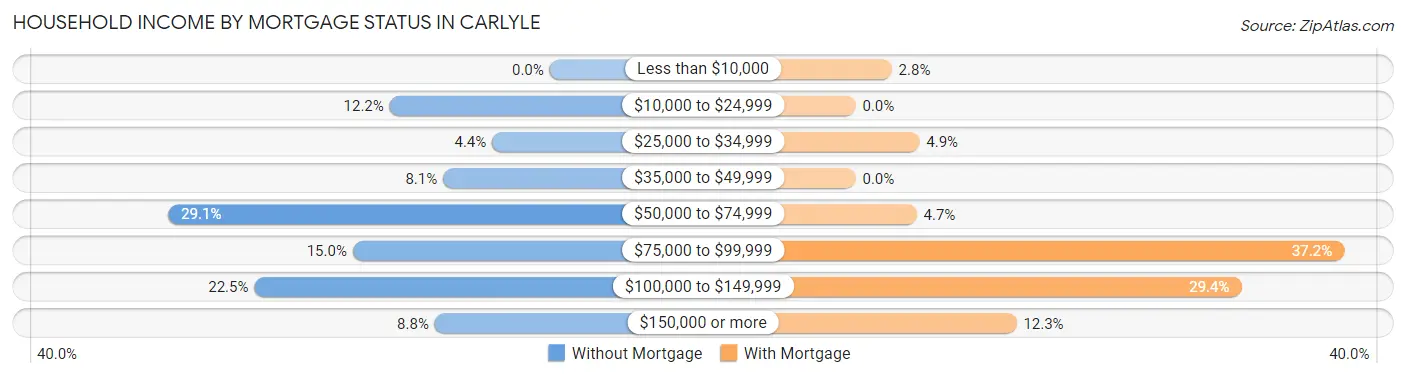
| Household Income | Without Mortgage | With Mortgage |
| Less than $10,000 | 0 (0.0%) | 13 (2.8%) |
| $10,000 to $24,999 | 39 (12.2%) | 0 (0.0%) |
| $25,000 to $34,999 | 14 (4.4%) | 23 (4.9%) |
| $35,000 to $49,999 | 26 (8.1%) | 0 (0.0%) |
| $50,000 to $74,999 | 93 (29.1%) | 22 (4.6%) |
| $75,000 to $99,999 | 48 (15.0%) | 176 (37.2%) |
| $100,000 to $149,999 | 72 (22.5%) | 139 (29.4%) |
| $150,000 or more | 28 (8.7%) | 58 (12.3%) |
| Total | 320 (100.0%) | 473 (100.0%) |
Property Value to Household Income Ratio in Carlyle
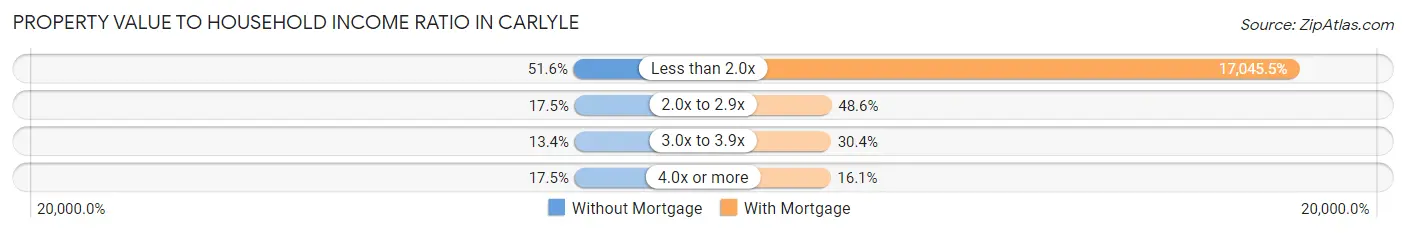
| Value-to-Income Ratio | Without Mortgage | With Mortgage |
| Less than 2.0x | 165 (51.6%) | 80,625 (17,045.4%) |
| 2.0x to 2.9x | 56 (17.5%) | 230 (48.6%) |
| 3.0x to 3.9x | 43 (13.4%) | 144 (30.4%) |
| 4.0x or more | 56 (17.5%) | 76 (16.1%) |
| Total | 320 (100.0%) | 473 (100.0%) |
Real Estate Taxes by Mortgage Status in Carlyle

| Property Taxes | Without Mortgage | With Mortgage |
| Less than $800 | 45 (14.1%) | 0 (0.0%) |
| $800 to $1,499 | 42 (13.1%) | 15 (3.2%) |
| $800 to $1,499 | 224 (70.0%) | 37 (7.8%) |
| Total | 320 (100.0%) | 473 (100.0%) |
Health & Disability in Carlyle
Health Insurance Coverage by Age in Carlyle

| Age Bracket | With Coverage | Without Coverage |
| Under 6 Years | 246 (100.0%) | 0 (0.0%) |
| 6 to 18 Years | 495 (89.2%) | 60 (10.8%) |
| 19 to 25 Years | 291 (96.7%) | 10 (3.3%) |
| 26 to 34 Years | 481 (98.2%) | 9 (1.8%) |
| 35 to 44 Years | 466 (97.9%) | 10 (2.1%) |
| 45 to 54 Years | 292 (97.0%) | 9 (3.0%) |
| 55 to 64 Years | 301 (92.9%) | 23 (7.1%) |
| 65 to 74 Years | 265 (100.0%) | 0 (0.0%) |
| 75 Years and older | 158 (100.0%) | 0 (0.0%) |
| Total | 2,995 (96.1%) | 121 (3.9%) |
Health Insurance Coverage by Citizenship Status in Carlyle
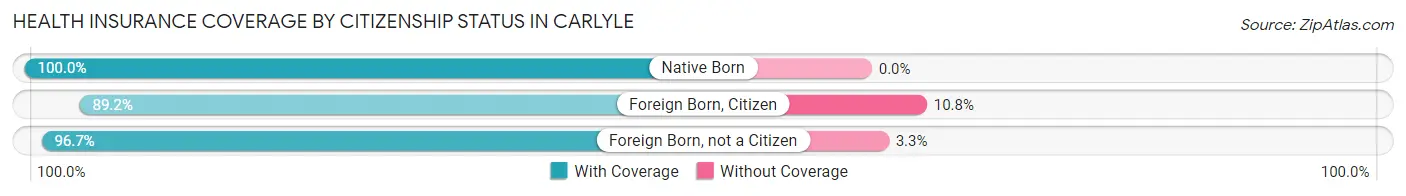
| Citizenship Status | With Coverage | Without Coverage |
| Native Born | 246 (100.0%) | 0 (0.0%) |
| Foreign Born, Citizen | 495 (89.2%) | 60 (10.8%) |
| Foreign Born, not a Citizen | 291 (96.7%) | 10 (3.3%) |
Health Insurance Coverage by Household Income in Carlyle
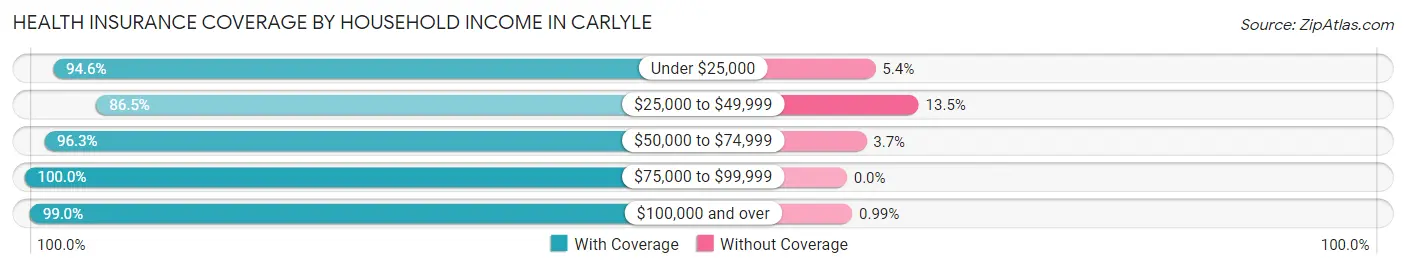
| Household Income | With Coverage | Without Coverage |
| Under $25,000 | 159 (94.6%) | 9 (5.4%) |
| $25,000 to $49,999 | 450 (86.5%) | 70 (13.5%) |
| $50,000 to $74,999 | 865 (96.3%) | 33 (3.7%) |
| $75,000 to $99,999 | 564 (100.0%) | 0 (0.0%) |
| $100,000 and over | 902 (99.0%) | 9 (1.0%) |
Public vs Private Health Insurance Coverage by Age in Carlyle

| Age Bracket | Public Insurance | Private Insurance |
| Under 6 | 39 (15.9%) | 207 (84.2%) |
| 6 to 18 Years | 153 (27.6%) | 342 (61.6%) |
| 19 to 25 Years | 80 (26.6%) | 211 (70.1%) |
| 25 to 34 Years | 87 (17.8%) | 394 (80.4%) |
| 35 to 44 Years | 119 (25.0%) | 359 (75.4%) |
| 45 to 54 Years | 11 (3.6%) | 281 (93.4%) |
| 55 to 64 Years | 87 (26.9%) | 229 (70.7%) |
| 65 to 74 Years | 251 (94.7%) | 173 (65.3%) |
| 75 Years and over | 158 (100.0%) | 66 (41.8%) |
| Total | 985 (31.6%) | 2,262 (72.6%) |
Disability Status by Sex by Age in Carlyle

| Age Bracket | Male | Female |
| Under 5 Years | 0 (0.0%) | 0 (0.0%) |
| 5 to 17 Years | 18 (8.2%) | 15 (5.2%) |
| 18 to 34 Years | 14 (2.6%) | 35 (9.2%) |
| 35 to 64 Years | 94 (21.4%) | 109 (16.5%) |
| 65 to 74 Years | 28 (23.0%) | 13 (9.1%) |
| 75 Years and over | 21 (42.0%) | 44 (40.7%) |
Disability Class by Sex by Age in Carlyle
Disability Class: Hearing Difficulty

| Age Bracket | Male | Female |
| Under 5 Years | 0 (0.0%) | 0 (0.0%) |
| 5 to 17 Years | 0 (0.0%) | 0 (0.0%) |
| 18 to 34 Years | 12 (2.2%) | 35 (9.2%) |
| 35 to 64 Years | 2 (0.5%) | 8 (1.2%) |
| 65 to 74 Years | 0 (0.0%) | 0 (0.0%) |
| 75 Years and over | 21 (42.0%) | 35 (32.4%) |
Disability Class: Vision Difficulty
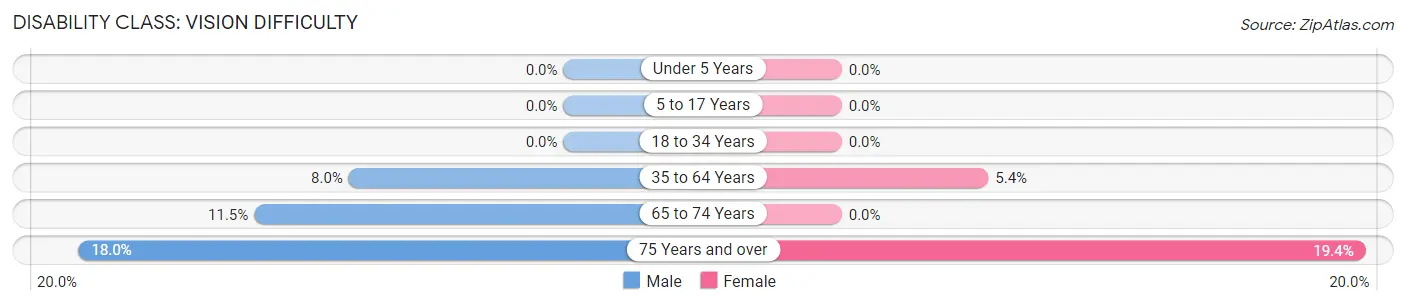
| Age Bracket | Male | Female |
| Under 5 Years | 0 (0.0%) | 0 (0.0%) |
| 5 to 17 Years | 0 (0.0%) | 0 (0.0%) |
| 18 to 34 Years | 0 (0.0%) | 0 (0.0%) |
| 35 to 64 Years | 35 (8.0%) | 36 (5.4%) |
| 65 to 74 Years | 14 (11.5%) | 0 (0.0%) |
| 75 Years and over | 9 (18.0%) | 21 (19.4%) |
Disability Class: Cognitive Difficulty
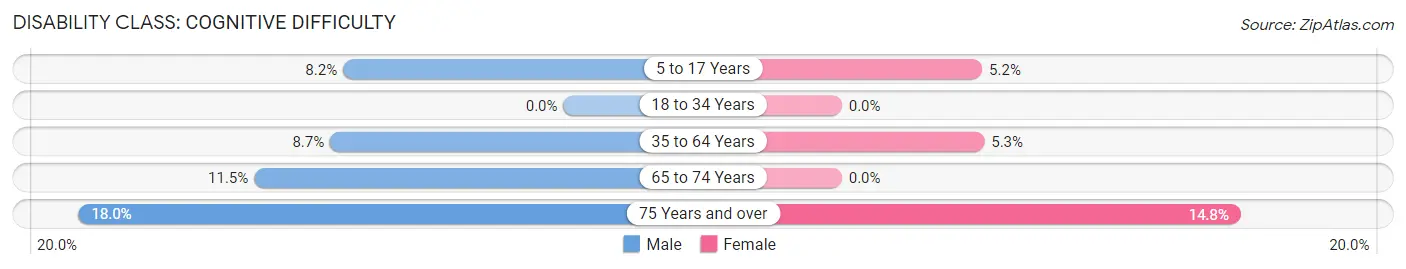
| Age Bracket | Male | Female |
| 5 to 17 Years | 18 (8.2%) | 15 (5.2%) |
| 18 to 34 Years | 0 (0.0%) | 0 (0.0%) |
| 35 to 64 Years | 38 (8.7%) | 35 (5.3%) |
| 65 to 74 Years | 14 (11.5%) | 0 (0.0%) |
| 75 Years and over | 9 (18.0%) | 16 (14.8%) |
Disability Class: Ambulatory Difficulty

| Age Bracket | Male | Female |
| 5 to 17 Years | 0 (0.0%) | 0 (0.0%) |
| 18 to 34 Years | 2 (0.4%) | 0 (0.0%) |
| 35 to 64 Years | 73 (16.6%) | 101 (15.3%) |
| 65 to 74 Years | 5 (4.1%) | 13 (9.1%) |
| 75 Years and over | 9 (18.0%) | 28 (25.9%) |
Disability Class: Self-Care Difficulty
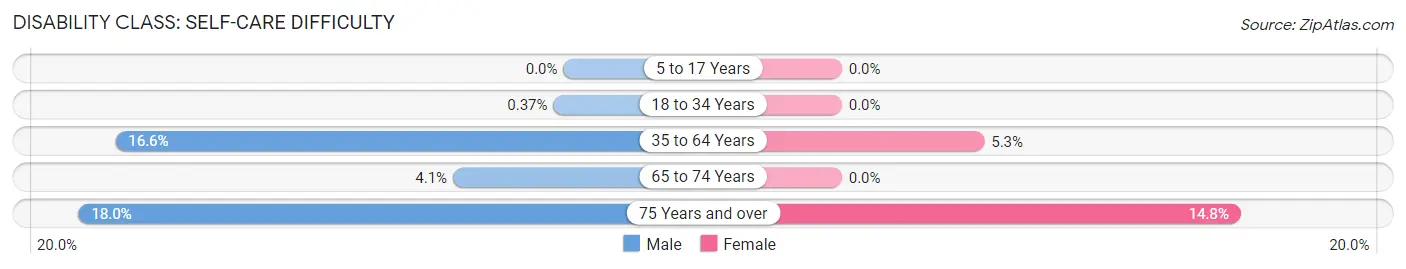
| Age Bracket | Male | Female |
| 5 to 17 Years | 0 (0.0%) | 0 (0.0%) |
| 18 to 34 Years | 2 (0.4%) | 0 (0.0%) |
| 35 to 64 Years | 73 (16.6%) | 35 (5.3%) |
| 65 to 74 Years | 5 (4.1%) | 0 (0.0%) |
| 75 Years and over | 9 (18.0%) | 16 (14.8%) |
Technology Access in Carlyle
Computing Device Access in Carlyle

| Device Type | # Households | % Households |
| Desktop or Laptop | 985 | 79.8% |
| Smartphone | 1,114 | 90.3% |
| Tablet | 731 | 59.2% |
| No Computing Device | 40 | 3.2% |
| Total | 1,234 | 100.0% |
Internet Access in Carlyle
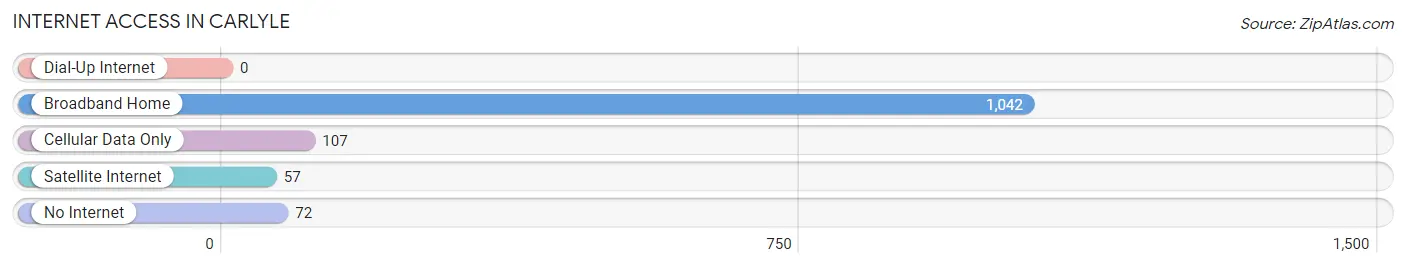
| Internet Type | # Households | % Households |
| Dial-Up Internet | 0 | 0.0% |
| Broadband Home | 1,042 | 84.4% |
| Cellular Data Only | 107 | 8.7% |
| Satellite Internet | 57 | 4.6% |
| No Internet | 72 | 5.8% |
| Total | 1,234 | 100.0% |
Carlyle Summary
Carlyle, Illinois is a small city located in Clinton County, in the south-central part of the state. It is situated on the Kaskaskia River, about 40 miles east of St. Louis, Missouri. The city has a population of 4,621, according to the 2010 census.
Carlyle was founded in 1854 by German immigrants who were attracted to the area by its rich soil and abundant natural resources. The city was named after Scottish essayist Thomas Carlyle. The city was incorporated in 1858 and has since grown to become a thriving community.
Geography
Carlyle is located at 38°37'N 89°25'W (38.6167, -89.4167). It is situated on the Kaskaskia River, about 40 miles east of St. Louis, Missouri. The city has a total area of 2.2 square miles, all of which is land.
The city is located in the Central Till Plains region of Illinois, which is characterized by flat terrain and fertile soil. The climate is humid continental, with hot summers and cold winters. The average annual temperature is 54°F, and the average annual precipitation is 40 inches.
Economy
The economy of Carlyle is largely based on agriculture and manufacturing. The city is home to several large agricultural operations, including a large dairy farm and a large hog farm. The city also has several manufacturing plants, including a paper mill and a plastics factory.
The city is also home to several small businesses, including restaurants, retail stores, and service providers. The city is also home to a large medical center, which provides a variety of health care services.
Demographics
According to the 2010 census, the population of Carlyle was 4,621. The racial makeup of the city was 97.2% White, 0.7% African American, 0.2% Native American, 0.3% Asian, 0.1% Pacific Islander, 0.7% from other races, and 0.9% from two or more races. Hispanic or Latino of any race were 1.7% of the population.
The median income for a household in the city was $41,944, and the median income for a family was $50,917. The per capita income for the city was $20,845. About 8.2% of families and 10.2% of the population were below the poverty line, including 14.2% of those under age 18 and 6.2% of those age 65 or over.
Conclusion
Carlyle, Illinois is a small city located in Clinton County, in the south-central part of the state. It is situated on the Kaskaskia River, about 40 miles east of St. Louis, Missouri. The city has a population of 4,621, according to the 2010 census. The economy of Carlyle is largely based on agriculture and manufacturing, and the city is home to several small businesses. The racial makeup of the city is 97.2% White, 0.7% African American, 0.2% Native American, 0.3% Asian, 0.1% Pacific Islander, 0.7% from other races, and 0.9% from two or more races. The median income for a household in the city was $41,944, and the median income for a family was $50,917.
Common Questions
What is Per Capita Income in Carlyle?
Per Capita income in Carlyle is $29,777.
What is the Median Family Income in Carlyle?
Median Family Income in Carlyle is $74,292.
What is the Median Household income in Carlyle?
Median Household Income in Carlyle is $65,286.
What is Income or Wage Gap in Carlyle?
Income or Wage Gap in Carlyle is 22.3%.
Women in Carlyle earn 77.7 cents for every dollar earned by a man.
What is Inequality or Gini Index in Carlyle?
Inequality or Gini Index in Carlyle is 0.35.
What is the Total Population of Carlyle?
Total Population of Carlyle is 3,252.
What is the Total Male Population of Carlyle?
Total Male Population of Carlyle is 1,588.
What is the Total Female Population of Carlyle?
Total Female Population of Carlyle is 1,664.
What is the Ratio of Males per 100 Females in Carlyle?
There are 95.43 Males per 100 Females in Carlyle.
What is the Ratio of Females per 100 Males in Carlyle?
There are 104.79 Females per 100 Males in Carlyle.
What is the Median Population Age in Carlyle?
Median Population Age in Carlyle is 35.6 Years.
What is the Average Family Size in Carlyle
Average Family Size in Carlyle is 2.8 People.
What is the Average Household Size in Carlyle
Average Household Size in Carlyle is 2.5 People.
How Large is the Labor Force in Carlyle?
There are 1,904 People in the Labor Forcein in Carlyle.
What is the Percentage of People in the Labor Force in Carlyle?
71.6% of People are in the Labor Force in Carlyle.
What is the Unemployment Rate in Carlyle?
Unemployment Rate in Carlyle is 4.8%.